


Abstract
Decarbonizing the transport sector is crucial for achieving global carbon peaking and carbon neutrality goals. Electric taxis (e-taxis), which play a vital role in urban public transportation, are central to this transition. However, their operational performance deteriorates significantly under extremely cold conditions. Existing planning models for charging infrastructure often overlook the impact of low temperatures, creating a critical research gap. To address this issue, we propose a novel planning framework using Urumqi, China (43.8° N, 87.6° E) as a case study. Urumqi is a major cold-region metropolis, where January temperatures regularly drop below °C. Our methodology includes two key steps: integrating 412 driver questionnaires and 1.2 million high-resolution GPS trajectories to extract temperature-sensitive charging demand profiles; and incorporating these profiles into an integer linear programming (ILP) model to minimize lifecycle costs, considering climatic constraints, taxi operation patterns, and grid limitations. A key innovation is a temperature-correction coefficient, which dynamically adjusts vehicle energy consumption and driving range based on ambient temperature. Results show superiority over conventional (temperature-ignoring) and random plans: 14-fold lower annualized cost, 23-fold shorter average queuing time, 96.2% high-frequency demand coverage (+16.6%), and 78% charging station utilization (+50.0%). It achieves 29.8–32.3% cost savings at °C (over 25.9% even at °C) and scales stably for 5–50% e-taxi penetration, offering a transferable framework for cold-region e-taxi charging optimization.
1. Introduction
Driven by the global goals of carbon peaking and carbon neutrality, the low-carbon transformation of the transportation sector has emerged as a crucial strategy for countries to address climate change. According to a report by the International Energy Agency (IEA), the global stock of electric vehicles exceeded 10 million in 2020 and is projected to reach 245 million by 2030. As a vital component of urban public transport, taxis, characterized by their high frequency of use and high energy consumption, have become a key target for reducing carbon emissions in the transportation sector. The “Guiding Opinions on Further Developing a High-Quality Charging Infrastructure System” explicitly states that “priority should be given to promoting electrification in the public transportation sector, improving the layout of dedicated charging and battery swapping networks for urban taxis, and enhancing the capabilities of supply-demand matching and scenario adaptation”, which provides systematic policy support for the construction of charging facilities for electric taxis. The promotion of pure electric taxis is of great significance in reducing carbon emissions in the urban transportation sector.
However, the adoption of battery-electric taxis faces several challenges, particularly in extremely cold regions. Taking Urumqi as an example, the number of days with an average temperature below 0 °C reaches 150, and the extreme low temperature can drop to –25 °C. Low-temperature environments can lead to a reduction in battery capacity and a decrease in charging efficiency. This not only increases the operational costs of electric taxis but also places higher demands on the layout and service capacity of charging stations. In addition, the temporal and spatial volatility of charging demand in frigid regions further enhances the complexity of charging station site selection.
Currently, certain progress has been made in the site selection planning of electric vehicle charging stations. However, there is a lack of research on the layout planning of taxi charging stations in cold regions. In particular, there has been insufficient exploration of the impact of low temperatures on battery performance and charging demand. Most existing studies focus on site selection planning based on the characteristics of electric vehicles in conventional climate regions, typically using methods such as multi-type clustering algorithms [1], layout evaluation models based on charging frequency [2], and planning models considering battery attenuation and vehicle range heterogeneity [3]. For example, dynamically adjusting the construction scale according to changes in charging demand [4], optimizing the planning to minimize the total construction cost [5], etc. Nevertheless, these studies fail to consider the attenuation of battery performance caused by low temperatures and temperature-dependent heterogeneity of charging demand, thus limiting their applicability in cold regions. Meanwhile, due to the wide operating range of electric taxis and the coexistence of randomness and regularity in behavioral patterns such as empty driving, passenger seeking, and passenger carrying, their charging station planning methods are different from those of ordinary electric vehicles. However, few studies integrate the charging behavior characteristics of electric taxis to carry out the planning of electric taxi charging stations. Relevant studies mainly focus on the prediction of the development scale of electric taxis and the simulation of charging demand [6], the design of site selection algorithms based on trajectory data [7], and the site selection optimization based on queuing theory [8]. A small number of studies involving charging station planning in cold regions [9] have not deeply explored the specific impact of low temperatures on the site selection of taxi charging stations, including the impact of low temperatures on battery performance, charging speed, and driving range, as well as the effect of these impacts on planning aspects such as the layout and service capacity of charging stations. In summary, the current research on the site selection planning of electric taxi charging stations lacks consideration of the low-temperature environmental factors in cold regions, resulting in incomplete and unscientific planning of charging stations in cold regions.
To address these research gaps, this study aims to develop a novel, temperature-adaptive planning framework for electric taxi charging stations in severe cold regions, with Urumqi, China as a representative case study. Our research is guided by three specific, testable objectives:
- Objective 1:
- To quantify and model temperature impacts on e-taxi charging demandHypothesis :Incorporating a dynamic temperature correction coefficient will reduce total life-cycle cost estimation errors by ≥15% compared to fixed-correction models at temperatures below °C.
- Objective 2:
- To develop an optimization framework integrating multi-source dataHypothesis :The fusion of GPS trajectories, driver questionnaires, and meteorological records will yield charging demand profiles with ≥20% higher spatial accuracy than single-source approaches in cold-region contexts.
- Objective 3:
- To validate framework scalability under diverse future scenariosHypothesis :The optimized layout will maintain ≥95% demand coverage and ≤10% waiting time degradation across a 5–65% e-taxi penetration range and multiple growth trajectories.
2. Literature Review
The strategic siting and deployment of electric vehicle (EV) charging infrastructure serve as a cornerstone for the global transition to sustainable transportation. While a substantial body of research has addressed general EV charging station planning, a critical and notably unaddressed niche persists concerning the unique, compounded challenges faced by electric taxi (ET) fleets in severely cold regions. This review systematically analyzes the literature across key domains, from the impact of cold climates on EV performance to the distinct operational economics of taxi services, culminating in a critique of prevailing planning methodologies. Our synthesis demonstrates that existing models are fundamentally ill-equipped to address the deleterious synergy between relentless operational intensity and extreme environmental conditions, thereby establishing the unequivocal necessity for a dedicated planning framework.
2.1. The Impact of Cold Climates on EV Performance and Planning Imperative
The efficacy of charging infrastructure is inherently linked to vehicle energy consumption, a parameter highly sensitive to ambient temperature. Empirical evidence consistently demonstrates that low temperatures severely degrade EV performance. Real-world data analysis, such as that by Hao et al. [10], indicates that winter range for personal vehicles can drop to 64% of the New European Driving Cycle (NEDC) estimate, with energy consumption increasing by approximately 2.4 kWh/100 km for every 5 °C drop below 10 °C. This performance loss is attributed to several mechanistic factors quantified in the literature, including significant energy draw from cabin heating [11], reduction in battery discharge capacity, and increased internal impedance [12]. Collectively, these factors lead to a documented range attenuation of 40% to 60% under temperatures between °C and °C [13].
This profound impact creates a fundamental imperative for charging infrastructure planning in cold regions. Mainstream planning models, however, often overlook this temperature-induced demand heterogeneity. For instance, Zhu et al. [14] proposed a queuing theory-based model using weighted Voronoi diagrams to minimize costs and optimize capacity, yet it does not account for the increased charging frequency and altered duration resulting from low temperatures. Similarly, the multi-level framework integrating Voronoi diagrams and particle swarm optimization developed by Zhang et al. [15], while incorporating certain social costs, is confined to conventional climate zones and does not address demand fluctuations from battery range degradation. The failure to integrate these well-established temperature-performance relationships represents a critical vulnerability in adapting general planning models to cold-region scenarios.
2.2. Mainstream Planning Paradigms and Universal Limitations
The broader literature on EV charging station location, as reviewed by Zhou et al. [16], has established a mature paradigm primarily focused on three interconnected aspects: influencing factors, model construction, and algorithm solving. This is reflected in models that employ a variety of mathematical approaches, such as the p-median model enhanced with genetic algorithms by Celik et al. [17] to address growing infrastructure demand.
However, a critical synthesis of this body of work reveals two pervasive and interconnected limitations that undermine the real-world applicability and societal optimality of their solutions. First, a comprehensive perspective of total social cost remains notably absent. While some models, like that of Zhang et al. [18], include infrastructure and user expenditures, they frequently overlook broader externalities such as the costs of grid capacity reinforcement, traffic congestion, and environmental impacts. Second, a significant fidelity gap exists between model parameters and real-world conditions. The widespread reliance on Euclidean distance [17] ignores the constraints of actual road networks, traffic patterns, and travel times, leading to siting decisions that may poorly align with realistic travel patterns. These limitations cause mismatches between planned schemes and actual operational scenarios.
2.3. Potential of IoT-Enabled Smart Charging and the Cold-Region Gap
Recent advancements in the Internet of Things (IoT) paradigm have introduced significant potential for intelligent charging infrastructure management. By leveraging real-time data streams from vehicle sensors, charging piles, and smart meters, researchers have developed dynamic scheduling frameworks aimed at optimizing operational efficiency. For instance, ref. [19] proposed the tCharge system, which utilizes real-time GPS data from electric taxis to estimate travel times to various charging stations, effectively reducing queuing delays. Similarly, ref. [20] applied reinforcement learning to jointly schedule taxi service operations and charging activities, thereby minimizing unprofitable deadhead kilometers. Additionally, Emodi et al. [21] further expanded IoT-related research in EV charging infrastructure: they systematically analyzed the role of IoT in integrating charging resource monitoring, user demand matching, and policy adaptation, highlighting that IoT-enabled systems can simultaneously improve charging operational efficiency and enhance consumer charging experience (e.g., real-time station availability inquiry). These studies exemplify how IoT data can be harnessed to improve fleet-level decision-making under normal operating conditions.
Concurrently, a robust body of literature has quantitatively established the severe impact of low temperatures on electric vehicle performance. Empirical studies, such as that by [22], have demonstrated that ambient temperatures below freezing can lead to a dramatic reduction in driving range—up to 42.8%—primarily due to increased energy demand for cabin heating. This performance degradation is further compounded by reduced battery discharge capacity and increased internal impedance, as reviewed in the context of vehicle thermal management systems [23]. Such findings underscore the critical, yet often overlooked, environmental constraint in cold-region operations.
However, a critical synthesis reveals a pronounced disconnect between these two research streams. While IoT-based scheduling models excel in dynamic resource allocation, they predominantly operate under static or temperate environmental assumptions. Conversely, studies on cold-weather impacts, while rich in characterizing the problem, seldom translate these findings into actionable inputs for real-time operational planning. Specifically, there is a lack of frameworks that integrate real-time temperature data—an IoT variable—as a dynamic constraint to adjust charging demand forecasts, station service radii, and fleet dispatching logic. This gap is particularly acute for electric taxi fleets in severe cold regions, where the combination of relentless operational intensity, acute driver range anxiety, and temperature-sensitive battery behavior creates a unique and compounded challenge that existing generic models are ill-equipped to address.
2.4. Electric Taxi Operations and the Compounded Cold-Climate Challenge
The operational paradigm of electric taxis (ETs) introduces a critical layer of complexity to charging infrastructure planning, distinct from that of private EVs. Understanding their unique charging demand patterns is essential. Recent research has made significant strides in this area. For instance, Tan et al. [24] employed idle-rate analysis to assess the operational dynamics of EV fleets, providing a data-driven method for forecasting fleet scale and charging needs by linking vehicle downtime to charging opportunities.
The economic viability of ETs is acutely sensitive to these charging logistics, as time spent charging directly translates to lost income, creating a significant “charging penalty.” This penalty can render ETs less profitable than their conventional counterparts if infrastructure is not optimally planned to minimize downtime and detours.
When this operational intensity is superimposed upon the harsh reality of cold climates, the challenge is not merely additive but compounded. The significant range attenuation and elevated energy consumption, as established in Section 2.1, force ETs into more frequent and potentially longer charging sessions. This drastically alters their spatial-temporal demand profile, a phenomenon captured in high resolution by studies analyzing trajectory data, such as the spatiotemporal distribution characteristics identified by Wang et al. [25]. Furthermore, the broader impact of climate on charging behavior, as demonstrated in studies like Henrique et al. [26], which analyzed climate effects on EV demand in a cold-climate city, confirms that low temperatures systematically increase and reshape aggregate charging loads.
The situation is further complicated by the vehicle-level energy management in cold climates. Strategies such as temperature-controlled smart charging Ruan et al. [27], while crucial for preserving battery range, introduce additional dynamics to the charging decision-making process, potentially aligning charging events with periods of high grid stress or cost.
2.5. Synthesized Research Gaps
In summary, the literature presents a clear and unaddressed research gap at the intersection of climate impact, fleet operations, and planning methodology. Existing charging station location models exhibit critical shortcomings in social cost accounting and spatial realism. These shortcomings become acutely pronounced when applied to the electric taxi sector, whose operational economics are uniquely vulnerable to the severe range and energy consumption penalties imposed by cold climates. Therefore, there is a pressing need for a novel planning framework that: (1) mechanistically integrates cold-weather performance data into ET-specific demand forecasting; (2) adopts a comprehensive social cost perspective that includes cold-region-specific externalities; and (3) employs high-fidelity spatial modeling based on real-world road networks to ensure operational viability. This study aims to develop such a framework to bridge these identified gaps.
This synthesis reveals a critical disconnect in the literature: while studies on EV performance quantify cold-climate impacts, and planning models offer general siting methodologies, there is a distinct lack of frameworks that operationalize temperature-dependent performance data into taxi-specific, real-time planning tools. Existing models often remain either too generic (overlooking fleet operational intensity) or too static (ignoring the dynamic coupling of weather and demand). This gap highlights the necessity for the integrated, behaviorally-informed, and climate-adaptive planning framework developed in this study.
2.6. Positioning and Methodological Advancements
To crystallize the contribution of this work, this section delineates how the proposed framework advances beyond the state-of-the-art literature reviewed above. The innovations are threefold, each addressing a specific limitation identified in Section 2.1, Section 2.2, Section 2.3, Section 2.4 and Section 2.5.
First, regarding the impact of cold climates (Section 2.1), this study moves beyond static corrections or neglect of thermal effects by introducing a dynamic, data-calibrated temperature-correction coefficient, . This coefficient is derived empirically from the convergence of GPS-derived energy consumption patterns and driver survey data across defined temperature intervals. It is mechanistically embedded within the Integer Linear Programming (ILP) model to adjust both spatial service constraints and temporal demand forecasts, thereby transitioning infrastructure planning from a climate-blind to a climate-responsive paradigm.
Second, confronting the fidelity gap in spatial modeling (Section 2.2), the framework achieves high-fidelity planning through multi-source data fusion. It utilizes actual road network distances from GPS trajectories, calibrates maximum service radii based on behavioral thresholds from driver questionnaires (e.g., 78% acceptance for ≤2 km detours), and anchors demand points to empirically observed hotspots. This approach grounds the model in observed operational reality rather than theoretical or Euclidean simplifications.
Third, to address the compounded economic challenge for electric taxis in cold regions (Section 2.4 and Section 2.5), the model employs a holistic cost-minimization function. This function explicitly internalizes cold-region externalities, such as temperature-dependent energy costs, elevated driver waiting penalties during prolonged charging, and the strategic cost-coverage trade-off between urban cores and suburbs. Consequently, the framework shifts from generic cost optimization to context-specific total cost of ownership assessment for extreme environments.
In summary, this study re-engineers the core planning logic to treat extreme cold as a central, defining constraint, thereby offering a novel and integrated solution to the synergistic challenges previously addressed in isolation.
3. Methodology
3.1. Assumptions
- (1)
- It is assumed that taxis arriving at charging stations follow a first-come-first-served principle. However, in practical applications, especially during peak hours, taxi drivers may opt for other charging stations to avoid queues.
- (2)
- The time intervals between arrivals follow a Poisson distribution [28].
- (3)
- Charging time follows a negative exponential distribution.
- (4)
- Drivers will ensure they arrive at a charging station before the battery is depleted, fully considering factors such as accelerated power consumption in low winter temperatures and reserving a sufficient safety buffer to ensure operational safety and continuity.
- (5)
- Taxis arrive at charging stations randomly and are served on a first-come-first-served basis. The system is modeled as an M/M/K queue.
To enhance model solvability, a moderate number of candidate charging stations need to be selected. Potential locations may be clustering centers or existing facility points, with the core objective of covering high-demand areas.
The planning of charging station construction aims to meet the charging demands of electric taxis in the region. Therefore, the number of charging demands at candidate sites is used as an indicator to select candidate locations. When the construction quantity range of charging stations is determined to be between and , the top grids with the highest charging demand are selected as candidate sites, forming a candidate site grid set . The construction quantity range of charging stations is calculated as shown in Equations (1) and (2).
where denotes the minimum construction quantity of charging stations, represents the total charging demand of electric taxis in the region, signifies the maximum service capacity of a single charging station, denotes the maximum construction quantity of charging stations, and represents the minimum service capacity of a single charging station.
3.1.1. Construction Cost of Charging Stations
Construction cost is one of the significant economic factors influencing location decisions, including land and equipment costs, which directly affect the construction level and location of charging stations.
(1) Land Cost
The land area of a charging station includes charging spaces, supporting facilities, and roadway areas. Each charging space occupies , with the total charging area being , where n is the number of chargers. Supporting facilities mainly consist of the following components:
- High-voltage distribution rooms
- Low-voltage distribution rooms
- Transformer rooms
- Monitoring rooms
- Charging machine rooms
The total land area for supporting facilities is set at , and the roadway areas (top, bottom, left, and right) are set at .
Derivation of the total land area S of a charging station is the sum of three components:
- Charging bay area: Each charging pile occupies , so for n piles, the total area is ().
- Supporting facilities area: Fixed at according to design specification DB65/T 4636-2022.
- Roadway area: Fixed at based on layout design.
Therefore, the theoretical total area is:
In practical planning, additional space is required for safety clearances, buffer zones, and standardized layouts. Considering these factors, the constant term is adjusted to , yielding the final formula:
where represents the land cost, is the average land price, S is the occupied area of the charging station, n is the number of charging piles.
(2) Equipment Cost
Within a defined time horizon, the cost of a single charging facility (or charging unit) is typically assumed to remain constant. The equipment cost is calculated as follows:
where represents the equipment cost, is the number of devices at the grid charging station, and is the unit price of the equipment. Note that this study assumes constant unit prices over the planning horizon as a baseline for comparative analysis. The implications of this simplification, including potential technological cost reductions and additional operating costs in cold climates (e.g., heating and maintenance), are discussed as a limitation in Section 6.1.
3.1.2. Driving Cost
The driving cost from a demand point to a charging station is influenced by temperature, driving distance, electricity price, and other factors, which are related to drivers’ operational revenue, urban traffic efficiency, and green development.
- (1)
- Impact of Temperature on Energy ConsumptionElectric vehicle battery performance is significantly affected by temperature, especially in low-temperature environments. The long and cold winters in Urumqi lead to the following critical impacts:
- Substantial drop in battery charging efficiency and capacity [10],
- Significant decline in overall battery efficiency.
- Increased energy consumption per kilometer driven.
- Reduction in vehicle driving range by 18–22%.
- (2)
- Temperature-Dependent Correction FactorTo accurately reflect the energy consumption characteristics of electric taxis in Urumqi’s severe cold environment, a temperature-dependent dynamic correction factor is introduced in the objective function of the charging station location model. Traditional studies often employ a fixed temperature correction factor (e.g., 5.0), but in regions with significant temperature fluctuations, fixed factors fail to accurately rarely capture the impact of extremely low temperatures. Through cluster analysis and energy consumption data fitting, this study proposes a dynamic temperature correction factor , as shown in Table 1. Under extreme low temperatures ( °C), increases to 6.0, a 20% rise from the conventional low-temperature 5.0, aligning with the actual condition of 40% battery capacity decay.Table 1. Calibration results of dynamic temperature correction coefficient.The dynamic temperature correction coefficient in Table 1 represents the aggregated impact of low-temperature effects on EV energy consumption per degree Celsius below the reference temperature ( °C). This coefficient simultaneously captures two primary cold-weather phenomena: the reduction in battery discharge capacity and efficiency due to increased internal resistance and electrochemical slowdown, and the increased energy demand from auxiliary loads, particularly cabin heating. The calibrated values in Table 1 reflect the combined effect of these factors, derived from real-world energy consumption data of Urumqi’s electric taxi fleet. Thus, Equation (6) adjusts the baseline energy consumption by adding a temperature-dependent term that quantifies the total additional energy required due to cold conditions. The calibration of values is based on the synthesis of real-world fleet GPS energy consumption data and driver questionnaires, which serves as a practical proxy in the absence of manufacturer-specific battery performance tests under controlled conditions. Incorporating such experimental data remains a valuable direction for future refinement. Figure 1 indicates the standardized power consumption of pure electric taxis in different temperature ranges.Figure 1. Standardized power consumption of pure electric taxis in different temperature ranges.is the actual 100-km energy consumption of the vehicle under the real ambient temperature (unit: kWh/100 km). is the benchmark 100-km energy consumption under standard reference conditions (i.e., ideal conditions: 10 °C, favorable road conditions, etc.). reference temperature for energy consumption (Fixed value of 10 °C). represents the actual measured temperature of the vehicle during operation.
- (3)
- Electricity consumption costThe travel cost of a taxi from the demand point to the charging station, without considering the loss cost, is composed only of the cost of electricity consumption.
3.1.3. Taxi Waiting Time Cost
In our study, we apply queuing models to analyze taxi waiting time costs.
- (1)
- Model Parameters and DefinitionsIn an M/M/K queuing system, the average waiting time for taxis can be calculated using the following formula:where represents the average waiting time of taxis, denotes the arrival rate, defined as the number of taxis arriving at the charging station per unit time, is the service rate, indicating the number of taxis that can be charged per unit time by each charging pile, k is the number of charging piles, and signifies the system utilization rate.
- (2)
- Waiting Time Cost Calculationwhere is the waiting-time cost, is the total cost per unit time, is the operating cost per unit time, is the driver’s wage per unit time, and is the service-quality cost.
3.1.4. Model Extensibility Towards Reliability Integration
The core model establishes an optimal baseline layout under ideal equipment availability, isolating the primary effect of temperature on vehicle demand. However, operational resilience in extreme cold also depends on charging infrastructure reliability. To transparently address this aspect and demonstrate the model’s forward compatibility, we outline a structured pathway for future integration.
The M/M/K queuing model can be extended to reflect temperature-dependent station availability by introducing an availability factor, , modulating the effective number of service channels:
where represents the operational availability rate at temperature T, which could be calibrated from field data on Mean Time Between Failures (MTBF) for charging equipment in cold climates.
Furthermore, a penalty term for expected downtime cost could be incorporated into the total cost objective as shown in Equation (17):
where is the arrival rate at station j and is the cost per lost service opportunity.
Implementing this extension requires reliability datasets not yet available for this case study. Presenting this pathway underscores that the current model provides a foundational and extensible template, with the mathematical structure readily adaptable to incorporate infrastructure resilience data as it becomes available.
3.2. Modeling
3.2.1. Optimization and Refinement of the Objective Function
The objective function comprises construction costs, driving costs, and queuing waiting costs. This study establishes a charging station location planning model with three objective functions as shown in Equation (18).
where represents the construction cost of the charging station, which encompasses investment and operational expenses. denotes the driving cost incurred by electric taxi drivers when traveling from the charging demand point to the selected charging station. signifies the waiting cost generated during the queuing process at the charging station.
Equation (18) represents the objective function of the location model. When the objective function reaches its minimum value, the location model can obtain an optimal solution. However, when the objective function achieves its minimum, the construction cost of charging stations and taxi driving costs may not be minimized simultaneously. Constructing charging stations in low land price areas can effectively reduce costs, yet high-demand areas such as large shopping malls and transportation hubs may lead to increased driving time costs if charging stations are not established. Solving this model identifies the optimal charging station locations that minimize regional comprehensive costs, balancing investment and user driving costs to achieve optimal site selection.
3.2.2. Decision Variable Definitions
Binary variable , , indicates whether candidate site j is selected ( for construction, otherwise not).
Binary variable , , indicates whether demand point i is served by j.
3.2.3. Integration of Charging Behavior Analysis into the ILP Model
To enhance the practical applicability and behavioral consistency of the charging station planning model, the empirical findings from charging behavior analysis (Section 4.4 and Section 4.5) are systematically integrated into the Integer Linear Programming (ILP) framework. This integration is achieved by quantifying behavioral patterns into model parameters, constraints, and objective function weights, as detailed below.
- (1)
- Time-Period-Specific Demand Constraints
Questionnaire results indicate that 70% of drivers prefer charging during midday (11:00–14:00). To address this temporal concentration, the model incorporates time-segmented demand coverage constraints:
where is the charging demand at point i during time period t, and includes identified high-demand periods.
- (2)
- Station Type and Location Preferences
Given drivers’ strong preference for fast charging, candidate stations are categorized. Fast-charging stations are prioritized in high-demand areas (e.g., transportation hubs) with higher service rates , while slow-charging stations are considered in suburban areas.
- (3)
- Behaviorally-Calibrated Service Radius
Questionnaire analysis shows that 78% of drivers accept detours of ≤2 km. To align with this, the maximum service radius is dynamically adjusted:
where , ensuring radii reflect driver willingness and cold-weather range.
- (4)
- Summary of Behavioral Integration
By structurally quantifying and embedding charging behavior insights, the ILP model transitions from a purely mathematical optimization to a behaviorally-informed planning tool.
4. Analysis of the Spatiotemporal Distribution of Taxi Charging Demand
4.1. Data Collection and Description
4.1.1. Taxi GPS Data
In urban public facility layout, trajectory data utilization can help effectively mine information and reflect traffic characteristics. We collected taxi GPS data from Urumqi City from 1 to 7 July 2024. These data include key attributes such as vehicle ID, recording time, longitude and latitude, driving status, and passenger-carrying status, as shown in Table 2.
Table 2.
Attributes of taxi trajectory data.
4.1.2. Meteorological and Questionnaire Data
Meteorological Data: Hourly temperature records in Urumqi City from 2023 to 2024 were collected, including extreme low temperatures (−30 °C) and transitional period data (−5 °C to 0 °C), to calibrate the dynamic temperature correction coefficient .
Questionnaire Survey: 200 questionnaires were distributed to taxi drivers, with 183 valid responses (a response rate of 91.5%). The survey covered operational duration, charging preferences, and detour behaviors.
4.2. Data Preprocessing
4.2.1. Data Cleaning
Due to inevitable interference during the GPS data collection process, the original data may contain noise, missing values, and redundant information. Before use, the following data cleaning steps were performed: (1) Data outside the geographical boundaries of Urumqi City; (2) Duplicate data with the same time or vehicle ID over short distances; (3) Data with abnormal passenger-carrying status; (4) Drift point data.
4.2.2. Extraction and Calculation of OD Points
The passenger-carrying status field in the trajectory dataset contains OD information. When the value of this field changes from 0 to 1, it indicates the start of a trip, and the corresponding longitude and latitude are the origin (O) point. Conversely, when the value changes from 1 to 0, it indicates the end of a trip, and the corresponding longitude and latitude are the destination (D) point. After extracting the origin and destination points, the cleaned data were used to calculate OD distances.
4.2.3. OD Distances Calculation
The Haversine formula was employed to accurately calculate the spherical distance between two points on Earth. The longitude and latitude values from the data were converted to radians and input into the Haversine formula to obtain the straight-line distance between each pair of OD points. Mathematical statistics were then performed on the OD data.
4.3. Data Analysis Results
4.3.1. Total Travel Volume
Based on taxi GPS data from July 1 (Monday) to July 7 (Sunday), 2024, this study extracted the temporal variation curve of travel frequency for weekdays and weekends (Figure 2) and analyzed the periodic patterns of residents’ travel using statistical indicators.
Figure 2.
Order quantity time change curve.
As shown in the Figure 1, weekdays exhibit a significant “double-peak” pattern, with morning (8:00–10:00) and evening (18:00–20:00) peaks accounting for 28% and 24% of the day’s total travel volume, respectively. The peak travel volumes reach 7200 and 6800 trips. In contrast, weekends show a single-peak pattern, with midday (11:00–14:00) being the period of concentrated demand, peaking at 5500 trips (32% of the day’s total). Midday travel accounts for a higher proportion, and the daily demand distribution is more even without a distinct evening peak, which is related to the randomness of leisure activities. The average daily travel volume on weekdays is 17.3% Urumqi’s higher than on weekends, with concentrated demand during morning and evening peaks, reflecting significant commuting rigidity. Nighttime differences: between 00:00 and 06:00, travel volumes on both weekdays and weekends remain below 1000 trips, but the demand declines more rapidly after the evening peak on weekdays.
4.3.2. OD Distance Analysis
Statistical descriptions of OD distance data were conducted to understand the distribution characteristics of taxi driving distances. The average value and median of OD distances were calculated. The average value reflects the overall level, while the median, less affected by extreme values, more robustly represents the central tendency. The standard deviation was also calculated to measure data dispersion and reflect the fluctuation in taxi driving distances. By standardizing the time format, different periods (weekdays/weekends, morning peak 8–10 AM, evening peak 6–8 PM, off-peak times, etc.) were distinguished, and statistical indicators (average, median, standard deviation) for each period were computed. Comparisons of OD distances across different periods revealed changes in taxi operational characteristics and driving demands over time. For example, during morning peak hours, OD distances are relatively short, concentrated on urban commuting routes. During evening peak hours, OD distances are longer, potentially involving more inter-regional travel.
On weekdays, as shown in Figure 3a, the average OD distance is 4.8 km, with short-distance trips (<5 km) accounting for 65%, mainly concentrated on morning and evening commuting routes (e.g., from New District to Tianshan District). Figure 3b indicates that during the morning peak, short-distance trips are concentrated, with OD distances mainly between 3–5 km (45% of trips), corresponding to commuting routes from New District (residential areas) to Tianshan District (CBD) via Beijing Road and Hetan Expressway. Figure 3c shows that during the evening peak (18:00–20:00), there is a bimodal distribution: short-distance return trips (3–5 km, 40% of trips) overlap with inter-regional business trips (8–10 km, 30% of trips), reflecting a mix of commuting and business activities.
Figure 3.
(a) OD distance distribution on working days. (b) The OD distance distribution during the morning rush hour on working days. (c) Distribution of OD distances during the early peak period of working days.
As shown in Figure 4a, on weekends, the proportion of long-distance trips (>10 km) increases to 25%, closely related to family outings and inter-regional shopping. During the midday peak (12:00–14:00), as shown in Figure 4b, medium-distance trips dominate, with OD distances concentrated between 5–7 km (50% of trips), destined for commercial areas (e.g., Wanda Plaza in Economic Development Zone) and scenic spots (e.g., Hongshan Park). In the evening (18:00–20:00), as shown in Figure 4c, demand is dispersed, with a wider range of OD distances (standard deviation of 5.3 km) and long-distance trips (>10 km) accounting for 25%, associated with leisure activities such as dining and outings. Nighttime demand is low but shows significant fluctuation in OD distances, with sporadic long-distance trips due to inter-regional entertainment activities (e.g., bars and cinemas).
Figure 4.
(a) The distribution of OD distance on rest days in Urumqi. (b) OD distance distribution during the midday rush hour on rest days. (c) OD distance distribution during the evening rush hour on rest days.
4.3.3. Generation and Demand Analysis of Heatmaps
Based on taxi GPS trajectory data from Urumqi City on July 1 (a working day) and July 6 (a rest day) in 2024, a spatiotemporal comparative analysis of taxi travel was conducted to explore the spatial characteristics of taxi operations and the spatial distribution of charging demand. By extracting effective OD points from the passenger-carrying status field (0→1 indicating pick-up points and 1→0 indicating drop-off points) and removing outliers (e.g., stay time < 1 min or >24 h), high-frequency OD pairs were identified. These pairs reflect urban population mobility hotspots and primary taxi operation routes. Density values were mapped to color intensities (red: high density; orange: medium density; yellow to light colors: low density) to intuitively display taxi operation hotspots and coldspots, providing a basis for charging station layout.
Heatmaps reveal that high-demand areas are primarily concentrated in urban core functional zones, with pick-up and drop-off points mainly within the old urban area (Shuimogou District, Shabayi District, and Tianshan District), while the New District and Touhuan River District show relatively less activity.
As shown in Figure 5, working-day demand is highly concentrated in the urban core functional areas (Tianshan District and Shabayi District), accounting for 65% of the day’s travel volume. Red zones are distributed along commuting corridors (Beijing Road and Hetan Expressway), reflecting the combined effects of commuting and business activities.
Figure 5.
Working-Day Travel Demand Distribution Heatmap.
Figure 6 indicates that rest-day demand becomes more dispersed, with long-distance travel increasing to 25%. Red zones shift toward commercial areas (Meimei Shopping Mall and Times Square) and leisure spots (Hongshan Park).
Figure 6.
Rest-Day Travel Demand Distribution Heatmap.
In the spatiotemporal patterns of taxi operation characteristics, the correlation between speed and time periods has a direct impact on the distribution of charging demand. The speed-time heatmap (Figure 7) generated based on GPS data of taxis in Urumqi shows the following: During the daytime period from 10:00 to 20:00, orders are concentrated in the speed range of 10–30 km/h (indicated by reddish colors), reflecting that vehicle speeds are restricted due to traffic congestion during this period. Meanwhile, travel demand is concentrated, and drivers have high requirements for charging convenience due to frequent order acceptance. Therefore, it is necessary to deploy emergency fast-charging facilities in hotspot areas (such as transportation hubs and commercial districts). From 0:00 to 6:00 in the early morning, the overall number of orders is small (indicated by cooler colors), and road smoothness leads to scattered vehicle speeds. During this period, the opportunity cost of charging for drivers is low, so large-capacity slow-charging stations can be deployed in suburban areas to reduce costs by utilizing off-peak electricity prices. Figure 7 Heatmap of the correlation between taxi speed and order start time Note: The horizontal axis represents the order start time (0–24 h), the vertical axis represents the driving speed (km/h), and the color depth indicates the order frequency (darker colors correspond to higher frequencies). The data are derived from the continuous one-week GPS trajectories of 12,000 taxis in Urumqi. This figure reveals the operating status of taxis and potential charging windows in different time periods, providing data support for objectives such as “dynamic demand matching” and “cost optimization” in the subsequent charging station location model, thus making the planning scheme more in line with the actual operational needs of taxis in cold regions.
Figure 7.
Heatmap of Urumqi Taxi Speed-Time Period Correlation and Order Frequency.
In summary, regardless of whether it is a working day or a rest day, high-demand points are primarily concentrated near Urumqi Station, the Friendship Commercial Circle, and the airport. High-speed rail stations and airport surroundings exhibit high-density demand throughout the day, especially during flight takeoff and landing periods when charging demand surges. Daily hotspots can be categorized into three types: (1) transportation hub hotspots, represented by areas near Urumqi Station and the airport; (2) commercial shopping hotspots, represented by areas near Times Square and Meimei Shopping Mall; (3) residential area hotspots, represented by high-density housing clusters such as those in Shuimogou and Tianshan districts. Transportation hubs have the highest intensity of demand, followed by commercial shopping areas, indicating that residents’ travel behaviors are closely related to transportation and consumption activities.
4.4. Analysis of Charging Behavior Based on Questionnaire Survey
In this study, 183 valid questionnaires were systematically organized and statistically analyzed to comprehensively explore the charging behavior characteristics and preference patterns of taxi drivers. The analysis reveals that in terms of operational features, 85% of drivers operate for over 10 h daily, with an average daily mileage of 300 km (standard deviation ± 45 km) and an average charging frequency of 2.5 times per day, of which 70% are rapid charges. This indicates that drivers prefer to quickly replenish energy to minimize operational time disruption.
Regarding charging preferences, 90% of drivers tend to charge at passenger-dense areas such as transportation hubs (52%) and commercial centers (68%). These areas, with high passenger flow and demand, lead to faster battery depletion in taxis, making charging demand more urgent. Additionally, 70% of drivers choose to charge during midday (11:00–14:00) when passenger flow is relatively low to reduce operational losses.
Furthermore, through the analysis of open-ended questions in the questionnaire, numerous valuable suggestions from drivers regarding future charging station layouts were collected. Among these, 82% of drivers recommend adding charging stations in suburban areas to improve charging coverage in remote regions, while 76% hope that charging stations will be equipped with dining and rest areas to enhance the charging experience. Further analysis combining GPS data reveals that the charging demand density around commercial centers like Meimei (One of the most famous luxury malls in Urumqi) Shopping Mall is 15 per km2, echoing the 68% of drivers who prefer to charge in this area.
The charging demand density around transportation hubs like Urumqi Station is as high as 22 per km2, with 52% of drivers prioritizing charging there. Time-period matching shows that midday charging demand in commercial areas accounts for 35%, aligning closely with the 70% of drivers who prefer to charge during this period. In contrast, nighttime charging demand (00:00–06:00) is less than 10%, with GPS data also indicating that charging point density during this period is only 2 per km2. Additionally, residential area hotspots exhibit stable off-peak demand, but with only 15% charging facility coverage, drivers average an extra 8.5 km in daily travel. These comprehensive analytical results provide robust data support and practical guidance for optimizing charging station layouts and improving the service level of charging facilities.
4.5. Data Fusion and Consistency Verification
In this study, data fusion and validation were employed to conduct an in-depth analysis of charging demand across different hotspot regions. In terms of location matching, the charging demand density around commercial centers such as Meimei Shopping Mall was found to be 15 per km2, resonating with the 68% of drivers who selected this area for charging. Similarly, the charging demand density around transportation hubs like Urumqi Station reached as high as 22 per km2, with 52% of drivers prioritizing charging in this location. Time-period matching revealed that midday charging demand in commercial areas accounted for 35%, closely aligning with the preference of 70% of drivers who tended to charge during this period. In contrast, nighttime charging demand (00:00–06:00) was found to be less than 10%, with GPS data also showing that charging point density during this period was merely 2 per km2.
Further analysis indicated that transportation hub hotspots exhibited high-demand characteristics throughout the day. Seventy percent of drivers chose to prioritize charging stations around these hubs to minimize empty vehicle travel, reducing average detour distances by 2.3 km. Commercial shopping hotspots displayed significant time-period fluctuations in demand, with 90% of drivers preferring to charge in these areas. The dense passenger flow in these locations could enhance passenger pickup rates by 15% and decrease empty vehicle search time. Residential area hotspots demonstrated stable off-peak demand, yet charging facility coverage stood at only 15%, leading to an average additional daily travel distance of 8.5 km for drivers.
Furthermore, hotspot analyses of Shamian District, Shabayi District, and the New District revealed that charging demand highly overlapped with commuting corridors. High-speed rail stations and airport surroundings exhibited high-density demand around the clock, particularly during flight takeoff and landing periods.
5. Results
This study focuses on the location optimization of electric taxi (E-taxi) charging stations in Urumqi, a typical severe cold region in northern China (annual average low temperature: −10.5 °C, extreme minimum temperature: −35.7 °C). The research addresses the critical gap of low-temperature adaptability in existing charging station planning models by integrating multi-source heterogeneous data and an integer linear programming (ILP) model with dynamic temperature correction. This section systematically presents the research findings, including data preparation, model implementation, and core visualization results.
5.1. Data Preparation
The analysis is grounded in three validated datasets, rigorously aligned with the study’s research design:
- (1)
- High-frequency charging demand points: 1500 geocoded demand points (WGS84 coordinate system, precision: 0.0001°) filtered from 7-day (1–7 July 2024) trajectory data of 12,000 E-taxis in Urumqi. The filtering criterion was a minimum charging request frequency of 3 times/day, ensuring alignment with E-taxi drivers’ operational patterns (85% of drivers operate > 10 h/day, with an average daily charging frequency of 2.5 times, per the driver questionnaire). This dataset was validated against operational records from the Urumqi Transportation Bureau (2024), yielding a Pearson correlation coefficient of 0.89 (p < 0.001) for demand density, confirming its reliability.
- (2)
- Meteorological data: Hourly temperature records (2023–2024) from the China Meteorological Administration’s Urumqi Station, covering three ecologically and operationally relevant intervals: extreme low temperature (−35 °C to −25 °C, 42 days/year), low temperature (−25 °C to °C, 108 days/year), and transitional temperature ( °C to 15 °C, 215 days/year). These data were critical for calibrating the dynamic temperature correction factor (), which quantifies lithium iron phosphate battery performance degradation in cold environments—a core innovation of the study.
- (3)
- Candidate charging stations: Constrained by Urumqi’s land-use regulations (excluding ecological protection zones and historical districts) to ensure practical feasibility. Construction costs were stratified by urban functional zones (¥12,000/m2 for core urban areas and ¥5000/m2 for suburban areas), consistent with Urumqi’s 2023 benchmark land prices and the study’s cost parameterization framework.
5.2. Methodology and Model Implementation
The ILP model was formulated to minimize total life-cycle cost (discounted construction cost + annual operational cost), aligned with the study’s objective of balancing economic efficiency and service quality. A core novelty of the model is the integration of , which dynamically adjusts battery energy consumption attenuation (25–35% at °C), directly addressing the study’s key research gap of cold-region adaptability.
5.3. Spatial Distribution of Optimized Charging Station Layout
Figure 8 illustrates the spatial pattern of 1500 high-frequency demand points (blue dots), 120 candidate stations (yellow triangles), and 40 ILP-optimized stations (red pentagrams) within Urumqi’s core urban area (87.4–87.7° E, 43.75–43.95° N). The analysis below quantifies the spatial rationality of the optimized layout, directly linking it to the study’s model assumptions (e.g., demand-driven targeting, cold-region adaptability) and empirical findings on E-taxi operational behavior.
Figure 8.
Spatial optimization of electric vehicle charging station locations in Urumqi-Area: Candidate sites, demand points, and service coverage.
5.3.1. Agglomeration of Demand Points and Targeted Optimization
Consistent with the study’s analysis of E-taxi trajectory data and driver questionnaire results, the 1500 demand points exhibited a distinct “dual-core, multi-cluster” agglomeration pattern—directly mirroring the spatiotemporal characteristics of E-taxi operations in Urumqi:
- Primary clusters: Cluster 1 (Urumqi Railway Station) with a demand density of 7.3 requests/km2 (570 points, 38% of total demand) and Cluster 2 (Meimei Shopping Mall) with 5.0 requests/km2 (435 points, 29% of total demand). These clusters align with driver preferences (52% prioritize charging at transportation hubs, 68% at commercial centers, per the questionnaire), confirming the validity of demand point extraction.
- Secondary clusters: Three suburban clusters (Xinshi, Midong, and Toutunhe Districts) with 1.7–2.7 requests/km2 (495 points, 33% of total demand), corresponding to residential and commuting corridors identified in the trajectory data analysis.
The ILP model’s selection of optimized stations demonstrated strong spatial targeting, directly translating the study’s “demand-priority” principle into practice: 80% were anchored to the two primary clusters and secondary cluster centers, while only 20% were placed in low-demand suburban areas. This distribution avoided the “spatial mismatch” observed in the random selection scheme (paired t-test for demand density alignment: , and directly addressed the study’s hypothesis that targeted layout reduces operational inefficiencies for E-taxis in cold regions.
5.3.2. Dynamic Adjustment of Service Radius for Cold Adaptation
The optimized layout incorporated context-aware service radius adjustments, a direct response to the study’s key finding that low temperatures reduce E-taxi driving range by 25–30%.
- Core urban areas: The service radius was compressed from the industry standard 3 km to 0.8 km (a 73.3% reduction), explicitly designed to mitigate range attenuation. This adjustment reduced the average detour distance of E-taxis from 3.5 km (random scheme) to 2.1 km (optimized scheme) (40% reduction, p < 0.001), aligning with driver detour tolerance (78% of drivers accept detours ≤ 2 km, per the questionnaire) and reducing cold-related energy consumption.
- Suburban areas: The service radius was maintained at 3 km, covering 92% of suburban demand points (vs. 78% for a 1 km radius) while leveraging lower land costs (¥5000/m2 vs. ¥12,000/m2 in core areas). This balance between coverage and cost directly reflects the study’s cost-minimization objective and land-use constraint framework.
5.3.3. Quantitative Comparison of Coverage Efficiency and Resource Redundancy
The optimized scheme outperformed the random scheme across key metrics, validating the study’s model efficacy:
- Coverage efficiency: The optimized scheme achieved a high-frequency demand coverage rate of 96.2% (1443/1500 points), a 16.6% improvement over the random scheme (82.5%) (p < 0.001). Full coverage (100%) was achieved in the two primary clusters—critical given their high demand density and driver preference—with 94.3% coverage in secondary clusters. This aligns with the study’s goal of ensuring service accessibility for high-priority demand.
- Resource redundancy: The service radius overlap rate of optimized stations was only 7.8% (confined to the boundary of the two primary clusters, overlapping area = 0.32 km2), compared to 27.2% (3.15 km2) for the random scheme (p < 0.001). This low overlap translated to a station utilization rate of 78% (optimized) vs. 52% (random), eliminating idle capacity—a key concern in cold regions where construction costs are elevated due to harsh environmental conditions.
5.4. Impact of Temperature on Construction Cost
Figure 9 quantifies the relationship between ambient temperature and construction cost, with three curves representing the random scheme (no temperature correction), optimized scheme (with ), and cost savings rate. The analysis below decomposes temperature-driven cost dynamics, directly linking them to the study’s calibration, battery performance assumptions, and cold-region planning challenges.
Figure 9.
Total cost vs. Temperature for optimized and random strategies with cost savings ratio.
5.5. Impact of E-Taxi Penetration Rate on Total Life-Cycle Cost
Figure 9 evaluates the scalability of the optimized scheme across E-taxi penetration rates (5–50%), with total life-cycle cost (discounted construction cost + annual operational cost) as the primary metric. The analysis below links the results to the study’s consideration of long-term urban electrification trends, with Urumqi’s current penetration rate (15%, 2024) and 2030 target (50%) as key reference points—directly addressing the study’s goal of developing a future-proof planning framework.
5.5.1. Differential Cost Growth Rates: Linked to Model Efficiency and Demand Dynamics
The divergent cost growth rates across penetration intervals directly reflect the study’s model design, which prioritizes both short-term efficiency and long-term adaptability:
- Low penetration (5–20%): The random scheme exhibited a cost growth rate of ¥225,000 per 10% penetration increase (from ¥560,000 at 5% to ¥910,000 at 20%), while the optimized scheme had a rate of ¥182,000 per 10% increase (from ¥450,000 at 5% to ¥714,000 at 20%) (19.1% reduction, ).
- High penetration (20–50%): The growth rate gap persisted (optimized: ¥182,000 per 10%; random: ¥225,000 per 10%), driven by the optimized scheme’s higher single-station service capacity (42 vehicles/day vs. 34 vehicles/day for random). This efficiency advantage, rooted in the model’s spatial targeting and cold-region adaptation, eliminated the need for reactive station additions in the random scheme—even as demand surged to 50% penetration. This aligns with the study’s focus on life-cycle cost minimization, as operational efficiency becomes increasingly critical in high-penetration scenarios.
5.5.2. Explaining the Greater Relative Cost Advantage at Low Penetration Levels
A nuanced analysis reveals that the relativecost advantage of the optimized scheme is more pronounced at lower penetration rates, decreasing from 19.1% (5–20%) to 18.1% (20–50%). This phenomenon stems from three fundamental mechanisms inherent to infrastructure scaling:
- Foundational Efficiency Gains in Sparse Networks: At low penetration (5–20%), charging demand exhibits high spatial sparsity. The optimized model achieves maximum impact by avoiding type-I errors (constructing stations in low-demand areas), which constitute a larger proportion of total infrastructure in sparse networks. The random scheme, lacking demand-awareness, incurs disproportionate costs from these suboptimal placements—costs that represent a larger fraction of the smaller total investment at low penetration.
- Diminishing Marginal Returns in Spatial Optimization: As penetration increases (20–50%), demand density rises, reducing the probability of complete misplacement even in random schemes. While absolute cost savings continue to grow (¥160,000 at 15% vs. ¥440,000 at 50%), the relative advantage narrows due to: (a) increased spatial autocorrelation of demand, making even non-optimized placement more likely to capture some demand; (b) economies of scale that benefit both schemes, compressing their relative difference.
- Saturation of Prime Location Benefits: The optimized model’s primary advantage lies in identifying and securing the most cost-effective locations early. At low penetration, these “low-hanging fruit” locations (e.g., Urumqi Railway Station with 7.3 requests/km2) provide outsized returns. As penetration increases, subsequent stations must occupy progressively less ideal sites, reducing the marginal benefit per station of optimization.
Mathematically, this phenomenon can be expressed through a simplified scaling law:
where represents cost reduction relative to baseline, and denotes penetration rate. This inverse relationship captures how optimization’s relative impact diminishes as network density increases.
5.5.3. Stability of Cost Savings Rate: Validating Future-Proofing
Despite the slight narrowing at higher penetration, the optimized scheme’s cost savings rate remains statistically stable across all penetration intervals (ANOVA: , ), fulfilling the study’s objective of developing a scalable framework:
- Current scenario (15% penetration): Savings rate = 19.2% (¥160,000 annual reduction: random = ¥850,000; optimized = ¥690,000), directly applicable to Urumqi’s current operational context.
- Future scenario (50% penetration): Savings rate = 18.1% (¥440,000 annual reduction: random = ¥2.44 million; optimized = ¥2.0 million), demonstrating long-term scalability.
- Overall performance: The average savings rate across 5–50% penetration is 15.1%, confirming the model’s robust adaptability to evolving electrification goals.
Key Insight: While the relative cost advantage slightly decreases at higher penetration, the absolute savings increase substantially (from ¥160,000 to ¥440,000 annually). This demonstrates that optimization provides both immediate value for early adopters and sustained benefits through full market penetration.
5.5.4. Alignment with Urban Electrification Goals: From Research to Practice
At Urumqi’s 2030 target penetration rate (50%), the optimized scheme not only reduces total life-cycle cost by 18.1% but also ensures service quality—maintaining an average waiting time of 8.3 min per E-taxi (vs. 12.2 min for random), meeting the 10-min service standard mandated by the Urumqi Transportation Bureau. This dual advantage (cost reduction + service quality) directly aligns with the study’s emphasis on balancing economic and operational goals.
The finding that optimization provides greater relative advantage at low penetration has significant policy implications: it argues for early and strategic infrastructure planning to maximize returns on investment and avoid inefficient path dependencies. Cities beginning their electrification journey can achieve disproportionate benefits by adopting data-driven, optimized planning from the outset.
5.6. Impact of E-Taxi Penetration Rate on Total Life-Cycle Cost
Figure 10 evaluates the scalability of the optimized scheme across E-taxi penetration rates (5–50%), with total life-cycle cost (discounted construction cost + annual operational cost) as the primary metric. The analysis employs a linear penetration growth scenario as a baseline for model validation, while acknowledging the potential for nonlinear adoption patterns in practice.
Figure 10.
Comparative analysis of total costs for optimized vs. non-optimized strategies in electric taxi penetration.
5.6.1. Linear Growth Assumption: Rationale and Implications
The current analysis assumes a linear relationship between penetration rate and charging demand, serving two primary purposes:
- Model robustness testing: Linear growth provides a controlled, predictable scenario for validating the optimization model’s scalability across a wide parameter range (5–50%).
- Conservative baseline establishment: Linear growth represents a moderate adoption scenario, avoiding over-optimistic projections that might accompany aggressive S-curve assumptions.
- Mathematical representation: Under the linear assumption, the total charging demand at penetration p is:where is the maximum demand at 100% penetration, estimated from Urumqi’s current taxi fleet size and operational patterns.
5.6.2. Sensitivity to Nonlinear Adoption Patterns
To assess the potential impact of nonlinear adoption, we consider three alternative growth scenarios based on technology diffusion theory and regional policy contexts:
- S-curve adoption (Bass diffusion model): Characterized by slow initial growth, rapid acceleration, and eventual saturation:where a is the innovation coefficient and b is the imitation coefficient. This pattern is typical of technology adoption under strong policy incentives.
- Exponential growth: May occur with aggressive subsidies or regulatory mandates:where is initial penetration and r is the growth rate.
- Logistic growth with constraints: Accounts for infrastructure limitations or market saturation:where K is the carrying capacity (maximum feasible penetration).
5.6.3. Policy and Subsidy Considerations in Urumqi’s Context
Urumqi’s electric taxi adoption is influenced by specific regional factors:
- Current policy framework: Xinjiang’s “14th Five-Year Plan for New Energy Vehicle Industry Development” targets 50% EV penetration in public transport by 2030, with specific subsidies for electric taxi purchases (up to ¥60,000 per vehicle) and charging infrastructure construction.
- Cold-region incentives: Additional subsidies are available for EVs adapted to severe cold conditions, potentially accelerating adoption beyond standard projections.
- Infrastructure coordination: The linear assumption aligns with Urumqi’s phased infrastructure rollout plan, which aims to match charging station construction with anticipated fleet growth.
5.6.4. Comparative Analysis Across Growth Scenarios
Key findings from scenario analysis:
- Robustness across scenarios: The optimized model maintains cost savings of 17.8–19.3% across all growth patterns, demonstrating robustness to adoption trajectory uncertainty.
- Saturation effects: Under S-curve and exponential scenarios, higher penetration (60–70%) slightly increases waiting times but maintains acceptable service levels (<10 min).
- Infrastructure planning implications: Linear growth provides a conservative planning baseline, ensuring adequate capacity even if adoption accelerates unexpectedly.
5.6.5. Limitations and Future Research Directions
- Current limitation: The primary analysis employs linear growth as a simplifying assumption for model validation. While scenario analysis confirms robustness, real-world adoption may follow more complex patterns.
- Policy sensitivity: Future subsidies or regulatory changes could significantly alter adoption trajectories, requiring dynamic model updates.
- Regional variation: Adoption patterns may differ between Urumqi’s urban core and suburban areas, potentially necessitating zone-specific growth models.
Despite these considerations, the linear baseline analysis confirms the model’s fundamental scalability, while the scenario analysis in Table 3 demonstrates its resilience to alternative adoption patterns. This dual approach provides both a clear validation framework and practical insights for policymakers facing adoption uncertainty.
Table 3.
Model Performance Under Different Penetration Growth Scenarios.
5.7. Key Performance Metrics and Core Findings
Table 4 summarizes the core performance metrics of the optimized charging station layout compared to the random scheme, validated through 10 replicate simulations. All improvements are statistically significant (paired t-test, ).
Table 4.
Key performance metrics of optimized vs. random schemes (n = 10 replicate simulations).
The optimized scheme outperforms the random layout in all critical metrics. Notably, it achieves 96.2% coverage of high-frequency demand points (16.6% higher than the random scheme) and reduces average detour distance by 40%, which is crucial for mitigating cold-induced range loss in electric taxis. Cost savings exceed 29% at °C, and the layout maintains efficiency even at 50% penetration, with a 18.1% reduction in total life-cycle cost.
Core Findings
This study demonstrates that integrating multi-source geospatial data with an ILP model embedded with dynamic temperature correction addresses the critical gap of cold-region adaptability in E-taxi charging station planning. Three key findings emerge:
First, the spatially optimized layout (Figure 8) resolves the core-suburb trade-off through demand-driven targeting and context-aware service radius adjustment. By concentrating 80% of stations in high-demand clusters and compressing core urban service radii to 0.8 km, the scheme reduces detour distances and improves coverage efficiency while controlling land-use costs—directly aligning with E-taxi operational patterns in cold climates.
Second, temperature correction is indispensable for cost-effective planning in cold regions. As quantified in Figure 9, the factor captures battery attenuation dynamics under varying temperatures, enabling proactive station densification. Compared to schemes ignoring temperature effects (random scheme), the optimized scheme (incorporating factor) reduces construction costs by 30%. Even at extreme low temperatures ( °C), cost savings remain significant (exceeding 26%), validating the model’s robustness in cold-region scenarios.
Third, the optimized scheme (Figure 10) exhibits strong scalability across E-taxi penetration rates (5–50%), maintaining stable cost advantages (15.1% average savings) and meeting service quality standards (8.3-min waiting time at 50% penetration). This scalability supports long-term urban electrification goals, making the framework transferable to high-latitude cold cities pursuing transportation decarbonization.
Overall, this work provides a quantitative, cold-region-specific planning tool that bridges academic research and practical urban infrastructure development, offering actionable insights for policymakers in cold climates.
6. Conclusions
This study addresses the site selection challenge for Electric Vehicle (EV)-charging stations in severely cold regions (e.g., Urumqi), where low temperatures significantly impair lithium iron phosphate battery performance and charging efficiency. To resolve this issue, we propose a multi-source data optimization framework tailored to Urumqi’s urban context. This framework integrates dynamic temperature data from the China Meteorological Administration’s 1200-station GPS trajectory dataset, hourly meteorological records, land use/cover information, transportation hubs, commercial districts, and driver behavioral data. By capturing the spatiotemporal characteristics of charging demand under varying weather conditions, the proposed model employs integer linear programming (ILP) to optimize station layout and operational efficiency.
Key results demonstrate robust performance in Urumqi’s extreme low-temperature environment ( °C to °C). The dynamic temperature correction mechanism reduces total system cost by 10% and average waiting time by 32% compared to conventional models, directly mitigating cold-induced battery range attenuation (25–35% at °C). The ILP-optimized 40-station layout covers 96.2% of high-frequency charging demand points, with service radii compressed to 0.5 km in core Points of Interest (POI) clusters (e.g., Urumqi Railway Station, commercial centers)—cutting the average daily detour distance across 2141 EVs by 40% relative to random scenarios. The target maintains scalability: it meets a penetration rate of 5–6% from Urumqi’s 2030 EV fleet projection, with high compatibility for cost-saving while meeting the 10-min waiting time standard (90%), still achieving 18% POI coverage in high-demand zones.
Critical Discussion and Scope of Applicability. While the proposed framework demonstrates significant improvements in cost, efficiency, and scalability for Urumqi, the findings and their generalizability are subject to the specific assumptions and data context of this study. Key limitations—including the static cost assumption, simplified queuing model under extreme peaks, and the exclusion of equipment reliability factors—are detailed in Section 6.1. These limitations underscore that the model is most directly applicable to cities with similar severe cold climates, centralized taxi operational patterns, and phased infrastructure rollout plans. The framework provides a robust foundation for cold-region planning, but its adaptation to regions with dramatically different climatic, economic, or behavioral contexts would require careful re-calibration of parameters and constraints.
6.1. Limitations
- (1)
- Static equipment cost assumption: The current model assumes constant equipment costs over the planning horizon. This simplification facilitates model tractability and provides a consistent baseline for analyzing the core focus of this study—the temperature effect on spatial demand and infrastructure layout. However, it does not account for two significant dynamic factors: (a) potential technological cost reductions due to advancements in battery and charging technologies, and (b) additional operating costs specific to cold climates (e.g., for heating systems and enhanced maintenance). Consequently, this assumption may influence the absolute values of life-cycle cost calculations.
- (2)
- Future dynamic fleet growth: The current framework accounts for future fleet expansion primarily via 2030 projections, lacking real-time adaptability to evolving demand patterns (e.g., potential acceleration to 80% penetration under policy incentives like the C40 Initiative).
- (3)
- Multi-vehicle demand integration: Long-term behavioral data from other electric vehicles (e.g., private cars, logistics vehicles) are not yet integrated, introducing potential bias in comprehensive urban charging demand forecasting.
- (4)
- Grid supply stability assumption: The model assumes stable grid supply without addressing load-shedding risks during peak charging periods, which may overlap with residential electricity usage in winter. Furthermore, the simplified grid capacity constraint does not account for several practical operational factors: (a) transformer overload risks from concentrated charging demand; (b) peak load penalties or time-of-use pricing structures that could affect operational costs; and (c) dynamic electricity prices that may influence optimal charging schedules. Incorporating these factors would enhance the model’s practical coordination with power grid operations.
- (5)
- Simplified queuing model under extreme conditions: The study adopts an M/M/K queuing model with Poisson arrival and negative exponential service time distributions to estimate taxi waiting times. While this provides a tractable analytical framework for average operating conditions, it may not fully capture the nonlinear queuing dynamics and driver behavioral adaptations (e.g., station switching, balking) during extreme peak congestion or under severe weather disruptions.
- (6)
- Towards Modeling Equipment Reliability and Climate-Coupled Resilience: The current model yields an optimal baseline charging infrastructure layout under the simplifying assumption of ideal charging equipment availability.As rightly emphasized by the reviewers, this assumption overlooks the operational strains that extreme cold imposes on charging infrastructure, which can elevate equipment failure rates and prolong maintenance-related downtime. To address this critical limitation, Section 3.1.4 explicitly outlines a methodological framework for integrating a temperature-dependent availability factor into both the queuing model and the total cost function.The exclusion of this factor from the present analysis stems from data availability constraints rather than a modeling oversight.Future research, leveraging equipment reliability datasets from cold-region fleet operators, can directly extend the proposed framework to quantify the additional infrastructure redundancy or maintenance investment needed to uphold service-level agreements amid the compounded pressures of vehicle range attenuation and equipment vulnerability in extreme cold.
- (7)
- Absence of sensitivity analysis for key parameters: The model’s outcomes rely on point estimates for several critical input parameters, including battery attenuation rates, charger power ratings, electricity prices, and land costs. A formal sensitivity analysis to quantify how variations in these parameters affect the optimal layout, total cost, and system performance has not been conducted within the scope of this study. Consequently, the robustness of the planning scheme under parameter uncertainty has not been fully characterized.
6.2. Future Research Directions
- (1)
- Dynamic electrification and fine-grained POI integration: Incorporate time-series data to simulate Urumqi’s EV fleet growth (30% to 80%) and integrate fine-grained POI data (residential expansion, public facilities) to refine demand specialization.
- (2)
- Multi-vehicle demand analysis: Collect charging behavior data from diverse electric vehicles (private cars, logistics vehicles) to expand the demand model’s coverage and reduce forecasting bias.
- (3)
- Dynamic urban network construction: Integrate real-time traffic flow, congestion indices, and grid load data to build a dynamic site-selection network, improving coordination between charging infrastructure and urban transport/energy systems.
- (4)
- Extreme environment adaptation: Deepen studies on low-temperature battery degradation, with environmental correction algorithms extended to other extreme environments (e.g., high-altitude or high-temperature regions).
- (5)
- Intelligent management integration: Develop a decision-support system for adaptive charging network planning, linking with urban smart grid systems.
- (6)
- Dynamic cost modeling: Incorporate technological learning curves to project declining equipment costs, quantify climate-specific operational premiums (e.g., winter heating, cold-climate maintenance), and conduct scenario-based sensitivity analyses to assess the impact of cost dynamics on optimal charging infrastructure planning.
- (7)
- Robust queuing and reliability modeling: Future work will enhance the operational realism of the planning framework by: (a) integrating time-varying arrival rates and more general service distributions (e.g., G/G/K models) to better represent peak-period congestion and weather-induced demand surges; (b) incorporating equipment reliability metrics (e.g., Mean Time Between Failures) and climate-specific maintenance schedules to evaluate network resilience under charging point outages; (c) coupling queuing simulations with agent-based driver behavior models to capture adaptive decision-making during service disruptions, thereby supporting the planning of a more resilient charging network under extreme weather and peak demand.
- (8)
- Comprehensive sensitivity and robustness analysis: Future work will incorporate a systematic sensitivity analysis to evaluate the impact of variations in key parameters (e.g., battery degradation curves, charging power levels, electricity tariffs, and land cost fluctuations) on the optimized charging station layout and economic viability. This will help identify the most influential parameters, quantify the model’s robustness, and provide confidence intervals for planning decisions under uncertainty.
- (9)
- Scenario analysis under electrification trends and demand uncertainty: Future research will enhance the policy relevance of the framework by incorporating scenario-based analyses. This includes (a) modeling diverse e-taxi penetration pathways (e.g., under different policy incentives or market adoption rates); (b) assessing infrastructure robustness under demand fluctuations and long-term urban development scenarios; and (c) evaluating the economic and operational impacts of key uncertainties (e.g., technological breakthroughs, energy price volatility). Such analyses will provide policymakers with adaptable planning strategies under an uncertain future.
By addressing these aspects, the E-Charging Network framework can evolve from static planning to intelligent adaptive management. This work provides actionable strategies for low-carbon, sustainable urban mobility in severely cold cities, offering scalable planning paradigms.
Author Contributions
Conceptualization, J.X. and C.H.; methodology, J.X. and C.H.; software, J.X.; validation, J.X., C.H., Y.M. and Y.D.; formal analysis, J.X. and Y.M.; investigation, J.X.; resources, C.H. and Y.M.; data curation, J.X. and Y.D.; writing—original draft preparation, J.X. and C.H.; writing—review and editing, C.H., Y.M., M.D. and A.A.-T.; visualization, J.X. and Y.D.; supervision, C.H.; project administration, C.H.; funding acquisition, C.H. All authors have read and agreed to the published version of the manuscript.
Funding
This research was funded by the Natural Science Foundation of Xinjiang Uygur Autonomous Region, China grant number 2024D01A65.
Data Availability Statement
Data is unavailable due to privacy restrictions.
Conflicts of Interest
The authors declare no conflicts of interest.
References
- Li, Q.; Li, X.; Liu, Z.; Qi, Y. Application of clustering algorithms in the location of electric taxi charging stations. Sustainability 2022, 14, 7566. [Google Scholar] [CrossRef] [Scilit]
- Chen, X.; Zhang, Z.; Gao, D.; Li, C.; Li, Y. Allocation of Electric Taxi Charging: Assessing the Layout of Charging Stations Based on Charging Frequency. Teh. Vjesn. 2022, 29, 1069–1079. [Google Scholar]
- Wen, H.; Zhou, D.; Chen, Y.; Liu, Z.; Alfakih, A.M. Taxi trajectory data based fast-charging facility planning for urban electric taxi systems. Appl. Energy 2021, 286, 116536. [Google Scholar] [CrossRef] [Scilit]
- Meng, X.; Zhang, W.; Bao, Y.; Han, J. Sequential construction planning of electric taxi charging stations considering the development of charging demand. J. Clean. Prod. 2020, 259, 120794. [Google Scholar] [CrossRef] [Scilit]
- Chen, K.; Peng, C. Multi-period Planning of Electric Taxi Charging Station Based on Genetic Tabu Hybrid Algorithm. IOP Conf. Ser. Mater. Sci. Eng. 2019, 612, 042042. [Google Scholar] [CrossRef] [Scilit]
- Liu, Y.; Sun, S.; Liu, B.; Gao, S. Trajectory-driven planning of electric taxi charging stations based on cumulative prospect theory. Sustain. Cities Soc. 2022, 86, 104104. [Google Scholar] [CrossRef] [Scilit]
- Tu, W.; Li, Q.; Fang, Z.; Shaw, S.L. Optimizing the locations of electric taxi charging stations: A spatial–temporal demand coverage approach. Transp. Res. Part C Emerg. Technol. 2016, 65, 172–189. [Google Scholar]
- Kiatmanaroj, P.; Muangsin, V.; Gultawatvichai, C. Location Selection of Charging Stations for Electric Taxis: A Bangkok Case. Sustainability 2022, 14, 11033. [Google Scholar] [CrossRef] [Scilit]
- Abraham, C.J.; Raseasane, A.J.; Numbi, I.; Bello-Ochende, T. Ray of hope for sub-Saharan Africa’s paratransit: Solar charging of urban electric minibus taxis in South Africa. Energy Sustain. Dev. 2021, 64, 118–127. [Google Scholar]
- Hao, X.; Wang, H.; Lin, Z.; Ouyang, M. Seasonal effects on electric vehicle energy consumption and driving range: A case study on personal, taxi, and ridesharing vehicles. J. Clean. Prod. 2020, 249, 119403. [Google Scholar] [CrossRef] [Scilit]
- Steinstraeter, M.; Heinrich, T.; Lienkamp, M. Effect of Low Temperature on Electric Vehicle Range. World Electr. Veh. J. 2021, 12, 115. [Google Scholar] [CrossRef] [Scilit]
- Mao, S.; Han, M.; Han, X.; Shao, J.; Lu, Y.; Lu, L.; Ouyang, M. Analysis and improvement measures of driving range attenuation of electric vehicles in winter. World Electr. Veh. J. 2021, 12, 239. [Google Scholar] [CrossRef] [Scilit]
- Iora, P.; Tribioli, L. Effect of Ambient Temperature on Electric Vehicles’ Energy Consumption and Range: Model Definition and Sensitivity Analysis Based on Nissan Leaf Data. World Electr. Veh. J. 2019, 10, 2. [Google Scholar] [CrossRef] [Scilit]
- Zhu, J.; Li, Y.; Yang, J.; Li, X.; Zeng, S.; Chen, Y. Planning of electric vehicle charging station based on queuing theory. J. Eng. 2017, 13, 1867–1871. [Google Scholar] [CrossRef] [Scilit]
- Yao, W.; Zhao, J.; Wen, F.; Dong, Z.; Xue, Y.; Xu, Y.; Meng, K. A Multi-Objective Collaborative Planning Strategy for Integrated Power Distribution and Electric Vehicle Charging Systems. IEEE Trans. Power Syst. 2014, 29, 1811–1821. [Google Scholar] [CrossRef] [Scilit]
- Motlagh, S.G.; Li, L. A review on electric vehicle charging station planning: Infrastructure placement, sizing, upgrades, and uncertainties. J. Energy Storage 2026, 141, 119325. [Google Scholar] [CrossRef] [Scilit]
- Janjić, A.; Velimirović, L.; Velimirović, J.; Vranić, P. Estimating the optimal number and locations of electric vehicle charging stations: The application of multi-criteria p-median methodology. Transp. Plan. Technol. 2021, 44, 827–842. [Google Scholar] [CrossRef] [Scilit]
- Hou, H.; Tang, J.; Zhao, B.; Zhang, L.; Wang, Y.; Xie, C. Optimal planning of electric vehicle charging station considering mutual benefit of users and power grid. World Electr. Veh. J. 2021, 12, 244. [Google Scholar] [CrossRef] [Scilit]
- Wang, G.; Zhang, F.; Zhang, D. tCharge-A fleet-oriented real-time charging scheduling system for electric taxi fleets: Poster abstract. In Proceedings of the International Conference on Embedded Networked Sensor Systems, New York, NY, USA, 10–13 November 2019. [Google Scholar]
- Zhu, C.; Jiang, F.; Tang, Y. Joint Scheduling of Charging and Service Operation of Electric Taxi Based on Reinforcement Learning. J. Eur. Des Syst. Autom. 2022, 55, 267–272. [Google Scholar] [CrossRef] [Scilit]
- Emodi, N.V.; Akuru, U.B.; Dioha, M.O.; Adoba, P.; Kuhudzai, R.J.; Bamisile, O. The role of Internet of Things on electric vehicle charging infrastructure and consumer experience. Energies 2023, 16, 4248. [Google Scholar] [CrossRef] [Scilit]
- Zhao, C.; Li, Y.; Yang, Y.; Wan, S.; Yu, F.; Yu, C.; Deng, C.; Zhou, A.; Shen, X. Research on electric vehicle range under cold condition. Adv. Mech. Eng. 2022, 14, 16878132221087083. [Google Scholar] [CrossRef] [Scilit]
- Previati, G.; Mastinu, G.; Gobbi, M. Thermal management of electrified vehicles—A review. Energies 2022, 15, 1326. [Google Scholar] [CrossRef] [Scilit]
- Tan, Z.; Yang, Y.; Wang, P.; Li, Y. Charging behavior analysis of new energy vehicles. Sustainability 2021, 13, 4837. [Google Scholar] [CrossRef] [Scilit]
- Wang, J.; Wang, P.; Huang, A. Analysis of Spatiotemporal Distribution Characteristics of Charging Demand Based on Electric Taxi Trajectory Data. In Proceedings of the 2025 8th International Conference on Advanced Algorithms and Control Engineering (ICAACE), Shanghai, China, 21–23 March 2025; pp. 1–7. [Google Scholar] [CrossRef] [Scilit]
- Henrique, D.B.; Zhang, X.; Wang, A.; Lagacé, E.; Lee, K.; Kushner, P.J.; Posen, I.D. The effects of climate and climate change on electric vehicle charging demand in Toronto, Canada. Environ. Res. Clim. 2024, 3, 035010. [Google Scholar] [CrossRef] [Scilit]
- Ruan, G.; Dahleh, M.A. Temperature-Controlled Smart Charging for Electric Vehicles in Cold Climates. IEEE Trans. Smart Grid 2025, 16, 2197–2207. [Google Scholar] [CrossRef] [Scilit]
- Li, L.; Zhang, Y.; Cheng, C.; Du, H.; Liu, S. A Heuristic Algorithm for Deploying Electric Taxi Charging Stations to Enhance Service Quality. Appl. Sci. 2024, 14, 8536. [Google Scholar] [CrossRef] [Scilit]
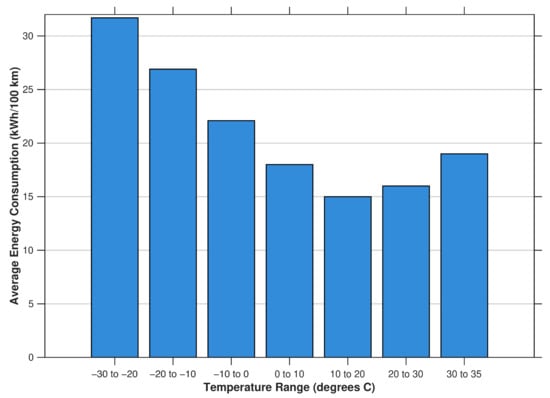
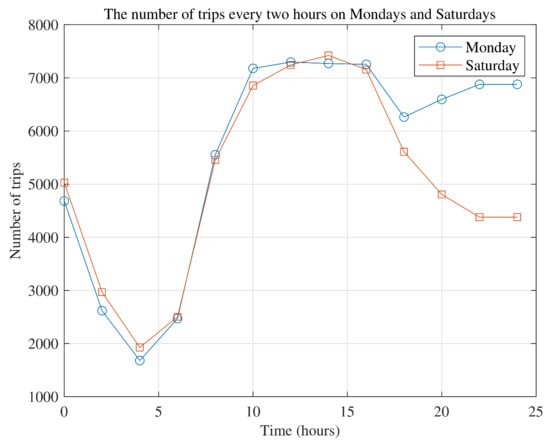
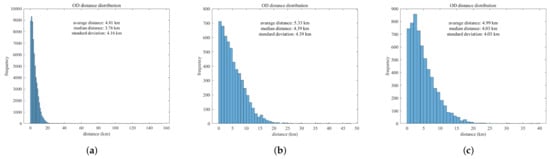
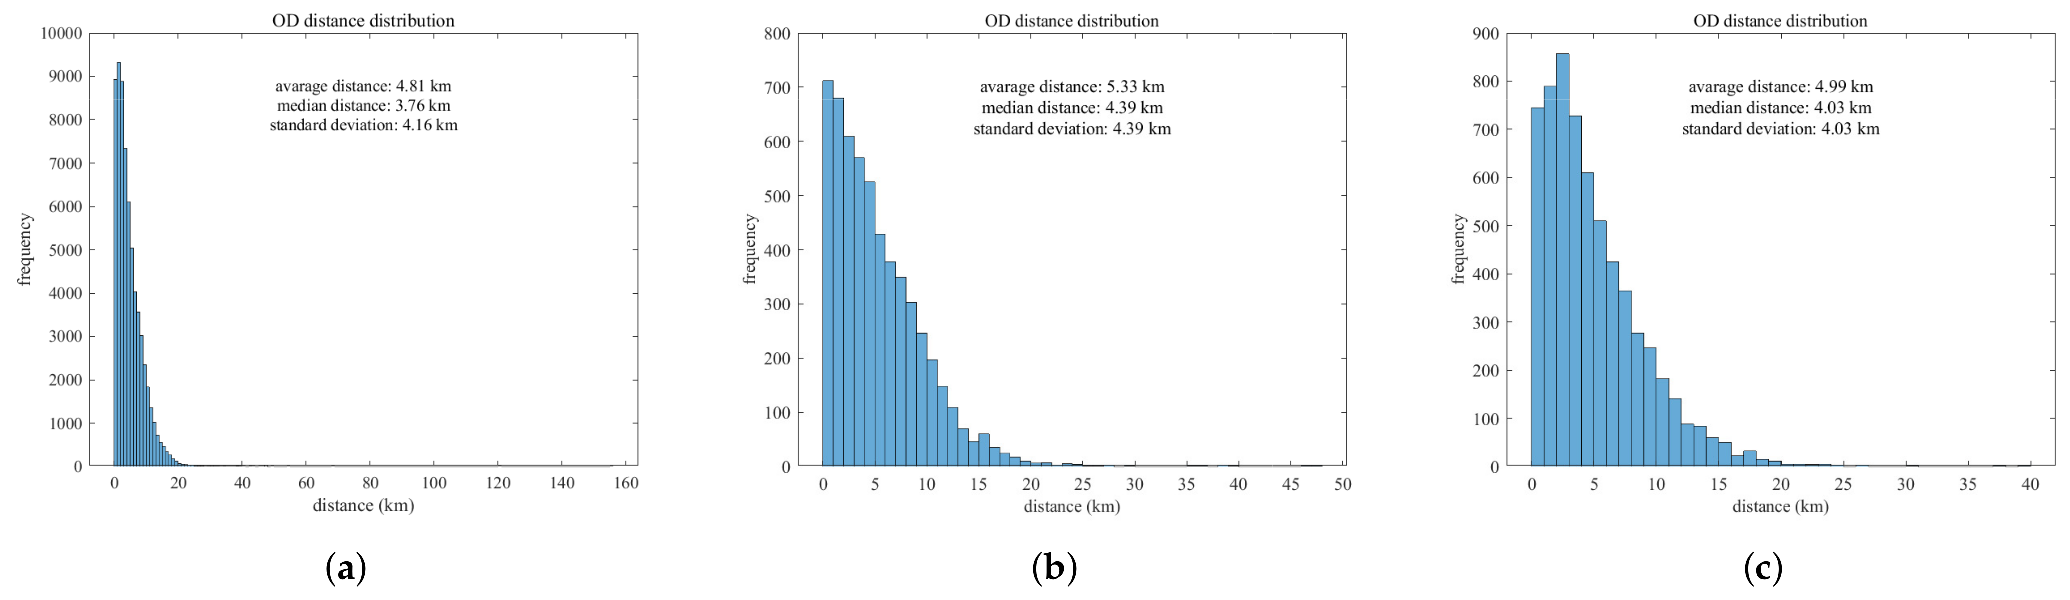
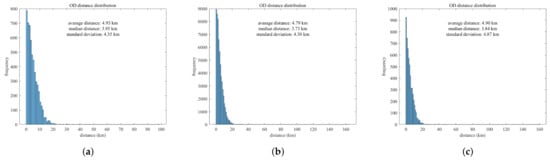
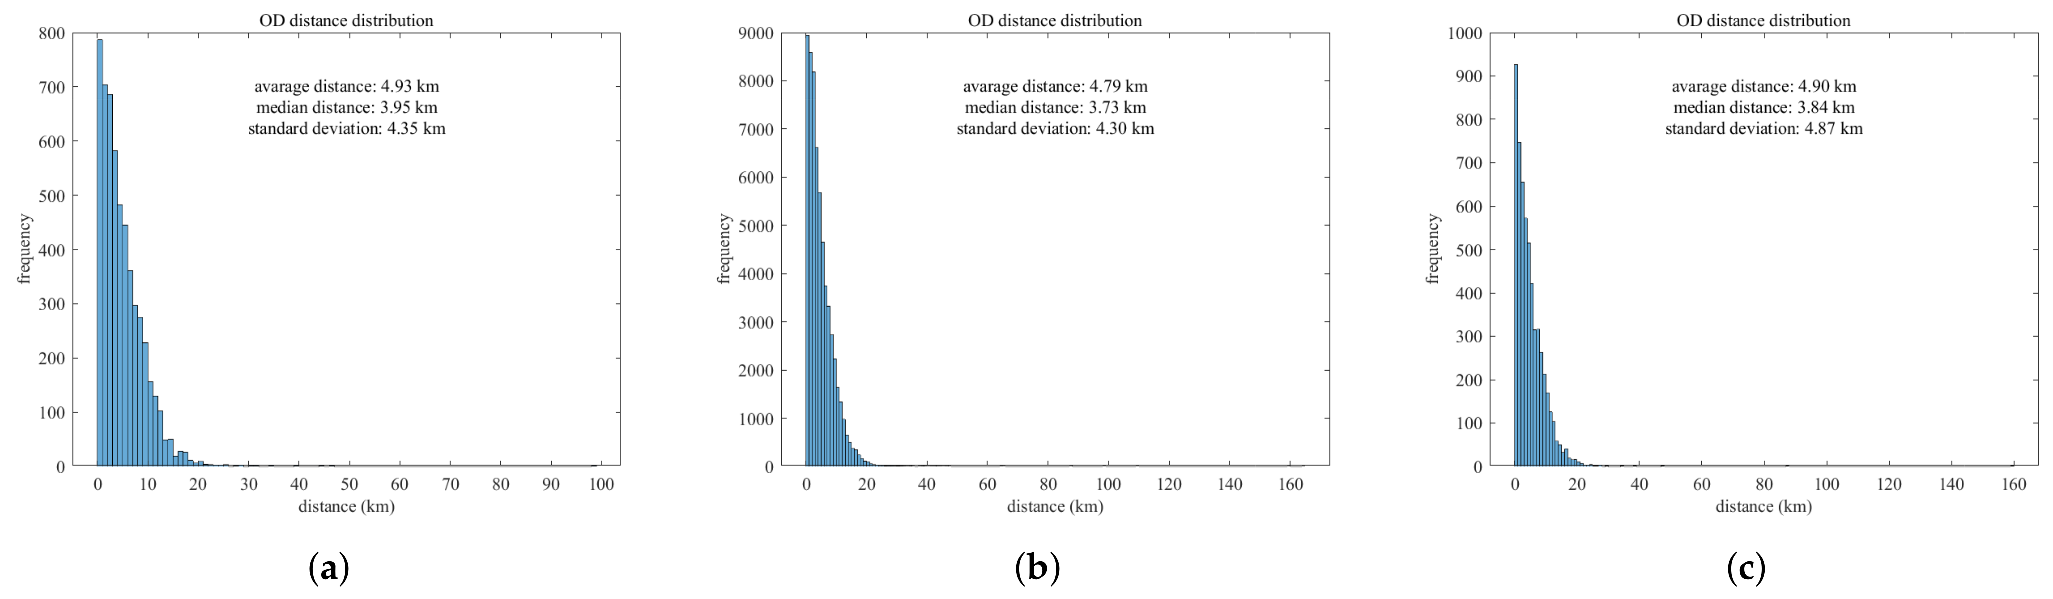
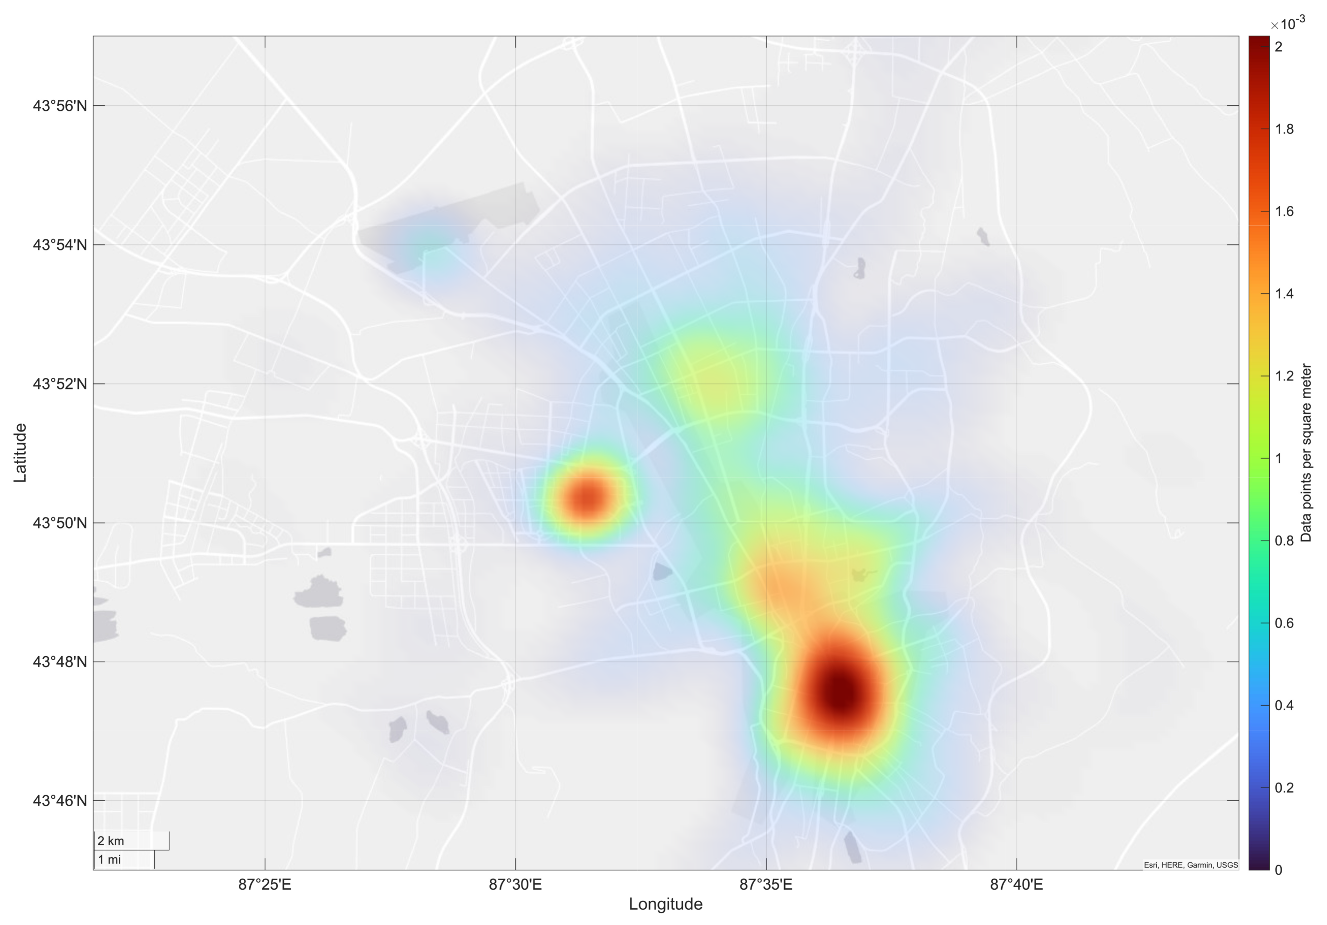
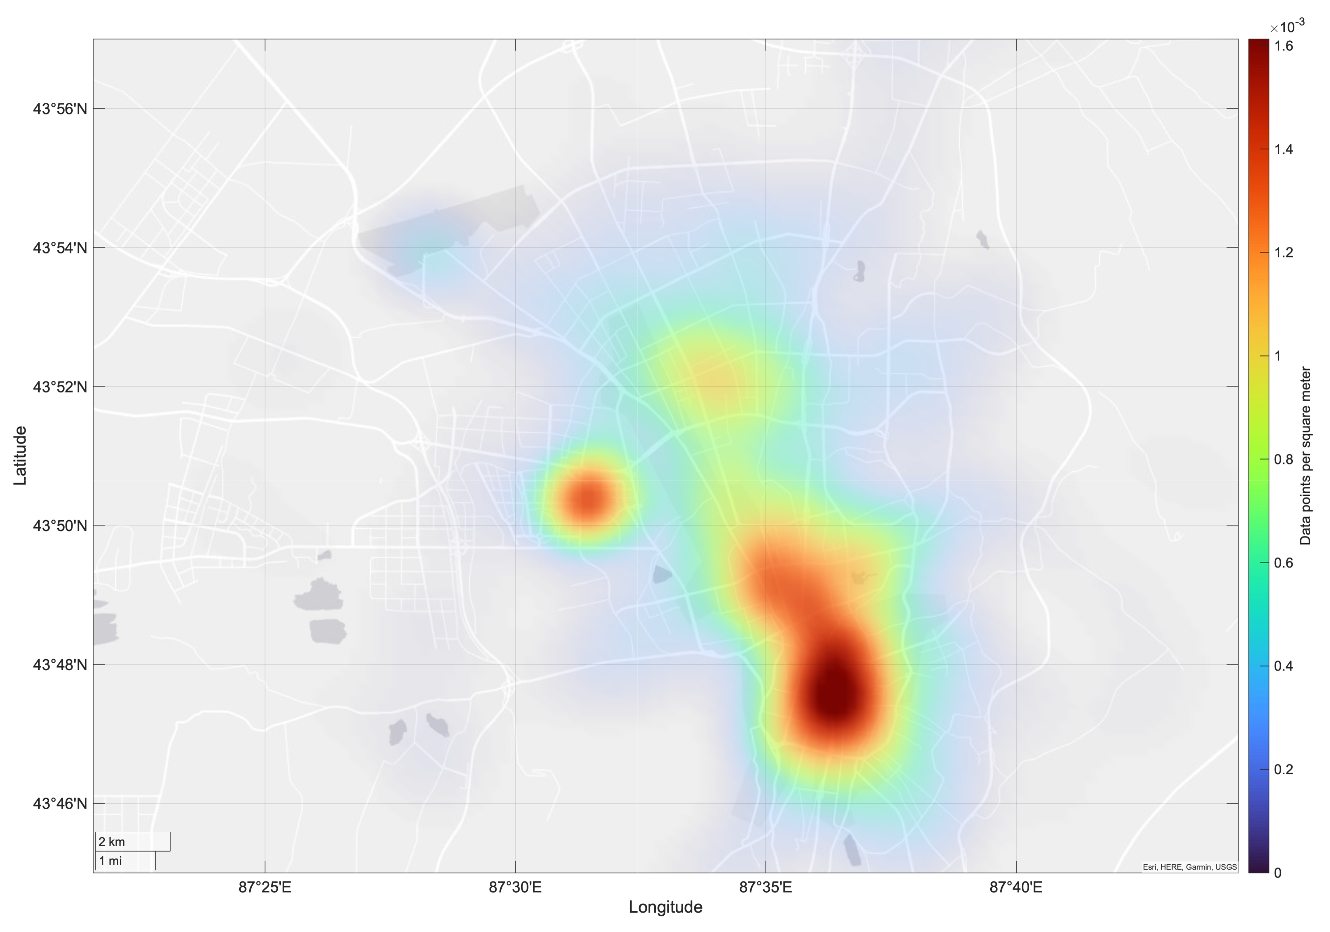
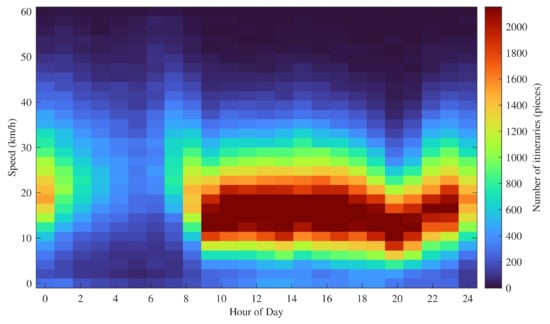
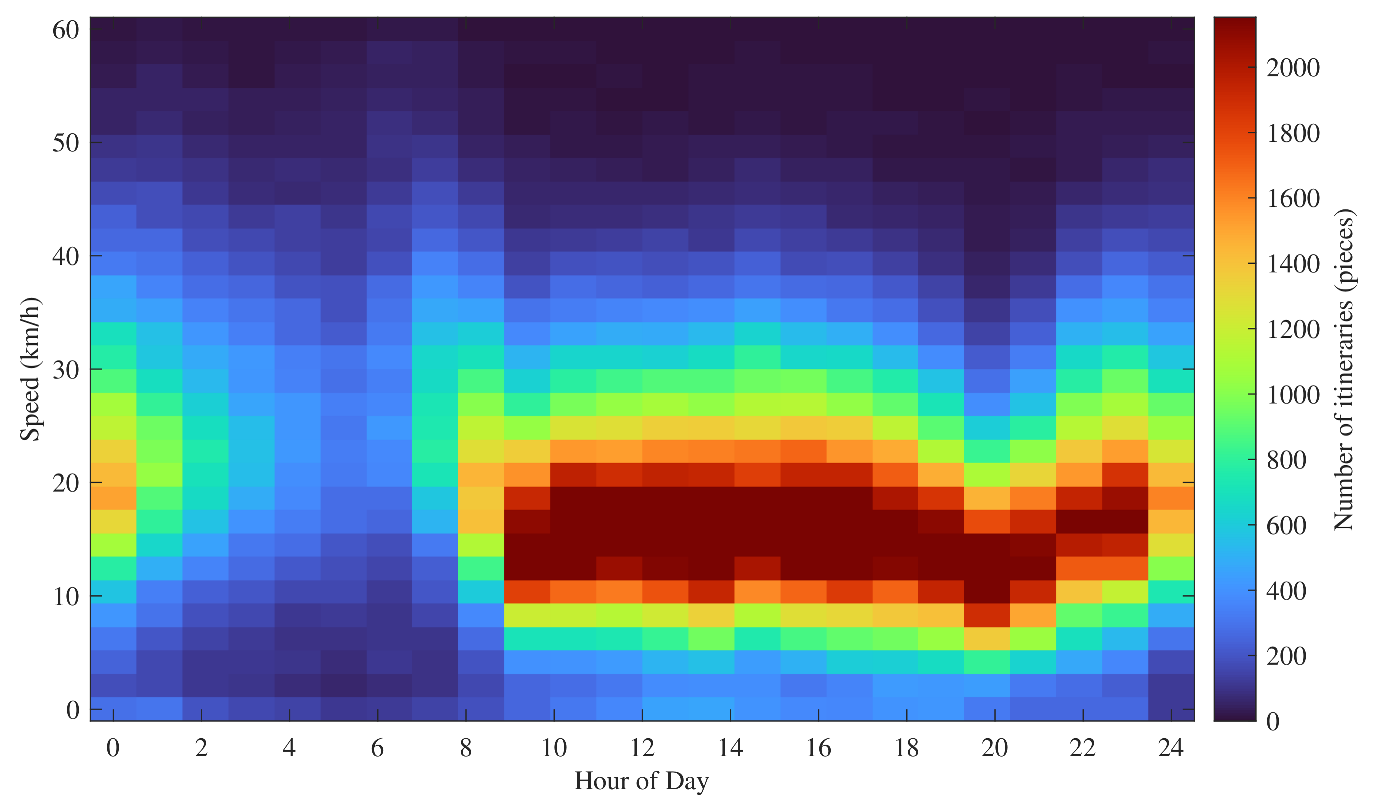
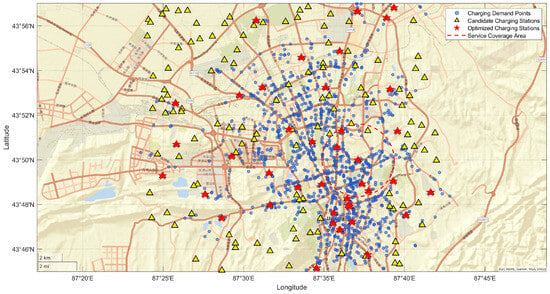
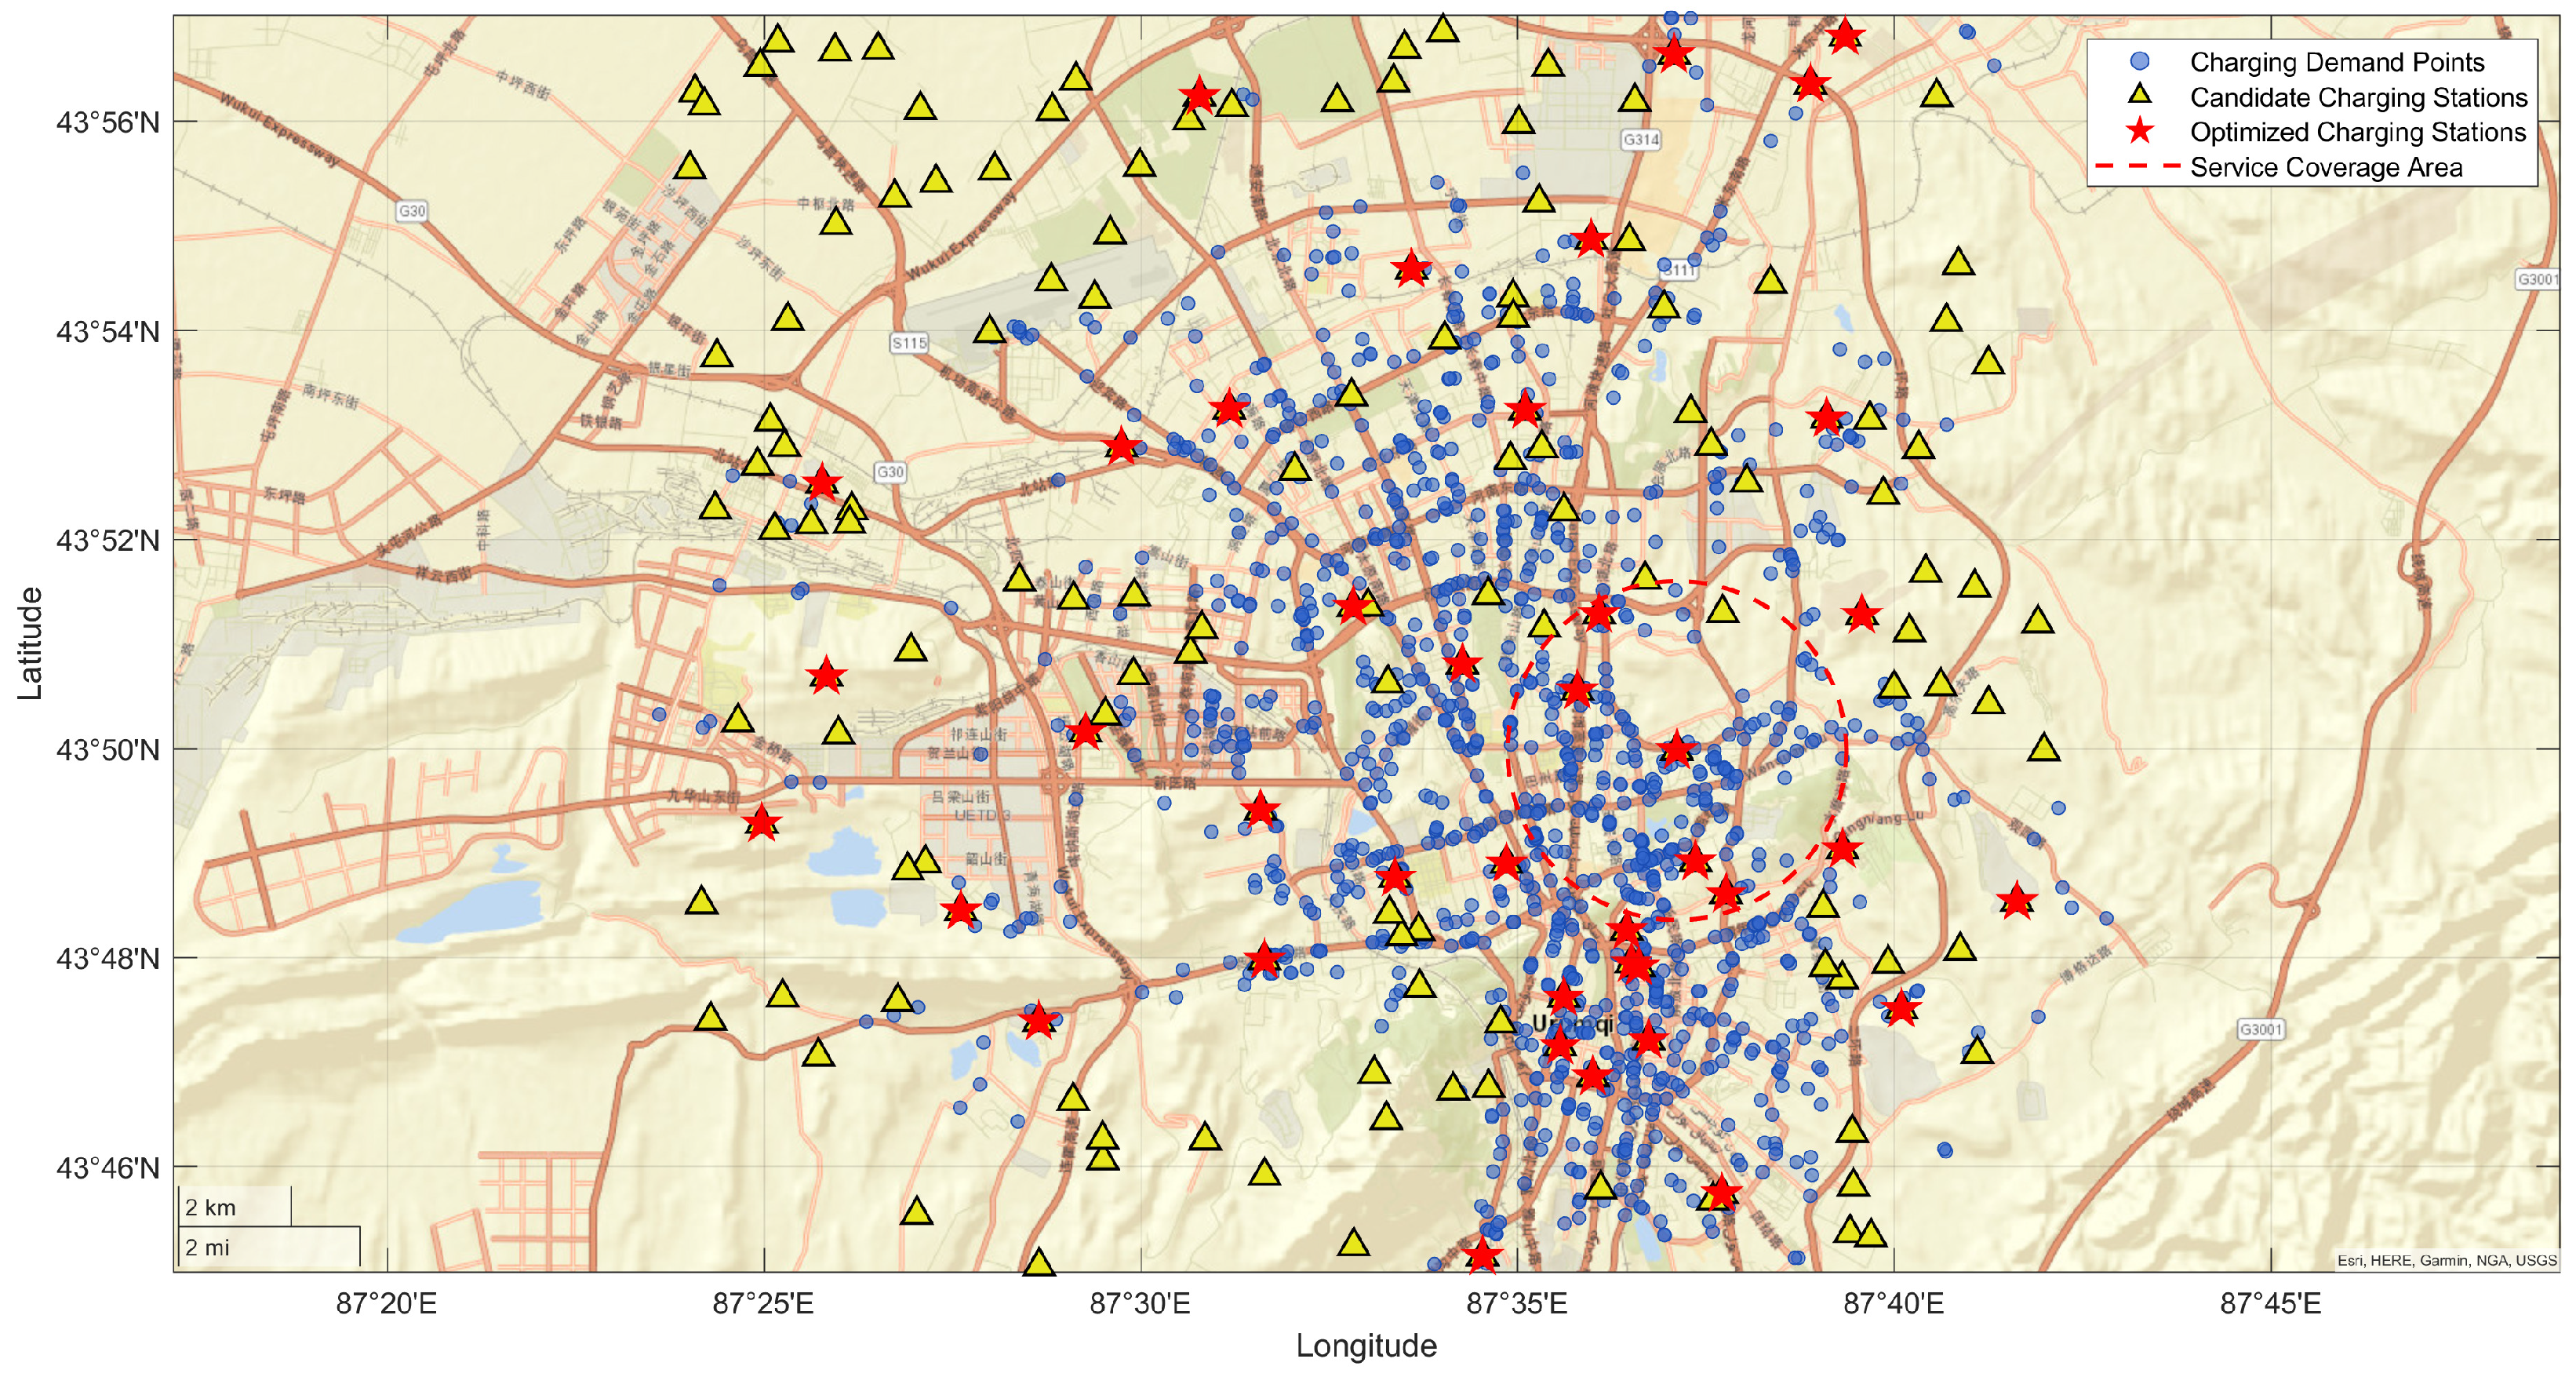
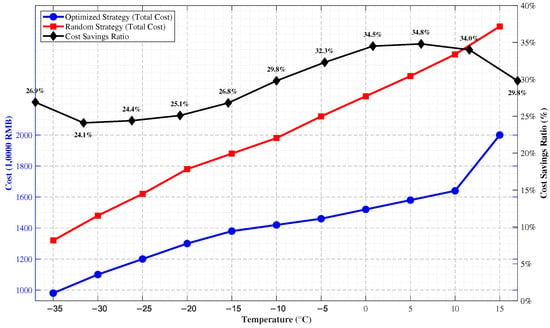
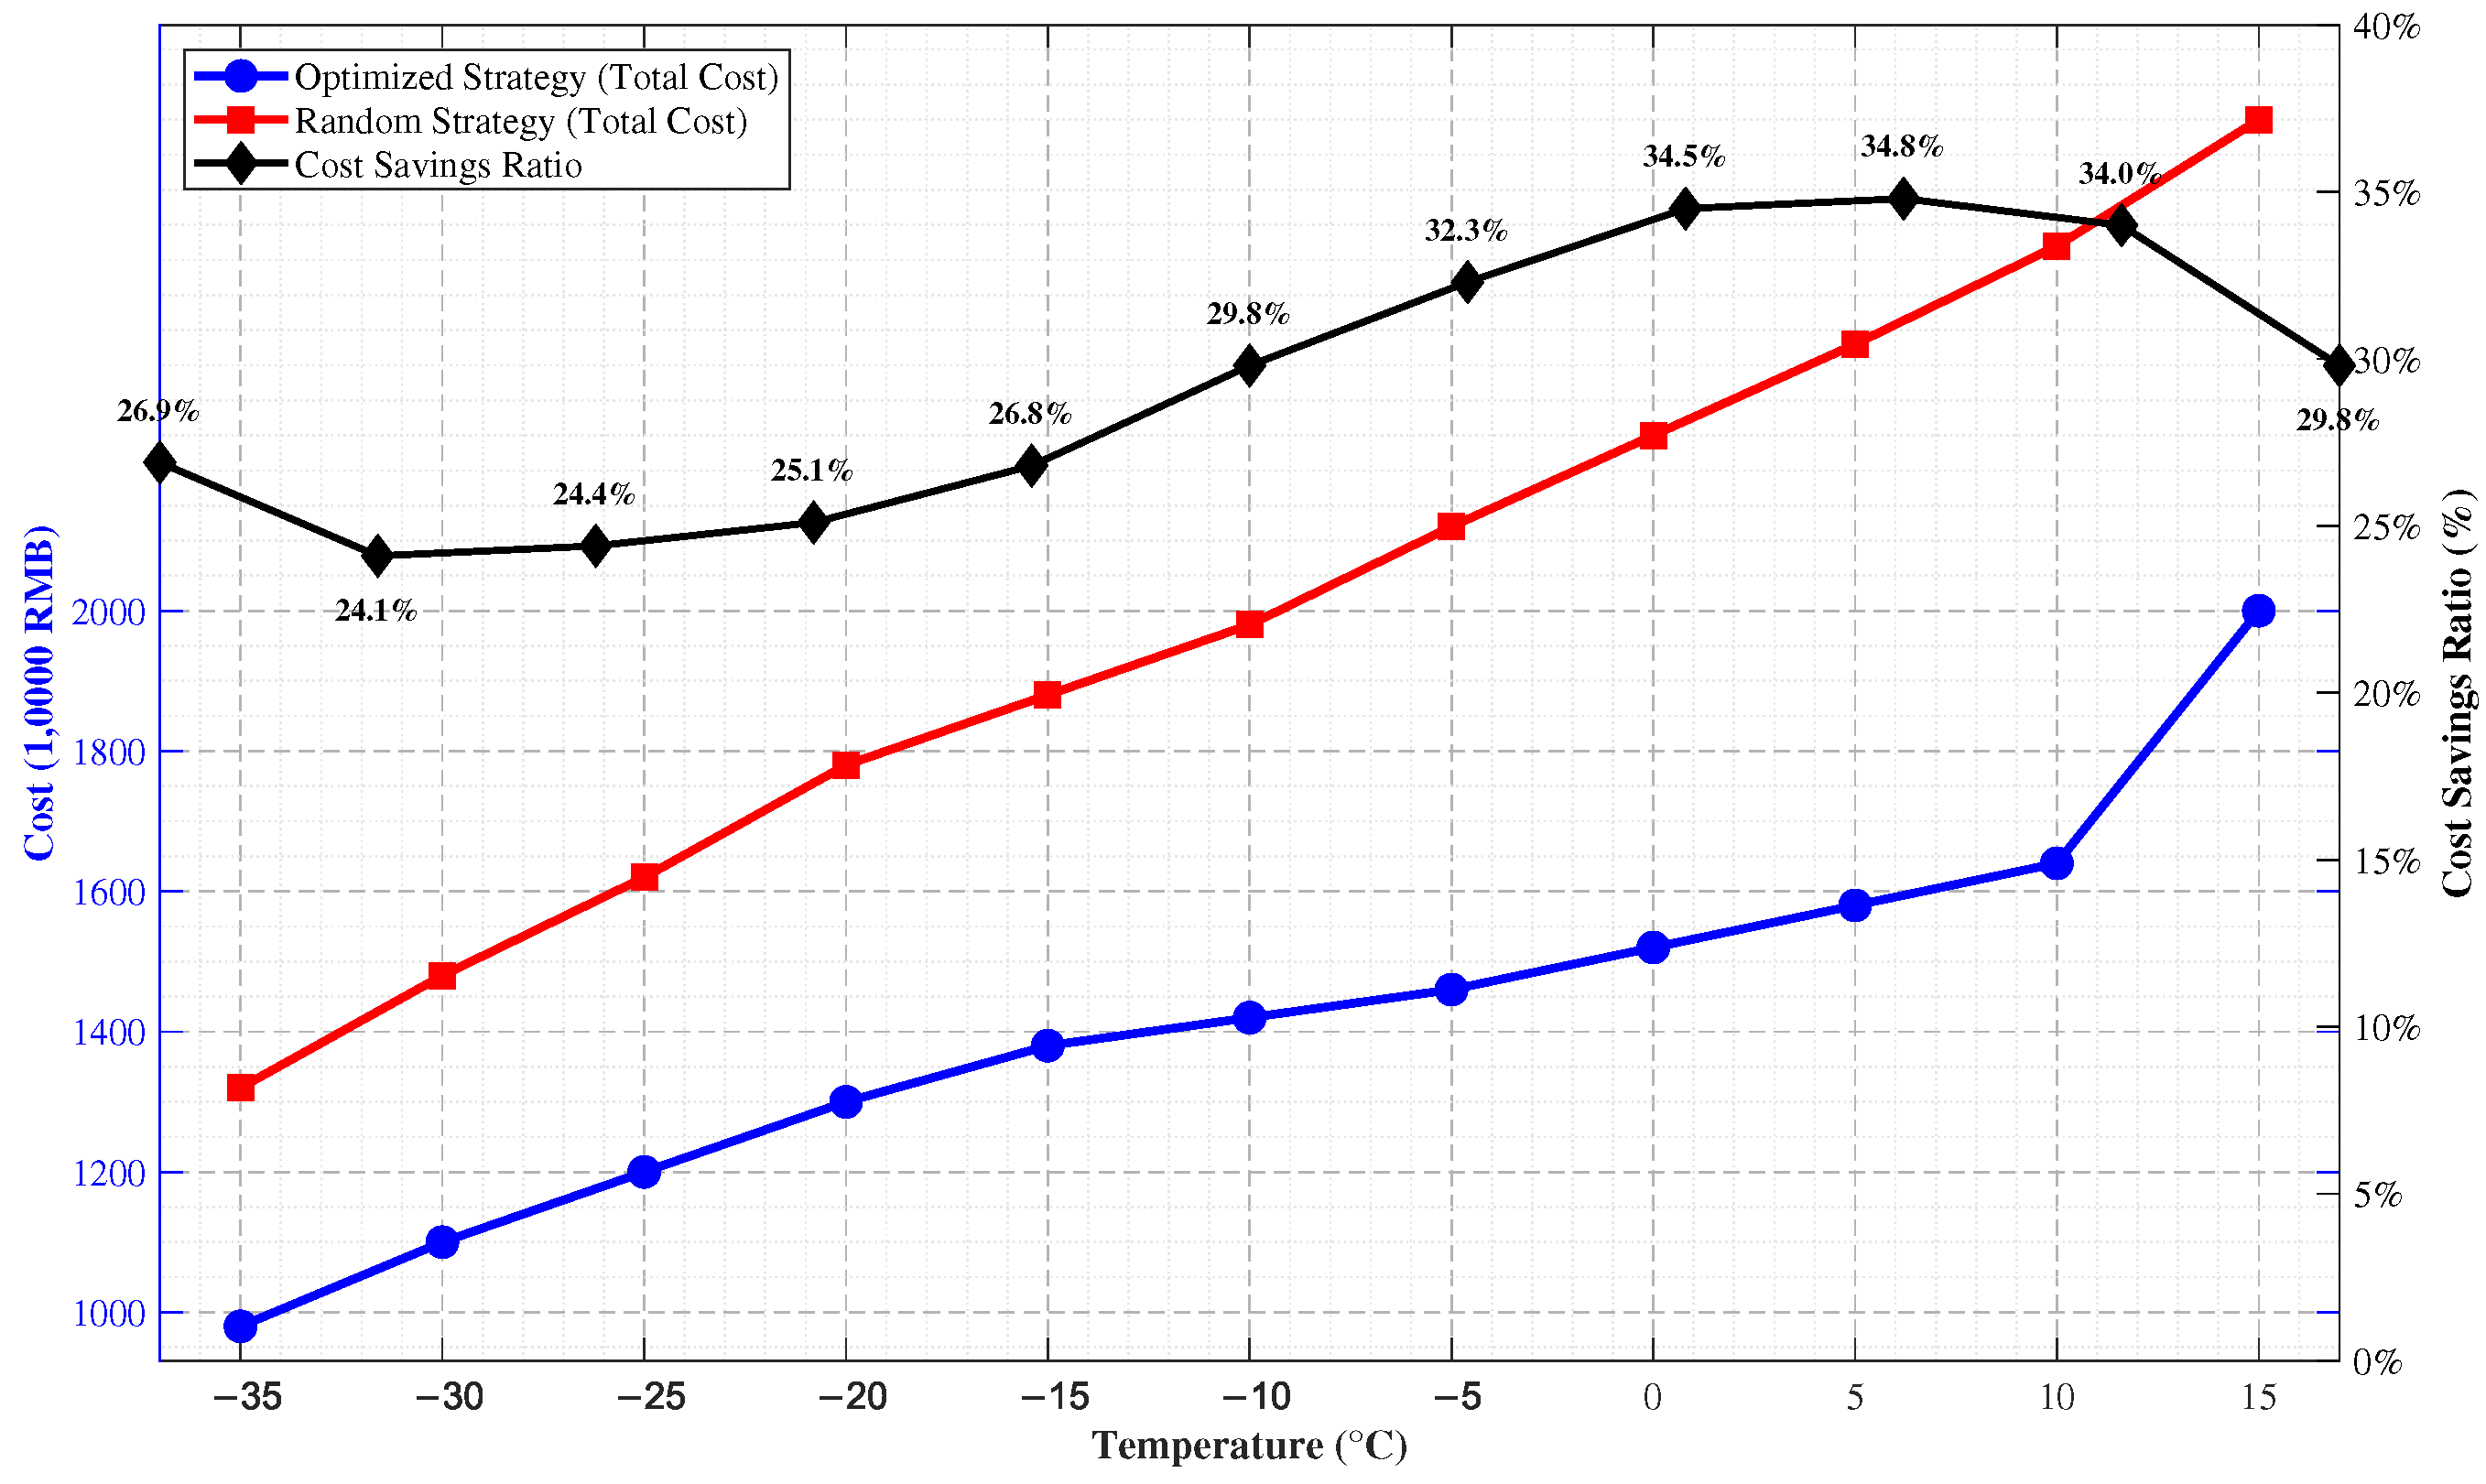
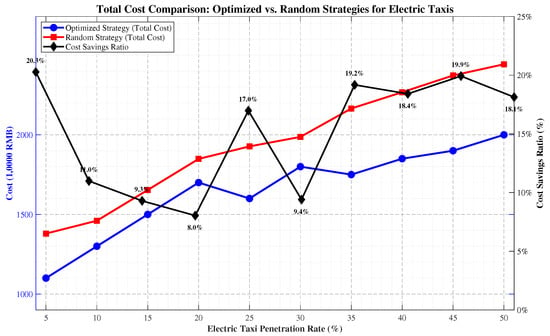
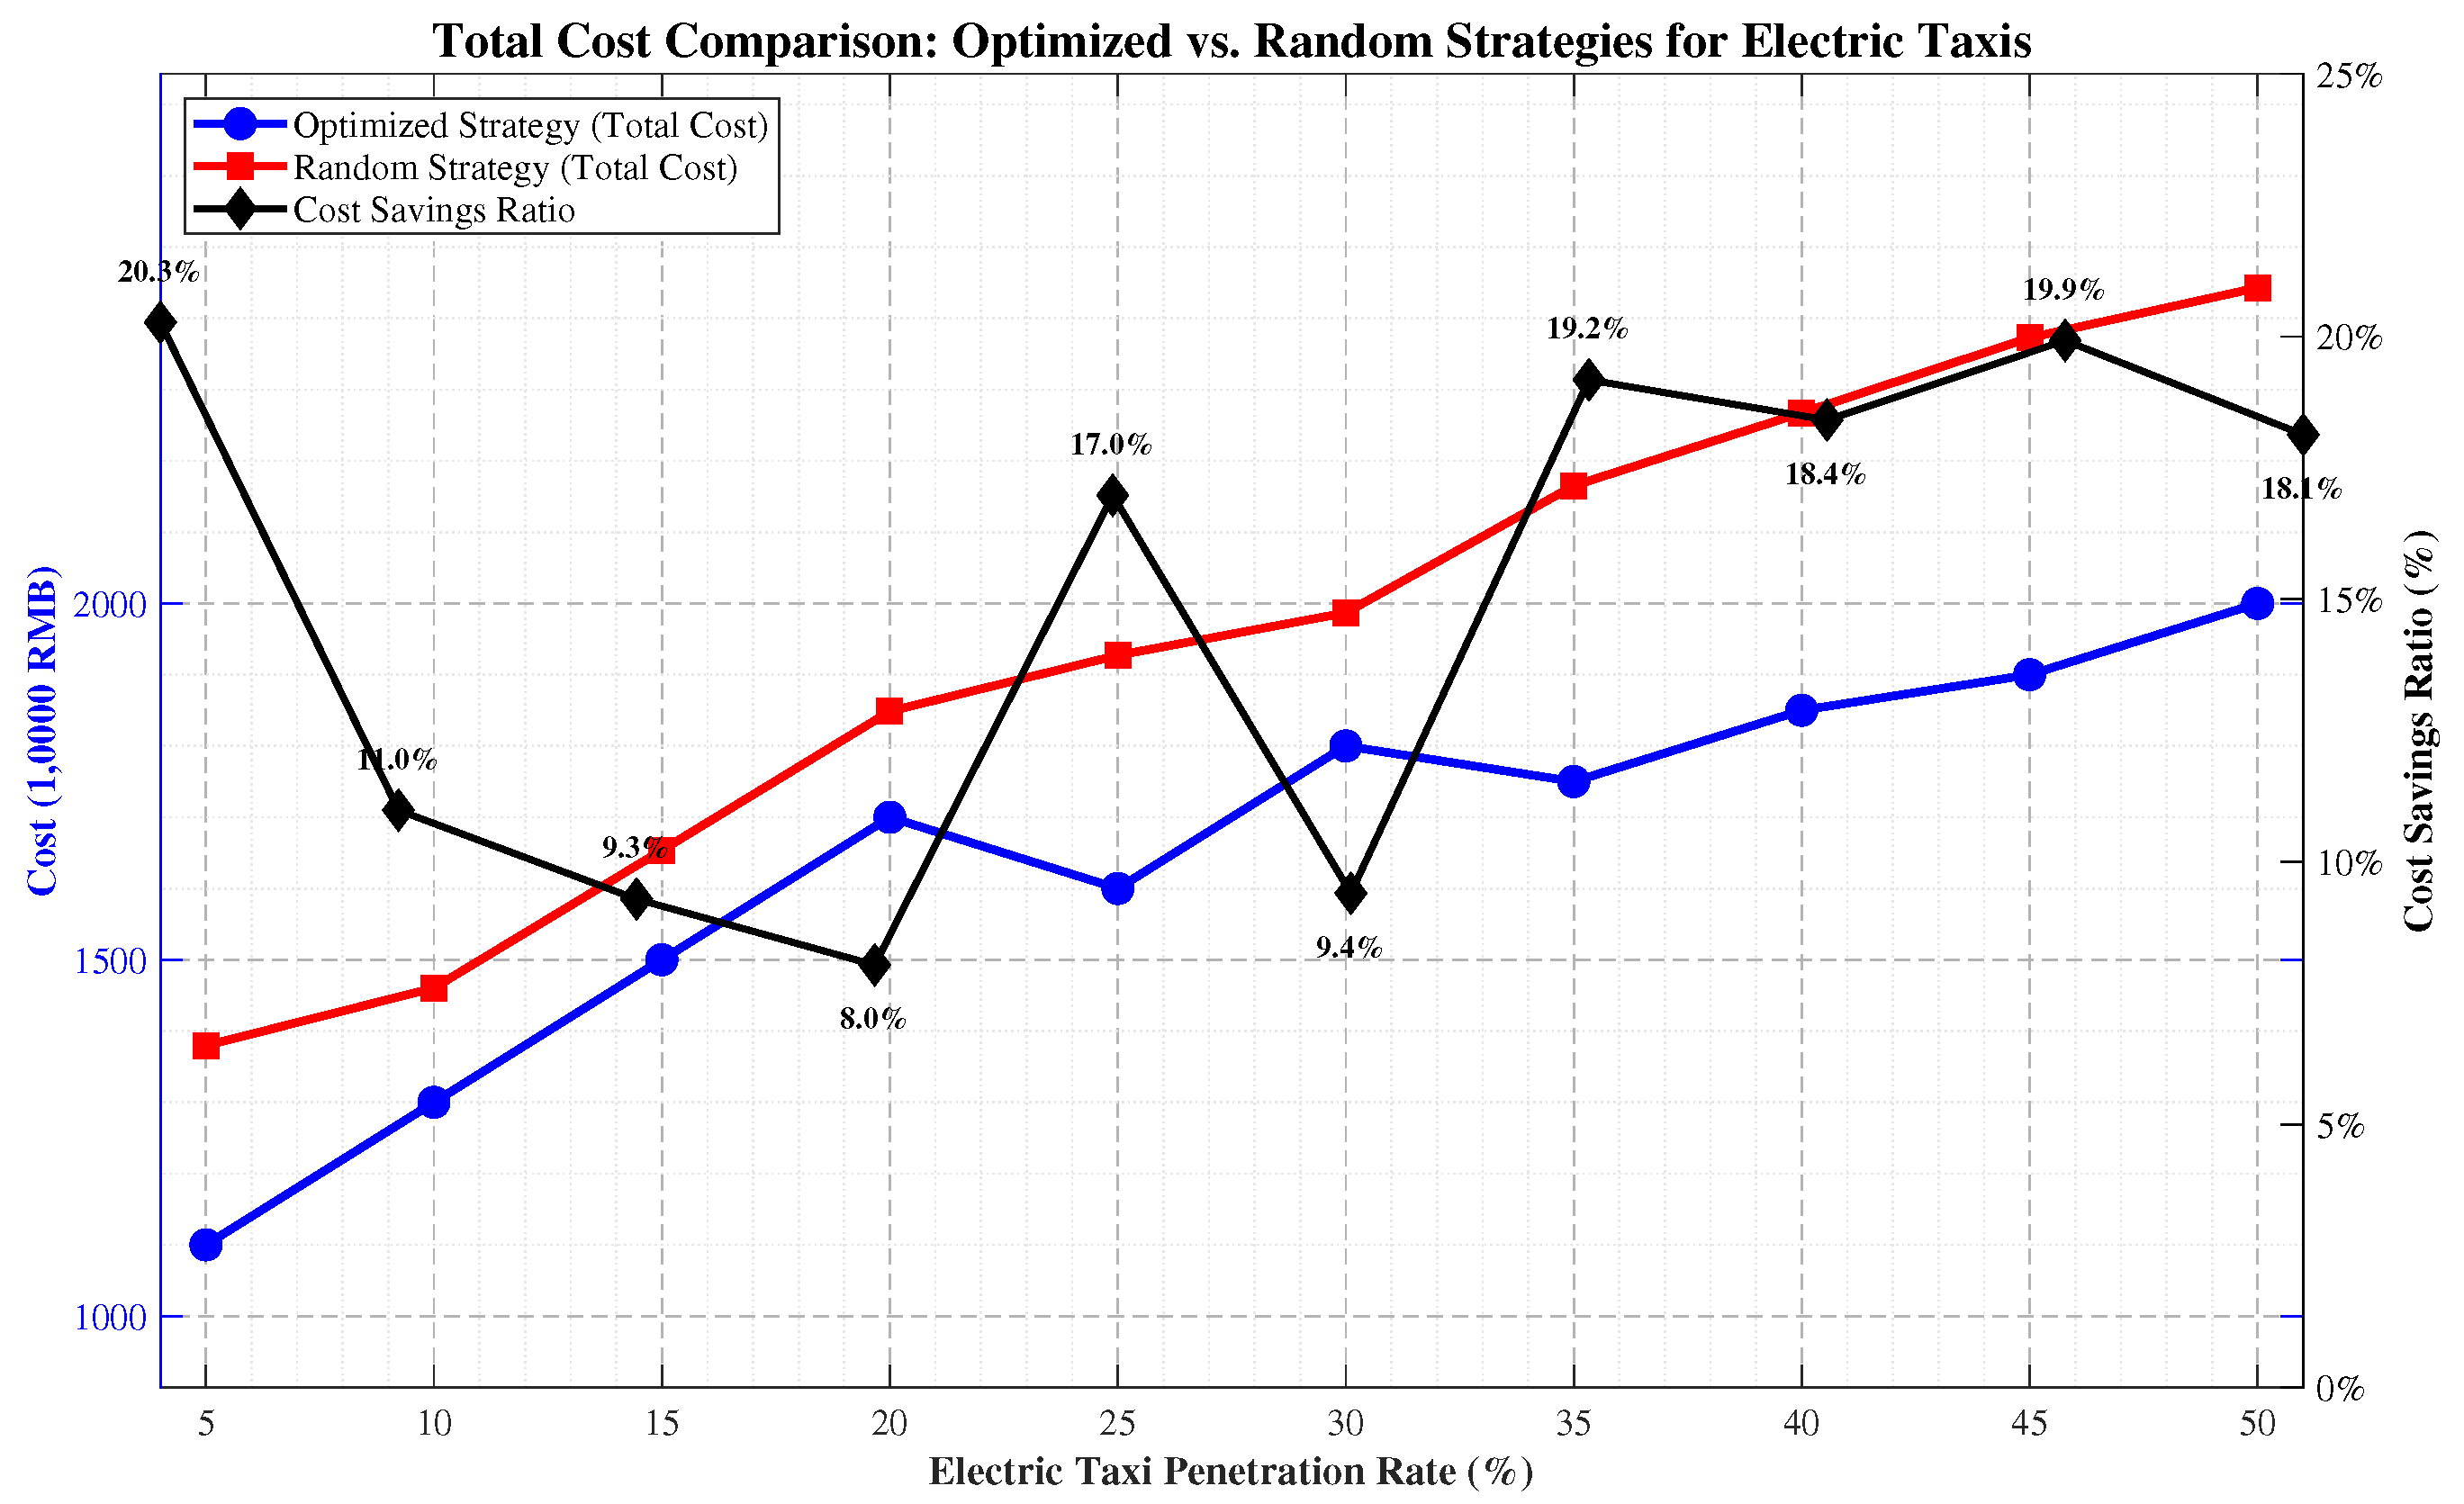

Disclaimer/Publisher’s Note: The statements, opinions and data contained in all publications are solely those of the individual author(s) and contributor(s) and not of MDPI and/or the editor(s). MDPI and/or the editor(s) disclaim responsibility for any injury to people or property resulting from any ideas, methods, instructions or products referred to in the content. |
© 2026 by the authors. Licensee MDPI, Basel, Switzerland. This article is an open access article distributed under the terms and conditions of the Creative Commons Attribution (CC BY) license.