


Abstract
This paper presents an integrated design, manufacturing, and validation methodology for aerodynamic components, demonstrated on a Formula Student front wing built within a USD 192 budget. A Computational Fluid Dynamics (CFD) workflow, validated against measured forces on a double-element wing in ground effect within 3% in downforce, was applied in a target-driven sequence: a four-parameter two-element configuration reached approximately 166 N in 3D, below the 260 N target, motivating a seven-parameter, 600-point Design of Experiments for a three-element configuration. The final design predicted 270.0 N of downforce and 25.7 N of drag, with a 40.7:59.3 front-to-rear vehicle split against the 40:60 target. A scaled wind tunnel test confirmed the drag level only qualitatively, owing to Reynolds-number and ground-effect mismatch. Finite Element Method (FEM) analysis confirmed compliance with the Formula SAE (FSAE) deflection rule T8.3.1. A decision matrix selected 162 g/m2 twill glass fibre, wet-laid with epoxy over an expanded polystyrene core and vacuum-consolidated at about 0.8 bar below atmospheric on a fume-hood vacuum line, as the available pump could run for only 15 min. The largest airfoil of the 8.5 kg wing deflected 3.25 mm under the 200 N regulatory load, well within the 10 mm limit. The workflow provides a reproducible, low-cost route from vehicle-level targets to a physically verified component.
1. Introduction
A refined Formula Student front wing has been reported to increase overall vehicle negative lift by more than 20% while simultaneously reducing wheel-region drag [1], and small design decisions within it have measurable effects on cornering behaviour and vehicle stability [1,2], giving a comparatively small component a disproportionate influence on lap time.
Multi-element configurations dominate contemporary Formula Student practice because they delay flow separation on the individual elements and permit higher effective angles of attack than a single wing of equivalent chord [2,3]. However, the pressure difference between the upper and lower surfaces of a wing produces tip vortices that reduce aerodynamic efficiency [4]; endplates are therefore used to limit pressure leakage, reduce induced drag, and control the airflow around the front tyres, which act as bluff bodies and generate strong turbulence [1,5]. Materials selection has followed a parallel evolution: early Formula One cars relied on metallic structures, which, despite their manufacturability, offered limited potential for weight reduction [6]; as aerodynamic and structural demands grew, teams progressively adopted fibre-reinforced composites, precisely tailoring stiffness, load paths, and geometry while reducing mass [7]. Front-wing design therefore sits at the intersection of aerodynamics, structural mechanics, materials selection, manufacturability, and the resources available to a student team. A practically useful methodology must therefore connect aerodynamic design decisions to a manufacturable component and to physical verification rather than treating each stage in isolation.
Despite the growing body of work on Formula Student aerodynamics, published studies rarely follow a front wing from vehicle-level requirements through optimization, manufacture, and physical verification within a single, reproducible account. This paper presents the design, fabrication, and structural validation of a three-element Formula Student front wing developed under a fixed consumables budget of 10,000 Egyptian pounds (EGP), approximately USD 192. The relevant literature is first reviewed to position the study; the aerodynamic design is then presented in Section 2, material selection and structural verification in Section 3, the scaled wind tunnel assessment in Section 4, the manufacturing methodology in Section 5, and the deflection testing in Section 6, followed by a discussion of limitations in Section 7 and conclusions in Section 8.
1.1. Literature Review
Research relevant to the present study can be grouped into four categories: (1) studies of the aerodynamics of multi-element wings in ground effect, which establish the physical basis for front-wing design; (2) computational fluid dynamics (CFD)-based design and optimization studies of Formula Student and race-car wings; (3) experimental assessments of Formula Student aerodynamics, including full-scale and scaled wind tunnel testing and on-track measurements; and (4) studies of composite design, manufacturing, and structural verification of Formula Student components. The following subsections provide an abridged overview of each category, after which the gaps addressed by the present study are identified. Candidate studies were identified with the assistance of a generative artificial intelligence tool (see Acknowledgments); all cited works were checked against their published versions by the authors.
1.1.1. Multi-Element Wings in Ground Effect
Race-car aerodynamics differs from aircraft aerodynamics chiefly in its use of negative lift to increase tyre load and, consequently, the cornering, braking, and traction capability of the vehicle [8]. A front wing operates close to the ground, where the flow is accelerated between the suction surface and the road; downforce increases as ride height decreases until separation on the suction surface limits and eventually reduces it [9,10]. Adding a flap delays this separation and substantially raises the attainable downforce, although a double-element wing exhibits a comparable force reduction at very small ground clearances [11]. The benefit of slotted multi-element configurations derives from the slot, dumping, and off-surface pressure-recovery effects described by Smith [12], which together permit higher effective angles of attack than a single element of equal chord [2,3]. Formula Student wings operate at Reynolds numbers of the order of 5 × 10⁵, considerably lower than those for which most published airfoil data were generated; Epple et al. therefore analysed more than 500 National Advisory Committee for Aeronautics (NACA) four-digit configurations to characterize the effects of camber, camber position, thickness, and angle of attack on lift and drag [13], and subsequently examined how aspect ratio, angle of attack, and ground clearance govern front-wing downforce in ground effect [14]. Endplates further limit pressure leakage around the wing tips and condition the flow approaching the front tyres [1,5]. These studies define the design variables that subsequent optimization studies treat as inputs: element angles of attack, gap, overlap, and ride height.
1.1.2. CFD-Based Design and Optimization of Formula Student Wings
CFD has become the primary design tool for Formula Student aerodynamics because it allows many configurations to be evaluated at a fraction of the cost of physical testing. Table 1 summarizes representative studies. Early systematic work by Jasper et al. [15] combined CFD with highly fractional factorial Design of Experiments (DOE) to screen multi-element wing parameters for a Formula SAE car, retaining only the influential parameters for a second, refined DOE stage; the resulting wings met their target performance, but the parameters were screened sequentially rather than modelled continuously. Wang et al. [16] extended this approach to a Formula SAE rear wing by combining DOE sampling, a response-surface approximation model, and a genetic algorithm to maximize the lift-to-drag ratio, showing the advantage of surrogate-based optimization over the enumeration of individual variables. Kelly et al. [17] coupled a stochastic-approximation optimizer to a CFD solver to define the profile, location, sizing, and angle of all wing elements simultaneously, using successive 2D and 3D evaluations to meet downforce, drag, and aerodynamic-balance targets at minimal computational cost.
More recent studies have increased both the number of design parameters and the sophistication of the surrogate. Ratterman and Paul [18] optimized a multi-element Formula SAE wing and reported the parameter ranges subsequently adopted in this study; Way et al. [19] parametrically optimized an aerodynamically active Formula SAE front wing, deriving separate high-downforce and low-drag configurations; and Suvanjumrat et al. [20] coupled a genetic algorithm with an artificial neural network to optimize the element angles of attack of multi-element front and rear wings, reporting downforce gains of 14.8% and 28.4%, respectively. At the cross-section level, Piszczatowski et al. [21] compared ten four-element front-wing configurations in ANSYS Fluent and identified an optimum with a downforce coefficient of 2.056 and a drag coefficient of 0.249, while Chudi et al. [2] examined the aerodynamic design of a racing car with particular regard to its front wing. Beyond Formula Student, Souza Dourado and Hayashi [22] optimized ten shape, position, and incidence parameters of a two-element Formula 1 rear wing in 2D, and Ben Moussa et al. [23] used a quadratic response surface in ANSYS DesignXplorer to identify an optimal front-bumper inclination, illustrating that the DOE–response-surface workflow used in the present study is an established and repeatable approach. Szudarek and Piechna [24] further showed that the position of an added front wing relative to the body strongly alters the distribution of downforce between the axles, increasing front-axle downforce two- to fivefold at the expense of the rear and underscoring the need to verify a wing at vehicle level rather than in isolation.
Across these studies, the optimization methods themselves are well developed. However, most of them conclude at the numerical stage: the optimized designs are rarely manufactured, their structural adequacy is seldom assessed, and the cost or resource implications of the selected geometry are not reported. In addition, 2D optimization results are not always rebuilt and verified in 3D, so that finite-span effects such as tip vortices and endplate losses remain unquantified.
Table 1.
Summary and limitations of CFD-based design and optimization studies of race-car wings.
1.1.3. Experimental Assessment of Formula Student Aerodynamics
Experimental validation of Formula Student aerodynamics is constrained by the cost and availability of suitable test facilities. Table 2 summarizes representative studies. Wordley and Saunders [25] developed multi-element wing profiles numerically and tested them in a full-scale wind tunnel, both in isolation and on the car, developing three techniques for measuring front-wing performance in ground effect; the same group later evaluated the effect of the aerodynamic package on acceleration, cornering, braking, and slalom performance from logged on-track data [26]. Abid et al. [27] designed a downforce package comprising front and rear wings and a diffuser and validated their CFD results against wind tunnel measurements. Pacheco et al. [28] tested a one-third-scale Formula Student model under several ride-height, appendage, and rear-flap configurations; although measurement and numerical uncertainties precluded a full quantitative evaluation, the CFD captured the experimental sensitivity to each setting, supporting the use of scaled tests for trend validation. Borgialli [29] similarly validated a CFD model against wind tunnel data and derived aerodynamic maps for a Formula Student car. Krbat’a et al. [30] compared three front-wing variants in CFD, evaluated the selected variant in a wind tunnel, and verified the geometric accuracy of the manufactured wing against the computer-aided design (CAD) model by 3D scanning. Outside Formula Student, Kuttasirisuk et al. [31] used a 1:12-scale, 3D-printed model and flow visualization to support CFD predictions for a sports-car aerodynamic package qualitatively, noting explicitly that quantitative force validation was precluded by Reynolds-number mismatch and facility constraints.
Table 2.
Summary and limitations of experimental studies on Formula Student and race-car aerodynamics.
These studies show that full-scale testing provides the most reliable correlation but is rarely accessible to student teams, whereas scaled tests are more affordable but are limited by Reynolds-number mismatch and balance resolution. Consequently, scaled tests are commonly used to verify trends or orders of magnitude rather than absolute coefficients, a limitation that also applies to the present study.
1.1.4. Composite Design, Manufacturing, and Structural Verification
The structural realization of Formula Student components has received less attention than their aerodynamic design. Table 3 summarizes representative studies. Hamilton et al. [32] showed that a carbon-fibre monocoque could be produced at undergraduate level, overcoming the limitations of locally available finite element tools by devising perimeter-shear, pin-shear, three-point-bending, and tensile tests to select the laminate; the resulting prepreg and aluminium-honeycomb sandwich reduced mass by 53% and increased torsional rigidity by 43% relative to the steel space frame. Sratong-on and Wanthong [33] combined finite element analysis with three-point-bending and perimeter-shear tests to verify the sandwich configuration of a full-body composite monocoque, and Capata et al. [34] validated finite element predictions of chassis torsional stiffness experimentally for both a steel space frame and a carbon-fibre monocoque using loads derived from track tests and a dial indicator, obtaining agreement within 0.6% and 3.6%, respectively. For composite wheel rims, Bársony et al. [35] presented an iterative, finite element method (FEM)-based layup-selection methodology using measured prepreg material cards and lap-time-simulation load cases, reaching the target properties after 11 iterations with an estimated 35% mass reduction relative to aluminium rims, although physical testing was limited to material coupons, while Klemt et al. [36] proposed a structured design process tailored explicitly to the resource and time constraints of Formula Student projects, achieving a 49% mass saving relative to an aluminium reference on the basis of finite element simulations with datasheet material properties, with physical validation left to future work. Hunar et al. [37] topology-optimized an additively manufactured Formula Student upright and compared its cost with that of a conventionally milled part, one of the few Formula Student studies to report component cost explicitly, although the optimized part was verified by finite element analysis only.
For aerodynamic devices, Sriraam et al. [38] designed a custom front-wing airfoil and manufactured it in carbon fibre by wet lay-up and vacuum bagging over a computer numerical control (CNC)-machined extruded-polystyrene foam that served as both mould and core, reporting a mould cost of roughly one-sixth that of a conventional female mould and a mass reduction from 4.7 to 3.9 kg; structural verification, however, was performed in three-point bending on a test laminate rather than on the wing. Similarly, Krbat’a et al. [30] selected a carbon fabric through material testing before manufacturing a front wing. Torres et al. [39] developed a low-cost vacuum-assisted resin infusion process for carbon-fibre sandwich components of a light sport aircraft; the aileron beam failed in a cantilever test at a load that the finite element model predicted it would sustain, a discrepancy of approximately 15% that the authors attributed to manufacturing defects identified by computed tomography, which illustrates how processing quality governs the agreement between FEM and test for hand-processed laminates. At the process level, a comparison of hand lay-up, vacuum bagging, and vacuum infusion of woven E-glass laminates found that vacuum infusion gave the highest ultimate tensile strength, 346 MPa [40], while hand lay-up and vacuum-assisted resin infusion produced similar mechanical performance, but with greater scatter and less uniform reinforcement for hand lay-up [41]. Earlier work established that optimizing the wet lay-up/vacuum-bag process yields high fibre fractions and low void contents [42], and established texts describe the trade-offs between open-mould processes and controlled-cure routes [43]. Most relevant to the present work, Yavuz et al. [44] manufactured glass-fibre/epoxy skins on an expanded polystyrene (EPS) foam core by hand lay-up with vacuum bagging and showed that heavier (300 g/m2) fabric and a greater number of layers improved impact and bending resistance. Sandwich panels with aluminium honeycomb cores for vehicle bodies [45] and potted-insert load introductions in honeycomb sandwich panels [46] have also been characterized.
Table 3.
Summary and limitations of composite design, manufacturing, and structural verification studies.
Collectively, these studies show that student teams can produce structurally verified composite components, but they concentrate predominantly on chassis and wheel components made from carbon-fibre prepreg, which typically require controlled-cure facilities. Studies of aerodynamic devices rarely report component-level structural verification or the manufacturing constraints that shaped the final design, and the direct cost of the selected manufacturing route is seldom quantified beyond individual items such as a mould or a single part [37,38].
1.1.5. Relevance and Gap Identification
The reviewed literature shows that the individual elements of front-wing development are well established. CFD-based and surrogate-assisted optimization of multi-element wings is mature [15,16,17,20,21]; scaled and full-scale wind tunnel testing has been used to verify CFD predictions and trends [25,28,31]; and student teams have produced structurally verified composite components [32,33,34]. Nevertheless, these efforts remain largely fragmented. Optimization studies seldom proceed to manufacture or physical testing; experimental studies typically address aerodynamics without structural verification; and composite studies concentrate on carbon-fibre prepreg chassis and wheel components produced with facilities that many teams do not have. Moreover, the reviewed studies rarely translate a vehicle-level performance requirement into explicit acceptance criteria for the wing architecture, and the cost and resource constraints that drive material and process substitutions are seldom quantified, which makes it difficult for teams with limited funding to reproduce published results. The closest precedent, Sriraam et al. [38], documented a low-cost foam-core front wing but verified it on a test laminate and reported only the mould cost; the optimization studies reviewed above, in turn, are framed as numerical design studies [16,20,21].
The present study addresses these gaps by documenting the complete development of a Formula Student front wing, from vehicle-level targets through DOE-based optimization, manufacture, and physical verification, within a single, traceable workflow. Its contribution is therefore not the use of any individual tool, which is well established, but the integration and reporting of the full chain under explicit resource constraints. Specifically, the novelty of this study lies in (1) a target-driven, sequential DOE workflow in which a vehicle-level downforce requirement serves as the acceptance criterion, used first to reject the best two-element configuration found by the DOE and then to justify a seven-parameter, 600-point three-element design that is subsequently verified in 3D and at vehicle level; (2) a cost-quantified, low-resource manufacturing route (woven glass fibre wet-laid over an EPS core with fume-hood vacuum consolidation and aluminium sandwich endplates) built under a fixed consumables budget of approximately USD 192, with each constraint-driven substitution documented alongside its consequence; and (3) closure of the design loop through validation and physical verification, comprising a CFD validation against measured forces on a double-element wing in ground effect, a scaled wind tunnel drag assessment and a comparison between the finite element method (FEM) prediction and a physical deflection test of the largest wing element. To the authors’ knowledge, no single Formula Student study reports this combination, and the outcome is intended to serve as a reproducible reference methodology for teams operating with limited equipment and funding.
Figure 1 summarizes the general workflow adopted in this study. Although it is demonstrated here on a Formula Student front wing, it is intended to apply to aerodynamic components more broadly. The workflow proceeds in three phases (design, materialization, and build and verify), each closed by an acceptance check: the aerodynamic architecture is refined until it meets the component target in 3D and at vehicle level, and is checked in a scaled wind tunnel test before any full-scale manufacture; the material and layup are revised until the structure complies with the applicable load cases; and the manufactured part is verified physically against the structural prediction. Resource constraints, such as budget, available equipment, regulations, and schedule, act throughout and govern the choices made at each step. The sections in which each step is applied to the present wing are indicated in the figure.
Figure 1.
General workflow for the design, materialization, manufacture, and verification of an aerodynamic component, as applied in this study. Diamonds denote acceptance checks; section numbers indicate where each step is reported. CFD, computational fluid dynamics; DOE, design of experiments; FEM, finite element method; GCI, grid convergence index.
2. Aerodynamic Design
2.1. CFD Framework and Ahmed Body Validation
The design simulations were carried out in ANSYS Fluent 2022 R2 and 2024 R2, and the validation case of Section 2.2 was performed in ANSYS Fluent 2026 R1 (ANSYS, Inc., Canonsburg, PA, USA) using the k–ω shear-stress transport (SST) turbulence model [47], selected for its near-wall accuracy in adverse-pressure-gradient boundary layers characteristic of multi-element wings. The computational domain was sized to represent a wind-tunnel test section, with sufficient length downstream for the wake to develop before the outlet and sufficient length upstream for the inlet to lie outside the stagnation region at the nose [48]. Following the guideline of [48], the inlet was placed 4L upstream of the body and the outlet 7L downstream, with a domain height of 6H and a width of 10W (5W from the symmetry plane in the half models), where L, W and H are the length, width and height of the body; the resulting blockage ratio was below 1%. The numerical set-up was verified against the Ahmed body benchmark (h/L = 288/1044 mm, slant angle 25°, inlet velocity 35 m/s) [49,50], a standard practice in Formula Student CFD validation [1,29]. Grid convergence was checked using Richardson extrapolation across three mesh refinement levels [51,52], computing a refinement ratio r = h1/h2 = 1.3 between successive mesh sizes and an observed order of accuracy p = ln[(f3 − f2)/(f2 − f1)]/ln(r); the resulting Grid Convergence Index (GCI), GCI = Fs|ε|/(rp − 1) remained below 1% for the lift coefficient CL and below 5% for quantities related to the drag coefficient CD.
The Ahmed body mesh is shown in Figure 2; the simulation yielded CL = 0.344 (0.3% deviation from published wind tunnel data) and CD = 0.315 (5.4% deviation), validating the meshing procedure and turbulence closure for subsequent front-wing simulations. The boundary conditions and mesh settings used are listed in Table 4.
Figure 2.
Mesh of the Ahmed body benchmark geometry, mounted on its four ground-clearance struts.
Table 4.
CFD boundary conditions used for the Ahmed body validation and all subsequent simulations, and mesh settings of the front-wing and vehicle models.
The front-wing and vehicle meshes were generated in ANSYS Fluent Meshing as poly-hexcore volume meshes. A body-of-influence region with a 25 mm cell size enclosed each model; on the wings, curvature-based sizing (2–7 mm on the front wing and 0.5–5 mm on the rear wing) was combined with a 1 mm face sizing, and six inflation layers with a 0.2 mm first-layer height were grown from the wing and vehicle surfaces. At the design speed, this first-layer height corresponds to an estimated y+ of about 10–20 on the wings, a range handled by the y+-insensitive near-wall formulation of the SST model in Fluent. The final meshes had a maximum skewness of 0.45 and a minimum orthogonal quality of 0.28.
2.2. Validation Against a Double-Element Wing in Ground Effect
The Ahmed body validates the set-up for vehicle-body flows but does not exercise the slot flows, boundary-layer interactions and tip vortices of a multi-element wing in ground effect. The CFD method was therefore also validated against the experiments of Zhang and Zerihan [11] on a double-element wing (main-element chord 223.4 mm, flap chord 165.7 mm, overall chord c = 380 mm, span 1100 mm and rectangular 400 × 170 × 4 mm endplates), tested above a moving ground at 30 m/s (Re ≈ 0.75 × 10⁶ based on c) with the flap at its datum setting and free transition. The geometry was built from the coordinates tabulated by Zerihan [53], with the endplate position estimated from the drawings in [53] because it is not dimensioned there, and a half-span model with a symmetry plane at mid-span (Figure 3) was meshed and solved with the same settings as the front wing (Table 4), with three additional nested refinement regions of 5, 10 and 15 mm cell size enclosing the wing, the wing–ground gap and the near wake, in a domain extending 3.0 m (7.9c) upstream and 5.0 m (13.2c) downstream of the model, and 1.0 m (2.6c) above it and beyond the endplate, which gives a blockage ratio of 3.0%. The inlet velocity was 30 m/s with the measured freestream turbulence intensity of 0.2% [53], and the ground moved at the freestream speed. The case was simulated at a ride height of h/c = 0.211, where h is the distance from the lowest point of the main element to the ground. A three-dimensional model with endplates was used because two-dimensional simulations of inverted wings in ground effect overpredict the downforce measured on finite-span wings [54], and a comparable three-dimensional approach has been validated against force measurements for a multi-element wing in ground effect [55].
Figure 3.
Double-element validation case [11,53]: half-span model with endplate above the moving ground, rendered from the CAD geometry. CAD, computer-aided design; U∞, freestream velocity, equal to the moving-ground speed; h, ride height.
Table 5 compares the predicted and measured force coefficients. The predicted CL of 2.56 was 3.0% below the measured 2.64, and the predicted CD of 0.278 was 10.3% above the measured 0.252. The mesh followed the same sizing rules as the front-wing simulations, for which a three-level study gave a Grid Convergence Index of 0.52% for downforce and 4.82% for drag (Section 2.4.1); a separate mesh study was therefore not repeated for the validation case. The larger deviation in drag has four main contributions. First, the experiments were performed with free transition [53], so that at this Reynolds number the boundary layers remain laminar over part of each element, whereas the SST model assumes fully turbulent boundary layers from the leading edge. The higher turbulent skin friction raises the predicted drag, and the thicker turbulent boundary layers slightly reduce the effective camber and hence the downforce, so the assumption explains the sign of both deviations; transition-sensitive modelling of multi-element wings in ground effect has been shown to improve on the fully turbulent SST model, which tends to underestimate downforce, and to bring the predicted drag within 4.1% of wind-tunnel measurements [56]. Second, the drag is about one-tenth of the downforce, so the same absolute discrepancy appears about ten times larger in relative terms: the difference of 0.026 in CD corresponds to only 1% of the measured CL. Third, drag is the more mesh-sensitive quantity, with a Grid Convergence Index of 4.82% against 0.52% for downforce. Fourth, the endplate position had to be estimated from drawings, and the endplate governs the tip vortices and hence the induced drag. Deviations of this size are common for RANS predictions of wings in ground effect: for the single-element wing of Zerihan and Zhang, Doig and Barber [54] obtained drag deviations between −9% and +8% with the SST model and up to +18% with the realizable k–ε model, with transition fixed in both the experiment and the simulation. The meshing and turbulence modelling used for the front wing therefore reproduce the downforce of a multi-element wing in ground effect within 3% and its drag within about 10%. Because the full-scale front wing operates at a similar Reynolds number (about 6 × 10⁵, Section 4), its drag is likely to be overpredicted by a similar margin, while its downforce predictions are, if anything, conservative.
Table 5.
Predicted and measured force coefficients of the double-element wing in ground effect.
2.3. Vehicle-Level Design Requirements
A baseline CFD run on the vehicle without aerodynamic devices, at the chosen 35 m/s design velocity, gave an inherent lift coefficient CL = 0.17 and drag coefficient CD = 0.53 (Figure 4). Mesh independence of this model was checked on three meshes of 6.0, 9.4 and 17.3 million cells (half model): CD changed by 0.3% or less and CL, which is small, by less than 0.025 in absolute terms. The forces, which oscillated about a steady mean, were averaged over the final iterations, and the values from the finest mesh are reported. The design velocity was chosen for cornering-dominated running rather than top speed, since Formula Student events are laid out around tight cornering sections [1,57].
Figure 4.
Static pressure contour on the vehicle without aerodynamic devices, baseline CFD run.
The required front-wing downforce was derived from the skidpad event, in which the cornering speed is limited by the tyre–road force balance [58]. Under this balance,
where vc is the cornering speed, μ = 1.4 is the tyre–road friction coefficient, R = 9.125 m is the skidpad radius [59], m = 250 kg is the vehicle mass, g is the gravitational acceleration, ρ is the air density, and A = 0.82 m2 is the frontal area with aerodynamic devices installed. With no downforce, the equation returns vc ≈ 11.2 m/s; the target cornering speed adopted for this study was 11.35 m/s. Solving Equation (1) for the CL that closes this gap gives CL ≈ 1.06, which corresponds to 650 N of total vehicle downforce at the design velocity.
Established Formula Student practice [1,2] distributes this total in a 40:60 ratio between the front and rear wings to maintain aerodynamic balance under braking and cornering. The front wing was therefore targeted at 260 N of downforce, and the rear wing at 390 N. These vehicle-level requirements were used as the acceptance criteria for the subsequent front-wing architecture stages.
2.4. DOE-Driven Optimization
Because both candidate architectures contain interacting geometric variables, the front-wing development used the Design of Experiments (DOE), response surface, and multi-objective genetic algorithm (MOGA) optimization workflow in ANSYS DesignXplorer 2024 R2. For each architecture, the DOE sampled the defined parameter space with CFD design points, the response surface provided a continuous surrogate of the aerodynamic responses, and optimization searched that surrogate for candidate configurations. All DOE design points were solved in 2D to reduce computational cost; this treatment assumes spanwise-infinite airfoil sections and therefore excludes finite-span effects such as tip vortices and endplate interactions. Forces from the 2D runs are per metre of span, as computed by the 2D solver, and are therefore not directly comparable with the total forces on the finite-span 3D wings. Selected candidates were consequently rebuilt and verified in 3D before an architecture was accepted or rejected. Surrogate quality was assessed using the coefficient of determination (R2), which measures the fraction of response variation captured by the model. Figure 5 summarizes the angle-of-attack, gap, and overlap definitions used throughout the study.
Figure 5.
Multi-element parameter definitions: global angle of attack, per-element angle of attack, gap, and overlap (AOA, angle of attack) [18].
2.4.1. Two-Element Configuration
The lower-complexity architecture used a NACA 4412 main element and flap, with four simultaneous variables: main- and flap-element angles of attack, gap ratio, and overlap ratio. Their DOE bounds are listed in Table 6. This stage tested whether the best two-element wing within these bounds could meet the 260 N requirement before additional aerodynamic complexity was introduced.
Table 6.
DOE parameter bounds for the two-element configuration.
The fitted response surface reproduced the two-element CFD dataset closely. Learning-point coefficients of determination ranged from 0.9985 to 0.9986, while cross-validation values ranged from 0.9474 to 0.9685. The maximum predicted errors reported for CL and CD were 0.04% and 0.003%, respectively. A MOGA search of the response surface, maximizing downforce and |CL/CD|, returned three tightly clustered candidates around 150 N of predicted 2D downforce and |CL/CD| ≈ 36.4–36.5. Candidate 1, with main-element and flap angles of 2.02° and 12.00°, a gap ratio of −0.0120, and an overlap ratio of 0.0061, was carried forward to the 3D stage; its 2D prediction was 149.9 N of downforce and 4.12 N of drag. Several of these values lie at or near the lower bounds of Table 6, so the two-element result is bounded by the chosen design space as well as by the architecture.
The selected two-element configuration was then rebuilt as a finite-span 3D wing and subjected to a three-level mesh-independence study. The mesh was refined by a factor of 1.3 between levels, and the resulting aerodynamic loads are summarized in Table 7.
Table 7.
Mesh-independence results for the selected two-element configuration.
Richardson extrapolation gave a Grid Convergence Index of 0.52% for downforce and 4.82% for drag force, with the lift-related quantities remaining below 1% and the drag-related quantities below 5%. The verified two-element configuration therefore generated approximately 166 N of downforce, remaining substantially below the 260 N vehicle-level target. Rather than continuing to refine the same architecture, this shortfall was used as the engineering basis for increasing the available design freedom through a third aerodynamic element. Because the shortfall amounted to 36% of the target, a moderate extension of the two-element bounds was not expected to close it and was not pursued.
2.4.2. Three-Element Configuration
Following the verified two-element shortfall, a third element was introduced, adding its angle of attack together with a second gap and overlap pair and expanding the design space from four to seven variables. Bounds on all seven parameters were taken from a prior multi-element Formula SAE optimization study by Ratterman and Paul [18] and are given in Table 8. A 600-point Latin Hypercube sample was generated within these bounds and each design point was solved as a 2D CFD run under the same k–ω SST closure as the Ahmed body validation.
Table 8.
DOE parameter bounds for the three-element configuration [18].
A Genetic Aggregation response surface was fitted to the DOE outputs, tracking CL, CD, downforce, and drag as separate responses. Learning-point R2 values exceeded 0.9999 and cross-validation values stayed above 0.9780 across all responses, indicating good predictive accuracy within the sampled design space. A Multi-Objective Genetic Algorithm was then run on the surface with the objectives of maximizing downforce magnitude and |CL/CD|. The three top-ranked candidates are given in Table 9; the candidates are tightly clustered, and several parameters lie at the lower bounds of Table 8, indicating that the optimum is limited by the chosen design space rather than being a global optimum. To test the influence of the bounds, a control study was performed in which every bound at which the candidates lay was extended by 20% of its original range, with the sampling concentrated around the optimum (main element 1.2–2.8°, flap 12–18°, third element 15.2–20.8°, gap ratio 1 −0.016 to −0.010, overlap ratio 1 0.002–0.020, gap ratio 2 −0.046 to −0.034 and overlap ratio 2 0.010–0.020). A 100-point Latin Hypercube sample was fitted with the same Genetic Aggregation response surface (cross-validation R2 of 0.988 for drag and 0.995 for downforce) and searched with the same MOGA objectives, with overlap ratio 1 limited to 0.010 to avoid contact between the main element and the flap. The best candidate (main element 1.20°, flap 17.96°, third element 16.44°, gap ratio 1 −0.0149, overlap ratio 1 0.0100, gap ratio 2 −0.0342 and overlap ratio 2 0.0103) produced 251 N of 2D downforce at |CL/CD| = 40.8 in a direct 2D CFD run, in close agreement with the response surface, which is about 24% more downforce than C2 (202.0 N at 36.5) with a higher lift-to-drag ratio. Four of its parameters again lay at the bounds of the extended space, so the optimum lies beyond the region explored by either study. C2 was nevertheless retained, because it already met the 260 N target in 3D and the wing had been manufactured and tested on that basis; the region beyond the original bounds is identified as future work.
Table 9.
Top three optimization candidates from the response surface.
Candidate C2 was rebuilt as a full 3D geometry and re-simulated, yielding 222.0 N of downforce, qualitatively consistent with the 2D result but 38 N below the 260 N front-wing target. The gap reflects finite-span effects excluded from the 2D DOE: tip vortices, endplate losses, and wing-wheel interaction. To close it, three changes were made in 3D while the relative element geometry of C2 was kept fixed: the global angle of attack was swept and set to 2°; the span was increased to the final 1500 mm; and the outboard edge of the endplate was given a curved profile. The last two changes directed the flow away from the front wheels. The intermediate sweep runs were exploratory and were not retained; the final geometry is available from the authors on request. The final 3D CFD configuration predicted 270.0 N of downforce at 25.7 N of drag, satisfying the target. Figure 6 shows the resulting surface pressure distribution. The mesh of the final wing is shown in Figure 7.
Figure 6.
Static pressure contour over the final three-element front wing at the 35 m/s design velocity.
Figure 7.
Mesh of the final three-element front wing (half model): (a) symmetry plane, showing the body-of-influence refinement regions around the wing; (b) section through the three elements at the symmetry plane, showing the inflation layers in the slot gaps.
2.4.3. Full-Vehicle Simulation
The isolated-wing simulations do not capture the interaction of the front wing with the wheels, body and rear wing, which also sets the front-to-rear downforce balance. The front wing was therefore mounted on the vehicle body together with a rear wing modelled for this purpose, and the full vehicle was simulated with the same boundary conditions, including rotating wheels (Table 4). The domain and surface mesh of this half model are shown in Figure 8; the mesh followed the settings of Section 2.1, with a finer surface mesh on the wings and wheels than on the body, and the sizing of the vehicle model whose mesh independence was checked in Section 2.3. A first full-vehicle run with candidate C2 gave 220.2 N of front-wing downforce, close to the 222.0 N of the isolated wing, and a front-to-rear split of 35.6:64.4 between the two wings, short of the 40:60 target; the front wheels also produced high drag (49.9 N). These results motivated the increased global angle of attack, the longer span and the curved endplate profile described in Section 2.4.2, the latter two directing the flow away from the front wheels. Table 10 compares the two runs. With the final wing, the front-wing downforce rose to 269.0 N and the split to 40.7:59.3, while the front-wheel drag fell by 23% and the vehicle drag by 9%. The installed front-wing downforce is within 0.5% of the 270.0 N predicted for the isolated wing, while its drag was lower (16.2 N against 25.7 N), so the isolated-wing drag is conservative. In both runs the body and wheels generated lift, so the net vehicle downforce (517.4 N with the final wing) is lower than the sum of the two wings.
Figure 8.
Domain and mesh of the full-vehicle model (half model) with the final front wing and the rear wing: (a) surface mesh on the symmetry plane of the domain, with the refinement region enclosing the vehicle; (b) surface mesh of the vehicle. The surface mesh was regenerated for this figure in ANSYS Fluent Meshing 2026 R1 with the original settings. In (a), the dark region is the refinement zone around the vehicle, where the cells are too small to be distinguished at this scale.
Table 10.
Full-vehicle simulations with the first (candidate C2) and final front wings at 35 m/s.
3. Material Selection and Structural Verification
3.1. Material Selection and Tensile Characterization
The initial design study identified non-crimp carbon fibre reinforced polymer (CFRP) as the theoretically optimal material through an Ashby-method screening based on specific stiffness, density, and cost. A preliminary structural screening predicted 1.50 mm deflection for the CFRP option.
Under the actual project constraints, however, CFRP was rejected. Suitable woven prepreg was not available within budget and lead time in the local supply chain; the unidirectional prepregs that were available required autoclave curing, which was not accessible; and the material cost would have consumed most of the consumables budget before the endplates and hardware were considered. Glass fibre was therefore carried forward as the feasible reinforcement family, with 200 g/m2 plain weave and 162 g/m2 2 × 2 twill evaluated mechanically and subsequently compared for manufacturability.
This material pivot defines the material system subsequently characterized experimentally, represented in the FEM model, and manufactured as the full-scale wing.
Representative laminates of the two candidate fabrics were characterized using a Universal Testing Machine (UTM; Instron 3382, Instron, Norwood, MA, USA) in accordance with ASTM D3039 [60]. No extensometer or strain gauge was available, so strain was derived from the testing machine’s crosshead displacement; Figure 9 shows the resulting stress–strain curves. Young’s modulus was obtained from the initial linear region of the tensile response, while ultimate tensile strength and apparent failure strain were also recorded. The plain weave reached a higher ultimate tensile strength (111.6 MPa) and apparent failure strain (12.78%) than the twill weave (86.7 MPa and 10.16%, respectively). The measured Young’s modulus of the selected twill laminate, E = 12.7 GPa, was used as the stiffness input to the structural FEM model. Poisson’s ratio could not be measured with the available equipment and was taken from the corresponding woven glass-fibre dataset in ANSYS Granta EduPack 2024 (ν = 0.072); the laminate was modelled as isotropic, so that the shear modulus followed from G = E/[2(1 + ν)] = 5.92 GPa. Because strain was derived from crosshead displacement, 12.7 GPa is an apparent modulus that includes machine and grip compliance and is therefore expected to underestimate the true laminate stiffness. It is comparable to the 10.7 GPa reported for woven E-glass laminates in [40] and close to the 13 GPa given by the same Granta EduPack dataset; because the true stiffness is expected to be higher, the FEM deflections are expected to be conservative; the influence of the elastic constants is quantified in Section 3.2. Stresses and the modulus were calculated with the coupon thickness of 0.35 mm, and the same thickness was used for the skin in the FEM, so that the membrane stiffness Et that governs the global deflection of the closed skin is taken directly from the tests.
Figure 9.
Comparative stress–strain response of twill (blue) and plain (red) woven glass fibre composites, tested per ASTM D3039.
3.2. FEM Structural Verification
Compliance with Formula SAE (FSAE) regulation T8.3.1 (200 N distributed over a minimum 225 cm2 area, deflection limited to 10 mm) was verified through Finite Element Method (FEM) analysis in ANSYS Mechanical 2026 R1. The regulatory 200 N load was applied as a uniform force distributed over the entire face of the wing. The wing skins were modelled as shell elements at the 0.35 mm laminate thickness with the material definition of Section 3.1, the 30 kg/m3 EPS cores as solids bonded to the skins (E ≈ 9.5 MPa, ν = 0.275, Granta EduPack) and the aluminium endplates and midplates as solid aluminium plates (E = 71 GPa, ν = 0.33), with the skins connected to the plates through the cores; the wing was fixed at the midplate mounting faces. The predicted maximum deflection was 0.91 mm, well below the 10 mm limit. Coarsening all element sizes by a factor of about 1.5 changed the maximum deflection by 2.4% (to 0.93 mm), so the result is insensitive to the mesh resolution. Figure 10 shows the total deformation contour, with the peak on the rear element of the outboard sections, between the midplate and the endplate.
Figure 10.
FEM total deformation contour on the front wing under the 200 N distributed load. Peak deflection: 0.91 mm.
Because the elastic constants are uncertain (Section 3.1), their influence was assessed by repeating the full-wing analysis with each constant varied (Table 11). The modulus has the largest influence: increasing E by 30%, with G following from the isotropic relation, reduced the deflection by 8.6%, whereas a ±25% change in G altered it by only about 2%. Poisson’s ratio enters the shell stiffness only through the factor 1 − ν2, so a ±25% change in ν alters it by less than 0.5% and was not analysed further. Even a 30% change in E altered the deflection by less than 9%, because a large part of the deflection arises from the core, the aluminium plates and their connections, which do not depend on the skin properties; in every case the deflection remained far below the 10 mm limit.
Table 11.
Sensitivity of the full-wing FEM to the elastic constants of the skin and to the mesh.
Because the full-wing model differs from the physical test (Section 6) in both loading and support, a test-replica model of the largest airfoil was also built. The 200 N load was applied over a 220 mm diameter patch at mid-span (Figure 11a), matching the footprint of the weight discs, and the vertical deflection was read at the dial-gauge position on the lower surface. As the airfoil was bolted to the plywood rig through its aluminium end-pieces, a joint that restrains end rotation only partially, the ends were modelled both as clamped and as simply supported, and the EPS core was modelled as in the full-wing model. The deflection at the gauge position was 1.26 mm with clamped ends and 1.60 mm with simply supported ends (Table 12; maximum deformation 1.5 and 2.5 mm, at mid-span; Figure 11b); coarsening all element sizes by a factor of about 1.5 changed the clamped gauge-point deflection by 1.2%. Under the patch load, the compressive stress carried by the core (at most about 5 kPa) is far below its compressive strength of 0.20–0.25 MPa.
Figure 11.
Test-replica model of the largest airfoil: (a) the 200 N load applied over the 220 mm diameter patch at mid-span; (b) total deformation with simply supported ends. The arrow in (a) indicates the direction of the applied load.
Table 12.
Test-replica model of the largest airfoil compared with the physical test.
4. Scaled Wind Tunnel Assessment
To assess the CFD drag prediction experimentally, a scaled model of the front wing was 3D-printed in polylactic acid (PLA) on a Centauri Carbon 2 printer (Shenzhen Elegoo Technology Co., Ltd., Shenzhen, China) and tested in an Engineering Laboratory Design (ELD) Model 402B open-circuit wind tunnel (Engineering Laboratory Design, Inc., Lake City, MN, USA) with a 305 mm × 305 mm test section [61] (Figure 12). The scale factor λ = 0.16 (1:6.25) was chosen under approximate Reynolds similitude based on the main-element chord length (Lp = 0.25 m): the full-scale Reynolds number was calculated as Rep = ρVpLp/μ = 1.225 × 35 × 0.25/(1.7894 × 10−5) ≈ 5.99 × 10⁵, which satisfies the Rep > 105 condition required to apply approximate similitude [62]. Exact Reynolds similarity would require a tunnel velocity of Vp/λ ≈ 220 m/s, far above the tunnel limit, so approximate similitude was used instead. The tunnel velocity was then selected iteratively within the wind tunnel’s operational range (up to 53 m/s) so that the resulting model characteristic length, obtained by equating the scaled-down Reynolds number to the 105 target, remained compatible with the available 3D-printer bed dimensions (256 × 256 × 256 mm). With Vm = 37 m/s, setting Rem = 105 gives Lm = 105μ/(ρVm) = 0.0395 m, which was rounded up to 0.04 m, so that λ = Lm/Lp = 0.16 and Rem ≈ 1.0 × 10⁵. At this scale, the 1500 mm full-scale span becomes 240 mm, within the 256 mm bed, which would allow at most λ ≈ 0.17; the resulting model was 240 mm wide and about 33 mm high.
Figure 12.
Scaled 3D-printed model installed in the Engineering Laboratory Design (ELD) open-circuit wind tunnel, mounted on the shrouded strut of the two-component balance.
Because the model Reynolds number at the achievable tunnel velocity was necessarily lower than the full-scale value, exact dynamic similitude could not be enforced across all non-dimensional parameters; the test therefore relied on approximate similitude rather than an exact scaling law. The model was mounted on the force strut of the tunnel’s two-component (lift and drag) balance, most of which is shielded from the airstream by a shroud [61]; the balance was calibrated before testing. Drag was measured directly; an attempt to measure downforce with the model inverted did not give a usable reading, so downforce was assessed through CFD, supported by the validation in Section 2.2.
The drag force measured on the model was first reduced to a model drag coefficient CD,m using the tunnel dynamic pressure and the model reference area, and then converted to a full-scale equivalent drag force FD = ½ρVp2ApCD,m, where Ap is the full-scale wing reference area and Vp = 35 m/s is the design velocity. Table 13 compares this full-scale equivalent with the full-scale CFD prediction. The deviation is attributed in Section 7 to the approximate similitude and to the absence of a ground plane in the tunnel rather than to a failure of the CFD model.
Table 13.
Full-scale equivalent drag from the wind tunnel test versus full-scale CFD.
The uncertainty of the full-scale equivalent drag was estimated by root-sum-square combination of the elementary uncertainties [63]; because the same air density is used at both scales, it cancels in the conversion. In the factory calibration, the drag channel of the balance reproduced the applied loads within about ±0.01 N [61], or about ±2% of the 0.55 N model drag. The tunnel velocity was set with the fan-frequency controller through the tunnel’s frequency–velocity calibration; with a stated velocity uniformity within ±1% [61], it was assigned an uncertainty of ±1.5%, which contributes about ±3% through the squared velocity ratio. The model and full-scale reference areas contribute about ±1%. The combined uncertainty is therefore about ±4%, or 19.1 ± 0.7 N (Table 13), which, together with the 4.8% discretization uncertainty of the CFD drag (Section 2.4.1), is far smaller than the 25.7% difference. Solid blockage was evaluated from the projected frontal area of the model, 3.0 × 103 mm2 (the full-scale value of 1.18 × 105 mm2 scaled by λ2), which is about 3.2% of the 305 mm × 305 mm test section; blockage corrections at this level are of the order of a few percent [64] and were not applied. A tare measurement of the exposed part of the strut was not performed, so the measured value also includes the drag of the short exposed strut and, if anything, overestimates the drag of the wing itself.
5. Manufacturing Methodology
The manufacturing route is documented in detail because it is the least-reported stage of the workflow. The wing was built as a foam-core sandwich structure with woven glass-fibre skins, bonded aluminium end-pieces on each airfoil, and machined aluminium endplates and midplates. With the material system established in Section 3, this section documents the process-selection trials, foam-core preparation, vacuum-consolidation workaround, and plate-and-connection design used to realize the full-scale wing under the available workshop constraints.
5.1. Fabric and Consolidation Process Selection
The 200 g/m2 plain weave and 162 g/m2 2 × 2 twill characterized in Section 3.1 were also evaluated for drape and surface conformity on the airfoil geometry. Although the plain weave showed the higher tensile strength, its tight one-over-one interlacing resisted drape and produced visible folds when forced onto the curved airfoil surface. The twill weave, with its longer float length, was substantially more compliant and therefore better suited to the required geometry.
The consolidation method was decided by a similar iteration: unvacuumed hand layup produced visible bubbles, weave sag, and low interfacial adhesion between the skin and the foam core; vacuum-bag consolidation eliminated the bubbles and weave sag and improved skin–core adhesion. The three trials are summarized in Table 14. For each trial, the table gives the fabric areal density, the tensile strength and failure strain measured on coupons of each fabric (Section 3.1), and the consolidation method, with measured pressure differentials of about 0.9 bar below atmospheric with the two-stage pump and 0.8 bar during the fume-hood consolidation of trial 3 (Section 5.3), and none for trial 2. The defects listed were identified by inspection, as the masses and thicknesses of the trial laminates were not recorded.
Table 14.
Manufacturing trials: measured indicators, observed defects and outcome.
The final process was 162 g/m2 twill glass fibre wet-laid with epoxy (Araldite LY 556 resin, Huntsman Advanced Materials, Basel, Switzerland, with Ricko-Cure 1018 hardener, Bodo Möller Chemie Egypt, Cairo, Egypt) at a nominal 2:1 resin-to-fibre mass ratio, over an expanded polystyrene (EPS) foam core, consolidated in a vacuum bag. With one ply of the 162 g/m2 fabric (E-glass density 2.55 g/cm3) in the 0.35 mm laminate, the fibre volume fraction is estimated at about 18%; the nominal mixing ratio gives 18–19% if all the applied resin is retained (cured resin density 1.15–1.20 g/cm3), so the two estimates are consistent. Neither is a measurement, however, and the void content could not be determined (Section 7). The resulting fabrication route, from the finalized geometry to the assembled wing, is summarized in Figure 13: branch A (composite airfoils) is detailed in Section 5.2 and Section 5.3, and branch B (endplates and midplates) in Section 5.4.
Figure 13.
Manufacturing workflow of the front wing, from the finalized computer-aided design (CAD) geometry to the assembled wing: (A) composite airfoils; (B) endplates and midplates. CNC, computer numerical control; EDM, electrical discharge machining; EPS, expanded polystyrene.
5.2. Foam Core Preparation
In step A1 (Figure 13), airfoil cores were cut from 30 kg/m3 EPS using a hot-wire foam cutter with a NACA 4412 template. The core defines and maintains the aerodynamic profile during layup and cure, and in service it supports the skin against local loads. In a flat sandwich panel, the core also separates the skins to raise the bending stiffness and transfers shear between them, stabilising them against buckling [43]; in the closed airfoil section, however, the skin already forms a closed shell that carries the bending load (Section 3.2). Low-density EPS was therefore chosen for weight and cost rather than crush strength, and the compressive stress it carries under the regulatory load is far below its compressive strength (Section 3.2).
Aluminium end-pieces were cut to the airfoil profile by wire electrical discharge machining (wire EDM), with their bolt holes CNC-machined, and bonded to the ends of each foam core using structural adhesive. These end-pieces (Figure 14) carry the bolt holes that later connect each airfoil to the endplates and midplates.
Figure 14.
Aluminium end-pieces for each airfoil (wire-EDM profile, CNC-machined bolt holes), prior to bonding to the foam cores.
5.3. Layup and Vacuum Consolidation Workaround
In step A2 (Figure 13), epoxy resin was applied by hand and rolled to an even distribution over the core before the fibre was placed, so that the vacuum line served only to evacuate air and a small quantity of excess resin (Figure 15). This is not a Vacuum-Assisted Resin Infusion (VARI) process, as the resin was not drawn through feed lines; it uses the vacuum bag only to provide consolidation pressure and interfacial bonding.
Figure 15.
Hand layup and rolling of the twill glass fibre skin over the EPS foam core.
The available vacuum pump was a two-stage unit (VE260N, Zhejiang Value Mechanical & Electrical Products Co., Ltd., Wenling, China; 0.56 kW; free-air displacement 3.3 L/s (7 CFM); ultimate vacuum 15 µm Hg) that could run continuously for only approximately 15 min before requiring cooldown. With the pump running, a dial vacuum gauge read approximately 0.9 bar below atmospheric. Epoxy cure time was several hours. Conventional vacuum bagging with the pump running until full cure was therefore not possible. The workaround adopted was to conduct final consolidation inside a laboratory fume hood: the hood’s vacuum line, connected to the bag through a resin trap, provides continuous suction for hours at a time (step A3 in Figure 13). A dial vacuum gauge on the resin trap read approximately 0.8 bar below atmospheric during consolidation, close to the one-atmosphere maximum that vacuum-bag consolidation can apply [43]. In this paper, “vacuum-assisted” refers to consolidation under these measured pressure differentials.
Using a fume-hood vacuum supply for curing is not itself new; the contribution is a documented adaptation of an academic-scale composite process to hardware-limited workshop conditions, a situation shared by many Formula Student teams.
5.4. Endplate and Midplate Design
The endplates and midplates (branch B in Figure 13) were fabricated as sandwich structures of two parallel 5083 aluminium sheets with a recycled-paper honeycomb core between them, in place of the composite sandwich panels originally intended in the design. Aluminium was chosen because CNC facilities capable of cutting fibre-reinforced composites were not available within the project constraints. The outer contour of each aluminium sheet was cut by wire EDM, and the bolt holes and adjustment slots were CNC-machined. The two-sheet layout also defines the load path: the outer plate carries counterbored holes matched to the head diameter of the fastening Allen bolts, so that the bolt heads sit flush inside the plate and press against internal aluminium brackets located between the two sheets, rather than reacting directly against the composite airfoil. The brackets distribute the clamping load over a larger surface area, avoiding local crushing of the foam-core airfoil where the bolts pass through. Figure 16 shows an endplate during assembly, with the outer sheet removed to expose the core and brackets.
Figure 16.
Endplate during assembly with the outer aluminium sheet removed, showing the recycled-paper core and the internal mounting brackets: two fixed holes for the first element and a pivot hole with curved slot for each of the second and third elements.
For the first airfoil, each plate carries two circular through-holes at fixed positions, locking the element in place as the geometric reference for the assembly. The second and third elements use one circular pivot hole and one curved slot per plate, allowing the trailing edge of each element to rotate through a bounded arc about the pivot. This provides a limited on-track adjustment range for the per-element angle of attack without additional hardware.
5.5. Cost and Resource Constraints
The front wing was manufactured under a fixed direct-material and consumables budget of 10,000 EGP, approximately USD 192 at the exchange rate of about 52 EGP per USD that prevailed during manufacture in 2026; this rate is used for all conversions in this paper. Recorded expenditure was 9840 EGP (USD 189), including raw materials, consumables, and fasteners (Table 15). Labor, university workshop equipment, and facility use were excluded because they were available to the team at no additional charge. The foam airfoils also carried no direct purchase cost because the required foam was supplied through university facilities. The reported value should therefore be interpreted as the direct manufacturing expenditure required to reproduce the selected route under comparable institutional access, rather than the full economic cost of the project.
Table 15.
Direct material and consumable cost breakdown for front-wing manufacture. USD values are converted at 52 EGP per USD and rounded individually.
6. Deflection Testing
Because of time and budget constraints, the physical test was limited to the largest airfoil of the manufactured wing rather than the full assembly. This element has the largest surface area, and therefore takes the largest share of the distributed regulatory load, and its skin, core and end-piece construction is common to all elements. The test was also deliberately more severe than the load case of Section 3.2: the full 200 N was applied to this single element as a concentrated load at mid-span, whereas in the assembled wing it carries only part of the load, distributed over its surface. The peak deflection of the assembled wing is predicted on the rear element of the outboard sections (Section 3.2), but at 0.91 mm it is small compared with the 3.25 mm measured in this more severe test. It was tested against FSAE T8.3.1 with its aluminium end-pieces bolted to a purpose-built compressed-plywood rig. A 200 N load was applied through stacked weight discs resting on the upper surface at mid-span, and the resulting downward deflection was measured by a dial test indicator with a magnetic base (Figure 17).
Figure 17.
Deflection test rig with the 200 N load (stacked weight discs) applied at mid-span of the largest airfoil; deflection is read by the dial test indicator beneath.
The measured deflection was 3.25 mm, well below the 10 mm regulatory limit. The test-replica model, which reproduces the loading of the test and brackets its support condition, predicted 1.26–1.60 mm at the gauge position (Table 12); the difference is discussed in Section 7. The final assembled wing (Figure 18) had a measured mass of 8.5 kg and a recorded direct manufacturing expenditure of USD 189, within the predefined USD 192 budget.
Figure 18.
Final manufactured front wing assembly.
7. Discussion and Limitations
Two limitations of the study warrant explicit discussion. In addition, downforce was not measured experimentally and was assessed through CFD, supported by the validation against measured ground-effect forces in Section 2.2, and the structural test was performed on a single airfoil rather than the full assembly because of time and budget constraints.
Wind tunnel similarity. Given the 25.7% drag deviation between the tunnel and CFD (Table 13), the tunnel test cannot be regarded as a strict validation of the CFD model. The scale factor λ = 0.16 was fixed by the combination of tunnel operating range and 3D-printer bed size, and at the achievable tunnel velocity the model Reynolds number was substantially lower than the full-scale value. Boundary-layer transition points, skin friction, and separation behaviour therefore differ between model and prototype: at Re ≈ 1 × 10⁵ the boundary layers on the model remain laminar over a larger part of the chord than in the fully turbulent full-scale CFD, which lowers skin-friction drag, although laminar separation may partly offset this through higher pressure drag. The validation case of Section 2.2 supports this: even at Re ≈ 7.5 × 10⁵, the fully turbulent model overpredicted the drag of the free-transition wing by about 10%, and the effect is expected to be larger at the model Reynolds number. In addition, the model was tested on the balance strut away from the tunnel floor, without a ground plane, whereas the full-scale CFD includes the ground effect of a moving road, which raises both downforce and induced drag. Both mismatches therefore tend to lower the measured drag relative to the CFD value, as observed. Because the measurement and discretization uncertainties (about 4% and 5%, Section 4) are much smaller than the 25.7% difference, and correcting for blockage and for the untared strut would lower the measured drag further, the difference is attributed mainly to these two mismatches. The tunnel result therefore confirms the drag level only qualitatively and is not used as a quantitative validation of the CFD; that role is taken by the ground-effect validation of Section 2.2. Future work should either use a larger tunnel to raise λ, or complement scaled tests with full-scale coast-down or on-track load measurements.
FEM idealization. The full-wing model and the physical test differ in loading (distributed over the wing face, against weight discs at mid-span of the isolated airfoil) and in support (fixed at the midplate faces, against an airfoil bolted at its ends to a plywood rig), so their deflections are not directly comparable. The fixed midplate faces of the full-wing model are also an idealization, since the bolted joints of the hand-laid assembly allow some rotation; in the test-replica model, releasing the rotational restraint (simply supported instead of clamped ends) increased the gauge-point deflection by 27%. The models further assume a homogeneous laminate thickness, which a hand-laid part does not reproduce exactly, and neither the fibre volume fraction nor the void content of the laminate was measured; their effect on the skin stiffness is, however, contained in the measured coupon modulus, obtained with the same fabric and resin system.
Test-replica model and physical test. The test-replica analyses (Table 12) remove the loading difference and bracket the rotational restraint of the supports, yet the measured 3.25 mm is 2.0 to 2.6 times their 1.26–1.60 mm, a difference of 1.65–1.99 mm. Several effects that the models do not represent act in the same direction, towards a more compliant test. First, the models fix the end-pieces in translation, whereas in the test the aluminium end-pieces were bolted to compressed plywood: clearance and slip at the bolts, bearing deformation of the plywood under the bolts and bending of the rig itself allow the ends to move downward. Because the dial indicator measured the lower surface relative to its magnetic base, any downward movement of the supports adds directly to the reading; a settlement of about 1.7–2.0 mm at the supports would close the difference on its own, but the support displacement was not recorded, so this contribution could not be separated. Second, the model applies the 200 N as a uniform pressure over the 220 mm patch, whereas rigid, flat weight discs resting on the curved upper surface bear mainly on the highest part of the profile, concentrating the load over a smaller area directly above the gauge. Third, the models assume perfect bonds between skins, cores and end-pieces; because the load passes from the skins into the end-pieces through the cores (Section 3.2), locally weak bonds in a hand-laid part, at the ends in particular, add rotation and slip at the supports. Fourth, the EPS core properties were taken from the database rather than measured, and because the core lies in this load path, a softer core than assumed would increase the deflection. Creep of the epoxy and EPS under the sustained weights, which a linear-elastic static model does not capture, may also have contributed, depending on the time between loading and reading. By contrast, correcting the apparent modulus (Section 3.1) would make the models stiffer, and the sensitivity study shows that the Poisson’s ratio of the skin has a negligible influence, so neither can explain the difference. Even if the full-wing prediction were increased by the same factor of 2.6, its maximum deflection would be about 2.4 mm, less than a quarter of the 10 mm limit, so the regulatory conclusion does not depend on these idealizations.
Future Work
Several directions follow directly from the limitations above and from the manufacturing trials documented in Section 5. Wind tunnel testing of the full-scale front wing above a moving ground is recommended as the most direct way to remove the Reynolds-number mismatch and scaling effects introduced by the scaled model used in this study. On the manufacturing side, adopting a more precise cutting method for the foam core, such as CNC hot-wire cutting with a controlled path, would avoid the thin, irregular trailing-edge sections produced by manual wire cutting, which were prone to chipping and left unsupported composite regions in the present part; more broadly, manufacturability constraints such as minimum trailing-edge thickness should be factored into the airfoil geometry selection during the design phase itself, rather than resolved during fabrication. Finally, access to CNC machines capable of cutting fibre-reinforced composites would allow the aluminium endplates to be replaced with composite sandwich panels as originally intended, reducing weight and improving the overall stiffness-to-weight ratio of the assembly [45,46]. Burn-off tests (ASTM D2584) on panels made with and without vacuum consolidation would quantify the fibre volume fraction and void content achieved by the fume-hood process. In future structural tests, the displacement of the supports should be recorded alongside the mid-span deflection, and coupon strain should be measured with an extensometer or strain gauges, which would remove the two main uncertainties of the structural comparison discussed above.
8. Conclusions
This work demonstrated an integrated design-to-validation methodology for a Formula Student front wing developed under a fixed consumables budget of approximately USD 192. A target-driven CFD workflow first explored a four-parameter two-element architecture; 3D verification yielded approximately 166 N of downforce, below the 260 N requirement, motivating a seven-parameter, 600-point DOE for a three-element configuration. Subsequent 3D refinement was predicted to produce 270.0 N of downforce, and whole-vehicle CFD returned a 40.7:59.3 front-to-rear split against the 40:60 target. The CFD method reproduced measured forces on a double-element wing in ground effect within 3% in downforce and 10% in drag, while a scaled wind tunnel test confirmed the drag level only qualitatively because of the Reynolds-number mismatch and the absence of a ground plane. The largest airfoil of the manufactured wing was then tested under the FSAE 200 N structural load, producing 3.25 mm deflection, well below the 10 mm limit; the finite element model of the full wing predicted 0.91 mm under the regulatory load, and a model of the test configuration predicted 1.26–1.60 mm, the remaining difference from the test being attributed mainly to compliance of the bolted joints and the rig.
The principal contribution is therefore the traceability and reproducibility of the complete workflow rather than novelty in any individual engineering tool. Vehicle-level targets, DOE-based aerodynamic design, 3D and whole-vehicle CFD, scaled aerodynamic assessment, material characterization, experimentally informed FEM, low-cost manufacture, and physical structural verification are connected within one sequence (Figure 1). The wing was manufactured for USD 189 against the USD 192 budget, with the manufacturing route and resource-driven substitutions documented alongside their realized structural outcome. This compact integration of design inputs, manufacturing decisions, cost control, and physical verification is intended as a practical reference methodology for Formula Student teams seeking to reproduce a comparable development process with limited manufacturing and testing infrastructure and, more generally, for the development of aerodynamic components under similar resource constraints.
Author Contributions
Conceptualization, O.H., M.Y. and O.A.; methodology, M.Y., J.H. and V.S.; software, M.Y., V.S., J.H., Y.A. and M.E.-T.; validation, V.S.; formal analysis, Y.A., O.H., M.Y., V.S., M.E.-T. and J.H.; investigation, Y.A., O.H., M.Y., V.S., M.E.-T. and J.H.; resources, M.S. and O.A.; data curation, V.S. and M.Y.; writing—original draft preparation, M.Y., V.S., M.E.-T., J.H., Y.A. and O.H.; writing—review and editing, M.Y., V.S., M.E.-T., J.H., Y.A., O.H., M.S. and O.A.; visualization, Y.A., J.H., M.Y., V.S. and M.E.-T.; supervision, M.S. and O.A.; project administration, M.S. and O.A.; funding acquisition, M.S. and O.A. All authors have read and agreed to the published version of the manuscript.
Funding
This research was funded by The American University in Cairo, Department of Mechanical Engineering, through a project budget of 10,000 EGP (approximately USD 192). The APC was funded by The American University in Cairo.
Institutional Review Board Statement
Not applicable.
Informed Consent Statement
Not applicable.
Data Availability Statement
The original contributions presented in this study are included in the article. Further inquiries, including requests for the retained simulation and test data, can be directed to the corresponding author. The complete raw simulation output was not retained.
Acknowledgments
The authors acknowledge Performance Visual Arts (PVA) for their support during the manufacturing phase, and the American University in Cairo Mechanical Engineering Department for facilities access. During the preparation of this manuscript, the authors used Claude (Anthropic; Claude Opus 5.5) for the purposes of literature searching, reference checking, manuscript formatting, and drafting and editing of text during revision. The authors have reviewed and edited the output and take full responsibility for the content of this publication.
Conflicts of Interest
The authors declare no conflicts of interest. The funders had no role in the design of the study; in the collection, analyses, or interpretation of data; in the writing of the manuscript; or in the decision to publish the results.
References
- Hokkanen, H.M. Aerodynamic Development of a Formula Student Front Wing: Performance out of Thin Air; Degree Project (First Cycle); KTH Royal Institute of Technology: Stockholm, Sweden, 2024; TRITA-SCI-GRU 2024:213. [Google Scholar]
- Chudi, L.Z.; Szlivka, F.; Fekete, G.; Molnár, I. Aerodynamic Design and Simulation of a Racing Car with Regard to the Front Wing. Eng. Proc. 2025, 113, 62. [Google Scholar] [CrossRef] [Scilit]
- Chand, D.V.; Sriram, R.; Udaya Kumar, D. Aerodynamic Analysis of Multi Element Airfoil. Int. J. Sci. Res. Publ. 2016, 6, 305–310. [Google Scholar]
- Angelini, L. Aerodynamic Design and Production of the Front Wing for Formula Student Vehicle. Master’s Thesis, Politecnico di Torino, Turin, Italy, 2019. [Google Scholar]
- Leali, M. The Influence of Endplate Geometry and Tip Structure on Wheel Wake Aerodynamics. Master’s Thesis, Politecnico di Milano, Milan, Italy, 2021. [Google Scholar]
- Savage, G. Composite Materials Technology in Formula 1 Motor Racing; Honda Racing F1 Team. 2008. Available online: https://www.formula1-dictionary.net/Big/Composite%20Materials%20Technology%20in%20Formula%201%20Motor%20Racing.pdf (accessed on 28 September 2026).
- Hou, X. Evolution of the Formula One Front Wing Assembly. 2024. Available online: https://www.researchgate.net/publication/385516738 (accessed on 28 September 2026).
- Katz, J. Aerodynamics of Race Cars. Annu. Rev. Fluid Mech. 2006, 38, 27–63. [Google Scholar] [CrossRef] [Scilit]
- Zerihan, J.; Zhang, X. Aerodynamics of a Single Element Wing in Ground Effect. J. Aircr. 2000, 37, 1058–1064. [Google Scholar] [CrossRef] [Scilit] [PubMed]
- Zhang, X.; Toet, W.; Zerihan, J. Ground Effect Aerodynamics of Race Cars. Appl. Mech. Rev. 2006, 59, 33–49. [Google Scholar] [CrossRef] [Scilit]
- Zhang, X.; Zerihan, J. Aerodynamics of a Double-Element Wing in Ground Effect. AIAA J. 2003, 41, 1007–1016. [Google Scholar] [CrossRef] [Scilit] [PubMed]
- Smith, A.M.O. High-Lift Aerodynamics. J. Aircr. 1975, 12, 501–530. [Google Scholar] [CrossRef] [Scilit] [PubMed]
- Epple, P.; Essler, T.; Bloch, G.; Below, V.; Gast, S. Aerodynamic Devices for Formula Student Race Cars. In Proceedings of the ASME 2014 International Mechanical Engineering Congress and Exposition, Montreal, QC, Canada, 14–20 November 2014; Fluids Engineering Systems and Technologies; Volume 7. [Google Scholar] [CrossRef] [Scilit]
- Epple, P.; Hellmuth, M.; Gast, S. Ground Effect on Wings for Formula Student Race Cars. In Proceedings of the ASME 2017 International Mechanical Engineering Congress and Exposition, Tampa, FL, USA, 3–9 November 2017; Volume 7. [Google Scholar] [CrossRef] [Scilit]
- Jasper, M.; Rudell, K.; Sakurai, H. The Application of Design of Experiments to CFD Studies of Racecar Wing Configurations; SAE Technical Paper 2006-01-3645; SAE International: Warrendale, PA, USA, 2006. [Google Scholar] [CrossRef] [Scilit]
- Wang, H.; Bai, Q.; Hao, X.; Hua, L.; Meng, Z. Genetic Algorithm-Based Optimization Design Method of the Formula SAE Racing Car’s Rear Wing. Proc. Inst. Mech. Eng. Part C J. Mech. Eng. Sci. 2018, 232, 1255–1269. [Google Scholar] [CrossRef] [Scilit]
- Kelly, D.; Batty, J.; Carrel-Billiard, T.; Cybulsky, A.; Viala, L.; Dumas, Y.; Visconti, N.; Mountassir, M. Computational-Based Aerodynamic Design for a Formula SAE Vehicle. SAE Int. J. Passeng. Cars-Mech. Syst. 2018, 11, 35–44. [Google Scholar] [CrossRef] [Scilit]
- Ratterman, A.J.; Paul, R.C. The Aerodynamic Optimization of a Multi-Element Wing for a Formula SAE Car. In Proceedings of the AIAA Region VI Student Conference, Stillwater, OK, USA, 5–6 April 2024. [Google Scholar] [CrossRef] [Scilit]
- Way, J.R.; Cho, S.G.; Feier, I.I. Parametric Optimization of an Aerodynamically Active Front Wing for a Formula SAE Competition Car. In Proceedings of the AIAA SCITECH 2025 Forum, Orlando, FL, USA, 6–10 January 2025. AIAA 2025-1470. [Google Scholar] [CrossRef] [Scilit]
- Suvanjumrat, C.; Namchanthra, S.; Phengpom, T.; Priyadumkol, J.; Chookaew, W.; Watechagit, S.; Cheung, S.C.P.; Promtong, M. AI-Assisted CFD Optimisation of Multi-Element Wing Angle of Attack for Enhanced Formula SAE Aerodynamic Performance. Int. J. Thermofluids 2025, 30, 101440. [Google Scholar] [CrossRef] [Scilit]
- Piszczatowski, A.; Kmiotek, M.; Kordos, A.; Zaremba, A. Modeling of the Front Wing Cross-Section for a Formula Student Vehicle. Adv. Sci. Technol. Res. J. 2026, 20, 93–106. [Google Scholar] [CrossRef] [Scilit]
- Souza Dourado, G.; Hayashi, M.T. Optimization of a 2-D Multi-Element Rear Wing on a Formula 1 Car; SAE Technical Paper 2024-36-0103; SAE International: Warrendale, PA, USA, 2024. [Google Scholar] [CrossRef] [Scilit]
- Ben Moussa, L.; El Khalfi, A.; Seddouki, A.; Vlase, S.; Scutaru, M. Front Bumper Inclination on Vehicle Aerodynamic Performance: A Parametric Optimization Analysis. Vehicles 2025, 7, 130. [Google Scholar] [CrossRef] [Scilit]
- Szudarek, M.; Piechna, J. CFD Analysis of the Influence of the Front Wing Setup on a Time Attack Sports Car’s Aerodynamics. Energies 2021, 14, 7907. [Google Scholar] [CrossRef] [Scilit]
- Wordley, S.; Saunders, J. Aerodynamics for Formula SAE: A Numerical, Wind Tunnel and On-Track Study; SAE Technical Paper 2006-01-0808; SAE International: Warrendale, PA, USA, 2006. [Google Scholar] [CrossRef] [Scilit]
- Wordley, S.; Pettigrew, J.; Saunders, J. Aerodynamics for Formula SAE: On-Track Performance Evaluation; SAE Technical Paper 2007-01-0897; SAE International: Warrendale, PA, USA, 2007. [Google Scholar] [CrossRef] [Scilit]
- Abid, M.; Wajid, H.; Iqbal, M.; Najam, S.; Arshad, A.; Ahmad, A. Design and Analysis of an Aerodynamic Downforce Package for a Formula Student Race Car. IIUM Eng. J. 2017, 18, 212–224. [Google Scholar] [CrossRef] [Scilit]
- Pacheco, J.; Marta, A.C.; Eça, L. Wind Tunnel Testing of a Formula Student Vehicle for Checking CFD Simulation Trends. Proc. Inst. Mech. Eng. Part D J. Automob. Eng. 2024, 238, 4347–4363. [Google Scholar] [CrossRef] [Scilit]
- Borgialli, L. Validation of CFD Model in Wind Tunnel and Study of Aerodynamic Maps. Master’s Thesis, Politecnico di Torino, Turin, Italy, 2023. [Google Scholar]
- Krbat’a, M.; Fekiač, J.; Kohutiar, M.; Malý, M.; Mikuš, P. Design and Optimization of the Front Wing for Formula Student Monopost. Adv. Sci. Technol. 2025, 167, 3–13. [Google Scholar] [CrossRef] [Scilit]
- Kuttasirisuk, N.; Munikanon, P.; Ajavakom, N.; De Silva, P.; Phanomchoeng, G. Simulation-Guided Aerodynamic Design and Scaled Verification for High-Performance Sports Cars. Modelling 2025, 6, 105. [Google Scholar] [CrossRef] [Scilit]
- Hamilton, L.; Joyce, P.; Forero, C.; McDonald, M. Production of a Composite Monocoque Frame for a Formula SAE Racecar; SAE Technical Paper 2013-01-1173; SAE International: Warrendale, PA, USA, 2013. [Google Scholar] [CrossRef] [Scilit]
- Sratong-on, P.; Wanthong, S. Finite Element Analysis and Experimental Investigation of the Mechanical Performance of a Full-Body Composite Monocoque Chassis for a Racecar; SAE Technical Paper 2021-01-5071; SAE International: Warrendale, PA, USA, 2021. [Google Scholar] [CrossRef] [Scilit]
- Capata, R.; Martellucci, L.; Buccolini, D.; De Felice, C.; Giannini, M. Validation Method of Torsional Stiffness for a Single-Seater Car Chassis. World Electr. Veh. J. 2025, 16, 604. [Google Scholar] [CrossRef] [Scilit]
- Bársony, D.; Kaszab, M.; Feszty, D. An Iterative Method for the Design of Carbon-Fiber Reinforced Polymer Wheel Rims. Appl. Sci. 2025, 15, 11434. [Google Scholar] [CrossRef] [Scilit]
- Klemt, K.; Bogenfeld, R.; Lefèvre, J.; Türke, L. Conceptualization Design and Analysis of Lightweight Composite Rims for a Formula Student Race Car with a Review of Existing Concepts. Discov. Appl. Sci. 2026, 8, 296. [Google Scholar] [CrossRef] [Scilit]
- Hunar, M.; Jancar, L.; Krzikalla, D.; Kaprinay, D.; Srnicek, D. Comprehensive View on Racing Car Upright Design and Manufacturing. Symmetry 2020, 12, 1020. [Google Scholar] [CrossRef] [Scilit]
- Sriraam, A.G.; Aggarwal, S.; Aulakh, S.S.; Adarsh, J.N.; Singh, S.K. An Access for Designing and Manufacturing of Aerodynamics Wings for a FSAE Vehicle. Int. J. Recent Technol. Eng. 2019, 8, 7340–7350. [Google Scholar] [CrossRef] [Scilit]
- Torres, M.; Piedra, S.; Ledesma, S.; Escalante-Velázquez, C.A.; Angelucci, G. Manufacturing Process of High Performance–Low Cost Composite Structures for Light Sport Aircrafts. Aerospace 2019, 6, 11. [Google Scholar] [CrossRef] [Scilit]
- Abdurohman, K.; Satrio, T.; Muzayadah, N.L.; Teten. A Comparison Process between Hand Lay-Up, Vacuum Infusion and Vacuum Bagging Method toward E-Glass EW 185/Lycal Composites. J. Phys. Conf. Ser. 2018, 1130, 012018. [Google Scholar] [CrossRef] [Scilit]
- Rydarowski, H.; Koziol, M. Repeatability of Glass Fiber Reinforced Polymer Laminate Panels Manufactured by Hand Lay-Up and Vacuum-Assisted Resin Infusion. J. Compos. Mater. 2015, 49, 573–586. [Google Scholar] [CrossRef] [Scilit]
- Stringer, L. Optimization of the Wet Lay-Up/Vacuum Bag Process for the Fabrication of Carbon Fibre Epoxy Composites with High Fibre Fraction and Low Void Content. Composites 1989, 20, 441–452. [Google Scholar] [CrossRef] [Scilit]
- Mazumdar, S. Composites Manufacturing: Materials, Product, and Process Engineering, 1st ed.; CRC Press: Boca Raton, FL, USA, 2001. [Google Scholar]
- Yavuz, İ.; Şimşir, E.; Şenol, B. Investigation of Mechanical Behavior of Glass Fiber Reinforced Extruded Polystyrene Core Material Composites. RSC Adv. 2024, 14, 13311–13320. [Google Scholar] [CrossRef] [Scilit] [PubMed]
- Wang, J.; Shi, C.; Yang, N.; Sun, H.; Liu, Y.; Song, B. Strength, stiffness, and panel peeling strength of carbon fiber-reinforced composite sandwich structures with aluminum honeycomb cores for vehicle body. Compos. Struct. 2018, 184, 1189–1196. [Google Scholar] [CrossRef] [Scilit]
- Wolff, J.; Brysch, M.; Hühne, C. Validity check of an analytical dimensioning approach for potted insert load introductions in honeycomb sandwich panels. Compos. Struct. 2018, 202, 1195–1215. [Google Scholar] [CrossRef] [Scilit]
- Menter, F.R. Two-Equation Eddy-Viscosity Turbulence Models for Engineering Applications. AIAA J. 1994, 32, 1598–1605. [Google Scholar] [CrossRef] [Scilit] [PubMed]
- Nobre, T.; Santos, M.; Ahmed, M. Aerodynamic Performance Validation against Numerical and Experimental Data of the Coventry University Phoenix Racing Formula Student Car; Coventry University: Coventry, UK, 2024. [Google Scholar]
- Ahmed, S.R.; Ramm, G.; Faltin, G. Some Salient Features of the Time-Averaged Ground Vehicle Wake; SAE Technical Paper 840300; SAE International: Warrendale, PA, USA, 1984. [Google Scholar] [CrossRef] [Scilit] [PubMed]
- Guilmineau, E.; Deng, G.B.; Leroyer, A.; Queutey, P.; Visonneau, M.; Wackers, J. Assessment of hybrid RANS-LES formulations for flow simulation around the Ahmed body. Comput. Fluids 2018, 176, 302–319. [Google Scholar] [CrossRef] [Scilit]
- NASA Glenn Research Center. Examining Spatial (Grid) Convergence. NPARC Alliance Wind-US Verification and Validation Tutorial. 2021. Available online: https://www.grc.nasa.gov/www/wind/valid/tutorial/spatconv.html (accessed on 28 September 2026).
- Celik, I.B.; Ghia, U.; Roache, P.J.; Freitas, C.J.; Coleman, H.; Raad, P.E. Procedure for Estimation and Reporting of Uncertainty Due to Discretization in CFD Applications. J. Fluids Eng. 2008, 130, 078001. [Google Scholar] [CrossRef] [Scilit]
- Zerihan, J. An Investigation into the Aerodynamics of Wings in Ground Effect. Ph.D. Thesis, University of Southampton, Southampton, UK, 2001. Available online: https://eprints.soton.ac.uk/426058/ (accessed on 30 October 2026).
- Doig, G.; Barber, T.J. Considerations for Numerical Modeling of Inverted Wings in Ground Effect. AIAA J. 2011, 49, 2330–2333. [Google Scholar] [CrossRef] [Scilit]
- Patel, D.; Garmory, A.; Passmore, M. The Effect of Cornering on the Aerodynamics of a Multi-Element Wing in Ground Effect. Fluids 2021, 6, 3. [Google Scholar] [CrossRef] [Scilit]
- Roberts, L.S.; Finnis, M.V.; Knowles, K. Modelling Boundary-Layer Transition on Wings Operating in Ground Effect at Low Reynolds Numbers. Proc. Inst. Mech. Eng. Part D J. Automob. Eng. 2019, 233, 2820–2837. [Google Scholar] [CrossRef] [Scilit]
- Wordley, S.; Saunders, J. Aerodynamics for Formula SAE: Initial Design and Performance Prediction; SAE Technical Paper 2006-01-0806; SAE International: Warrendale, PA, USA, 2006. [Google Scholar] [CrossRef] [Scilit]
- Dahlberg, H. Aerodynamic Development of Formula Student Race Car. Bachelor’s Thesis, KTH Royal Institute of Technology, Stockholm, Sweden, 2014. [Google Scholar]
- Formula Student Germany. Formula Student Rules 2026, Version 1.1; Formula Student Germany: Hockenheim, Germany, 2026. [Google Scholar]
- ASTM D3039/D3039M-08; Standard Test Method for Tensile Properties of Polymer Matrix Composite Materials. ASTM International: West Conshohocken, PA, USA, 2008.
- ELD Inc. Model 402B 12-Inch Open Circuit Wind Tunnel: Installation, Operation and Maintenance Instructions; ELD Inc.: Lake City, MN, USA, 2002. [Google Scholar]
- Gerhart, P.M.; Gerhart, A.L.; Hochstein, J.I. Munson, Young and Okiishi’s Fundamentals of Fluid Mechanics, 8th ed.; Wiley: Hoboken, NJ, USA, 2016. [Google Scholar]
- Coleman, H.W.; Steele, W.G. Experimentation, Validation, and Uncertainty Analysis for Engineers, 4th ed.; Wiley: Hoboken, NJ, USA, 2018. [Google Scholar]
- Barlow, J.B.; Rae, W.H.; Pope, A. Low-Speed Wind Tunnel Testing, 3rd ed.; Wiley: New York, NY, USA, 1999. [Google Scholar]
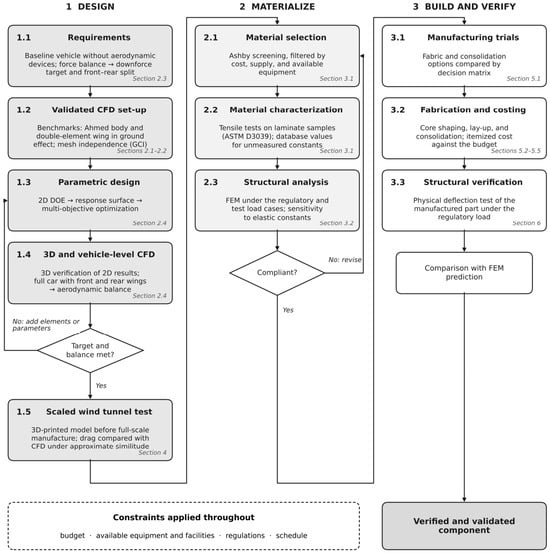
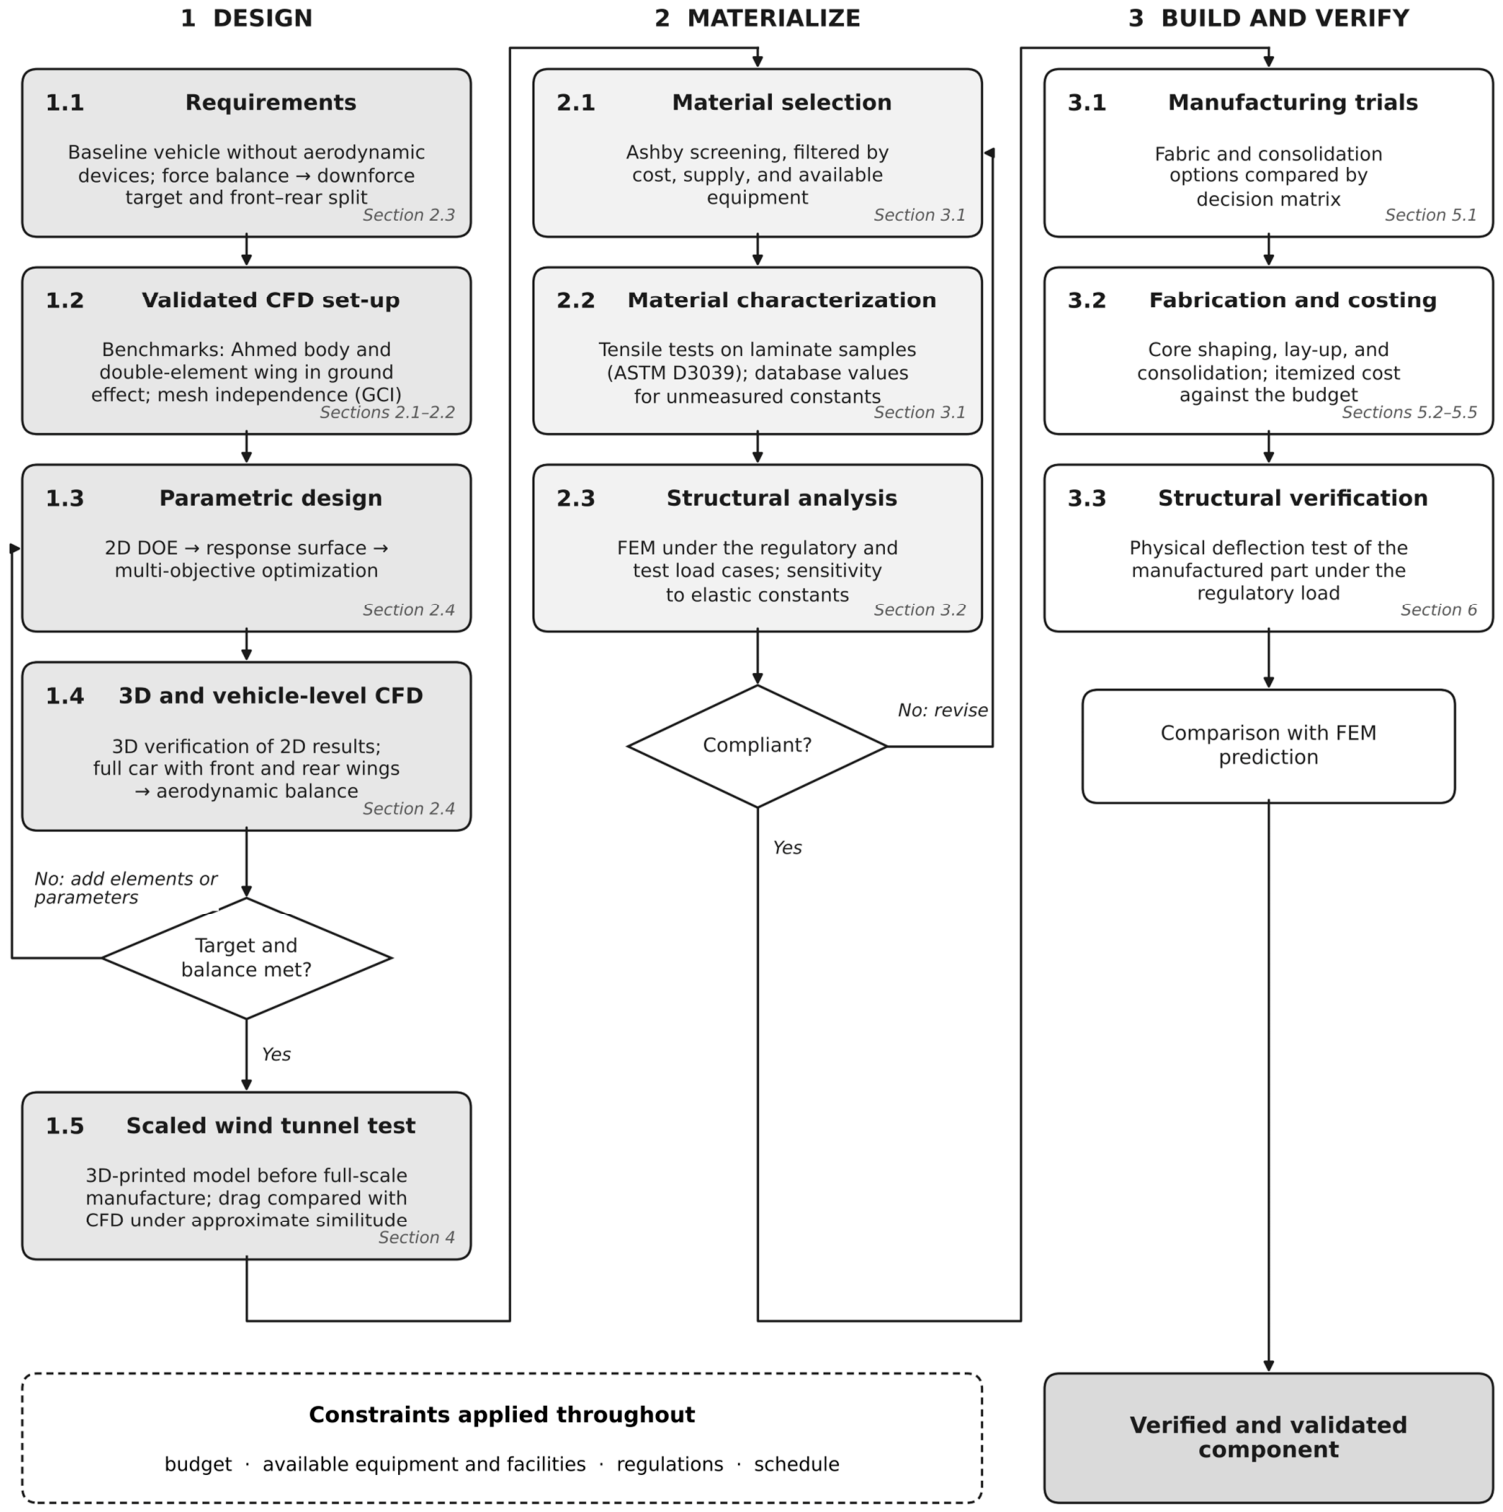
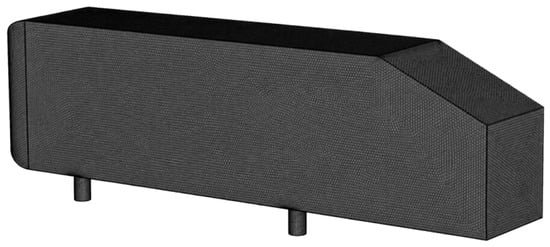
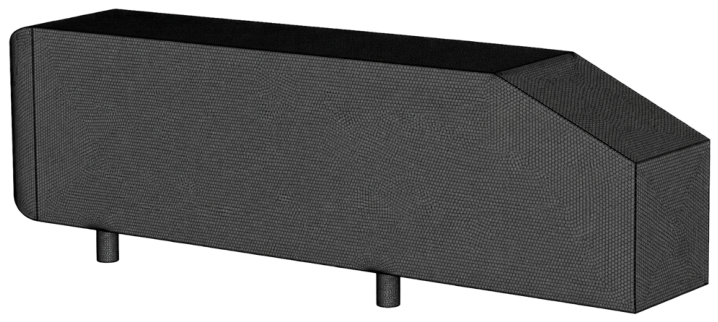
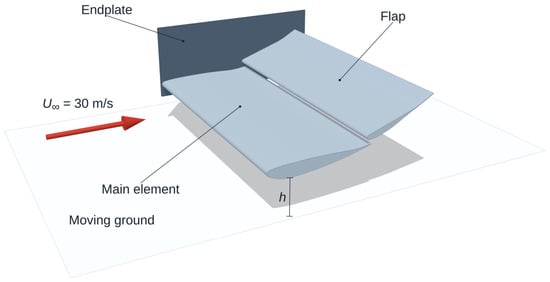
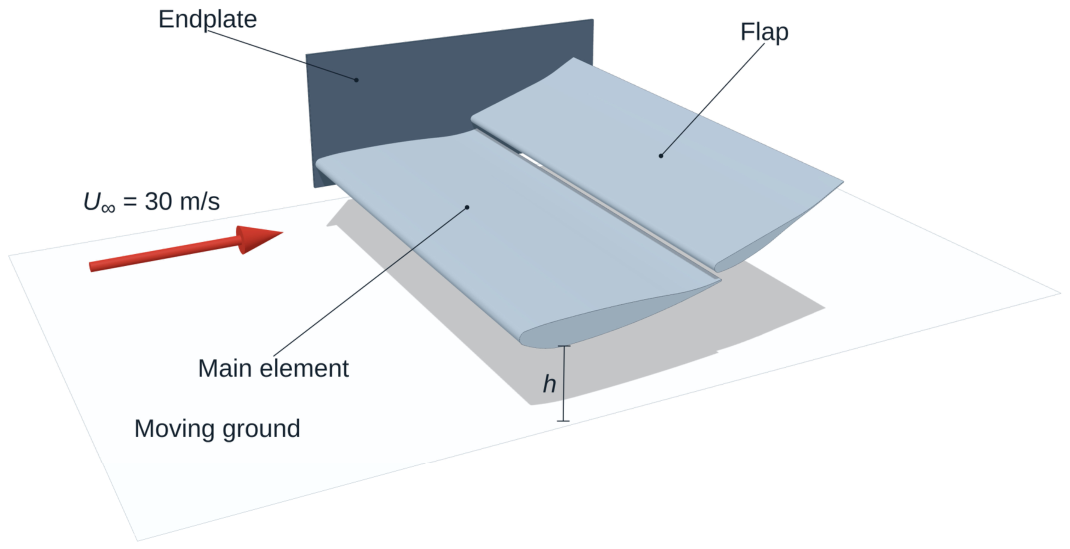
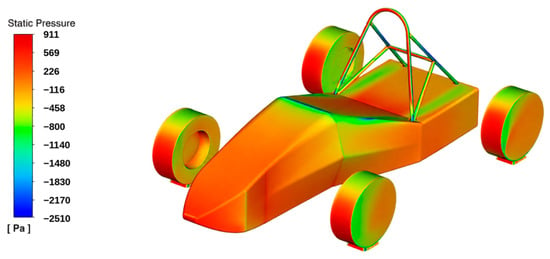
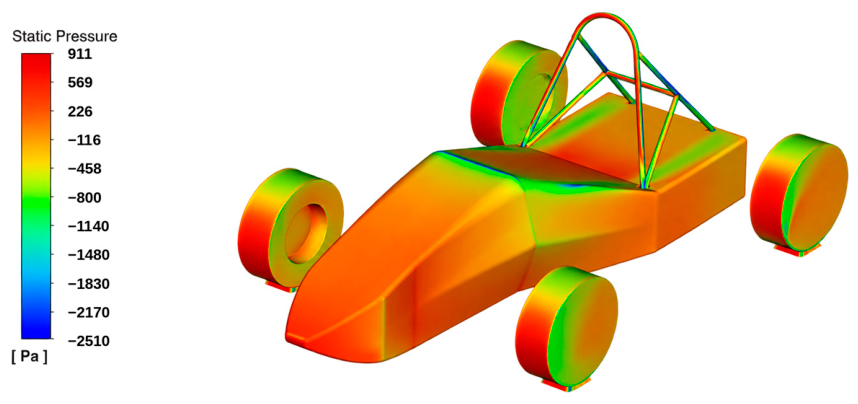
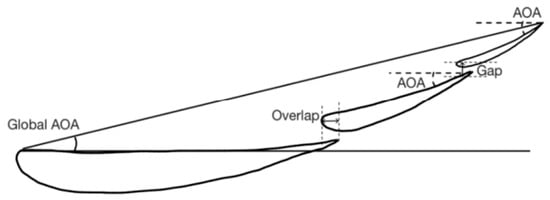
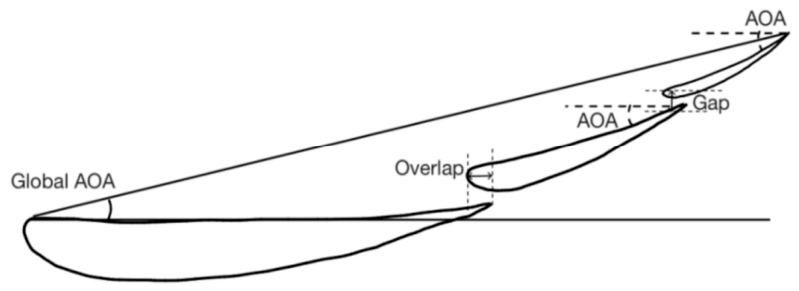
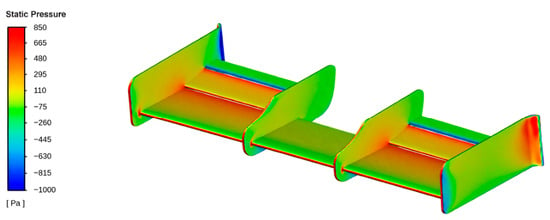
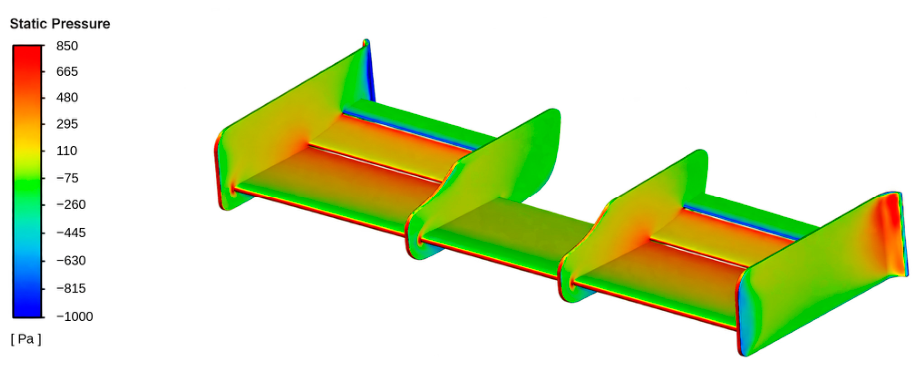
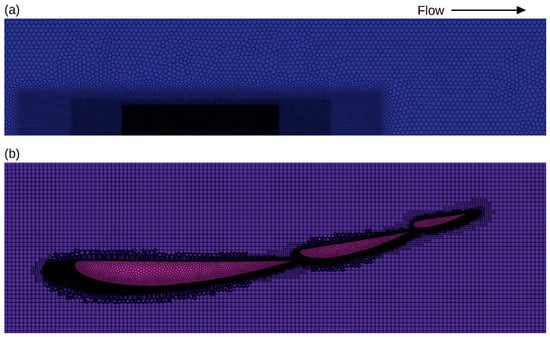
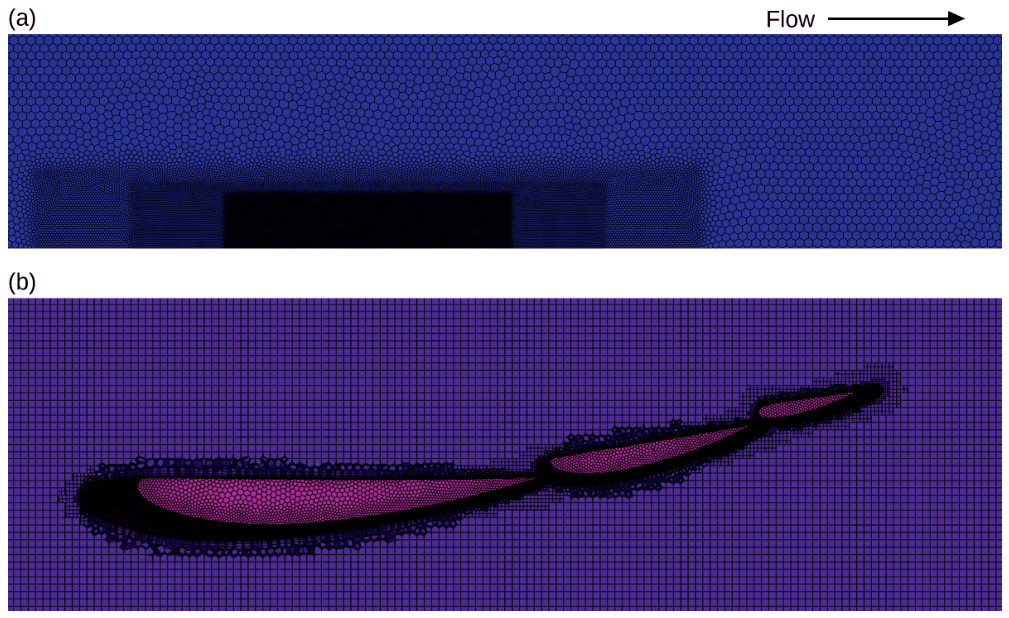
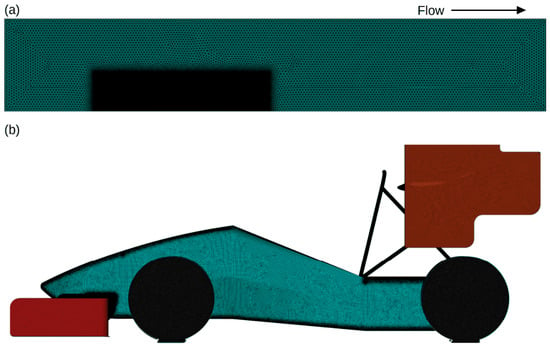
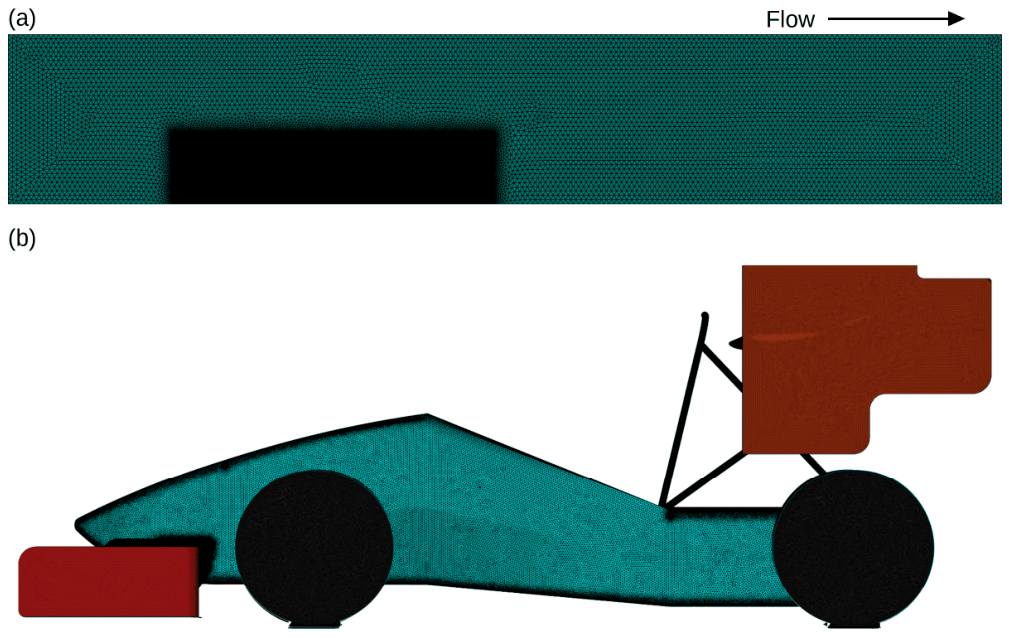
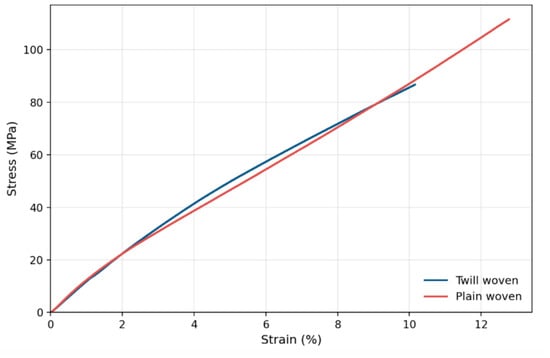
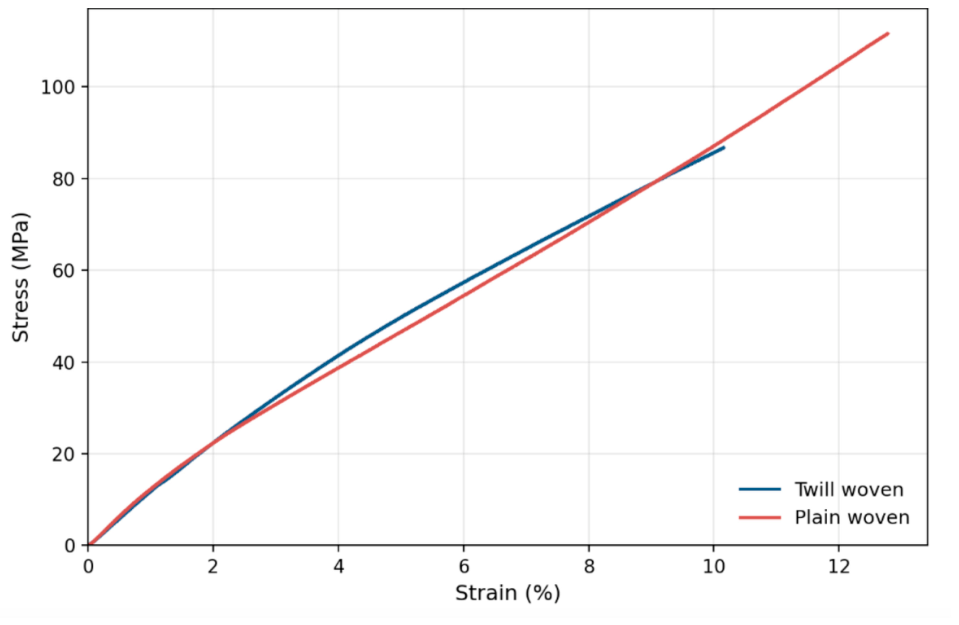
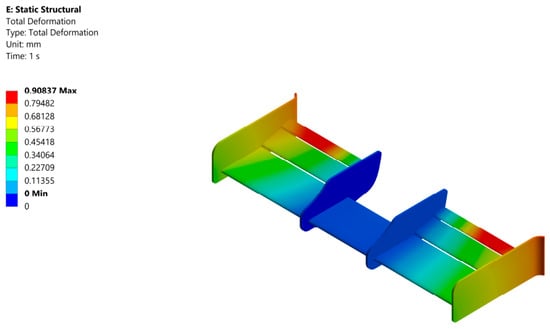
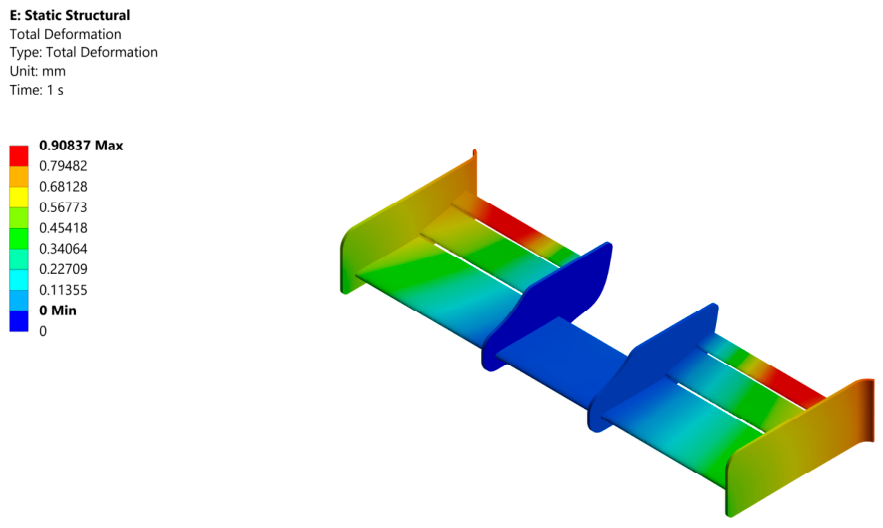
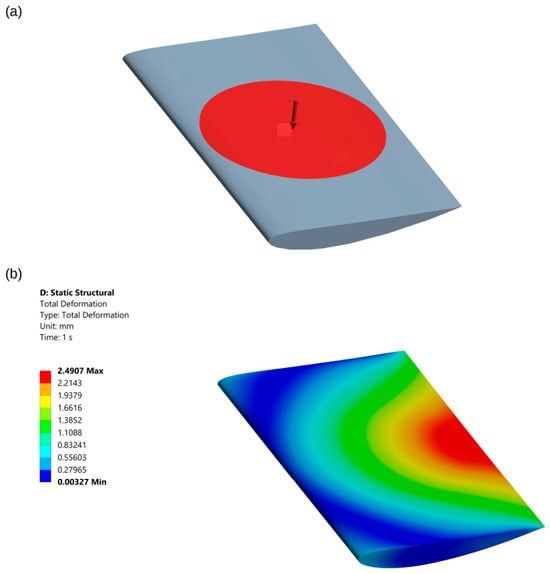
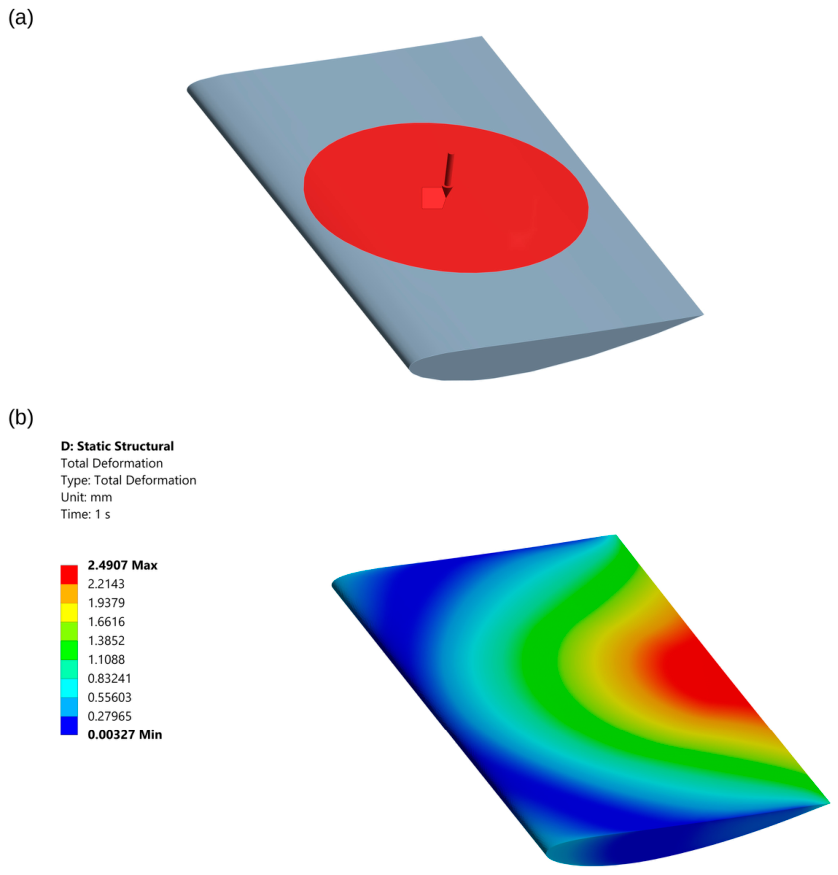
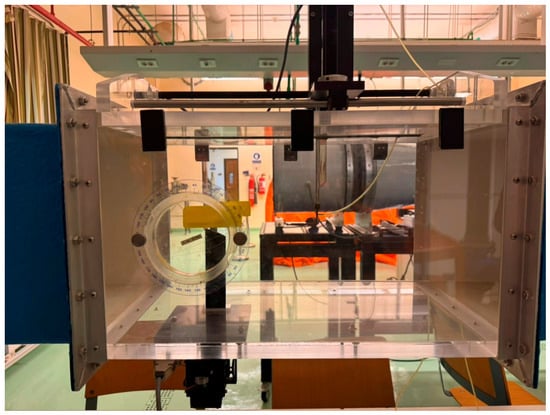
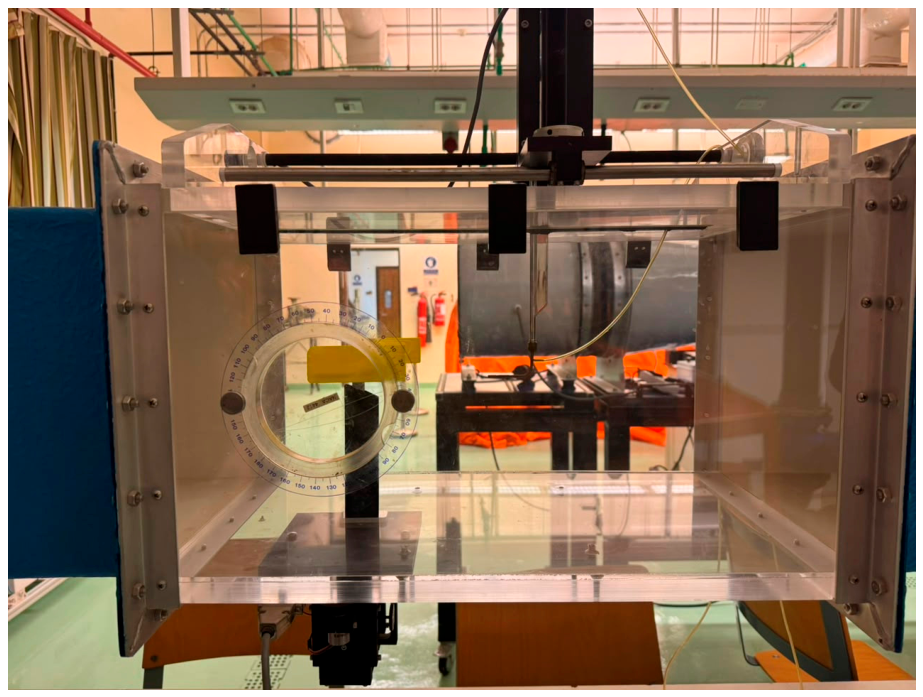
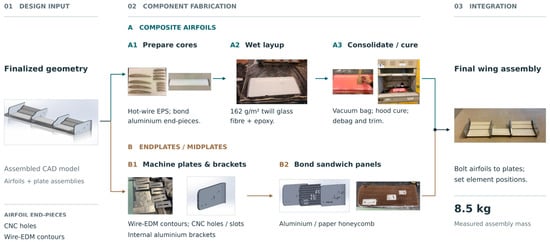
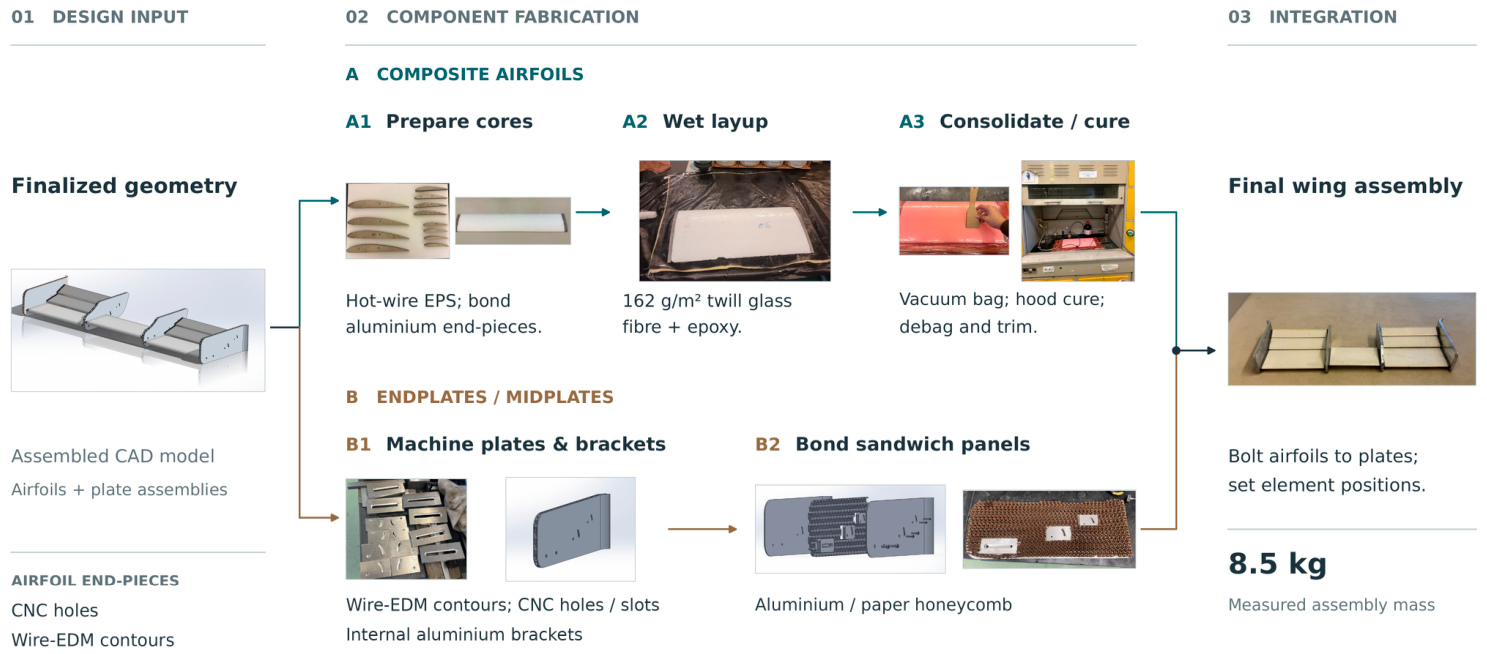
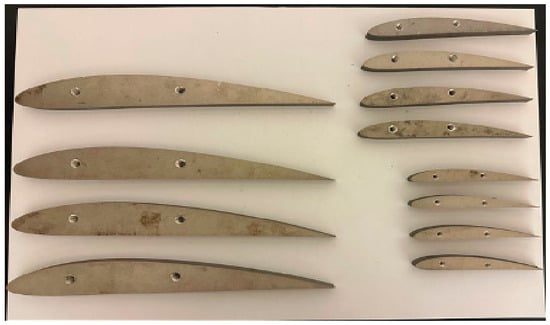
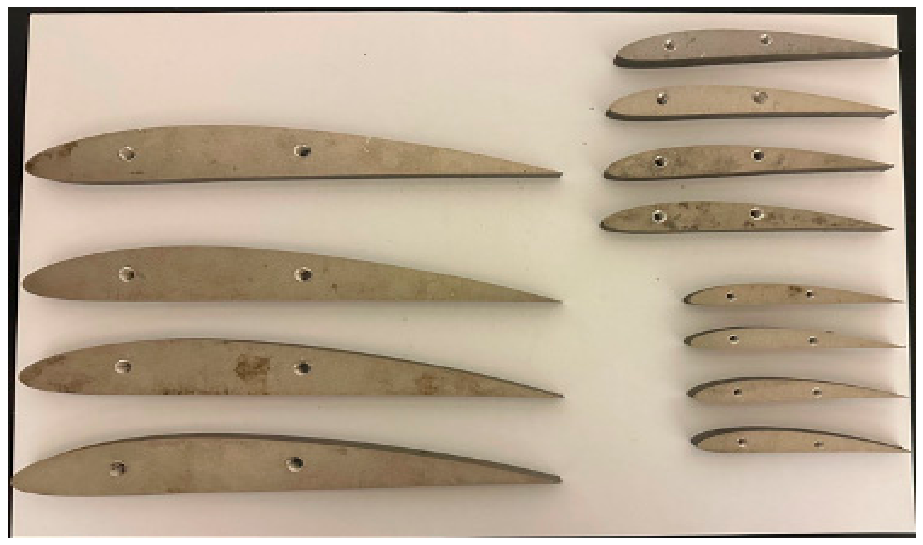
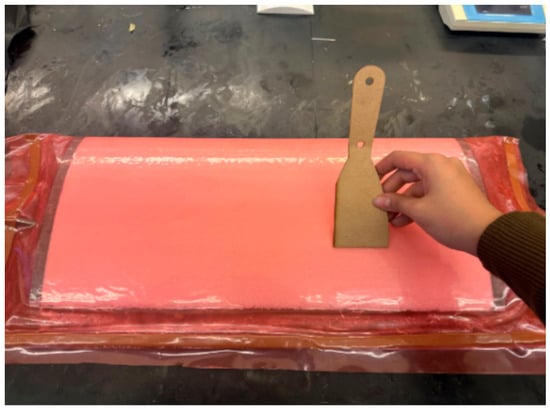
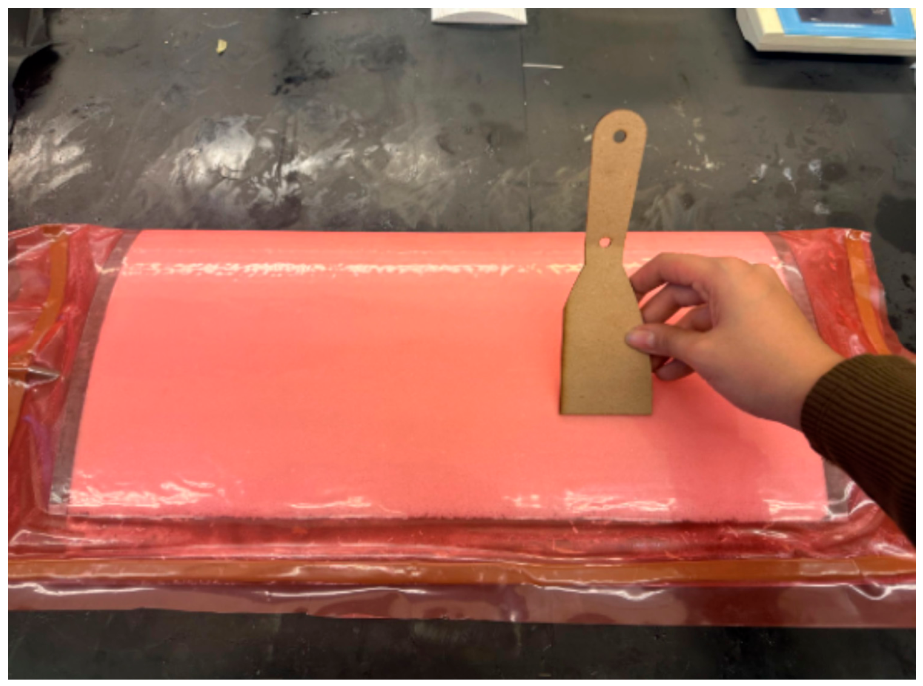
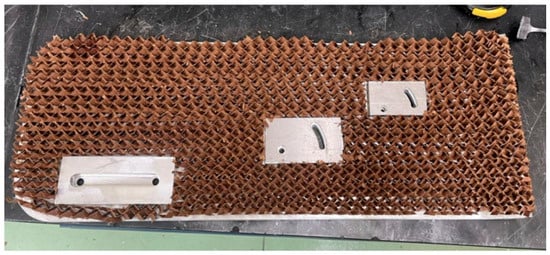
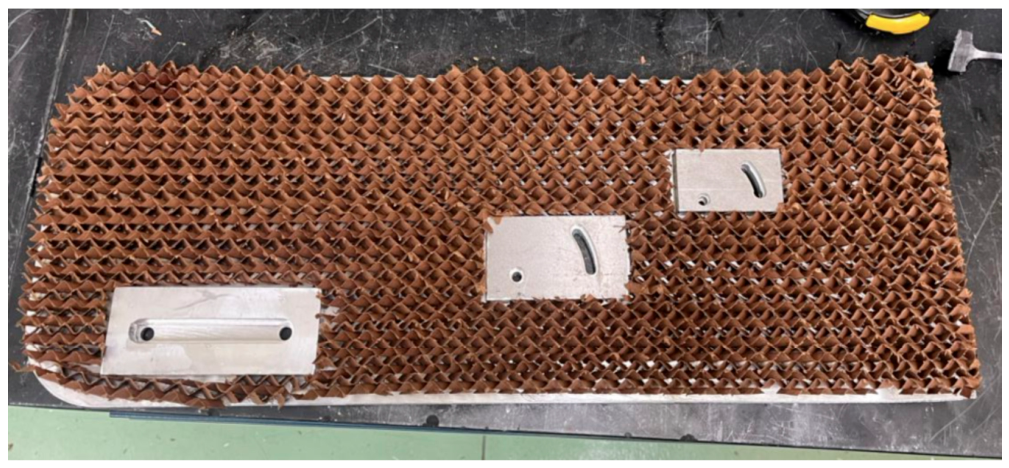
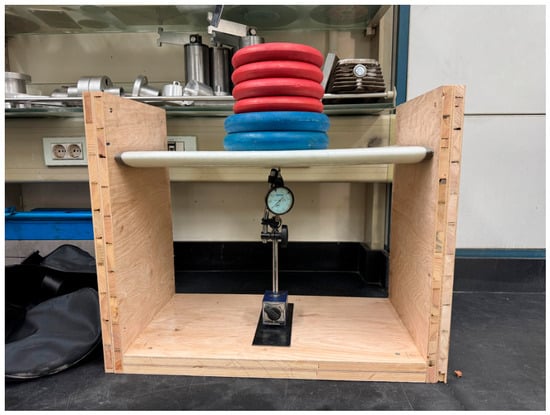
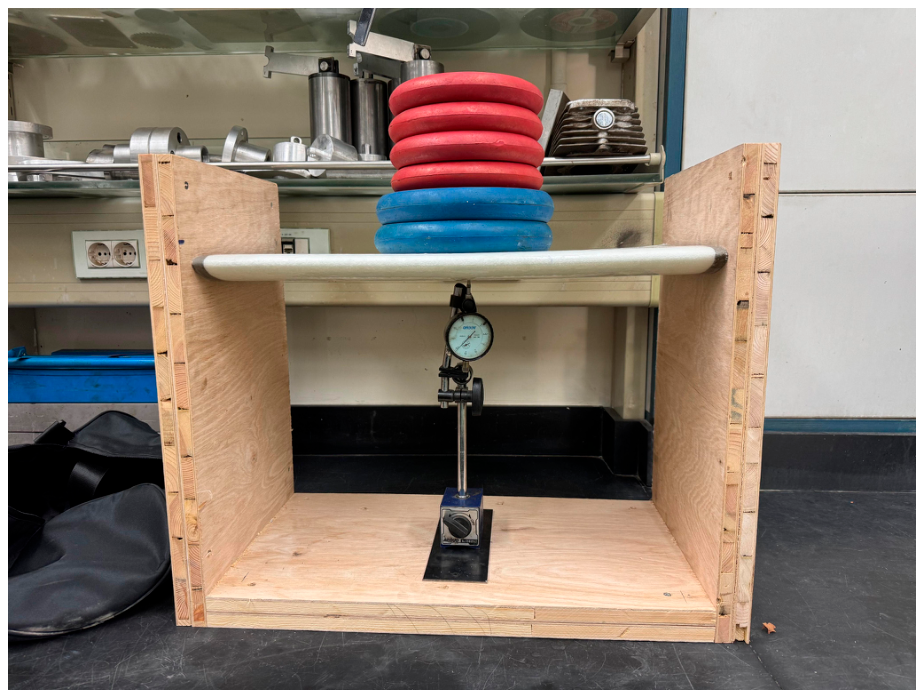
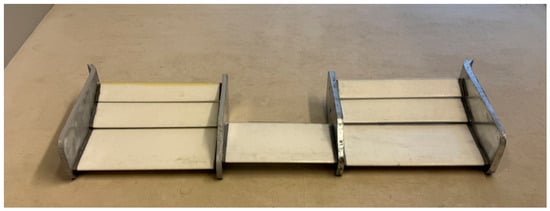
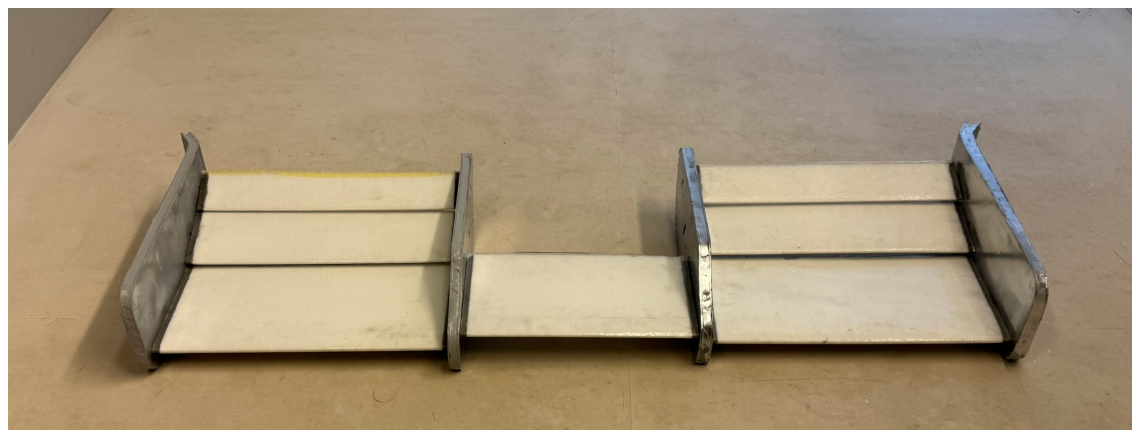

Disclaimer/Publisher’s Note: The statements, opinions and data contained in all publications are solely those of the individual author(s) and contributor(s) and not of MDPI and/or the editor(s). MDPI and/or the editor(s) disclaim responsibility for any injury to people or property resulting from any ideas, methods, instructions or products referred to in the content. |
© 2026 by the authors. Licensee MDPI, Basel, Switzerland. This article is an open access article distributed under the terms and conditions of the Creative Commons Attribution (CC BY) license.