


Abstract
Milk color reflects the optical output of a complex colloidal system governed by protein micelles, fat globules, and serum phase interactions. In this study, we evaluated whether CIE Lab* color parameters can explain variation in milk composition and somatic cell count (SCC) using Lasso-based multiple linear regression and Extreme Gradient Boosting (XGBoost). A total of 119 Holstein milk samples were analyzed for fat, protein, lactose, dry matter, electrical conductivity, freezing point, and SCC, and five color indices (L*, a*, b*, Hue, and Chroma) were used as predictors. Model robustness was evaluated using 10-fold cross-validation and an independent 80/20 train–test split. In regression analyses, Lasso explained 32.7% of protein variation (R2 = 0.327), 26.3% of dry matter (R2 = 0.263), 22.8% of lactose (R2 = 0.228), and 19.1% of fat (R2 = 0.191). Spectral tone parameters (a*, Hue, and Chroma) were consistently retained as key predictors, whereas L* showed a limited contribution. SCC exhibited weak direct associations with color traits but was significantly related to electrical conductivity (p < 0.05), indicating inflammation-driven ionic changes rather than pigment effects. In classification analysis (SCC ≥ 200,000 cells/mL), the XGBoost model achieved 74% accuracy and an AUC of 0.69 in the independent test set, with Chroma and electrical conductivity identified as the most influential features. These findings suggest that, among the evaluated color variables, Chroma provided the most relevant information for discriminating SCC status, whereas the overall contribution of milk color traits to compositional prediction remained moderate. Therefore, color-derived measurements should be interpreted as instrument-based optical indicators that may complement, but not replace, conventional milk quality assessments.
1. Introduction
Milk color is influenced by multiple biological and environmental factors, including genetic background, lactation stage, and udder health. For example, previous studies have reported that variations in milk fat content between approximately 2% and 6% can result in measurable changes in lightness (L*) values, while somatic cell count levels exceeding 200,000 cells/mL are associated with detectable alterations in the physical properties of milk [1,2]. Milk color is known to be affected by many factors, including animal genetic merit and breed [1], stage of lactation and parity [3], time of milking, and udder health status, as well as herd-level factors such as pasture grazing and seasonal calving [4,5]. Winkelman et al. [6] estimated genetic and phenotypic correlations of milk color traits (in terms of milk color, fat color, and β-carotene yield) with each other and with milk production traits (milk, fat, and protein yields). Milk color, in this case, was determined by the extraction of nonsaponifiable compounds from milk. Misawa et al. [7] concluded that objective measurement of whiteness showed correlations with several appearance, texture, and flavor sensory descriptors for low-fat milks. Increasing milk fat levels increased the L value (whiteness) of the milk and decreased the “a*” value (green to red) and “b*” value (blue to yellow), which correlated well with the perceived color of low-fat milk in sensory analysis [2]. The white appearance of milk is primarily due to light scattering by casein micelles and fat globules [8,9]. A large portion of the signal measured in the visible spectrum is of scattering origin, and this scattering behavior varies depending on particle size, content, and refractive index differences [8]. The optical behavior of milk is not determined by a single component, but instead by the physical organization of its colloidal structure and serum phase. In particular, casein micelles and fat globules differ in size, content, and refractive index relative to the surrounding serum, leading to multiple light scattering events. Variations in particle size distribution and spatial arrangement modify the scattering intensity and direction, which directly affects measurable color parameters such as L*, a*, and b*. Therefore, optical properties arise not only from chemical composition but also from the microstructural arrangement of the colloidal system [8,9]. Although the contributions of protein and fat phases to optical scattering have been defined, these relationships are generally complex and nonlinear due to the multi-component nature of the optical signal [10]. It has been reported that changes in mammary physiology, particularly through ionic balance and cellular content, can affect the physical environment of milk, and this can indirectly be reflected in its optical properties [1].
Machine learning approaches have been increasingly applied in dairy science to predict milk quality parameters and detect adulteration using algorithms such as support vector machines and neural networks. These approaches enable rapid, data-driven evaluation of milk characteristics; however, their application in linking optical milk color traits with compositional parameters and somatic cell counts remains limited [11,12,13]. The use of machine learning tools can facilitate the rapid assessment and estimation of parameters related to the quality of cow’s milk. In the recent past, machine learning approaches were used to predict the adulteration of cow’s milk through the use of support vector machines or neural network tools [11,12,14].
One of the most important applications of machine learning approaches in dairy science is the detection and monitoring of subclinical mastitis, a condition characterized by changes in milk composition and elevated somatic cell counts [14,15]. There is potential for the application of machine learning methodologies to predict bulk milk tank composition and monitor subclinical mastitis [9,16,17]. The primary objective of this study was to evaluate whether milk color parameters (CIELab: L*, a*, b*, Hue, and Chroma) can serve as optical indicators of milk quality traits, including milk composition and somatic cell count, using both linear (Lasso) and nonlinear (XGBoost) modeling approaches. We hypothesized that milk color parameters, particularly spectral tone indicators (a*, b*, Hue, and Chroma), are associated with milk composition and somatic cell count and can serve as indirect optical indicators of milk quality. In this study, machine learning models were applied to evaluate the relationship between milk color parameters and key milk quality traits, including milk composition and somatic cell count.
2. Materials and Methods
2.1. Animals, Housing, and Feeding
This study was conducted at the Cukurova University Faculty of Agriculture, Revolving Fund Dairy Cattle Research and Application Unit. Clinically healthy and physiologically comparable Holstein cows were used as animal material. The herd was housed in a free-stall open barn with a milking capacity of 200 cows. At the time of the study, 119 lactating cows were milked twice daily at 12 h intervals (morning and evening) using an automatic milking system in a central milking parlor. Cows were fed a total mixed ration (TMR), formulated with a roughage-to-concentrate ratio of 60:40. The roughage component consisted of corn silage (50%), alfalfa hay (25%), and wheat straw (25%). On average, each cow received 22 kg corn silage, 2 kg wheat straw, and 2 kg dried alfalfa (total roughage: 26 kg/day), supplemented with 8 kg concentrate feed (18% crude protein and 2650 kcal ME/kg), including 4 kg concentrate and 4 kg crushed feed. Additionally, approximately 4.5 kg of pelleted milk feed was supplied daily via an automatic feeder. TMR was prepared fresh daily and offered twice per day, at 07:00 and 16:00.
2.2. Milk Sampling and Chemical and Color Measurements
Milk samples were collected once from each lactating cow during the evening milking, yielding a total of 119 samples (one sample per cow). Samples were placed into 50 mL containers and transported to the laboratory under cold-chain conditions. Milk chemical composition, including protein, fat, lactose, density, and electrical conductivity, was analyzed using a Milkana Multi-Test SAC/10 analyzer (GNC Agriculture, Konya, Türkiye). Prior to analysis, samples were preheated to 40 °C and gently mixed to ensure homogeneity. Each cow contributed a single observation to the dataset, and no repeated measurements were included. Milk color was measured using a CR-5 colorimeter (Konica Minolta, Tokyo, Japan) under standardized conditions. The instrument was calibrated using a standard white calibration tile according to the manufacturer’s instructions. Subsamples of 10 mL were placed in a cuvette for measurement, and results were expressed in the Commission Internationale d’Eclairage (CIELab) color space, including L*, a*, and b* coordinates. In this system, L* represents lightness (ranging from 0 = black to 100 = white), a* represents the green–red axis (negative values indicate green; positive values indicate red), and b* represents the blue–yellow axis (negative values indicate blue; positive values indicate yellow). Chroma (C*) was calculated as C* = √(a2 + b2), and Hue angle (h°) was derived from the a* and b* coordinates using an angular transformation.
2.3. Statistical Analysis and Data Preprocessing
All statistical analyses, data preprocessing, and predictive modeling were performed using custom scripts written in Python (v3.10). Predictive modeling was conducted using Lasso regression and Extreme Gradient Boosting (XGBoost). As each cow contributed only a single observation, no repeated-measures structure was present in the dataset. The analysis workflow included data preprocessing, descriptive statistics, correlation analysis, and predictive modeling. Prior to modeling, data quality was assessed using graphical (box plots) and statistical methods (z-scores). Observations exceeding ±3 standard deviations were considered potential outliers; however, no data points were removed, as these values were assumed to reflect natural biological variation. Instead, model robustness was evaluated using resampling-based validation approaches. The distribution of variables was examined using the Shapiro–Wilk test. Variables not meeting normality assumptions were transformed using the Box–Cox transformation. To ensure comparability across variables with different measurement scales, all independent variables were standardized using z-score normalization. To prevent information leakage, all preprocessing steps—including transformation parameter estimation and standardization—were performed using the training data and subsequently applied to the corresponding validation or test data during model evaluation. Descriptive statistics were calculated as mean, standard deviation, and minimum–maximum values. For comparisons between groups, the independent samples t-test was used for normally distributed variables, while the Mann–Whitney U test was applied to variables that did not meet normality assumptions. The choice of statistical test depended on the distribution of each variable, as assessed by normality testing. Relationships between variables were evaluated using Pearson’s correlation coefficients, and the Benjamini–Hochberg procedure was applied to control the false discovery rate in multiple comparisons. For predictive modeling, two approaches were implemented using CIELab color parameters (L*, a*, b*, Hue angle, and Chroma) as predictors: (i) a linear shrinkage model (Lasso regression), and (ii) a nonlinear tree-based model (Extreme Gradient Boosting, XGBoost).
2.4. Predictive Modeling: Lasso and XGBoost
Two modeling approaches were applied to estimate milk components (fat, dry matter, density, protein, lactose, freezing point, and conductivity) using CIELab color parameters (L*, a*, b*, Hue, and Chroma) as predictors: (i) a linear shrinkage model (Lasso regression) and (ii) nonlinear tree-based model (XGBoost).
2.4.1. Lasso Regression
Lasso regression, originally introduced by Tibshirani [18], was defined as Ŷ = β0 + Σ (βj Xj).
Coefficients were estimated by minimizing:
where λ is the regularization parameter controlling the degree of shrinkage. The optimal λ value was determined via 10-fold cross-validation. Increasing λ results in coefficient shrinkage and potential elimination (βj = 0), enabling variable selection.
minβ { Σ (Yi − Ŷi)2 + λ Σ |βj|}
2.4.2. XGBoost Modeling
Nonlinear relationships were modeled using the Extreme Gradient Boosting (XGBoost) algorithm. The prediction model follows an additive tree-based structure: Ŷi = Σ fk(Xi).
The objective function is Σ l(Yi,Ŷi) + Σ Ω(fk), with regularization term Ω(f) = γT + (1/2)λ‖w‖2, where (i) fk: decision trees, (ii) T: number of leaves, (iii) w: leaf weights, (iv) γ: complexity penalty. The dataset was randomly stratified into 80% training and 20% testing subsets. Hyperparameter tuning was conducted on the training dataset using grid search combined with 10-fold cross-validation. Parameter ranges were as follows: learning_rate (0.01–0.1), max_depth (3–6), n_estimators (100–500), subsample (0.7–0.9), colsample_bytree (0.6–0.8), and gamma (0–1). Early stopping was applied if validation error did not improve for 20 consecutive rounds.
Model performance was evaluated using
R2 = 1 − [〖Σ(Yi − Ŷi)〗2/(Σ (Yi − Ȳ)2)]
RMSE = √((1/n)Σ (Yi − Ŷi)2)
MAE = (1/n) Σ |Yi − Ŷi|
Feature importance was assessed using gain-based importance: Gainj = (overall error reduction)/(split numbers).
In all statistical tests, the significance level was accepted as p < 0.05.
2.5. Limitations of the Study
This study has several limitations that should be considered when interpreting the results. First, the dataset was derived from a single herd under uniform management and feeding conditions, which may have limited the biological variability of milk composition and SCC. Consequently, the generalizability of the models to different breeds, production systems, or environmental conditions may be restricted. Second, the sample size (n = 119) and the relatively small number of mastitis-positive cases may have influenced classification performance in particular. Third, physical factors affecting light scattering—such as fat globule size distribution, sample temperature, and degree of mixing—were not explicitly quantified and may have contributed to unexplained variance in the models. Therefore, the findings should be interpreted as a proof-of-concept framework, and further validation using multi-herd and larger-scale datasets is recommended.
3. Results
Descriptive statistics of milk composition traits according to parity are presented in Table 1. These results provide an overview of the variation in milk components between primiparous and multiparous cows.
Table 1.
Descriptive statistics of milk composition traits in Holstein cows according to parity.
The relatively high values observed in some milk components may be explained by sampling conditions and herd characteristics. Milk samples were collected during evening milking, when milk yield is typically lower and total solids may be relatively higher. In addition, the herd included cows at different lactation stages, including individuals approaching the dry-off period, which is known to increase fat and dry matter content.
It was observed that there was no statistically significant difference between the milk components fat, protein, dry matter, lactose percentages, density, freezing point, conductivity, and somatic cell counts according to lactation order (p > 0.05).
Descriptive statistics of milk color parameters (CIELab) according to parity are presented in Table 2. These results provide an overview of the variation in color characteristics between primiparous and multiparous cows.
Table 2.
Descriptive statistics of milk color parameters (CIELab) according to parity.
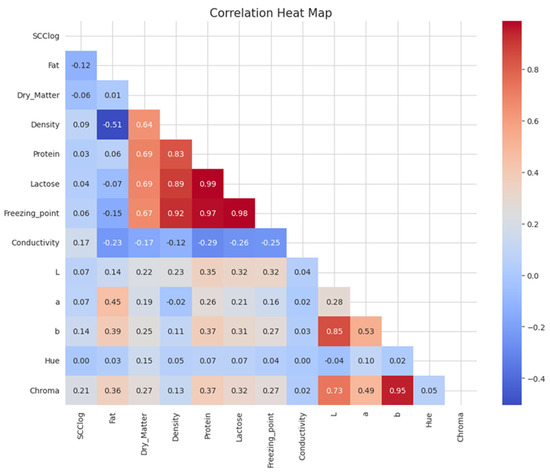
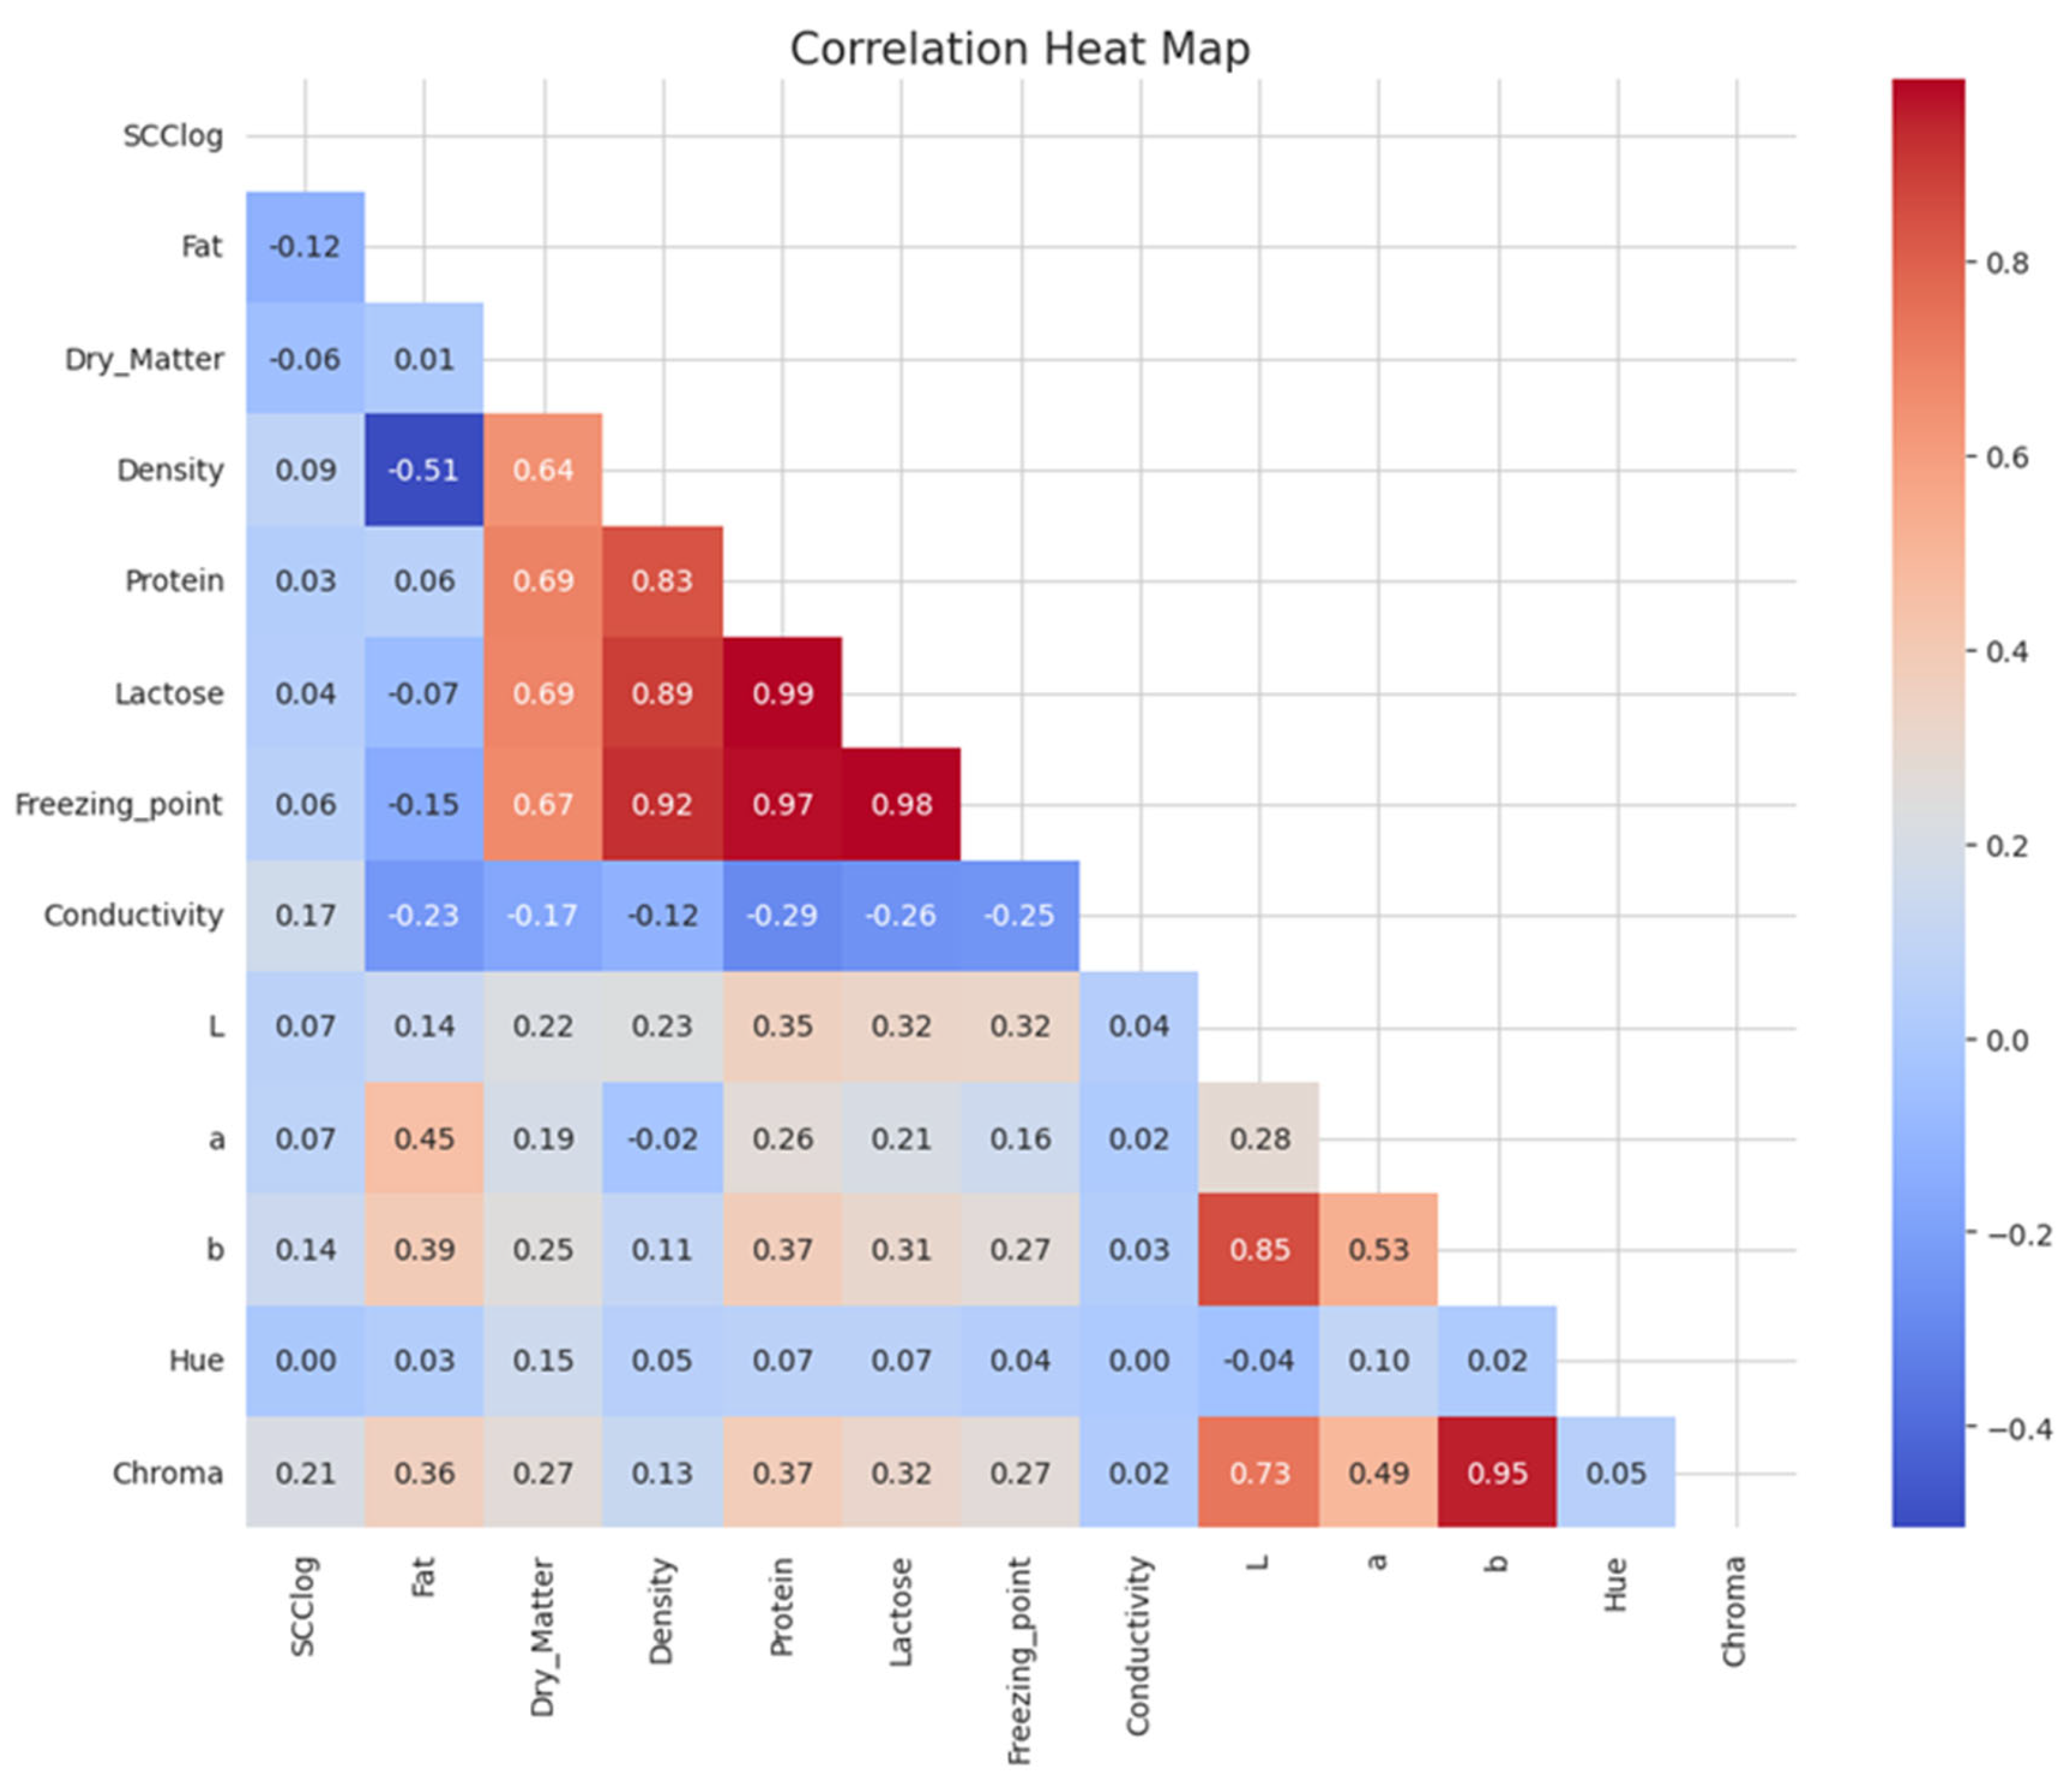
Among all color variables, the L*, b*, and Chroma values showed a positive correlation with protein, lactose, and the freezing point (Figure 1). Furthermore, the fat content showed a positive correlation with the a*, b*, and Chroma values. However, the color values showed a negative correlation with the somatic cell count, electrical conductivity, and density. The outcome provided evidence of the impartial selection of the input variables to develop the model.
Figure 1.
Correlations of milk color with milk composition.
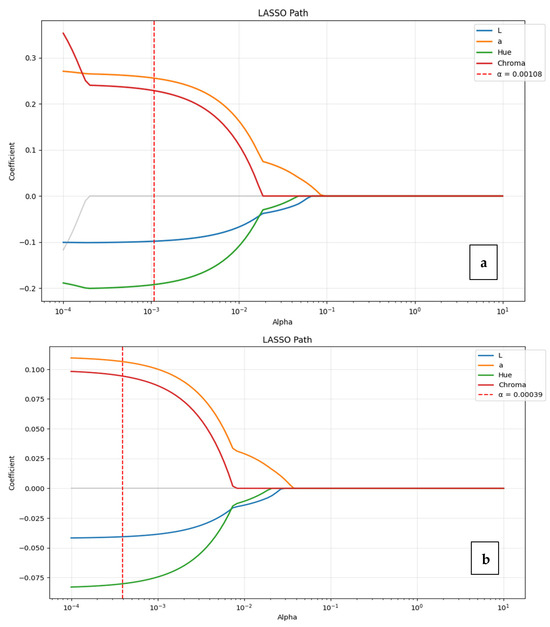
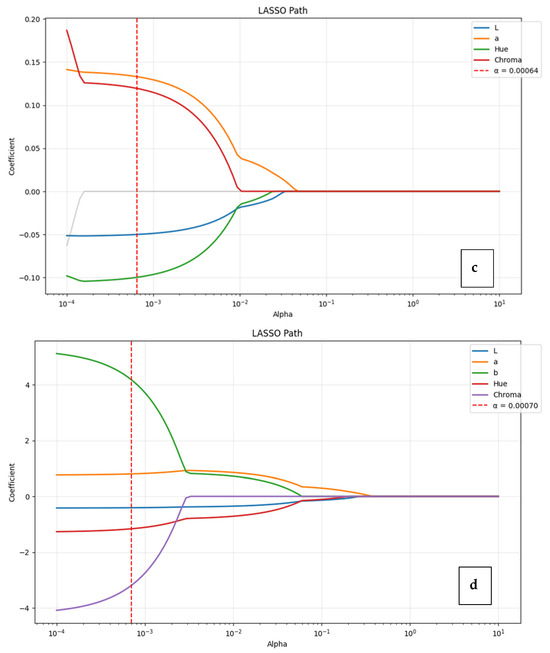
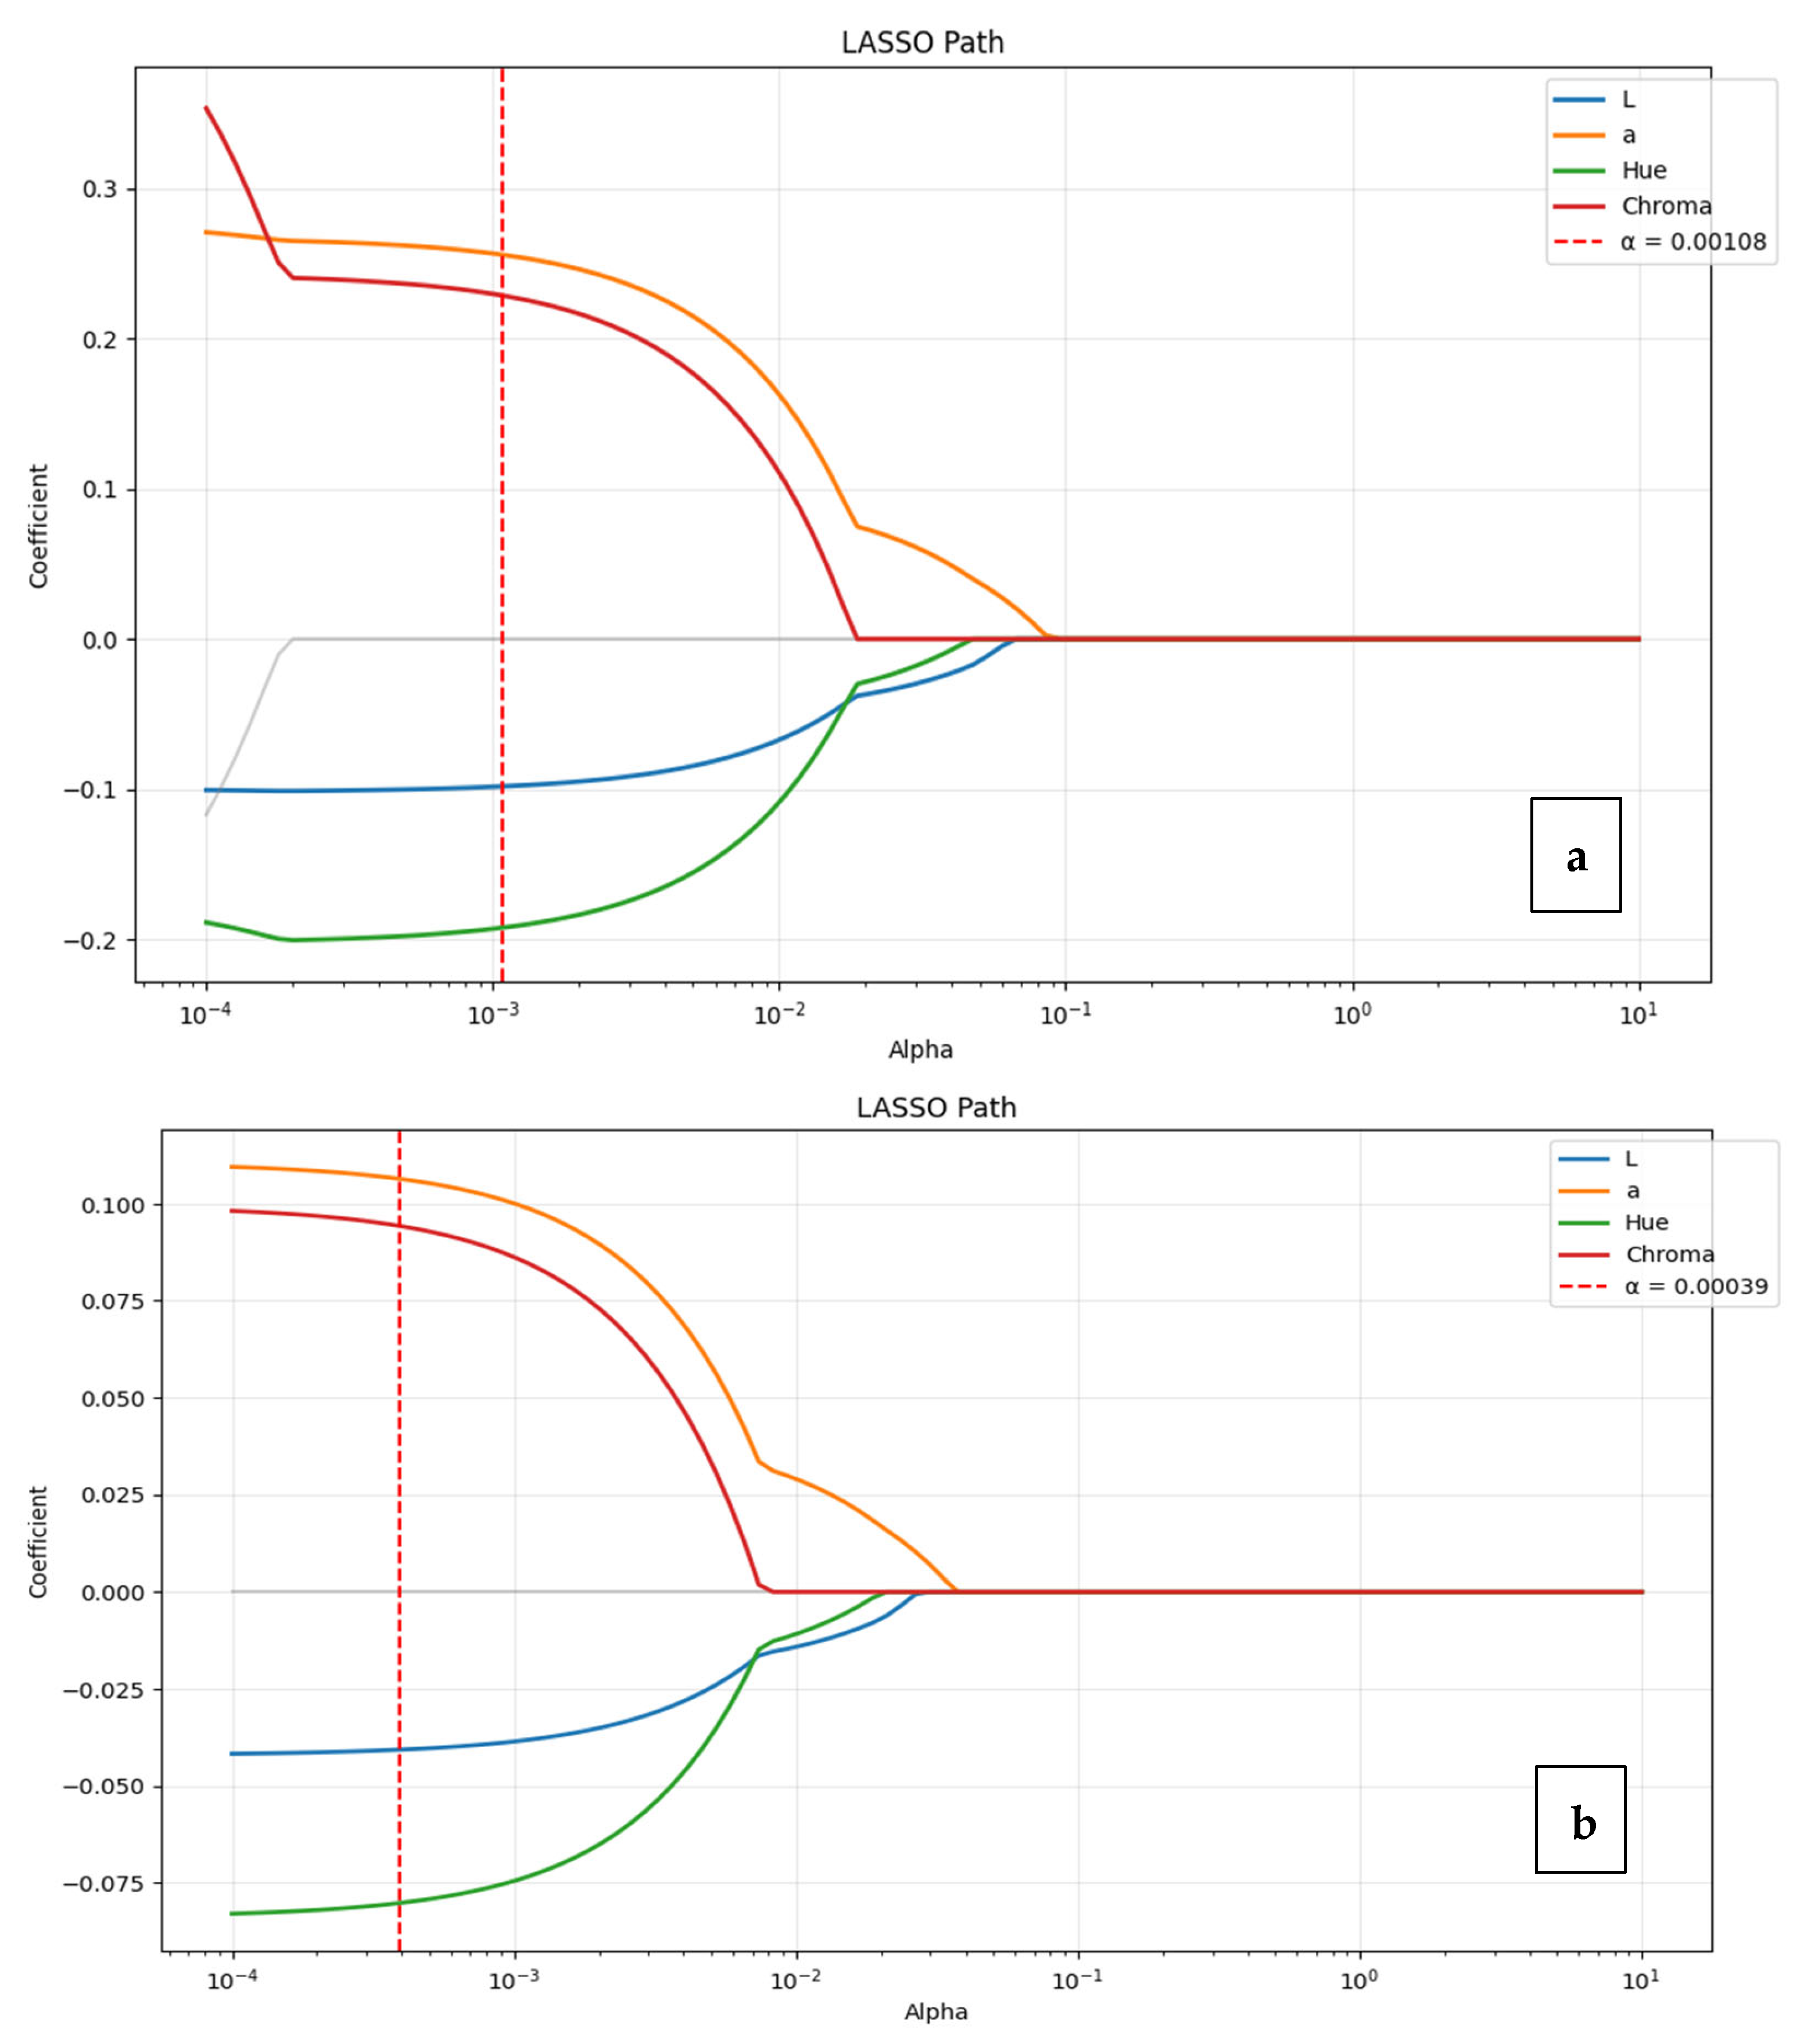
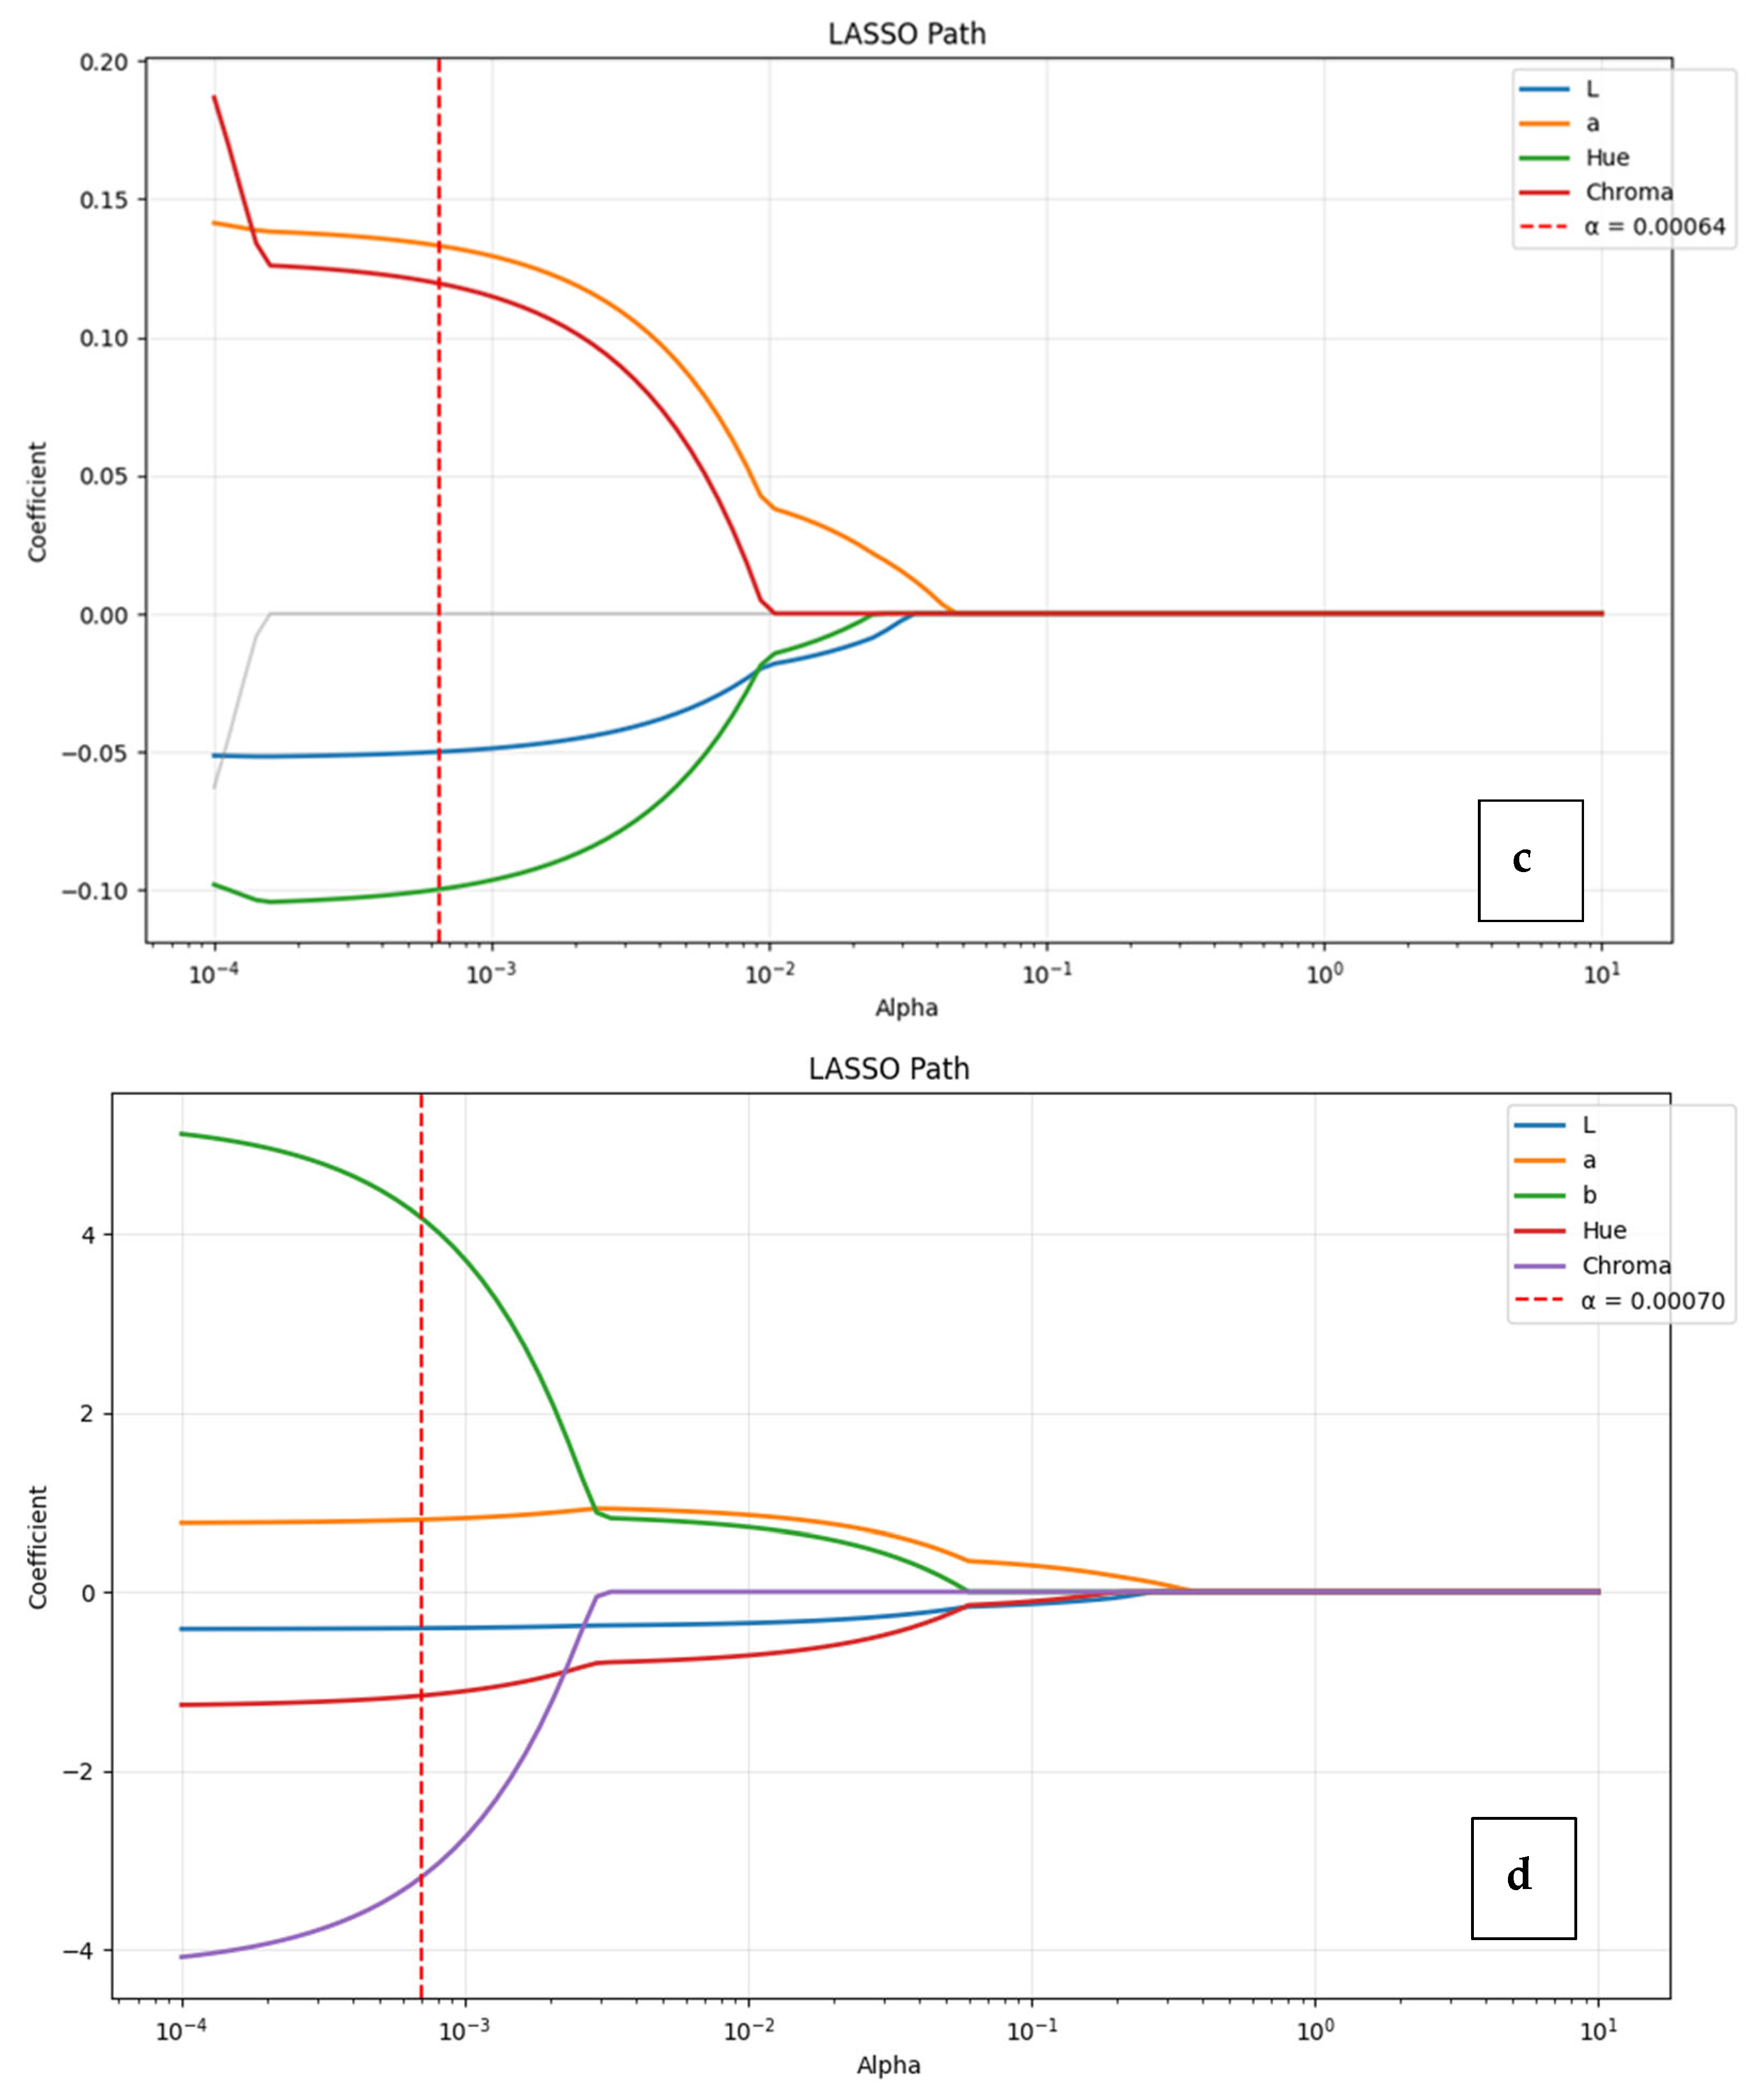
Estimating milk dry matter and lactose content using CIE L*a*b* color parameters yielded R2 values of 0.2634 and 0.228, respectively (Figure 2a,c). These values indicate that color-based optical measurements can explain approximately one-quarter of the dry matter and lactose variation. The prominence of the a*, Hue, and Chroma parameters in the model results suggest that dry matter and lactose variation is reflected indirectly through the spectral composition of the optical medium and shifts in Hue, rather than directly through brightness. Estimating milk protein content using CIE L*a*b* color parameters yielded an R2 of 0.327 (Figure 2b) (Table 3). This value indicates that color-based optical measurements can explain approximately one-third of the protein variation. Examining the model coefficients revealed that the highest contribution came from the a* parameter, followed by the Chroma and Hue variables, while L* provided a more limited contribution. These results suggest that protein variation is reflected optically not only through the brightness level but also through the spectral composition of the colloidal medium and shifts in color tone. Estimating milk fat content using CIE L*a*b* color parameters yielded an R2 of 0.191 (Figure 2d). This value indicates that color-based optical measurements can explain approximately one-fifth of the fat variation. This relatively low explanatory power indicates that color-based measurements capture only a limited portion of fat variation. Although b*, Chroma, and Hue were retained in the model, their contributions should be interpreted cautiously, as the relationship between milk fat and color parameters appears to be weak and potentially influenced by indirect optical effects rather than direct associations.
Figure 2.
Lasso analysis to confirm the best linear model showing relationship between color indices and dry matter (a), protein (b), lactose (c), and fat (d) in cow milk. On the x axis, the shrinkage regularization factor is given in logarithmic units (log λ). The number on top of the figure indicates the number of Lasso-selected predictors at the log λ value.
Table 3.
Color scales used in prediction.
The predictors selected by the Lasso regression model and their corresponding R2 values for each milk component are summarized in Table 3. These results highlight the relative contribution of CIELab color parameters (L*, a*, b*, Hue angle, and Chroma) in explaining the variation in milk composition traits.
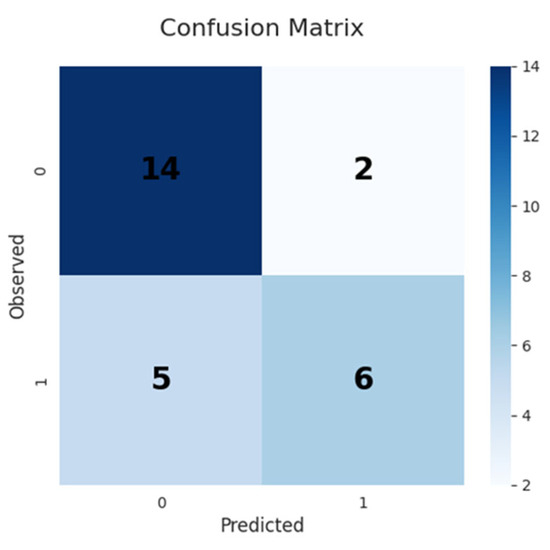
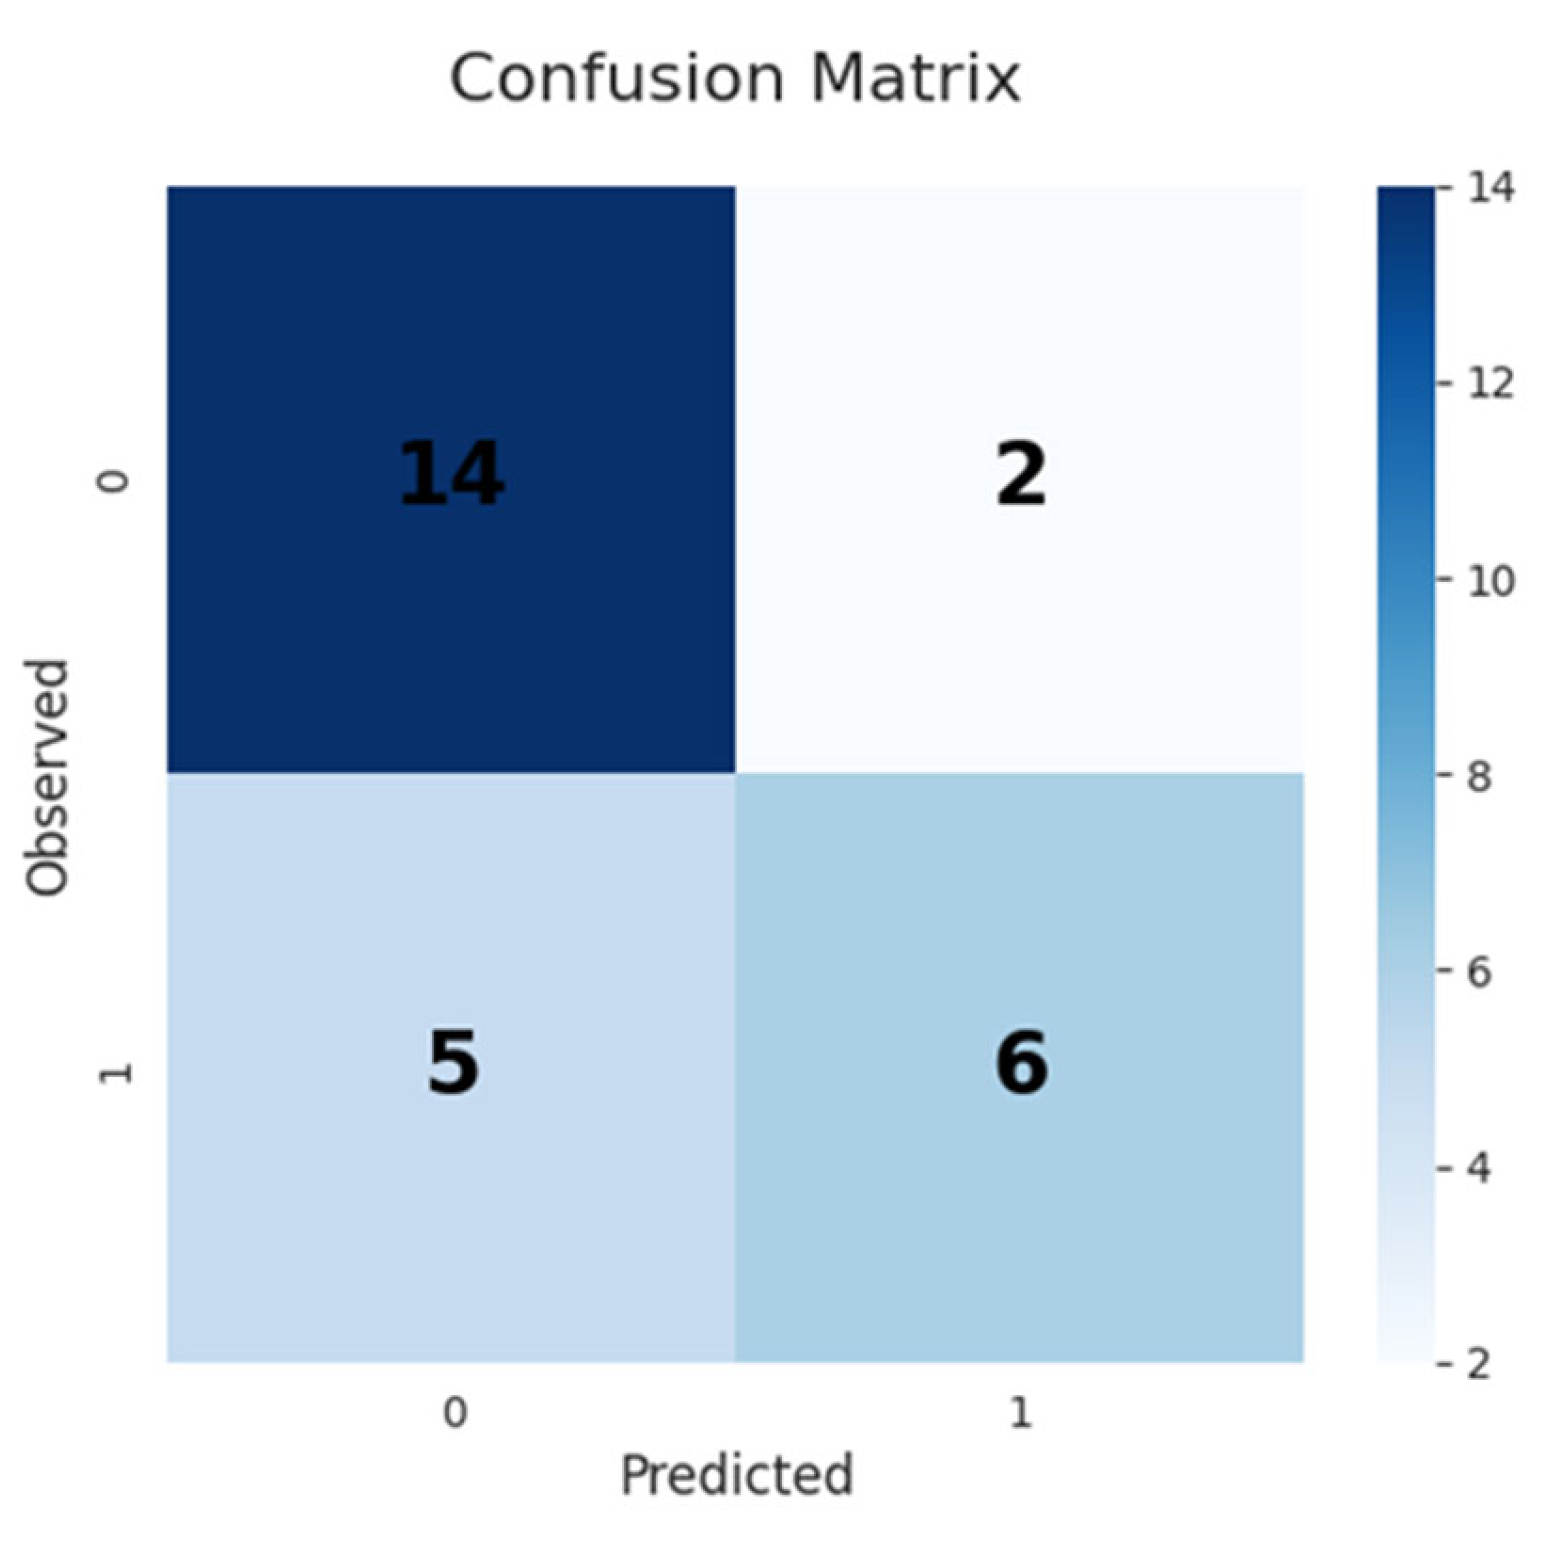
Data were coded as binary classes (0–1) based on somatic cell count (SCC). A threshold of 200,000 cells/mL was used to classify samples, as this value is widely accepted as an indicator of subclinical mastitis in dairy cattle. Samples below this threshold were classified as low SCC, while those above were classified as high SCC (Figure 2d). The classification performance of the model is presented in Figure 3. The confusion matrix illustrates the distribution of correct and incorrect predictions for SCC classification. The Lasso analysis was conducted to find the best linear model of the relationship between color indices and somatic cell counts (SCCs) in cow milk. In this study, the relationships between somatic cell count (SCClog), used as an indicator of milk quality, and physical and chemical milk parameters were evaluated (Table 4). The findings reveal a relationship between milk components and the quality indicator. In this study, comparisons based on SCC classification showed no statistically significant differences in most milk composition parameters; however, significant changes were detected in electrical conductivity (EC) and Chroma values (p < 0.05) (Figure 2d). This finding indicates that cellular and ionic changes in mammary physiology could indirectly affect the optical properties of milk. In particular, increases in somatic cell count are associated with the disruption of epithelial integrity and altered ion transport, leading to elevated sodium and chloride content in milk. These ionic shifts modify the refractive index of the serum phase, which in turn influences light scattering behavior within the colloidal system. As a result, optical parameters such as Chroma may capture these structural and physicochemical changes indirectly, rather than reflecting direct compositional variation [2,8].
Figure 3.
Milk quality classification based on Confusion Matrix SCC. Mastitis present (1)/absent (0). This matrix shows that the model made 14 true negative, 6 true positive, 5 false negative, and 2 false positive predictions in 27 test samples.
Table 4.
Descriptive statistics of milk composition and color parameters according to somatic cell count (SCC) classification (n = 119).
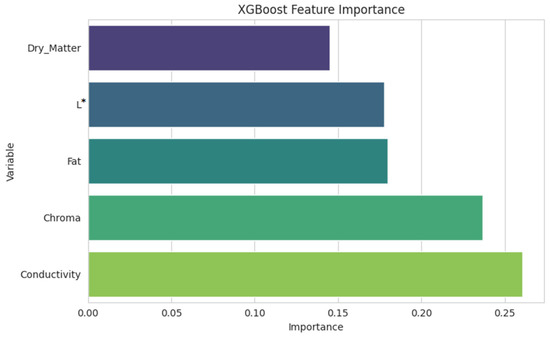
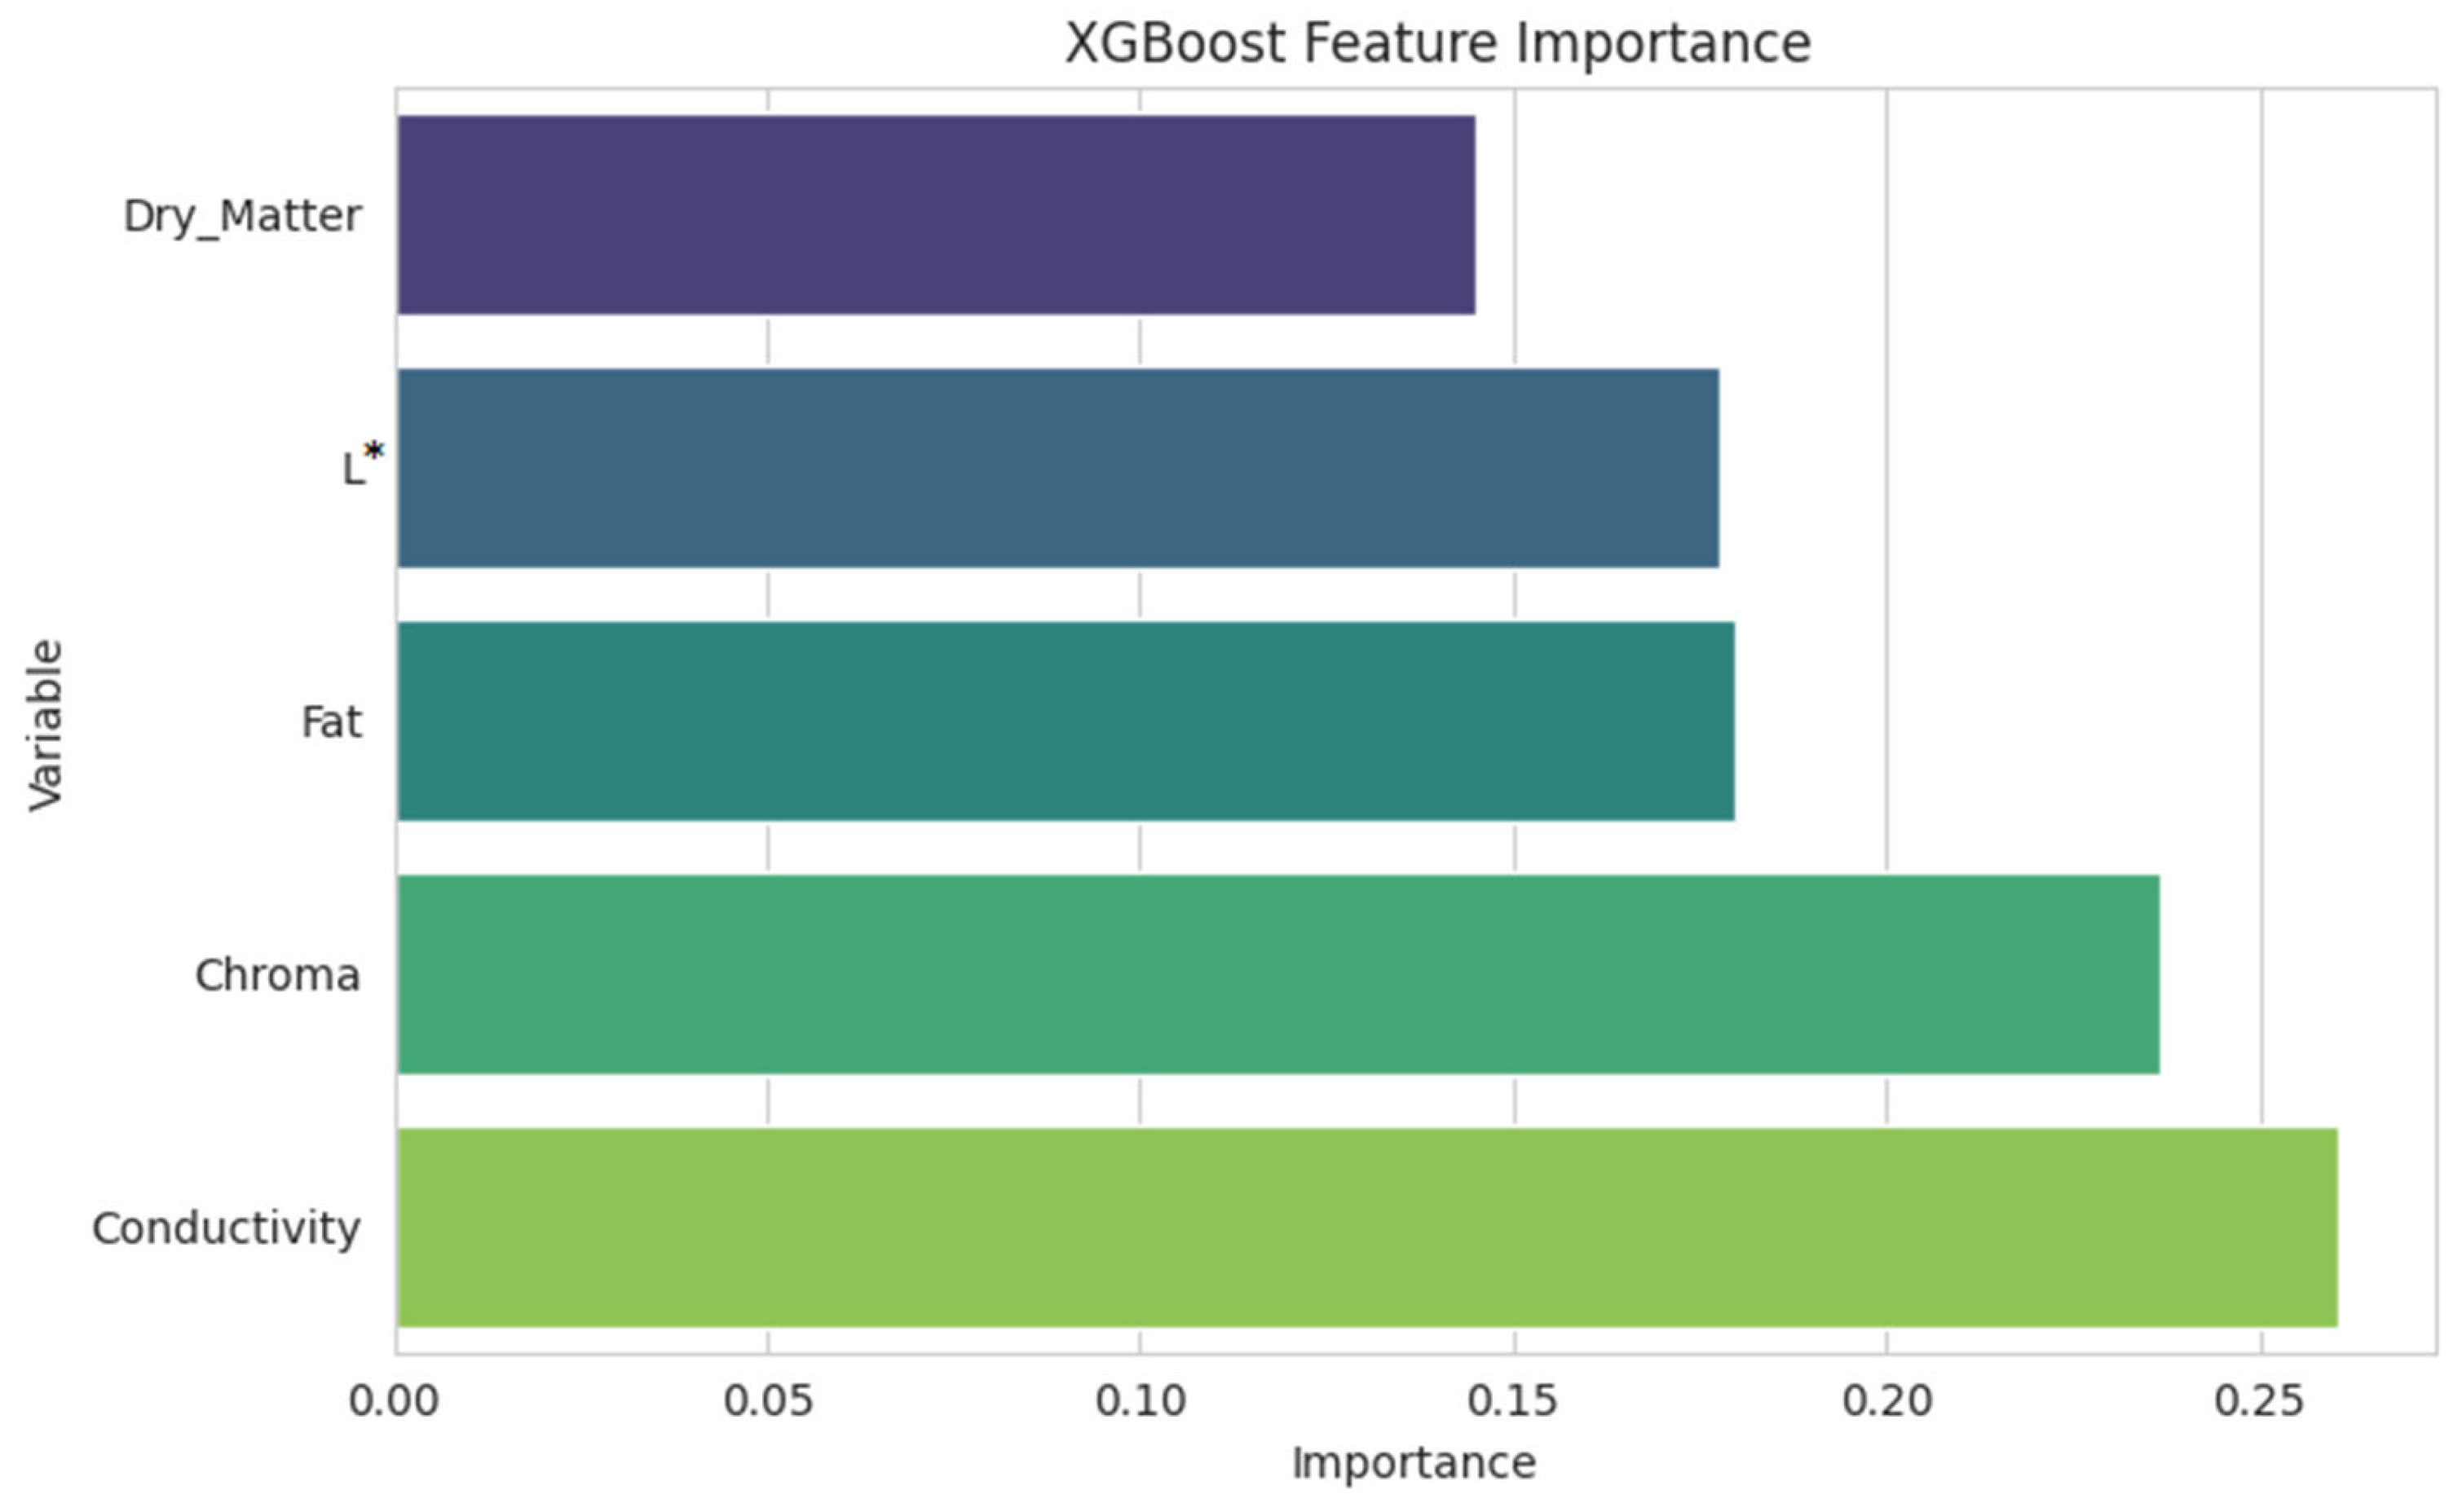
The XGBoost model’s feature ranking shows that electrical conductivity and Chroma are the most effective predictors in milk quality classification (mastitis present/absent). These two parameters account for more than half of the total significance score and have the highest gain values, respectively (Figure 4). The fat content and brightness (L*) contribute moderately, while dry matter has relatively lower significance. These two parameters appear to be the most influential variables among those evaluated in this study for distinguishing milk quality.
Figure 4.
XGBoost feature importance ranking.
4. Discussion
The resulting correlation structure clearly reflects that milk is not a single-component liquid, but a multiphase colloidal system consisting of protein micelles, fat globules, and serum phase [19]. The observed correlations between protein, fat, and color parameters are consistent with the known light-scattering properties of milk; however, these relationships should be interpreted as indirect associations within the variables evaluated in this study rather than definitive evidence of underlying scattering mechanisms. Protein (especially casein micelles) and fat globules are the main sources of scattering in the visible spectrum. Therefore, these two parameters show a systematic relationship with optical indicators such as L*, α*, Hue, and Chroma. The correlation structure reveals that the color measurement reflects the optical outcome of the colloidal structure, not the chemical quantity of the composition. The optical signal measured in the visible spectrum is related more to the light scattering of colloidal particles than to the chemical bonds of milk components [8]. The Hue angle should be interpreted with caution, as its representation depends on the angular transformation and may vary depending on the computational approach used to derive it from a* and b* coordinates. Therefore, comparisons with other studies should consider potential differences in Hue calculation methods.
The relatively limited explanatory performance of the models observed in this study is consistent with previous reports indicating that visible spectrum measurements are only indirectly related to milk composition. Aernouts et al. [8] demonstrated that optical signals in milk are primarily governed by scattering properties rather than direct chemical composition. Similarly, Figueroa et al. [20] reported that color parameters are more strongly associated with fat and protein fractions, while relationships with lactose remain weak. These findings support the interpretation that the moderate R2 values observed in this study may be attributed to the indirect nature of optical measurements and the influence of structural factors such as particle size distribution and refractive index variations. The relatively weak correlation between lactose and color parameters can be explained by the fact that lactose does not form a particulate phase. Lactose exists dissolved in the serum phase and does not directly produce an optical signal; however, it can create an indirect optical effect by modifying the refractive index through osmotic balance and serum phase composition. The lactose linkages in the correlation matrix are consistent with this indirect physiological role [21].
The strong correlation of SCC with conductivity and its limited correlation with color parameters suggest that inflammation causes ionic shifts, not pigment changes. The chain of increased SCC, increased Na+/Cl−, and increased conductivity can affect the optical contrast of the colloidal system by altering the serum phase refractive index [2]. Therefore, SCC is linked to color parameters not directly, but through the physical arrangement of the optical medium. The use of a single SCC threshold may simplify the classification of udder health status, and different threshold definitions may influence model performance.
The weak correlation of freezing point with most parameters suggests that this parameter is primarily dependent on dissolved substance content and behaves independently of colloidal scattering processes. This indicates that freezing point is more of an indicator of osmotic equilibrium than of optical phenotype [22].
Figueroa et al. [20] reported a strong covariation structure between color parameters and composition and hygiene indicators in a sheep milk study; they reported that color variables were more strongly associated with protein and fat, while the association with lactose remained relatively weak. In a large cross-species dataset, Garzón et al. [8] showed that color indices were consistently associated with milk fat and protein, and that the relationship, although varying across species, was based on a biophysical basis. The reasons for the relatively low R2 values for dry matter, protein, fat, and lactose in this study include the fact that visible spectrum measurements are not directly sensitive to the chemical bonds of fat, protein, and lactose molecules; the optical signal originates not only from fat globules but also from protein micelles and the serum phase [8]; the limited range of variation for fat, protein, and lactose in clinically healthy herds [23]; and the influence of factors such as globule size, sample temperature, and degree of mixing on scattering behavior [24].
Variable selection using Lasso regression shows that fat percentage, dry matter (DM), conductivity, L (brightness), and Chroma variables play an important role in determining the quality of both milk composition and optical properties. The XGBoost model established in the machine learning phase showed classification success with 74% accuracy and 69% AUC in the test set. This result shows that the model has statistically strong but clinically moderate predictive power in distinguishing milk quality. The results suggest a slight false negative tendency, meaning that some mastitis samples may be incorrectly classified as healthy. This situation may be due to class imbalance or a limited sample size.
The Lasso regularization path graph shows that the model coefficients rapidly approach zero as the penalty parameter (α) increases, while conductivity and Chroma variables stand out as the two most penalty-resistant parameters. This finding suggests that electrical conductivity and Chroma showed relatively stronger contributions among the variables evaluated in this study for predicting milk quality; however, their importance should be interpreted within the limitations of the selected predictors.
Variable selection performed using Lasso regression highlighted fat percentage, dry matter, electrical conductivity, L (brightness)*, and Chroma parameters as key factors determining milk composition and optical properties.
The XGBoost classification model achieved an accuracy of 74%, a sensitivity of 75%, and an AUC of 0.69 in the independent test set. These results indicate moderate predictive performance in distinguishing between SCC classes. The model demonstrated a reasonable ability to identify high-SCC samples; however, some degree of misclassification was observed. This may be attributed to class imbalance, the relatively small sample size, or the indirect relationship between color-derived predictors and underlying udder health status.
This can be explained by class imbalance in the dataset (dominance of healthy samples) and the limited sample size. The Lasso adjustment path graph in Figure 2 shows that as the penalty parameter (λ) increases, the variable coefficients rapidly approach zero, but electrical conductivity and Chroma are the most resistant parameters. This confirms that these variables are the most reliable in predicting milk quality. Similarly, the feature importance ranking (gain scores) of the XGBoost model is Chroma > electrical conductivity > fat > dry matter > L*. This ranking reveals that color saturation (Chroma) and conductivity provide the highest contribution in terms of capturing nonlinear relationships. This advantage of XGBoost has enabled it to achieve a 10–15% greater performance compared to Lasso in cross-validation.
5. Conclusions
This study evaluated the potential of milk color parameters (CIELab: L*, a*, b*, Hue, and Chroma) as optical indicators of milk quality traits, including milk composition and somatic cell count. The results demonstrate that milk color provides indirect information related to the structural and physicochemical properties of milk rather than acting as a direct proxy for its chemical composition. Among the evaluated variables, Chroma and electrical conductivity showed relatively stronger contributions in distinguishing somatic cell count status, suggesting that optical and ionic changes associated with udder health may be partially captured through color-based measurements. However, the overall predictive performance of color parameters for milk composition remained moderate, indicating that these measurements should be considered complementary rather than substitutive tools. These findings demonstrate that the integration of optical sensing and machinery to monitor milk quality and udders in dairy production systems is an area that can be improved, with the potential to provide a rapid and complementary overview of integrated units.
Author Contributions
Conceptualization, A.E. and C.A.O.; methodology, A.E., S.G. and Ç.T.; software, M.B. and C.A.O.; validation, S.G., Ç.T. and C.A.O.; formal analysis, A.E. and C.A.O.; investigation, S.G., A.E., M.B., C.A.O. and Ç.T.; resources, A.E. and C.A.O.; data curation, Ç.T. and M.B.; writing—original draft preparation, A.E., C.A.O. and Ç.T.; writing—review and editing, S.G. and M.B.; visualization, A.E. and Ç.T.; supervision, S.G.; project administration, S.G., C.A.O. and A.E. All authors have read and agreed to the published version of the manuscript.
Funding
This research received no external funding.
Institutional Review Board Statement
The animal study protocol was approved by Cukurova University Animal Experiments Local Ethics Committee with Decision No. 4, dated 27 March 2025.
Data Availability Statement
The data presented in this study are available from the corresponding author upon reasonable request. The data are not publicly available due to ongoing research analyses.
Acknowledgments
The authors thank the staff of the Cukurova University Dairy Cattle Research and Application Unit for their support in animal management and milk sampling. The authors also acknowledge the technical assistance provided during laboratory analyses.
Conflicts of Interest
The authors declare no conflicts of interest.
Abbreviations
The following abbreviations are used in this manuscript:
| CIELab | Commission Internationale d’Eclairage Lab* Color Space |
| DM | Dry Matter |
| EC | Electrical Conductivity |
| LASSO | Least Absolute Shrinkage and Selection Operator |
| MAE | Mean Absolute Error |
| ME | Metabolic Energy |
| RMSE | Root Mean Square Error |
| SCC | Somatic Cell Count |
| TMR | Total Mixed Ration |
| XGBoost | Extreme Gradient Boosting |
References
- Scarso, S.; McParland, S.; Visentin, G.; Berry, D.P.; McDermott, A.; De Marchi, M. Genetic and nongenetic factors associated with milk color in dairy cows. J. Dairy Sci. 2017, 100, 7345–7361. [Google Scholar] [CrossRef] [Scilit] [PubMed]
- Bobbo, T.; Matera, R.; Biffani, S.; Gómez, M.; Cimmino, R.; Pedota, G.; Neglia, G. Exploring the sources of variation of electrical conductivity and somatic cell count. J. Dairy Sci. 2024, 107, 508–515. [Google Scholar] [CrossRef] [Scilit] [PubMed]
- Begna, R.; Asfaw, Y.; Masho, W. Evaluation of trait preferences and effect of parity, season and lactation stage on production performance of indigenous dairy cow. Heliyon 2023, 9, e22380. [Google Scholar] [CrossRef] [Scilit] [PubMed]
- Ahmed, R.H.; Schmidtmann, C.; Mugambe, J.; Thaller, G. Effects of the breeding strategy beef-on-dairy at animal, farm and sector levels. Animals 2023, 13, 2182. [Google Scholar] [CrossRef] [Scilit]
- Kaskous, S.; Farschtschi, S.; Pfaffl, M.W. Physiological aspects of milk somatic cell count in small ruminants—A review. Dairy 2022, 4, 26–42. [Google Scholar] [CrossRef] [Scilit]
- Winkelman, A.M.; Johnson, D.L.; MacGibbon, A.K.H. Estimation of heritabilities and correlations associated with milk color traits. J. Dairy Sci. 1999, 82, 215–224. [Google Scholar] [CrossRef] [Scilit]
- Misawa, N.; Barbano, D.M.; Drake, M.A. Influence of casein as a percentage of true protein and protein level on color and texture of milks containing 1 and 2% fat. J. Dairy Sci. 2016, 99, 5284–5304. [Google Scholar] [CrossRef] [Scilit]
- Aernouts, B.; Van Beers, R.; Watté, R.; Huybrechts, T.; Lammertyn, J.; Saeys, W. Visible and near-infrared bulk optical properties of raw milk. J. Dairy Sci. 2015, 98, 6727–6738. [Google Scholar] [CrossRef] [Scilit]
- Huppertz, T.; Uniacke-Lowe, T.; Kelly, A.L. Physical chemistry of milk fat globules. In Advanced Dairy Chemistry; Springer: Cham, Switzerland, 2020. [Google Scholar]
- Zaitsev, S.Y.; Voronina, O.A.; Dovzhenko, N.A.; Milaeva, I.V.; Tsarkova, M.S. Comprehensive analysis of the colloid biochemical properties of animal milk as a complex multicomponent system. BioNanoScience 2017, 7, 26–31. [Google Scholar] [CrossRef] [Scilit]
- Cheng, N.; Barbano, D.M.; Drake, M.A. Effect of pasteurization and fat content on milk color and viscosity. J. Dairy Sci. 2019, 102, 2022–2043. [Google Scholar] [CrossRef] [Scilit]
- Pérez-Calabuig, A.M.; Pradana-López, S.; Lopez-Ortega, S.; Sáenz, K.d.J.B.; Cancilla, J.C.; Torrecilla, J.S. Application of residual neural networks to detect and quantify milk adulterations. J. Food Compos. Anal. 2023, 122, 105427. [Google Scholar] [CrossRef] [Scilit]
- Chu, C.; Wang, H.; Luo, X.; Wen, P.; Nan, L.; Du, C.; Fan, Y.; Gao, D.; Wang, D.; Yang, Z.; et al. Possible Alternatives: Identifying and Quantifying Adulteration in Buffalo, Goat, and Camel Milk Using Mid-Infrared Spectroscopy Combined with Modern Statistical Machine Learning Methods. Foods 2023, 12, 3856. [Google Scholar] [CrossRef] [Scilit] [PubMed]
- Novac, C.S.; Andrei, S. The impact of mastitis on biochemical parameters in milk: A review. Pathogens 2020, 9, 882. [Google Scholar] [CrossRef] [Scilit] [PubMed]
- Gutiérrez-Reinoso, M.A.; Aponte, P.M.; García-Herreros, M. Genomic and phenotypic udder evaluation for dairy cattle selection: A review. Animals 2023, 13, 1588. [Google Scholar] [CrossRef] [Scilit]
- Piras, C.; Hale, O.J.; Reynolds, C.K.; Jones, A.K.; Taylor, N.; Morris, M. Speciation and milk adulteration analysis by rapid ambient liquid MALDI mass spectrometry profiling using machine learning. Sci. Rep. 2021, 11, 3305. [Google Scholar] [CrossRef] [Scilit]
- Gonzalo, C.; Juárez, M.T.; García-Jimeno, M.C.; De La Fuente, L.F. Bulk tank somatic cell count practices. Small Rumin. Res. 2019, 178, 22–29. [Google Scholar] [CrossRef] [Scilit]
- Tibshirani, R. Regression shrinkage and selection via the LASSO. J. R. Stat. Soc. B 1996, 58, 267–288. [Google Scholar] [CrossRef] [Scilit]
- Garzón, A.; Perea, J.M.; Angón, E.; Ryan, E.G.; Keane, O.M.; Caballero-Villalobos, J. Exploring Interrelationships between Colour, Composition, and Coagulation Traits of Milk from Cows, Goats, and Sheep. Foods 2024, 13, 610. [Google Scholar] [CrossRef] [Scilit]
- Figueroa, A.; Caballero-Villalobos, J.; Angón, E.; Arias, R.; Garzón, A.; Perea, J.M. Using multivariate analysis to explore the relationships between color, composition, hygienic quality, and coagulation of milk from Manchega sheep. J. Dairy Sci. 2020, 103, 4951–4957. [Google Scholar] [CrossRef] [Scilit]
- Hevia-Aymes, L.; Cuevas-Tenango, R.; Morales-Luna, G. Impact of fat content and lactose presence on refractive index in cow milk. Appl. Sci. 2024, 14, 4529. [Google Scholar] [CrossRef] [Scilit]
- Costa, A.; Visentin, G.; De Marchi, M.; Cassandro, M.; Penasa, M. Genetic relationships of lactose and freezing point. J. Dairy Sci. 2019, 102, 7217–7225. [Google Scholar] [CrossRef] [Scilit]
- Costa, A.; Bovenhuis, H.; Penasa, M. Changes in milk lactose content as indicators for udder health. J. Dairy Sci. 2020, 103, 11574–11584. [Google Scholar] [CrossRef] [Scilit] [PubMed]
- Fu, X.; Diaz-Olivares, J.A.; Van Nuenen, A.; Postelmans, A.; Saeys, W.; Aernouts, B. Analysis of the fat globule size in raw milk through parametrization of visible and near-infrared spatially resolved spectra. Spectrochim. Acta A Mol. Biomol. Spectrosc. 2025, 339, 126287. [Google Scholar] [CrossRef] [Scilit]

Disclaimer/Publisher’s Note: The statements, opinions and data contained in all publications are solely those of the individual author(s) and contributor(s) and not of MDPI and/or the editor(s). MDPI and/or the editor(s) disclaim responsibility for any injury to people or property resulting from any ideas, methods, instructions or products referred to in the content. |
© 2026 by the authors. Licensee MDPI, Basel, Switzerland. This article is an open access article distributed under the terms and conditions of the Creative Commons Attribution (CC BY) license.