


Abstract
Most researchers who have studied enzymatic milk coagulation in depth recognize that this process is composed of two overlapping phases: an enzymatic phase (first) and a non-enzymatic phase (second). The latter is composed of two consecutive sub-phases that are also partially overlapping: the first is called micellar aggregation, and the second is called the gel hardening phase by many researchers. This final phase, which consists of the rearrangement of the three-dimensional para-κ-casein network, is one of the most complex and least studied milk coagulation stages. A review conducted prior to this publication confirmed that existing models describe micellar aggregation up to network formation but cannot characterize the subsequent network rearrangement and gel hardening process. The objective of this review is to examine the main models that describe the gel hardening phase, evaluating each one to highlight its advantages, disadvantages, and main limitations. Among the models reviewed, those based on light scattering stand out, as they are non-invasive and allow for the prediction of gel firmness in real time. This review is expected to provide greater support to the cheese industry in achieving better control of enzymatic milk coagulation.
1. Introduction
Global cheese production exceeds 22 million tons annually [1], and even small improvements in curd cutting efficiency can significantly increase cheese yield and profitability [2].
Cheese is a food composed primarily of protein, fat, and moisture from milk [3]. The enzymatic coagulation process of milk for cheese production begins with the enzymatic hydrolysis of milk casein micelles, causing the hydrolyzed micelles to approach each other, initially forming chains or clusters that subsequently structure themselves three-dimensionally into a loose network of hydrolyzed micelles; this first sub-phase of the gel assembly phase is known as micellar aggregation [4]. The aggregation of hydrolyzed micelles leads to a second sub-phase of gel assembly, where a reorganization of the network structure occurs, causing its contraction and firming over time. This results in the exudation of part of the serum phase (whey), known as microsyneresis, while its mechanical resistance increases, partially trapping the other milk components [5]. These three processes are not easy to differentiate because there are overlapped [6,7]. The last process (i.e., the second sub-phase of the non-enzymatic phase) is increasingly being called the gel hardening stage [8], which we will refer to directly from now on as the hardening phase or stage. Figure 1 shows the process of enzymatic coagulation of milk.
Figure 1.
Enzymatic milk coagulation. Authors’ own work, with the assistance of chatgpt artificial intelligence.
The hardening phase of the formed gel is generally considered an extension of the micellar aggregation phase. However, the study and evaluation of this phase require a different approach and tools [9]. Several instruments have been used to monitor and model the gel hardening phase, such as those based on rheological properties. However, less invasive methods, such as thermal and optical methods, are currently employed to monitor the gel’s behavior during this stage until the gel is cut [10]. One such method was proposed by Payne and Castillo [11], who monitored and modeled the gel hardening phase using a near-infrared (NIR) light scattering sensor.
During the gel hardening stage, the gel’s firmness progressively increases until it reaches a hardness that allows it to withstand mechanical cutting in the cheese vat without breaking [12]. Cutting the gel at optimal firmness ensures minimal loss of fat, protein and fines in the whey and maximum cheese yield, contributing to optimal final product quality [13]. The gel hardening stage is the least understood; therefore, it is important to study this final stage of milk coagulation by rennet, differentiating it from the preceding micelle aggregation stage. This will allow for better control in cheese production, aiming to achieve maximum quality and cheese yield. While several reviews have addressed the mechanisms of milk coagulation, no comprehensive review has focused specifically on the mathematical models developed to describe gel firming kinetics; the aim of this review is to address this need.
2. Review Methodology
This review was conducted following the recommendations of the PRISMA 2020 (Preferred Reporting Items for Systematic Reviews and Meta-Analyses) statement for systematic reviews. The objective was to identify, select, and analyze studies that developed or applied mathematical models to describe curd firming during the enzymatic coagulation of milk, as well as to evaluate their theoretical foundations, variables employed, predictive capacity, and industrial applicability.
2.1. Databases Consulted
The literature search was conducted using four internationally recognized databases in the fields of food science, process engineering, and dairy technology: Scopus, Web of Science Core Collection, PubMed, Google Scholar. These databases were selected due to their extensive coverage of peer-reviewed scientific literature and the availability of publications related to milk coagulation, food rheology, and mathematical process modeling.
2.2. Search Strategy
The search was conducted using Boolean operators (AND and OR) and controlled terms in Spanish and English related to milk coagulation and curd hardening. The main terms used were as follows: “milk coagulation”; “gel hardeninG″ or “gel firminG″; “curd firmness”; “rennet coagulation model”; “casein aggregation”; “coagulation kinetics”; “mathematical model”; “predictive model”.
2.3. Inclusion Criteria
Only studies meeting the following criteria were included: scientific articles published in peer-reviewed journals; studies focused on the development, validation, or application of models for the enzymatic coagulation of milk; experimental, theoretical, or modeling research; works describing empirical, mechanistic, or hybrid models; studies using rheological, optical, ultrasonic, mechanical, or physicochemical variables to describe curd firming; articles available in full text; book chapters.
2.4. Exclusion Criteria
The following were excluded: conference abstracts; theses and gray literature; patents; duplicate publications; articles lacking sufficient information to analyze the proposed model.
2.5. Selection of Studies
The retrieved records were consolidated into a single bibliographic database and subsequently cleaned to remove duplicates. The selection of studies was carried out in three stages:
- Identification of records found in the databases.
- Screening via review of titles and abstracts, followed by eligibility assessment based on full-text reading.
- Inclusion of studies meeting all established criteria.
During the review, the reference lists of the selected articles were also examined to identify additional relevant studies.
2.6. Extraction and Analysis of Information
The following information was extracted from each selected article:
- Author and year of publication;
- Model objective;
- Model type (empirical, mechanistic, or hybrid);
- Theoretical basis;
- Measured variable;
- Predicted variable;
- Instrument used;
- Experimental conditions;
- Computational complexity;
- Advantages and limitations;
- The ability to distinguish between micelle aggregation and gel hardening stages;
- Industrial applicability;
- Current status of the model.
Subsequently, the models were qualitatively compared based on their accuracy, complexity, calibration requirements, ease of implementation, and potential for application in online monitoring systems for cheese manufacturing. Figure 2 shows the PRISMA 2020 flow diagram of the study selection process used for the preparation of this review.
Figure 2.
PRISMA 2020 flow diagram of study selection process. Source: Page MJ et al. [14].
3. Hardening of the Enzymatic Milk Gels
With virtually all particles (micelles) already attached to the network at the gelation point, the primary way in which gel firmness can increase over time is through fusion and rearrangement of particles and clusters, a phenomenon known as “reorganization” [15]. Several experimental studies have specifically considered the rearrangement effect within the context of a fractal description of the aggregate or gel structure. These include microscopic [16] and rheological [17] studies on casein gels. Based on these studies, Mellema et al. [15] identified four levels of rearrangement: particle fusion, particle rearrangement, cluster rearrangement, and syneresis, the latter being a consequence of the previous three (Figure 3).
Figure 3.
Levels of reorganization during the aggregation and gel hardening phases. Authors’ own work, with the assistance of chatgpt artificial intelligence.
The fusion and rearrangement of particles make the aggregates denser. This can lead to tensile stresses on the filaments near the aggregates, causing their rupture and reorganization, resulting in a microsyneresis process [18]. This process expels the whey retained in growing pores within the gel structure. Extensive filament rupture in the system will eventually induce syneresis [15]. Some proteolytic reactions caused by rennet and other endogenous enzymes may also occur, contributing to the rupture and rearrangement process [7]. An increase in permeability (B) and endogenous syneresis pressure (Psyn) was observed after the formation of gels obtained by curdling, indicating pore growth within the gel during the early stages of gelation. Once the gel has fully formed, the endogenous syneresis pressure (Psyn) begins to decrease as a consequence of syneresis [19].
4. Methods for Monitoring the Gel Hardening Phase
4.1. Methods Based on the Use of Rheological Sensors
Possibly one of the first devices used to monitor the gel hardening phase was the hydraulically driven oscillating diaphragm device, developed by Vanderheiden [20]. In this device, a milk sample is placed between two diaphragms (Figure 4), and rennet is added. One diaphragm (the transmitting diaphragm) is vibrated by the cyclic application of hydraulic pressure. When the milk is liquid, the effect of the vibration dissipates quickly and does not affect the receiving diaphragm. When a gel forms, the vibrations emitted by the transmitting diaphragm reach the receiving diaphragm, causing it to vibrate. These vibrations are detected and quantified [21].
Figure 4.
A schematic representation of a pressure transmission apparatus for measuring milk coagulation. Authors’ own work, with the assistance of chatgpt artificial intelligence.
However, the most direct way to measure gel formation and hardening is by monitoring the evolution of its rheological properties [18]. For milk gels, it is recommended to use rotational rheometers with concentric cylinder probes, as these allow for the measurement of the rheological properties of viscoelastic materials and offer better thermoregulation [22]. To study milk coagulation, small amplitude oscillatory rheometry (SAOR) tests are applied, as they inflict small deformations on the gel, providing information about the intact network structure [23]. The rheological properties that characterize a gel are the elastic or storage modulus (G′), the viscous or loss modulus (G″), and the loss tangent (tan δ) [24], also known as the phase angle. G′ (Pa) expresses the magnitude of the energy stored in the material or that is recoverable per deformation cycle. G″ (Pa) is a measure of the energy lost as viscous dissipation per deformation cycle [22]. Therefore, for a perfectly elastic solid, all the energy is stored, that is, G″ is zero. Conversely, for a liquid without elastic properties, all the energy is dissipated as heat, that is, G′ is zero. Furthermore, we have the following:
A higher tan δ value indicates that, during material deformation, a relatively large portion of the supplied energy is dissipated as heat and less is stored elastically; in other words, the material behaves in a more viscous and less elastic manner [25]. Furthermore, the loss tangent is an indicator of the material’s structure (molecular interaction). A highly structured material generally exhibits a low tan δ value [26].
The onset of gelation is characterized by strong increases in G′ and G″ and a decrease in δ, which drops abruptly from ~80° in milk to ~10° and marks the transition from a mostly viscous material, such as milk, to a gel that is largely elastic (Figure 5) [27,28,29].
Figure 5.
Changes in storage (G′) and loss (G″) modulus and phase angle (δ) during rennet-induced milk gelation. The gel point is identified at G′–G″ crossover which occurs at δ = 45°.
G″ and δ are useful parameters for monitoring viscoelastic changes in the gel during gel hardening phase, but they are not directly related to gel hardness. In contrast, G′ is a direct measure of gel firmness and is therefore important in cheesemaking.
Several objective coagulation parameters, which are relevant in cheesemaking, can be derived from the G′ vs. time curve, in curve modeling, as described below [30]:
- Gelation time (tg), defined as the time at which G′ reaches a threshold value, arbitrarily set at 0.5 Pa [31]. However, authors such as Arango et al. [32] consider the value to be 1 Pa, while other authors consider that this time coincides with the crossover of the G′ and G″ curves (tanδ = 1; δ = 45°) at a frequency that allows it to be within the linear viscoelastic regime [29]. This last definition is accepted by rheology experts because from the point of crossing, G′ is greater than G″ and therefore, the crossing time G′-G″ is conceptually close to the sol/gel transition time in milk [22].
- Firmness after a fixed settling time, for example 30 or 60 min, G′30 or G′60 [27].
- The maximum rate of gel hardening, defined as the maximum slope, Smax, of the G′ vs. t graph [30].
- Rheological cutting time (tG′), i.e., time between the addition of rennet and the cutting of the gel with adequate firmness, for example, tG′40 is the cutting time at 40 Pa [27].
On the other hand, gel hardening has also been monitored using vibration probes. Vibration probes are much less intrusive than mechanical motion systems and could be adapted to commercial cheese vats. Such systems can vibrate in a tuning fork mode (sometimes referred to as acoustic probes) or in a torsional mode [33,34].
In any case, fluid viscosity can be measured by damping and phase-shift effects, which occur when a vibrating probe is immersed in a fluid such as milk. When such a probe is immersed in a cheese vat, milk coagulation can be directly monitored by measuring the increasing viscosity before gelation and the increase in gel elasticity after gelation begins. Since vibrations can be generated and measured in such probes using the piezoelectric principle, they offer the advantage of having no mechanically moving parts [33]. Senge et al. [35] and Schulz et al. [36] showed that a torsional vibration probe (Paar Physica Rheoswing; not currently commercially available) at a frequency of around 8500 Hz can monitor milk coagulation. Sharma et al. [37] used a Nametre torsional vibration viscosity probe (vibration frequency of around 660 Hz) in reconstituted skim milk and found that the instrument detects an early phase of coagulation before visible clots form. Torsional vibration detects viscosity and density of the product, which decreases to a minimum for 10–20 min after the addition of rennet (initial stage of κ-casein hydrolysis) and then progressively increases. O’Callaghan et al. [38] showed that transverse or torsional vibration modes can be used to monitor coagulation. However, in that experiment, both types of probes subjected the gel to a risk of microsyneresis due to the amplitude of the movement, and this limited the degree of coagulation that could be measured. For this reason, a vibration probe for use in cheesemaking should be designed with a very low vibration amplitude [39]. Currently, the company Rheolution (Montreal, QC, Canada) markets a milk coagulation monitoring system (CoaguSens), which uses vibration to detect milk gelation.
Another technique used to monitor the gel hardening phase is the air puff technique, which measures the deformation of the milk surface during coagulation after applying an air puff (0.10 bar for 50 ms) directed onto the surface. The range of deformation measured using the Foodtexture Puff Device (FPD) is the sum of the maximum and minimum deformation values. Surface deformation was measured using a laser displacement sensor. The device was mounted 4 cm above the milk surface [40].
Other instruments have been used to measure the rheological properties of milk gels, such as the lactodynamograph, which consists of a pendulum or cylinder immersed in milk. The sample holder is oscillated or rotated. While the milk remains liquid, the oscillatory movements do not transmit enough force through the milk to the pendulum to produce movement. When coagulation occurs, the increased viscosity creates a ballast for the pendulum in the milk, causing synchronous movement of the pendulum and the coagulum, which is continuously recorded [27].
4.2. Methods Based on the Use of Thermal Sensors
The use of a hot wire to control coagulation in cheesemaking is based on the principle that fluid viscosity governs convective heat transfer from a heated probe immersed in the fluid (Figure 6). The change in gel viscosity during gel formation can thus be observed by measuring the rate of heat transfer, in practice, the temperature difference between a heated probe and the milk [33].
Figure 6.
A schematic representation of a hot-wire device for measuring milk coagulation. Authors’ own work, with the assistance of chatgpt artificial intelligence.
4.3. Methods Based on the Use of Ultrasonic Sensors
Because ultrasonic waves are sensitive to microstructural heterogeneities in the medium at certain frequencies, the changes that occur during coagulation (micelle aggregation, increased aggregate size, and gel network formation) produce measurable variations in ultrasound propagation. Specifically, aggregate growth and the development of a gel-like structure increase scattering and/or absorption, resulting in attenuation changes, and also modify the effective mechanical properties of the system (compressibility/rigidity), affecting the speed of sound. Therefore, ultrasonic techniques can be used to monitor milk coagulation [33]. Continuous and pulsed ultrasound methods have been studied for this purpose, using piezoelectric transducers across a wide frequency range (1–400 MHz) (Figure 7). Gelation has been reported to be detectable by attenuation and/or velocity measurements [41,42].
Figure 7.
Ultrasonic attenuation measured at 14.5 MHz in milk during the coagulation process at 30 °C. Reproduced from Dwyer et al. [43]. Reproduced with permission from Corredig et al. [41], Journal of Dairy Research, 2005.Q.
4.4. Methods Based on the Use of Electrical Conductivity Sensors
Another technique applied to monitoring gel hardening is the measurement of electrical conductivity. Electrical conductivity decreases during coagulation by approximately 0.5–1.0%, depending on the protein level, and therefore, theoretically, it can be used to monitor coagulation. Changes in electrical conductivity during coagulation were compared with viscosity measurements and elastic modulus measurements (using oscillatory rheometry). It was found that, due to the high temperature coefficient of electrical conductivity in milk (0.0195 °C−1 at 30 °C), it was necessary to minimize temperature gradients in the assays [10]. Electrolyte variations due to salt also confound the conductivity changes as a measure of coagulation. Therefore, this technique appears to have limited use unless combined with other techniques [44].
4.5. Methods Based on the Use of Optical Sensors
Optical techniques are currently being applied to monitor the gel setting phase, as they are considered non-invasive techniques capable of accurately detecting the changes that occur in milk during gelation. It has been known for many decades that milk coagulation is accompanied by changes in optical properties (including color, absorbance, and reflectance), and this led to the use of optical measurement systems in milk coagulation control. Developments in fiber optics have allowed such techniques to be adapted for online use [33]. To this end, in conventional visible and near-infrared spectroscopy, spectral measurements are primarily performed in three detection geometries (reflection, transmission, and scattering), as shown schematically in Figure 8. Absorption/absorbance determinations are usually treated as a derived quantity, generally from transmission, and, in reflection mode, as an apparent absorbance obtained through reflectance transformations. Furthermore, refractometric methods based on changes in the refractive index of the medium have been proposed for coagulation monitoring. Each detection mode requires a different instrumentation configuration and can have various implications for the measurement of food and agricultural products [45].
Figure 8.
Three detection modes commonly used in spectroscopic measurement of the visible and near-infrared range: (a) reflection, (b) transmission, and (c) scattering. Authors’ own work, with the assistance of chatgpt artificial intelligence.
Over the years, these detection methods have been applied to measuring milk coagulation using different optical techniques. Hardy & Fanni [46] applied reflectance photometry to the offline measurement of milk coagulation using a Hunterlab colorimeter. The L* and b* coordinates increased during coagulation, which was attributed to the increase in the mean dimension of casein particles during their aggregation [44]. McMahon et al. [47] and McMahon et al. [48] demonstrated that light absorbance at 600 nm could track milk coagulation and discriminate between a range of enzyme levels. Korolczuk [49] fitted the refractometric profile obtained during coagulation to several theoretical equations describing the increase in stiffness modulus during gel hardening. De Kruif [50] measured the turbidity of skim milk during coagulation using light transmission spectrophotometry with a spectrophotometer at four visible and infrared wavelengths (650 to 1200 nm). He was able to interpret the large drop in transmission observed (~100-fold) during coagulation in terms of particle size due to flocculation. Dybowska and Fujio [51] used a colorimeter to monitor the gelation of reconstituted skim milk using glucono-δ-lactone (GDL) as a coagulant (in this case, acid). They showed that aggregation can be monitored in terms of the lightness parameters, L*, and blue–yellow parameters, b*, over a range of temperature and coagulant concentration.
One of the devices that operates on the principle of transmission is the Optigraph, which measures the decrease in near-infrared (NIR) light intensity transmitted through coagulating milk. The Optigraph calculates coagulation parameters (coagulation time, gel firmness, aggregation rate) using characteristic points extracted from the optical data acquired in real time [52,53]. Cipolat-Gotet et al. [54] compared some milk coagulation characteristics, such as coagulation time (CTT) and gel firmness, using a mechanical method like the Formagraph and an optical method like the Optigraph. They concluded that the readings from the optical methods were more independent of the sensor characteristics and could provide more information about milk coagulation, especially during the hydrolysis phase.
Light scattering is the change in the direction of its propagation in a medium due to the presence of discrete particles and/or changes in the refractive index of that medium. Scattering is affected by the density and size of the particles and cellular structures present in the material. Therefore, scattering is useful for detecting the structural characteristics and composition of food and biological materials [45].
When light (i.e., visible or near-infrared) strikes milk, most of it is strongly scattered forward, with only a small fraction scattered backward. This is because the wavelength of the incident light beam is very close to the size of the fat globules and casein micelles with which it interacts [45]. During gelation, microstructural changes (aggregation/assembly of the casein network) modify the scattering regime and increase the recorded backscatter signal (i.e., in the opposite direction to the light input). Consequently, in light backscatter configurations, the measurement is substantially less dependent on the optical path length than in transmission-based systems, such as the Optigraph, which yields a signal considerably more dependent on the optical path length. An important application of light scattering technology is the use of fiber optic sensors to monitor and control cheesemaking operations during milk coagulation [11]. Figure 9 illustrates the operating principle of these sensors. Light is directed through one fiber optic cable toward the milk sample, and the light scattered back is received by a second fiber. By measuring the increase in light scattering, the degree of aggregation and gel formation can be monitored.
Figure 9.
Operation of a light backscatter sensor, showing the relative amount of light transmitted and scattered in milk before coagulation and in milk gel after coagulation.
Payne et al. [55] developed the CoAguLite™ fiber optic light scattering sensor, which detects scattering at 880 nm. This optical technology for online use has been successfully applied to monitor milk coagulation and to predict both coagulation and cutting times.
Near-infrared (NIR) light scattering technology has been used to predict gel cutting time using cow’s milk [56], goat’s milk [57], milk mixtures (cow, sheep, and goat) [58], sheep’s milk [59], and fat-reduced milk with added inulin [60]. Furthermore, using this technology, Castillo et al. [57] predicted the Berridge clotting time in goat’s milk, Lyndgaard et al. [6] modeled milk coagulation in real time, and Abdelgawad et al. [61] predicted gel cutting time and evaluated the effect of subclinical mastitis on the coagulation properties of sheep’s milk. The sensor was shown to be an alternative method for detecting the Berridge clotting time, established by the IDF as the reference method for determining the clotting activity of rennet [62].
These sensors work well for applications where a change in light scattering provides the necessary information. However, a limitation of the scattering sensors mentioned above is that their output is not a physical property but a relative measure of light energy in volts that depends on the fiber size, amplifier gain, etc. Therefore, the optical signal is transformed into a ratio, R, starting at a value R = 1, by dividing the voltage at time “t” by the average voltage value calculated from the first minute of data [11].
Another optical technique described as potentially suitable as a non-destructive online method for monitoring milk coagulation is fluorescence spectroscopy. In this method, the excitation light beam is delivered to the milk, typically via an optical fiber. Endogenous fluorophores in the sample emit light almost instantaneously upon excitation by the incident light, and the emitted fluorescence is received by a detector, usually via another optical fiber, and analyzed over time to assess milk coagulation. The fluorescence profile of some endogenous fluorophores (specifically tryptophan and riboflavin) also increases sigmoidally during coagulation, as in the case of scattered light. Additionally, this method provides information on the gel syneresis process [63].
Photon density waveform (PDW) spectroscopy is another optical technique that has been used to study the coagulation of homogenized fresh milk at different fat concentrations [64]. PDW spectroscopy is an online optical analytical technique based on radiation transport theory. PDW is generated by inserting intensely modulated light (i.e., laser diodes) into a turbid, but low-absorption material. The amplitude and phase of the wave are characterized by the absorption and scattering properties of the material. PDW is quantified by the absorption coefficient (μa/mm−1) and reduced scattering coefficient (μs′/mm−1), which represent the chemical composition and physical properties of the material, respectively. As demonstrated in the work of Hass et al. [64], the reduced scattering coefficients detect the different fat contents in milk, as well as changes in casein micelles, showing coagulation kinetics similar to other monitoring techniques, such as NIR light scattering.
Optical sensors currently represent the most promising technology for monitoring curd firming, as they combine high sensitivity, a non-invasive nature, compatibility with dairy industry hygiene requirements, and ease of integration with automated systems. Near-infrared (NIR) light backscattering allows for the highly precise detection of microstructural changes associated with casein micelle aggregation and gel firming, providing an objective estimate of the optimal cutting time [65]. Subsequently, Arango and Castillo [66] demonstrated that this optical signal could be used to estimate the storage modulus (G′), while Panikuttira et al. [31] enhanced system sensitivity by combining backscattering with fluorescence. From an economic perspective, optical sensors offer a favorable cost–benefit ratio; they utilize low-cost optoelectronic components, require minimal maintenance, and have a long service life, all of which facilitate their adoption in industrial plants [40]. Furthermore, they can be installed behind sanitary windows, avoiding direct contact with the product and allowing for operation during Cleaning-in-Place (CIP) cycles—a feature that reduces contamination risk and minimizes cleaning-related downtime. Another significant advantage is their ease of integration with industrial automation systems, such as programmable logic controllers (PLCs) and SCADA systems, enabling continuous monitoring and automatic determination of the cutting time. Moreover, data generated by these sensors can be incorporated into machine learning algorithms and digital twins, fostering the development of intelligent systems capable of optimizing the coagulation process in real time [67]. Collectively, these characteristics position optical sensors among the most promising technologies for the industrial monitoring of curd firming and as a valuable sensing platform for the implementation of Industry 4.0 solutions in cheese manufacturing.
5. Gel Hardening Models
5.1. Mechanistic Models
Several mathematical models have been developed to predict the increase in gel firmness over time, based on changes in chemical and physical properties that occur during the curd gel hardening phase. The main models that have been studied/proposed are described below.
5.1.1. Tuszyński Model
Arguing that the shape of the growth curve of G was similar to that of simple autocatalytic reactions, Tuszyński [68] proposed that the growth kinetics be fitted by the following model:
where G is the shear modulus (arbitrary unit of rigidity), G∞ is the shear modulus value at time t = ∞, t is time (s), t* = t − tg, and k is the rate constant for the process (s−1), essentially a fitting parameter. However, the model provides no indication of how changes in the reaction variables will influence the gel hardening process. Like the Scott Blair and Burnett [69] model, the model exhibits sigmoidal behavior. The Tuszynski model is a symmetric function, predicting that the inflection point occurs when G = 0.5G∞; however, this is not observed in practice [70].
5.1.2. Tokita and Collaborators Model
Tokita et al. [71] fitted their milk-setting curves to a generalized nth-order kinetic equation and experimentally determined that the development of gel rigidity after the onset of gelation was best described by first-order kinetics, consistent with the first-order form previously proposed by Douillard [72]. Furthermore, they demonstrated that the gelation onset time, tg, varied inversely with enzyme concentration, [E], whereas the gel firming rate constant, k, which describes the post-gel development of rigidity in the Douillard-type equation, followed a power-law dependence on enzyme concentration with an exponent of 0.8:
where C is a proportionality constant and [E] is the enzyme concentration (%w/w).
k = C[E]0.8,
Subsequently, Tokita [73] explained the enzymatic gelation process of milk as a percolation process, determining that k varied linearly with the enzyme concentration. This model assumes that the aggregation reaction occurs simultaneously with the hydrolysis reaction, suggesting that bonds form immediately when any of the active sites of the nearest neighboring casein micelles are hydrolyzed by the enzyme, but it is now known that a certain percentage of κ-casein must be hydrolyzed (60–90%) for aggregation to occur [74]. On the other hand, it assumes homogeneous connectivity between hydrolyzed micelles, not considering the actual heterogeneity they may have (micelle size distribution, variability in κ-casein content, fine three-dimensional network effects). Although the theory clarifies the dependence of gelation characteristics on the appropriate enzyme concentration, quantitative agreement between the theory and experimental results was not achieved, suggesting further experimental work for its refinement [73].
5.1.3. Hori Model
Hori [75] demonstrated that the increase in milk viscosity during its enzymatic coagulation is proportional to the temperature rise of a platinum wire heated by a direct current of 0.7 A, according to the following equation:
where θW is the temperature of the wire at time t (°C), R is the electrical resistance of the wire (Ω), R0 is R at 0 °C (Ω), and αW is the coefficient of R that varies with temperature (1/K).
The model made it possible to differentiate the enzymatic from the non-enzymatic stage of milk coagulation by rennet.
Subsequently, Sbodio et al. [76], using this methodology, were able to determine optimal temperature, pH, and chymosin concentration conditions to establish the cut-off time. The device allowed for the determination of the coagulation time (tc), as the time at which the sign change of the derivative occurs, of the rate of voltage increase (dV/dt) (“rate of firmness increase”), and of the maximum voltage (Vmax) (“maximum firmness”).
Subsequently, Sbodio & Revelli [77] developed a device for inline monitoring of milk coagulation, which was later refined by Sbodio et al. [78]. Currently, Relco (USA) markets an inline system under the name Optiset 4.1, which uses the hot-wire operating principle.
While a hot-wire sensor measures milk coagulation time quite accurately, it does not track the gel hardening phase. However, when the coagulation rate is varied by the rennet level—at constant milk composition and coagulation temperature—the hot-wire inflection point could be used to predict the curd cut-off point [10].
5.1.4. Carlson and Collaborators Model
Although widely applied, the Douillard equation does not reproduce the acceleration phase immediately after the gel point, one of the most significant features observed experimentally in gel hardening curves obtained with more sensitive modern rheometers.
Therefore, Carlson et al. [79] proposed a more complex model given by the following:
where G is the shear modulus (arbitrary unit of rigidity), t is time (min), t* = t − tg, k1 is the rate constant for the creation of “active” sites (min−1), and kf is the rate constant for the destruction of these sites as they are incorporated into the gel network (min−1). Essentially, the model predicts that “active” sites are created in micelles, which then react with each other to form bonds in the gel network. Both reactions, activation and destruction, are considered first-order processes. Activation requires the enzymatic hydrolysis of κ-casein, and therefore k1 emerges as proportional to the enzyme concentration [70]. This model has been tested by other researchers, following the measurement of the elastic shear modulus G′ during the enzymatic coagulation of milk, observing that the model could reproduce the experimental values of G′ with good accuracy [80,81]. However, the model does not distinguish between micellar aggregation and hardening stages. This model assumes the creation and destruction of active sites in both the aggregation and hardening stages; however, the model is based on the hardening stage, since this model works from tg, at which point the reaction of active site creation and destruction would be close to ending (most active sites already created and the bonds between caseins mostly established).
5.1.5. Mellema and Collaborators Model
Several models have been developed that relate the gel’s elastic modulus (G′) to the volume fraction (φ) through a power-law equation, with the exponent of this equation written as a simple function of the fractal dimension and other possible parameters [17]. Mellema et al. [15] proposed a model (Equation (6)) with two different scaling exponents that describe the filament structure (i.e., micelle chain) as a function of the cluster size. One is related to the number of bonds per filament (δ = 0, 1, or 2); the second is determined by the dominant type of microscopic filament deformation: bending (ε = 1) or stretching (ε = 0) [67]. The types of gels resulting from the model vary with respect to these parameters.
where G′ is the elastic modulus (Pa), aeff is the (effective) particle radius (µm), D is the fractal dimensionality, and α = 2ε + δ + 1 (dimensionless). The value of α depends on the type of filament and the micellar deformation produced, ranging from 1 for a rigid, stretched filament to 4 for a flexible, bent filament. For rennet-induced casein gels at physiological pH (6.6) and room temperature (25–30 °C), α would be approximately 2.5, implying that the network strands at the cluster level are straight within the clusters, with some degree of bending. The presence of straight strands is what is expected from the results of rheometry and confocal and electron micrographs. However, at lower pH, the value of α tends to increase over time, suggesting that the structures become more flexible or curved over time, which contradicts what was predicted by confocal microscopy.
5.2. Empirical Models
5.2.1. Scott Blair and Burnett Model
Scott Blair & Burnett [69] proposed an empirical model as follows:
This model describes the increase in the shear modulus G (arbitrary unit of rigidity) with time t (min) beyond the gelation time that occurs at tg, where τ is a constant characteristic of the sample, determined by fitting, and G∞ is the value of the shear modulus at t = ∞. The model assumes that the value of G could be approximated by the value of G′ of the gel at the gel hardening stage. Dejmek [82] showed that this model provides a good fit to experimentally obtained curves, but it has non-random residuals, indicating that the function may not be appropriate for its intended purpose.
Later, Sharma et al. [34] proposed another model derived from the Scott Blair & Burnett [83] model, in which they replaced the shear modulus (G) with the complex viscosity modulus (µ*), since µ* is strongly influenced by G′ and therefore by G once milk gelation occurs:
where µ* is the complex viscosity at time t (cP), is µ* at aggregation time (cP), is maximum µ* (cP), λ is the time when µ* reaches (min), and t* is t − ta, where ta is the aggregation time (min).
It has been verified that the model can reproduce the hardening phase of the gel based on the prediction of µ*, measuring this value experimentally, using a Nametre viscometer with a vibration sensor [34].
5.2.2. Douillard Model
Douillard [72] proposed a model in which the rate of change in the complex rigidity modulus with time followed first-order kinetics:
where G* is the complex rigidity modulus (arbitrary unit of rigidity), is the value of the complex rigidity modulus at time t = ∞, t is the time (s) and k is the rate constant (s−1).
Equation (9) can be integrated to give the following:
with the initial condition that G* = 0 at t = t0, where t0 is the time from which G* starts to increase.
In his research, he demonstrated that the gel hardening phase followed first-order kinetics and acknowledged the limitations of stiffness modulus measurements performed by torsion meters. However, Douillard’s model is not entirely satisfactory because, due to its non-sigmoidal nature, the model resulted in deviations in G in the region of the onset of gelation [80].
5.2.3. Bamelis and De Baerdemaeker Model
Using a Foodtexture Puff Device (FPD), Bamelis & De Baerdemaeker [40] generated the following model to monitor milk coagulation:
where A is the initial value of the measured property (mm), B is the change in the initial value at the end of the process of the measured property (mm), C is the estimator of the time shift at the point at which shift is made, D and E are estimators for the asymptotes of the hyperbolic phase (mm/s and mm−1, respectively), k is the rate at which the shift is made from the first (constant) phase to the second (hyperbolic) phase of the curve (here chosen as 0.5 mm−1), t is time (s), and f(t) is the registered characteristic (fitted).
The results correlated with reference measurements (G′ and G″), showing that the sensor signal was able to accurately adjust the course of G′ and G″. The main challenges in the commercial adaptation of this technique are ensuring hygienic operation and finding a way for the device to follow the surface of the milk when a tank is filled to different levels [10]. If these challenges are not overcome, its commercial implementation would apparently be very difficult.
5.2.4. Bittante Model
Bittante [84], using a Lactodynamograph and coagulating samples of Brown Swiss cow’s milk, modeled the firmness of the curd, FC, for a time of 30 min, in terms of distance (mm) of oscillation from the signal of this type of device; the model has some similarity, although it is measured differently, with that of Douillard (1973).
where CFt is the gel firmness at time t (mm), CFP is the asymptotic potential value of CF at infinite time (mm), kCF is the gel hardening rate constant (min−1), and RCT is the coagulation time (min).
Subsequently, Bittante et al. [85] proposed an improvement to the model by extending the modeling time to 60 min for a more accurate estimation of the model parameters in cases of late-clotting breeds such as Holstein–Friesian. Later, Bittante et al. [86] and Pazzola et al. [87] applied this latter model to the study of sheep and goat milk coagulation, respectively. However, the instrument used for modeling presented some drawbacks, such as the low repeatability of the milk coagulation properties [88] and a lack of accuracy and precision compared to a rheometer. In fact, G′ is not directly measured.
5.2.5. Panikuttira and Collaborators Model
Panikuttira et al. [31], using a sensor that combines an infrared light scattering signal at 880 nm (R) and a fluorescence signal at 350 nm (F) induced by ultraviolet light at 280 nm, monitored the rennet coagulation of skimmed milk at different protein concentrations (3.3%, 4.0% and 4.7%), developing a model to predict the gel cutting time based on a pre-set storage module (G′):
where PTcut is the cut-off time to be estimated for a prefixed value of G′ (min), is the time corresponding to the minimum value of the first derivative of F (min), is the time corresponding to the maximum value of the first derivative of R (min) and β1, β2 and β3 are constants.
The standard error of prediction for this model was 1.6 min. The cut-off times predicted from the developed model had an R2 of 0.98, corresponding to selected G′ values measured using a rheometer. Based on this model, the optimal cut-off time can be predicted for selected G′ values once the milk protein concentration is known. However, the model shows greater accuracy at cut-off times of 20 to 25 min, with a slight increase in prediction deviations observed at cut-off times above 25 min, which are typically the most common (typically > 30 min [27]).
5.3. Hybrid Models
5.3.1. Dwyer and Collaborators Model
Dwyer et al. [43] analyzed the dynamics of microstructural changes in milk during the curdling process using high-resolution ultrasonic spectroscopy in combination with dynamic rheology and NIR transmission measurements.
Although the potential of ultrasound for monitoring milk coagulation was demonstrated, difficulties were found in tracking the gel hardening stage. Furthermore, air bubbles in the milk, and possibly fat globules, were found to confound some of the measurements. It was concluded that a significant amount of development work would be required to bring the technology to a stage where it could be used online in a commercial cheese-making setting [44].
5.3.2. Castillo and Collaborators Model
Using an NIR light backscattering sensor, Castillo et al. [65] developed a kinetic model for rennet-induced gel formation in goat’s milk that differentiated casein micelle aggregation, described by second-order kinetics, from subsequent curd firming, described by first-order kinetics.
The proposed model for the gel hardening phase was as follows:
where Rf is the light backscatter ratio (dimensionless) at time t-t0, R∞ is the light backscatter ratio at t = ∞, R0 is the light backscatter ratio at t0, k1 is the first-order reaction rate constant (s−1), t is the time after enzyme addition (s), and t0 is the start time of the gel hardening reaction, equal to t2min of the second derivative of the reflectance ratio R.
In this research work, an integrated model was also developed for the aggregation and gel hardening phases; in this model, it was considered that the increase in light backscatter during the aggregation period corresponded to second-order kinetics and that the gel hardening period corresponded to first-order kinetics, resulting in
where Rmax is the light backscatter ratio at Tmax (dimensionless), β1 is the increase in the dispersion ratio, after Tmax, resulting exclusively from the aggregation reactions of the gel (%), k2 is the second-order rate constant (s−1)—aggregation—t′ is the time after the addition of the enzyme (s), Tmax is the maximum of the first derivative of the light scatter ratio (s), and k1 is the first-order rate constant (s−1)—hardening.
Under specific experimental conditions, the aggregation and gel hardening phases could be distinguished by the appearance of a shoulder in the light backscattering profile, particularly at low coagulation temperatures and protein concentrations. At higher temperatures and protein concentrations, this shoulder became less evident because aggregation and gel hardening increasingly overlapped [9]. The integrated model accounts for these overlapping contributions by describing micellar aggregation through second-order kinetics and gel hardening through first-order kinetics, with their relative contributions characterized by the kinetic constants (k2) and (k1) and the parameter (β1). Despite the overlap between these processes, the model provided an excellent fit to the experimental data, with an average (R2) of 0.9975 ± 0.0027 and a standard error of prediction (SEP) of 0.0081 ± 0.0037, demonstrating its high accuracy under the experimental conditions evaluated. Although light backscattering provides an indirect measurement of structural changes during coagulation rather than a direct assessment of rheological properties, the model enables continuous monitoring of the contributions of micellar aggregation and gel hardening from a single optical signal. Therefore, this approach provides a useful framework for characterizing the kinetics of rennet-induced gel formation while offering advantages for non-destructive and potentially in-line monitoring.
5.3.3. Arango and Castillo Model
Arango & Castillo [66] developed a model that correlates the light backscattering ratio R of an NIR light sensor with the storage modulus G′ measured with a rheometer during the gel hardening phase. This model was obtained by combining Equation (14) proposed by Castillo et al. [65] with an equation derived from Douillard [72], Equation (10), in which the shear modulus term G was replaced by the elastic modulus G′, obtaining the following equation:
where G′ is the elastic modulus at time t (Pa), is the elastic modulus at t = ∞ (Pa), kGR = kG/kR is a dimensionless constant that represents the ratio between the rates of increase in the values of G′ and R as a result of gel hardening.
Equation (15) represents a mathematical model that does not include time and allows for the input of real-time collected R data into the model to calculate the value of the rheological variable G′. In this way, this equation can be used to monitor inline the hardness of the gel using an infrared light scattering sensor.
The model assumes that the milk composition and coagulation temperature will remain constant. However, these conditions can change in processing plants; therefore, it is necessary to standardize the milk composition and establish a constant temperature for the milk coagulation process in order to obtain accurate predictions of the elastic modulus G′, unless corrections are introduced into the model to compensate for the effect of these factors. From a computational perspective, the model offers the advantage of directly converting the real-time optical signal (R) into the storage modulus (G′) through a calibrated algebraic relationship, without explicitly using time as an input variable, thus facilitating continuous in-line monitoring of curd firming. The model showed an excellent fit between optical and rheological measurements under the experimental conditions evaluated (R2 > 0.998 for most treatments). However, its accuracy depends on the calibration conditions, particularly milk composition and coagulation temperature, because the relationship between light backscattering and G′ may change when these factors vary. Consequently, application beyond the calibration conditions may require recalibration or the incorporation of these factors as additional model variables.
Salvador et al. [89], performed coagulations of reconstituted low-heat milk powder at two protein levels (3.4 and 5.1%) and two temperature levels (30 and 40 °C) and monitoring them in parallel on a rheometer and on a device adapted with an NIR scattering sensor that measured the light backscattering ratio R. These authors verified that the coefficients of the predictors selected by SAS 9.4 for prediction models of visual coagulation time (tclot), gelation time (tgel; G′ = 1 Pa) and time at which the gel reaches a value of 30 Pa (tG′30) had different significances, observing that the significant predictors tmax and t2min had more relevance for tclot and tgel, while t2min2 was more relevant for predicting tG′30, which showed that it was possible to generate a model to predict the value of G′ in the protein and temperature range studied.
By simplifying the Arango and Castillo model, and introducing the protein parameter into the simplified model to improve the prediction of gel hardness in terms of its elastic modulus, G′, a model was obtained that was successfully validated at the laboratory, pilot plant and industrial levels, and is currently in the process of industrial transfer.
5.4. Emerging Approaches Based on Artificial Intelligence
The development of Industry 4.0 and the increasing availability of smart sensors have opened opportunities for the use of Artificial Intelligence (AI) in cheese manufacturing. Unlike traditional empirical and mechanistic models, AI-based approaches are capable of learning complex relationships among multiple process variables without requiring an explicit description of the physicochemical mechanisms underlying κ-casein hydrolysis, micelle aggregation, and gel firming. AI is now being employed to optimize various stages of the production chain—including coagulation, fermentation, quality control, and defect detection—by integrating data from optical, spectroscopic, and rheological sensors, as well as computer vision systems [67,90].
5.4.1. Machine Learning
Machine learning (ML) currently represents one of the most promising data-driven approaches for process modeling in cheese manufacturing. Supervised learning algorithms, including Random Forest, Support Vector Machines (SVMs), Gradient Boosting, Extreme Gradient Boosting (XGBoost), and Gaussian Process Regression, can establish complex relationships between process and product variables and response variables such as coagulation time, curd firmness, cheese yield, and other quality attributes. A major advantage of these approaches is their ability to capture complex and highly nonlinear relationships without explicitly formulating the kinetic or mechanistic equations governing the process. Machine learning approaches have been investigated across different stages of cheese manufacturing, including fermentation and coagulation, as well as for the characterization of the final product and the detection of adulteration or food fraud. Nevertheless, further validation using large-scale industrial datasets and under real processing conditions is required to establish their robustness, generalizability, and suitability for industrial implementation [67].
5.4.2. Artificial Neural Networks
Artificial Neural Networks (ANNs) represent one of the most widely used AI techniques for modeling complex food systems. These networks are capable of approximating highly nonlinear functions and establishing relationships between multiple input and output variables. In cheese manufacturing, ANNs can simultaneously integrate data from optical sensors, near-infrared (NIR) spectroscopy, ultrasound, physicochemical variables, and operating conditions to estimate parameters such as curd firmness, storage modulus (G′), optimal cutting time, and cheese yield. However, their main limitation remains the need for large datasets for training and the models’ limited interpretability—a characteristic commonly referred to as the “black box” [67,91].
5.4.3. Deep Learning
Deep Learning (DL), a branch of machine learning based on neural networks with multiple hidden layers, enables the automatic extraction of complex and hierarchical features from large datasets. In the context of milk coagulation, Convolutional Neural Networks (CNNs) and other deep learning approaches can be used to extract relevant features from images acquired during curd formation, while the incorporation of temporal information from image sequences can capture the dynamic evolution of curd firming. A recent example is the work of Loddo et al. [92], who developed a computer vision and machine learning-based system for the automatic detection of curd firming time during cheese production. The proposed approach combines features extracted from individual images with temporal information derived from image sequences, providing real-time information on curd firmness and supporting the prediction of the optimal cutting time [89].
5.4.4. Digital Twins
Digital twins represent a promising emerging technology for the digitalization and automation of food processing. A digital twin consists of a dynamic virtual representation of a physical process that is continuously updated using data acquired from the corresponding physical system. The integration of process sensors, Internet of Things (IoT) technologies, mathematical or data-driven models, and artificial intelligence could enable real-time monitoring and simulation of milk coagulation, detection of process deviations, and decision support for the optimization of critical process variables such as temperature, rennet dosage, and curd cutting time. Although specific applications of digital twins to enzymatic milk coagulation are still scarce, recent research identifies digital twin technology as a promising direction for the development of intelligent monitoring, prediction, optimization, and process-control systems in food and dairy processing [89,90].
Table 1 shows a comparison of models of the gel hardening phase, classifying them based on the measured property, showing relevant aspects and limitations of each one. Table 2 expands on the content presented in Table 1 by focusing on aspects more closely related to the current state of the technology and its applicability to industrial-scale implementation.
Table 1.
Comparison of models of the gel hardening phase from a theoretical point of view.
Table 2.
Comparison of models of the gel hardening phase from the point of view of their practical implementation at industrial scale.
6. Summary
The gel hardening stage can be modeled using different properties of coagulating milk, such as rheological, thermal, ultrasonic, electrical, and optical properties. Rheological properties have been the basis of numerous models. The Scott Blair & Burnett [69] model provides a good fit to experimentally obtained curves, but with non-random residuals, indicating that the function may not be suitable for its intended purpose. The Tuszyński [68] model incorporates kinetic constants, but it does not provide any indication of how changes in reaction variables will influence the gel hardening process. The Douillard model [72], which has been extensively tested within certain limits, is not entirely satisfactory because the elastic modulus of coagulating milk exhibits deviations in the region of initial gelation. The Tokita et al. model [71], an improvement on the Douillard equation [72], requires further experimental work for refinement. The Carlson et al. model [79] provides a good fit with a low standard error, but it is complex and does not distinguish between the aggregation and gel hardening stages of milk coagulation. The model by Mellema et al. [15] explains the reorganization and fusion of particles during the gel hardening stage. However, at pH values below that of milk (6.6), it suggests that the structures become more flexible or curved over time, which contradicts observations made by confocal microscopy. The model by Bamelis & De Baerdemaeker [40] has proven efficient in describing the gel hardening phase in terms of G′. However, the main challenges for the commercial adaptation of this model are ensuring the hygienic operation of the measuring device and finding a way for the device to track the milk surface when a vat is filled to different levels. Bittante’s model [84] offers a very good fit to data obtained from milk samples with very different compositions, produced by cows of different breeds, but it may have problems predicting gel firmness in milk from late-coagulating breeds; moreover, the instrument used does not have the same repeatability and precision as a rheometer. Thermal properties have also served as the basis for several attempts to model the gel hardening phase. Thus, Hori [75] used a hot-wire sensor, measuring coagulation time with considerable accuracy, but this does not follow the gel hardening phase. Additionally, attempts have been made to model the gel hardening phase using the acoustic properties of coagulating milk. For example, Dwyer et al. [43] used ultrasound waves to model the three phases of milk coagulation; however, they concluded that there were problems in fully modeling the gel hardening stage. Modeling with electrical properties has also been tested; however, there are problems for its application in industry because it was found that, due to the large temperature coefficient of the electrical conductivity of milk, it is necessary to minimize the temperature gradients during milk coagulation; on the other hand, the variation in electrolytes due to sodium chloride and calcium salts also confounds the changes in conductivity as a measure of coagulation. In recent decades, the study of optical properties during milk coagulation has led to the formulation of several models for the gel hardening phase. Castillo et al. [65] successfully modeled the gel hardening phase using a near-infrared (NIR) light scattering sensor, enabling them to differentiate between the aggregation and gel hardening stages. However, the signal from this type of sensor is based on optical properties, indirectly measuring rheological properties. The model by Arango & Castillo [66] reports real-time G′ values from a near-infrared scattering sensor signal and allows for the determination of the gel cutting time at a specific G′ value. This model accurately predicts G′ values starting at 1 Pa. Subsequently, Salvador et al. [86] simplified the original model by incorporating protein content to improve G′ prediction. The model by Panikuttira et al. [31] combines the signal from a near-infrared light scattering sensor with a fluorescence sensor signal to predict the gel cutting time based on a predefined storage modulus (G′). However, this model exhibits greater accuracy at cutting times of 20 to 25 min, with a slight increase in prediction deviations observed at cutting times above 25 min, which are the most common in cheesemaking. For current industrial applications, optical approaches based on light backscattering, such as those reported by Arango and Castillo [66] and Panikuttira et al. [31], are among the most promising alternatives because they enable continuous, non-destructive, and potentially inline monitoring of milk coagulation. AI-based approaches offer considerable potential for capturing complex nonlinear relationships and integrating multiple process variables; however, their validation under real industrial conditions remains limited. Rather than being competing technologies, optical sensing and AI can be considered complementary approaches, since machine learning models could enhance the predictive capabilities of optical monitoring systems when sufficiently large and representative datasets are available. Conventional rheological methods remain valuable as reference techniques for characterizing curd formation and firmness, although their implementation for continuous inline monitoring presents practical limitations. Consequently, the integration of optical sensors with data-driven and AI-based models represents a promising direction for real-time monitoring and prediction of the optimal curd-cutting time.
7. Conclusions
As we have seen previously, there are two stages in the enzymatic coagulation of milk. The second stage, corresponding to the non-enzymatic phase, involves the substages of aggregation of hydrolyzed micelles until the formation of a network (gel) and subsequent hardening of the gel [5,6,7,8,65]. The gel hardening stage is the least known stage of enzymatic coagulation of milk; however, it is an important stage because, on one hand, it lasts for approximately half of the total milk coagulation time [89], and on the other hand, it is the phase in which particle rearrangement and fusion phenomena occur that will influence the final characteristics of the cheese [5]. Furthermore, the beginning of this phase coincides with the first increases in G′, thus also differentiating it from the micellar aggregation stage. For these reasons, models describing micellar aggregation cannot be used to model this final stage of enzymatic coagulation of milk. Therefore, models that attempt to explain and differentiate this final, but important, stage of enzymatic coagulation of milk have been reviewed.
Several models have been formulated to demonstrate the existence of the curdling stage and to explain the phenomena that occur during this stage. Rheological models have shown a high capacity for interpreting the phenomena that occur in the gel once it has formed; however, the intrusive nature of the devices used to measure mechanical properties makes them impractical for industrial use. Thermal, acoustic, and electrical methods present difficulties in modeling the curdling stage; moreover, these methods can only differentiate the three stages of milk coagulation to varying degrees. Finally, optical methods, which are more compatible with food hygiene and can be used online compared to the other methods studied, have demonstrated the ability to differentiate the three stages of milk coagulation. These methods can be supported by models formulated based on rheological signals to improve their fit and increase their predictive power. It is also worth noting that no single model fully describes all the phenomena involved in gel hardening. Rheological models provide a strong physical basis for characterizing the development of the gel network and its viscoelastic properties, whereas optical approaches are particularly promising for continuous, non-destructive, and potentially inline industrial monitoring. The integration of optical sensing with rheological measurements as reference data and artificial intelligence represents a promising direction for future research. In particular, future studies should explore hybrid mechanistic–data-driven models that combine physical knowledge of milk coagulation with rheological and optical measurements and machine learning algorithms, with the ultimate goal of enabling real-time prediction, optimization, and control of cheese manufacturing processes.
Finally, we believe that with the development of increasingly intelligent and sensitive computer systems and sensors, and with the combination of current models using AI, the goal of achieving a model that accurately tracks milk coagulation, in order to maximize cheese yield and quality, will become an increasingly attainable objective.
Author Contributions
Conceptualization M.C.; investigation, D.S.; writing—original draft preparation, D.S. and M.C.; writing—review and editing, M.C.; project administration, D.S. and M.C.; and funding acquisition, D.S. and M.C. All authors have read and agreed to the published version of the manuscript.
Funding
This research has been funded by Generalitat de Catalunya (Project VALTEC; VALTEC13-1-0141-00) (M.C.) and by the Peruvian National Scholarship Program (RJ-145-2017-MINEDU/VMGI-PRONABEC-OBPOST) (D.S.).
Institutional Review Board Statement
Not applicable.
Informed Consent Statement
Not applicable.
Data Availability Statement
No new data were created or analyzed in this study. Data sharing is not applicable to this article.
Acknowledgments
The authors thank the Departament de Ciència Animal i dels Aliments and the Centre d’Innovació, Recerca i Transferència en Tecnologia dels Aliments (CIRTTA) for the usage of their facilities.
Conflicts of Interest
The authors declare no conflicts of interest.
References
- USDA Foreign Agricultural Service. Cheese: World Markets and Trade. Available online: https://www.fas.usda.gov/data/production/0240000 (accessed on 3 August 2026).
- Smykov, I.T. Milk curd cutting time determination in cheesemaking. Food Syst. 2022, 5, 4–11. [Google Scholar]
- Timlin, M.; Brodkorb, A.; Harbourne, N.; O’Callaghan, T.F.; Drouin, G.; Pacheco-Pappenheim, S.; Hennessy, D.; O’Donovan, M.; Pierce, K.M.; Corrigan, B.M.; et al. The impact of seasonal calving systems with varying pasture allowance on Cheddar cheese composition, nutritional quality, and ripening characteristics. J. Dairy Sci. 2024, 107, 10310–10327. [Google Scholar] [CrossRef] [Scilit] [PubMed]
- Chen, C.-C.; Chen, L.-Y.; Li, W.-T.; Chang, K.-L.; Kuo, M.-I.; Chen, C.-J.; Hsieh, J.-F. Influence of Chymosin on Physicochemical and Hydrolysis Characteristics of Casein Micelles and Individual Caseins. Nanomaterials 2021, 11, 2594. [Google Scholar] [CrossRef] [Scilit] [PubMed]
- Bauland, J.; Famelart, M.-H.; Faiveley, M.; Croguennec, T. Rheological properties of enzymatic milk gel: Effect of ion partitioning in casein micelles. Food Hydrocoll. 2022, 130, 107739. [Google Scholar] [CrossRef] [Scilit]
- Lyndgaard, C.B.; Engelsen, S.B.; van den Berg, F.W.J. Real-time modeling of milk coagulation using in-line near infrared spectroscopy. J. Food Eng. 2012, 108, 345–352. [Google Scholar] [CrossRef] [Scilit]
- Choi, J.; Horne, D.S.; Lucey, J.A. Effect of insoluble calcium concentration on endogenous syneresis rate in rennet-coagulated bovine milk. J. Dairy Sci. 2015, 98, 5955–5966. [Google Scholar] [CrossRef] [Scilit] [PubMed]
- Arango, O.; Trujillo, A.J.; Castillo, M. Monitoring the effect of inulin, protein, and calcium on milk coagulation phases using a fibre optic sensor. Int. Dairy J. 2018, 81, 80–86. [Google Scholar] [CrossRef] [Scilit]
- Salvador, D.; Acosta, Y.; Zamora, A.; Castillo, M. Rennet-Induced Casein Micelle Aggregation Models: A Review. Foods 2022, 11, 1243. [Google Scholar] [CrossRef] [Scilit] [PubMed]
- O’Callaghan, D.J.; O’Donnell, C.P. Monitoring Gel Formation in Cheese Manufacture. In Encyclopedia of Dairy Sciences, 3 ed; McSweeney, P., McNamara, J., Eds.; Elsevier: Amsterdam, The Netherlands, 2022; Volume 3, pp. 238–244. [Google Scholar]
- Payne, F.A.; Castillo, M. Light Backscatter Sensor Applications in Milk Coagulation. In Encyclopedia of Agricultural, Food, and Biological Engineering; Heldman, D., Moraru, C., Eds.; Taylor & Francis: London, UK, 2007; pp. 1530–1534. [Google Scholar]
- Guinee, T.P. Effect of high-temperature treatment of milk and whey protein denaturation on the properties of rennet–curd cheese: A review. Int. Dairy J. 2021, 121, 105095. [Google Scholar] [CrossRef] [Scilit]
- Aldalur, A.; Bustamante, M.Á.; Salmerón, J.; Barron, L.J.R. Relationships between cheese-processing conditions and curd and cheese properties to improve the yield of Idiazabal cheese made in small artisan dairies: A multivariate approach. J. Dairy Sci. 2021, 104, 253–269. [Google Scholar] [CrossRef] [Scilit] [PubMed]
- Page, M.J.; McKenzie, J.E.; Bossuyt, P.M.; Boutron, I.; Hoffmann, T.C.; Mulrow, C.D.; Shamseer, L.; Tetzlaff, J.M.; Akl, E.A.; Brennan, S.E.; et al. The PRISMA 2020 statement: An updated guideline for reporting systematic reviews. BMJ 2021, 372, n71. [Google Scholar] [CrossRef] [Scilit] [PubMed]
- Mellema, M.; Walstra, P.; van Opheusden, J.H.J.; van Vliet, T. Effects of structural rearrangements on the rheology of rennet-induced casein particle gels. Adv. Colloid Interface Sci. 2002, 98, 25–50. [Google Scholar] [CrossRef] [Scilit] [PubMed]
- Mellema, M.; Heesakkers, J.W.M.; van Opheusden, J.H.J.; van Vliet, T. Structure and Scaling Behavior of Aging Rennet-Induced Casein Gels Examined by Confocal Microscopy and Permeametry. Langmuir 2000, 16, 6847–6854. [Google Scholar] [CrossRef] [Scilit]
- Bremer, L. Fractal Aggregates in Relation to Formation and Properties of Particle Gels. PhD Thesis, Wageningen Agricultural University, Wageningen, The Netherlands, 1992. [Google Scholar]
- Horne, D.S.; Banks, J. Rennet-induced Coagulation of Milk. In Cheese Chemistry, Physics and Microbiology; Fox, P., McSweeney, P., Cogan, T., Guinee, T., Eds.; Elsevier Ltd.: London, UK, 2004; pp. 47–70. [Google Scholar]
- Walstra, P. Physical Chemistry of Foods; Marcel Dekker: New York, NY, USA, 2003; pp. 425–486. [Google Scholar]
- Vanderheiden, G. An apparatus for continuously monitoring the structural rigidity of a gel. CSIRO Food Res. Quart. 1976, 36, 45–47. [Google Scholar]
- Fox, P.; Guinee, T.; Cogan, T.; McSweeney, P. Fundamentals of Cheese; Aspen Publishers: Boston, MA, USA, 2000; pp. 115–116. [Google Scholar]
- Anandha, M. Rheology of Fluid, Semisolid, and Solid Foods; Springer: New York, NY, USA, 2014; p. 75. [Google Scholar]
- Tornberg, E. Influence of Fibers and Particle Size Distribution on Food Rheology. In Advences in Food Rheology and Its Applications; Ahmed, J., Ptaszek, P., Basu, S., Eds.; Elsevier: Cambridge, UK, 2017; pp. 177–208. [Google Scholar]
- Sanz, T.; Salvador, A.; Hernández, M. Creep-Recovery and Oscillatory Rheology of Flour-Based Systems. In Advances in Food Rheology and Its Applications; Ahmed, J., Ptaszek, P., Basu, S., Eds.; Elsevier: Cambridge, UK, 2017; pp. 277–295. [Google Scholar]
- Van Vliet, T. Rheology and Fracture Mechanics of Foods; Taylor & Francis Group: New York, NY, USA, 2014; pp. 100–101. [Google Scholar]
- Létang, C.; Piau, M.; Verdier, C. Characterization of wheat flour–water doughs. Part I: Rheometry and microstructure. J. Food Eng. 1999, 41, 121–132. [Google Scholar] [CrossRef] [Scilit]
- Fox, P.; Guinee, T.; Cogan, T.; McSweeney, P. Fundamentals of Cheese Science, 1st ed.; Springer: New York, NY, USA, 2017; pp. 185–229. [Google Scholar]
- Fox, P.; Guinee, T. Cheese Science and Technology. In Milk and Dairy Products in Human Nutrition; Park, Y., Haenlein, G., Eds.; John Wiley & Sons: Chichester, UK, 2013; pp. 357–389. [Google Scholar]
- Gunasekaran, S.; Mehmet, A. Cheese Rheology and Texture, 1st ed.; CRC Press: Boca Raton, FL, USA, 2003; p. 23. [Google Scholar]
- Guinee, T.P.; O’Callaghan, D.J.; Pudja, P.D.; O’Brien, N. Rennet coagulation properties of retentates obtained by ultrafiltration of skim milks heated to different temperatures. Int. Dairy J. 1996, 6, 581–596. [Google Scholar] [CrossRef] [Scilit]
- Panikuttira, B.; Payne, F.A.; O’Shea, N.; Tobin, J.T.; O’Callaghan, D.J.; O’Donnell, C.P. Investigation of an in-line prototype fluorescence and infrared backscatter sensor to monitor rennet-induced coagulation of skim milk at different protein concentrations. Int. J. Food Sci. Technol. 2020, 55, 175–182. [Google Scholar] [CrossRef] [Scilit]
- Arango, O.; Trujillo, A.J.; Castillo, M. Influence of fat replacement by inulin on rheological properties, kinetics of rennet milk coagulation, and syneresis of milk gels. J. Dairy Sci. 2013, 96, 1984–1996. [Google Scholar] [CrossRef] [Scilit] [PubMed]
- O’Callaghan, D.J.; O’Donnell, C.P.; Payne, F.A. Review of systems for monitoring curd setting during cheesemaking. Int. J. Dairy Technol. 2002, 55, 65–74. [Google Scholar] [CrossRef] [Scilit]
- Sharma, S.K.; Hill, A.R.; Mittal, G.S. Effect of milk concentration, pH and temperature on aggregation kinetics and coagulation properties of ultrafiltered (UF) milk. Food Res. Int. 1993, 26, 81–87. [Google Scholar] [CrossRef] [Scilit]
- Senge, B.; Schulz, D.; Krenkel, K. Structure formation in milk during rennet coagulation. Appl. Rheol. 1997, 7, 153–160. [Google Scholar] [CrossRef] [Scilit][Green Version]
- Schulz, D.; Senge, B.; Krenkel, K. Beitrag zur Beschreibung des Strukturierungsverhaltens von Milch bei der Labgerinnung. 1. Mess- und Auswerteverfahren. Milchwissenschaft 1997, 52, 243–246. [Google Scholar]
- Sharma, S.; Hill, A.; Goff, H.; Yada, R. Measurement of coagulation time and curd firmness of renneted milk using a Nametre viscometer. Milchwissen-Schaft 1989, 44, 682–685. [Google Scholar]
- O’Callaghan, D.J.; O’Donnell, C.P.; Payne, F.A. On-line sensing techniques for coagulum setting in renneted milks. J. Food Eng. 2000, 43, 155–165. [Google Scholar] [CrossRef] [Scilit]
- O’Callaghan, D.J. Gel firmness and its measurement. In Encyclopedia of Dairy Sciences, 2nd ed.; Fuquay, J.W., Fox, P.F., McSweeney, P.L.H., Eds.; Elsevier: Jackson, MS, USA, 2011; Volume 1, pp. 585–590. [Google Scholar]
- Bamelis, F.R.; De Baerdemaeker, J.G. Use of the Foodtexture Puff Device to Monitor Milk Coagulation. J. Dairy Sci. 2006, 89, 29–36. [Google Scholar] [CrossRef] [Scilit] [PubMed]
- Corredig, M.; Alexander, M.; Dalgleish, D.G. The application of ultrasonic spectroscopy to the study of the gelation of milk components. Food Res. Int. 2004, 37, 557–565. [Google Scholar] [CrossRef] [Scilit]
- Mohammadi, V.; Ghasemi-Varnamkhasti, M.; Ebrahimi, R.; Abbasvali, M. Ultrasonic techniques for the milk production industry. Measurement 2014, 58, 93–102. [Google Scholar] [CrossRef] [Scilit]
- Dwyer, C.; Donnelly, L.; Buckin, V. Ultrasonic analysis of rennet-induced pre-gelation and gelation processes in milk. J. Dairy Res. 2005, 72, 303–310. [Google Scholar] [CrossRef] [Scilit] [PubMed]
- Castillo, M. Cutting time prediction methods in cheese making. In Encyclopedia of Agricultural, Food, and Biological Engineering; Taylor & Francis Group: Boca Raton, FL, USA, 2006; pp. 1–7. Available online: http://www.manuelcastillo.es/pdfs-publications/Cutting%20Time%20Prediction%20Methods%20in%20Cheese%20Making.htm.pdf (accessed on 3 August 2026).
- Lu, R. Light Scattering Technology for Food Property, Quality and Safety Assessment; Taylor & Francis Group: Boca Raton, FL, USA, 2016; pp. 28–29. [Google Scholar]
- Hardy, J.; Fanni, J. Application of Reflection Photometry to the Measurement of Milk Coagulation. J. Food Sci. 1981, 46, 1956–1957. [Google Scholar] [CrossRef] [Scilit]
- McMahon, D.J.; Brown, R.J.; Richardson, G.H.; Ernstrom, C.A. Effects of Calcium, Phosphate, and Bulk Culture Media on Milk Coagulation Properties 1. J. Dairy Sci. 1984, 67, 930–938. [Google Scholar] [CrossRef] [Scilit]
- McMahon, D.J.; Brown, R.J.; Ernstrom, C.A. Enzymic Coagulation of Milk Casein Micelles 1. J. Dairy Sci. 1984, 67, 745–748. [Google Scholar] [CrossRef] [Scilit]
- Korolczuk, J. Refractometric signal evolution during rennet coagulation of milk. Neth. Milk. Dairy J. 1988, 42, 313–322. [Google Scholar]
- De Kruif, C.G. The Turbidity of Renneted Skim Milk. J. Colloid Interface Sci. 1993, 156, 38–42. [Google Scholar] [CrossRef] [Scilit]
- Dybowska, B.; Fujio, Y. Effect of temperature and glucono-δ-lactone (GDL) concentration on milk aggregation and gelation process as revealed by optical method. Milchwissenschaft 1996, 51, 557–560. [Google Scholar]
- Kübarsepp, I.; Henno, M.; Kärt, O.; Tupasela, T. A comparison of the methods for determination of the rennet coagulation properties of milk. Acta Agric. Scand. Sect. A Anim. Sci. 2005, 55, 145–148. [Google Scholar] [CrossRef] [Scilit]
- Pretto, D.; Kaart, T.; Vallas, M.; Jõudu, I.; Henno, M.; Ancilotto, L.; Cassandro, M.; Pärna, E. Relationships between milk coagulation property traits analyzed with different methodologies. J. Dairy Sci. 2011, 94, 4336–4346. [Google Scholar] [CrossRef] [Scilit] [PubMed]
- Cipolat-Gotet, C.; Cecchinato, A.; De Marchi, M.; Penasa, M.; Bittante, G. Comparison between mechanical and near-infrared methods for assessing coagulation properties of bovine milk. J. Dairy Sci. 2012, 95, 6806–6819. [Google Scholar] [CrossRef] [Scilit] [PubMed]
- Payne, F.; Madangopal, S.; Hicks, C.; Shearer, S. Fiber optic milk coagulation sensor for cut-time detection. In Food Processing Automation Conference; American Society of Agricultural Engineers: St. Joseph, MI, USA, 1990. [Google Scholar]
- Payne, F.A.; Hicks, C.L.; Shen, P.S. Predicting Optimal Cutting Time of Coagulating Milk Using Diffuse Reflectance 1. J. Dairy Sci. 1993, 76, 48–61. [Google Scholar] [CrossRef] [Scilit]
- Castillo, M.; Payne, F.A.; Hicks, C.L.; Lopez, M.B. Predicting cutting and clotting time of coagulating goat’s milk using diffuse reflectance: Effect of pH, temperature and enzyme concentration. Int. Dairy J. 2000, 10, 551–562. [Google Scholar] [CrossRef] [Scilit]
- Abdelgawad, A.R.; Guamis, B.; Castillo, M. Using a fiber optic sensor for cutting time prediction in cheese manufacture from a mixture of cow, sheep and goat milk. J. Food Eng. 2014, 125, 157–168. [Google Scholar] [CrossRef] [Scilit]
- Nicolau, N.; Buffa, M.; O’Callaghan, D.J.; Guamis, B.; Castillo, M. Estimation of clotting and cutting times in sheep cheese manufacture using NIR light backscatter. Dairy Sci. Technol. 2015, 95, 495–507. [Google Scholar] [CrossRef] [Scilit]
- Arango, O.; Trujillo, A.J.; Castillo, M. Predicting coagulation and syneresis parameters of milk gels when inulin is added as fat substitute using infrared light backscatter. J. Food Eng. 2015, 157, 63–69. [Google Scholar] [CrossRef] [Scilit]
- Abdelgawad, A.R.; Rovai, M.; Caja, G.; Leitner, G.; Castillo, M. Evaluating coagulation properties of milk from dairy sheep with subclinical intramammary infection using near infrared light scatter. A preliminary study. J. Food Eng. 2016, 168, 180–190, Correction in J. Food Eng. 2016, 171, 248. https://doi.org/10.1016/j.jfoodeng.2015.11.005. [Google Scholar] [CrossRef] [Scilit]
- Tabayehnejad, N.; Castillo, M.; Payne, F.A. Comparison of total milk-clotting activity measurement precision using the Berridge clotting time method and a proposed optical method. J. Food Eng. 2012, 108, 549–556. [Google Scholar] [CrossRef] [Scilit]
- Fagan, C.C.; Ferreira, T.G.; Payne, F.A.; O’Donnell, C.P.; O’Callaghan, D.J.; Castillo, M. Preliminary evaluation of endogenous milk fluorophores as tracer molecules for curd syneresis. J. Dairy Sci. 2011, 94, 5350–5358. [Google Scholar] [CrossRef] [Scilit] [PubMed]
- Hass, R.; Munzke, D.; Vargas Ruiz, S.; Tippmann, J.; Reich, O. Optical monitoring of chemical processes in turbid biogenic liquid dispersions by Photon Density Wave spectroscopy. Anal. Bioanal. Chem. 2015, 407, 2791–2802. [Google Scholar] [CrossRef] [Scilit] [PubMed]
- Castillo, M.Z.; Payne, F.A.; Hicks, C.L.; Laencina, J.S.; López, M.B. Modelling casein aggregation and curd firming in goats’ milk from backscatter of infrared light. J. Dairy Res. 2003, 70, 335–348. [Google Scholar] [CrossRef] [Scilit] [PubMed]
- Arango, O.; Castillo, M. A method for the inline measurement of milk gel firmness using an optical sensor. J. Dairy Sci. 2018, 101, 3910–3917. [Google Scholar] [CrossRef] [Scilit] [PubMed]
- Pardo, D.; Castillo, M.; Mulayim, M.O.; Cerquides, J. Machine learning in cheese-making: Methods, applications, and the future. Food Eng. Rev. 2025, 17, 505–531. [Google Scholar] [CrossRef] [Scilit]
- Tuszyński, W.B. A kinetic model of the clotting of casein by rennet. J. Dairy Res. 1971, 38, 115–125. [Google Scholar] [CrossRef] [Scilit]
- Scott Blair, G.W.; Burnett, J. Physical changes in milk caused by the action of rennet: III. Effects of separation, homogenization and pasteurization and of varying calcium content on the rigidity moduli and viscosities of curd. J. Dairy Res. 1958, 25, 457–466. [Google Scholar] [CrossRef] [Scilit]
- Horne, D.; Lucey, J. Rennet-Induced Coagulation of Milk. In Cheese: Chemistry, Physics and Microbiology; McSweeney, P., Fox, P., Cotter, P., Everett, D., Eds.; Elsevier: Boston, MA, USA, 2017; pp. 115–143. [Google Scholar]
- Tokita, M.; Hikichi, K.; Niki, R.; Arima, S.; Copley, A.L. Dynamic viscoelastic studies on the mechanism of milk clotting process. Biorheology 1982, 19, 209–219. [Google Scholar] [CrossRef] [Scilit] [PubMed]
- Douillard, R. Rheological Analysis of Curd Formation. J. Texture Stud. 1973, 4, 158–165. [Google Scholar] [CrossRef] [Scilit]
- Tokita, M. Gelation mechanism and percolation. Food Hydrocoll. 1989, 3, 263–274. [Google Scholar] [CrossRef] [Scilit]
- Sinaga, H.; Bansal, N.; Bhandari, B. Partial renneting of pasteurised bovine milk: Casein micelle size, heat and storage stability. Food Res. Int. 2016, 84, 52–60. [Google Scholar] [CrossRef] [Scilit]
- Hori, T. Objective measurements of the process of curd formation during rennet treatment of milks by the hot wire method. J. Food Sci. 1985, 50, 911–917. [Google Scholar] [CrossRef] [Scilit]
- Sbodio, O.A.; Tercero, E.J.; Coutaz, R.; Martinez, E. Optimizing Processing Conditions for Milk Coagulation Using the Hot Wire Method and Response Surface Methodology. J. Food Sci. 2002, 67, 1097–1102. [Google Scholar] [CrossRef] [Scilit]
- Sbodio, O.A.; Revelli, G.R. Coagulación de la leche: Desarrollo de un dispositivo para el “monitoreo”online del proceso. Avances en la Argentina. RIA. Rev. Investig. Agropecu. 2012, 38, 236–246. [Google Scholar]
- Sbodio, O.A.; Martínez, E.D.A.; Tercero, E.J.; Didier, M.J.J.; Revelli, G.R. Desarrollo de un dispositivo para monitoreo en la línea del proceso de coagulación de la leche. RIA. Rev. Investig. Agropecu. 2017, 43, 312–327. [Google Scholar]
- Carlson, A.; Hill, C.G., Jr.; Olson, N.F. The kinetics of milk coagulation: IV. The kinetics of the gel-firming process. Biotechnol. Bioeng. 1987, 29, 612–624. [Google Scholar] [CrossRef] [Scilit] [PubMed]
- O’callaghan, D.J.; Guinee, T.P. Comparison of Mathematical Models Applied to the Rennet Coagulation of Skim Milks. J. Texture Stud. 1996, 26, 607–634. [Google Scholar] [CrossRef] [Scilit]
- Esteves, C.; Lucey, J.; Pires, E. Mathematical modelling of the formation of rennet-induced gels by plant coagulants and chymosin. J. Dairy Res. 2001, 68, 499–510. [Google Scholar] [CrossRef] [Scilit] [PubMed]
- Dejmek, P. Dynamic Rheology of Rennet Curd. J. Dairy Sci. 1987, 70, 1325–1330. [Google Scholar] [CrossRef] [Scilit]
- Scott Blair, G.W.; Burnett, J. An equation to describe the rate of setting of blood and milk. Biorheology 1963, 1, 183–191. [Google Scholar] [CrossRef] [Scilit]
- Bittante, G. Modeling rennet coagulation time and curd firmness of milk. J. Dairy Sci. 2011, 94, 5821–5832. [Google Scholar] [CrossRef] [Scilit] [PubMed]
- Bittante, G.; Contiero, B.; Cecchinato, A. Prolonged observation and modelling of milk coagulation, curd firming, and syneresis. Int. Dairy J. 2013, 29, 115–123. [Google Scholar] [CrossRef] [Scilit]
- Bittante, G.; Cipolat-Gotet, C.; Pazzola, M.; Dettori, M.L.; Vacca, G.M.; Cecchinato, A. Genetic analysis of coagulation properties, curd firming modeling, milk yield, composition, and acidity in Sarda dairy sheep. J. Dairy Sci. 2017, 100, 385–394. [Google Scholar] [CrossRef] [Scilit] [PubMed]
- Pazzola, M.; Stocco, G.; Paschino, P.; Dettori, M.L.; Cipolat-Gotet, C.; Bittante, G.; Vacca, G.M. Modeling of coagulation, curd firming, and syneresis of goat milk from 6 breeds. J. Dairy Sci. 2018, 101, 7027–7039. [Google Scholar] [CrossRef] [Scilit] [PubMed]
- Pazzola, M. Coagulation Traits of Sheep and Goat Milk. Animals 2019, 9, 540. [Google Scholar] [CrossRef] [Scilit] [PubMed]
- Salvador, D.; Arango, O.; Castillo, M. In-line estimation of the elastic module of milk gels with variation of temperature protein concentration. Int. J. Food Sci. Technol. 2019, 54, 354–360. [Google Scholar] [CrossRef] [Scilit]
- Xu, N.; Liu, B.; Geng, R.; Zhang, Y.; Yang, X.; Zhang, W.; Qu, B.; Guo, L.; Jiang, Y. AI in cheese manufacturing: A comprehensive review of technologies, applications, and future prospects. Trends Food Sci. Technol. 2026, 172, 105721. [Google Scholar] [CrossRef] [Scilit]
- García-Méndez, S.; de Arriba-Pérez, F.; Somoza-López, M.C. Informatics & dairy industry coalition: AI trends and present challenges. arXiv 2024, arXiv:2406.12770. [Google Scholar]
- Loddo, A.; Di Ruberto, C.; Armano, G.; Manconi, A. Detecting coagulation time in cheese making by means of computer vision and machine learning techniques. Comput. Ind. 2024, 164, 104173. [Google Scholar] [CrossRef] [Scilit]
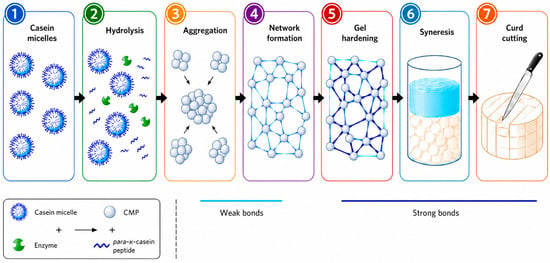
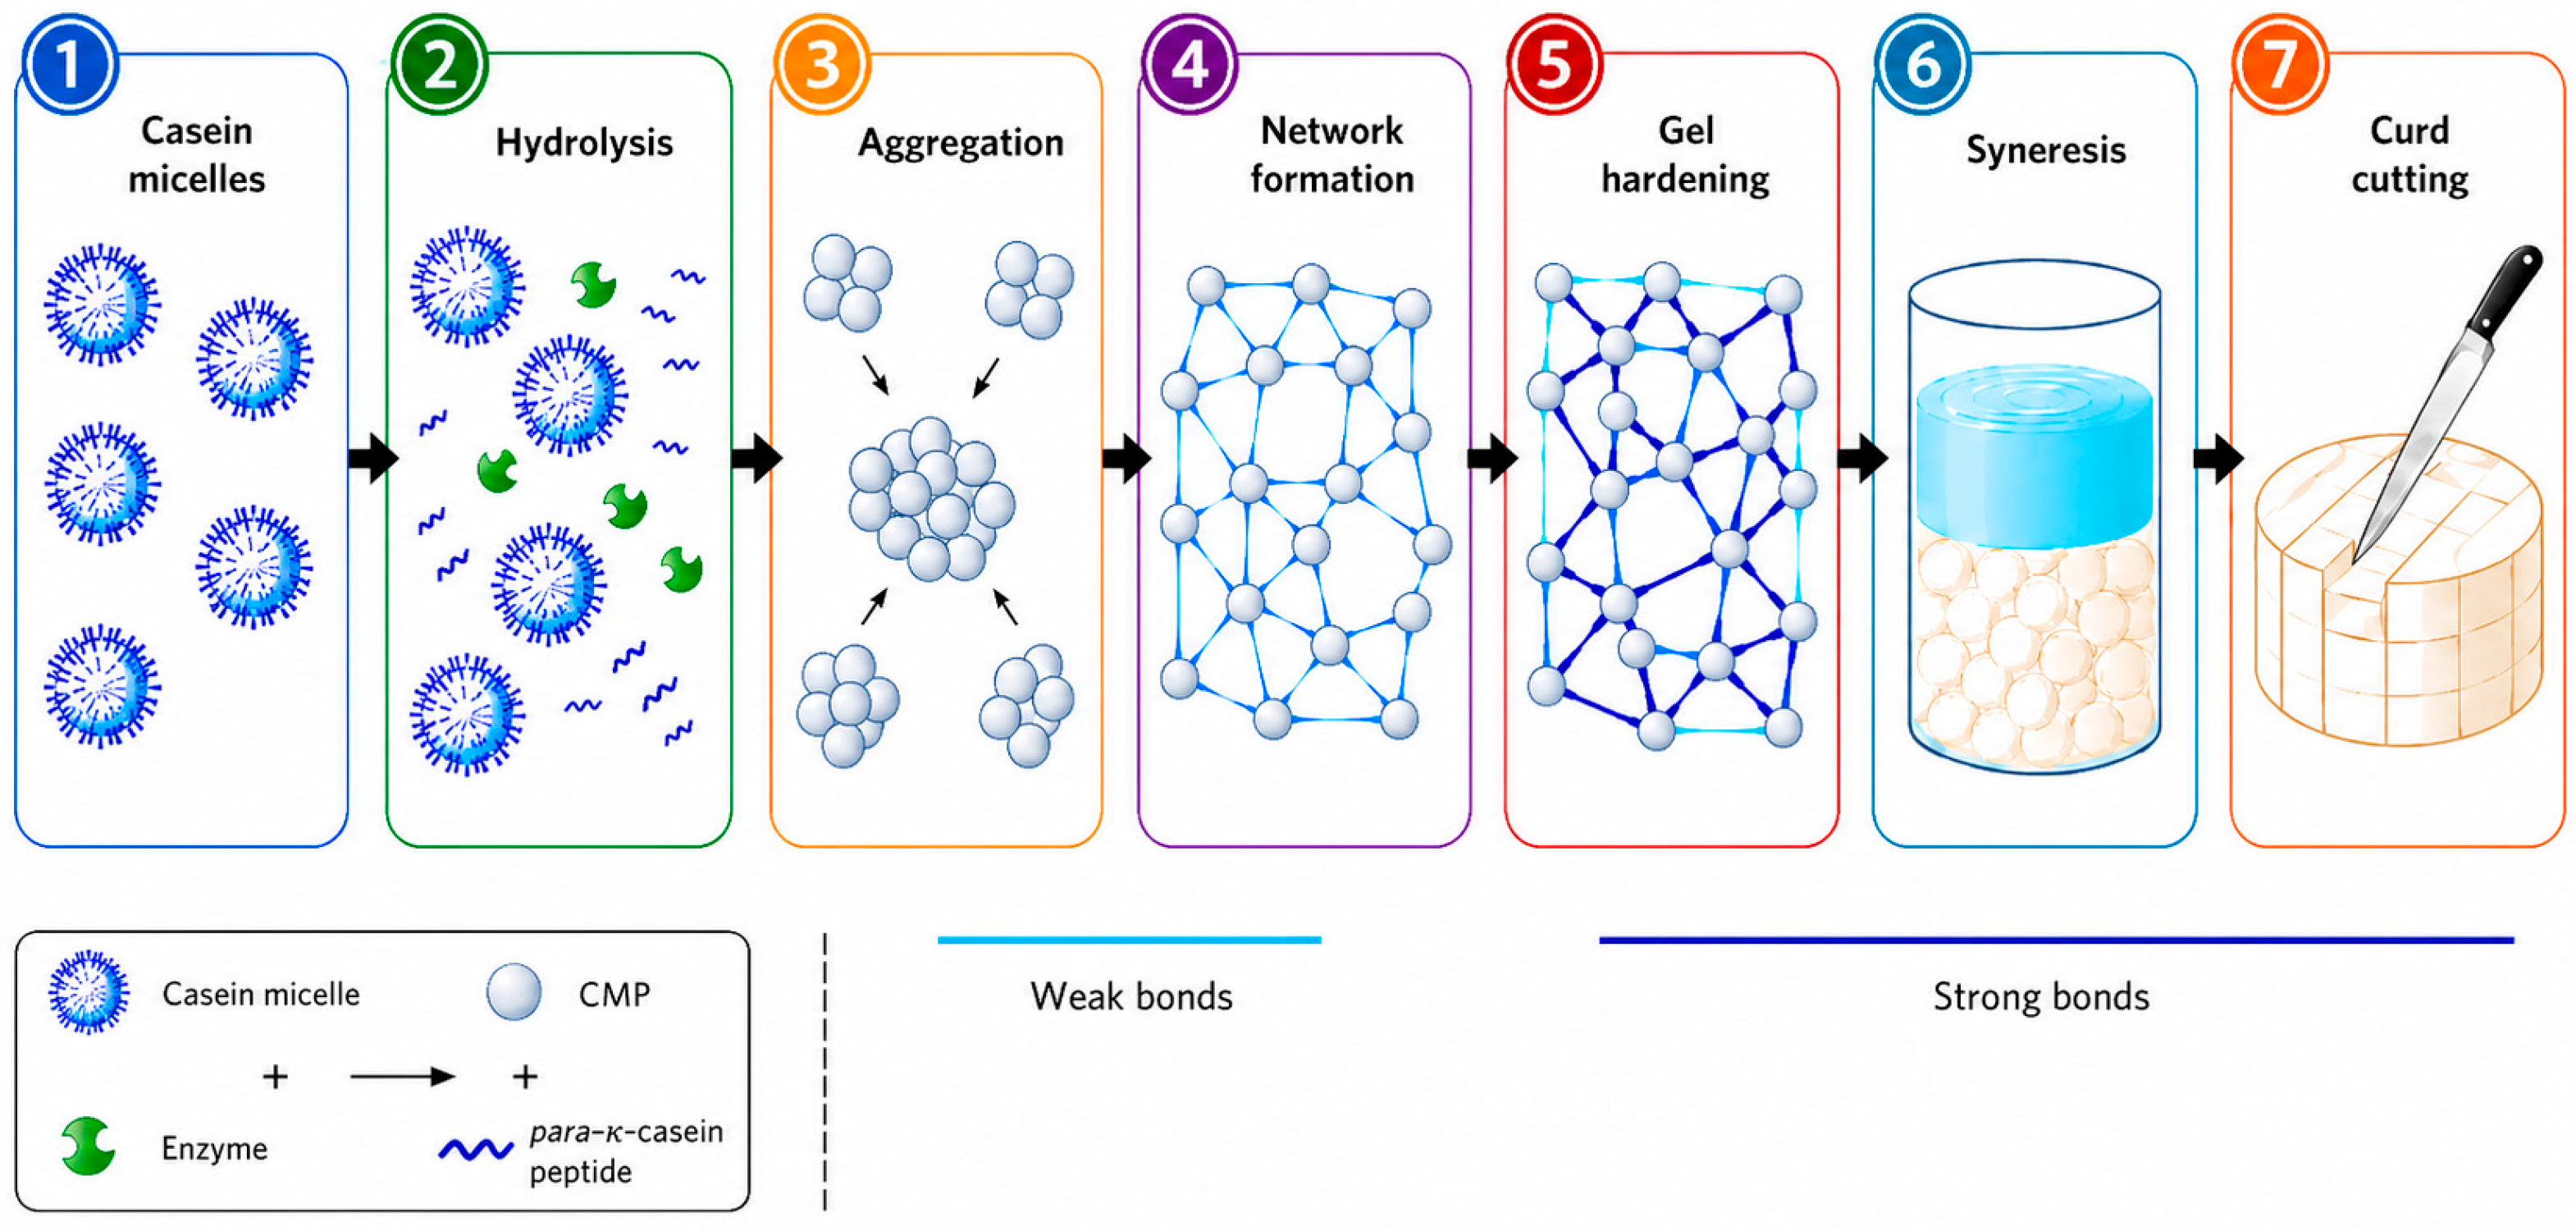
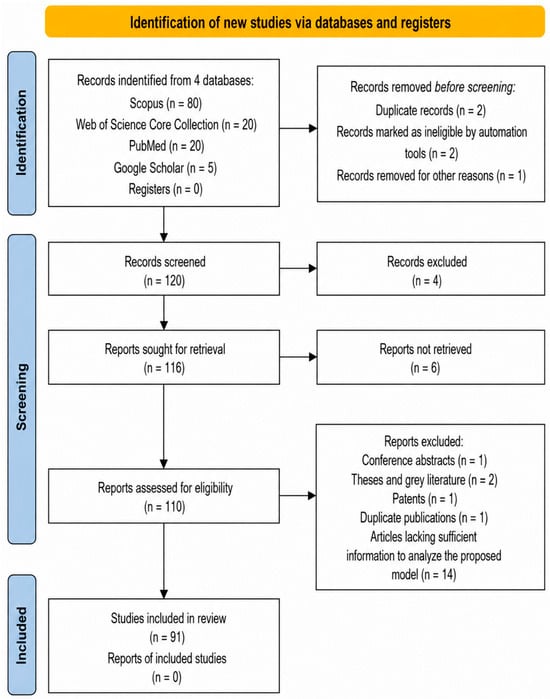
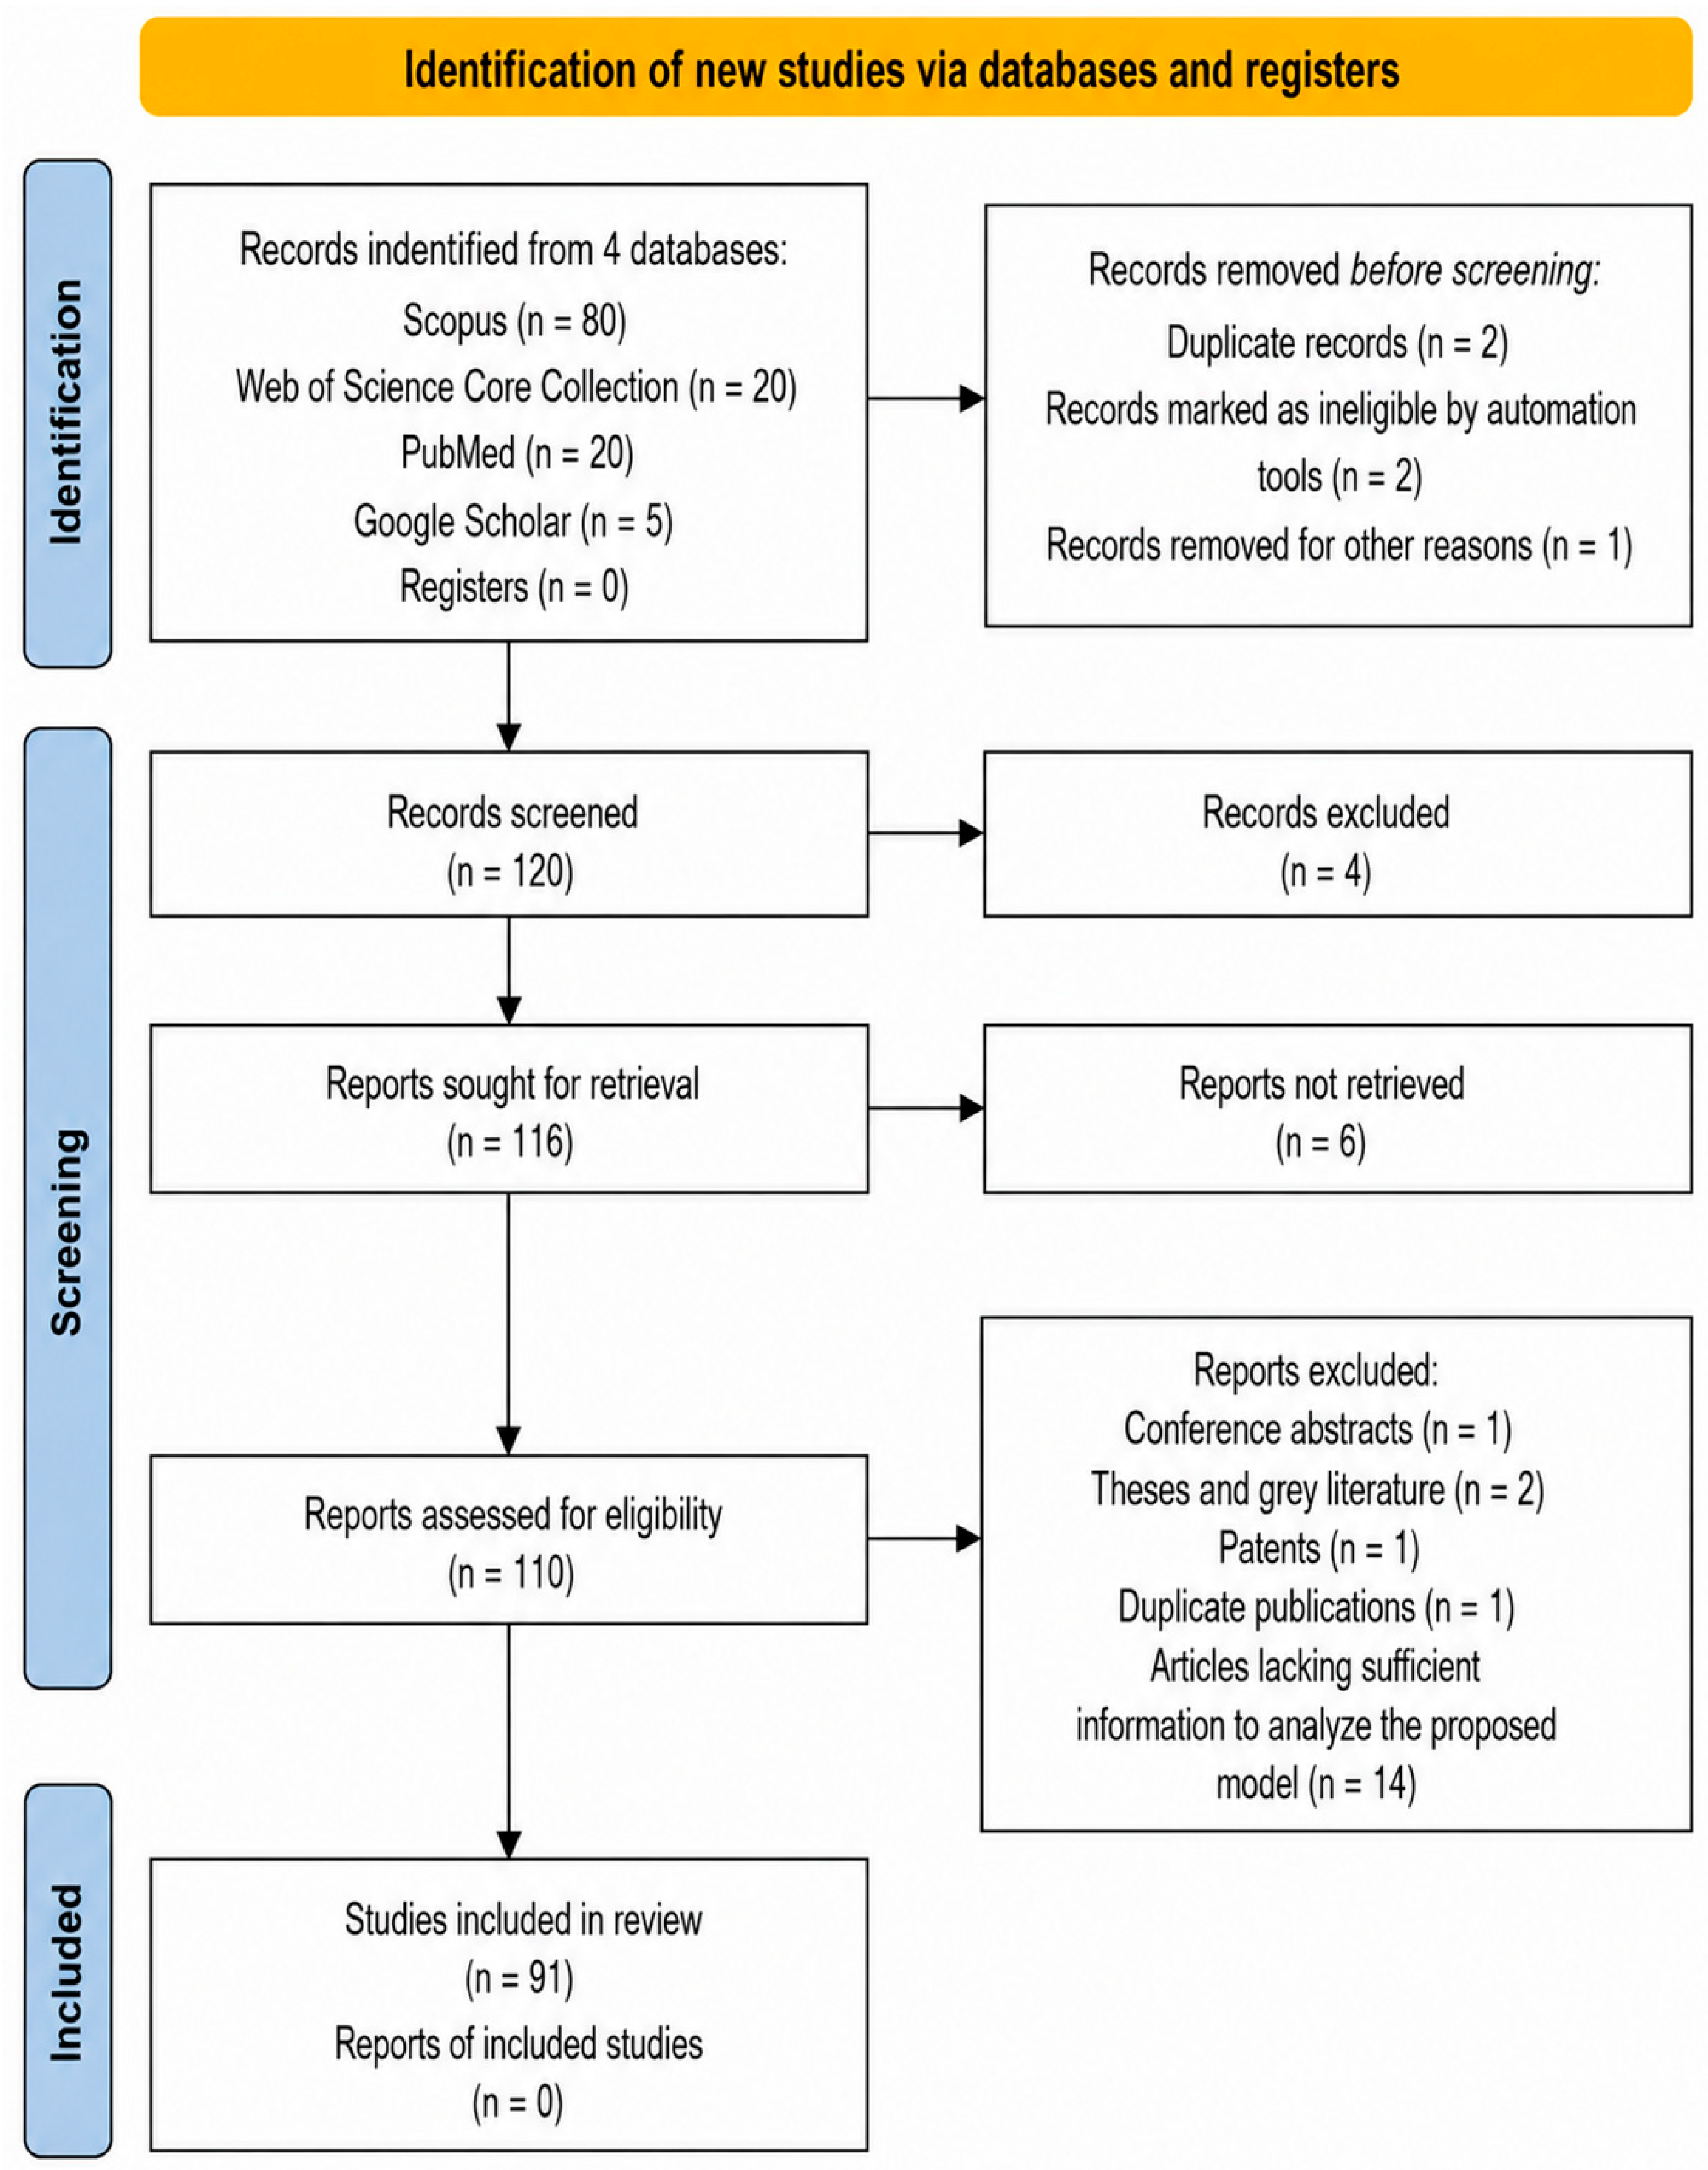
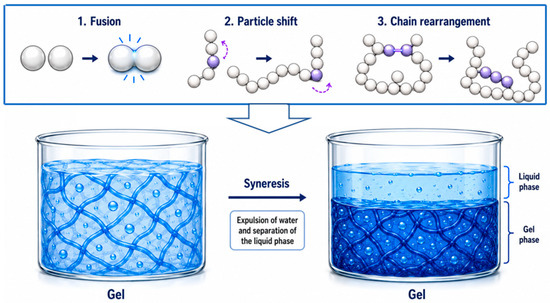
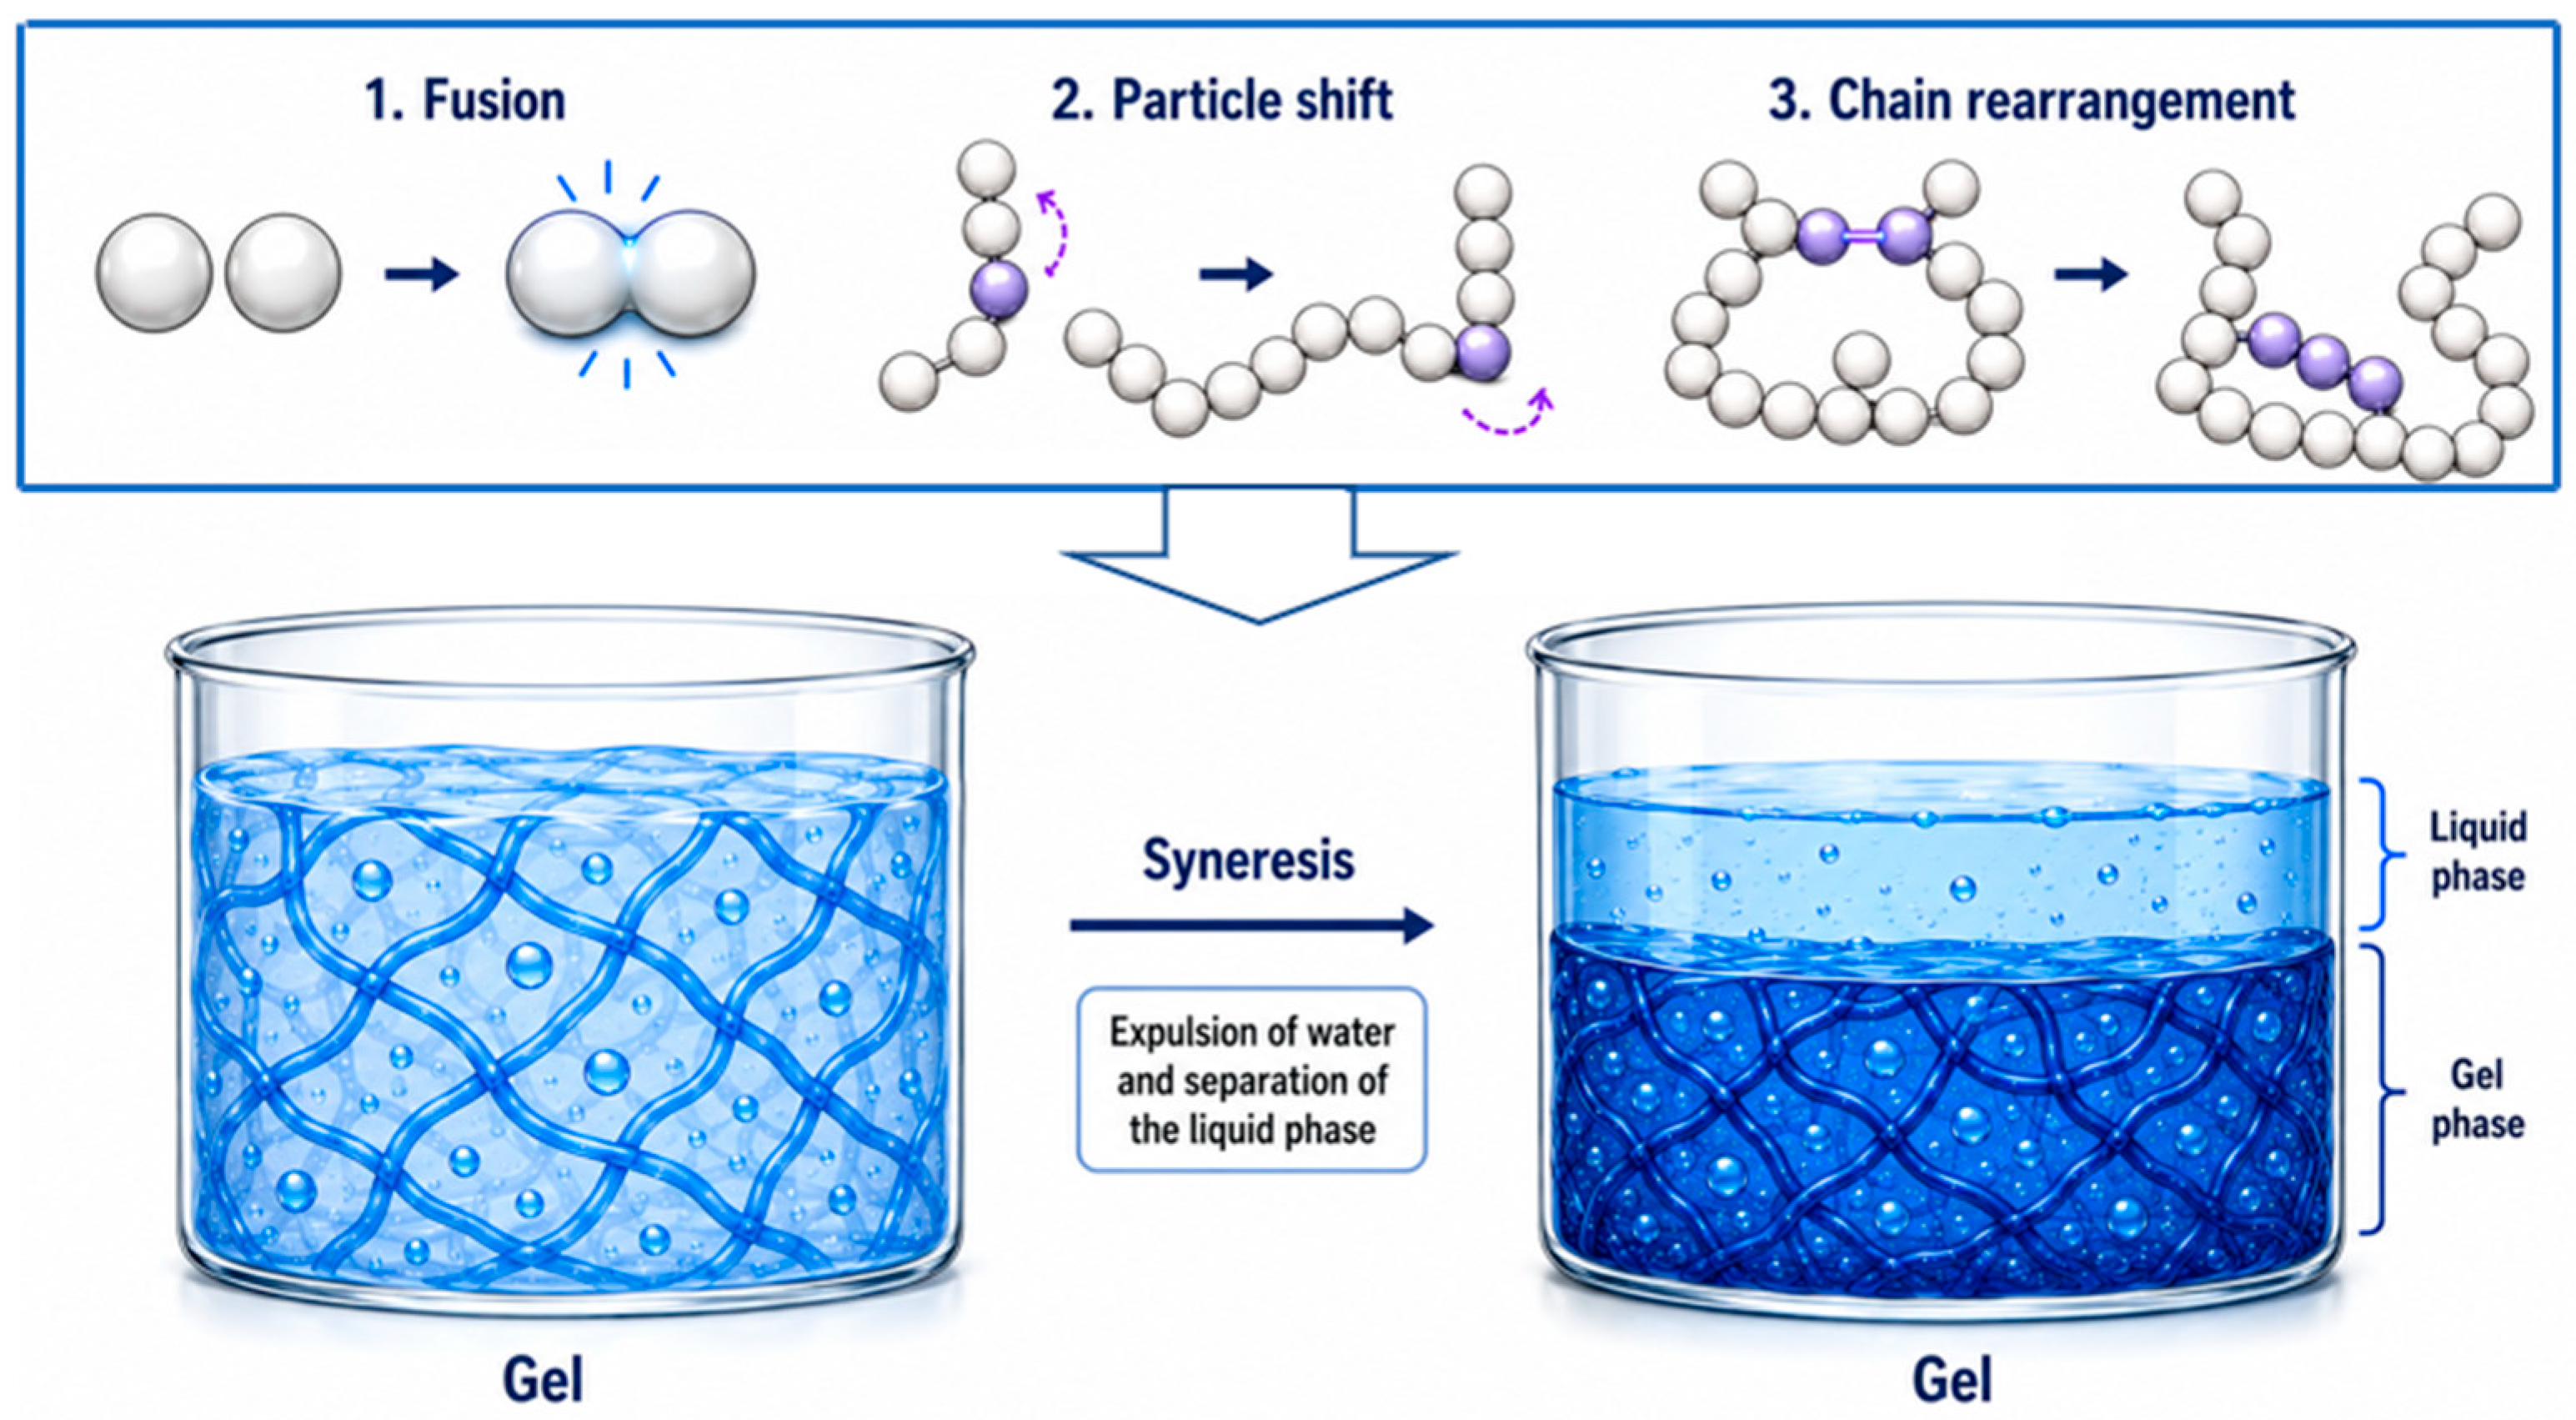
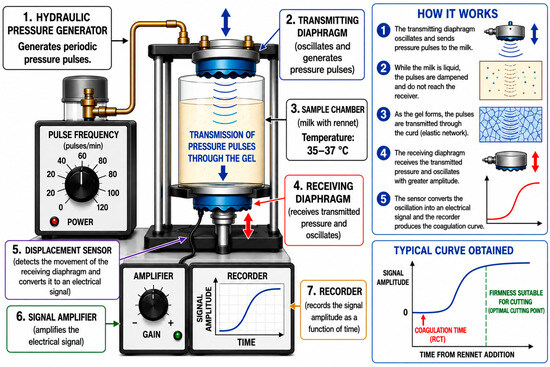
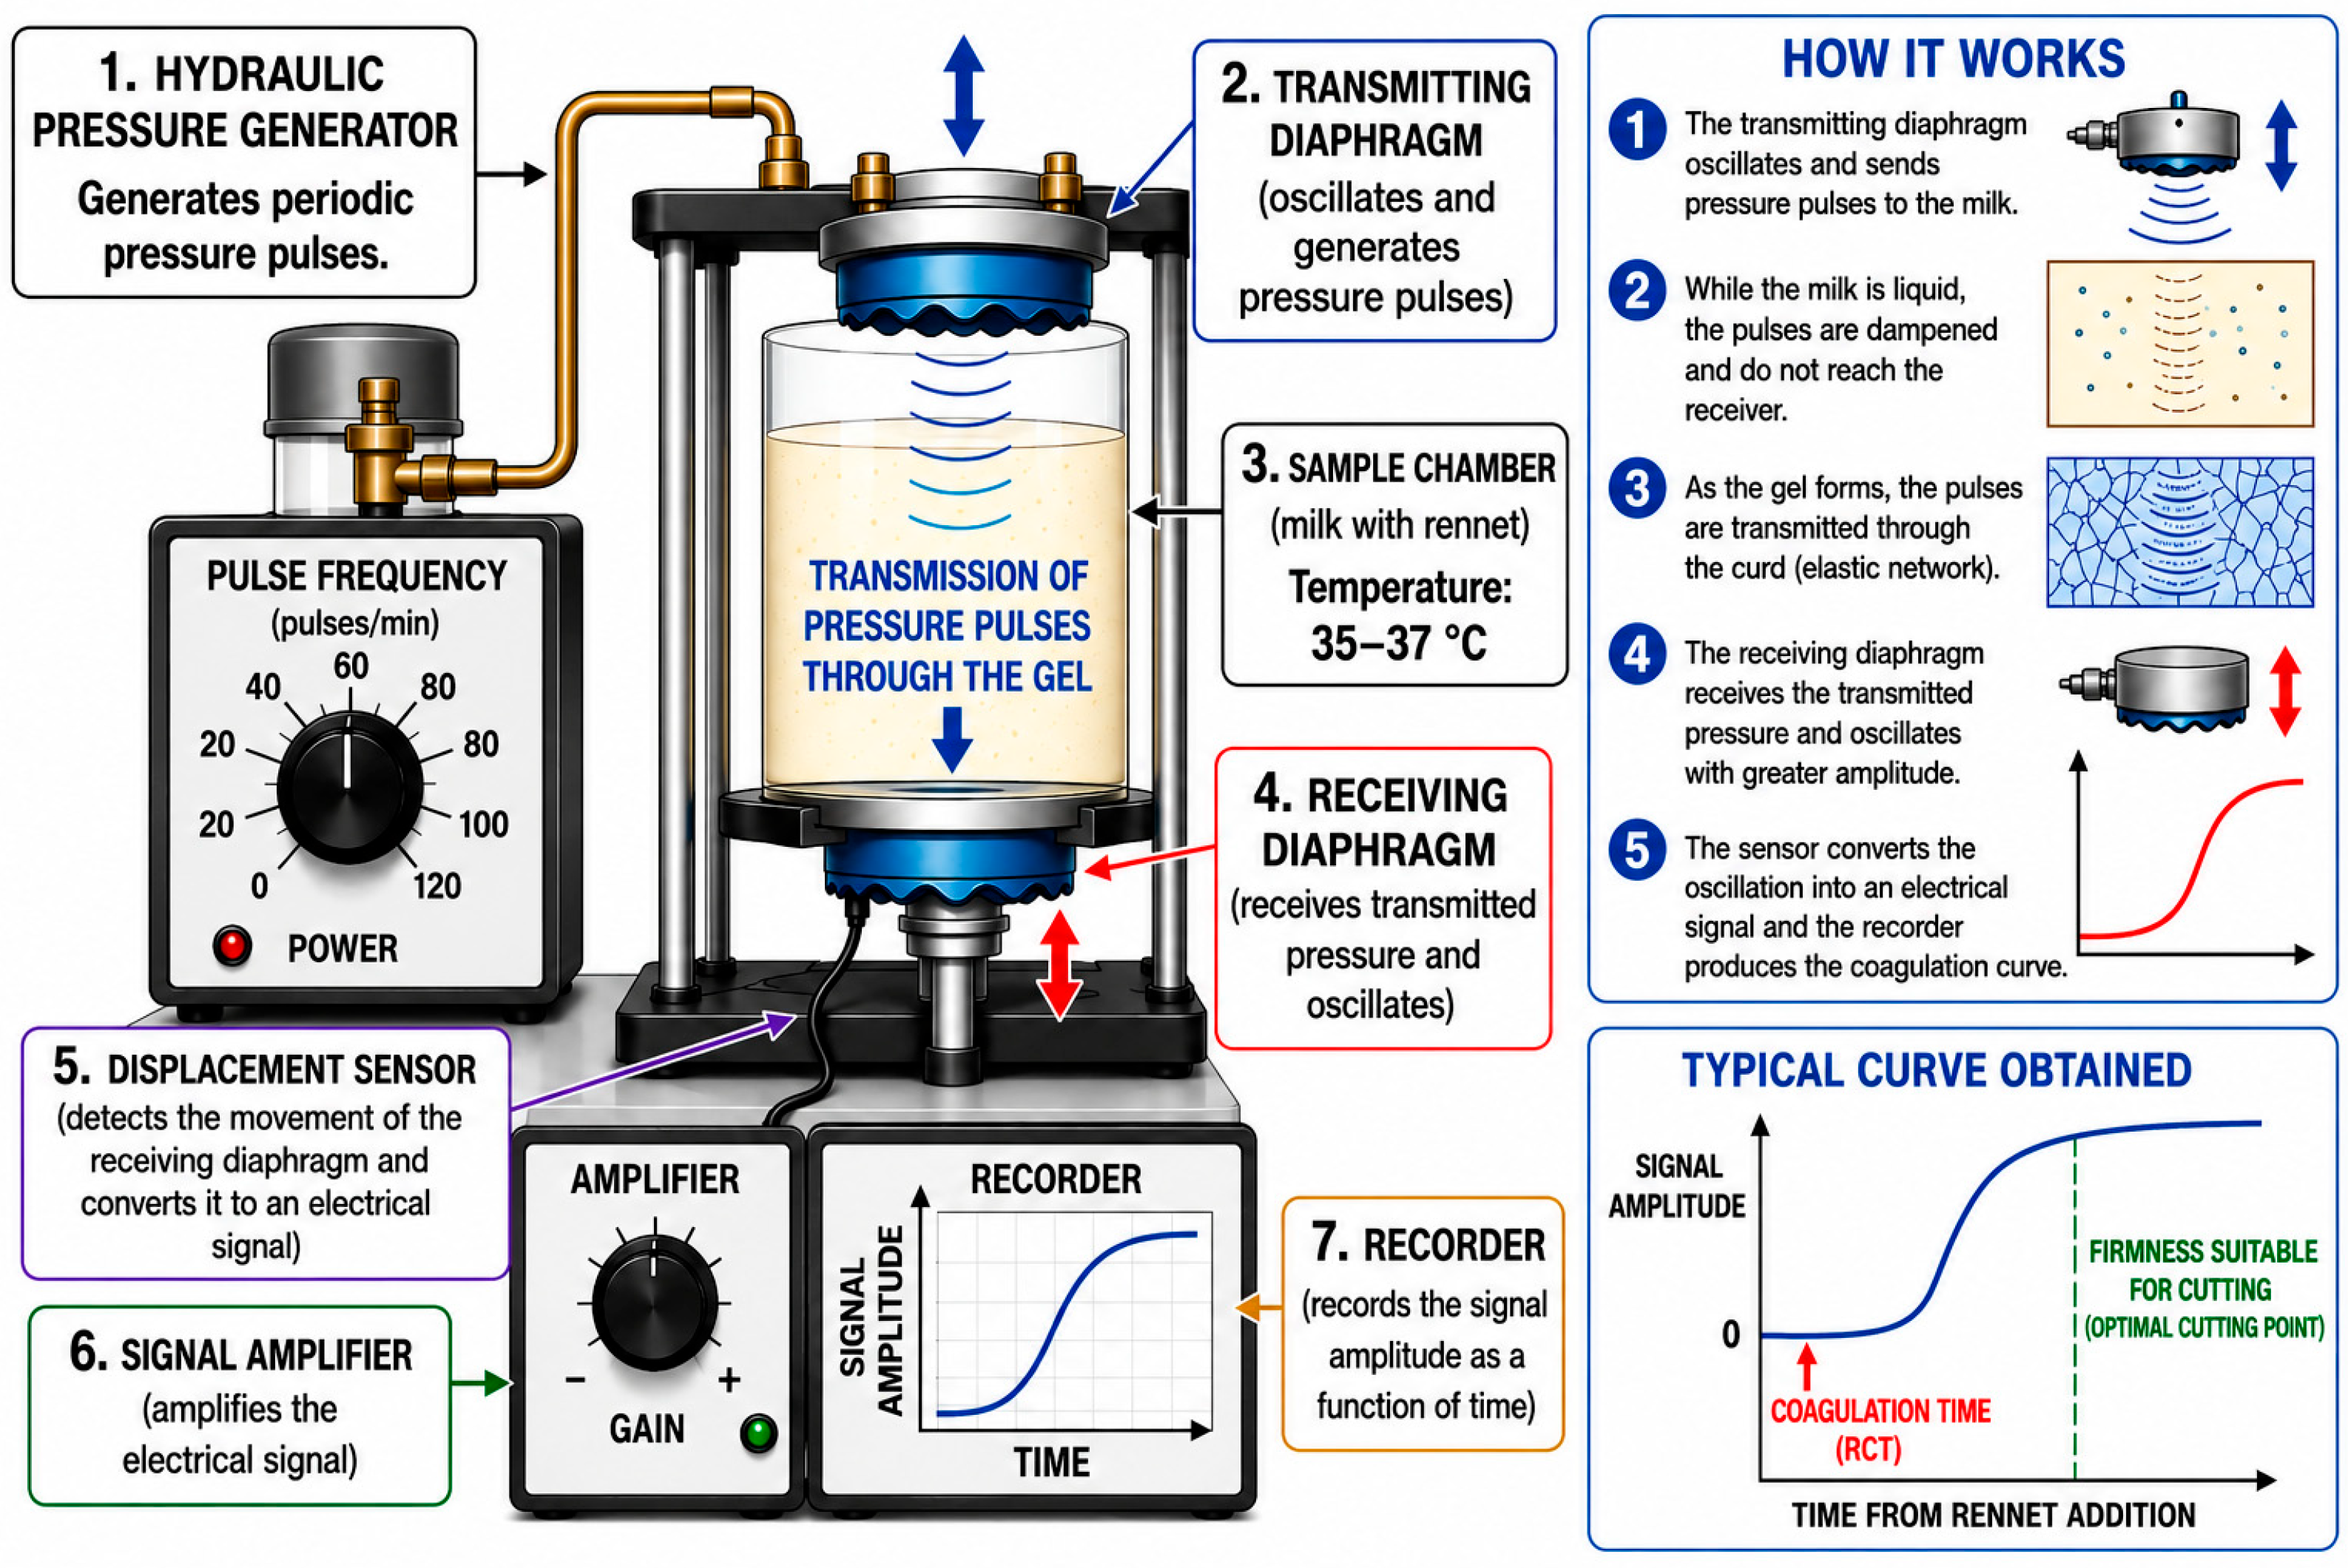
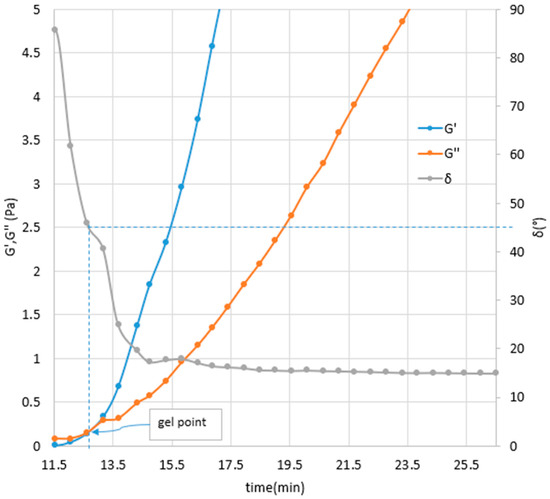
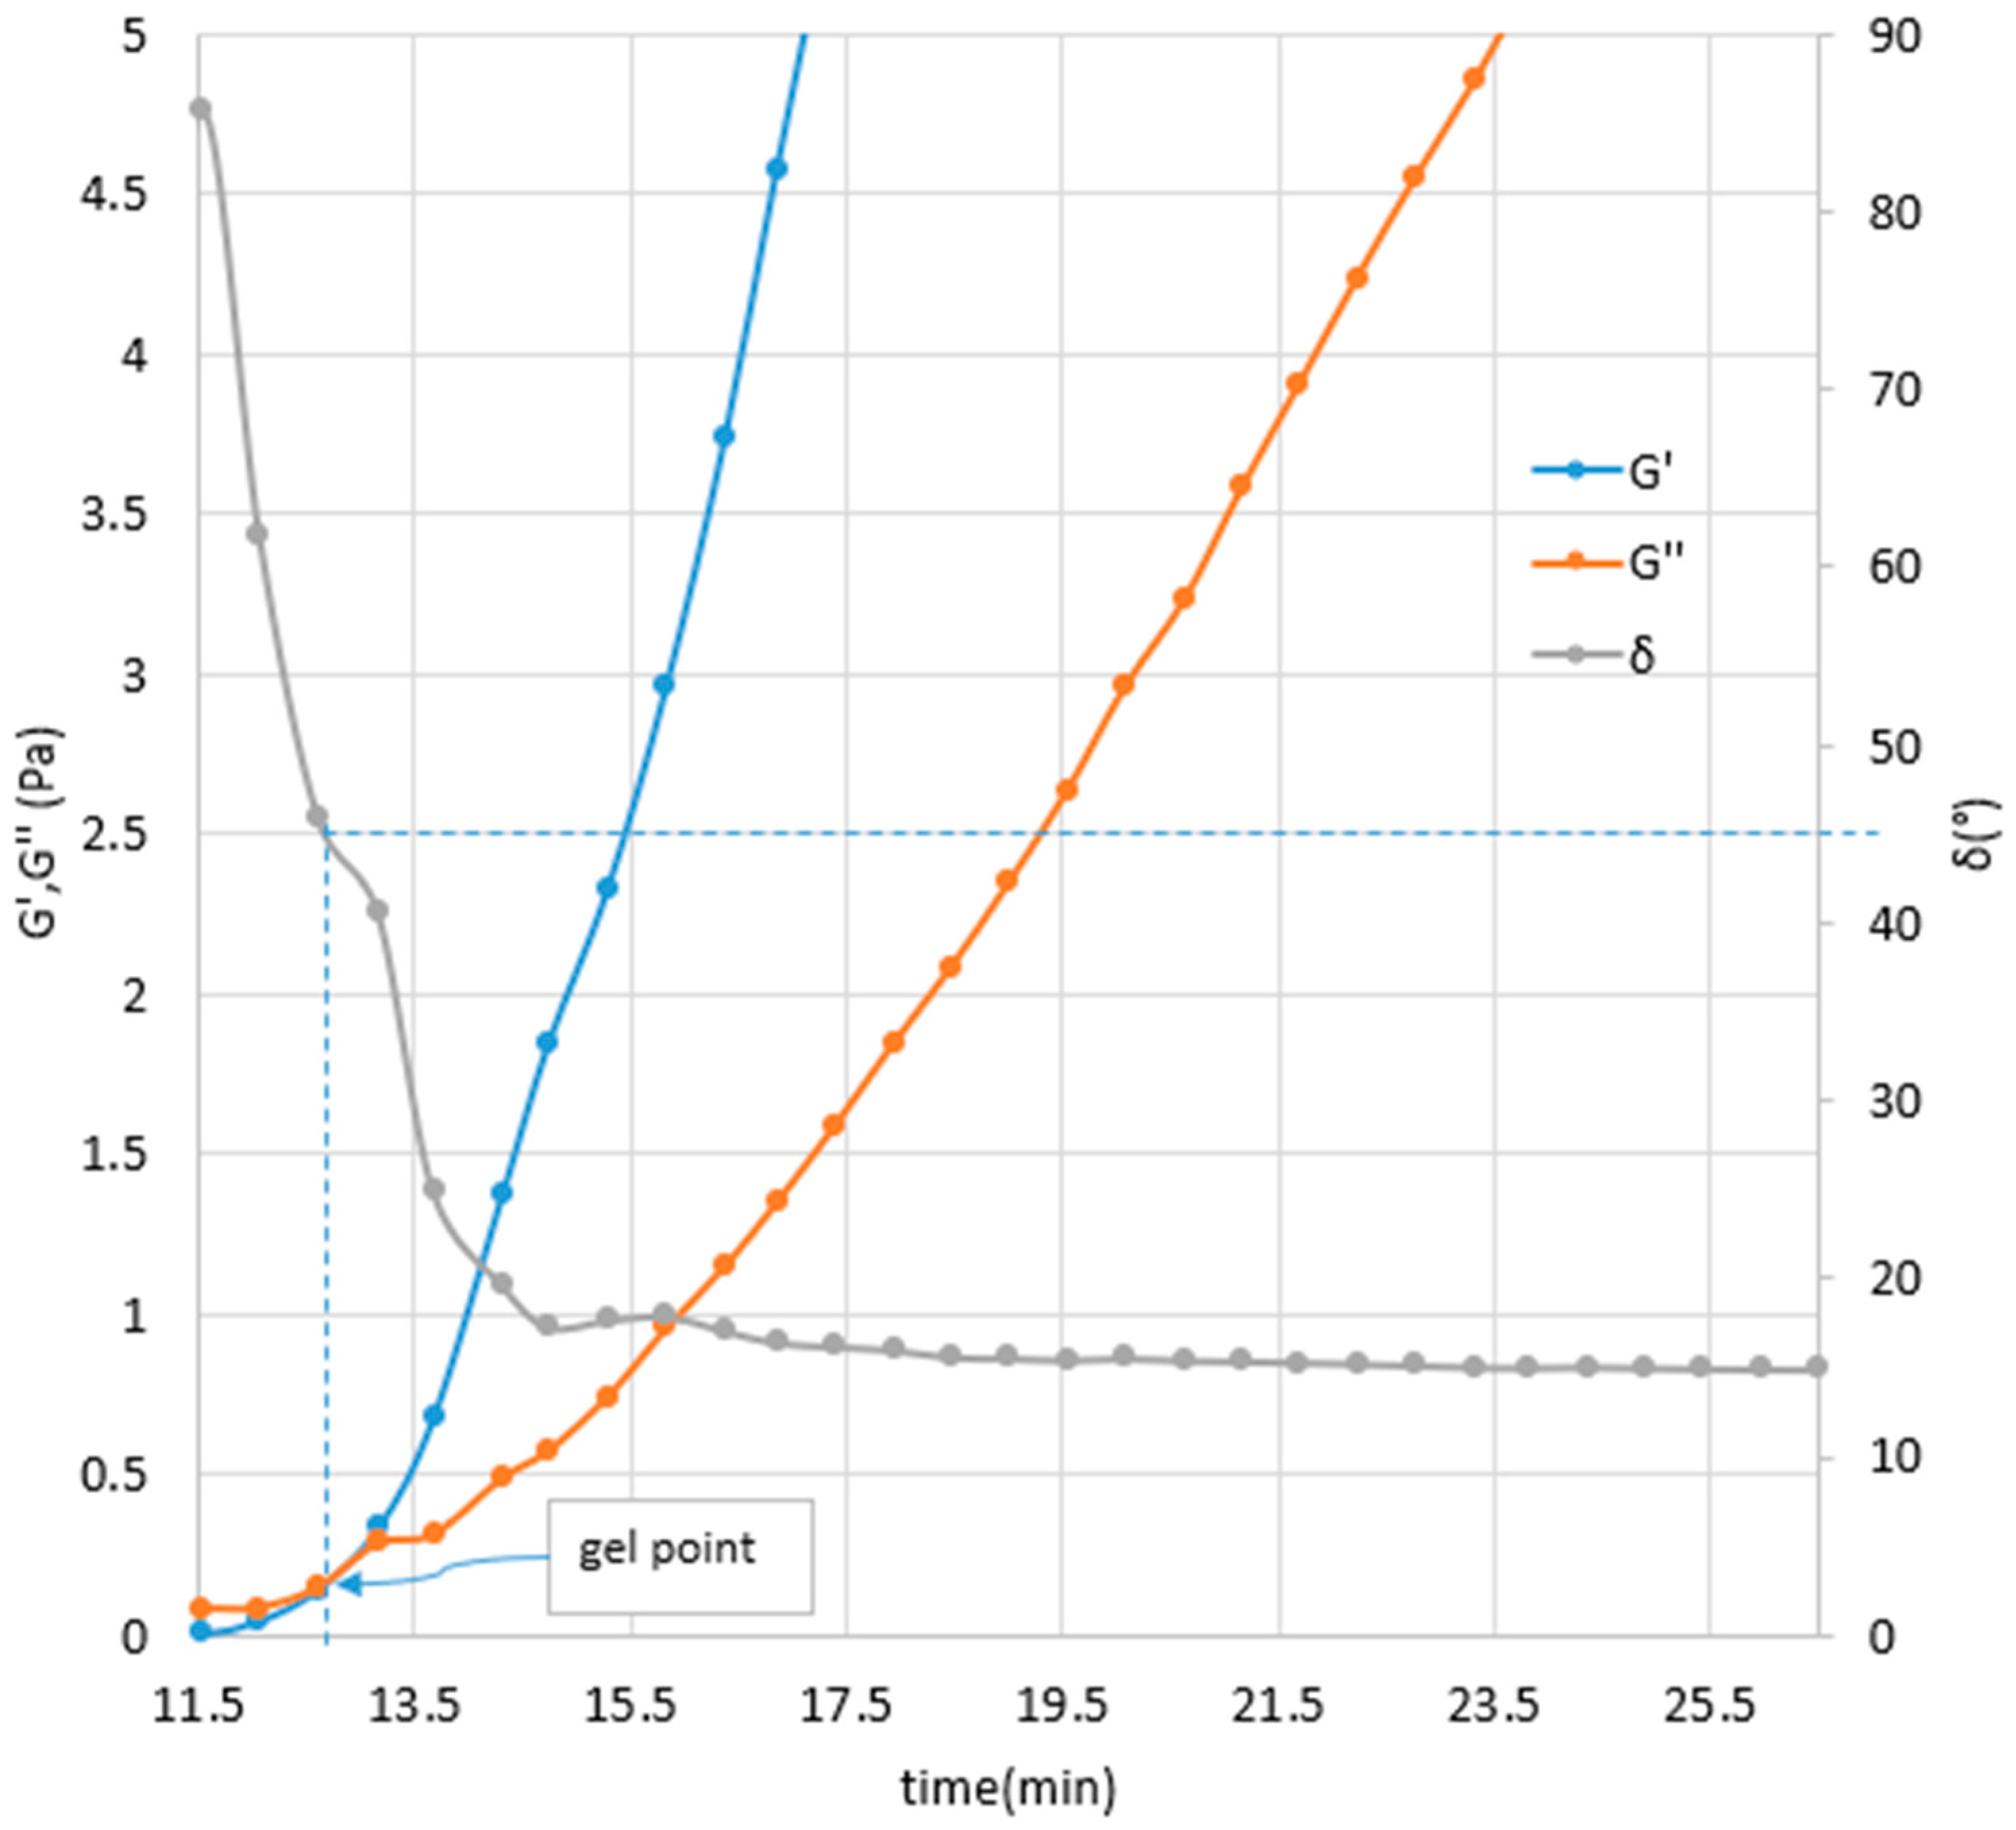
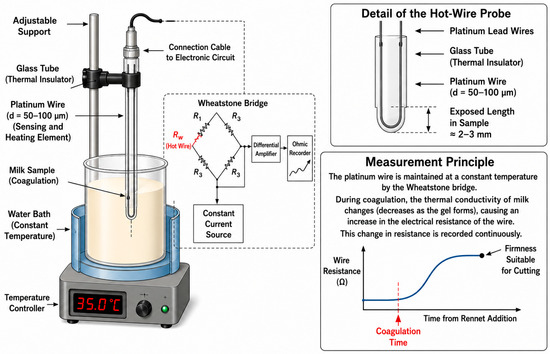
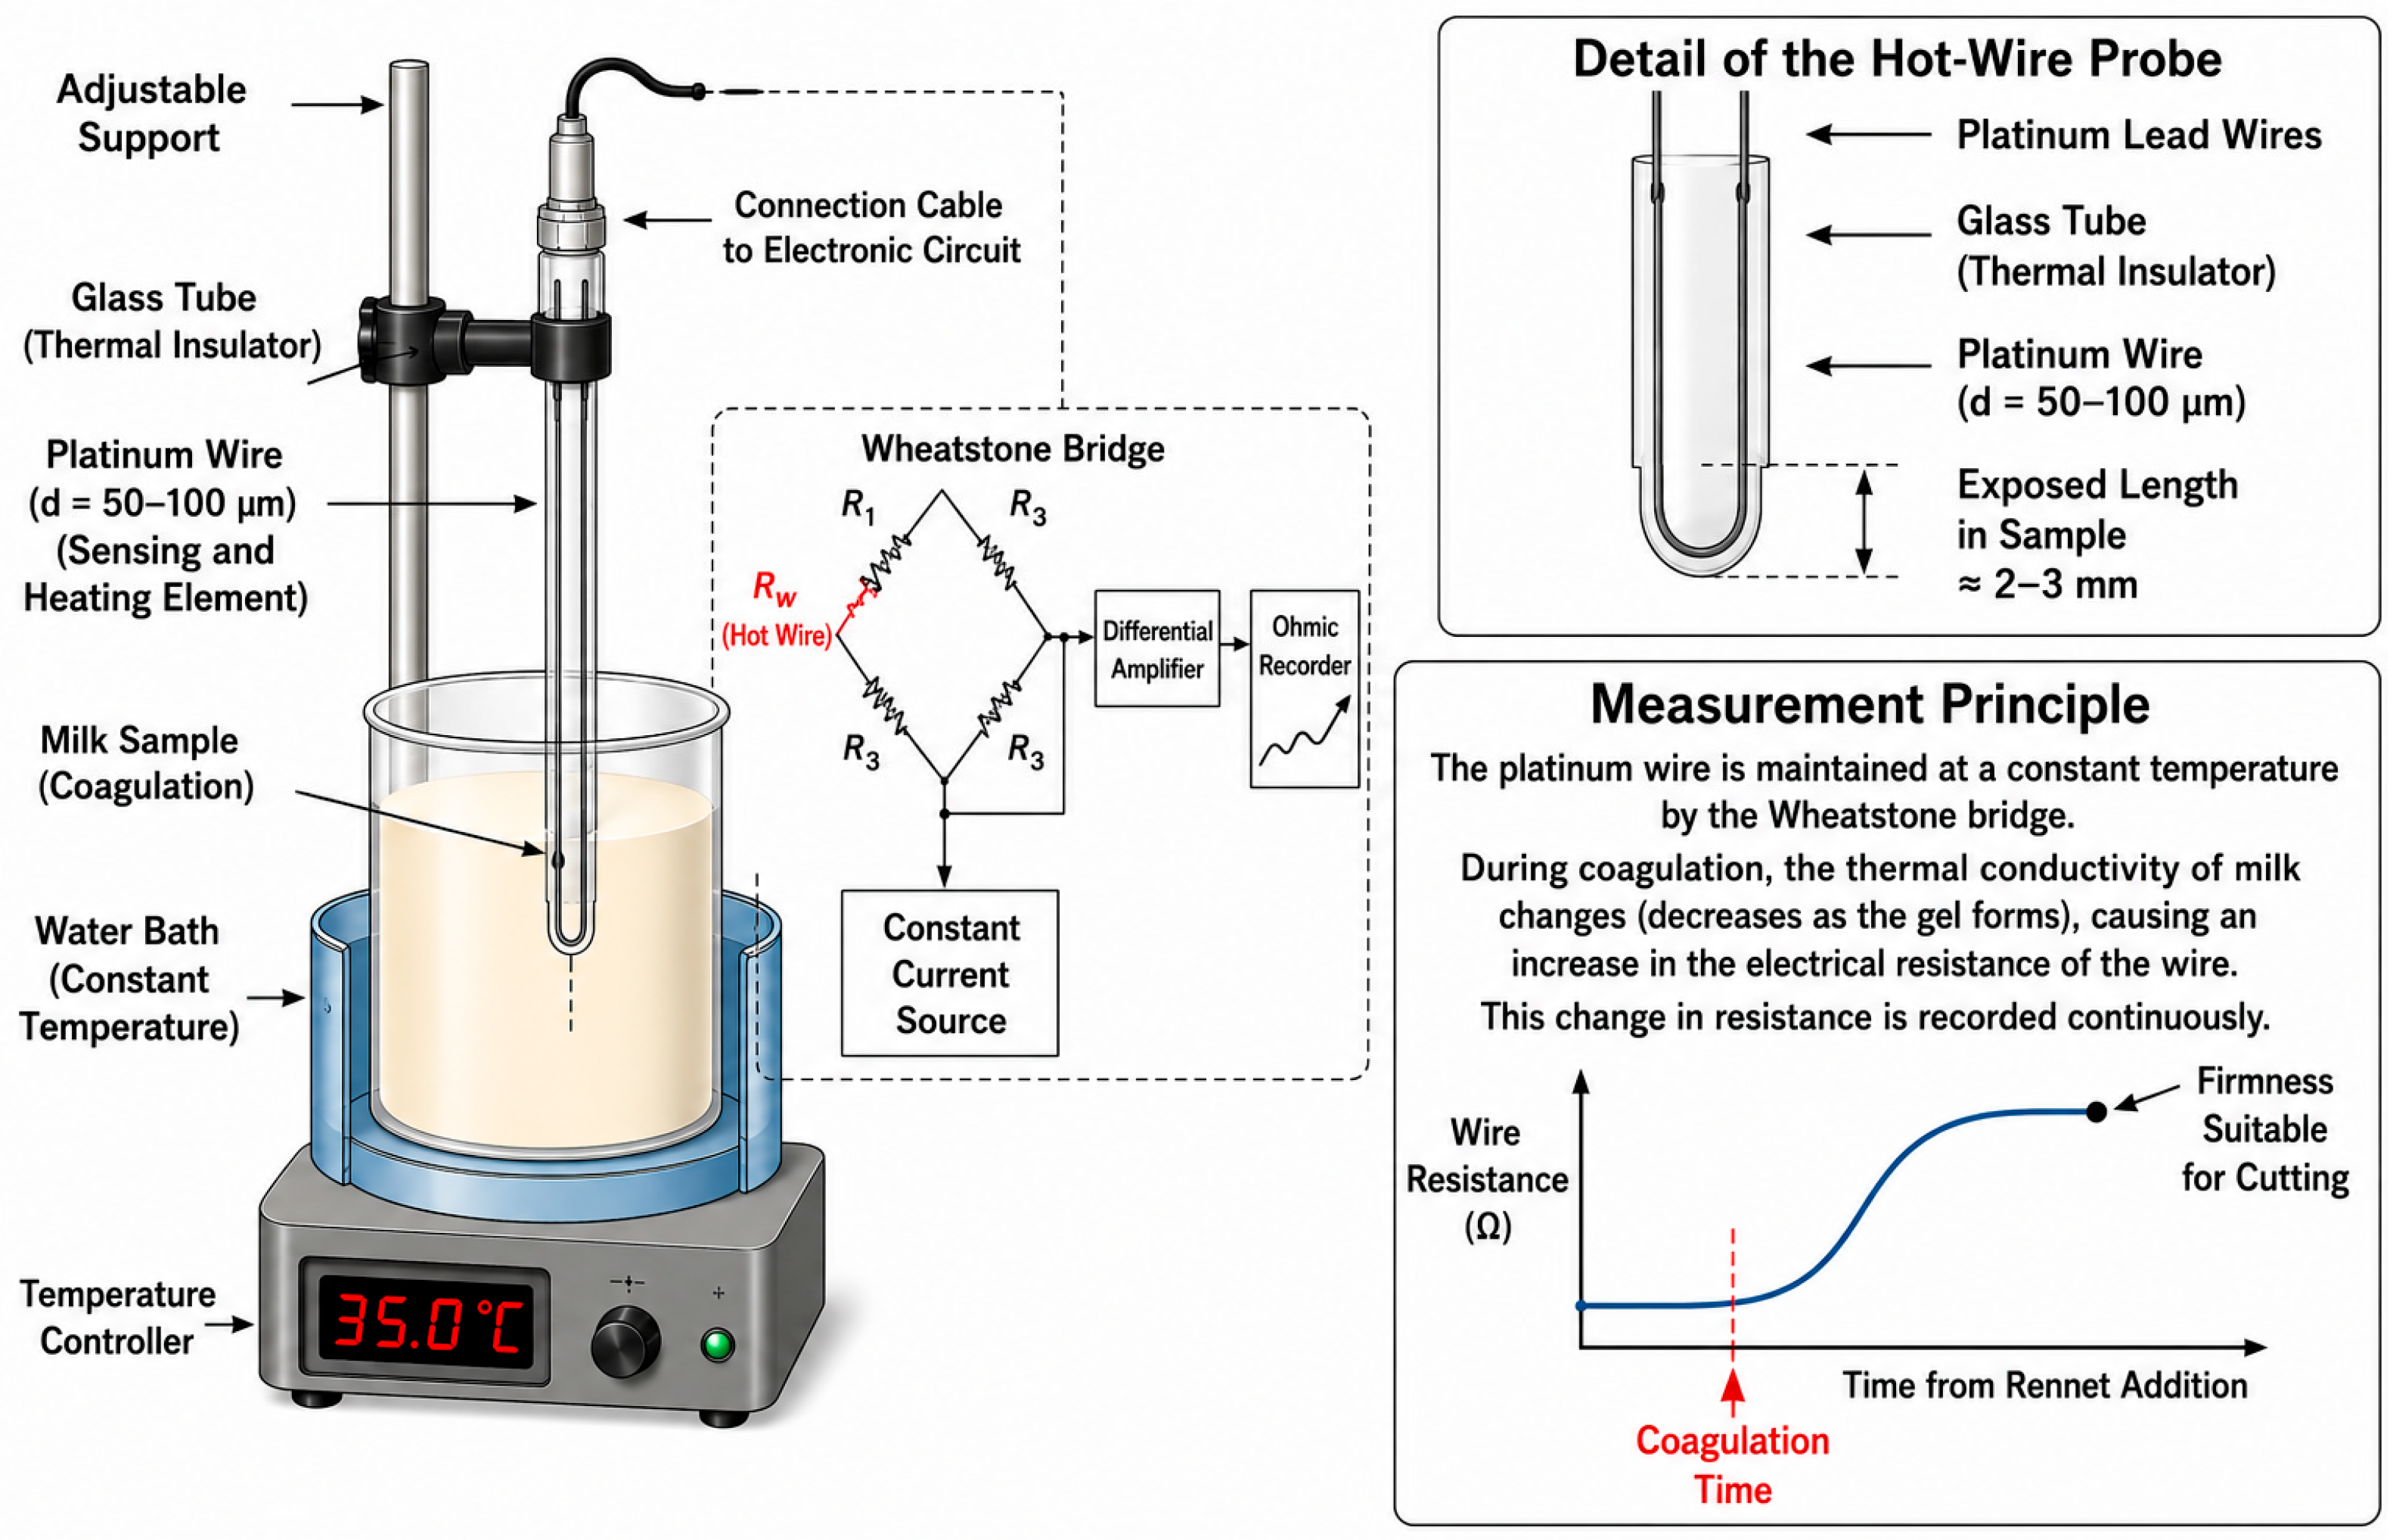
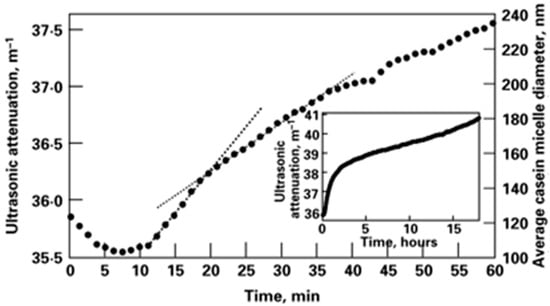
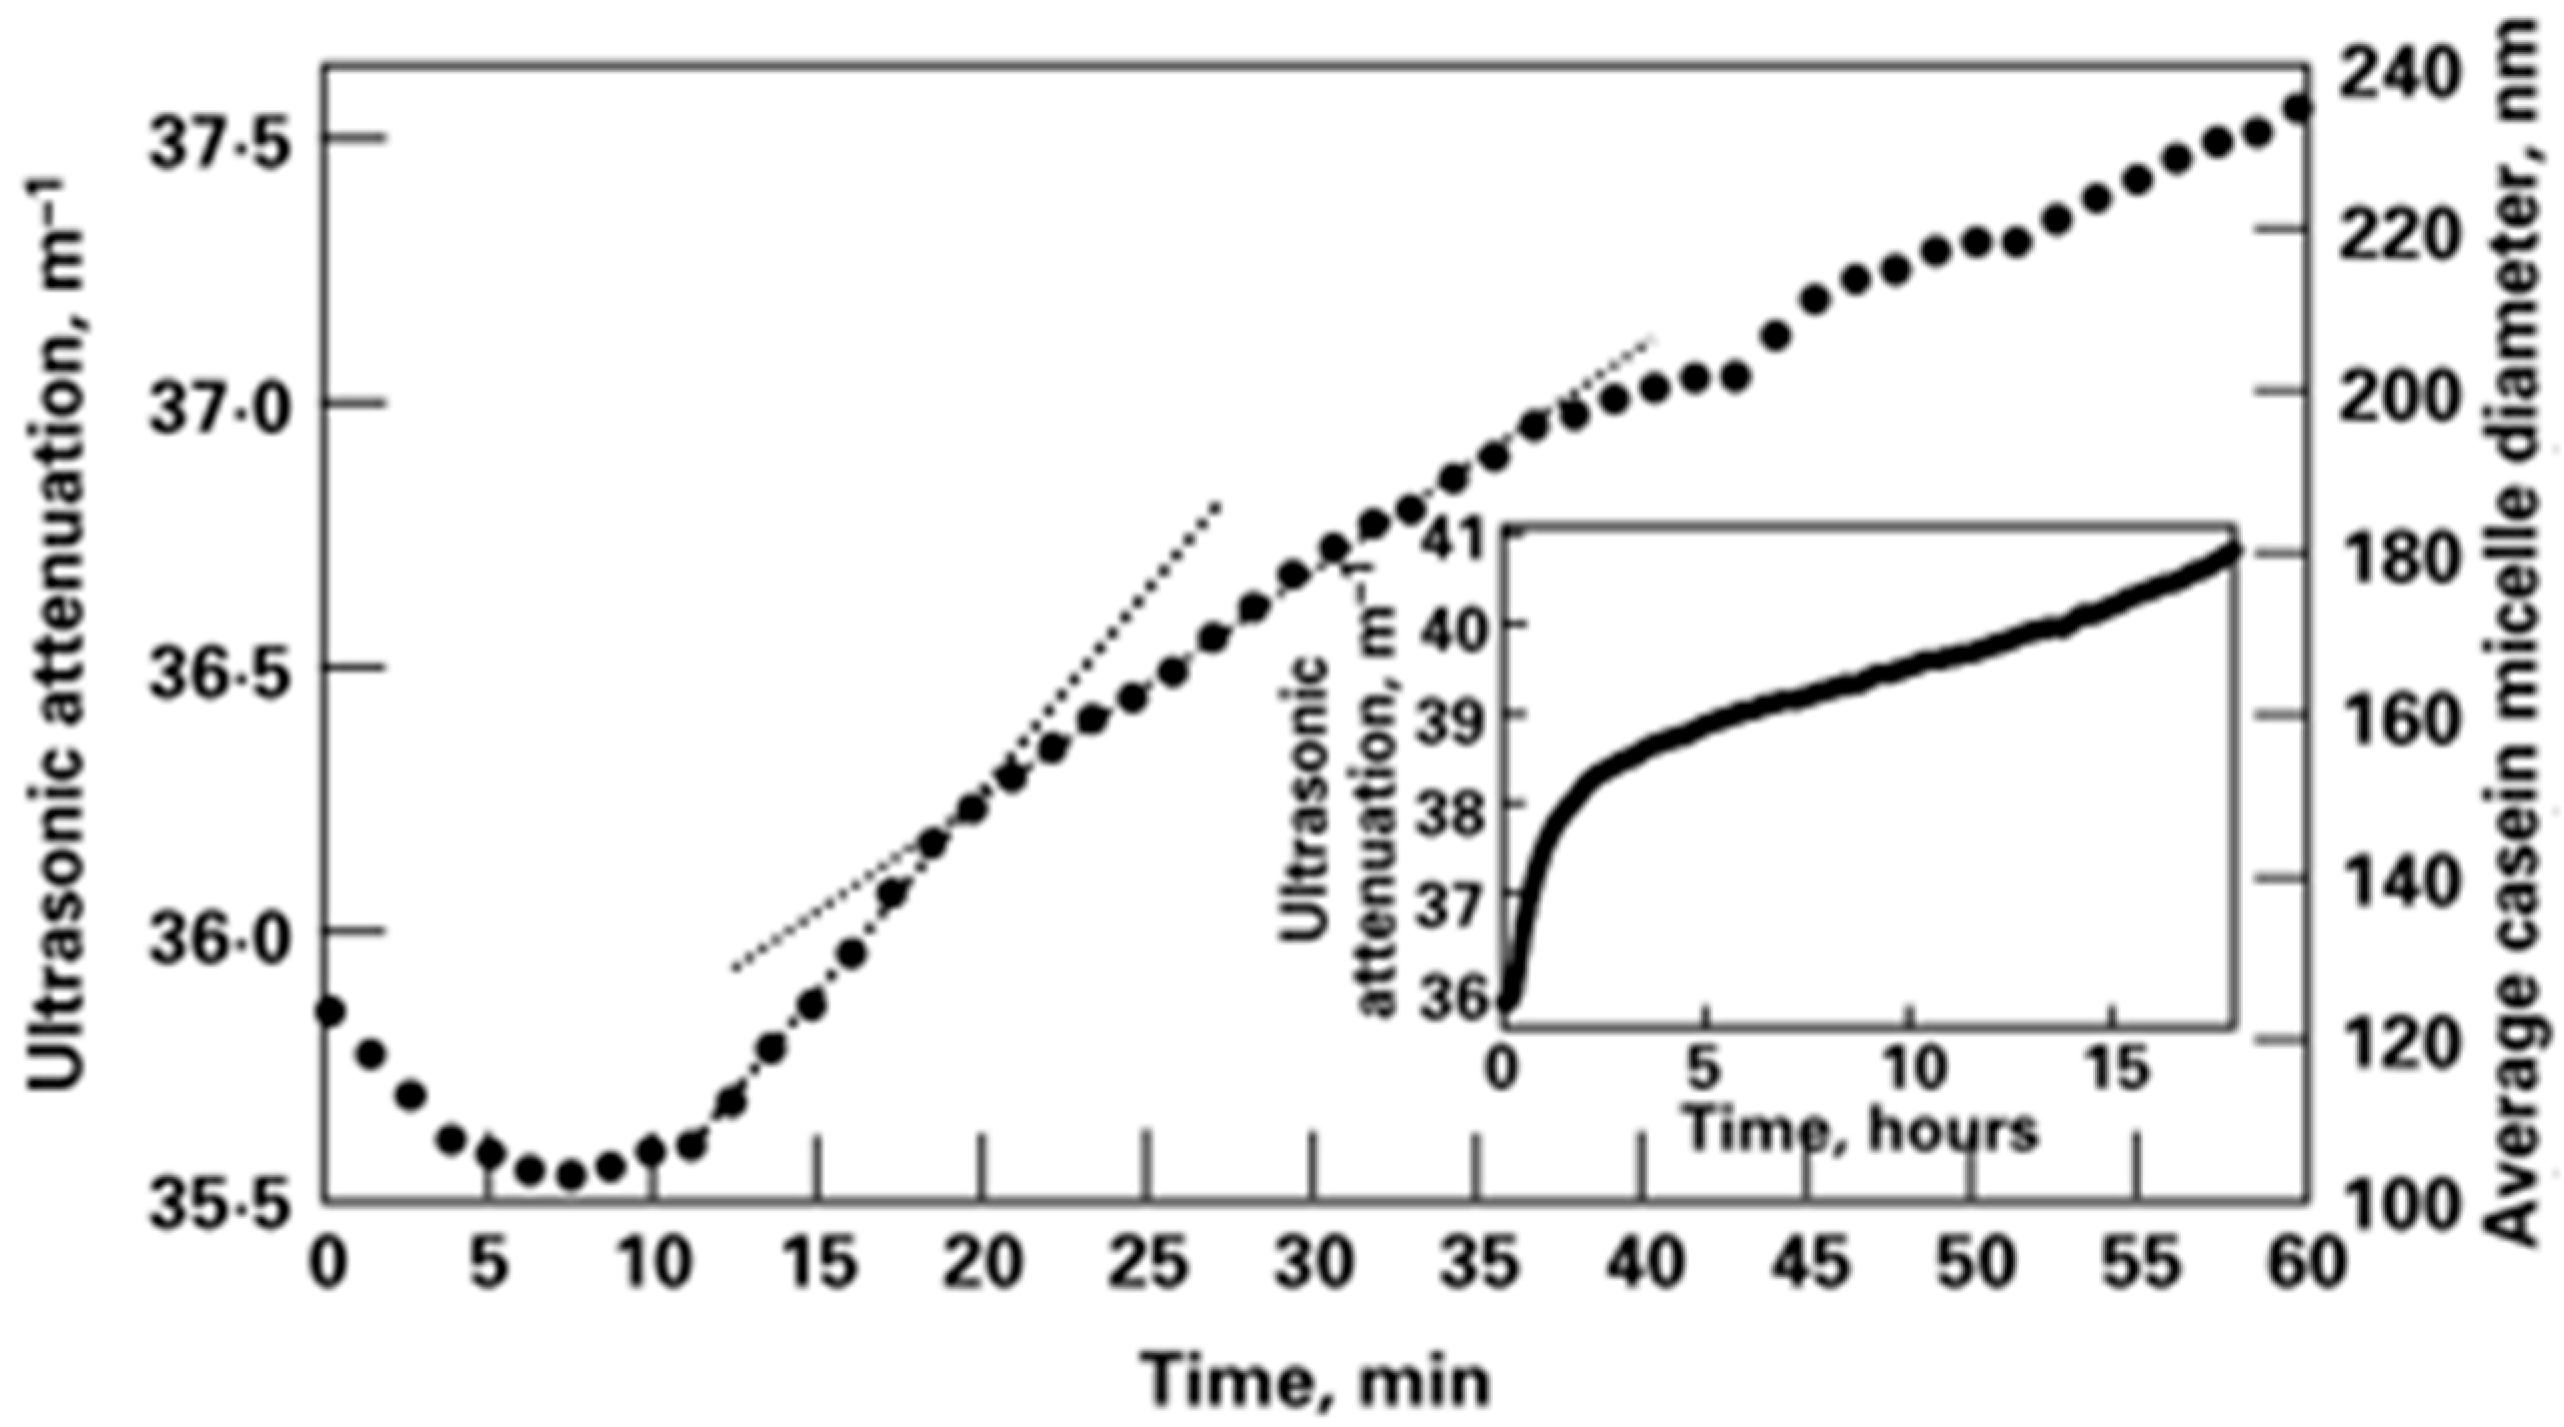
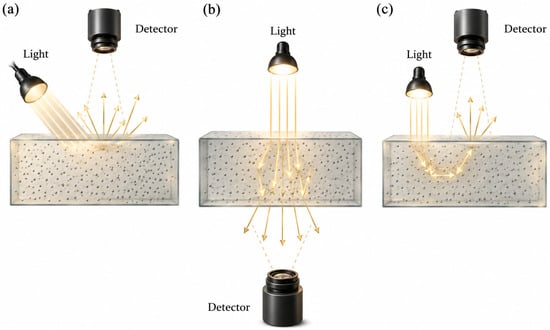
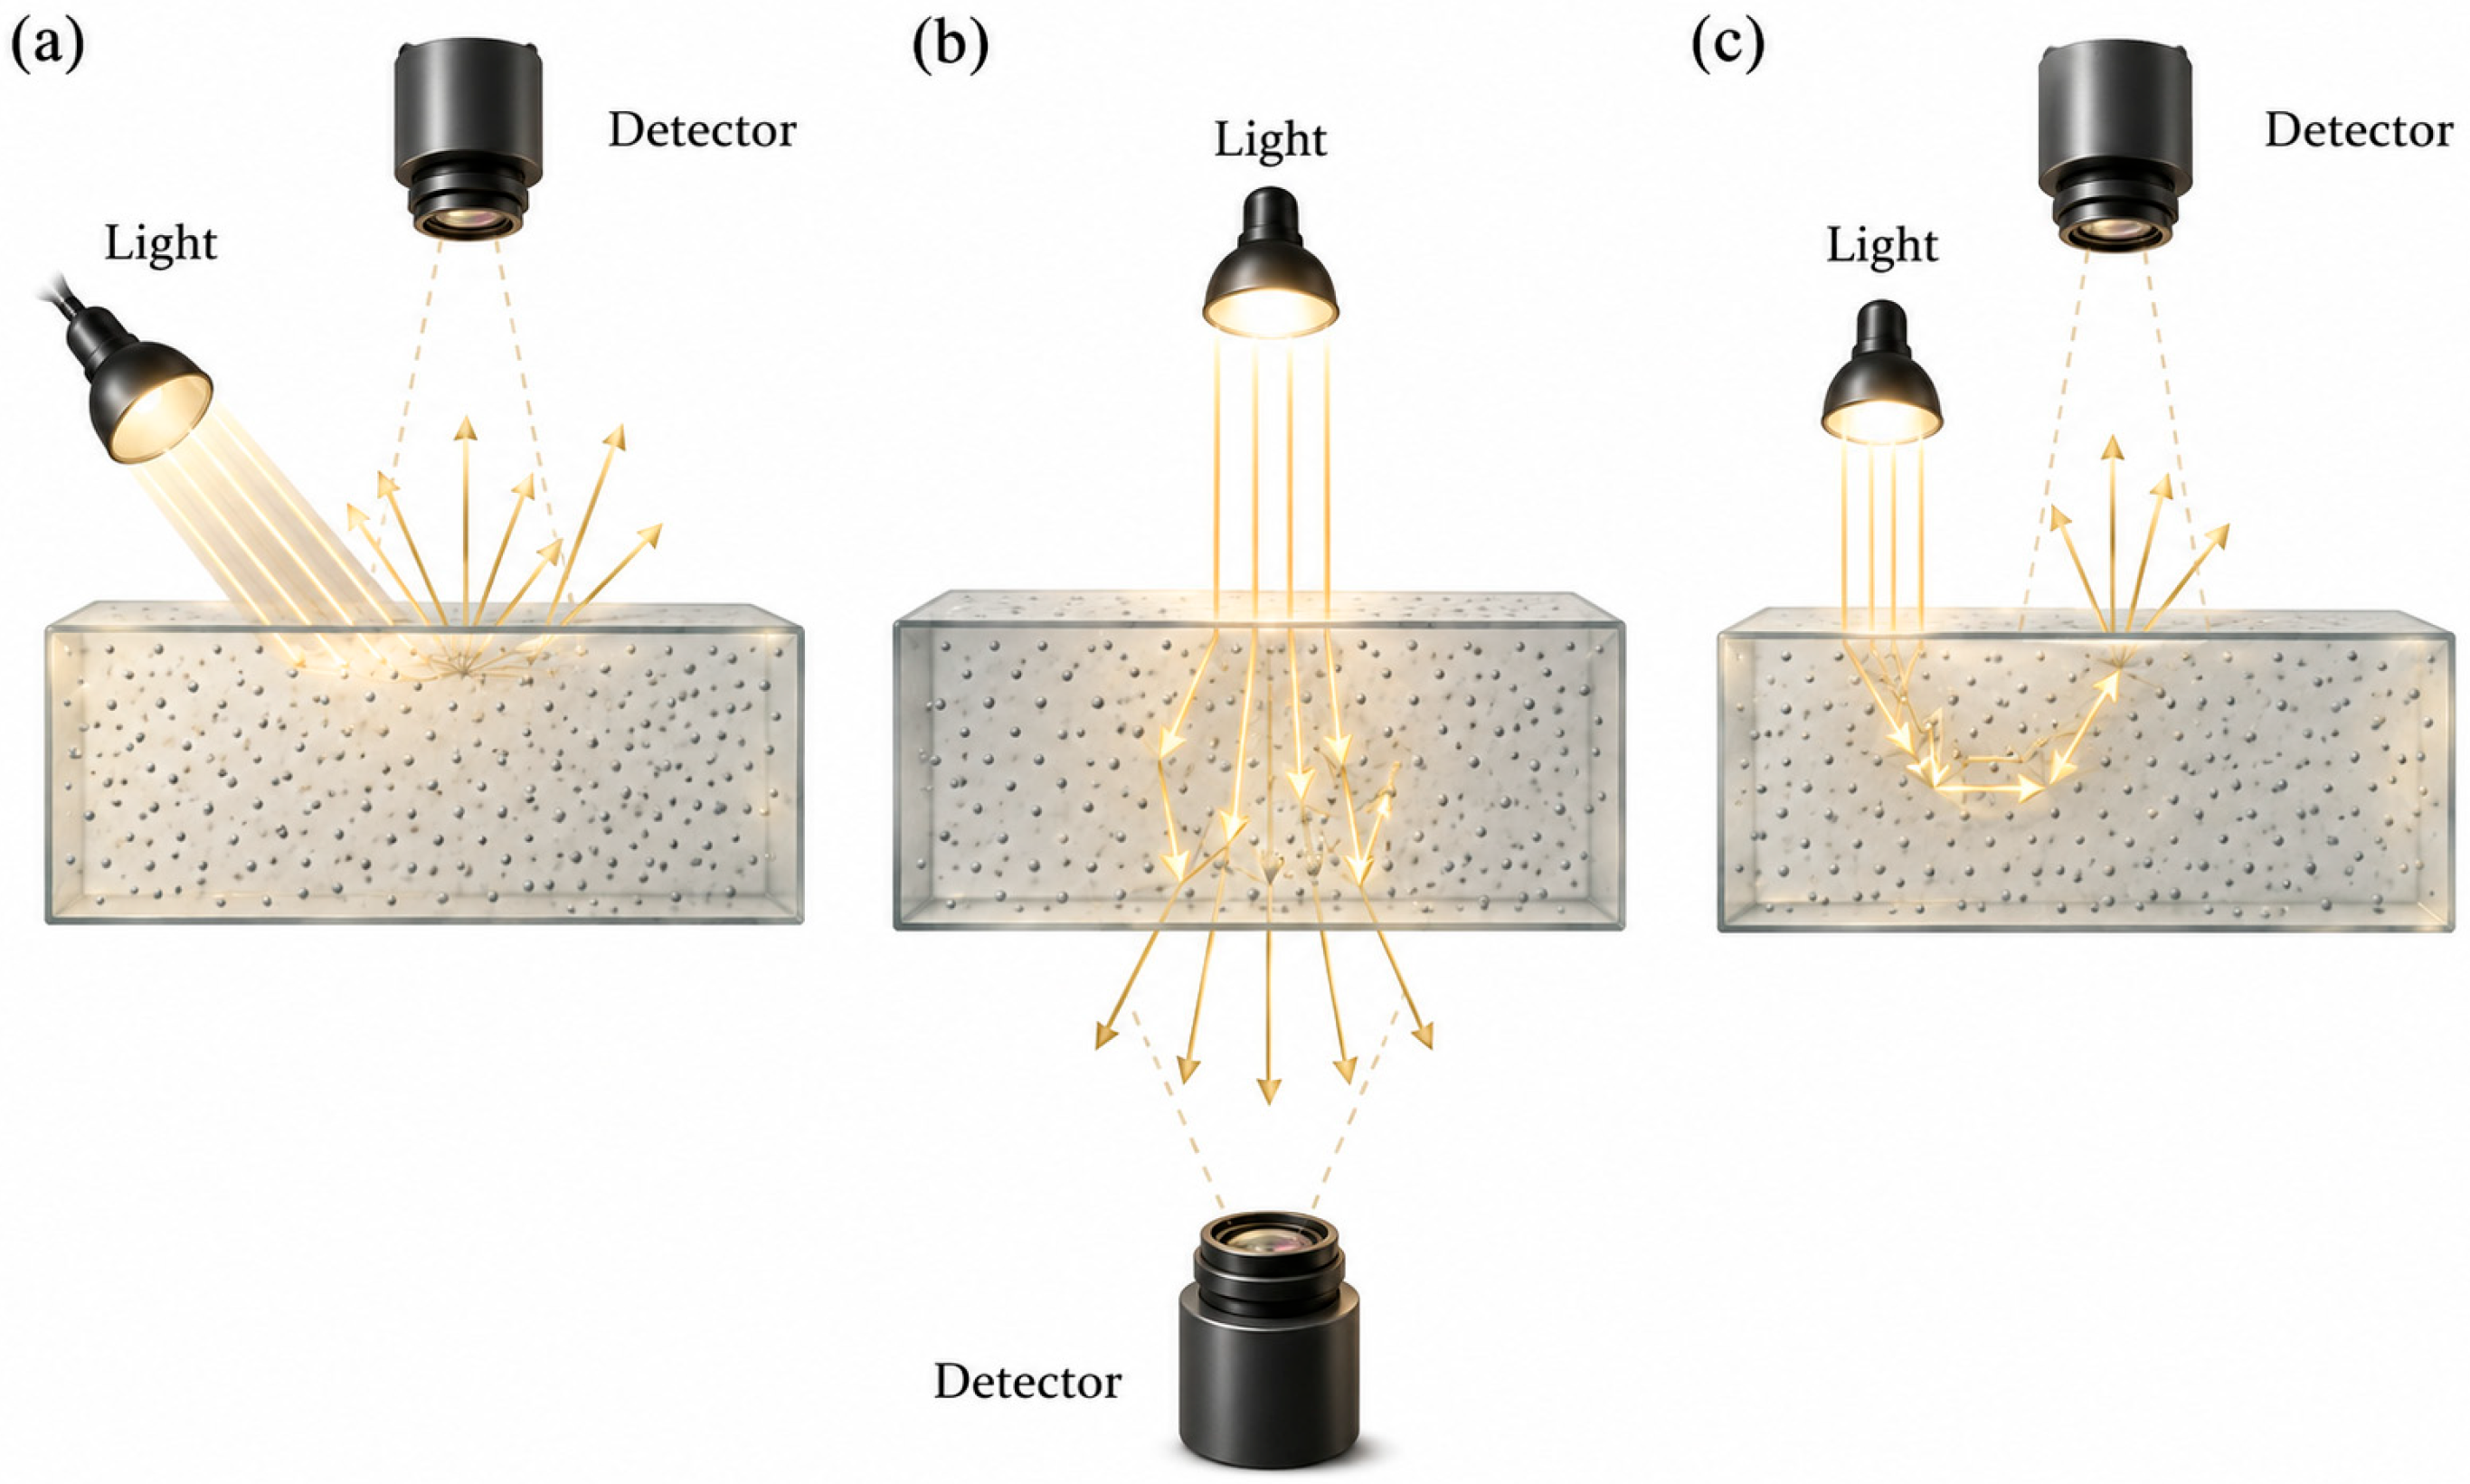
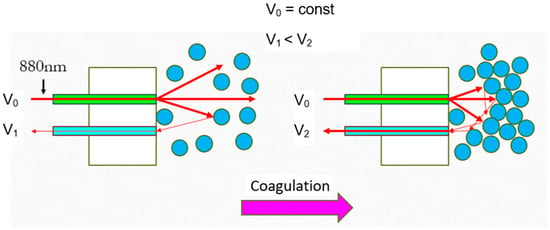

Disclaimer/Publisher’s Note: The statements, opinions and data contained in all publications are solely those of the individual author(s) and contributor(s) and not of MDPI and/or the editor(s). MDPI and/or the editor(s) disclaim responsibility for any injury to people or property resulting from any ideas, methods, instructions or products referred to in the content. |
© 2026 by the authors. Licensee MDPI, Basel, Switzerland. This article is an open access article distributed under the terms and conditions of the Creative Commons Attribution (CC BY) license.