


Abstract
Landslides are a critical environmental hazard in mountainous regions like eastern Uganda, posing serious threats to lives, infrastructure, and ecosystems. While recent advances in geospatial technology have improved hazard assessment, existing research often lacks high-resolution, cloud-based analysis for dynamic landscapes such as the Mount Elgon region. This study addresses that gap by developing a landslide susceptibility map (LSM) using Google Earth Engine (GEE), which integrates remote sensing and geospatial data for scalable analysis. The main objective is to identify landslide-prone zones by analyzing eight conditioning factors, namely slope, elevation, vegetation cover, rainfall, land use land cover, soil type, soil moisture, and groundwater levels using the weighted overlay method (WOM). The methodology produced a classified LSM with zones of high (37.7%), moderate (58%), low (2%), and very low (2.3%) susceptibility, with validation via historical landslide data and ROC analysis yielding an AUC of 0.76, confirming strong predictive performance. The study underscores the value of GEE in hazard modeling and provides actionable insights for targeted risk mitigation, sustainable land use planning, and early warning system development in landslide-prone areas.
1. Introduction
Landslides are among the most destructive natural hazards, resulting in extensive economic damage, loss of life, and disruption to livelihoods and ecosystems. Globally, the annual cost of landslides exceeds USD 20 billion [1]. Between 2004 and 2010 alone, 2620 non-seismically triggered landslides caused over 32,000 fatalities worldwide, with Asia bearing the highest toll, particularly along the Himalayan Arc and in China [2]. In Europe, 476 fatal landslides were recorded between 1995 and 2014, resulting in 1370 deaths and approximately EUR 4.7 billion in economic losses annually [3]. Similarly, Turkey experienced 389 fatal landslides between 1929 and 2018, while China’s historical losses exceed 250,000 deaths and half a billion dollars annually [4]. Even in countries like Canada, where fatalities are relatively low, landslides continue to cause major economic and infrastructural disruptions [5]. These examples highlight the widespread and multifaceted impacts of landslides, affecting both high-income and low-income regions alike.
Globally, landslide occurrences are rising, driven by a combination of natural and anthropogenic factors. Between 1900 and 2024, 543 significant landslides were reported worldwide, with Asia accounting for the majority (399), followed by the Americas (207) and Africa (78), including 12 in Uganda alone [6]. Intensified rainfall from climate change has heightened slope instability, while deforestation, unplanned urbanization, and land use changes have further increased vulnerability, particularly in densely populated, mountainous regions like those in Asia [7]. These trends highlight the need for data-driven tools to support early warning systems, real-time monitoring, and resilient land use planning.
Landslide susceptibility is rising across Africa due to the combined effects of rugged terrain, intense rainfall, deforestation, and unplanned development. A continental-scale study [8] identified the Horn of Africa, Eastern, and Southern regions as most at risk, expanding on [9] earlier Africa-wide susceptibility mapping. Research in Rwanda, Tanzania, Malawi, and the DRC confirms rainfall and land use change as key drivers [10,11]. The 2024 Gofa Zone disaster in Ethiopia, which killed 257 people, highlights the deadly consequences of climate extremes and weak governance [12]. In East Africa, Uganda is particularly vulnerable, with Mount Elgon consistently identified as a national hotspot, having experienced 41 of the country’s 98 major landslides and displacing over 129,000 people since 2010 [6]. The 2024 dam-triggered landslide, which left 141 dead, reflects a troubling increase in disaster severity [9]. Such recurring disasters emphasize the urgency of scalable and evidence-based solutions to improve preparedness and reduce risk.
While existing landslide susceptibility mapping (LSM) efforts in East Africa have yielded useful insights, most are constrained by static, desktop-based GIS workflows that lack scalability and real-time responsiveness [9,13]. The emergence of cloud-based geospatial platforms like Google Earth Engine (GEE) offers a transformative alternative, overcoming barriers related to data access, processing capacity, and infrastructure limitations [14]. When integrated with the weighted overlay method (WOM), GEE allows for automated, multi-criteria analysis that incorporates key conditioning factors such as slope, rainfall, soil, and land cover [15]. However, the application of GEE-WOM combinations remains rare in East African settings, particularly in Mount Elgon, where evidence-based, scalable tools for disaster preparedness are urgently needed.
This study aims to develop a high-resolution landslide susceptibility map for the Mount Elgon districts in eastern Uganda by integrating Google Earth Engine with the weighted overlay method. Using remotely sensed and geospatial data, the study generates a dynamic susceptibility index that accounts for both environmental and anthropogenic risk factors. By advancing a replicable and cloud-native methodology, it addresses the limitations of conventional GIS-based approaches and contributes a practical decision support tool for local planners, disaster managers, and policymakers. The outcome enhances the region’s capacity for early warning, land use planning, and resilience-building, offering a scalable model for other landslide-prone regions in sub-Saharan Africa.
2. Materials and Methods
2.1. Study Area
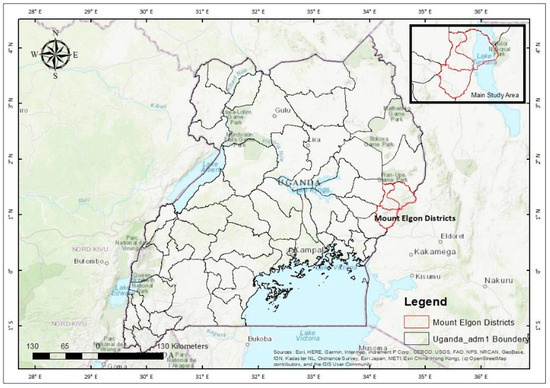
The study area, located in eastern Uganda between latitudes 0.75° N–1.60° N and longitudes 34.1° E–34.8° E, spans approximately 4223 km2 (Figure 1). It features varied topography ranging from 1044 to 4188 m above sea level, with slopes from 0° to 76° [16], contributing to diverse land use and susceptibility to landslides. The region receives about 1442 mm of annual rainfall, with temperatures ranging from 13.3 °C to 26.2 °C [17]. Dominant soils are primarily clay (92%) [18], and land cover is mainly forest (29%), shrubland (26%), grassland (24%), and cropland (18%), with minimal built-up areas, wetlands, bare land, and water bodies [19].
Figure 1.
Geographical location of the study area.
2.2. Dataset Description and Sources
The dataset used in this study was constructed using eight key landslide conditioning factors (LCFs) derived from multiple remote sensing and geospatial sources. To evaluate the proposed method, we used the global landslide dataset available from the NASA satellite repository [20]. Table 1 summarizes these datasets.
Table 1.
Description of landslide conditioning factors and data sources.
2.3. Landslide Conditioning Factor Preparation
Landslide conditioning factors were standardized to a 30 m resolution (EPSG:4326) and clipped to the study area. Key variables including rainfall, elevation, slope, groundwater, and soil moisture were classified into five natural break categories. Soil texture, LULC and the NDVI were reclassified into meaningful classes, ensuring consistency and thematic relevance for susceptibility mapping.
2.4. Weighted Overlay Approach
The weighted overlay method (WOM) is a widely applied knowledge-based empirical technique for landslide susceptibility mapping (LSM) [25]. Numerous studies have employed this approach to produce LSMs [26]. In this method, raster layers representing various landslide conditioning factors are overlaid to generate the susceptibility map. Each factor is reclassified and assigned a weight based on expert judgment and local knowledge, with the total weight summing to 100 [27]. All layers are then integrated using the weighted overlay formula, as outlined in Equation (1).
LSI = ∑ Wi × Sij/∑ Wi
It can be defined where LSM is a spatial unit of the final map, Wi is the weight of the ith factor, and Sij is a subclass weight of the jth factor. Upon the completion of this, LSM was the final product.
2.5. Validation of Landslide Susceptibility Maps
To evaluate model accuracy, two validation techniques were applied, namely landslide density analysis (LDA) and the receiver operating characteristic–area under the curve (ROC-AUC). The comparison of susceptibility map classes and the density of landslides in each of these classes was the first method. To examine the correlation between susceptibility zones and past events of landslides determined spatially, the Tabulate Area tool part of ArcGIS 10.7.1 was also used. A high density of landslides in high- and very high-susceptible areas shows a more authentic and precise model [26].
Also, the RC-AUC approach of comparing the model performance on a graph of sensitivity and specificity was carried out in Scikit-learn in accordance with the methods presented in [28,29]. The AUC value, having a range between 0.5 and 1, is a quantitative measure of predictive power of the model. A score that is close to 1 indicates a high rate of accuracy and reliability of predictions, and a value that is close to or lower than 0.5 shows that the model does not make any better predictions than the simple strategy of guessing [28,30].
3. Results
3.1. Landslide Conditioning Factors
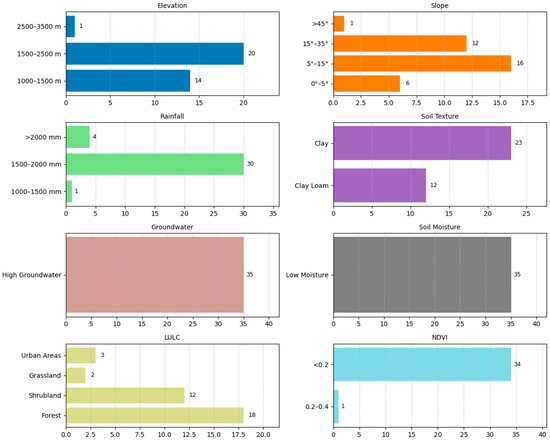
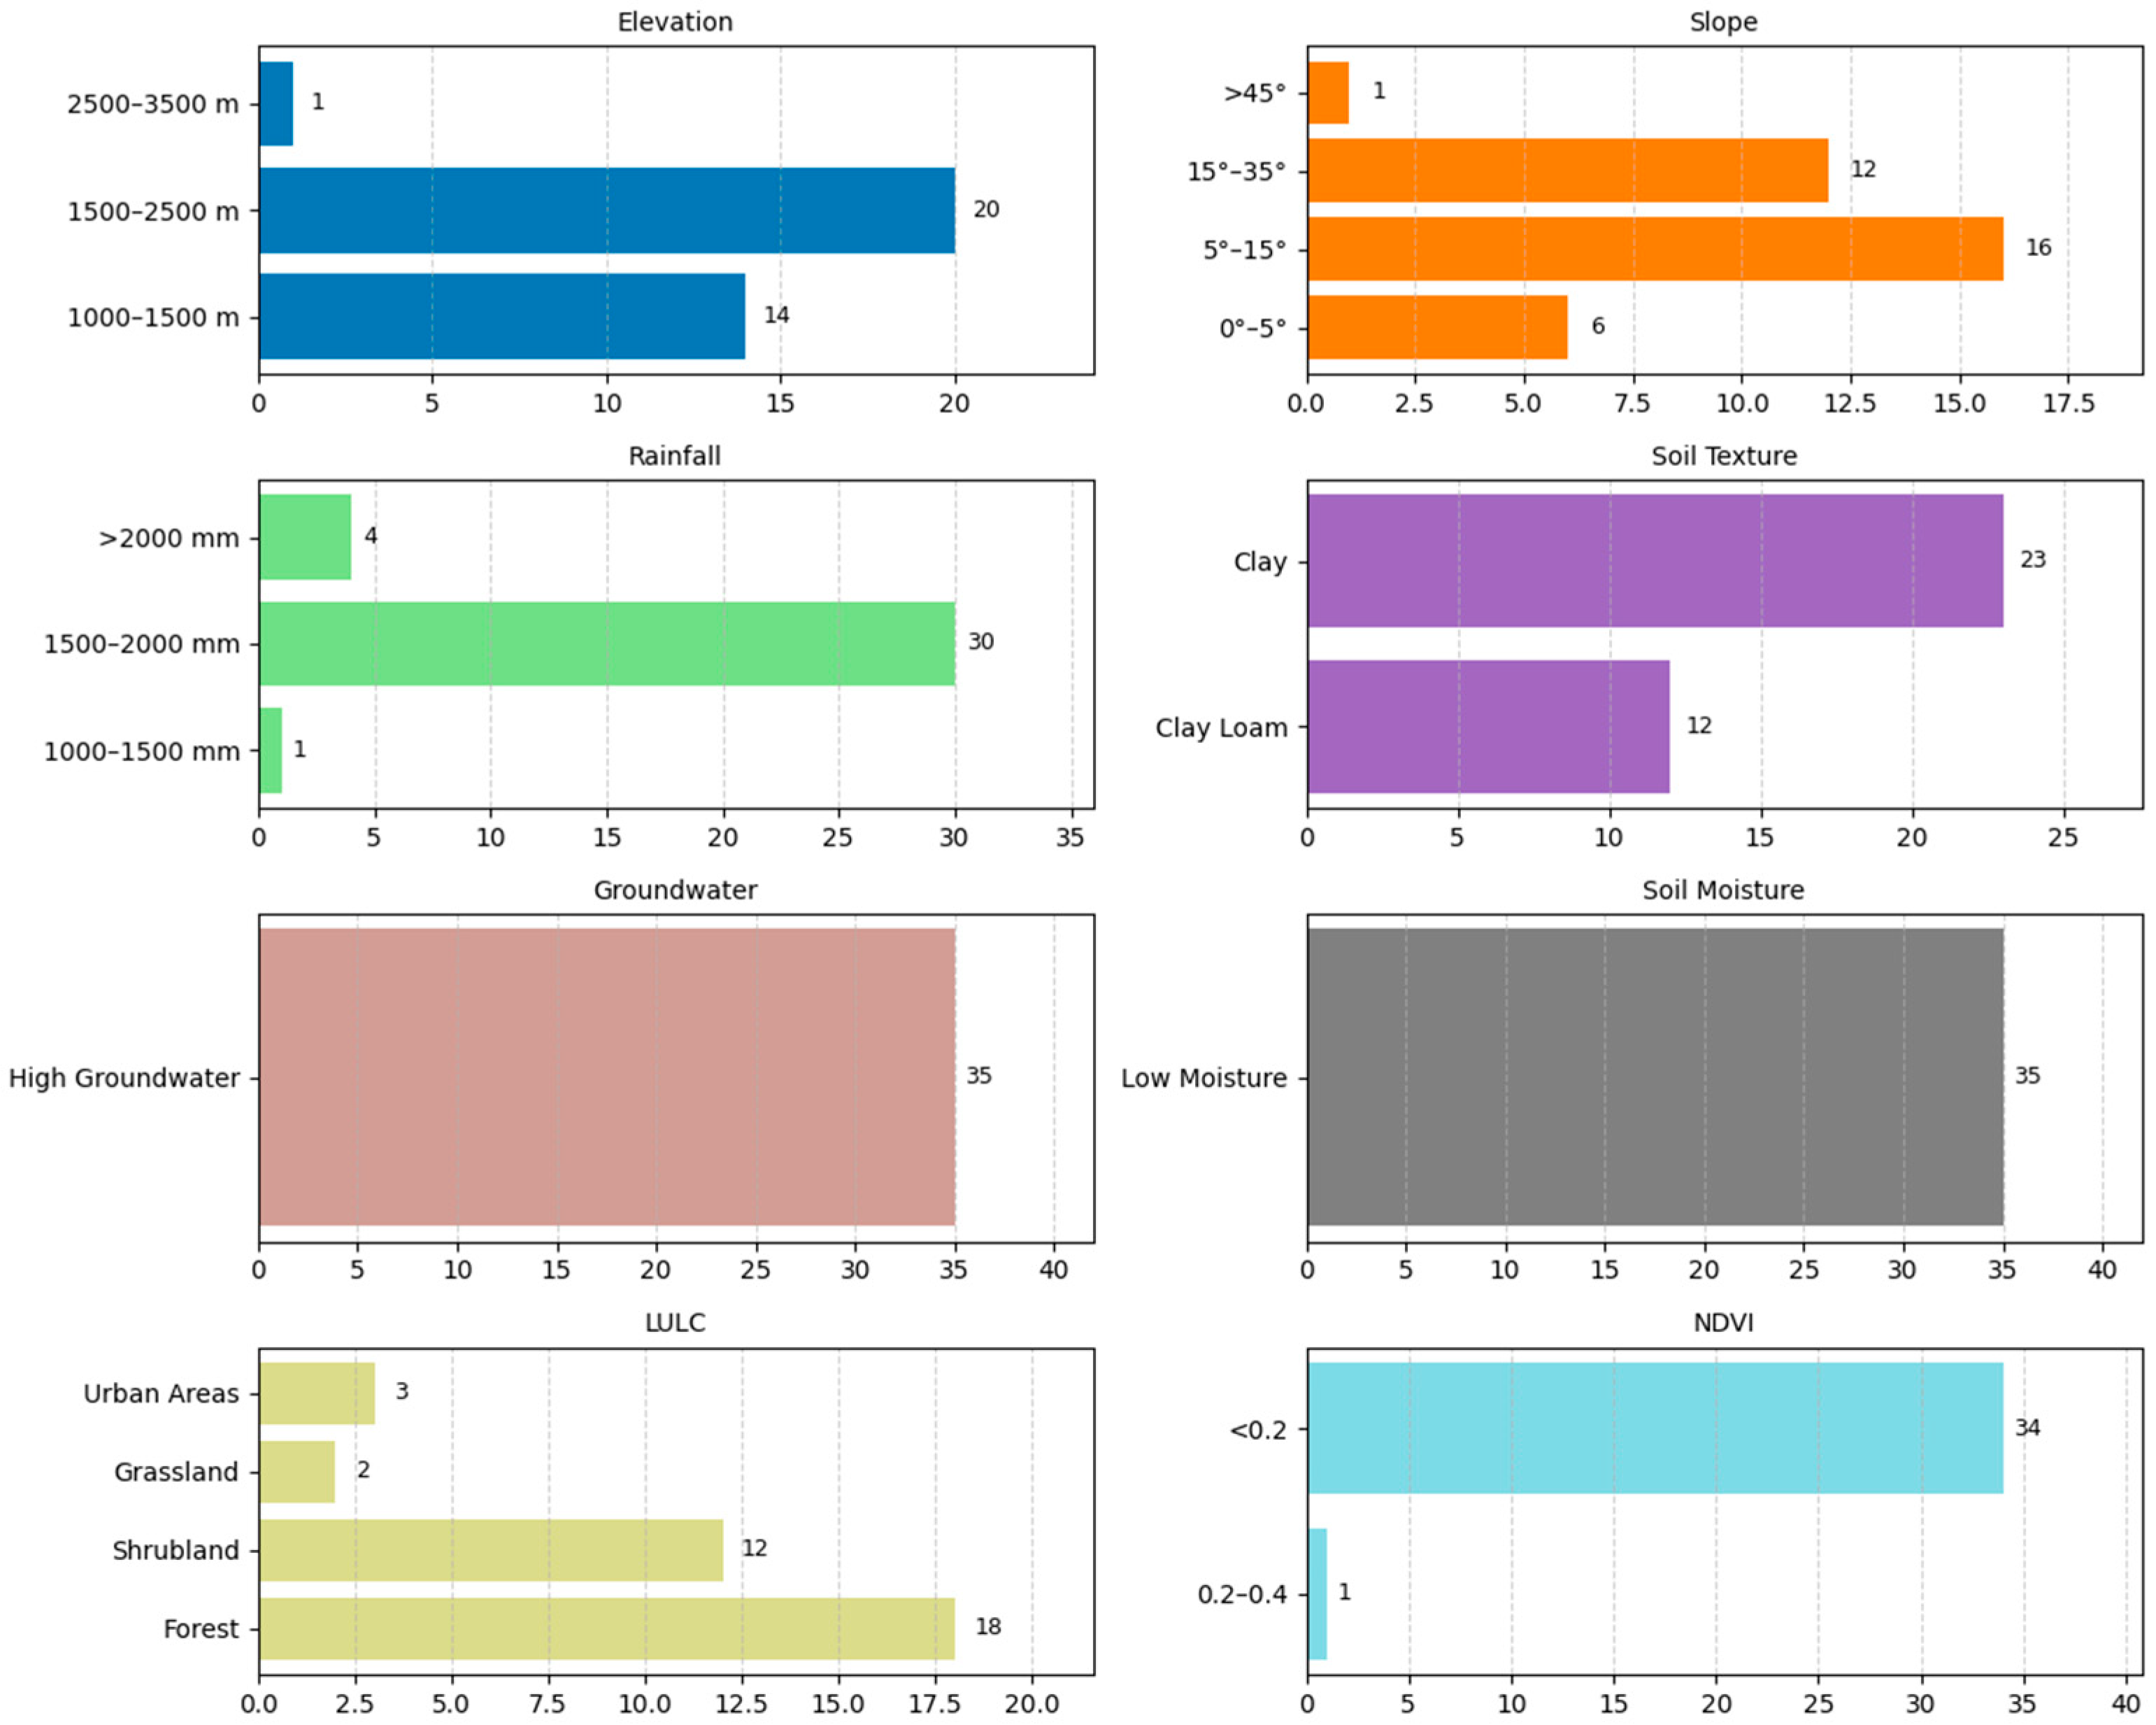
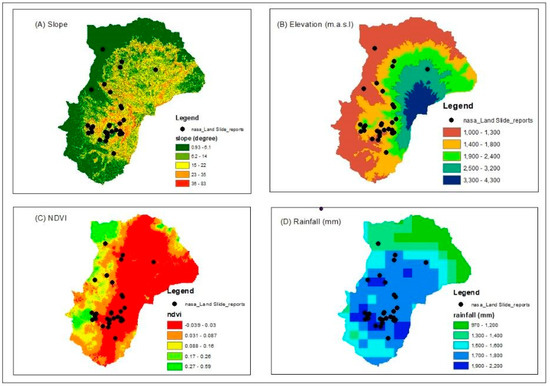
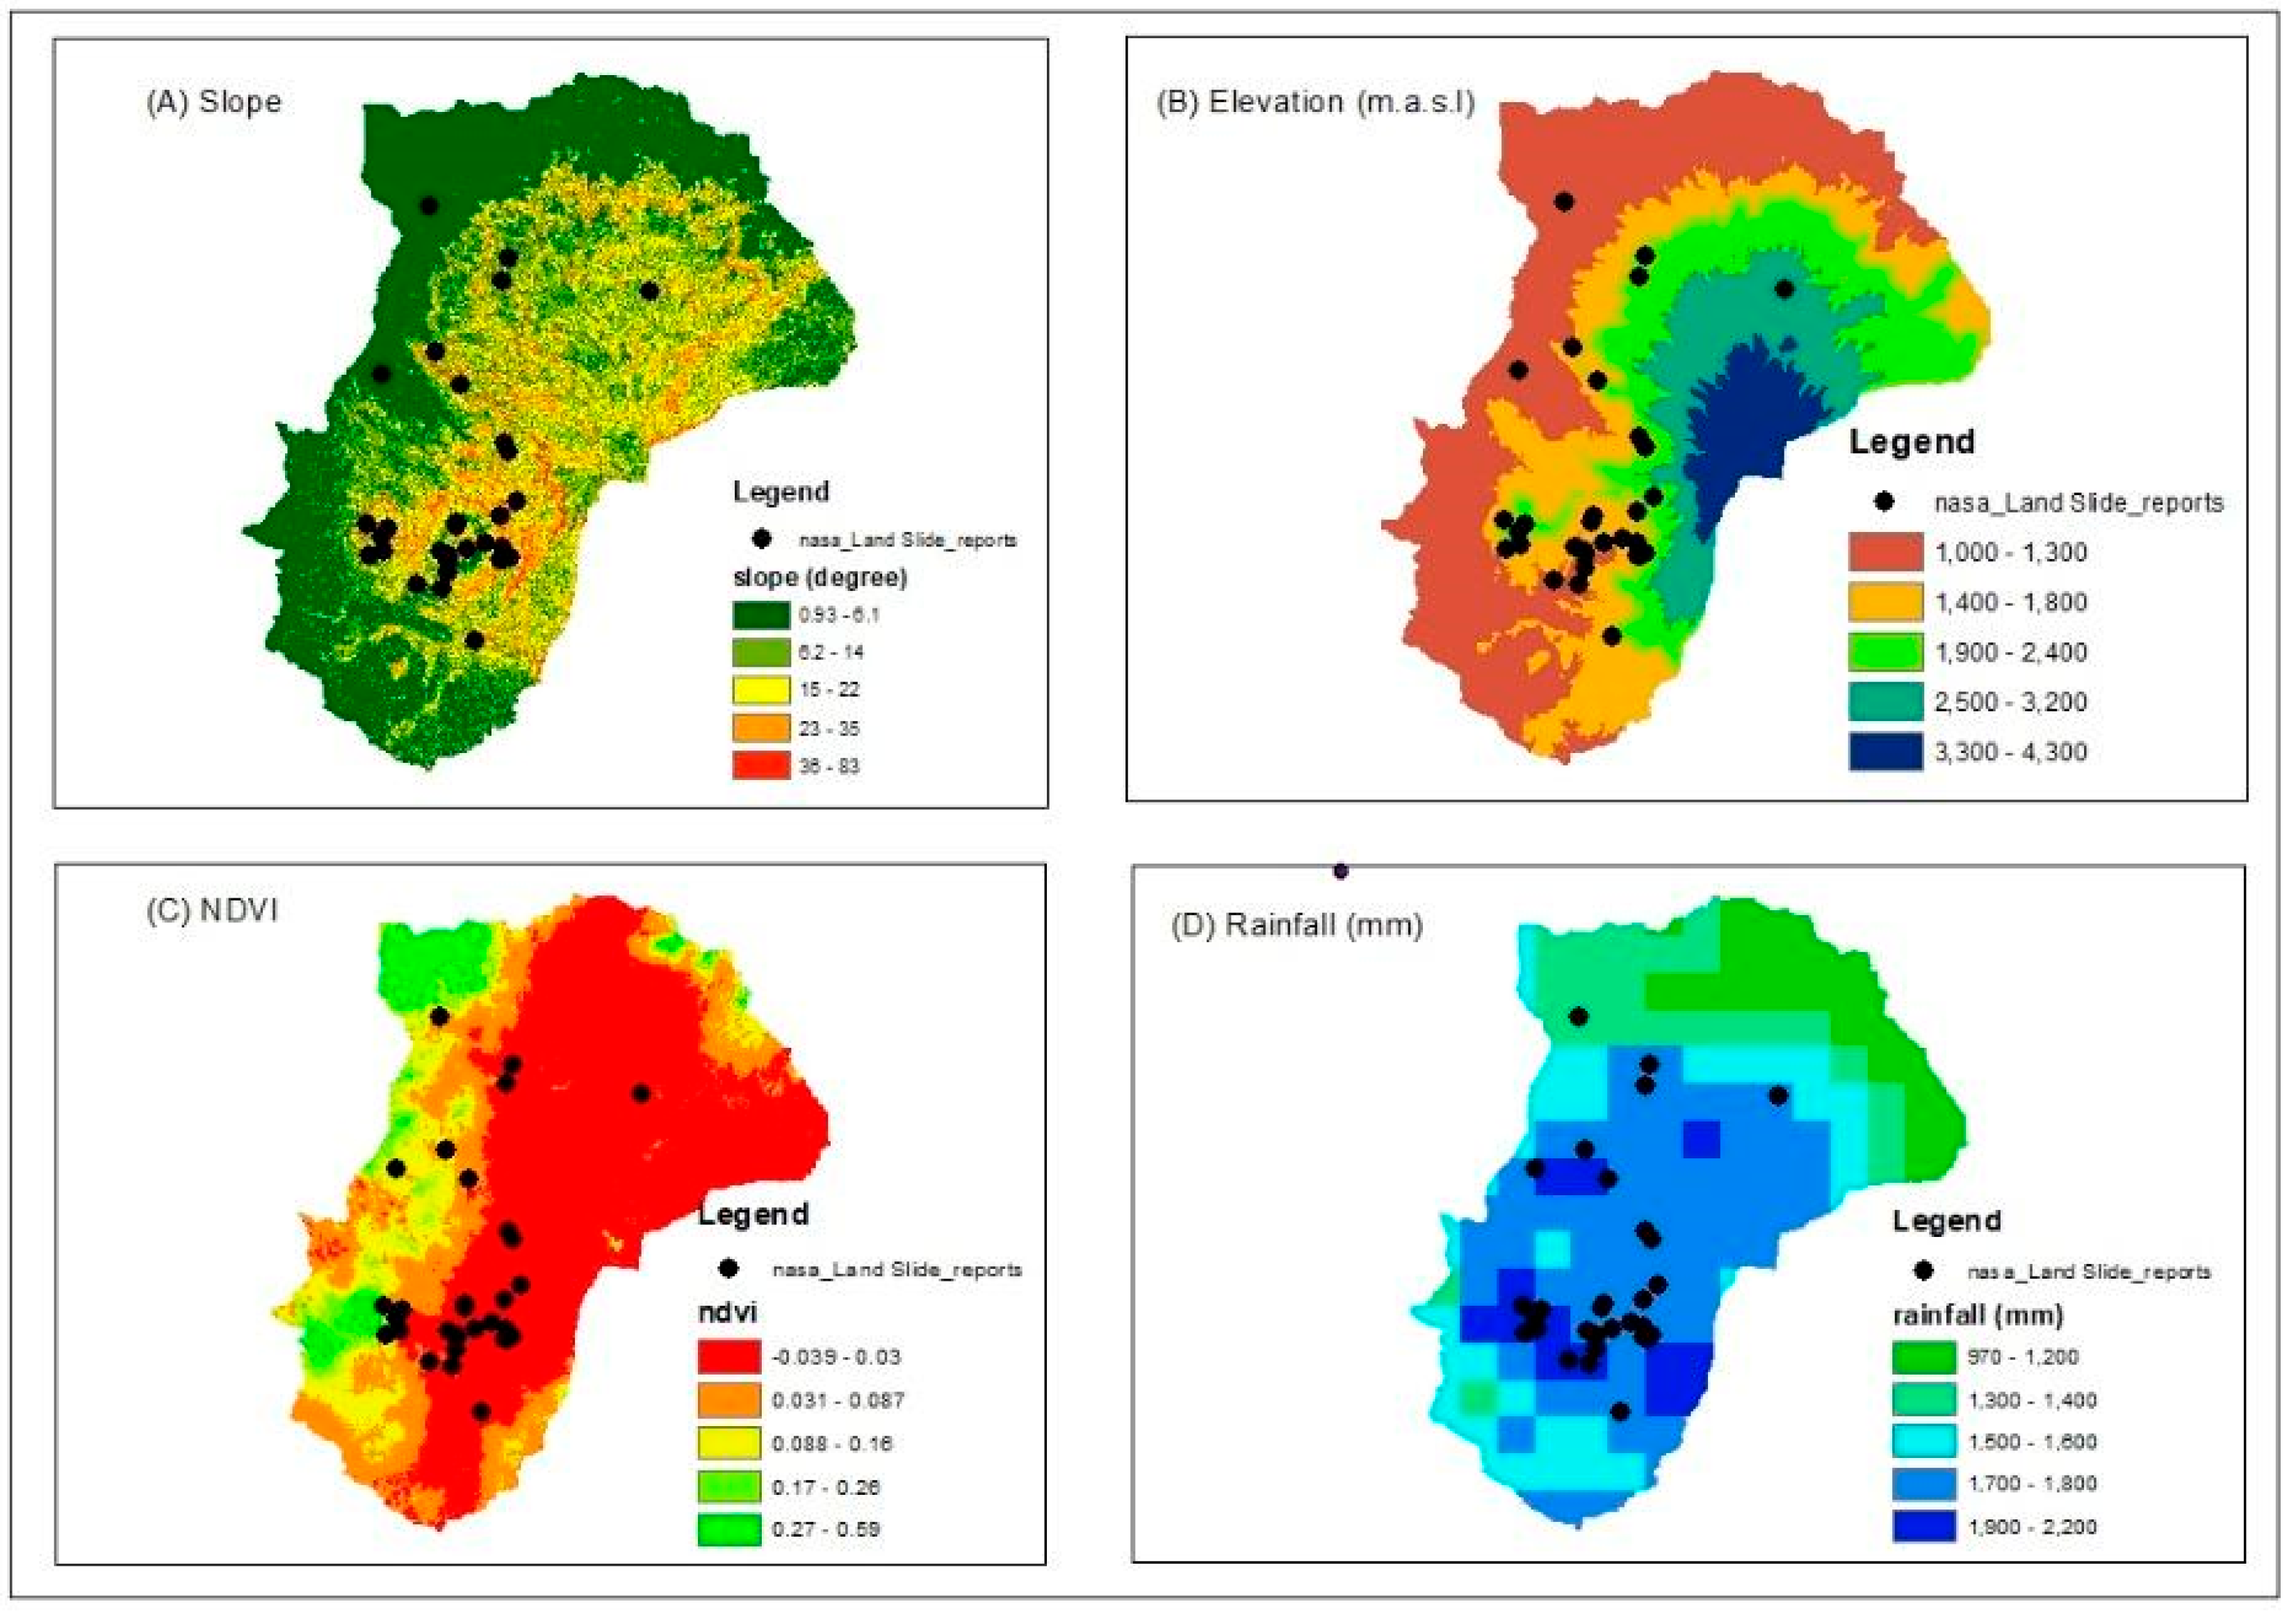
The results indicate that landslides predominantly occurred on moderately sloped areas (Figure 2, Figure 3 and Figure 4), while very steep slopes experienced fewer events. Elevation was also a significant factor, with most landslides (20 cases) occurring between 1500 and 2500 m above sea level (m.a.s.l.).
Figure 2.
Landslide distribution across different conditioning factors.
Figure 3.
LCFs used for LSM. (A) Slope. (B) Elevation. (C) NDVI. (D) Rainfall.
Figure 4.
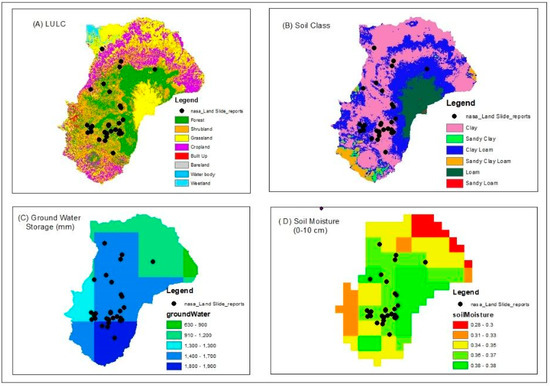
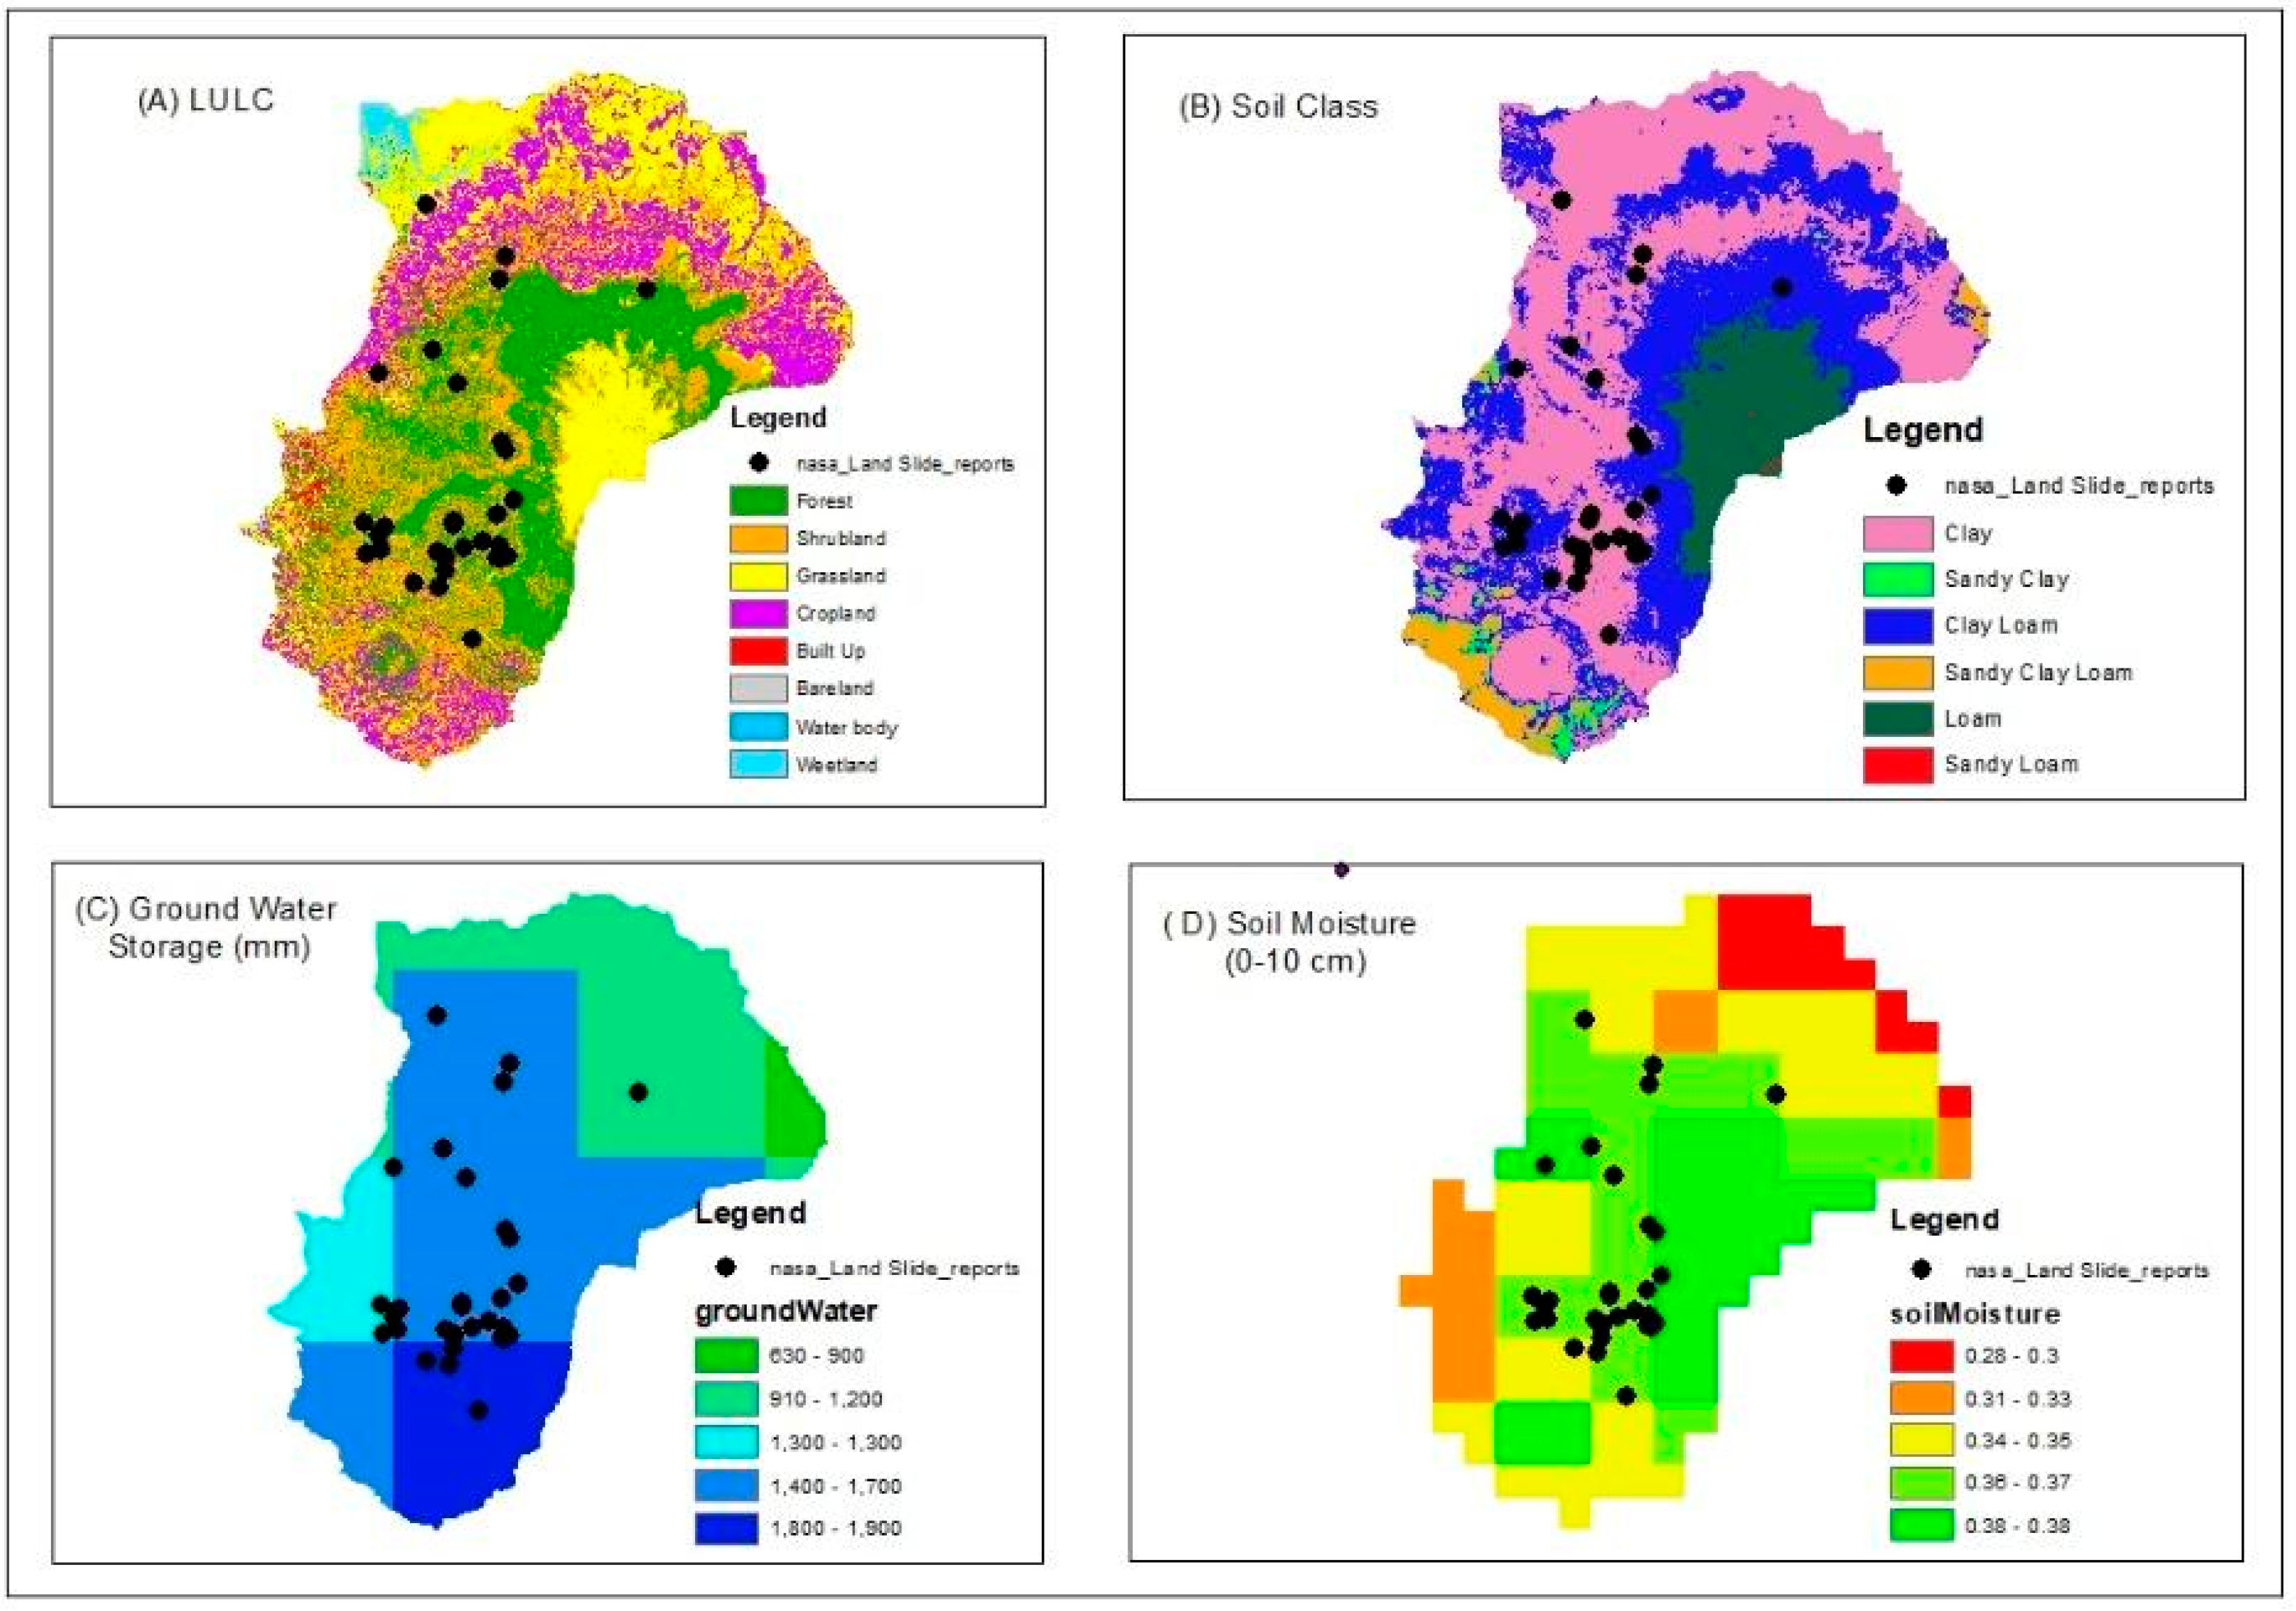
LCFs used for LSM. (A) LULC. (B) Soil. (C) Groundwater storage. (D) Soil moisture.
Rainfall emerges as a key triggering factor, as 30 landslides occurred in regions with annual precipitation between 1500 and 2000 mm. Interestingly, areas receiving over 2000 mm of rainfall saw fewer landslides (four cases). Vegetation cover, assessed using the NDVI, further affects susceptibility. Most landslides (34) were found in areas with NDVI values below 0.2, indicating sparse vegetation.
Landslides were most frequently observed in forested (18 cases) and shrubland (12 cases) regions, which are typically marked by steep slopes. In contrast, only three inci-dents occurred in urban areas. Soil composition also played a significant role, with clay-rich soils known for their high-water retention linked to the majority of events (23 cases), followed by clay loam soils (12 cases). High groundwater levels were another critical factor, as all 35 landslides took place in zones with elevated groundwater presence.
3.2. Landslide Susceptibility Mapping
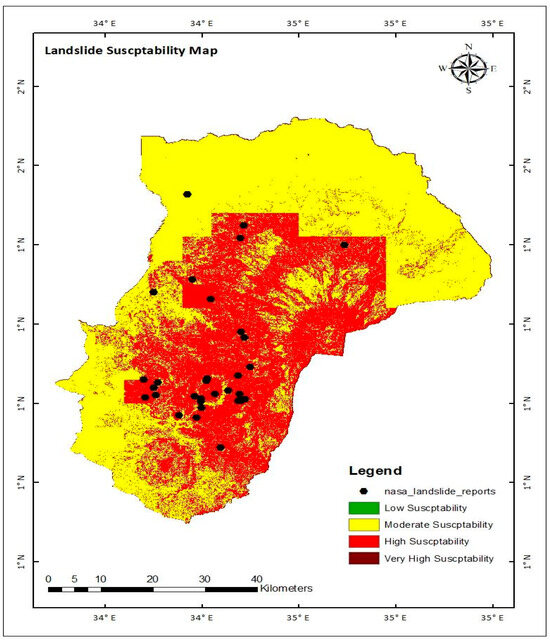
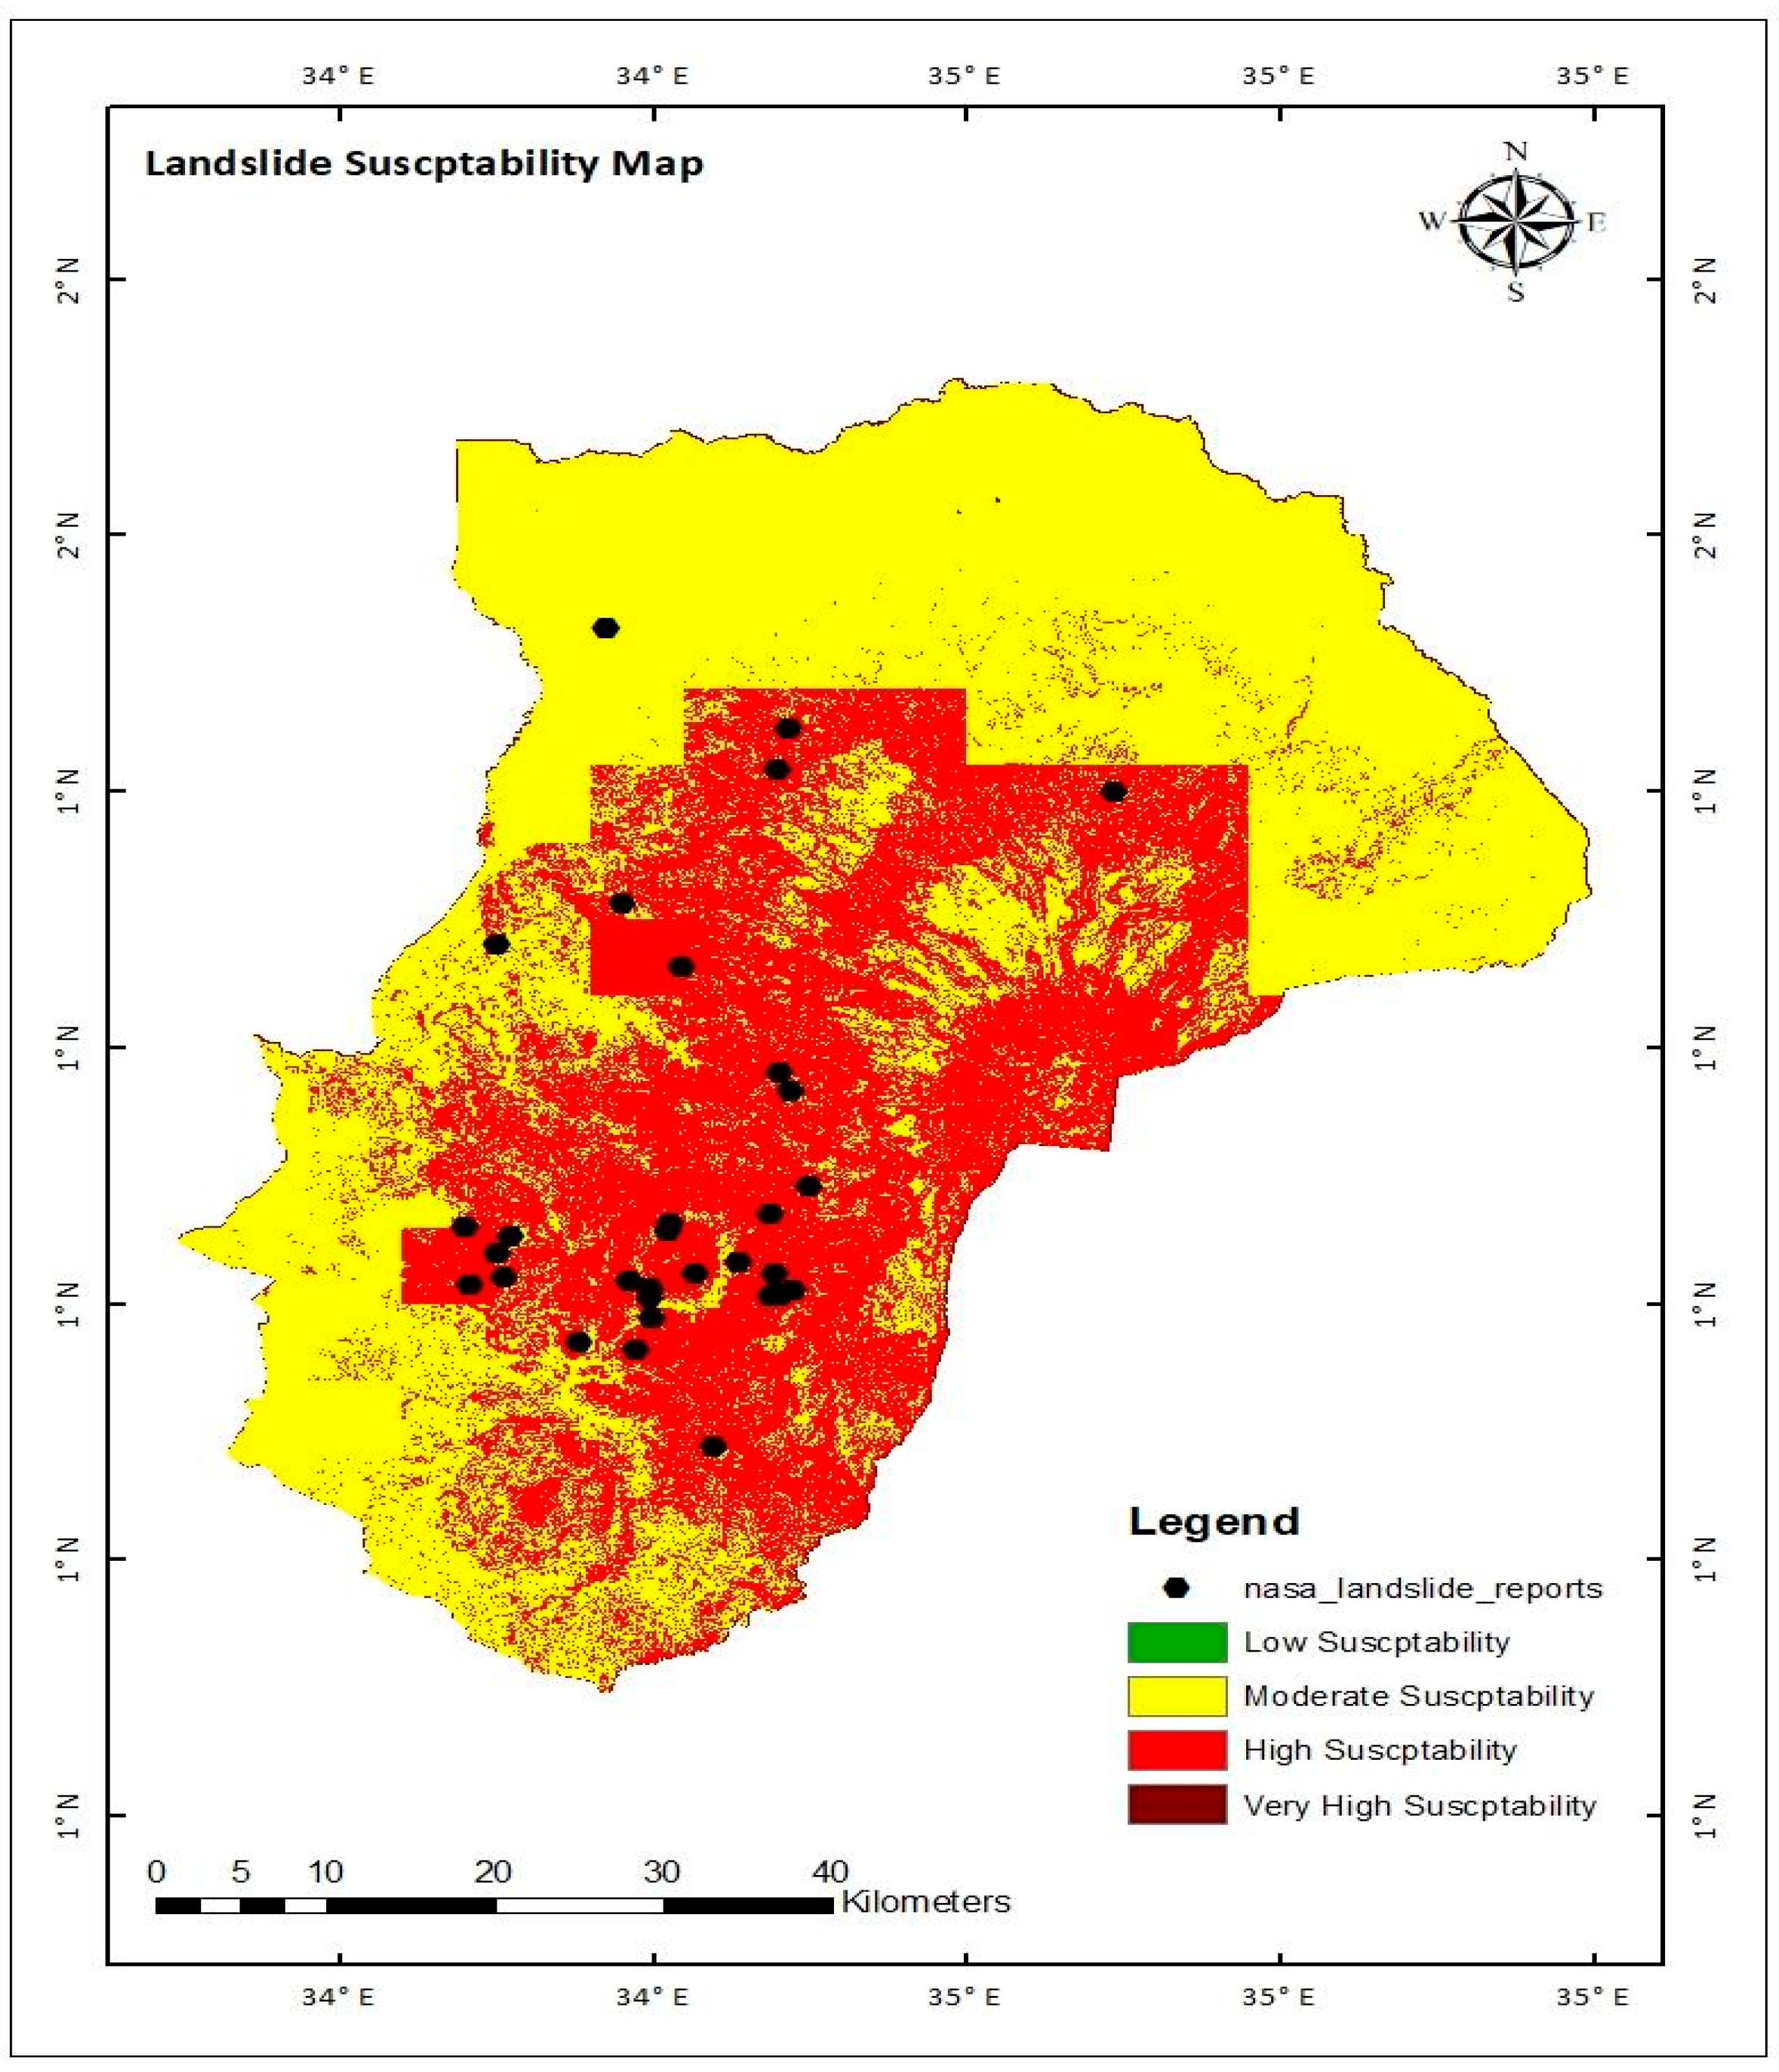
The study area was classified into four landslide susceptibility classes (Figure 5), and their respective percentage area coverages are summarized in Table 2. The results show that high-risk zones are mainly concentrated in the central and southern regions, while low-risk zones are located in the northern and northwestern parts.
Figure 5.
Landslide susceptibility map (LSM).
Table 2.
Landslide susceptibility classification by area and percentage.
The findings show that the region is largely characterized by high- and moderate-landslide-susceptibility zones, underscoring the need for focused mitigation measures in these areas. Conversely, zones with low and very low susceptibility occupy a relatively minor portion of the landscape, indicating limited landslide risk. Notably, no part of the region falls under the very high-susceptibility category, suggesting an absence of extreme landslide threat. These results offer important guidance for hazard management, enabling more effective and targeted strategies to reduce landslide risks and improve disaster readiness.
3.3. Validation of LSM Results
The validation procedure started with an evaluation of the distribution pattern between susceptibility zones and landslide concentration areas. About 97% of all mapped landslides appeared within areas designated as high-susceptibility zones according to the analysis results (Figure 5 and Table 3). The reliability of the generated map emerges through the strong relation between susceptibility classification areas and the occurrences of actual landslide events.
Table 3.
Landslide susceptibility level of map and observed landslides.
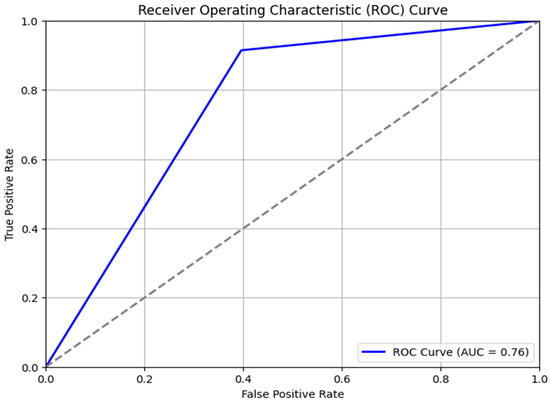
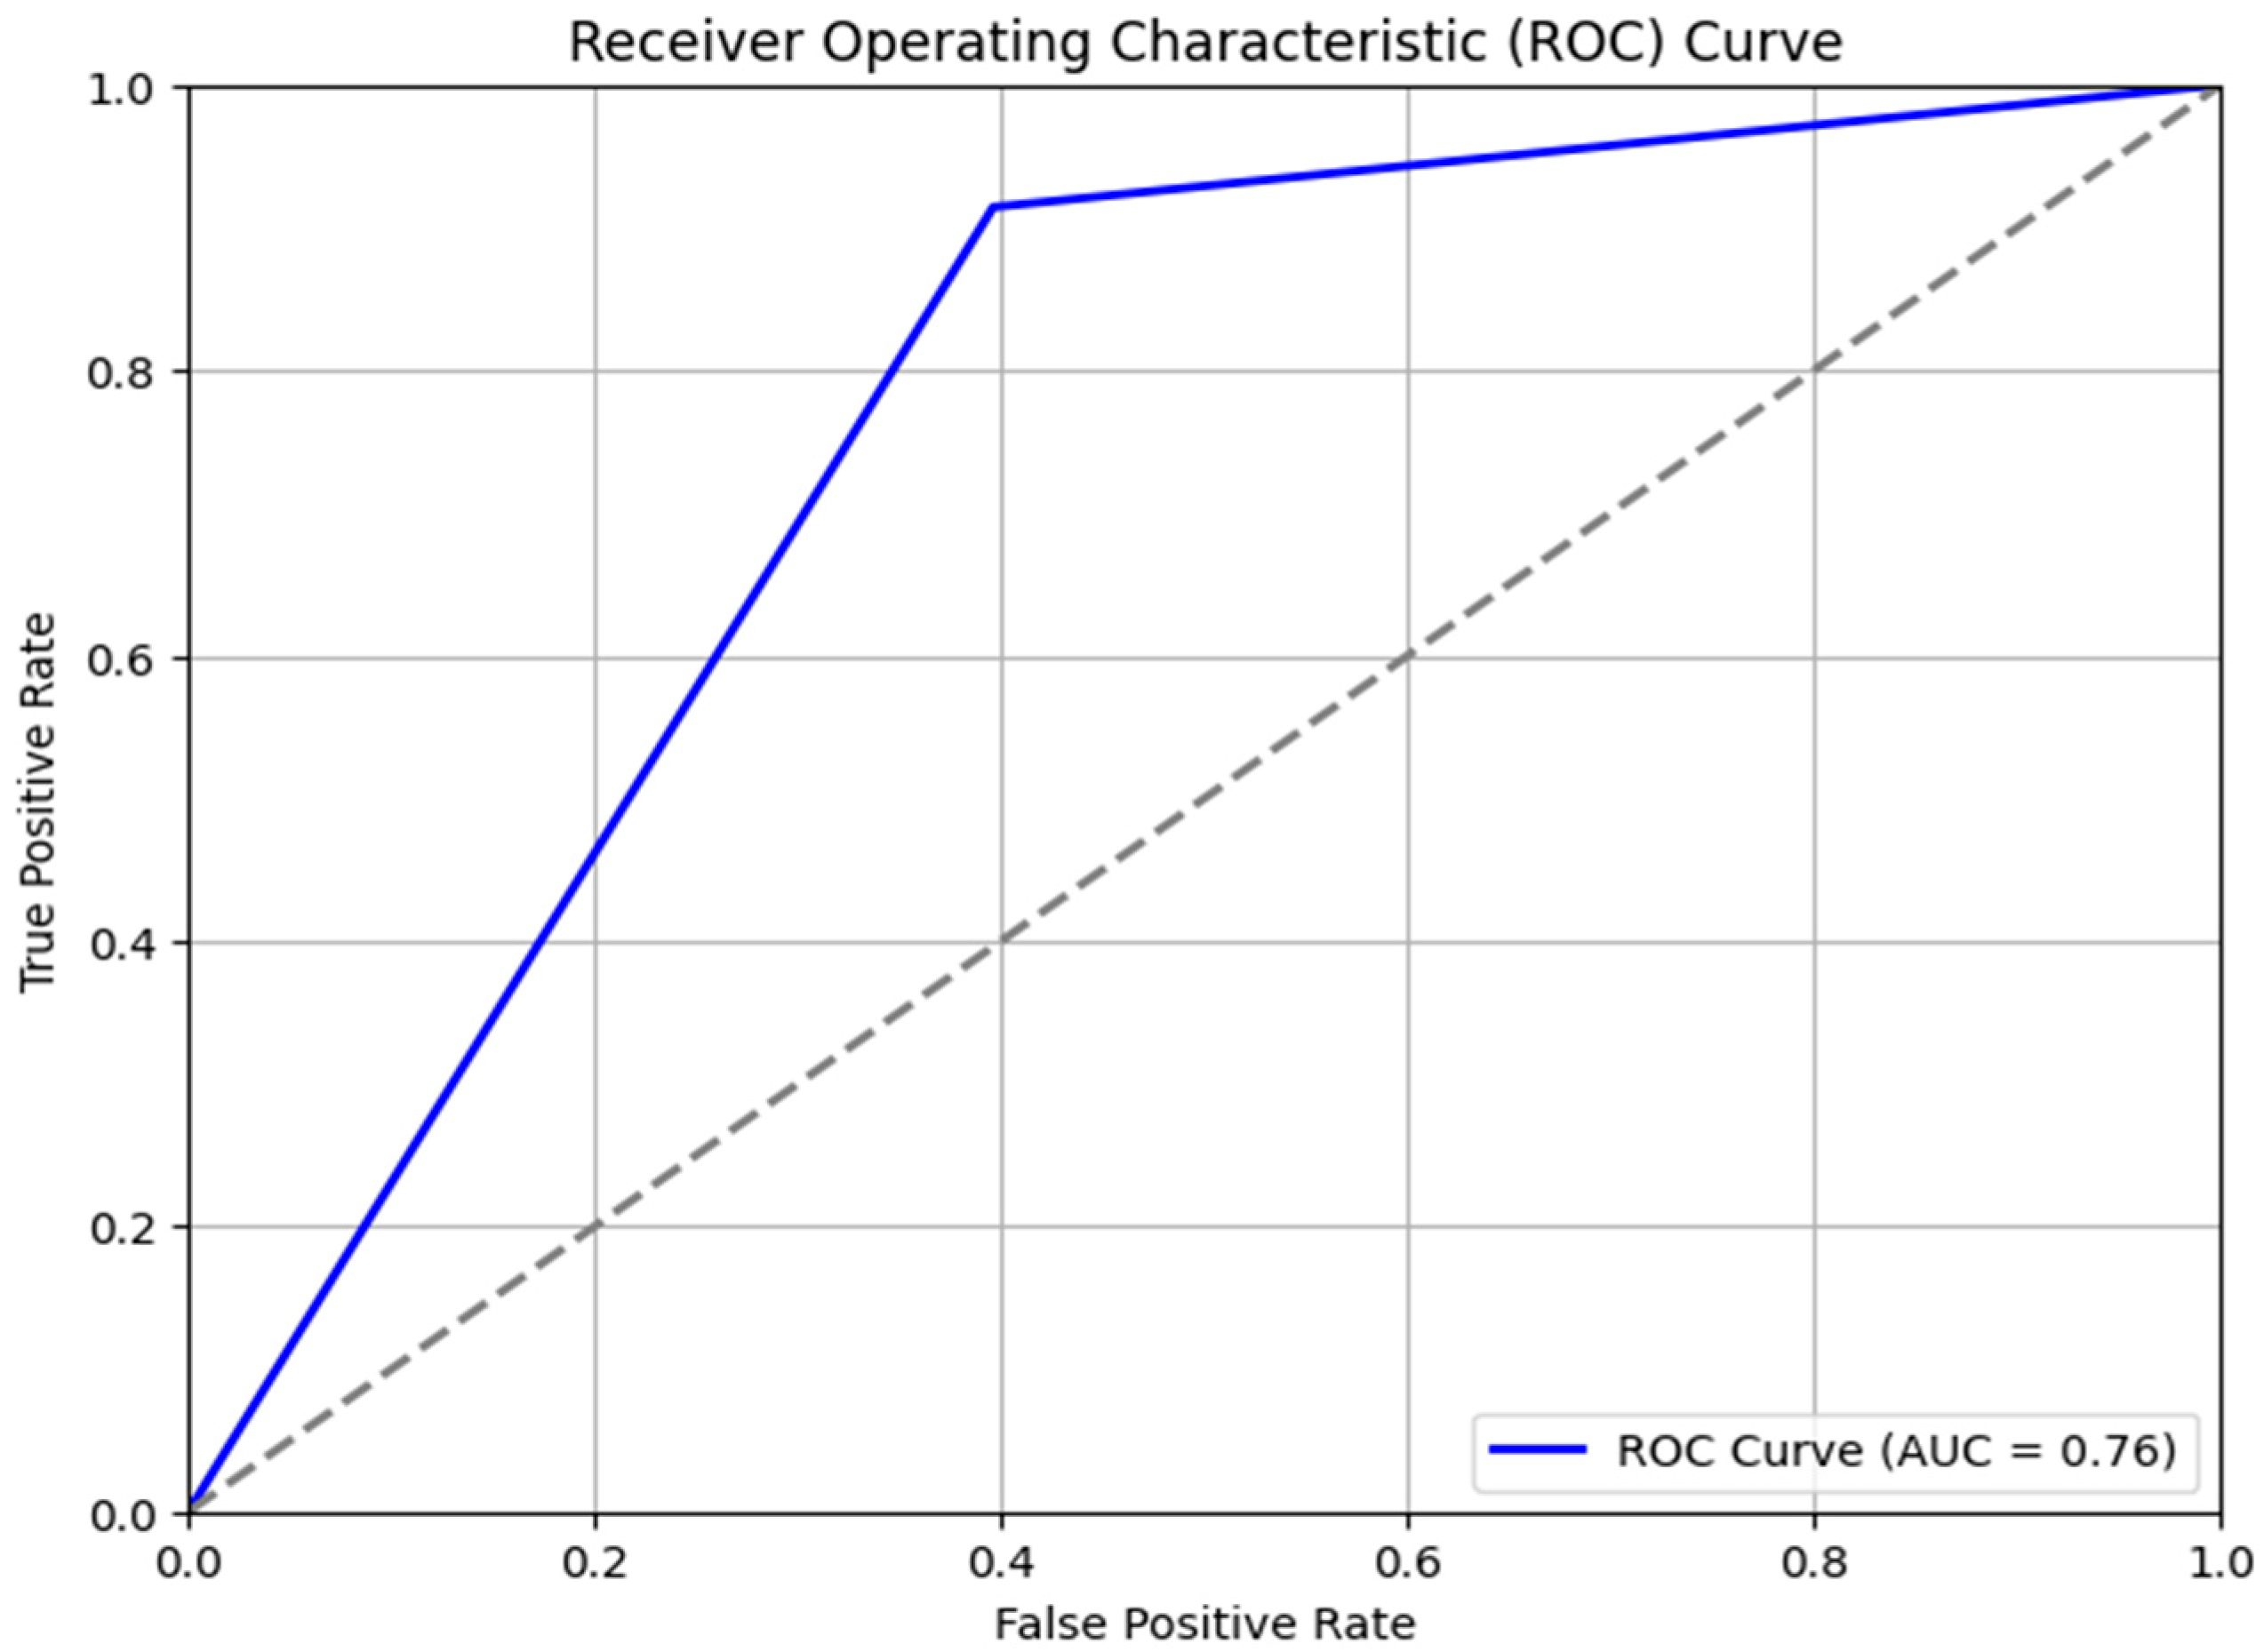
ROC curve analysis served to evaluate the accuracy of the LSM. The purpose of the accuracy assessment was to establish consistent LSM predictions through the separation of locations prone to landslides from those without any landslide risks. Figure 6 shows the ROC curve analysis, where evaluation through the AUC produced an outcome of 0.76 (76%). The predictive accuracy of identifying landslide susceptibility reaches high levels, because the model obtained an AUC score of 0.76 (76%).
Figure 6.
Receiver operating characteristic (ROC) curve for landslide susceptibility assessment.
4. Discussion
The findings indicate that landslide susceptibility is influenced by a combination of natural and human-induced factors, including slope, elevation, rainfall, vegetation cover, soil type, and groundwater levels. The LSM achieved successful classification of the study area into high-, moderate-, and low- and very low-susceptibility zones, where high and moderate areas represent the largest parts. The model exhibited high predictive accuracy based on landslide density distribution analysis and ROC curve validation.
Landslide occurrence presents its highest frequency on slopes with moderate angles between 5 and 15° according to study results which support earlier research findings about steep slopes having reduced susceptibility due to less human activity and stabilizing vegetation [31,32,33]. Most landslides occurred between 1500 and 2500 m. a.s.l, and this data matches findings from previous research according to [34]. The middle-elevation areas show higher rates of landslides, since they receive more rainfall while supporting increased soil moisture and human agricultural practices.
The study establishes rainfall as a major trigger of landslides, because the majority of recorded landslides occurred in areas that experience between 1500 and 2000 mm in annual rainfall. The occurrence of landslides becomes less frequent in locations receiving more than 2000 mm of rainfall, since dense vegetation minimizes slope instability. A study [28,35] confirms that vegetation is vital in stopping slope failures. The study data confirmed the connection between higher groundwater levels, because all observed landslides occurred in zones with high groundwater pressure [36].
Soil class and LULC proved to be another critical factor. Clayey soils displayed the most landslide occurrences because they are known to retain high levels of water [37]. The combination of steep slopes in forest and shrubland areas triggered higher landslide numbers than urban areas because forest and shrubland zones possess natural terrain instability, yet urban areas receive benefits from engineered stabilization practices [32]. The analysis demonstrates that various environmental elements work together in landslide susceptibility; thus, it becomes essential to develop specific remediation approaches.
The findings validate previous research about landslide susceptibility together with new specific observations. Soil types and groundwater levels have proven to be more influential for landslide risks than previously established factors of rainfall and slope angle according to [32]. This research backs up [37,38] the theory that long-term saturated soil causes slope fragility, which results in slope instability.
The main innovation within this model relies on the incorporation of GEE for landslide mapping, providing improved precision and data accessibility. GEE demonstrates superior performance compared to standard GIS-based methods because it enables swift data processing during real-time operations, which leads to faster landslide susceptibility evaluations. The model shows reliable performance because its validation accuracy measure (AUC = 76%) matches similar research that used ROC curve analysis findings [26,27]. The use of weighted overlay analysis with remote sensing data produces successful results in identifying landslide-prone areas.
The investigation produces critical findings which affect how natural disasters are managed, as well as how urban areas should be designed and how environmental protection should be pursued. Landslide prevention measures starting with high- and moderate-risk zones require land conservation efforts alongside slope protection through engineered techniques along with controlled land management. The project planning of urban areas and infrastructure development should include geotechnical assessments along with drainage systems, as these areas mainly experience landslides within forested and shrubland territories. Regarding agricultural practices, mid-elevation areas, where most landslides occur, require sustainable land management strategies to prevent further slope degradation. Additionally, the integration of real-time satellite data and machine learning models could enhance early warning systems, helping communities prepare for potential landslide hazards.
This study has several limitations. The analysis relies on the weighted overlay method, which may not fully capture complex landslide patterns. Additionally, key variables such as geology were excluded due to data limitations. Uncertainties in landslide data and biases in remote sensing products (e.g., rainfall and soil moisture) were also not addressed, impacting accuracy. Future research should explore hybrid models combining geospatial analysis, artificial intelligence, and in situ measurements to create more accurate and adaptive landslide susceptibility models.
This study successfully applied GEE-based spatial analysis to map landslide susceptibility in the Mount Elgon region, providing high-accuracy predictive insights (AUC = 76%). The results underscore the critical role of slope, rainfall, soil type, vegetation, and groundwater levels in landslide occurrence. The developed LSM serves as a valuable tool for hazard mitigation, land use planning, and early warning systems. However, addressing model limitations through machine learning integration, geological data incorporation, and improved landslide inventories will be essential for enhancing future landslide risk assessments. By leveraging advanced geospatial tools and data-driven approaches, this research contributes to a more effective and accessible landslide risk assessment framework, ultimately supporting sustainable disaster resilience and environmental management in landslide-prone regions.
5. Conclusions
This study successfully employed Google Earth Engine (GEE) and a weighted overlay method (WOM) to enhance landslide susceptibility mapping in the Mount Elgon districts of eastern Uganda. The analysis carried out the identification of major environmental conditions that contribute to the risk of landslides, and these conditions are the angle of slope, elevation, plant cover, precipitation, land use land cover, soil type, soil moisture, and the level of groundwater. Moderate-sloping terrain (5–15), mid-range altitude (1500–2500 m), low vegetative cover (NDVI < 0.2), high precipitation (1500–2000 mm), soils enriched in clay, and areas with a high-water table were proven to be the most vulnerable to landslides.
The susceptibility mapping identified four different risks zones, namely very low, low, moderate, and high in the region. Areas of high and moderate susceptibility were more concentrated in the central and southern areas of the research region, whereas the susceptible areas were predominantly in the north and northwest of the study area. This accuracy of the model was checked by ROC analysis, which revealed an AUC value of 0.76, implying strong conformity between the mapped high-risk areas and the observed landslides.
These findings provide critical input for risk-informed land use planning, early warning systems, and targeted interventions. Immediate priorities include slope stabilization, improved drainage systems, and reforestation in high- and moderate-risk zones. The study underscores the importance of integrating geospatial tools into disaster risk management to deliver efficient, data-driven solutions.
Finally, enhancing public awareness through the education, evacuation drills, and capacity-building of local authorities is essential to increase community resilience. Future research should explore climate change impacts in high-rainfall zones and encourage collaboration among government agencies, researchers, and communities to strengthen preparedness and response strategies for landslide hazards.
Author Contributions
M.M.A. led the data collection, analysis, and drafting of the manuscript under the supervision of P.E.E.; P.E.E. and Z.B. reviewed and provided input on the final version. All authors contributed to the study design, reviewed earlier drafts, and approved the final manuscript. All authors have read and agreed to the published version of the manuscript.
Funding
The study received financial and logistic support from the CoSTClim and MERIT project.
Data Availability Statement
The original contributions presented in this study are included in the article. Further inquiries can be directed to the corresponding author.
Acknowledgments
We gratefully acknowledge the CoSTClim project team for organizing the summer school, where this manuscript was initiated and later enriched through fieldwork. We thank the trainers for their guidance and support throughout the process.
Conflicts of Interest
The authors declare no conflicts of interest.
References
- Zumpano, V.; Pisano, L.; Malek, Ž.; Micu, M.; Aucelli, P.P.; Rosskopf, C.M.; Parise, M. Economic losses for rural land value due to landslides. Front. Earth Sci. 2018, 6, 97. [Google Scholar] [CrossRef] [Scilit]
- Petley, D.N. Global patterns of loss of life from landslides. Geology 2012, 40, 927–930. [Google Scholar] [CrossRef] [Scilit]
- Haque, U.; Blum, P.; da Silva, P.F.; Andersen, P.; Pilz, J.; Chakraborty, S.; Chalov, S.R.; Malet, J.-P.; Auflič, M.J.; Andres, N.; et al. Fatal landslides in Europe. Landslides 2016, 13, 1545–1554. [Google Scholar] [CrossRef] [Scilit]
- Fidan, S.; Görüm, T. Türkiye’de ölümcül heyelanların dağılım karakteristikleri ve ulusal ölçekte öncelikli alanların belirlenmesi. Türk Coğrafya Derg. 2020, 74, 123–134. [Google Scholar] [CrossRef] [Scilit]
- Strouth, A.; McDougall, S. Historical landslide fatalities in British Columbia, Canada: Trends and implications for risk management. Front. Earth Sci. 2021, 9, 606854. [Google Scholar] [CrossRef] [Scilit]
- Centre for Research on the Epidemiology of Disasters (CRED). EM-DAT: The International Disaster Database; Université catholique de Louvain: Brussels, Belgium, 2024; Available online: https://www.emdat.be (accessed on 12 January 2025).
- Chae, B.G.; Park, H.J.; Catani, F.; Simoni, A.; Berti, M. Landslide prediction, monitoring, and early warning: A concise review of state-of-the-art. Geosci. J. 2017, 21, 1033–1070. [Google Scholar] [CrossRef] [Scilit]
- Nahayo, L.; Peng, C.; Lei, Y.; Tan, R. Spatial understanding of historical and future landslide variation in Africa. Nat. Hazards 2023, 119, 2463–2487. [Google Scholar] [CrossRef] [Scilit]
- Broeckx, J.; Maertens, M.; Isabirye, M.; Nakileza, B.; Vanmaercke, M. Landslide susceptibility and mobilization rates in the Mount Elgon region, Uganda. Landslides 2018, 16, 571–584. [Google Scholar] [CrossRef] [Scilit]
- Makonyo, T.; Zahor, L. GIS-based analysis of landslide susceptibility mapping: A case study of Lushoto District, north-eastern Tanzania. Nat. Hazards 2023, 118, 1085–1115. [Google Scholar] [CrossRef] [Scilit]
- Deijns, A.A.; Dewitte, O.; Thiery, W.; d’Oreye, N.; Malet, J.P.; Kervyn, F. Timing landslide and flash flood events from SAR satellite: A regionally applicable methodology illustrated in African cloud-covered tropical environments. Nat. Hazards Earth Syst. Sci. 2022, 22, 3679–3697. [Google Scholar] [CrossRef] [Scilit]
- Abdulahi, M.; Egli, M. Landslides triggered by the July 21–22, 2024, heavy rainfall in the Gofa Zone, Southern Ethiopia. Landslides 2024, 22, 267–270. [Google Scholar] [CrossRef] [Scilit]
- Opedes, H.; Nedala, S.; Mücher, C.; Baartman, J.; Mugagga, F. How Can Drones Uncover Land Degradation Hotspots and Restoration Hopespots? An Integrated Approach in the Mount Elgon Region with Community Perceptions. Land 2023, 12, 1. [Google Scholar] [CrossRef] [Scilit]
- Yang, K.; Niu, R.; Song, Y.; Dong, J.; Zhang, H.; Chen, J. Dynamic hazard assessment of rainfall-induced landslides using gradient boosting decision tree. Water 2024, 16, 1638. [Google Scholar] [CrossRef] [Scilit]
- Faisal, R.M.; Shehab, Z.N. Integrating GIS and comparative multi-criteria decision-making techniques for landslide susceptibility assessment. Prog. Phys. Geogr. 2025. [Google Scholar] [CrossRef] [Scilit]
- Farr, T.G.; Rosen, P.A.; Caro, E.; Crippen, R.; Duren, R.; Hensley, S.; Kobrick, M.; Paller, M.; Rodriguez, E.; Roth, L.; et al. The Shuttle Radar Topography Mission. Rev. Geophys. 2007, 45, RG2004. [Google Scholar] [CrossRef] [Scilit]
- Abatzoglou, J.T.; Dobrowski, S.Z.; Parks, S.A.; Hegewisch, K.C. TerraClimate: A high-resolution global dataset. Sci. Data 2018, 5, 170191. [Google Scholar] [CrossRef] [Scilit]
- Hengl, T. Soil texture classes (USDA system) for 6 soil depths (0, 10, 30, 60, 100 and 200 cm) at 250 m (Version v02) [Data set]. Zenodo 2018. [Google Scholar] [CrossRef]
- Zanaga, D.; Van De Kerchove, R.; Daems, D.; De Keersmaecker, W.; Brockmann, C.; Kirches, G.; Wevers, J.; Cartus, O.; Santoro, M.; Fritz, S.; et al. ESA WorldCover 10 m 2021 v200. 2022. Available online: https://zenodo.org/records/7254221 (accessed on 12 January 2025).
- Zanaga, D.; Bravo-López, E.R.; Delgado-García, J.; Sarmiento, L. Analysis of conditioning factors in Cuenca, Ecuador, for landslide susceptibility map generation employing machine learning methods. Land 2022, 12, 1135. [Google Scholar] [CrossRef] [Scilit]
- NASA Goddard Space Flight Center. Global Landslide Catalog (GLC). NASA. 2025. Available online: https://landslides.nasa.gov (accessed on 12 January 2025).
- Wiese, D.N.; Yuan, D.-N.; Boening, C.; Landerer, F.W.; Watkins, M.M. JPL GRACE and GRACE-FO Mascon Ocean, Ice, and Hydrology Equivalent Water Height JPL RL06.3Mv04. Ver. RL06.3Mv04. PO.DAAC, CA, USA. Available online: https://podaac.jpl.nasa.gov/dataset/TELLUS_GRAC-GRFO_MASCON_GRID_RL06.1_V3 (accessed on 12 January 2025).
- U.S. Geological Survey (USGS). Landsat 8 OLI/TIRS Level-2 Science Product, Path 042, Row 034; USGS Earth Resources Observation and Science (EROS) Center: Sioux Falls, SD, USA, 2013. Available online: https://earthexplorer.usgs.gov/ (accessed on 12 January 2025).
- Funk, C.; Peterson, P.; Landsfeld, M.; Pedreros, D.; Verdin, J.; Shukla, S.; Husak, G.; Rowland, J.; Harrison, L.; Hoell, A.; et al. The climate hazards infrared precipitation with stations—A new environmental record for monitoring extremes. Sci. Data 2015, 2, 150066. [Google Scholar] [CrossRef] [Scilit] [PubMed]
- Khatun, M.; Hossain, A.S.; Sayem, H.M.; Moniruzzaman, M.; Ahmed, Z.; Rahaman, K.R. Landslide susceptibility mapping using weighted-overlay approach in Rangamati, Bangladesh. Earth Syst. Environ. 2023, 7, 223–235. [Google Scholar] [CrossRef] [Scilit]
- Ali, S.A.; Parvin, F.; Vojteková, J.; Costache, R.; Linh, N.T.T.; Pham, Q.B.; Vojtek, M.; Gigović, L.; Ahmad, A.; Ghorbani, A.M. GIS-based landslide susceptibility modeling: A comparison between fuzzy multi-criteria and machine learning algorithms. Geosci. Front. 2021, 12, 857–876. [Google Scholar] [CrossRef] [Scilit]
- Basharat, M.; Rohn, J.; Baig, M.S.; Khan, M.R. Spatial distribution analysis of mass movements triggered by the 2005 Kashmir earthquake in the Northeast Himalayas of Pakistan. Geomorphology 2014, 206, 203–214. [Google Scholar] [CrossRef] [Scilit]
- Babitha, G.; Shweta, V.; Sameena, P.; Silvia Raquel, G.B. Machine learning based landslide susceptibility mapping models and GB-SAR based landslide deformation monitoring systems: Growth and evolution. Remote Sens. Appl. Soc. Environ. 2023, 29, 100905. [Google Scholar] [CrossRef] [Scilit]
- Dashbold, B.; Bryson, L.S.; Crawford, M.M. Landslide hazard and susceptibility maps derived from satellite and remote sensing data using limit equilibrium analysis and machine learning model. Nat. Hazards 2023, 116, 235–265. [Google Scholar] [CrossRef] [Scilit]
- Di Napoli, M.; Tanyas, H.; Castro-Camilo, D.; Calcaterra, D.; Cevasco, A.; Di Martire, D.; Pepe, G.; Brandolini, P.; Lombardo, L. On the estimation of landslide intensity, hazard and density via data-driven models. Nat. Hazards 2023, 119, 1513–1530. [Google Scholar] [CrossRef] [Scilit]
- Shano, L.; Raghuvanshi, T.K.; Meten, M. Landslide susceptibility evaluation and hazard zonation techniques—A review. Geoenviron. Disasters 2020, 7, 18. [Google Scholar] [CrossRef] [Scilit]
- Murgia, I.; Vitali, A.; Giadrossich, F.; Tonelli, E.; Baglioni, L.; Cohen, D.; Schwarz, M.; Urbinati, C. Effects of Land Cover Changes on Shallow Landslide Susceptibility Using SlideforMAP Software (Mt. Nerone, Italy). Land 2024, 13, 1575. [Google Scholar] [CrossRef] [Scilit]
- Zhao, Z.; Liu, Z.Y.; Xu, C. Slope unit-based landslide susceptibility mapping using certainty factor, support vector machine, random forest, CF-SVM and CF-RF models. Front. Earth Sci. 2021, 9, 589630. [Google Scholar] [CrossRef] [Scilit]
- Nakileza, B.R.; Nedala, S. Topographic influence on landslides characteristics and implication for risk management in upper Manafwa catchment, Mt Elgon Uganda. Geoenviron. Disasters 2020, 7, 27. [Google Scholar] [CrossRef] [Scilit]
- Ali, S.A.; Khatun, R.; Ahmad, A.; Ahmad, S.N. Assessment of cyclone vulnerability, hazard evaluation and mitigation capacity for analyzing cyclone risk using GIS technique: A study on Sundarban biosphere reserve, India. Earth Syst. Environ. 2020, 4, 71–92. [Google Scholar] [CrossRef] [Scilit]
- Jayakody, S.H.S.; Uzuoka, R.; Ueda, K. Effect of groundwater dynamics in rain-induced landslides: Centrifuge and numerical study. Soils Found. 2024, 64, 101482. [Google Scholar] [CrossRef] [Scilit]
- Jacobs, L.; Dewitte, O.; Poesen, J.; Maes, J.; Mertens, K.; Sekajugo, J.; Kervyn, M. Landslide characteristics and spatial distribution in the Rwenzori Mountains, Uganda. J. Afr. Earth Sci. 2017, 134, 917–930. [Google Scholar] [CrossRef] [Scilit]
- Shahabi, H.; Hashim, M. Landslide susceptibility mapping using GIS-based statistical models and Remote sensing data in tropical environment. Sci. Rep. 2015, 5, 9899. [Google Scholar] [CrossRef] [Scilit] [PubMed]

Disclaimer/Publisher’s Note: The statements, opinions and data contained in all publications are solely those of the individual author(s) and contributor(s) and not of MDPI and/or the editor(s). MDPI and/or the editor(s) disclaim responsibility for any injury to people or property resulting from any ideas, methods, instructions or products referred to in the content. |
© 2026 by the authors. Licensee MDPI, Basel, Switzerland. This article is an open access article distributed under the terms and conditions of the Creative Commons Attribution (CC BY) license.