


Abstract
Tomato is a major global crop, yet foliar diseases seriously affect yield and quality. Accurate and efficient disease identification techniques are of great significance for ensuring agricultural production safety. To address the limitations of existing methods in feature extraction capability, model complexity, and dependence on large-scale labeled data, as well as the difficulty of recognizing early-stage diseases whose visual symptoms are not yet fully developed, this paper proposes SAEFormer, a lightweight and robust disease recognition model. The model integrates a Multi-scale Selective Fusion Attention Block to enhance the ability to model multi-scale semantic information in lesion areas. In addition, by leveraging a self-supervised loss derived from dense relative localization as an auxiliary regularization term, the model’s generalization ability under limited training data is notably enhanced. To optimize normalization and improve inference efficiency, the RepBN normalization strategy is further adopted, significantly reducing computational cost while maintaining model performance. Experimental results on Dataset A show that SAEFormer achieves a Top-1 accuracy of 87.86% with 24.14 M parameters and 5.35 GFLOPs, demonstrating a favorable balance between recognition accuracy and model complexity. The training curves further indicate stable convergence during model optimization. Ablation experiments validate the complementary contributions of the proposed modules. Moreover, SAEFormer achieves competitive performance in cross-dataset evaluation on Dataset B, indicating its potential adaptability to different data distributions. Overall, SAEFormer provides an efficient approach to tomato leaf disease recognition and shows potential for deployment in precision agriculture applications.
1. Introduction
Tomato is one of the most widely cultivated vegetable crops worldwide and can grow under a wide range of climatic and soil conditions. Owing to its nutritional value, diverse edible forms, and high market value, tomato plays an important role in the global agricultural production system. However, tomatoes are often infected by a variety of pathogenic microorganisms, including bacteria, fungi, oomycetes, and viruses during growth, significantly affecting tomato yield and quality [1]. These diseases can affect several parts of the plant such as leaves, stalks, roots, and fruits, which in turn cause a variety of pathological symptoms. Common disease manifestations include leaf spotting, tissue wilting, color abnormalities, fruit rot, and plant stunting [2]. Specific symptoms vary depending on the type of pathogen and the site affected, and may include growth stagnation, leaf discoloration or wilting, and fruit deformities, which can have a significant impact on tomato yield and quality. Relevant studies have shown that different diseases occur under specific climatic conditions and at different stages of tomato growth and may cause up to 100% yield loss, posing a serious threat to global food security and the agricultural economy [3]. Therefore, early detection of plant diseases is crucial to minimize the economic losses caused by diseases, reduce production costs, and improve agricultural yields.
In the past, farmers primarily relied on the diagnostic advice of agricultural experts and selected appropriate pesticides based on their recommendations. However, this approach is time-consuming and heavily dependent on both the availability and diagnostic accuracy of professionals. With the rapid advancement of deep learning technologies, an increasing number of technical solutions have been applied to crop disease identification. These methods enable more efficient and accurate disease detection, thereby enhancing the timeliness and reliability of diagnosis while significantly reducing labor costs.
In 2020, Yang et al. proposed a model for the fine-grained visual classification of tomato diseases. The model employed self-supervised learning and multi-network collaboration to alleviate the shortage of labeled data and improve feature extraction and classification performance. However, its training process was relatively complex and computationally demanding, and its stability and interpretability under different environmental conditions require further validation [4]. Hu et al. proposed a deep learning-based method for tea disease detection and severity analysis, which effectively improved the average detection accuracy and severity grading accuracy compared with classical machine learning methods by using the Retinex algorithm for image enhancement, the improved Faster R-CNN model for detecting diseased leaves, and the VGG16 network for severity grading. The average detection accuracy and severity grading accuracy were improved by more than 6% and 9%, respectively, compared with the classical machine learning methods [5]. The CNN-SVM hybrid model proposed by Garg et al. combines the feature extraction capability of a convolutional neural network (CNN) and the classification advantage of a support vector machine (SVM), which can improve the accuracy of tomato disease classification. However, when dealing with large-scale datasets, the model has a high computational cost and shows a certain dependence on the diversity and quality of the dataset [6]. The TomConv model adopts a simplified convolutional neural network structure with four convolutional layers, a maximum pooling layer, and two dense layers, achieving an accuracy of 98.19% for tomato leaf disease classification on the PlantVillage dataset [7]. Zhao et al. proposed CAST-Net, a lightweight model that fuses convolutions and self-attention mechanisms for more efficient feature representation, based on the Next-ViT architecture. In addition, to further enhance model performance and compress the model size, the method also introduces a self-distillation strategy, which significantly improves the accuracy of plant leaf disease classification while reducing the number of parameters and FLOPs [8]. S. Ledbin Vini and P. Rathika proposed the TrioConvTomatoNet model, which uses a triple-convolution module to optimize feature extraction for tomato leaf disease classification and achieve high accuracy and low latency (a single-image detection time of 0.03 s) while maintaining a lightweight design (a 40% reduction in parameter count). The model is suitable for real-time agricultural monitoring scenarios and performs significantly better than traditional CNN models [9]. Shruthi and Nagaveni proposed the TomSevNet model, which achieves 96.91% accuracy in tomato disease identification with high-precision classification and disease severity grading through a hybrid convolutional neural network (CNN) architecture combined with multi-scale feature fusion and an attention mechanism [10].
The above studies demonstrate advances in tomato leaf disease detection methods. CNN-based methods have achieved significant progress in tomato disease recognition. However, researchers have gradually identified their limitations in global feature modeling and long-range dependency modeling. The traditional CNN mechanism of extracting features layer by layer through local receptive fields, although it can effectively recognize the texture and morphological features of localized leaf spots, has limitations in handling irregular disease distributions or integrating multi-scale global information. This challenge has prompted a shift toward Vision Transformer technology, whose self-attention mechanism can overcome local receptive-field limitations and achieve cross-regional global contextual information modeling through dynamic weight allocation. In particular, in complex scenarios with blurred leaf edges, scattered spots, or coexistence of multiple diseases, ViT can better disentangle disease features. For example, by distinguishing micropathological features between early and late blight, the Transformer architecture significantly improves fine-grained classification accuracy by establishing long-range correlations across pixels.
The Vision Transformer (ViT)-based plant disease classification model proposed by Borhani et al. demonstrated excellent accuracy and low computational cost on multiple datasets, especially on small datasets, but its slow prediction speed, especially on high-resolution inputs and GPU-accelerated devices, limits its real-time applications [11]. Wang et al. proposed a spectral Transformer Network (STNet)-based approach for tomato bacterial wilt severity identification. The method combines hyperspectral imaging with a Transformer module to capture global correlations in spectral data. When trained using a transfer-learning strategy, it achieved better recognition results than the convolutional neural network, with an average F1 value of 0.9309, an overall accuracy of 91.93%, and a Kappa coefficient of 0.8903, thereby improving the accuracy and quantitative assessment of disease monitoring [12]. Tiwari et al. used a multi-head self-attention mechanism combined with an L1-norm attention approach to capture key image features. Data augmentation techniques improved the model’s robustness and performance, resulting in a tomato disease detection accuracy of 99.74% and excellent classification performance [13]. FET-FGVC introduces a novel hierarchical attention mechanism based on the standard Swin Transformer to reduce misleading attention. It captures complementary fine-grained features through a Multi-Head Self-Attention Block and achieves weakly supervised part localization without part annotations. The model achieves these results on the CUB-200-2011, NABirds and Oxford 102 Flowers datasets with Top-1 accuracies of about 93.0%, 92.7%, and 99.4%, respectively, but it still uses a large number of ViT parameters and has a relatively weak ability to model high-frequency localized details, which elevates the computational cost and limits the ability to recognize subtle textures [14]. The Tswin-F network model proposed by Ye et al. effectively improves the accuracy of tomato leaf spot recognition by combining the Transformer architecture, the bilateral attention mechanism, the self-supervised learning block, and the FFLCA structure, achieving 99.64% accuracy on 10 classes of datasets, and an average accuracy of 90.64% on 13 classes of tomato leaf spot recognition. The average accuracy in 13 types of tomato leaf spot recognition is 90.81%, but its model structure is complex, the number of parameters is large, the computational complexity is high, the memory occupation is large and the processing speed is slow [15]. The Transformer-based transfer learning method performs well in the early detection of tomato leaf diseases, achieving 99.17% accuracy on the PlantVillage dataset and excellent recognition results on various subsets of the TomatoEbola dataset, which effectively improves the robustness of the model to environmental changes, but it suffers from high computational complexity and high hardware requirements [16].
Therefore, our proposed SAEFormer makes the following contributions to address the above problems:
- (1)
- To enhance the model’s ability to model disease features at different scales, we designed a Multi-scale Selective Fusion Attention Block (MSFAB). This block enables the model to adaptively acquire the most discriminative feature information from different receptive fields by introducing a multi-scale feature extraction and selection mechanism in the spatial and channel dimensions, respectively. Specifically, MSFAB combines the representation advantages of local details and global context, which significantly enhances the feature perception and classification ability of the model in recognizing tomato disease images with large morphological differences and a complex distribution.
- (2)
- By jointly optimizing self-supervised loss and cross-entropy loss, the model’s capacity to capture fine-grained differences is substantially enhanced, leading to improved feature representation and generalization performance in tomato disease recognition. This joint strategy enables synergistic reinforcement between feature extraction and classification, which not only strengthens the model’s robustness under sample imbalance and complex backgrounds, but also effectively alleviates overfitting and improves its ability to distinguish visually similar disease classes. These results underscore the model’s strong potential for broad and practical deployment in diverse agricultural scenarios.
- (3)
- RepBN is simplified into a standard Batch Normalization structure through parameter fusion, balancing both performance and efficiency. This approach effectively mitigates the normalization-related performance bottlenecks typically observed in lightweight models, without introducing additional parameter overhead. As a result, it significantly enhances the model’s generalization ability and robustness in multi-class tomato disease recognition tasks.
2. Materials and Methods
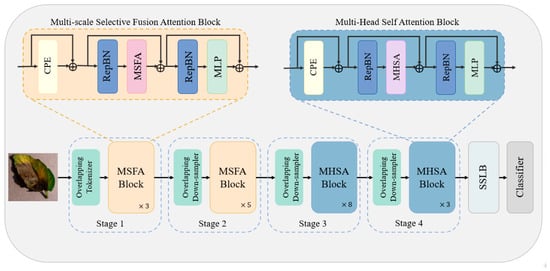
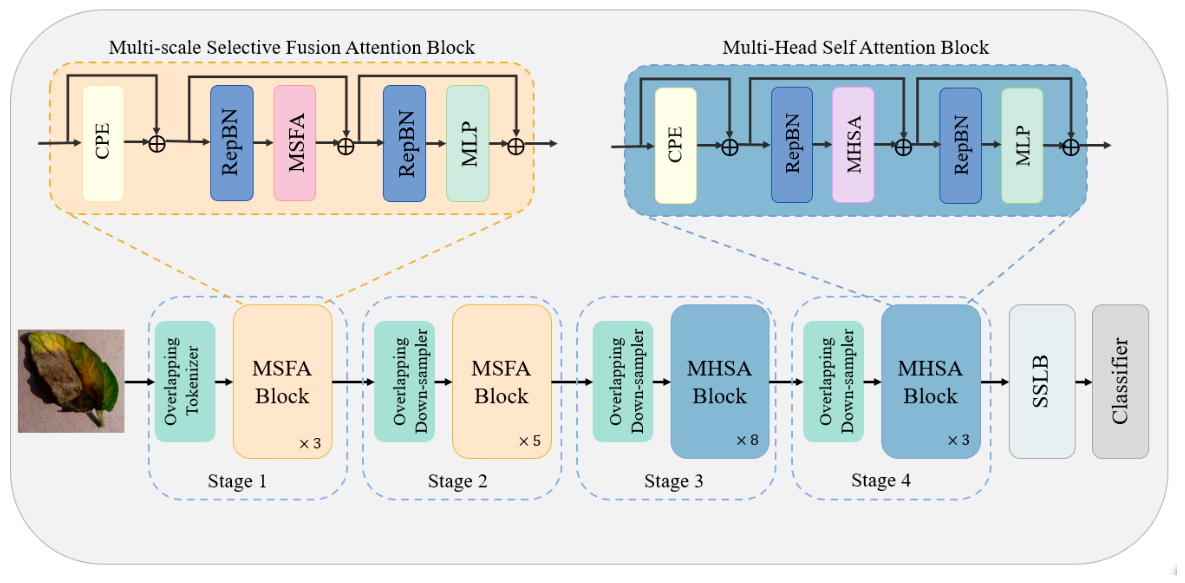
Our proposed SAEFormer method aims to classify tomato diseases at different severity levels, and Figure 1 illustrates the architecture of SAEFormer.
Figure 1.
The overall architecture of our proposed SAEFormer.
2.1. SAEFormer
Our model consists of four main stages (Stage 1 to Stage 4), combining the strengths of four components, namely, the Multi-scale Selective Fusion Attention Block (MSFAB), the Multi-Head Self-Attention Block (MHSAB) with a strong capability of long-range modeling, the Self-Supervised Learning Block (SSLB), and the classifier, to form a multi-stage network structure that effectively combines local feature perception with global semantic modeling, enabling accurate and robust tomato disease recognition.
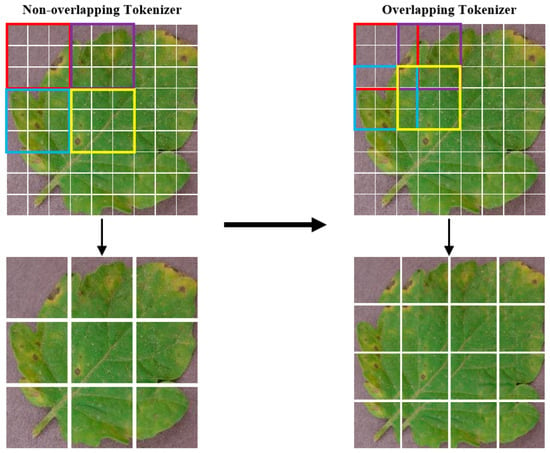
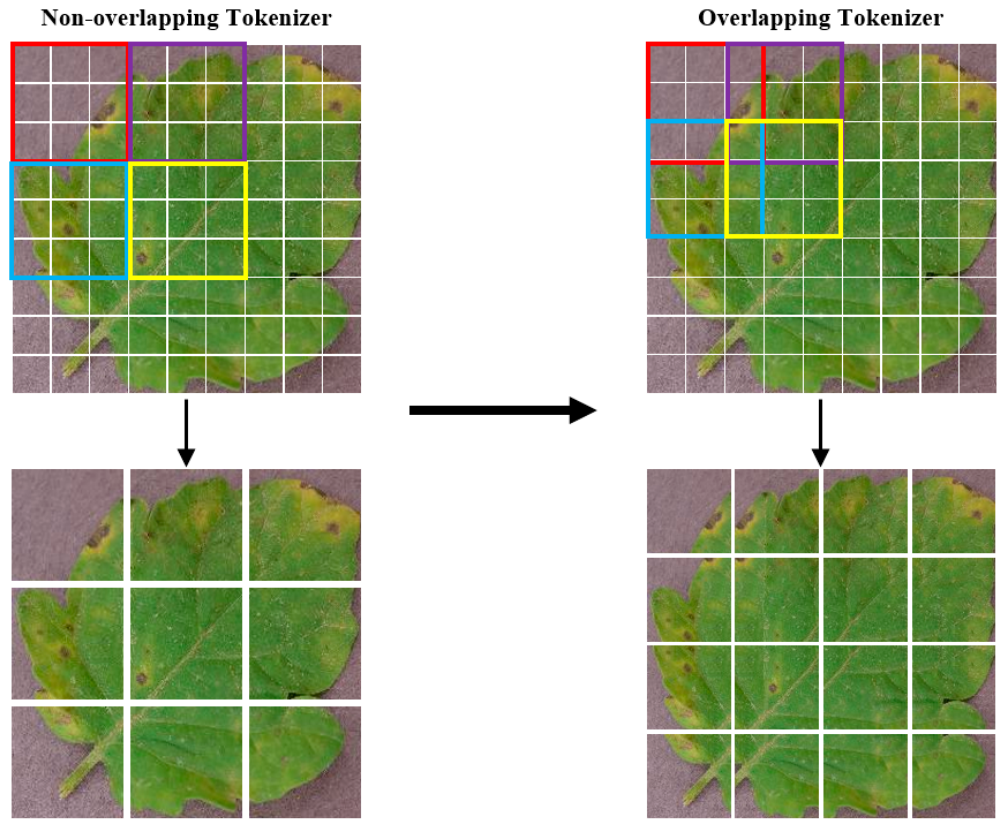
As illustrated in Figure 2, the input image is first processed by an Overlapping Tokenizer, which converts it into feature-embedded tokens compatible with the model architecture. This tokenizer employs a sliding-window convolution strategy to partition the image into patches with overlapping regions between adjacent tokens. This design preserves local continuity and enhances the model’s ability to capture spatially coherent information, which is essential for accurate disease localization in complex agricultural imagery.
Figure 2.
Contrasting Tokenization Approaches: Non-Overlapping vs. Overlapping Methods.
Overlapping Downsampler is used in the process of Stage 1 to Stage 2, Stage 2 to Stage 3, and Stage 3 to Stage 4, which utilizes a convolution operation with a step size smaller than the size of the convolution kernel to achieve downsampling of features with overlapping regions so as to reduce the spatial dimensionality while retaining more contextual information. Each time an overlapping downsampling layer is traversed, the feature map undergoes a reduction to 50% of its initial resolution, while the number of feature dimensions increases, doubling that of the preceding output layer. Feature continuity and progressive scale compression are achieved by the Overlapping Tokenizer and Overlapping Downsampler between stages. The first two stages contain Multi-scale Selective Fusion Attention Blocks with different numbers of layers to efficiently extract multi-scale localized spot features, while the latter two stages contain Multi-Head Self-Attention Blocks with different numbers of layers to enhance their ability to model global dependencies between disease regions and identify sparsely distributed but semantically relevant distant spots. A lightweight Self-Supervised Learning Block is connected to the backbone output to mine the underlying feature structure through a self-supervised loss mechanism, enhancing feature-discrimination and generalization capabilities. Finally, the features are fed into the classifier module to output the final disease category predictions. We will describe each part in more detail next.
2.2. Multi-Scale Selective Fusion Attention Block
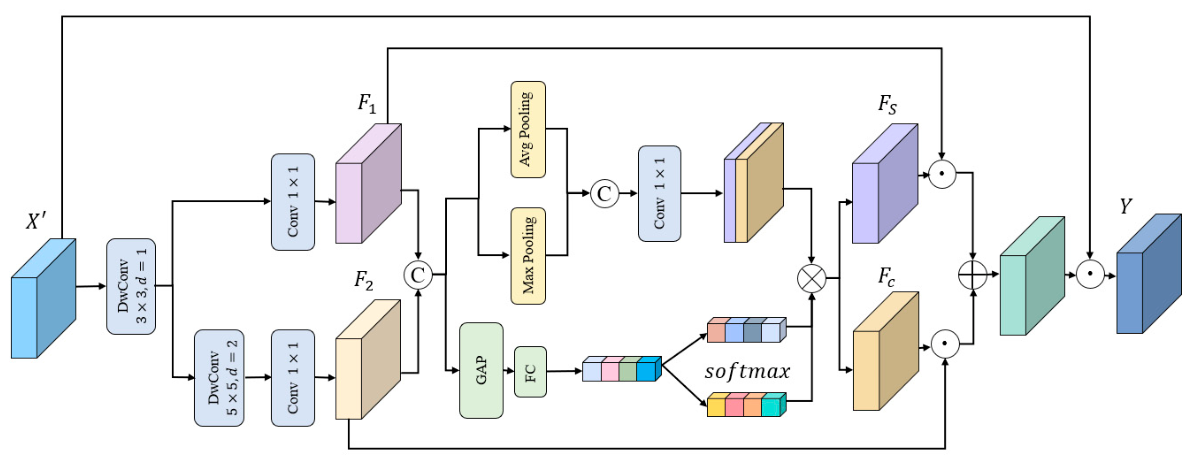
In the tomato disease recognition task, disease features at different scales often have obvious differences and contain rich texture and semantic information at the same time. Traditional convolutional modules often have difficultly focusing on local edges and global semantics at the same time due to the fixed receptive-field limitations. To capture fine-grained tomato disease features, we constructed a Multi-scale Selective Fusion Attention Block to efficiently extract multi-scale contextual information from the input image and enhance the response of key regions through channel-selective fusion and spatial attention mechanisms. The input feature is . First, is obtained by a Conditional Positional Encoding (CPE) that introduces positional information conditional on the local neighborhood of the input token.
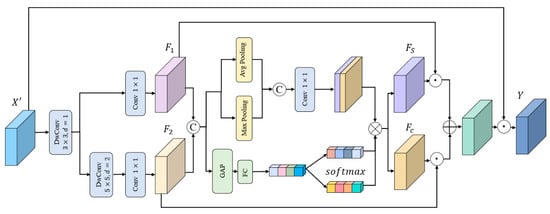
As shown in Figure 3, is then fed into the MSFAB, which is constructed based on multi-scale convolution and an attention mechanism, to capture fine-grained disease features and local textures. In the first branch, a depthwise separable convolution with a kernel size of 3 is applied, followed by a convolution with a kernel size of 1 to compress the number of channels and generate feature . In the second branch, a depthwise separable convolution with a kernel size of 5 is first used to capture contextual information over a larger region, followed by a convolution with a kernel size of 1 to compress the number of channels and generate feature . The two features, and , are concatenated along the channel dimension to form the joint feature , which retains the information from both scales and provides complete semantic feature information for the subsequent attention mechanism.
Figure 3.
The proposed Multi-scale Selective Fusion Attention Block.
Next, we apply maximum pooling and adaptive average pooling on the fusion feature along the channel dimension to obtain spatial maps, which are then convolved with a kernel size of 1 and passed through a sigmoid activation function to generate the spatial attention map M.
The spatial attention map and the fused features are weighted and combined to obtain the spatial feature
Channel-wise weighting is first applied to and to obtain and , respectively. Then, global average pooling (GAP) is performed, and the result is passed through a fully connected layer to generate a selective channel attention vector. This vector is then split into two separate weight vectors, and , which are used to perform channel-wise multiplication with and , respectively.
The spatial attention output is then summed with the channel attention output to obtain two branches, which are added with the initial input to form the residual output .
Through the channel attention mechanism, key feature channels related to the disease are highlighted, enabling the model to focus more on the representative features of lesion regions while filtering out irrelevant background and other interfering information, thereby improving classification accuracy. In addition, image-level semantic information is integrated through global semantic guidance to enhance the model’s ability to capture the overall characteristics of the disease and further improve classification performance. Its lightweight structure also facilitates efficient deployment and application in practical tomato disease detection scenarios.
2.3. Multi-Head Self-Attention Block
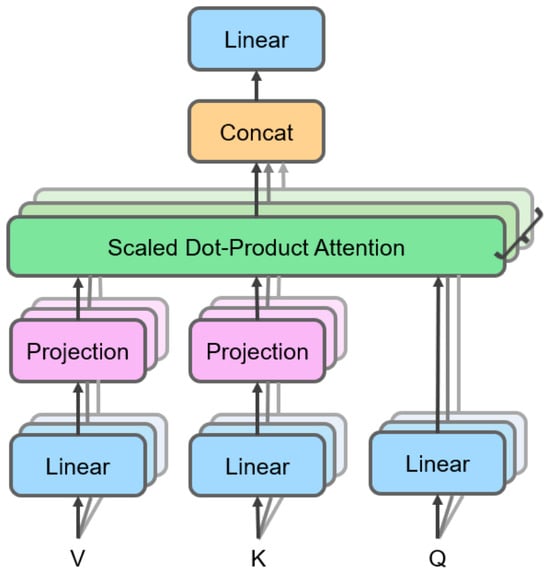
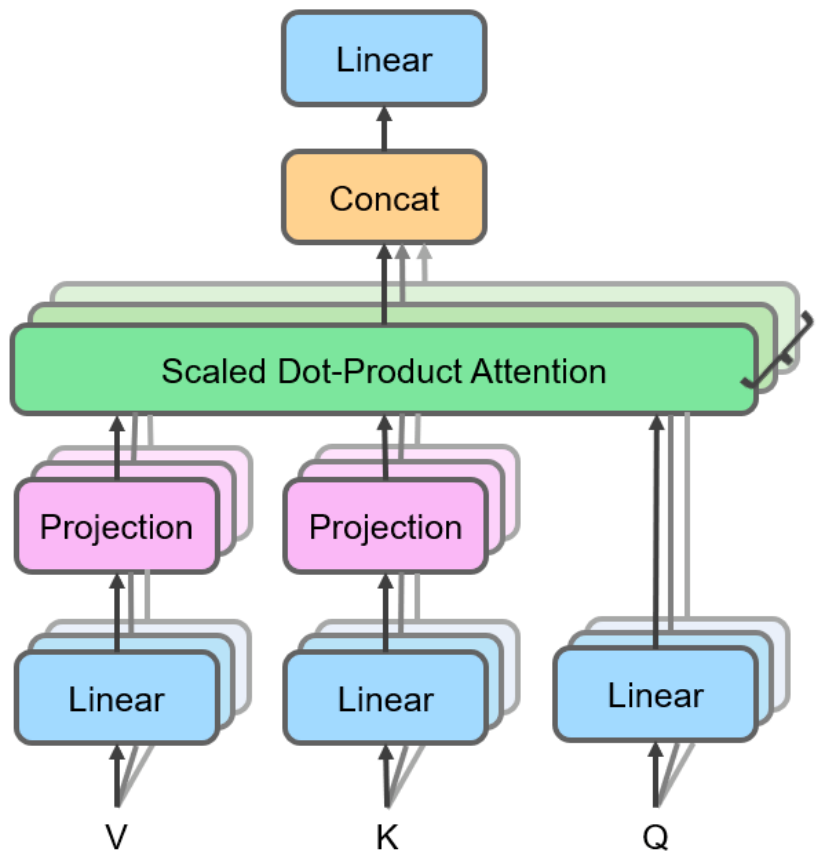
We introduce the Multi-Head Self-Attention Block (MHSAB) in the latter two stages, as shown in Figure 4. First, the input features are passed through a linear transformation layer to generate the query matrix (Q), key matrix (K), and value matrix (V), respectively; each set of Q, K, and V matrices is fed into the scaled dot-product attention mechanism, which obtains local feature representations by calculating query–key similarity scores and weighting the aggregated value vectors. The outputs of the multiple attention heads are then integrated through concatenation; finally, the concatenated features are fused into the final attention feature output through a linear transformation layer. This structural design enables the model to simultaneously capture feature interaction patterns in different subspaces and effectively model long-range dependencies.
Figure 4.
Multi-Head Self-Attention.
We first calculate single-head attention. Formula (9) computes the scaled dot-product attention by first calculating the dot product between the queries Q and keys K, scaling by to stabilize gradients, applying the Softmax function to obtain attention weights, and finally performing a weighted sum of the values V to produce the aggregated output representation.
The above single-head attention is then extended to multiple heads and concatenated to obtain multi-head attention.
where each is an independently computed attention head.
In tomato disease images, spot morphology, color, and texture vary widely across regions. The MHSAB significantly improves the model’s performance by spatially connecting distant pixels to capture long-range dependencies. The proposed model introduces the Multi-Head Self-Attention Block in the deeper stages, enabling long-range modeling and multi-scale semantic feature extraction through multi-head attention. MHSAB can capture potential connections between distant regions in leaf disease images, thereby improving classification performance and generalization in complex disease scenarios.
2.4. Self-Supervised Learning Block
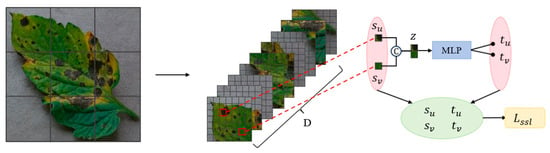
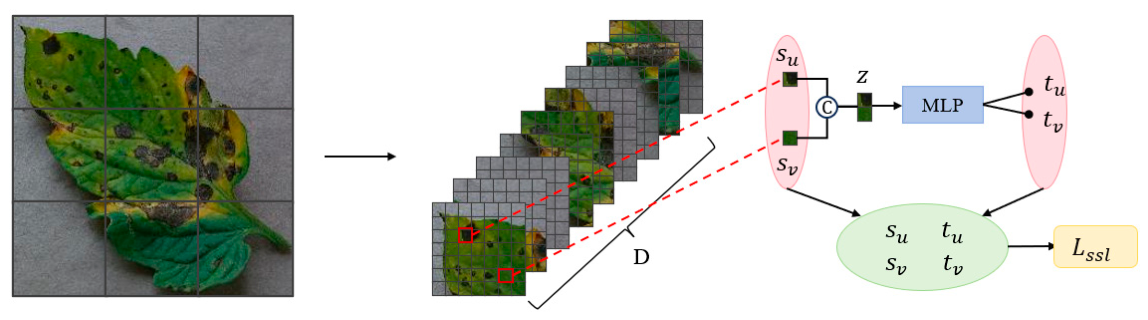
Crop disease image datasets often face challenges such as limited labeled samples, time-consuming and labor-intensive manual annotation, rich and subtle disease features that may lead to model overfitting, and variations in lesion regions caused by local and global pattern shifts. Therefore, introducing a self-supervised learning mechanism can enable the network to learn discriminative structures in the feature space without using category labels for the auxiliary task, thereby improving the robustness of feature representations and guiding the model to automatically extract key features. Importantly, no additional unlabeled data are required; instead, the same labeled training images used for supervised classification are also used to construct the auxiliary self-supervised task, while their category labels are excluded from the self-supervised loss computation. To address these challenges, as shown in Figure 5, we introduce a lightweight Self-Supervised Learning Block (SSLB) as an auxiliary task in SAEFormer.
Figure 5.
Processing for self-supervised learning.
After processing the token sequence through the MSFAB and MHSAB, an embedding map for the network structure is generated. The final token embeddings form the network representation .
It should be noted that no additional unlabeled data were used in this study. The auxiliary self-supervised task was constructed using the same labeled training images as those used for the supervised classification task. During relative-position prediction, the category labels of these images were ignored, and only the spatial relationships between tokens were used to generate the auxiliary supervision signals. For each image, 32 token pairs were randomly sampled from different spatial positions, and the token positions were randomly resampled during training. Next, we randomly sample m pairs of positional indices and from . Based on these indices, we compute the normalized ground-truth positional offsets and , where :
Subsequently, the embeddings and of the two tokens are concatenated into a 2D vector z, which is passed through an MLP network to predict the tokens’ positional offsets and .
We use to compare the predicted positional offset with the ground-truth positional offset, which is computed as .
The sample size is chosen to balance computational efficiency with effective supervision: it represents a 2.7 sampling rate of all possible pairs from the token feature map, and since pairs are randomly resampled at each training iteration, each image effectively contributes diverse spatial relationships throughout the training process.
We use the cross-entropy loss for the tomato disease classification task, as defined in Equation (15). It measures the difference between the model’s predicted category distribution and the true label distribution. The cross-entropy loss is particularly suitable for multiclass classification problems because of its smooth gradient and high numerical stability. In this study, the loss function is used to optimize the model’s trunk output, thereby enhancing discriminative ability. Here, is the true label and is the model’s predicted probability.
The final optimization objective is defined as the weighted sum of the supervised classification loss and the self-supervised loss. Specifically, is introduced to adaptively regulate the contribution of the self-supervised loss. It is implemented as a learnable scalar parameter, initialized to 0, and jointly optimized with the other model parameters during training. The total loss is formulated as follows:
The classification branch and the auxiliary self-supervised branch were jointly trained in an end-to-end manner. The auxiliary self-supervised branch and its associated loss were used only during training and were excluded during inference. Therefore, the final disease category was determined solely by the classification branch.
The integration of cross-entropy loss and self-supervised loss substantially enhances model performance in tomato disease recognition through synergistic optimization. Specifically, cross-entropy loss directly refines classification boundaries, ensuring that extracted features are accurately aligned with their corresponding disease categories. In parallel, the self-supervised loss leverages the same labeled training images, while ignoring their category annotations for the relative-position prediction task, to strengthen the discriminative capacity of features without requiring additional unlabeled data.
This joint optimization framework not only improves the model’s robustness under challenging conditions—such as variations in illumination and leaf occlusion—but also introduces a regularization effect that effectively suppresses overfitting. As a result, the model exhibits stronger generalization capabilities in cross-domain scenarios and demonstrates resilience to data scarcity, high inter-class similarity, and environmental complexity commonly encountered in agricultural applications.
2.5. Re-Parameterized Batch Normalization
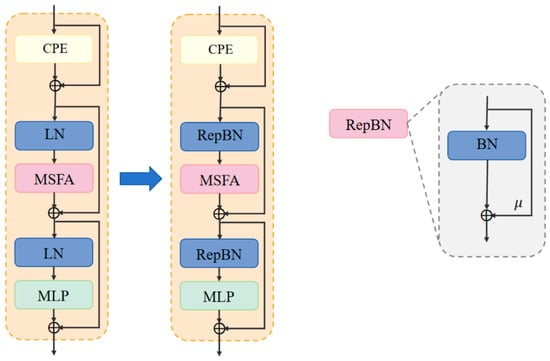
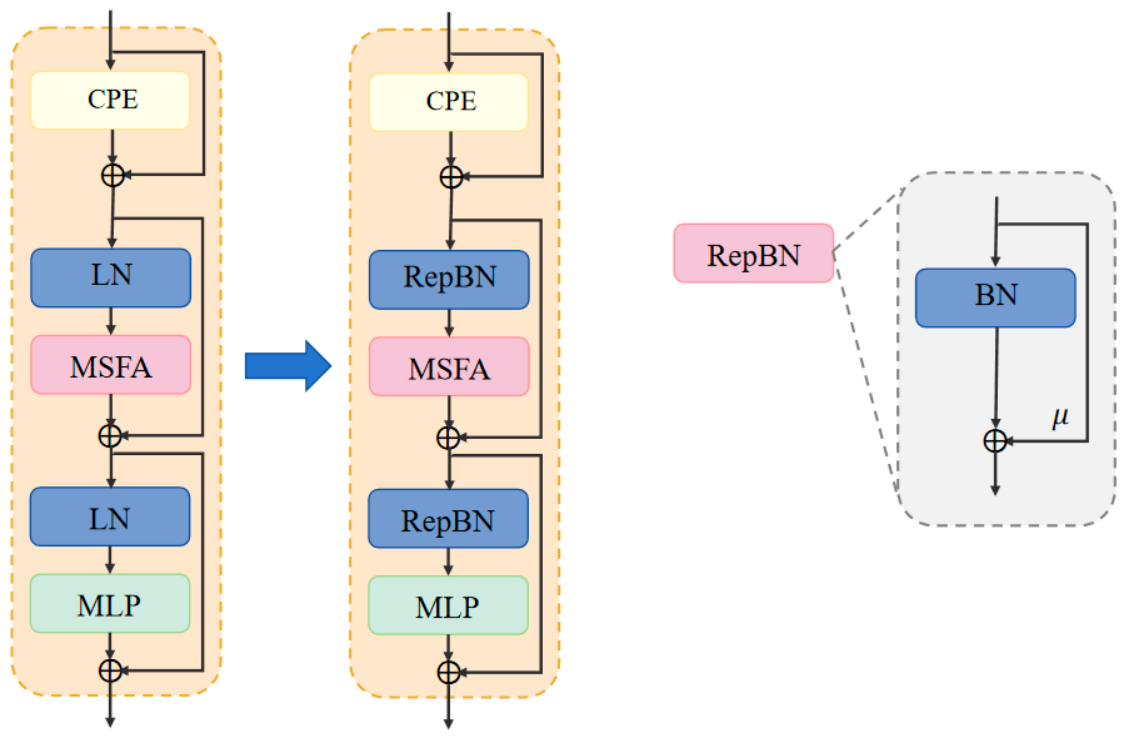
To enhance the training stability and inference efficiency of the model, we adopt a Re-parameterized Batch Normalization (RepBN) strategy. This approach introduces a learnable parameter that enables the model to dynamically balance the influence of Batch Normalization (BN) and residual connections during training. As illustrated in Figure 6, Layer Normalization (LN) is replaced by RepBN during the training phase, allowing for improved gradient flow and model convergence. In the inference phase, the model switches to using standard BN exclusively, thereby eliminating the computational overhead associated with statistical calculations and enabling more efficient deployment. This re-parameterization not only preserves performance but also reduces complexity, making the model more suitable for real-world agricultural applications with resource constraints.
Figure 6.
Efficient Transformer structure optimization for replacement of LN with RepBN.
The formula for RepBN is defined as follows, where is the input feature, is the standard batch normalization operation, and is the learnable parameter.
After training, RepBN can be re-parameterized into a standard BN form. RepBN enhances the expressive power of the model by adjusting the scaling parameter and the translation parameter of BN to incorporate the additional linear term into the normalization process.
In traditional lightweight Transformer architectures, although normalization layers such as Layer Normalization improve training stability, they tend to suppress useful features when dealing with highly localized lesion textures [17]. By introducing learnable linear re-parameters (, ) into BN, RepBN allows the model to retain the degrees of freedom for the linear transformation of the input features after normalization, enabling it to better model key visual cues such as lesion edges and color variations during training, thereby effectively improving the discriminability among disease categories. RepBN is designed to maintain a high degree of expressive power during the training phase and to be re-parameterized into an equivalent standard BN form during the inference phase, thus achieving low computational cost and high efficiency during inference while ensuring the model’s practicality and deployment flexibility. Meanwhile, the re-parameterization mechanism in RepBN enables adaptive adjustment of input features, which significantly improves the robustness and generalization ability of the model under complex input distributions and enables the model to maintain stable performance across different disease severity levels.
3. Experiments
3.1. Experimental Environment
All experiments were conducted on a workstation equipped with a 12th Gen Intel(R) Core(TM) i5-12600KF CPU (Intel Corporation, Santa Clara, CA, USA), 32 GB of RAM, and an NVIDIA GeForce RTX 4070 SUPER GPU (NVIDIA Corporation, Santa Clara, CA, USA) with 12 GB of memory. The software environment consisted of Windows 11, CUDA 12.1, Python 3.8.19, and PyTorch 2.3.1. SAEFormer was trained for 300 epochs with a batch size of 64 using the AdamW optimizer. The learning rate was adjusted using a cosine annealing schedule with a warm-up stage. The overall objective combined the cross-entropy classification loss with an auxiliary self-supervised loss. Detailed training and implementation settings are summarized in Table 1. (the manufacturer, city, and country information for both the GPU and CPU as follows: NVIDIA GeForce RTX 4070 SUPER GPU (NVIDIA Corporation, Santa Clara, CA, USA) and 12th Gen Intel® Core™ i5-12600KF CPU (Intel Corporation, Santa Clara, CA, USA)).
Table 1.
Experimental training parameter settings.
3.2. Datasets and Data Preprocessing
Dataset A used in the experiment was obtained from Kaggle [18], which covers a wide range of diseases caused by fungi, viruses, and pests, including six different tomato leaf disease types caused by early blight fungus, late blight water mold, leaf mold fungus, septoria leaf spot fungus, spider mite damage, and yellow leaf curl virus, along with images of healthy tomato leaves. Each disease type was classified into two subcategories: general and serious. In total, the dataset contains 13 categories and 9863 tomato disease images. Details of this tomato disease dataset are shown in Table 2. The class distribution is imbalanced: the largest class, YLCV virus (serious), contains 2473 images—nearly 10 times as many as the smallest class, early blight fungus (general), which contains 251 images.
Table 2.
Dataset of 13 classes of tomato diseases (Dataset A).
Dataset B, summarized in Table 3, is from “Tomato-Village” [19], a standardized dataset containing real farmland scenarios constructed for common tomato diseases (e.g., leaf miner disease, spotted wilt virus, and nutrient deficiencies) in the Jodhpur and Jaipur districts of Rajasthan, India. It includes seven tomato disease types and healthy leaves, totaling 4525 images. Dataset B contains five disease types not present in Dataset A. The class distribution is also imbalanced.
Table 3.
Dataset of 8 classes of tomato diseases (Dataset B).
Both datasets were divided into training and validation subsets at a ratio of 8:2 using stratified random sampling to preserve the original class distribution in each subset. A fixed random seed of 0 was used to ensure the reproducibility of the dataset partitioning. The specific numbers of images in the training and validation subsets of each dataset are presented in Table 2 and Table 3. No independent test subset was constructed in this study. Dataset A was used for model training and internal validation, whereas Dataset B was not used for model training or fine-tuning; only its validation subset was used for cross-dataset evaluation. All data augmentation operations were performed after dataset partitioning and were applied exclusively to the training subset of Dataset A, thereby preventing information leakage between the training and validation subsets.
During training, each image was randomly resized and cropped to 224 × 224 pixels using bicubic interpolation, followed by random horizontal flipping, color jittering with a factor of 0.4, RandAugment with the configuration “rand-m9-mstd0.5-inc1,” and random erasing with a probability of 0.25 in pixel mode. The images were subsequently normalized using the ImageNet mean of [0.485, 0.456, 0.406] and standard deviation of [0.229, 0.224, 0.225]. At the batch level, Mixup with and CutMix with were applied with a switching probability of 0.5 and an overall activation probability of 1.0. A repeated augmentation strategy was also adopted, in which each sample was repeated three times and independently augmented in each repetition. During validation, images were resized to 256 × 256 using bicubic interpolation, center-cropped to 224 × 224, and normalized using the same ImageNet statistics; no stochastic augmentation was applied.
3.3. Results and Discussion
3.3.1. Analysis of Experimental Results
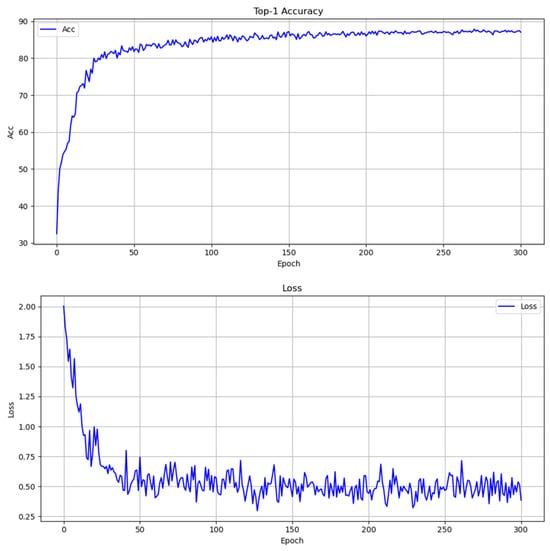
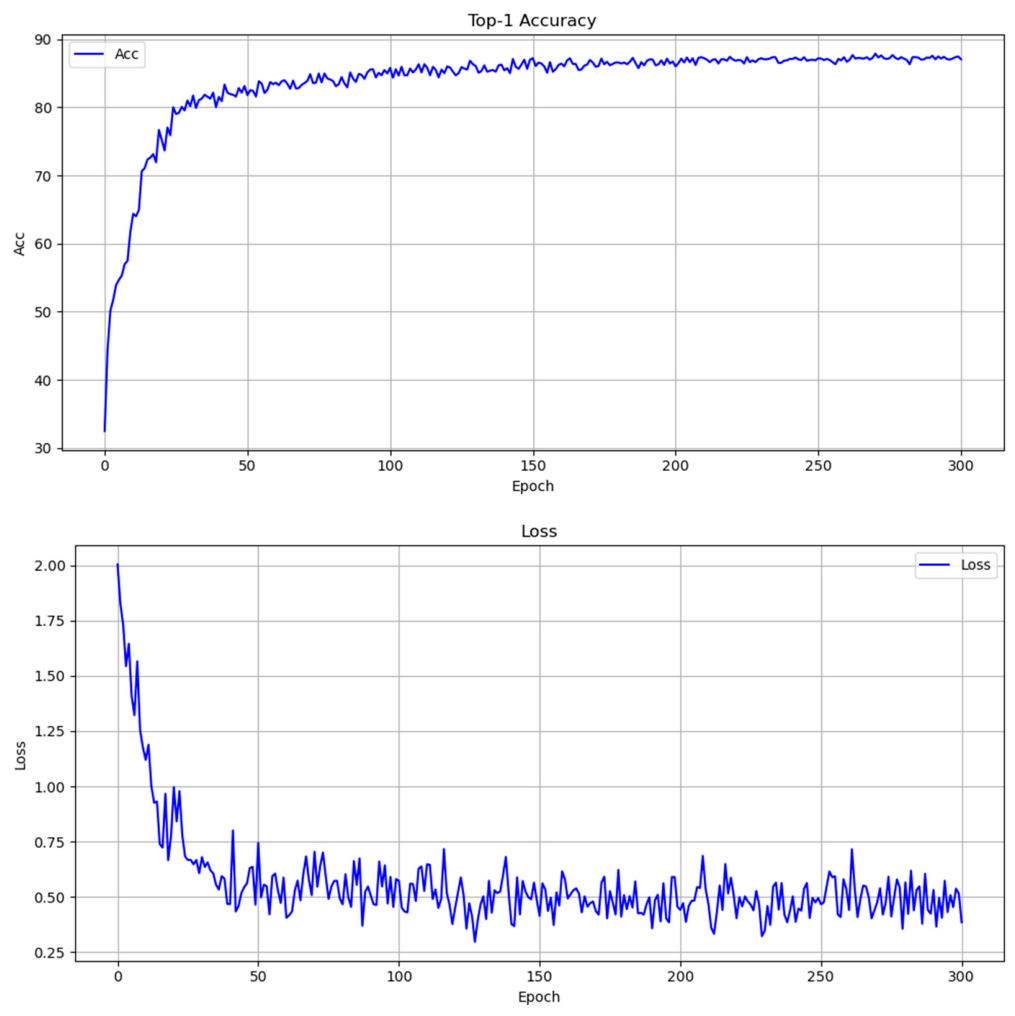
The model used to obtain all results presented in this subsection was trained exclusively on Dataset A; Dataset B was not used for training, and the two datasets were not combined. To clearly understand the learning dynamics of the model and the performance convergence process, we plotted the Top-1 accuracy curve over the training epochs, as shown in Figure 7. The model shows a significant upward trend in the early stage of training (within the first 20 epochs), increasing from approximately 32% initially to more than 70%, indicating that the model is able to learn discriminative features from the data at an early stage. As the training progresses, the accuracy curve gradually flattens out around epoch 50. The accuracy fluctuates slightly in the late stage of training, which may be related to the optimization strategy (e.g., learning rate adjustment or regularization mechanisms), but remains at a high level, indicating that the model has good convergence and stability. The results validate the effectiveness of the proposed model structure in the tomato disease classification task, demonstrating good learning ability and generalization performance. The Top-1 accuracy finally stabilizes at around 87%, which further confirms the soundness of the model architecture and training strategy.
Figure 7.
Validation Top-1 accuracy (top) and loss (bottom) curves over 300 training epochs for SAEFormer.
As shown by the training loss curve in Figure 7, the model shows good convergence and stability throughout the training process. In the initial stage (0–30 epochs), the loss value decreases rapidly from approximately 2.0 to below 0.6, indicating that the model quickly learns the basic feature structures from the data in a relatively short period of time and reaches initial convergence. In the subsequent stage (approximately 30–300 epochs), the loss value gradually stabilizes and remains within the range of 0.45 to 0.65. Despite some fluctuations, the overall loss remains low. Combined with the stable validation performance, this suggests that no obvious overfitting behavior is observed during training.
In summary, our model has good learning ability and training stability and can achieve rapid and effective convergence in fewer iterations, providing a solid basis for high classification accuracy.
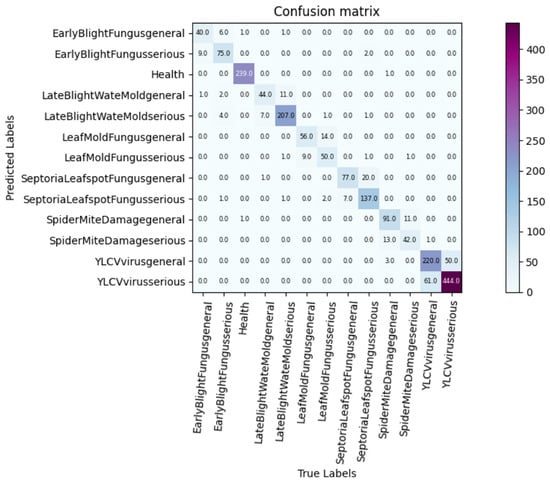
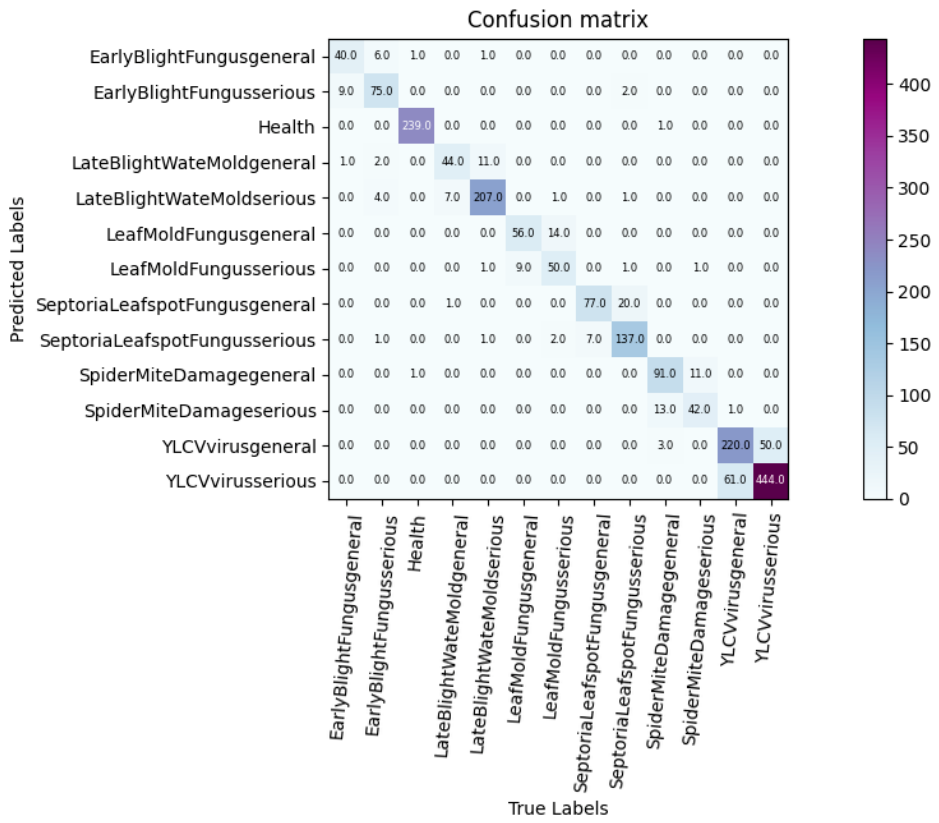
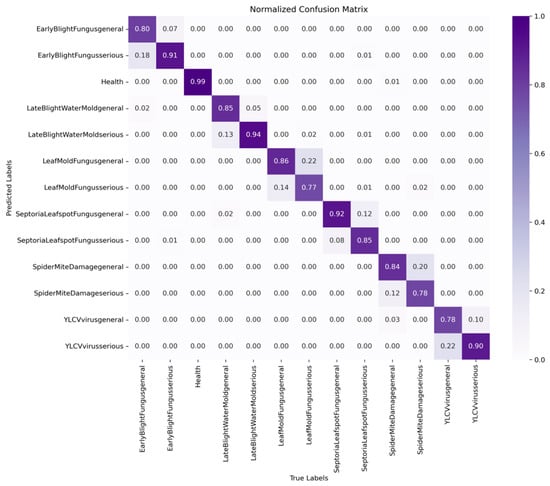
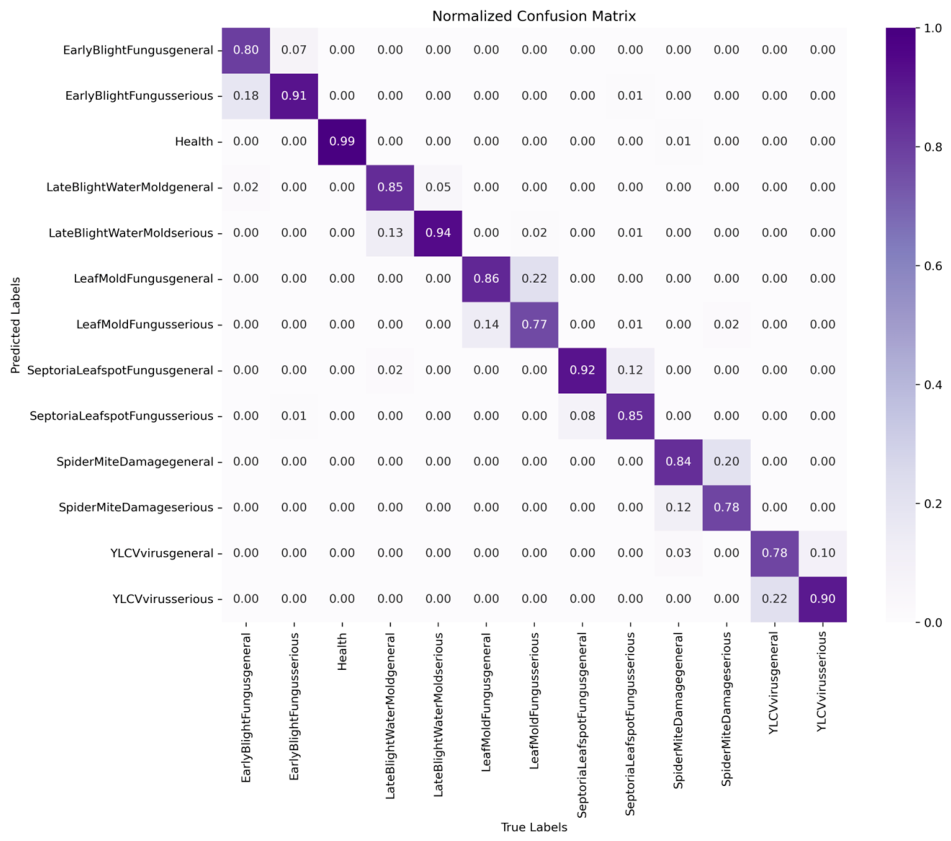
To further evaluate the model’s recognition performance across different categories, we plotted the confusion matrix and normalized confusion matrix, shown in Figure 8 and Figure 9, respectively. Figure 8 presents the classification results in terms of sample counts, whereas Figure 9 presents the normalized classification results for each category, providing a clearer view of the model’s class-wise recognition performance in the fine-grained tomato disease classification task. Overall, the model demonstrates a strong ability to discriminate among different tomato diseases, with most samples concentrated along the diagonal, indicating that the model can accurately predict a wide range of disease types. Although the overall results are good, some confusion remains between certain categories, mainly among different severity levels within the same disease category, indicating that further fine-grained discrimination is still required.
Figure 8.
Confusion matrix for the 13 classes of the tomato disease dataset.
Figure 9.
Normalized confusion matrix for the 13 classes of the tomato disease dataset.
3.3.2. Ablation Experiments
To evaluate the incremental contribution of each proposed component, we conducted a stepwise ablation study on Dataset A. Starting from the DilateFormer baseline, SSLB, MSFAB, and RepBN were added sequentially. As summarized in Table 4, Top-1 accuracy is reported as the mean ± standard deviation over three runs with different random seeds, together with the parameter count and mean training time per epoch.
Table 4.
Ablation experiment performance comparison. Top-1 accuracy (%) is reported as the mean ± standard deviation over three runs with different random seeds, while training time/epoch is reported as the mean training time per epoch over these three runs.
The DilateFormer [20] baseline achieved a mean Top-1 accuracy of 86.12 ± 0.36%, contained 23.49 M parameters, and required an average of 1 min 14 s per training epoch. Adding SSLB increased the mean accuracy to 87.50 ± 0.31%, corresponding to an absolute gain of 1.38 percentage points over the baseline. This improvement was accompanied by an increase of 0.85 M parameters and an increase in the mean per-epoch training time from 1 min 14 s to 1 min 33 s.
Adding MSFAB to the Base-SSLB configuration yielded a mean Top-1 accuracy of 87.46 ± 0.11%, representing a slight decrease of 0.04 percentage points relative to the preceding configuration but a cumulative gain of 1.34 percentage points over the Base model. Meanwhile, the parameter count decreased from 24.34 M to 24.14 M, and the mean per-epoch training time decreased from 1 min 33 s to 1 min 10 s. Thus, MSFAB maintained comparable mean accuracy while improving parameter and training-time efficiency.
Finally, adding RepBN increased the mean Top-1 accuracy from 87.46 ± 0.11% to 87.86 ± 0.11%, corresponding to an incremental gain of 0.40 percentage points, while leaving the parameter count unchanged at 24.14 M. The mean per-epoch training time was further reduced from 1 min 10 s to 1 min 2 s. Relative to the Base model, the complete SAEFormer achieved an absolute accuracy gain of 1.74 percentage points and reduced the per-epoch training time by 12 s, corresponding to a reduction of approximately 16.2%.
Overall, the stepwise ablation results indicate that the three modules make distinct contributions. SSLB provides the largest accuracy gain; MSFAB reduces the parameter count and per-epoch training time while maintaining comparable mean accuracy; and RepBN further improves accuracy and training-time efficiency. The complete model achieves the highest mean Top-1 accuracy of 87.86 ± 0.11%, demonstrating a favorable balance among classification accuracy, parameter count, and per-epoch training time within the evaluated configurations.
To verify the effect of introducing the MSFAB at different stages on the performance of SAEFormer, we conducted ablation experiments, and the results are shown in Table 5. When the global self-attention block is used in all four stages, the model’s Top-1 accuracy was 87.14%. After replacing Stage 1 with MSFAB, the accuracy improved to 87.71%. After introducing MSFAB in Stage 2, the accuracy further improved to 87.86%, while the parameter count was reduced to 24.14 M and total training time was shortened to 6 h 41 min 15 s, thereby achieving the best performance. However, when MSFAB was additionally used in Stages 3 and 4, the accuracy decreased to 86.93% and 86.61%, respectively. These results show that introducing MSFAB in the early stages of the model (Stages 1 and 2) can effectively improve the feature extraction capability and recognition performance, while overuse may lead to performance degradation. Therefore, SAEFormer ultimately uses multi-scale fusion attention blocks in the first two stages to achieve a better balance of accuracy and efficiency.
Table 5.
Impact of different stages of MSFAB on SAEFormer performance (“M” denotes MSFAB and “G” denotes MHSAB). Training time in this table refers to the total training time, whereas Table 4 reports the average training time per epoch.
3.3.3. Comparative Experiments
To evaluate the effectiveness and efficiency of the proposed SAEFormer for tomato disease recognition, we compared it with several representative CNN- and Transformer-based models. As summarized in Table 6, SAEFormer achieves competitive classification accuracy while maintaining a moderate parameter count and computational cost, demonstrating a favorable balance between recognition accuracy and model complexity.
Table 6.
Performance comparison of different methods on Dataset A recognition tasks.
To ensure a fair comparison, all models reported in Table 6 were trained and evaluated using the same experimental protocol and training configurations described in Section 3.1 and Section 3.2, including the dataset split, input resolution, data augmentation strategy, number of training epochs, optimizer, learning-rate schedule, and pretraining scheme.
In comparison with CNN-based models, SAEFormer exhibits a clear performance advantage. It outperforms representative lightweight networks such as ShuffleNetV1 (87.09%) and MobileNetV3 (86.88%) by 0.77 and 0.98 percentage points, respectively. Despite its enhanced performance, SAEFormer maintains a compact architecture with only 24.14 million parameters, which is slightly higher than that of ResNet-34 (21.8 million parameters), while achieving higher accuracy. In terms of computational efficiency, SAEFormer requires 5.35 GFLOPs, which is slightly higher than ultra-lightweight models like MobileNetV3 (0.24 GFLOPs). However, this modest increase results in an improvement in recognition accuracy, illustrating SAEFormer’s favorable trade-off between model compactness and performance.
When compared to Transformer-based models, SAEFormer achieves higher recognition accuracy while maintaining considerably lower parameter counts and computational cost. For example, relative to the classical Vision Transformer (ViT), which yields a Top-1 accuracy of 84.6% with 85.8 million parameters and 17.58 GFLOPs, SAEFormer improves accuracy by 3.26 percentage points while using only 28.1% of the parameters and 30.4% of the FLOPs. Likewise, compared with lightweight Transformer variants such as RepViT (83.1%) and CloFormer (85.97%), SAEFormer still achieves a superior Top-1 accuracy of 87.86%, further validating the effectiveness of its lightweight and well-optimized architectural design. Although QFormer achieves a slightly higher accuracy of 88.05%, this improvement comes at the expense of a much larger model size (89.32 million parameters, nearly four times that of SAEFormer) and a significantly higher computational load (8.91 GFLOPs, nearly twice that of SAEFormer). In contrast, SAEFormer delivers comparable performance with a significantly smaller footprint, underscoring its potential for deployment in resource-constrained scenarios.
In summary, SAEFormer achieves an excellent balance among accuracy, efficiency, and model compactness. It effectively controls computational resource consumption without compromising classification performance, demonstrating its potential for further deployment on resource-constrained devices and in field environments. However, additional optimization and hardware-based evaluations are required to validate its real-time inference capability in practical applications.
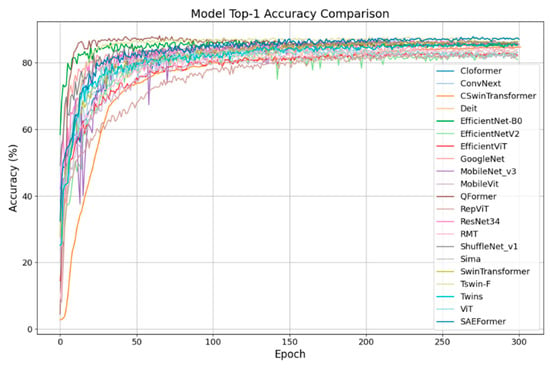
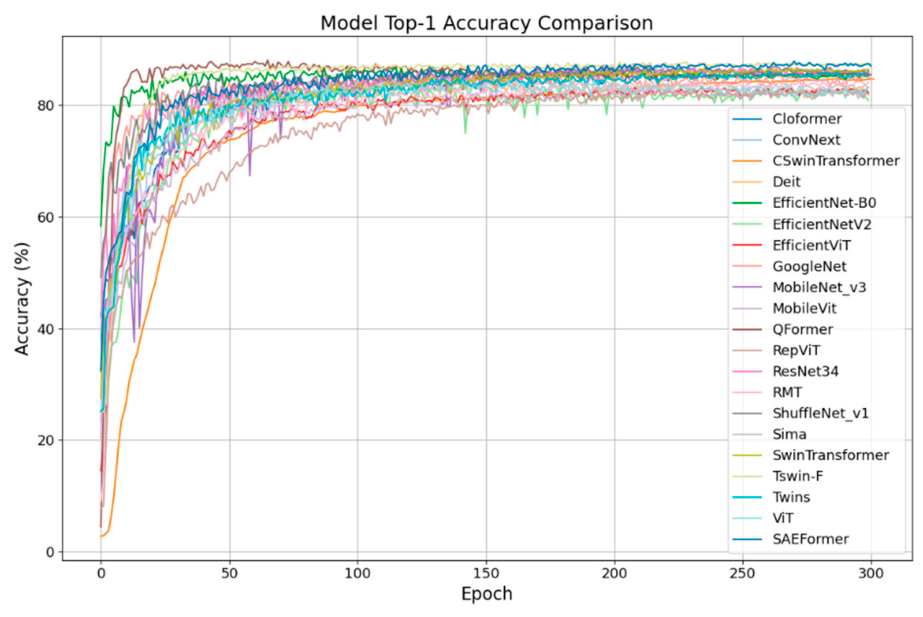
Figure 10 presents the Top-1 accuracy curves over 300 training epochs on Dataset A for several mainstream models, including SAEFormer. Most models converge rapidly within the first 50 epochs, followed by gradual improvements, with final accuracies ranging between 75% and 90%. Notably, SAEFormer demonstrates faster convergence, smaller accuracy fluctuations, and competitive final performance, reflecting its strong training stability and optimization efficiency.
Figure 10.
Comparison of classification performance on Dataset A.
Compared to other architectures, SAEFormer consistently outperforms ConvNeXt, ViT, Twins, and ResNet-34 across the entire training process, establishing itself as one of the top-performing models. In contrast, lightweight models such as MobileNetV3 and EfficientNet-B0 show fast initial convergence but lower final accuracies, revealing their limitations in capturing complex disease-specific features. Meanwhile, deeper Transformer-based models like CSWin Transformer and RepViT achieve competitive final accuracies but require more epochs to converge, indicating higher training costs.
Overall, SAEFormer offers a well-balanced advantage in accuracy, convergence speed, and training stability, confirming its effectiveness and practicality for tomato disease image recognition, especially in real-world agricultural scenarios.
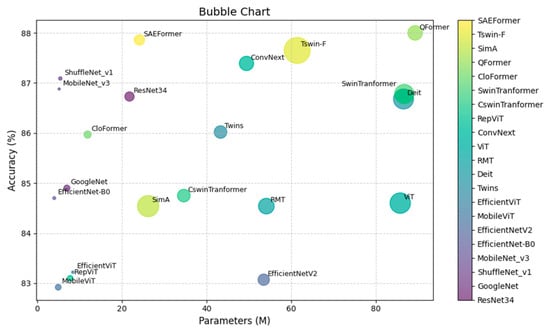
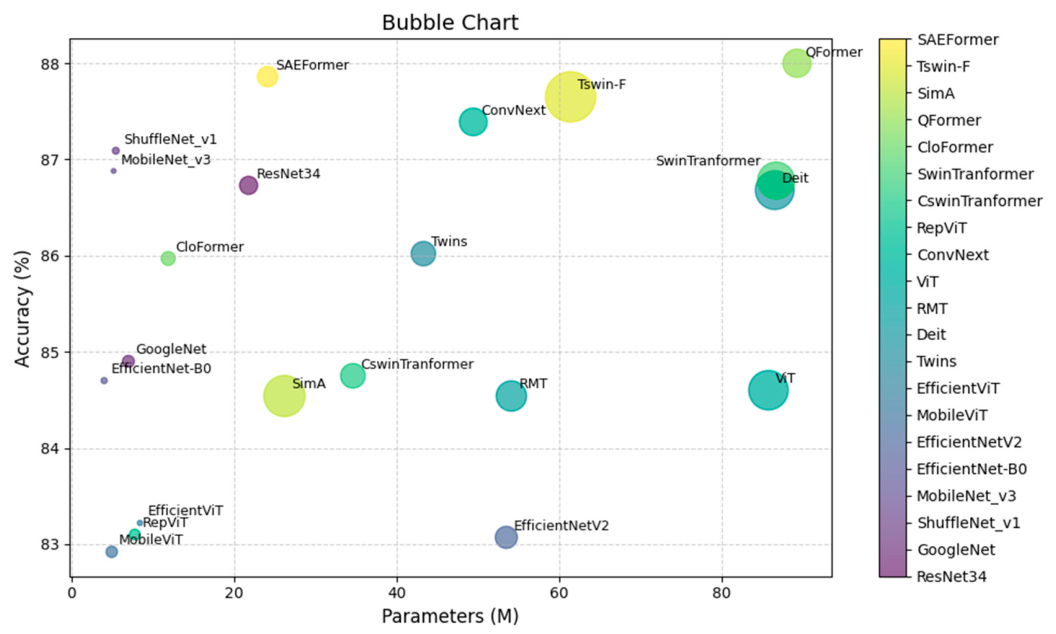
As shown in the bubble chart in Figure 11, our model achieves a more compact architecture—with a lower parameter count and lower computational cost—compared to models with similar accuracy. Conversely, it delivers higher classification accuracy than other lightweight models with comparable complexity. This comprehensive comparison highlights SAEFormer’s ability to balance efficiency and performance, making it a highly effective solution for lightweight and accurate tomato disease recognition.
Figure 11.
Bubble chart comparing parameter count, computational cost, and accuracy across different models.
To assess the model’s cross-dataset generalization under a different data distribution, SAEFormer was trained exclusively on Dataset A and directly evaluated on the validation subset of Dataset B without any retraining, fine-tuning, or parameter updating. Therefore, the results reported in Table 7 reflect the model’s direct transfer performance on the validation subset of Dataset B under a cross-dataset distribution shift. Unlike Dataset A, Dataset B was collected from real-world agricultural settings in Indian farmlands and includes region-specific diseases such as leaf miner and spotted wilt virus, along with abiotic stress conditions such as nutrient deficiencies. These characteristics represent more practical and geographically dependent agricultural challenges. Results on the validation subset of Dataset B indicate that SAEFormer maintains competitive performance under a different data distribution. These findings suggest its potential for cross-dataset generalization; however, further evaluations across regions and hardware platforms are required before practical deployment.
Table 7.
Cross-dataset performance comparison of different methods on the validation subset of Dataset B.
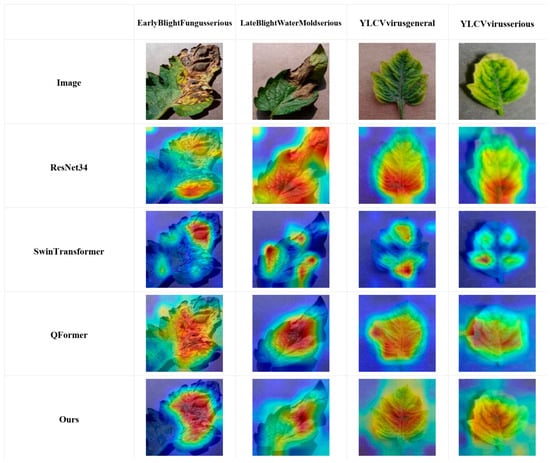
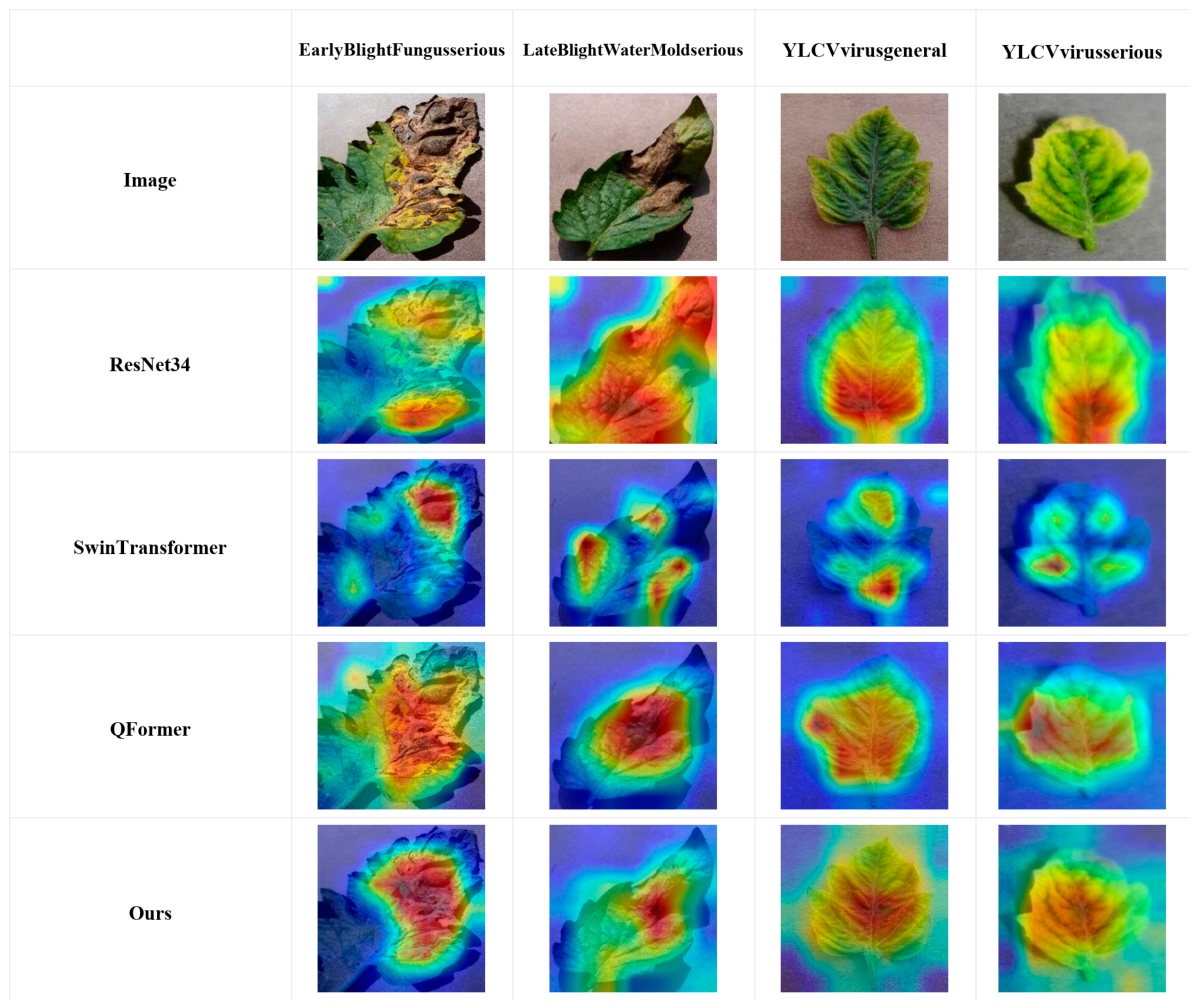
Figure 12 shows Grad-CAM visualizations of four models (ResNet-34, Swin Transformer, QFormer, and SAEFormer) for tomato leaf disease images representing serious early blight fungus, serious late blight water mold, general YLCV virus, and serious YLCV virus classes.
Figure 12.
Grad-CAM visualization analysis.
As shown in Figure 12, most heat maps generated by ResNet-34 focus on the center of the leaf, with insufficient attention to lesions near the edges and some false activations. Swin Transformer can capture more detailed regions, but multiple discontinuous high-response regions and scattered activations indicate discontinuities in spatial attention. QFormer is more efficient than the Swin Transformer; its red areas are more concentrated on leaf spots, and the boundary processing is smoother, indicating that its fusion structure improves attention accuracy. The heat maps generated by SAEFormer show high-quality localization across all categories, with red regions accurately covering lesion areas, reduced background interference, and clear, continuous thermal zones, demonstrating greater discriminative ability and more focused attention on diseased regions.
The Grad-CAM visualizations demonstrate that the proposed model achieves superior lesion localization, discriminative capability, and visual consistency compared to mainstream baseline models. SAEFormer consistently focuses on the diseased regions across various tomato disease types, exhibiting strong robustness and enhanced interpretability. These results highlight its practical applicability in real-world scenarios where reliable model explanations are essential for decision support in precision agriculture.
4. Conclusions
In this study, we propose a novel multi-stage, multi-attention model, SAEFormer, for the efficient recognition and accurate classification of crop leaf disease images. The model integrates the Multi-scale Selective Fusion Attention Block and the Multi-Head Self-Attention Block into its overall architecture, thereby combining local texture perception with global semantic modeling. Meanwhile, the introduced Self-Supervised Learning Block further improves the discriminability and robustness of feature representations through an auxiliary self-supervised loss. To enhance feature representation and generalization, SAEFormer adopts a pyramid-structured architecture that progressively extracts hierarchical features across multiple stages, thereby effectively integrating fine-grained local information with high-level global semantic information. SAEFormer integrates multi-scale perception, global modeling, and self-supervised optimization strategies, demonstrating competitive performance and practical value in lightweight intelligent tomato disease recognition.
The cross-entropy loss and self-supervised loss are jointly optimized to provide complementary supervision for tomato disease recognition. Specifically, the cross-entropy loss provides category-level supervision by encouraging the learned features to align with their corresponding disease categories. In contrast, the self-supervised loss does not rely on disease-category labels; instead, it introduces an auxiliary spatial prediction task based on the relative positional relationships between token embeddings extracted from the same input images. This additional constraint encourages the network to preserve spatially meaningful relationships while learning discriminative disease features.
By jointly optimizing the supervised classification objective and the label-independent self-supervised objective, SAEFormer can simultaneously exploit category information and intrinsic spatial structure in the input images. The self-supervised objective also serves as an auxiliary regularization constraint, helping alleviate overfitting and improving the stability of feature learning. Consequently, the proposed framework improves the robustness and generalization of the learned representations, particularly in challenging conditions involving illumination variations, leaf occlusion, complex backgrounds, and high inter-class visual similarity.
Author Contributions
Conceptualization, H.Z.; methodology, S.G.; software, C.L.; validation, H.H.; formal analysis, S.G.; investigation, C.L.; resources, L.L.; data curation, C.L.; writing—original draft preparation, H.Z.; writing—review and editing, H.H.; supervision, L.L.; project administration, L.L.; funding acquisition, L.L. All authors have read and agreed to the published version of the manuscript.
Funding
This research was supported by Zhejiang Provincial Natural Science Foundation of China under Grant No. LY24F020005.
Institutional Review Board Statement
Not applicable.
Data Availability Statement
Publicly available datasets were analyzed in this study. These datasets are available at: https://www.kaggle.com/datasets/wetsfgsg/tomato-leaves-with-13-different-lesions (accessed on 15 September 2025) and https://github.com/mamta-joshi-gehlot/Tomato-Village (accessed on 15 September 2025).
Acknowledgments
The authors would like to thank the anonymous reviewers for their constructive comments and suggestions, which significantly contributed to improving the manuscript.
Conflicts of Interest
The authors declare that there are no conflicts of interest regarding the publication of this paper.
References
- Panno, S.; Davino, S.; Caruso, A.G.; Bertacca, S.; Crnogorac, A.; Mandić, A.; Noris, E.; Matić, S. A Review of the Most Common and Economically Important Diseases That Undermine the Cultivation of Tomato Crop in the Mediterranean Basin. Agronomy 2021, 11, 2188. [Google Scholar] [CrossRef] [Scilit]
- Islam, M.S.; Sultana, S.; Farid, F.A.; Islam, N.; Rashid, M.; Bari, B.S.; Hashim, N.; Husen, M.N. Multimodal Hybrid Deep Learning Approach to Detect Tomato Leaf Disease Using Attention Based Dilated Convolution Feature Extractor with Logistic Regression Classification. Sensors 2022, 22, 6079. [Google Scholar] [CrossRef] [Scilit] [PubMed]
- Kaushal, A.; Sadashiva, A.T.; Krishna Reddy, M.; Rao, E.S.; Singh, T.H.; Sriram, S.; Dhananjay, M.V.; Venugopalan, R.; Ravishankar, K.V. Assessment of the effectiveness of Ty genes in tomato against tomato leaf curl Bangalore virus. Plant Pathol. 2020, 69, 1777–1786. [Google Scholar] [CrossRef] [Scilit]
- Yang, G.; Chen, G.; He, Y.; Yan, Z.; Guo, Y.; Ding, J. Self-Supervised Collaborative Multi-Network for Fine-Grained Visual Categorization of Tomato Diseases. IEEE Access 2020, 8, 211912–211923. [Google Scholar] [CrossRef] [Scilit]
- Hu, G.; Wang, H.; Zhang, Y.; Wan, M. Detection and severity analysis of tea leaf blight based on deep learning. Comput. Electr. Eng. 2021, 90, 107023. [Google Scholar] [CrossRef] [Scilit]
- Garg, N.; Gupta, R.; Kaur, M.; Kukreja, V.; Jain, A.; Tiwari, R.G. Classification of Tomato Diseases using Hybrid Model (CNN-SVM). In Proceedings of the 2022 10th International Conference on Reliability, Infocom Technologies and Optimization (Trends and Future Directions) (ICRITO), Noida, India, 13–14 October 2022; pp. 1–5. [Google Scholar]
- Baser, P.; Saini, J.R.; Kotecha, K. TomConv: An Improved CNN Model for Diagnosis of Diseases in Tomato Plant Leaves. Procedia Comput. Sci. 2023, 218, 1825–1833. [Google Scholar] [CrossRef] [Scilit]
- Zhao, Y.; Li, Y.; Wu, N.; Xu, X. Neural network based on convolution and self-attention fusion mechanism for plant leaves disease recognition. Crop Prot. 2024, 180, 106637. [Google Scholar] [CrossRef] [Scilit]
- Vini, S.L.; Rathika, P. TrioConvTomatoNet: A robust CNN architecture for fast and accurate tomato leaf disease classification for real time application. Sci. Hortic. 2024, 330, 113079. [Google Scholar] [CrossRef] [Scilit]
- Shruthi, U.; Nagaveni, V. TomSevNet: A hybrid CNN model for accurate tomato disease identification with severity level assessment. Neural Comput. Appl. 2024, 36, 5165–5181. [Google Scholar] [CrossRef] [Scilit]
- Borhani, Y.; Khoramdel, J.; Najafi, E. A deep learning based approach for automated plant disease classification using vision transformer. Sci. Rep. 2022, 12, 11554. [Google Scholar] [CrossRef] [Scilit] [PubMed]
- Wang, X.; Yang, W.; Yang, Y.; Huang, M.; Zhu, Q. Identification of tomato bacterial wilt severity based on hyperspectral imaging technology and spectrum Transformer network. Ecol. Inform. 2023, 78, 102353. [Google Scholar] [CrossRef] [Scilit]
- Tiwari, M.; Kumar, H.; Prakash, N.; Kumar, S.; Neware, R.; Tripathi, S.; Agarwal, R. Tomato Disease Detection Using Vision Transformer with Residual L1-Norm Attention and Deep Neural Networks. Int. J. Intell. Eng. Syst. 2024, 17, 679–688. [Google Scholar] [CrossRef] [Scilit]
- Chen, H.; Zhang, H.; Liu, C.; An, J.; Gao, Z.; Qiu, J. FET-FGVC: Feature-enhanced transformer for fine-grained visual classification. Pattern Recognit. 2024, 149, 110265. [Google Scholar] [CrossRef] [Scilit]
- Ye, Y.; Zhou, H.; Yu, H.; Hu, H.; Zhang, G.; Hu, J.; He, T. Application of Tswin-F network based on multi-scale feature fusion in tomato leaf lesion recognition. Pattern Recognit. 2024, 156, 110775. [Google Scholar] [CrossRef] [Scilit]
- Shehu, H.A.; Ackley, A.; Marvellous, M.; Eteng, O.E. Early detection of tomato leaf diseases using transformers and transfer learning. Eur. J. Agron. 2025, 168, 127625. [Google Scholar] [CrossRef] [Scilit]
- Lee, M.K.; Hyun, S.; Jun, W.; Kim, H.; Chung, J.; Heo, J.-P. Analyzing the Training Dynamics of Image Restoration Transformers: A Revisit to Layer Normalization. In Proceedings of the International Conference on Learning Representations (ICLR), Rio de Janeiro, Brazil, 23–27 April 2026. [Google Scholar]
- Tomato Leaves with 13 Different Lesions. Available online: https://www.kaggle.com/datasets/wetsfgsg/tomato-leaves-with-13-different-lesions (accessed on 4 June 2025).
- Gehlot, M.; Saxena, R.K.; Gandhi, G.C. “Tomato-Village”: A dataset for end-to-end tomato disease detection in a real-world environment. Multimed. Syst. 2023, 29, 3305–3328. [Google Scholar] [CrossRef] [Scilit]
- Jiao, J.; Tang, Y.-M.; Lin, K.-Y.; Gao, Y.; Ma, A.J.; Wang, Y.; Zheng, W.-S.; Ma, J. DilateFormer: Multi-Scale Dilated Transformer for Visual Recognition. IEEE Trans. Multimed. 2023, 25, 8906–8919. [Google Scholar] [CrossRef] [Scilit]
- Szegedy, C.; Liu, W.; Jia, Y.; Sermanet, P.; Reed, S.; Anguelov, D.; Erhan, D.; Vanhoucke, V.; Rabinovich, A.; Liu, W.; et al. Going Deeper With Convolutions. In Proceedings of the IEEE Conference on Computer Vision and Pattern Recognition, Boston, MA, USA, 7–12 June 2015; pp. 1–9. [Google Scholar]
- He, K.; Zhang, X.; Ren, S.; Sun, J. Deep Residual Learning for Image Recognition. In Proceedings of the IEEE Conference on Computer Vision and Pattern Recognition, Las Vegas, NV, USA, 26 June–1 July 2016; pp. 770–778. [Google Scholar]
- Zhang, X.; Zhou, X.; Lin, M.; Sun, J. ShuffleNet: An Extremely Efficient Convolutional Neural Network for Mobile Devices. In Proceedings of the IEEE Conference on Computer Vision and Pattern Recognition, Salt Lake City, UT, USA, 18–22 June 2018; pp. 6848–6856. [Google Scholar]
- Tan, M.; Le, Q. EfficientNet: Rethinking Model Scaling for Convolutional Neural Networks. In Proceedings of the 36th International Conference on Machine Learning; PMLR, Long Beach, CA, USA, 9–15 June 2019; pp. 6105–6114. [Google Scholar]
- Howard, A.; Sandler, M.; Chen, B.; Wang, W.; Chen, L.-C.; Tan, M.; Chu, G.; Vasudevan, V.; Zhu, Y.; Pang, R.; et al. Searching for MobileNetV3. In Proceedings of the IEEE/CVF International Conference on Computer Vision, Seoul, Republic of Korea, 27 October–2 November 2019; pp. 1314–1324. [Google Scholar]
- Touvron, H.; Cord, M.; Douze, M.; Massa, F.; Sablayrolles, A.; Jégou, H. Training data-efficient image transformers & distillation through attention. In Proceedings of the 38th International Conference on Machine Learning; PMLR, Virtual Event, 18–24 July 2021; pp. 10347–10357. [Google Scholar]
- Tan, M.; Le, Q. EfficientNetV2: Smaller Models and Faster Training. In Proceedings of the 38th International Conference on Machine Learning; PMLR, Virtual Event, 18–24 July 2021; pp. 10096–10106. [Google Scholar]
- Chu, X.; Tian, Z.; Wang, Y.; Zhang, B.; Ren, H.; Wei, X.; Xia, H.; Shen, C. Twins: Revisiting the Design of Spatial Attention in Vision Transformers. In Advances in Neural Information Processing Systems; Curran Associates, Inc.: Red Hook, NY, USA, 2021; pp. 9355–9366. [Google Scholar]
- Dosovitskiy, A.; Beyer, L.; Kolesnikov, A.; Weissenborn, D.; Zhai, X.; Unterthiner, T.; Dehghani, M.; Minderer, M.; Heigold, G.; Gelly, S.; et al. An Image is Worth 16×16 Words: Transformers for Image Recognition at Scale. arXiv 2021, arXiv:2010.11929. [Google Scholar]
- Liu, Z.; Lin, Y.; Cao, Y.; Hu, H.; Wei, Y.; Zhang, Z.; Lin, S.; Guo, B. Swin Transformer: Hierarchical Vision Transformer using Shifted Windows. In Proceedings of the 2021 IEEE/CVF International Conference on Computer Vision (ICCV); IEEE: Montreal, QC, Canada, 2021; pp. 9992–10002. [Google Scholar]
- Mehta, S.; Rastegari, M. MobileViT: Light-weight, General-purpose, and Mobile-friendly Vision Transformer. arXiv 2022, arXiv:2110.02178. [Google Scholar]
- Dong, X.; Bao, J.; Chen, D.; Zhang, W.; Yu, N.; Yuan, L.; Guo, B. CSWin Transformer: A General Vision Transformer Backbone with Cross-Shaped Windows. In Proceedings of the 2022 IEEE/CVF Conference on Computer Vision and Pattern Recognition (CVPR), New Orleans, LA, USA, 18–24 June 2022. [Google Scholar]
- Liu, Z.; Mao, H.; Wu, C.-Y.; Feichtenhofer, C.; Darrell, T.; Xie, S. A ConvNet for the 2020s. In Proceedings of the 2022 IEEE/CVF Conference on Computer Vision and Pattern Recognition (CVPR), New Orleans, LA, USA, 18–24 June 2022; pp. 11966–11976. [Google Scholar]
- Liu, X.; Peng, H.; Zheng, N.; Yang, Y.; Hu, H.; Yuan, Y. EfficientViT: Memory Efficient Vision Transformer With Cascaded Group Attention. In Proceedings of the IEEE/CVF Conference on Computer Vision and Pattern Recognition, Vancouver, BC, Canada, 18–22 June 2023; pp. 14420–14430. [Google Scholar]
- Fan, Q.; Huang, H.; Guan, J.; He, R. Rethinking Local Perception in Lightweight Vision Transformer. arXiv 2023, arXiv:2303.17803. [Google Scholar]
- Fan, Q.; Huang, H.; Chen, M.; Liu, H.; He, R. RMT: Retentive Networks Meet Vision Transformers. In Proceedings of the IEEE/CVF Conference on Computer Vision and Pattern Recognition, Seattle, WA, USA, 17–21 June 2024; pp. 5641–5651. [Google Scholar]
- Wang, A.; Chen, H.; Lin, Z.; Han, J.; Ding, G. RepViT: Revisiting Mobile CNN From ViT Perspective. In Proceedings of the IEEE/CVF Conference on Computer Vision and Pattern Recognition, Seattle, WA, USA, 17–21 June 2024; pp. 15909–15920. [Google Scholar]
- Zhang, Q.; Zhang, J.; Xu, Y.; Tao, D. Vision Transformer With Quadrangle Attention. IEEE Trans. Pattern Anal. Mach. Intell. 2024, 46, 3608–3624. [Google Scholar] [CrossRef] [Scilit] [PubMed]
- Koohpayegani, S.A.; Pirsiavash, H. SimA: Simple Softmax-free Attention for Vision Transformers. In Proceedings of the 2024 IEEE/CVF Winter Conference on Applications of Computer Vision (WACV), Waikoloa, HI, USA, 3–8 January 2024. [Google Scholar]

Disclaimer/Publisher’s Note: The statements, opinions and data contained in all publications are solely those of the individual author(s) and contributor(s) and not of MDPI and/or the editor(s). MDPI and/or the editor(s) disclaim responsibility for any injury to people or property resulting from any ideas, methods, instructions or products referred to in the content. |
© 2026 by the authors. Licensee MDPI, Basel, Switzerland. This article is an open access article distributed under the terms and conditions of the Creative Commons Attribution (CC BY) license.