


Abstract
Capillary wick irrigation offers a passive means of gradual water delivery, but field evidence comparing wick configurations with conventional drip irrigation remains limited. This study compared annular capillary wick irrigation (AI), straight capillary wick irrigation (SI), drip irrigation (DI), and a non-irrigated rainfall-only control (NI) in a Red Globe grapevine field experiment in Ningxia, northwest China. Each irrigated experimental unit consisted of one reservoir supplying three grapevines and received four 90 L irrigation events, corresponding to a seasonal applied irrigation amount of 360 L per experimental unit. The local soil moisture at a monitored 10 cm depth, vegetative growth, berry development, yield, fruit quality traits, physiological indicators, and irrigation water productivity were evaluated. The capillary wick treatments generally showed a more persistent local soil moisture response than the more rapid post-irrigation response under DI. AI had the highest-recorded treatment mean yield (11.97 kg experimental unit−1), irrigation water productivity among the irrigated treatments (0.033 kg L−1), final 100-berry weight (864.49 g), and soluble solids content (18.77%). A 13-indicator AHP–Entropy Weight evaluation ranked AI first (0.8765), followed by SI (0.5129), DI (0.4860), and NI (0.3502); the same treatment order was retained in a sensitivity analysis using mean SPAD readings. Because the archived dataset did not permit consistent reconstruction of experimental unit identity for all response variables, the treatment differences are interpreted descriptively rather than as inferential statistical effects. These results provide preliminary field evidence that annular capillary wick irrigation warrants further engineering evaluation as a delivery configuration, while direct measurements of hydraulic discharge, spatial wetting patterns, and long-term operational reliability are required before its broader application.
1. Introduction
Water scarcity and increasingly variable atmospheric demand have made irrigation management central to grapevine production in arid and semi-arid regions [1,2,3]. Irrigation performance depends not only on the seasonal water amount but also on the timing, placement, and delivery rate, which shape vine water status, yield, berry quality, and water productivity [1,2,3,4]. Field and regional studies have further shown that delivery depth, scheduling, and site conditions can alter root-zone access to water and the interpretation of crop water productivity [5,6,7].
Current vineyard irrigation strategies include surface and subsurface drip irrigation, direct root-zone delivery, regulated deficit irrigation, and sensor- or data-informed scheduling [5,6,8]. Recent field studies have indicated that these approaches can modify soil water–root coupling, root distribution, yield, and water productivity [8,9,10]. The deficit intensity and timing also create context-dependent trade-offs among vegetative growth, yield components, acidity, phenolic development, and water saving [11,12,13,14,15]. Because the denominator may include different water components, water productivity metrics must be interpreted according to the stated water accounting boundary [16].
Capillary wick irrigation transfers water through fibrous media and can provide a gradual supply without the pressurized discharge mechanism of conventional drip emitters [17,18,19]. Reviews, modeling, and soil–plant experiments have identified system configuration, wick properties, wick length, reservoir water level, and the receiving medium’s hydraulic conditions as important controls on transfer [17,18,19], and capillary irrigation has also been evaluated in horticultural crops [20]. Related negative-pressure systems regulate supply through soil matric suction and imposed hydraulic boundaries [21,22,23,24]. Low-head porous ceramic emitters provide an additional passive subsurface delivery analogue, but their material, flow path, and boundary conditions differ from those of fibrous wicks [25].
The delivery geometry can influence where water contacts the soil and how a wetting zone develops [26,27]. Experimental and numerical work on ring-shaped subsurface emitters has shown that wetting patterns depend on the emitter geometry as well as the soil and hydraulic conditions [26]. Recent ceramic emitter research has similarly linked the operating head and soil wetting patterns to suitable system operation [27]. These findings support treating annular and straight wick arrangements as distinct delivery configurations, while avoiding an assumption that geometry alone determines whole-root-zone wetting or hydraulic efficiency.
Existing studies have examined capillary, subsurface, negative-pressure, direct root-zone, and ring-shaped delivery systems, but comparative field evidence directly evaluating annular and straight capillary wick configurations against drip irrigation under the same vineyard conditions remains limited [17,18,20,23,26]. We therefore compared annular capillary wick irrigation (AI), straight capillary wick irrigation (SI), drip irrigation (DI), and a non-irrigated rainfall-only control (NI) in a Red Globe vineyard under arid field conditions. We hypothesized that the slower release associated with capillary wick configurations would be accompanied by a more persistent soil moisture response at the monitored 10 cm position than the pulsed response following DI. The objectives were to compare the local soil moisture and crop responses, evaluate the yield and irrigation water productivity among the irrigated treatments, and provide a descriptive integrated comparison of selected indicators. The three-dimensional wetted volume, deep percolation, and root-zone distribution uniformity were not measured.
2. Materials and Methods
2.1. Site Description
The field experiment was conducted from May to September 2017 at Yuquanying Farm in the Ningxia Hui Autonomous Region, northwest China, within an approximately 0.67 ha table grape vineyard. A later published vineyard study at Yuquanying Farm reported a farm-level location of 38°14′25″ N and 106°01′43″ E [28], which matches the farm-level reference coordinates used here for the contextual gridded data; it is not treated as the exact location of the 2017 trial plot. Historical site descriptions have characterized the vineyard setting as a temperate continental arid environment with a mean annual temperature of approximately 8.7 °C, annual precipitation of approximately 201.4 mm, annual evaporation of approximately 1470.1 mm, and rainfall concentrated mainly from July to September. The soil was described historically as sandy loam/light sierozem, with a pH below 8.5, organic matter of 3.79 g kg−1 in the 0–10 cm layer, and field capacity of 14.26%. These descriptors provide site context rather than a 2017 soil laboratory characterization. For the farm-level contextual geolocation, the reference coordinates used for the gridded meteorological extraction are 38.240278° N, 106.028611° E. The SRTM90m and ASTER30m gridded terrain at this reference point indicate an elevation of approximately 1140 m a.s.l. The exact 2017 trial plot GPS position and surveyed plot elevation were not preserved. The bulk density, wilting point, saturated hydraulic conductivity, porosity, and water retention curve were likewise not recovered and are not reported. Supplementary Table S1 provides the NASA POWER gridded meteorological context for the farm area for May–September 2017; these data were not on-site station measurements.
2.2. Experimental Unit and Treatment Design
The master’s thesis describes the study vineyard as having east–west rows with 50 cm within-row vine spacing. Each treatment consisted of three independent water supply units. One water supply unit comprised one reservoir and its associated delivery system supplying three Red Globe grapevines; this water supply unit was therefore the independent field experimental unit. Each treatment contained three independent field units and nine grapevines in total. The three grapevines within each unit were subsamples rather than independent treatment replicates. The historical archive did not permit reconstruction of randomization, block structure, border plants, exact inter-unit distances, row numbers, or a field layout map.
2.3. Irrigation System Configuration
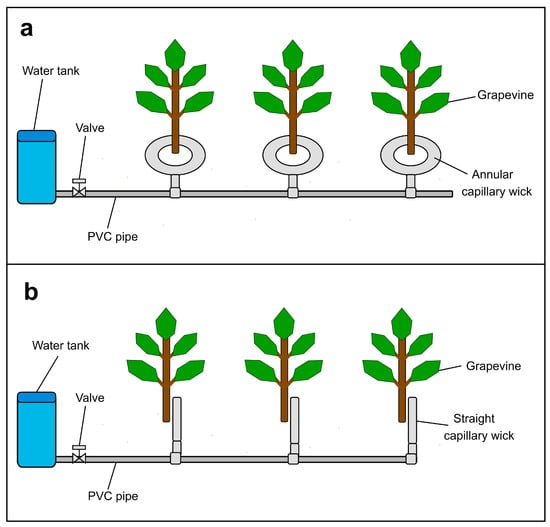
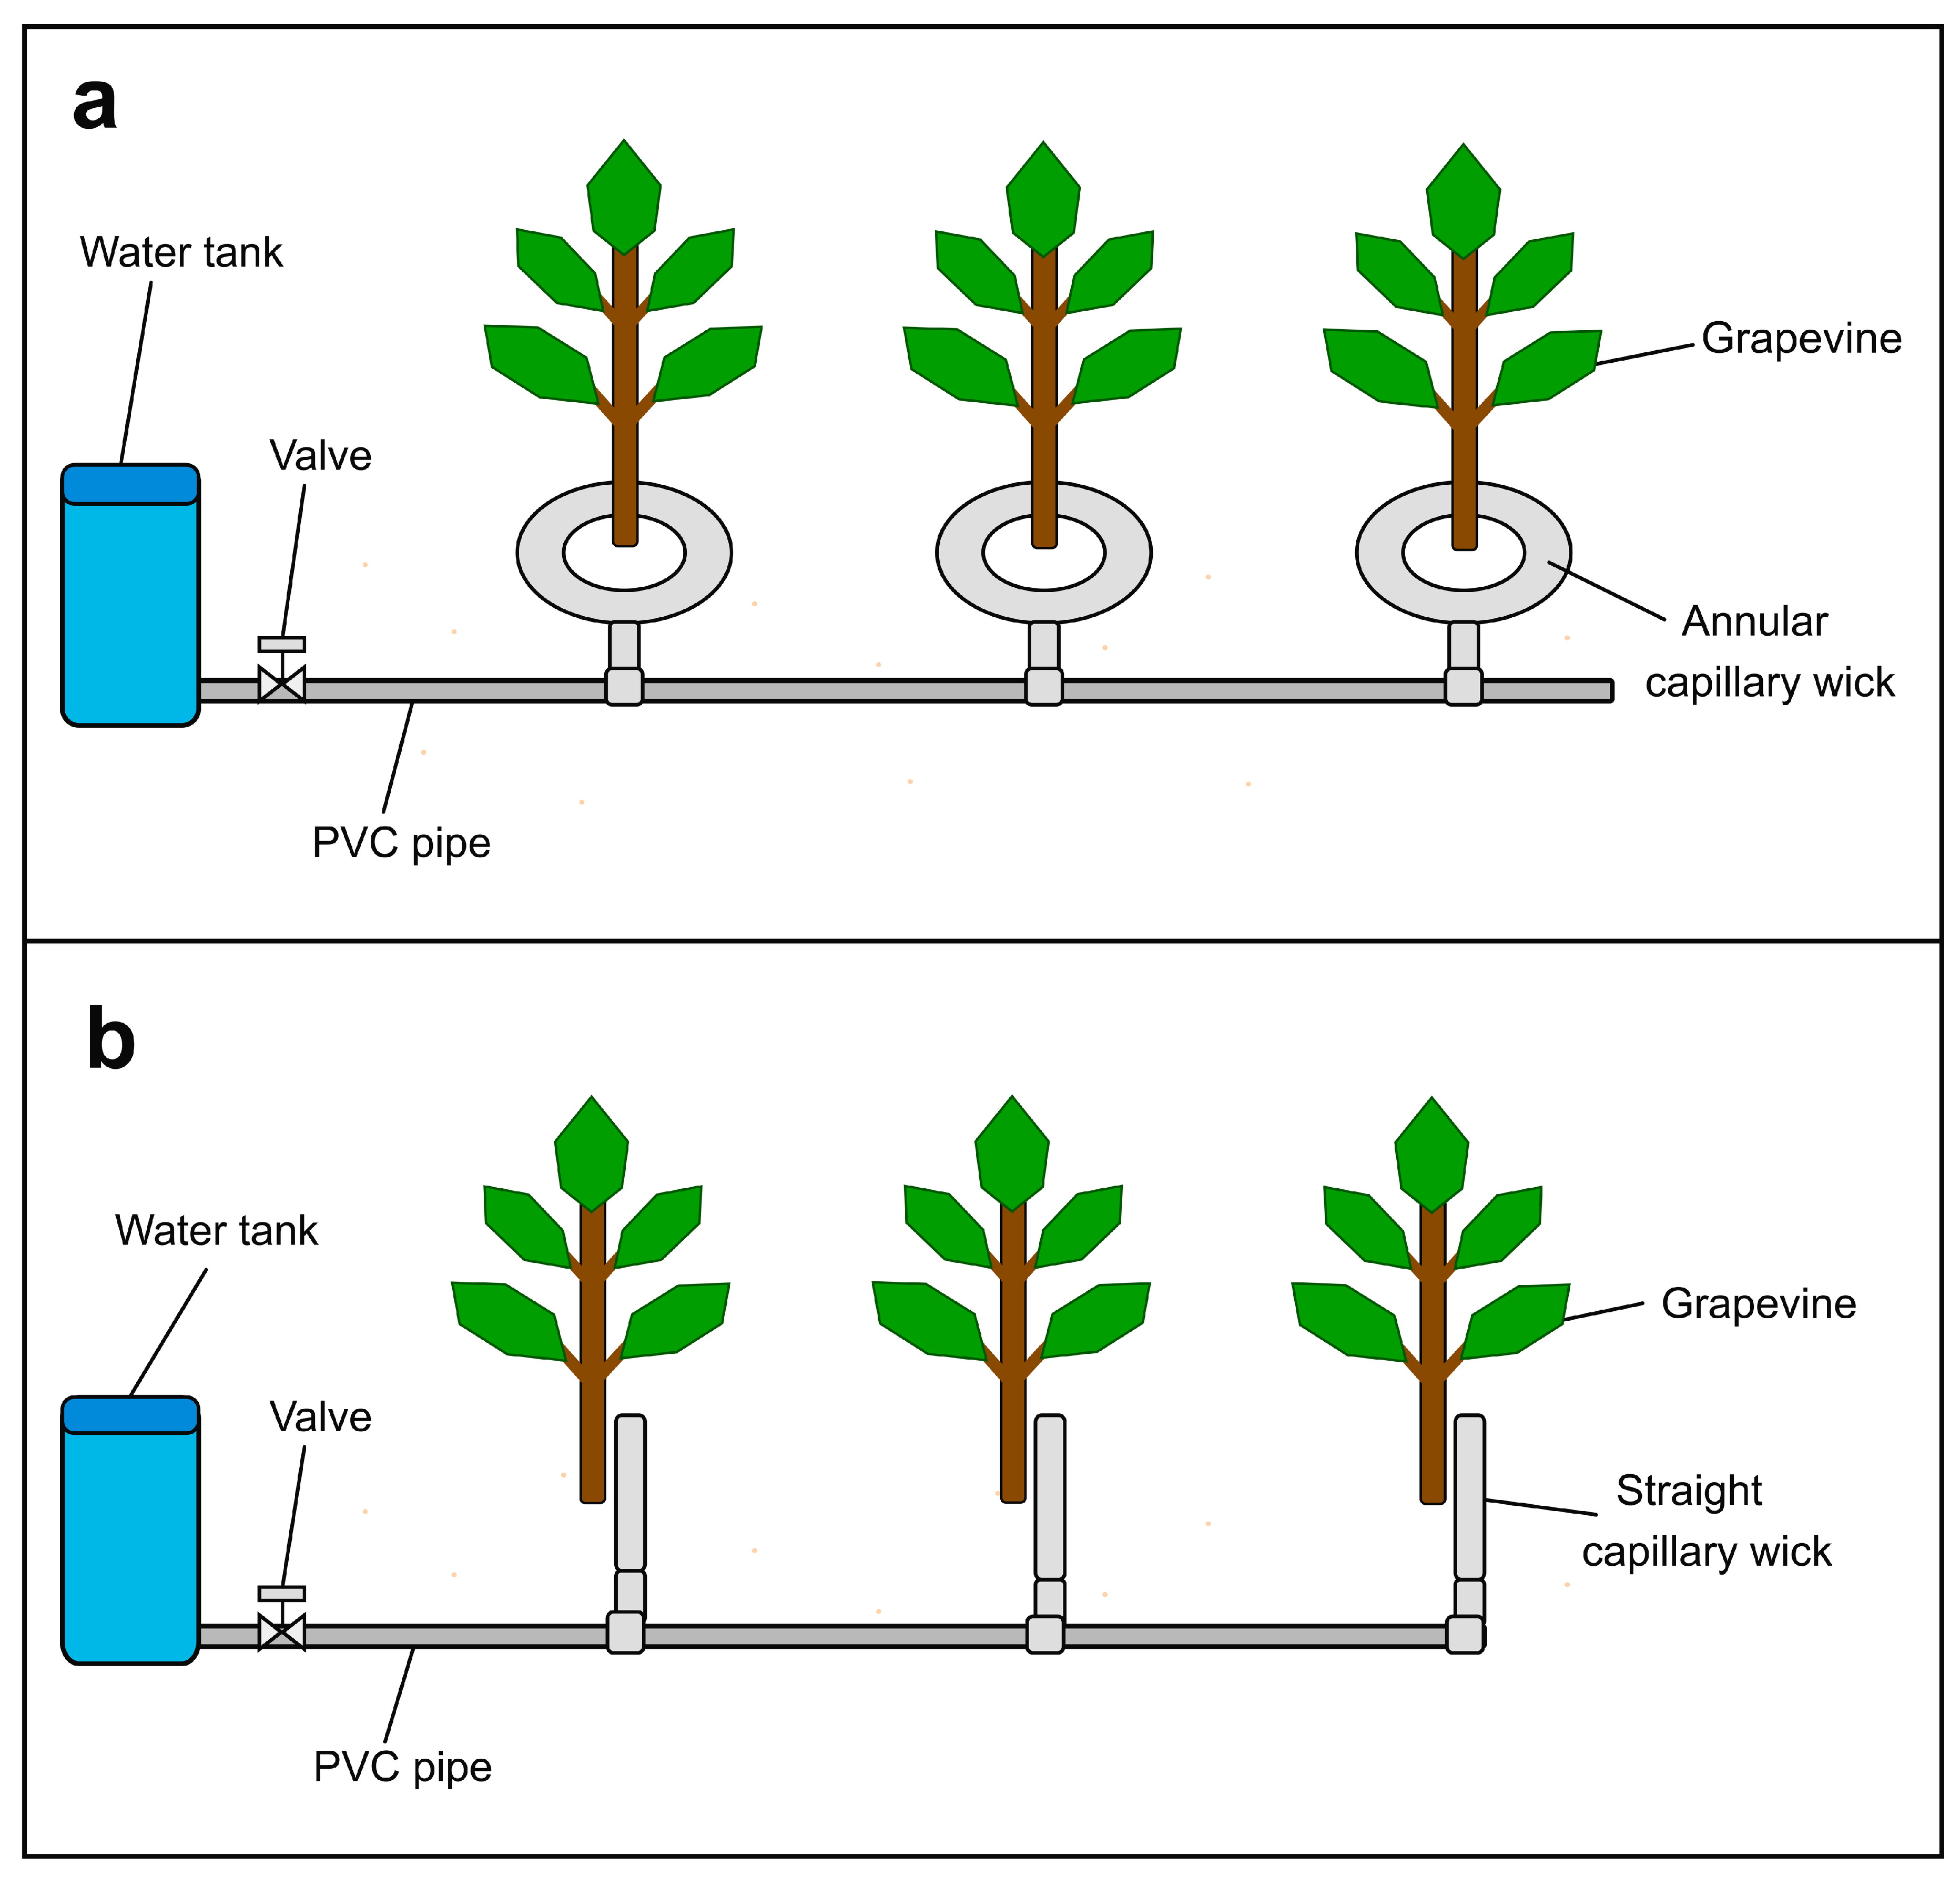
The tested AI and SI configurations are illustrated in Figure 1.
Figure 1.
Schematic representation of the tested irrigation configurations. (a) Annular capillary wick irrigation (AI) and (b) straight capillary wick irrigation (SI).
Each irrigated experimental unit used a 90 L reservoir connected to a PVC supply pipe; the distal end of the pipe was sealed. For AI, three upper release/slit positions corresponded to the three grapevines, and the wick arrangement was placed annularly around the vine-base/root-zone surface. SI used the same general reservoir–PVC framework and three release positions, but straight wick elements were used instead of annular loops; the retained record does not support a more specific placement description. DI used a reservoir-fed delivery pipe with three openings corresponding to the three grapevines; the openings were directed toward the soil surface. NI was a rainfall-only control and had no irrigation device. The historical project documentation describes the cotton-based flat fibrous wick used in this research program as approximately 15 cm × 3 cm × 2 mm. The full-season configuration-specific total wick length, exact inserted wick length, soil contact area, wick porosity, absorption capacity, and wick hydraulic conductivity were not preserved. The total wick length and soil contact area therefore cannot be confirmed as identical between AI and SI. The hydraulic-head time series, pipe diameter, exact slit dimensions, commercial emitter type, pressure, filter, regulator, discharge curve, and distribution uniformity were not recovered. The comparison is therefore between tested irrigation configurations, not a demonstration of a pure geometry effect.
2.4. Irrigation Schedule
Four irrigation events occurred on 12 May, 7 June, 6 July, and 24 August 2017. During each event, each irrigated experimental unit received a 90 L reservoir fill, and the full volume was released through its corresponding delivery system into the soil, giving 360 L experimental unit−1 season−1 (30 L vine−1 per event and 120 L vine−1 per season as derived equivalents). The third event began at approximately 07:00 on 6 July, and most of the reservoir water had been released by the evening of 16 July. In early August, a blockage was observed in the straight wick treatment; the wicks were removed, cleaned, and reinstalled. The fourth event began at approximately 07:00 on 24 August. DI completed water release by approximately 27 August, whereas most of the capillary wick units continued releasing water until approximately 30 August. A further capillary wick blockage and cleaning event was documented on 20 September. The applied volume was established from the reservoir fill and completion of release, as no flow meter, unit-specific cumulative discharge curve, or quantitative distribution-uniformity measurement was available. The archive preserves irrigation dates but not a quantitative soil moisture, evapotranspiration, or plant water status trigger. It also does not preserve an area-normalized design calculation for converting the experimental amount into a commercial vineyard irrigation quota.
2.5. Soil Moisture and Crop Measurements
Soil moisture was monitored with an RS-GPRS-M temperature/moisture monitoring system (Jinan Renshuo Electronic Technology Co., Ltd., Jinan, China) at an approximately 10 cm soil position/layer. Sensor-to-unit identity and the exact horizontal position relative to the release elements cannot be reconstructed consistently. The observations are therefore treated as local monitored measurements and do not quantify the complete root-zone moisture, wetted bulb geometry, vertical distribution, drainage, or uniformity. Lateral shoots and leaf midribs were labeled and measured with a tape at approximately 10-day intervals; the interval growth was converted to daily growth, as reported in the retained treatment-level records. For berry development, approximately 30 berries per treatment were selected on vines without harvesting and measured with a vernier caliper at approximately 7-day intervals for the transverse and longitudinal diameter. The resulting growth rates are reported in mm d−1. For the 100-berry weight, three fruit samples/bags of approximately 33 berries per treatment were weighed at approximately 10-day intervals where the retained records support this description. Because the relation of fruit bags, leaves, berries, sensors, and dates to the water supply unit’s identity cannot be consistently reconstructed, these observations are interpreted descriptively at the treatment level and are not used as independent field replicates.
2.6. SPAD, Fruit Chemistry, Yield, and IWP Measurements
The soluble solids content was measured with an Atago PR-101 digital refractometer (ATAGO Co., Ltd., Tokyo, Japan; 0–45 °Brix; accuracy ± 0.1 °Brix under the stated operating conditions). Leaf greenness was measured with a SPAD-502 m (Konica Minolta Sensing, Inc., Osaka, Japan) at approximately 7-day intervals where the retained records support this schedule, and is reported as the mean SPAD readings rather than the chlorophyll concentration. The yield was harvested on approximately 2 October; one unit’s yield was the total fresh fruit mass from the three grapevines supplied by that unit, and the treatment values are reported as the treatment mean yield per experimental unit. The proline content was determined by ninhydrin colorimetry at 520 nm using a proline calibration curve, consistent with Bates et al. [29]. The titratable acidity was determined by NaOH acid–base titration and expressed as tartaric acid equivalents. The anthocyanin content was assessed spectrophotometrically at the wavelength of maximum absorption. The specific spectrophotometer model and manufacturer were not preserved in the surviving records. The surviving laboratory archive does not preserve every extraction volume, reagent concentration, endpoint, or preparation step required for a complete retrospective reconstruction; no undocumented procedural values were introduced. The retained proline results are reported on the historical percentage scale; the archived conversion basis for a different concentration unit was not preserved.
2.7. Integrated Evaluation and Statistical Interpretation
The final descriptive AHP–Entropy Weight evaluation used 13 indicators. AHP uses pairwise comparisons to derive relative priorities [30], whereas the entropy weight method derives objective indicator weights from information dispersion [31]. SPAD was retained as a descriptive physiological outcome but was not included in the final integrated evaluation because the historical-derived chlorophyll variable used in the earlier weighting matrix could not be validated against the retained SPAD measurements. The remaining AHP priorities were renormalized, the entropy weights recalculated, and the combined weights derived using the same arithmetic combination rule. A sensitivity analysis substituting the mean SPAD readings is provided in Supplementary Table S2. The water supply unit was the independent field unit. Although three units per treatment were confirmed, the unit identity could not be reconstructed consistently across all major variables. Retrospective tests using vine-, berry-, sensor-, or date-level observations as independent replicates would have created pseudoreplication. The comparisons and AHP–Entropy Weight results are consequently descriptive and no inferential significance is assigned. Table 1 summarizes the AHP, entropy, and combined weights used for this descriptive integrated evaluation. In the AHP consistency calculation, λmax is the maximum eigenvalue of the judgment matrix, CI is the consistency index, RI is the random index, and CR is the consistency ratio; CR < 0.10 was used as the retained consistency criterion.
Table 1.
AHP, entropy, and combined weights for the final 13-indicator descriptive integrated evaluation.
2.8. AHP–Entropy Weight Equations
Equations (1)–(10) retain the AHP, entropy weight, normalization, and combined weight definitions used for the final 13-indicator evaluation.
3. Results
3.1. Local Soil Moisture and Vegetative Growth
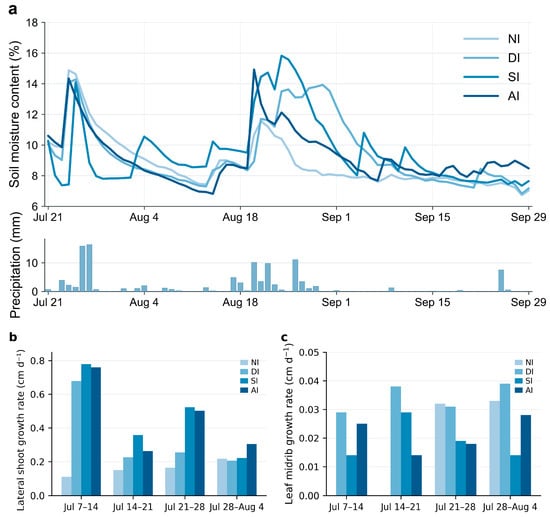
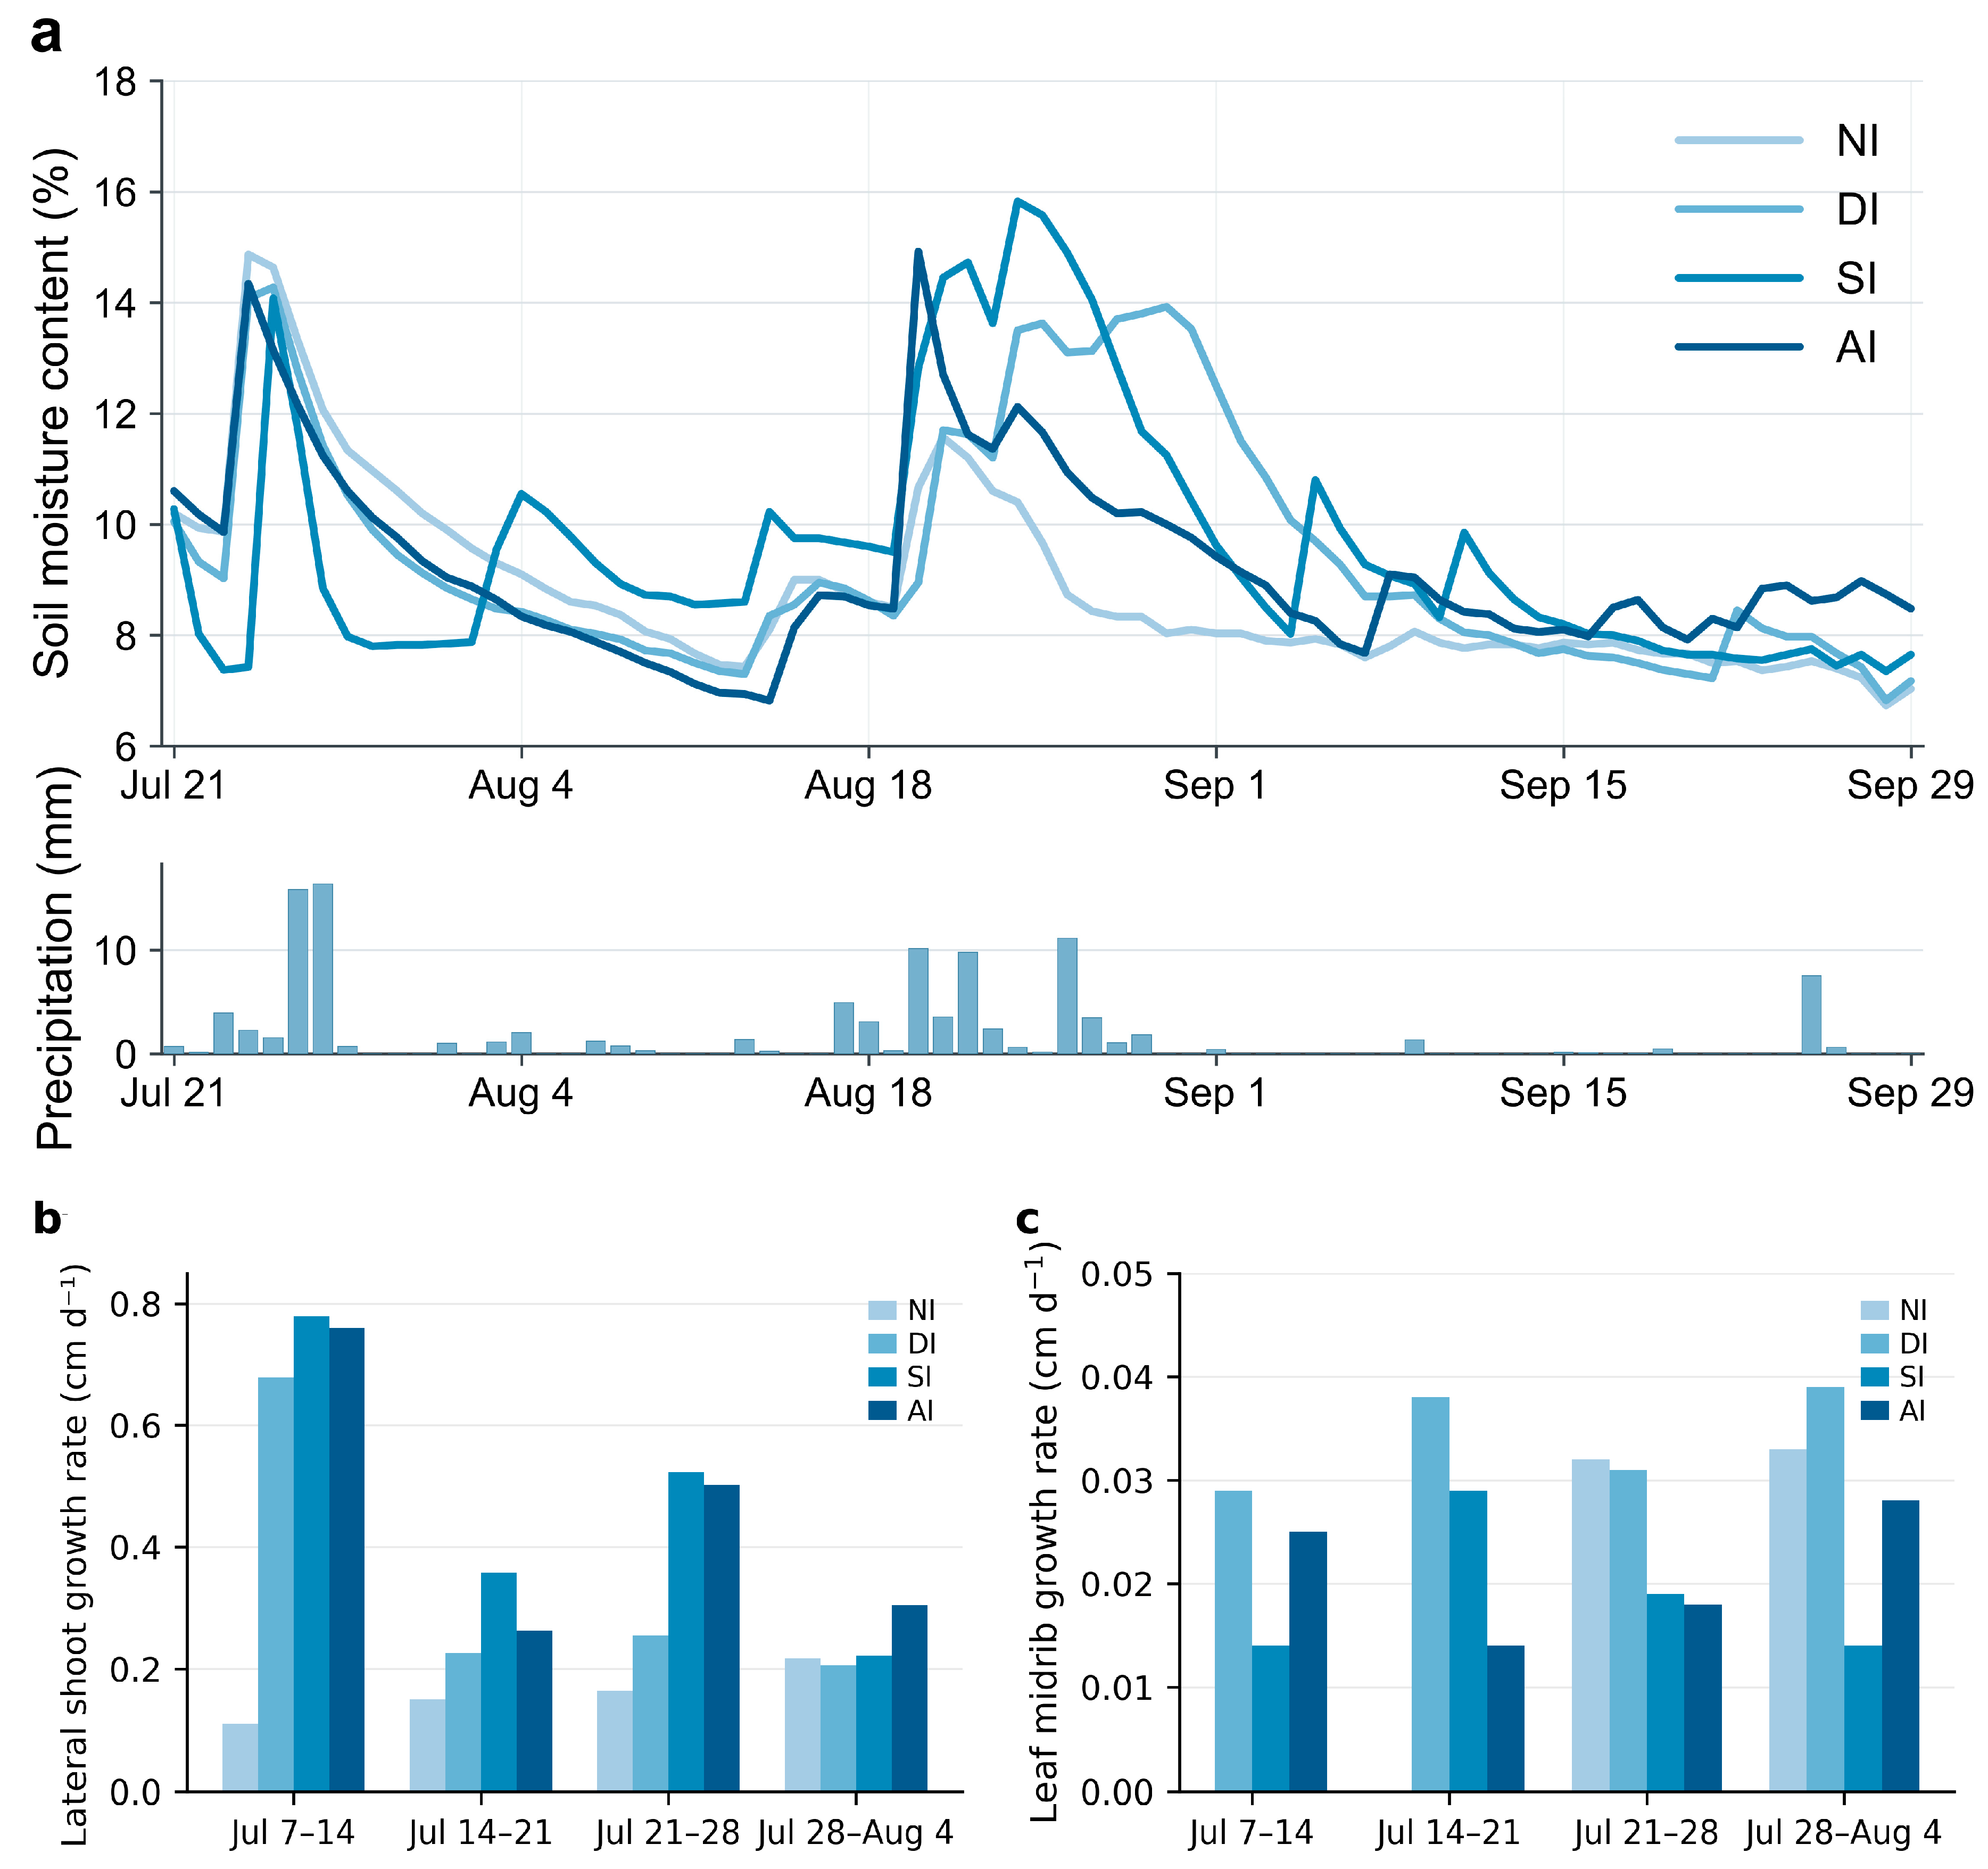
At the monitored 10 cm position, the four treatments showed distinct temporal soil moisture patterns (Figure 2a). The late-July increases aligned with the NASA POWER precipitation context. DI showed a relatively rapid post-irrigation response followed by a decline at the monitored position, whereas the capillary wick treatments generally showed more gradual and persistent local responses. SI had higher local readings during some periods. Wick blockage and cleaning are reported as operational events only.
Figure 2.
Descriptive treatment-level soil moisture and vegetative growth responses during the 2017 field experiment. (a) Soil moisture time series for AI, SI, DI, and NI; the aligned lower subpanel shows the daily precipitation from the NASA POWER gridded meteorological data for the farm area, rather than on-site station observations. (b) Lateral shoot growth rate (cm d−1). (c) Leaf midrib growth rate (cm d−1). No error bars or inferential statistics are shown because recoverable experimental unit variance was not available consistently across treatments.
Lateral shoot and leaf-midrib growth rates are shown descriptively in Figure 2b,c. Across the four displayed intervals, mean lateral shoot growth was approximately 0.47 cm d−1 under SI, 0.46 cm d−1 under AI, 0.34 cm d−1 under DI, and 0.16 cm d−1 under NI. These treatment-level patterns are presented without error bars or inferential comparisons.
3.2. The 100-Berry Weight, Mean SPAD Reading, Yield, and IWP
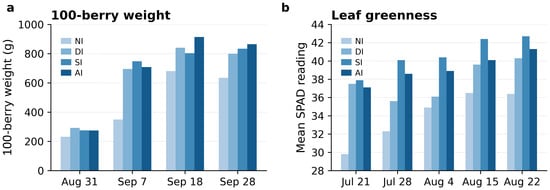
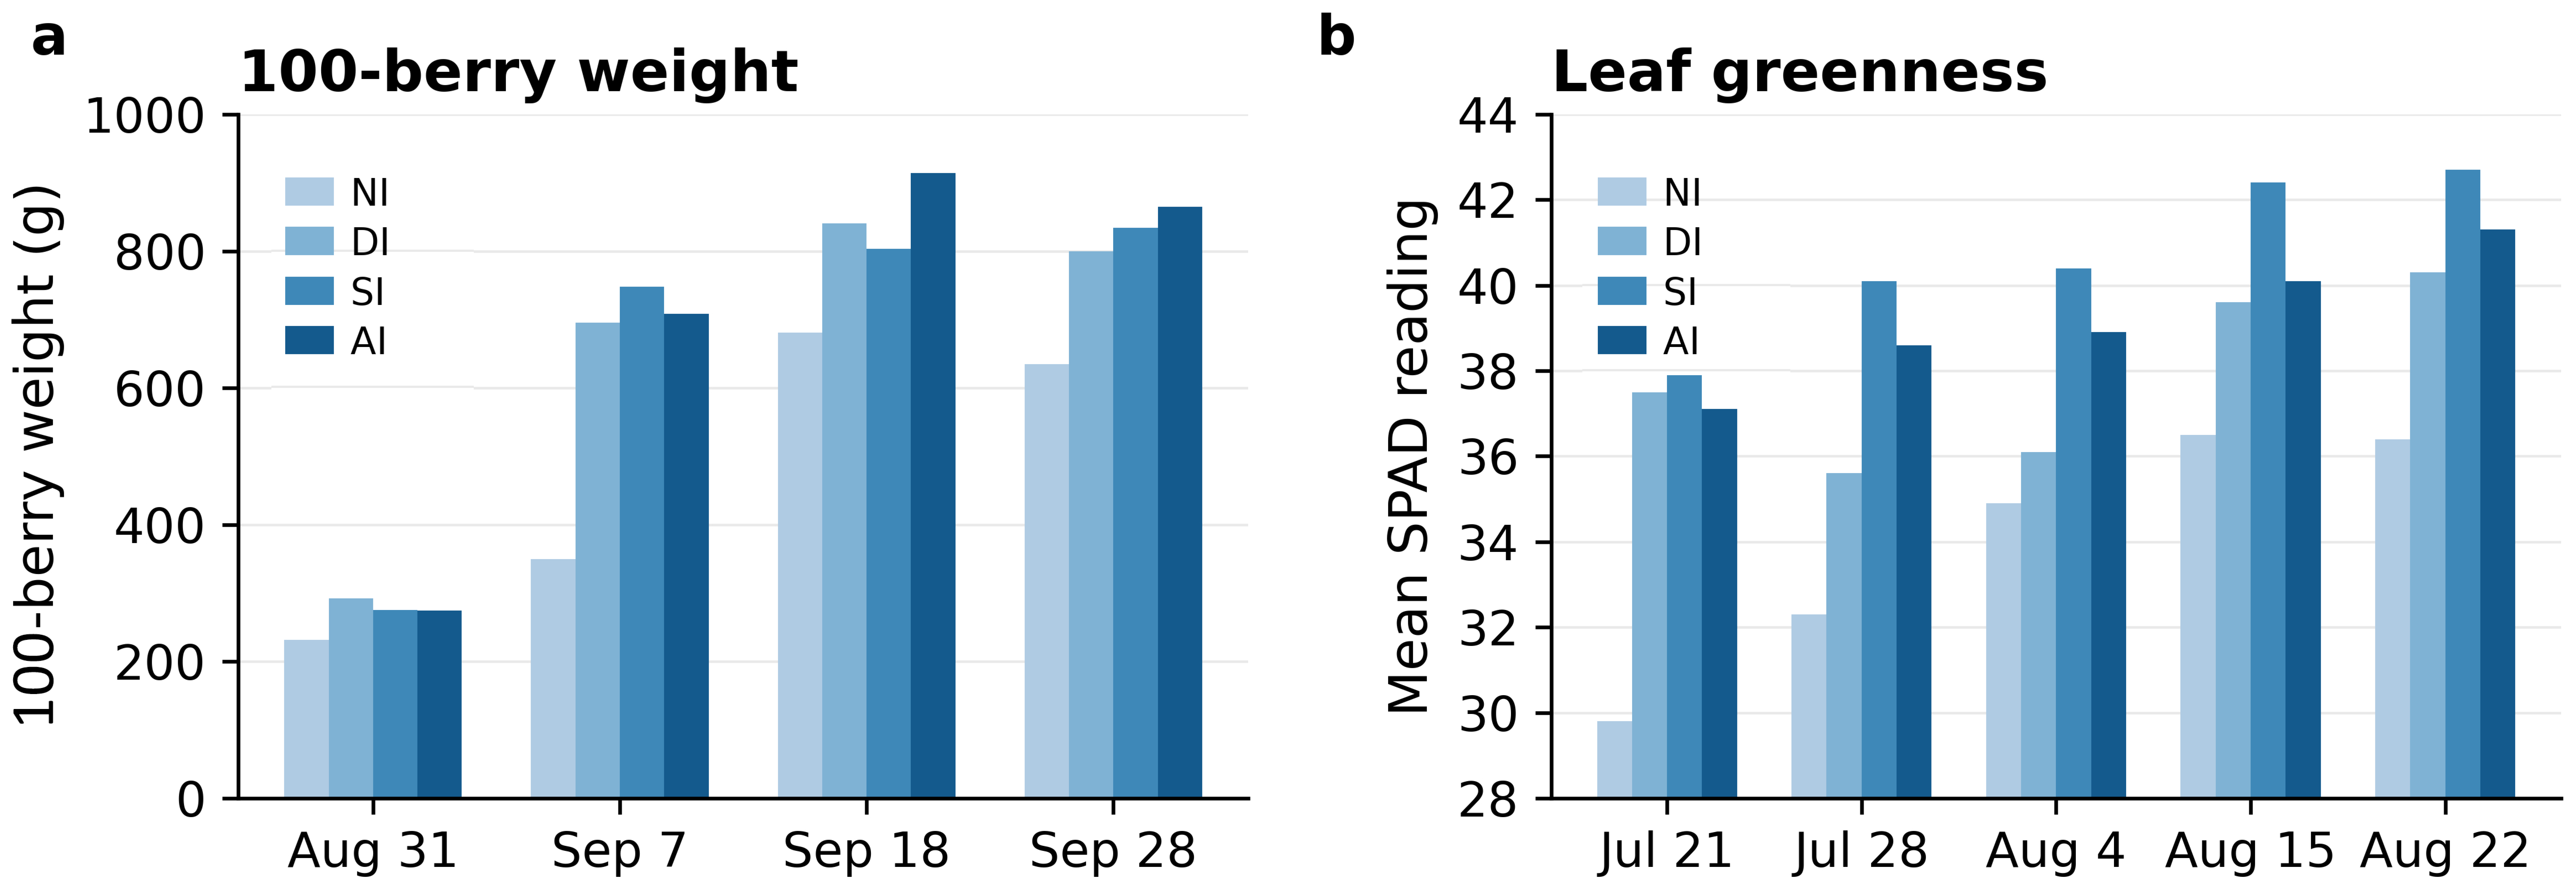
Figure 3 shows the 100-berry weight and mean SPAD readings. AI reached a final 100-berry weight of 864.49 g, approximately 1.4 times the NI value and 1.1 times the DI value in the retained treatment-level records. SPAD is reported as an instrument index value and is not interpreted as a quantitative chlorophyll concentration. The yield is reported per experimental unit, with a derived per-vine equivalent provided for reader comparison (Table 2). AI had the highest treatment mean yield and IWP among the irrigated treatments under the tested schedule.
Figure 3.
(a) Temporal treatment means for 100-berry weight at four sampling dates; the final AI value is 864.49 g on 28 September. (b) Mean SPAD readings. SPAD readings are instrument index values and are not chlorophyll concentration measurements. No error bars or inferential statistics are shown.
Table 2.
Treatment mean yield, equivalent mean yield per vine, seasonal applied irrigation volume, and irrigation water productivity.
The mean SPAD readings varied across dates and treatments. SI had the highest or among the highest mean SPAD readings on several observation dates, whereas treatment ordering was not consistent throughout the observation period. These measurements are interpreted as relative leaf greenness observations rather than quantitative chlorophyll concentrations.
3.3. Berry Development and Fruit Quality
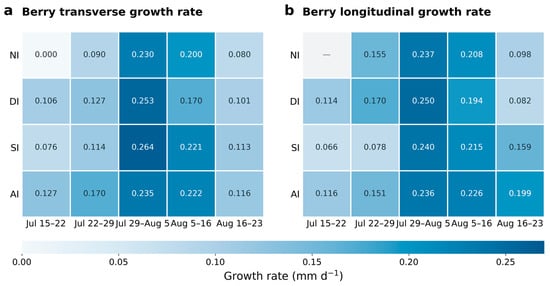
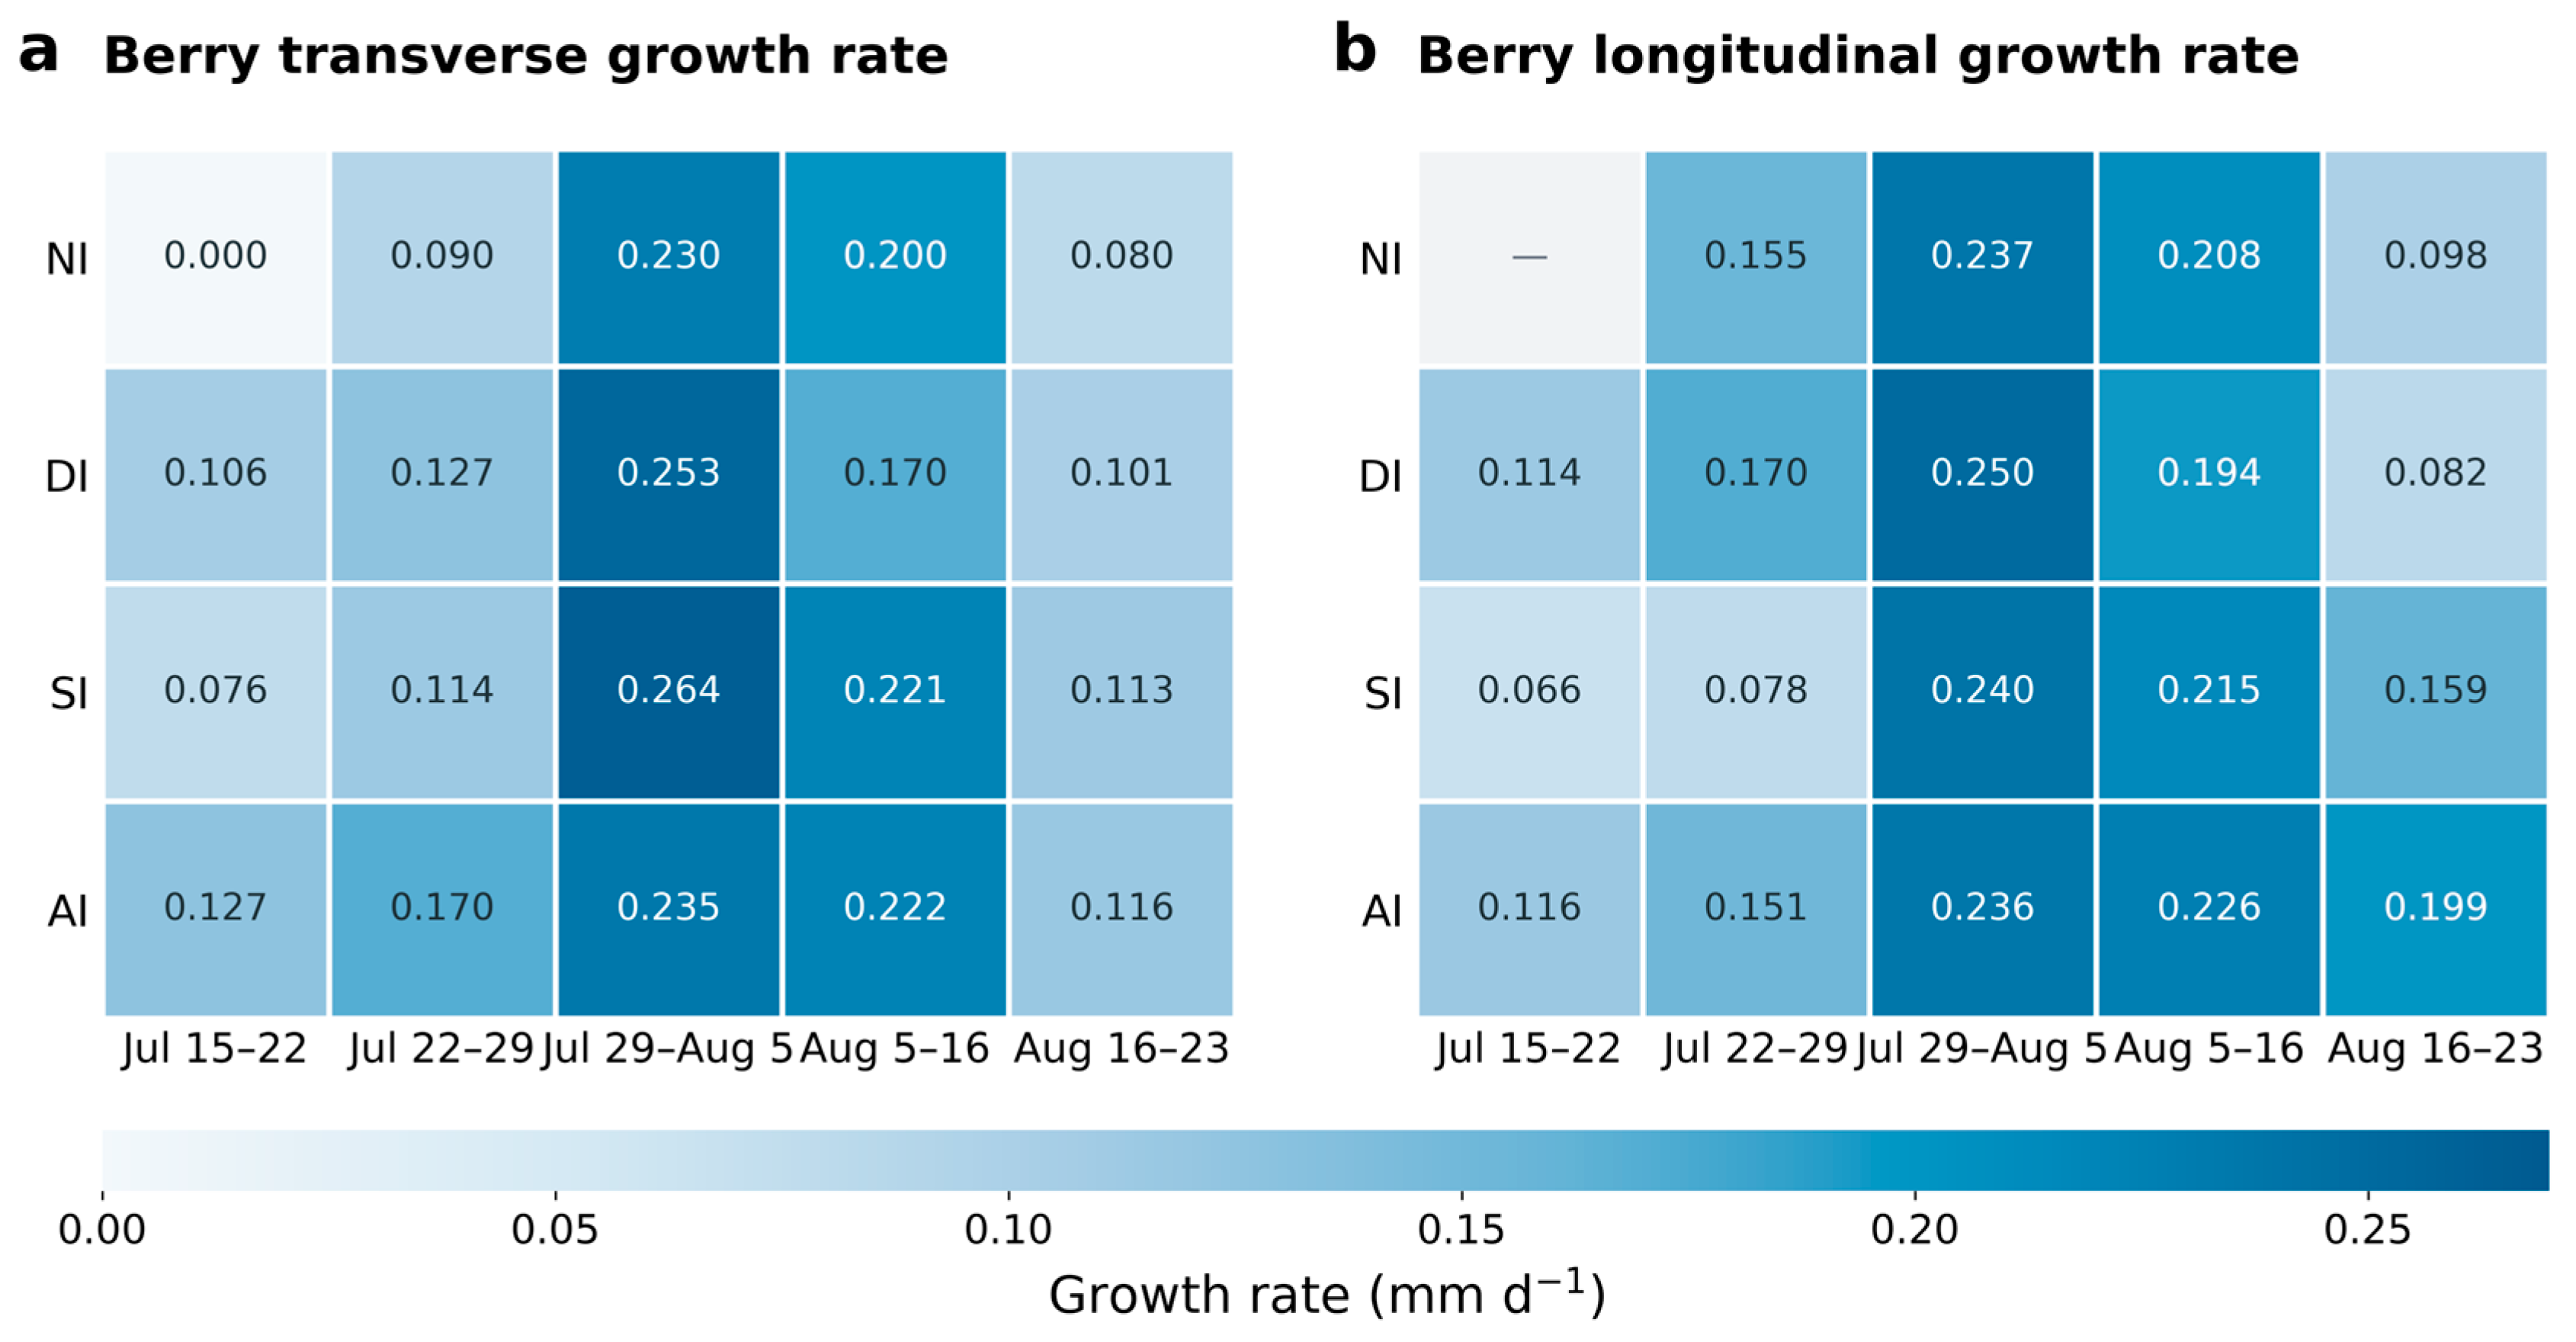
The berry transverse and longitudinal growth rates are shown in Figure 4 and expressed as mm d−1. SI transverse growth reached 0.2638 mm d−1 during 29 July–5 August and 0.1135 mm d−1 during 16–23 August. SI longitudinal growth during 16–23 August was 0.1592 mm d−1. AI transverse growth during 22–29 July was 0.1697 mm d−1, and AI longitudinal growth during 16–23 August was 0.1991 mm d−1. Other fruit quality, proline, and anthocyanin observations are retained as treatment-level descriptive patterns.
Figure 4.
Berry transverse and longitudinal growth rates under four irrigation treatments, expressed as mm d−1. (a) Transverse growth rate and (b) longitudinal growth rate. Cell shading encodes growth rate magnitude and numerical values are shown within cells; an em dash denotes an unavailable retained observation. No error bars or inferential statistics are shown.
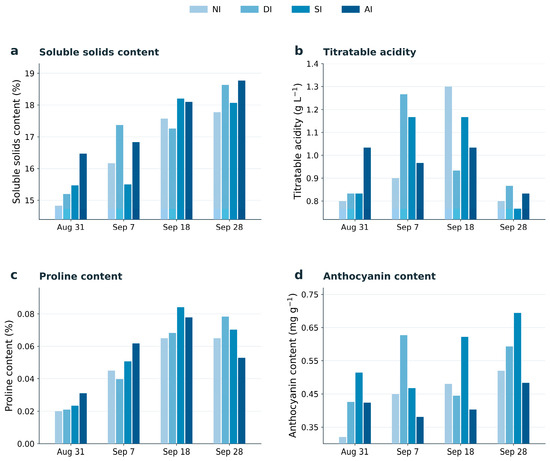
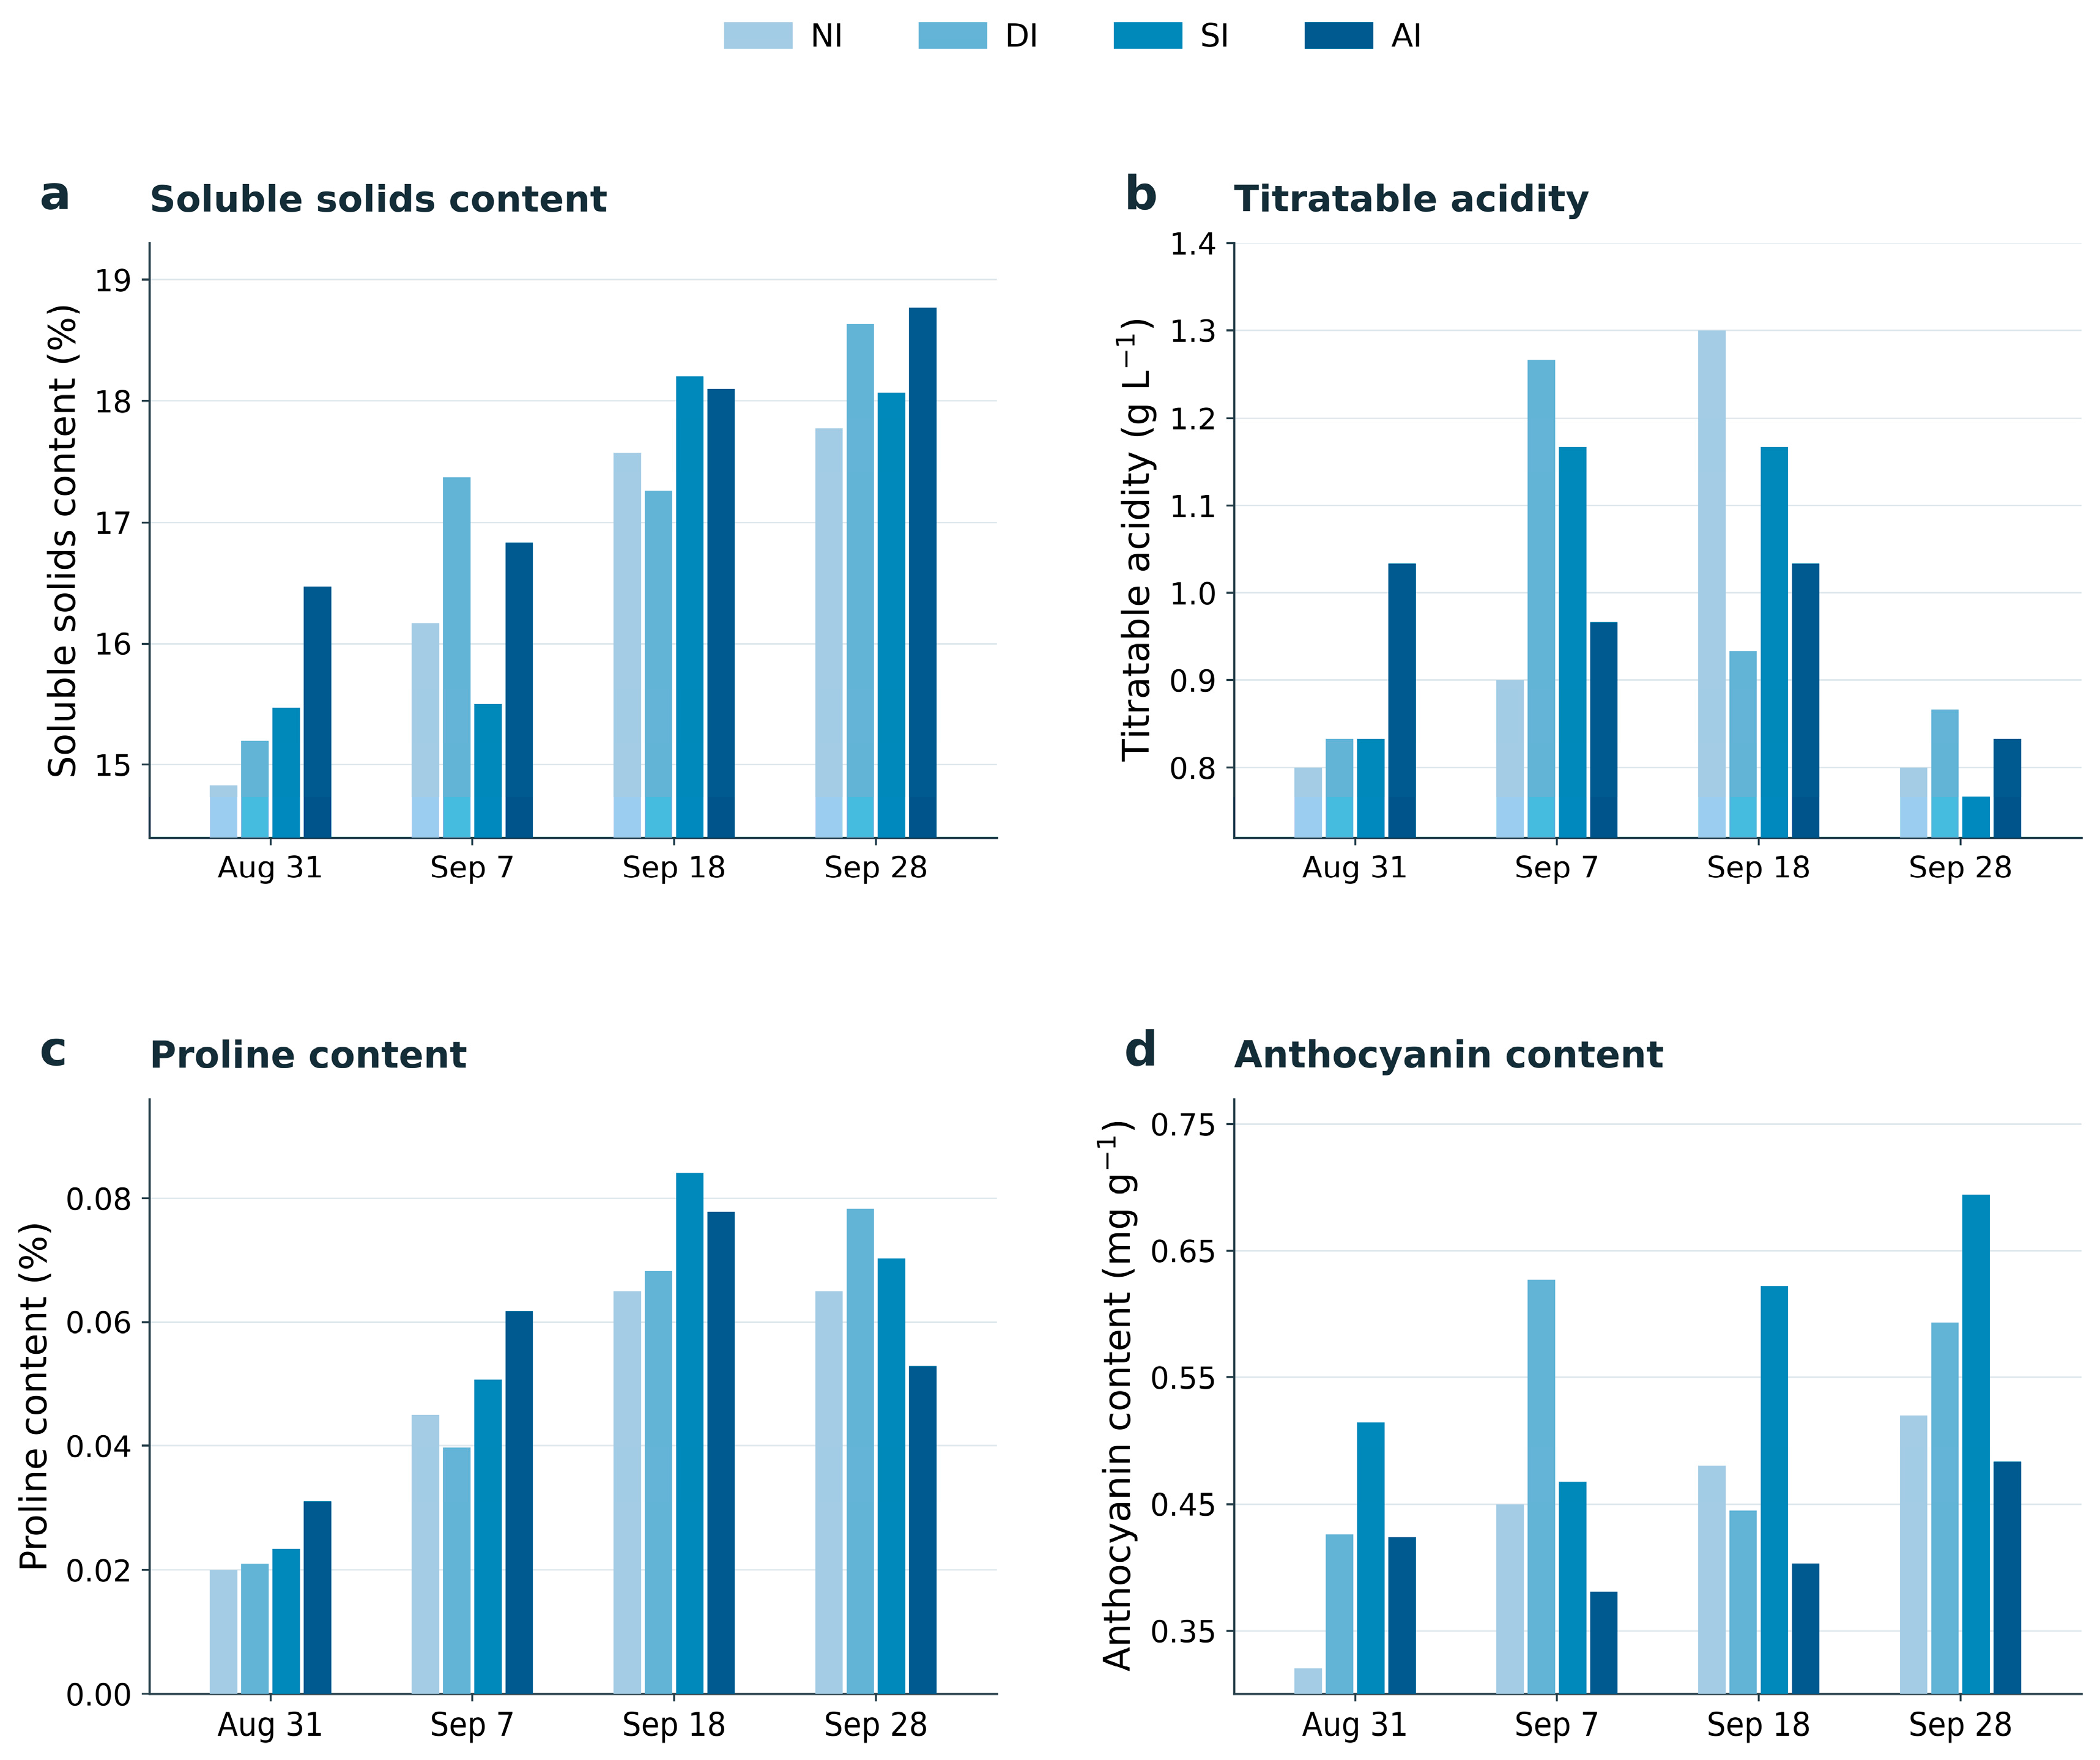
For fruit quality observations, the final SSC reached 18.77% under AI. The NI titratable acidity reached 1.3 g L−1 on 18 September. Proline increased until 18 September and then declined under AI and SI; under NI it remained unchanged from 18 to 28 September, whereas under DI it increased slightly over the same late sampling interval. SI had the highest final anthocyanin content (0.695 mg g−1). These statements describe observed treatment-level patterns only. Figure 5 presents the grouped treatment-level means across the four sampling dates.
Figure 5.
Treatment-level fruit quality and biochemical observations over four sampling dates. (a) Soluble solids content; (b) titratable acidity; (c) proline content, reported on percentage scale used in retained historical record; and (d) anthocyanin content. Grouped bars show retained treatment-level means by date and do not represent independent experimental unit replicates. No error bars or inferential statistics are shown.
3.4. Integrated Evaluation
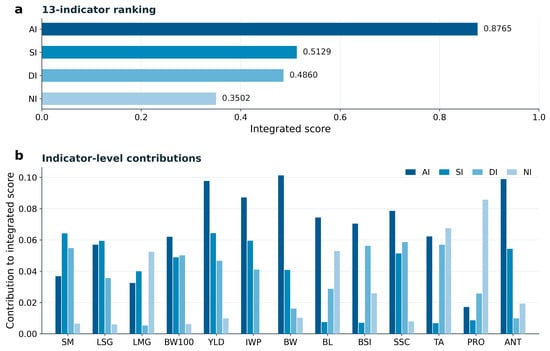
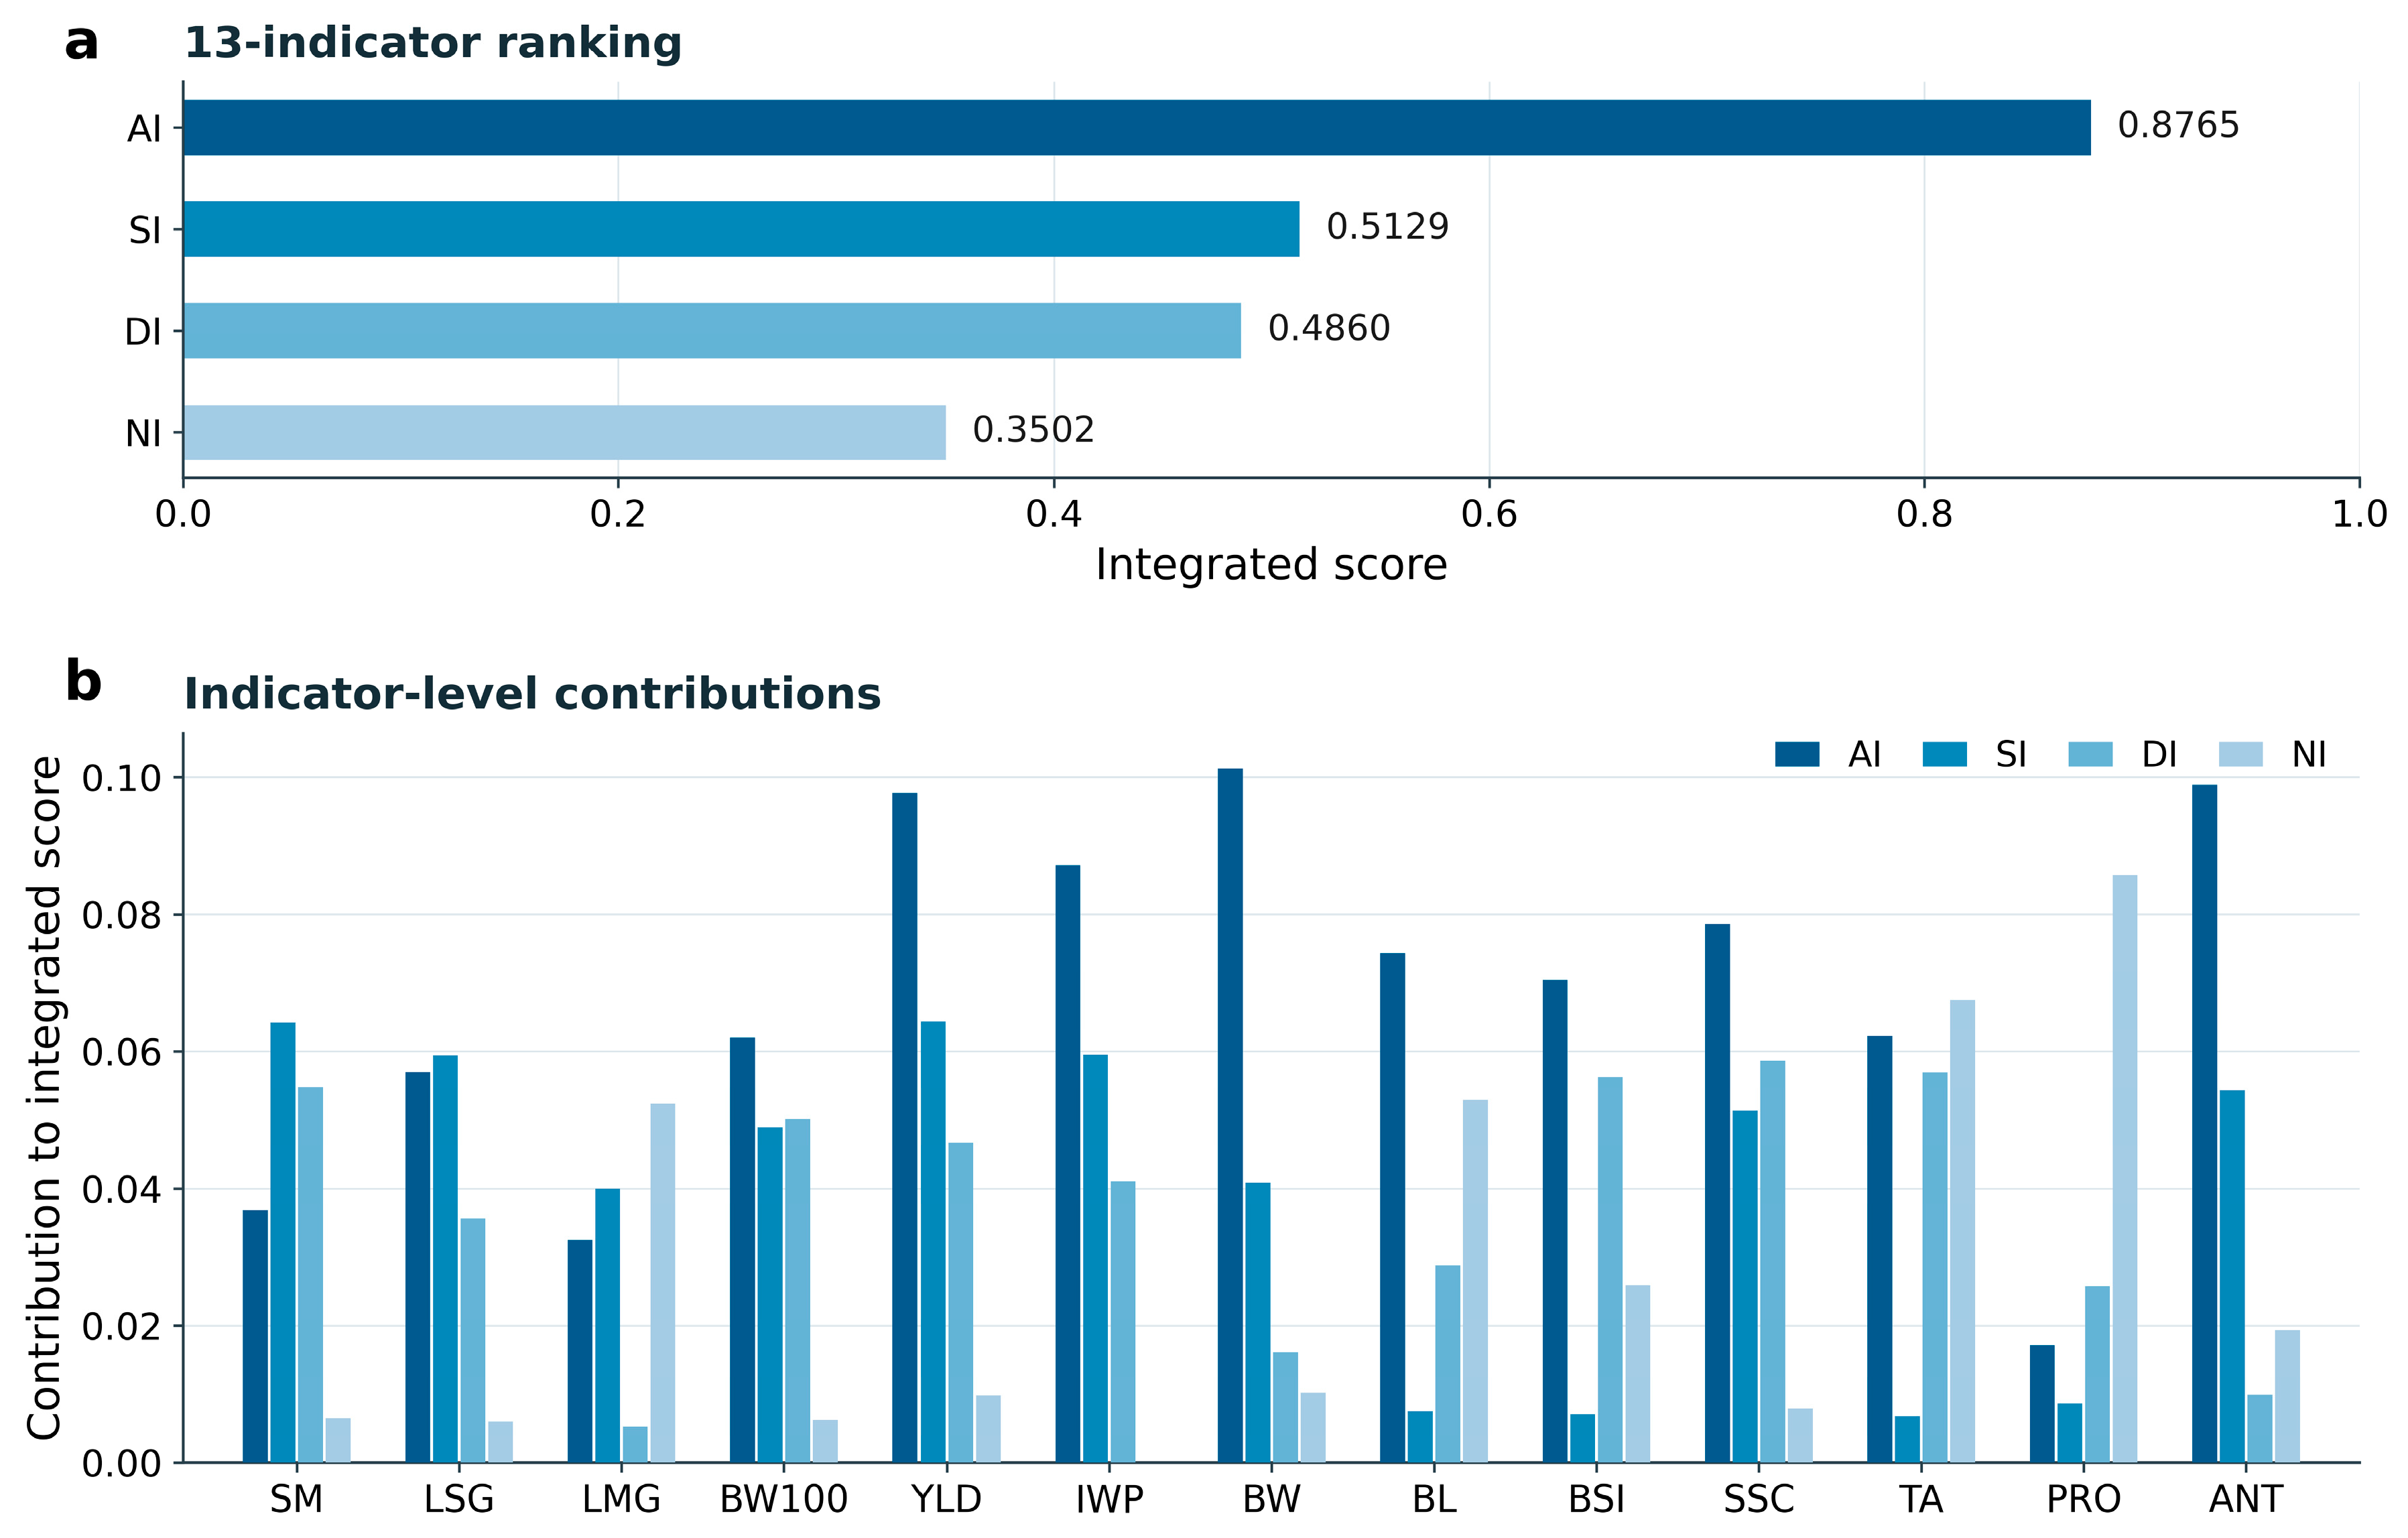
The final 13-indicator descriptive AHP–Entropy Weight evaluation ranked AI first (0.8765), followed by SI (0.5129), DI (0.4860), and NI (0.3502) (Figure 6). A sensitivity analysis using Candidate B produced the same treatment order (AI 0.8719 > SI 0.5418 > DI 0.4936 > NI 0.3354; Supplementary Table S2). AI did not rank first for every individual response. The scores are conditional on selected indicators and the weighting framework and are not statistical significance tests.
Figure 6.
Descriptive multi-criteria evaluation using the final 13-indicator framework. (a) Integrated treatment scores: AI = 0.8765, SI = 0.5129, DI = 0.4860, and NI = 0.3502. (b) Indicator-level contributions, grouped by indicator and colored by treatment. SPAD is not included in the final framework. This is not a statistical significance test and is conditional on the selected indicators and weighting scheme.
4. Discussion
4.1. Local Soil Moisture Persistence and Hydraulic Interpretation
The more gradual local moisture response under the capillary wick treatments is physically consistent with transport through a fibrous medium and redistribution at the wick–soil interface under unsaturated conditions. Capillary irrigation reviews and modeling studies emphasize that the configuration, wick properties, wick length, and reservoir water level can affect system behavior [17,18,19]. Negative-pressure studies likewise show that the supply responds to soil matric suction, imposed hydraulic boundaries, and emitter position [21,22,23,24]. Low-head porous emitter studies further demonstrate the importance of working head and soil context [25,27]. These systems provide useful engineering context but are not hydraulically equivalent to the fibrous wick configurations tested here. Within the soil–plant–atmosphere continuum, the soil matric potential is one component of the water potential gradient among the supply interface, local soil, plant, and atmosphere; the wick potential, root uptake, and hydraulic flux were not measured directly in this experiment.
The observed comparison is therefore limited to local moisture persistence at the monitored 10 cm position and configuration-level crop responses. Ring-shaped emitter and ceramic emitter studies indicate that the delivery geometry and operating head can influence wetting-zone development [26,27], while root-zone irrigation research shows that soil water–root coupling also depends on placement and soil context [8]. The sensor position relative to the release interface, wick contact area, hydraulic resistance, and soil properties may all have influenced the local readings. Although the site was historically described as sandy loam/light sierozem, the absence of plot-specific saturated hydraulic conductivity and a water-retention curve prevents the quantitative attribution of the observed moisture persistence to the soil texture. The present data do not quantify three-dimensional wetting, whole-root-zone wetting, or deep percolation.
4.2. Crop Growth, Berry Development, Yield, and Quality
The treatment responses were heterogeneous rather than showing universal AI dominance. Under the tested schedule, AI had the highest treatment mean yield, IWP, final 100-berry weight, and SSC, whereas individual physiological and fruit quality traits did not follow one common treatment order. Studies of subsurface, direct root-zone, and managed drip irrigation show that delivery strategy can affect soil water–root coupling, root distribution, yield, and crop water productivity [1,5,8,9,10]. Recent grapevine studies also demonstrate that the phenology, deficit intensity, rootstock, and precipitation context influence vine water status, yield, and berry composition [3,4,11,12]. The timing of water limitation can create additional trade-offs involving acidity, anthocyanin accumulation, and other quality attributes [13,14,15]. The observed patterns are therefore consistent with context-dependent treatment trade-offs rather than universal superiority; the present experiment did not measure the physiological mechanisms needed for causal attribution.
4.3. Integrated Ranking and Sensitivity
The final 13-indicator framework excluded the unvalidated historical chlorophyll-derived variable, while the mean SPAD readings were retained for a sensitivity analysis (Supplementary Table S2). The sensitivity analysis retained the ranking of AI > SI > DI > NI. This ranking is descriptive and conditional on the selected indicators and weighting rule; it does not imply statistical superiority or that AI ranked first for every individual trait.
4.4. Wick Blockage, Maintenance, and Operational Feasibility
Emitter-clogging research shows that particulate and biological fouling can reduce the discharge and distribution uniformity in localized irrigation [32,33,34,35,36]. Although fibrous wick obstruction is not hydraulically identical to commercial drip emitter clogging, the observed algae and sand accumulation identifies a comparable operational reliability concern: progressive obstruction can make the release duration and uniformity less predictable. The removal, cleaning, and reinstallation of affected wicks added a maintenance requirement that should be considered alongside the low-energy delivery concept. Because no clean-baseline wick discharge was preserved, a retrospective numeric threshold cannot be established. Future field validation should calibrate a discharge ratio (q/q0) and inspection interval; until then, the deviation from a clean-baseline reservoir-emptying time together with visible fouling or interrupted transfer are practical qualitative indicators. Field-scale development should evaluate the filtration, anti-fouling wick materials or design, wick service life, inspection frequency, maintenance labor or cost, and calibrated hydraulic performance.
4.5. Scope, Limitations, and Future Validation
This was a single-site, single-season field comparison with three water supply units per treatment. The unit identity could not be reconstructed consistently for all variables, the field layout and randomization records were incomplete, and the local 10 cm monitoring did not represent the complete root zone. No discharge curves, deep percolation observations, spatial wetting measurements, or fully characterized AI/SI hydraulic properties were available. Future work should use randomized larger replication designs with unit-level hydraulic monitoring, multi-depth/multi-distance sensors, controlled wick length and contact area, and multi-year/multi-site validation.
5. Conclusions
This field study compared annular capillary wick irrigation, straight capillary wick irrigation, drip irrigation, and a rainfall-only control in a Red Globe vineyard under arid conditions. At the monitored 10 cm soil position, the capillary wick treatments generally showed a more persistent temporal soil moisture response than the comparatively rapid post-irrigation response observed under drip irrigation. During the fourth irrigation initiated on 24 August, DI completed water release by approximately 27 August, whereas most capillary wick units continued until approximately 30 August. The treatments showed different vegetative, berry development, and fruit quality response patterns rather than one consistent ranking across all variables.
Under the tested schedule, AI had the highest treatment mean yield (11.97 kg per experimental unit), IWP among the irrigated treatments (0.033 kg L−1), final 100-berry weight (864.49 g), and final soluble solids content (18.77%). In the final 13-indicator descriptive AHP–Entropy Weight evaluation, AI ranked first (0.8765), followed by SI (0.5129), DI (0.4860), and NI (0.3502). The same ordering was retained in the SPAD sensitivity analysis. These values are conditional on the selected indicators and do not represent statistical significance or universal superiority.
The results identify annular capillary wick irrigation as a field configuration warranting further engineering evaluation, but they do not establish a universal hydraulic advantage of annular wick geometry. Direct unit-level discharge, hydraulic head, multi-depth and multi-distance soil moisture, spatial wetting, and long-term maintenance measurements are required before broader generalizations can be made.
Supplementary Materials
The following supporting information can be downloaded at: https://www.mdpi.com/article/10.3390/agriengineering8090371/s1, Table S1, NASA POWER meteorological context for May–September 2017; Table S2, Sensitivity analysis of the integrated multi-criteria evaluation.
Author Contributions
Conceptualization, J.Z., Y.W. and Q.Z.; methodology, J.Z., Y.W. and Y.S.; formal analysis, J.Z. and Y.W.; investigation, Y.W. and Y.S.; data curation, J.Z., Y.W. and Y.S.; visualization, J.Z., Y.W. and T.Y.; writing—original draft preparation, J.Z., Y.W. and Y.S.; writing—review and editing, J.Z., Y.W., T.Y. and Q.Z.; supervision, Q.Z.; project administration, Q.Z. All authors have read and agreed to the published version of the manuscript.
Funding
This research was funded by the China Meteorological Administration Climate Change Special Project, grant number QBZJ202607, and the National Natural Science Foundation of China, grant numbers 31270748 and U25A20356.
Institutional Review Board Statement
Not applicable.
Informed Consent Statement
Not applicable.
Data Availability Statement
The retained source data supporting the revised figures and tables are available from the corresponding authors upon reasonable request. Because this study is based on a historical field experiment, some archived observations and experimental unit identifiers are no longer available in complete form.
Acknowledgments
The authors thank the field experiment team for their assistance with vineyard management and data collection.
Conflicts of Interest
The authors declare no conflicts of interest.
References
- Pisciotta, A.; Di Lorenzo, R.; Santalucia, G.; Barbagallo, M.G. Response of grapevine (Cabernet Sauvignon cv) to above ground and subsurface drip irrigation under arid conditions. Agric. Water Manag. 2018, 197, 122–131. [Google Scholar] [CrossRef] [Scilit]
- Mirás-Avalos, J.M.; Intrigliolo, D.S. Grape Composition under Abiotic Constrains: Water Stress and Salinity. Front. Plant Sci. 2017, 8, 851. [Google Scholar] [CrossRef] [Scilit] [PubMed]
- Chen, Y.; Chen, J.; Kang, J.; Du, T.; Ding, R.; Dai, Z.; Kong, J.; Li, Z.; Kang, S. Alleviating drought and heat stress: A root-canopy coordination irrigation strategy synergistically elevating grapevine yield, quality, and water productivity. Agric. For. Meteorol. 2026, 376, 110912. [Google Scholar] [CrossRef] [Scilit]
- Damásio, M.; Pinto, C.; Salguero, J.; Alarcón, M.V.; de Deus, J.; David, T.S.; Silvestre, J.; Carvalho, L.C.; Zarrouk, O. Molecular and hydraulic responses of grapevine to water status and phenology under long-term differential irrigation treatments. Agric. Water Manag. 2025, 318, 109708. [Google Scholar] [CrossRef] [Scilit]
- Ma, X.; Sanguinet, K.; Jacoby, P. Direct root-zone irrigation outperforms surface drip irrigation for grape yield and crop water use efficiency while restricting root growth. Agric. Water Manag. 2020, 231, 105993. [Google Scholar] [CrossRef] [Scilit]
- Schlank, R.; Kidman, C.M.; Gautam, D.; Jeffery, D.W.; Pagay, V. Data-driven irrigation scheduling increases the crop water use efficiency of Cabernet Sauvignon grapevines. Irrig. Sci. 2024, 42, 29–44. [Google Scholar] [CrossRef] [Scilit]
- Phogat, V.; Petrie, P.R.; Bonada, M.; Collins, C. Regional dynamics in evapotranspiration components, crop coefficients, and water productivity of vineyards. Agric. Water Manag. 2025, 322, 109955. [Google Scholar] [CrossRef] [Scilit]
- Sun, R.; Ma, J.; Sun, X.; Zheng, L.; Bai, S. Responses of soil water–root coupling and coupling effects on grapevines to irrigation methods in extremely arid region. Agric. Water Manag. 2024, 302, 108984. [Google Scholar] [CrossRef] [Scilit]
- Ma, X.; Han, F.; Wu, J.; Ma, Y.; Jacoby, P.W. Optimizing crop water productivity and altering root distribution of Chardonnay grapevine (Vitis vinifera L.) in a silt loam soil through direct root-zone deficit irrigation. Agric. Water Manag. 2023, 277, 108072. [Google Scholar] [CrossRef] [Scilit]
- Peng, X.; Chen, D.; Zhou, Z.; Zhen, J.; Xu, C.; Hu, X.; Wang, Y. Optimizing drip fertigation management to simultaneously improve the yield, water productivity and fertilizer agronomic utilization efficiency of grapes in different precipitation year patterns. Agric. Water Manag. 2024, 295, 108749. [Google Scholar] [CrossRef] [Scilit]
- Romero, P.; Botía, P.; Morote, E.; Navarro, J.M. Optimizing deficit irrigation in Monastrell vines grafted on rootstocks of different vigour under semi-arid conditions. Agric. Water Manag. 2024, 292, 108669. [Google Scholar] [CrossRef] [Scilit]
- Losciale, P.; Conti, L.; Seripierri, S.; Alba, V.; Mazzone, F.; Rustioni, L.; di Leo, G.; Tarricone, F.; Tarricone, L. Effect of different deficit irrigation regimes on vine performance, grape composition and wine quality of the ‘Primitivo’ variety under Mediterranean conditions. Irrig. Sci. 2024, 42, 877–890. [Google Scholar] [CrossRef] [Scilit]
- Caruso, G.; Palai, G.; Gucci, R.; D’Onofrio, C. The effect of regulated deficit irrigation on growth, yield, and berry quality of grapevines (cv. Sangiovese) grafted on rootstocks with different resistance to water deficit. Irrig. Sci. 2023, 41, 453–467. [Google Scholar] [CrossRef] [Scilit]
- Lavado, N.; Prieto, M.H.; Mancha, L.A.; Moreno, D.; Valdés, M.E.; Uriarte, D. Combined effect of crop forcing and reduced irrigation as techniques to delay the ripening and improve the quality of cv. Tempranillo (Vitis vinifera L.) berries in semi-arid climate conditions. Agric. Water Manag. 2023, 288, 108469. [Google Scholar] [CrossRef] [Scilit]
- El-Sayed, M.E.A.; Hammam, A.A.; Fayed, A.S.K.; Rebouh, N.Y.; Badr Eldin, R.M. Improving Water Use Efficiency, Yield, and Fruit Quality of Crimson Seedless Grapevines under Drought Stress. Horticulturae 2024, 10, 576. [Google Scholar] [CrossRef] [Scilit]
- Silva, S.P.; Valín, M.I.; Mendes, S.; Araujo-Paredes, C.; Cancela, J.J. Water productivity in Vitis vinifera L. cv. Alvarinho using dual crop coefficient approach. Agric. Water Manag. 2024, 303, 109027. [Google Scholar] [CrossRef] [Scilit]
- Semananda, N.P.K.; Ward, J.D.; Myers, B.R. A Semi-Systematic Review of Capillary Irrigation: The Benefits, Limitations, and Opportunities. Horticulturae 2018, 4, 23. [Google Scholar] [CrossRef] [Scilit]
- Roonjho, S.J.; Kamal, M.R.; Roonjho, A.R. Modeling capillary wick irrigation system for greenhouse crop production. Agric. Water Manag. 2022, 274, 107927. [Google Scholar] [CrossRef] [Scilit]
- Bin Zainal Abidin, M.S.; Shibusawa, S.; Ohaba, M.; Li, Q.; Khalid, M. Capillary flow responses in a soil–plant system for modified subsurface precision irrigation. Precis. Agric. 2014, 15, 17–30. [Google Scholar] [CrossRef] [Scilit][Green Version]
- Nalliah, V.; Sri Ranjan, R. Evaluation of a Capillary-Irrigation System for Better Yield and Quality of Hot Pepper (Capsicum annuum). Appl. Eng. Agric. 2010, 26, 807–816. [Google Scholar] [CrossRef] [Scilit]
- Yang, P.; Bai, J.; Yang, M.; Ma, E.; Yan, M.; Long, H.; Liu, J.; Li, L. Negative pressure irrigation for greenhouse crops in China: A review. Agric. Water Manag. 2022, 264, 107497. [Google Scholar] [CrossRef] [Scilit]
- Wang, J.; Long, H.; Huang, Y.; Wang, X.; Cai, B.; Liu, W. Effects of different irrigation management parameters on cumulative water supply under negative pressure irrigation. Agric. Water Manag. 2019, 224, 105743. [Google Scholar] [CrossRef] [Scilit]
- Li, S.; Jiao, L.; Wu, X.; Song, X.; Liu, X.; Gao, H.; Han, Z.; Lu, J.; Liang, G. Negative pressure irrigation as a potential technique for increasing vegetable yields and decreasing nitrous oxide emissions. Sci. Hortic. 2023, 318, 112125. [Google Scholar] [CrossRef] [Scilit]
- Wang, K.; Xu, J.; Wei, Q.; Chen, P.; Min, Z.; Wang, H. The potential for mitigating greenhouse gas emissions and minimizing yield losses using the negative pressure irrigation system. Sci. Hortic. 2024, 324, 112621. [Google Scholar] [CrossRef] [Scilit]
- Liu, X.; Han, M.; Zhang, L. A new subsurface ceramic emitter for smallholders without pumps: Design, hydraulic performance, and field application. Irrig. Sci. 2023, 41, 835–845. [Google Scholar] [CrossRef] [Scilit]
- Saefuddin, R.; Saito, H.; Šimůnek, J. Experimental and numerical evaluation of a ring-shaped emitter for subsurface irrigation. Agric. Water Manag. 2019, 211, 111–122. [Google Scholar] [CrossRef] [Scilit]
- Liu, X.; Zhang, L.; Zhang, C.; Sun, Y.; Yang, X. Optimization algorithm for determining working water head of subsurface irrigation with ceramic emitters based on soil wetting patterns. Comput. Electron. Agric. 2023, 212, 108069. [Google Scholar] [CrossRef] [Scilit]
- Sun, Y.; Xi, B.; Dai, H. Effects of Water Stress on Resveratrol Accumulation and Synthesis in ‘Cabernet Sauvignon’ Grape Berries. Agronomy 2023, 13, 633. [Google Scholar] [CrossRef] [Scilit]
- Bates, L.S.; Waldren, R.P.; Teare, I.D. Rapid determination of free proline for water-stress studies. Plant Soil 1973, 39, 205–207. [Google Scholar] [CrossRef] [Scilit]
- Saaty, T.L. A scaling method for priorities in hierarchical structures. J. Math. Psychol. 1977, 15, 234–281. [Google Scholar] [CrossRef] [Scilit]
- Zou, Z.-H.; Yun, Y.; Sun, J.-N. Entropy method for determination of weight of evaluating indicators in fuzzy synthetic evaluation for water quality assessment. J. Environ. Sci. 2006, 18, 1020–1023. [Google Scholar] [CrossRef] [Scilit] [PubMed]
- Liu, H.; Huang, G. Laboratory experiment on drip emitter clogging with fresh water and treated sewage effluent. Agric. Water Manag. 2009, 96, 745–756. [Google Scholar] [CrossRef] [Scilit]
- Nakayama, F.S.; Bucks, D.A. Emitter Clogging Effects on Trickle Irrigation Uniformity. Trans. ASAE 1981, 24, 77–80. [Google Scholar] [CrossRef] [Scilit]
- Lv, C.; Niu, W.; Du, Y.; Sun, J.; Dong, A.; Wu, M.; Mu, F.; Zhu, J.; Siddique, K.H.M. A meta-analysis of labyrinth channel emitter clogging characteristics under Yellow River water drip tape irrigation. Agric. Water Manag. 2024, 291, 108634. [Google Scholar] [CrossRef] [Scilit]
- Petit, J.; García, S.M.; Molle, B.; Bendoula, R.; Ait-Mouheb, N. Methods for drip irrigation clogging detection, analysis and understanding: State of the art and perspectives. Agric. Water Manag. 2022, 272, 107873. [Google Scholar] [CrossRef] [Scilit]
- Gilboa, Y.; White, B.; Shlomo, I.; Linden, K.G.; Friedler, E. UV-LED irradiation for biofouling reduction in drip irrigation emitters fed with wastewater effluent. Environ. Sci. Water Res. Technol. 2024, 10, 2723–2735. [Google Scholar] [CrossRef] [Scilit]

Disclaimer/Publisher’s Note: The statements, opinions and data contained in all publications are solely those of the individual author(s) and contributor(s) and not of MDPI and/or the editor(s). MDPI and/or the editor(s) disclaim responsibility for any injury to people or property resulting from any ideas, methods, instructions or products referred to in the content. |
© 2026 by the authors. Licensee MDPI, Basel, Switzerland. This article is an open access article distributed under the terms and conditions of the Creative Commons Attribution (CC BY) license.