


Abstract
The cleaning system of combine harvesters is an important component whose efficiency directly depends on the uniform distribution of the air velocity profile on the sieve surface. However, the experimental evaluation of the air flow rate is often limited by the high cost and the impossibility of simultaneous multi-point acquisition using commercial anemometers. This paper presents the design, development, and calibration of a low-cost anemometric sensor, based on an NTC thermistor, intended for aerodynamic optimization in the design and laboratory testing phase of cleaning systems. The proposed system replaces the need to use Wheatstone bridges by combining a constant current source, a 16-bit ADC converter, and an RC filter, allowing it to resolve fine voltage variations at low velocity. The algorithm integrates temperature compensation in the 3rd degree polynomial equation by simultaneously reading the environmental temperature using a digital sensor with an accuracy of ±0.1 °C. Experimental validation on the bench against the reference anemometer testo 405i showed excellent agreement (R2 = 0.998, mean bias = 0.017 m/s, and a maximum error of ±0.08 m/s), falling within the tolerance of the reference anemometer. By the ability to use multiple sensors and parallel acquisition in real time, the proposed solution offers an alternative for 2D/3D aerodynamic mapping of sieves under controlled laboratory conditions for the design of combine harvester cleaning systems.
1. Introduction
Minimizing agricultural losses is necessary for food security in the context of population growth, climate change, and shrinking arable land. To meet these challenges, modern agriculture adopts advanced technologies, sensors, and autonomous equipment. This transformation optimizes work in real time, increasing productivity, making resources more efficient and protecting the environment to guarantee food security [1,2,3,4,5].
Therefore, agriculture is at a critical point globally, undergoing continuous and accelerated change, characterized by climate change, labor shortages, diminishing water resources, and the need to achieve maximum production to feed the growing world population [6,7,8]. The implementation of advanced sensors in agriculture leads to reduced crop losses, management and optimization of agricultural operations, increased agricultural production, reduced energy consumption, and environmental impact [9,10,11,12].
In the evaluation of agricultural production, the losses at harvest are an important issue. Harvesting is a link in the crop technology with a significant impact on the quality and quantity of grains; therefore, it is considered that the harvest should be carried out in a short time and with the lowest possible losses [13,14,15].
Combine harvesters are the most complex machines used in agriculture because the work process includes several technological phases, such as cutting the plants; collecting and transporting them; threshing; separating the grains from the total mass of material; and cleaning and transporting the grains into the bunker for temporary storage [16,17,18].
Proper adjustment of the combine’s working parameters such as threshing speed, distance between the threshing drum and the concave meshed grill, opening positions of the sieve shutters, cleaning system fan speed, forward speed, and humidity (as an external factor) during harvesting are important factors in evaluating grain quality [19,20].
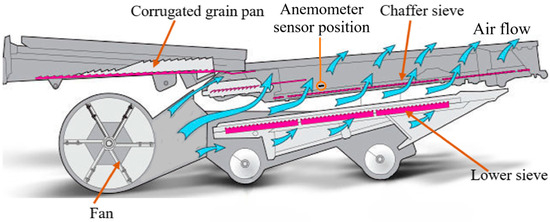
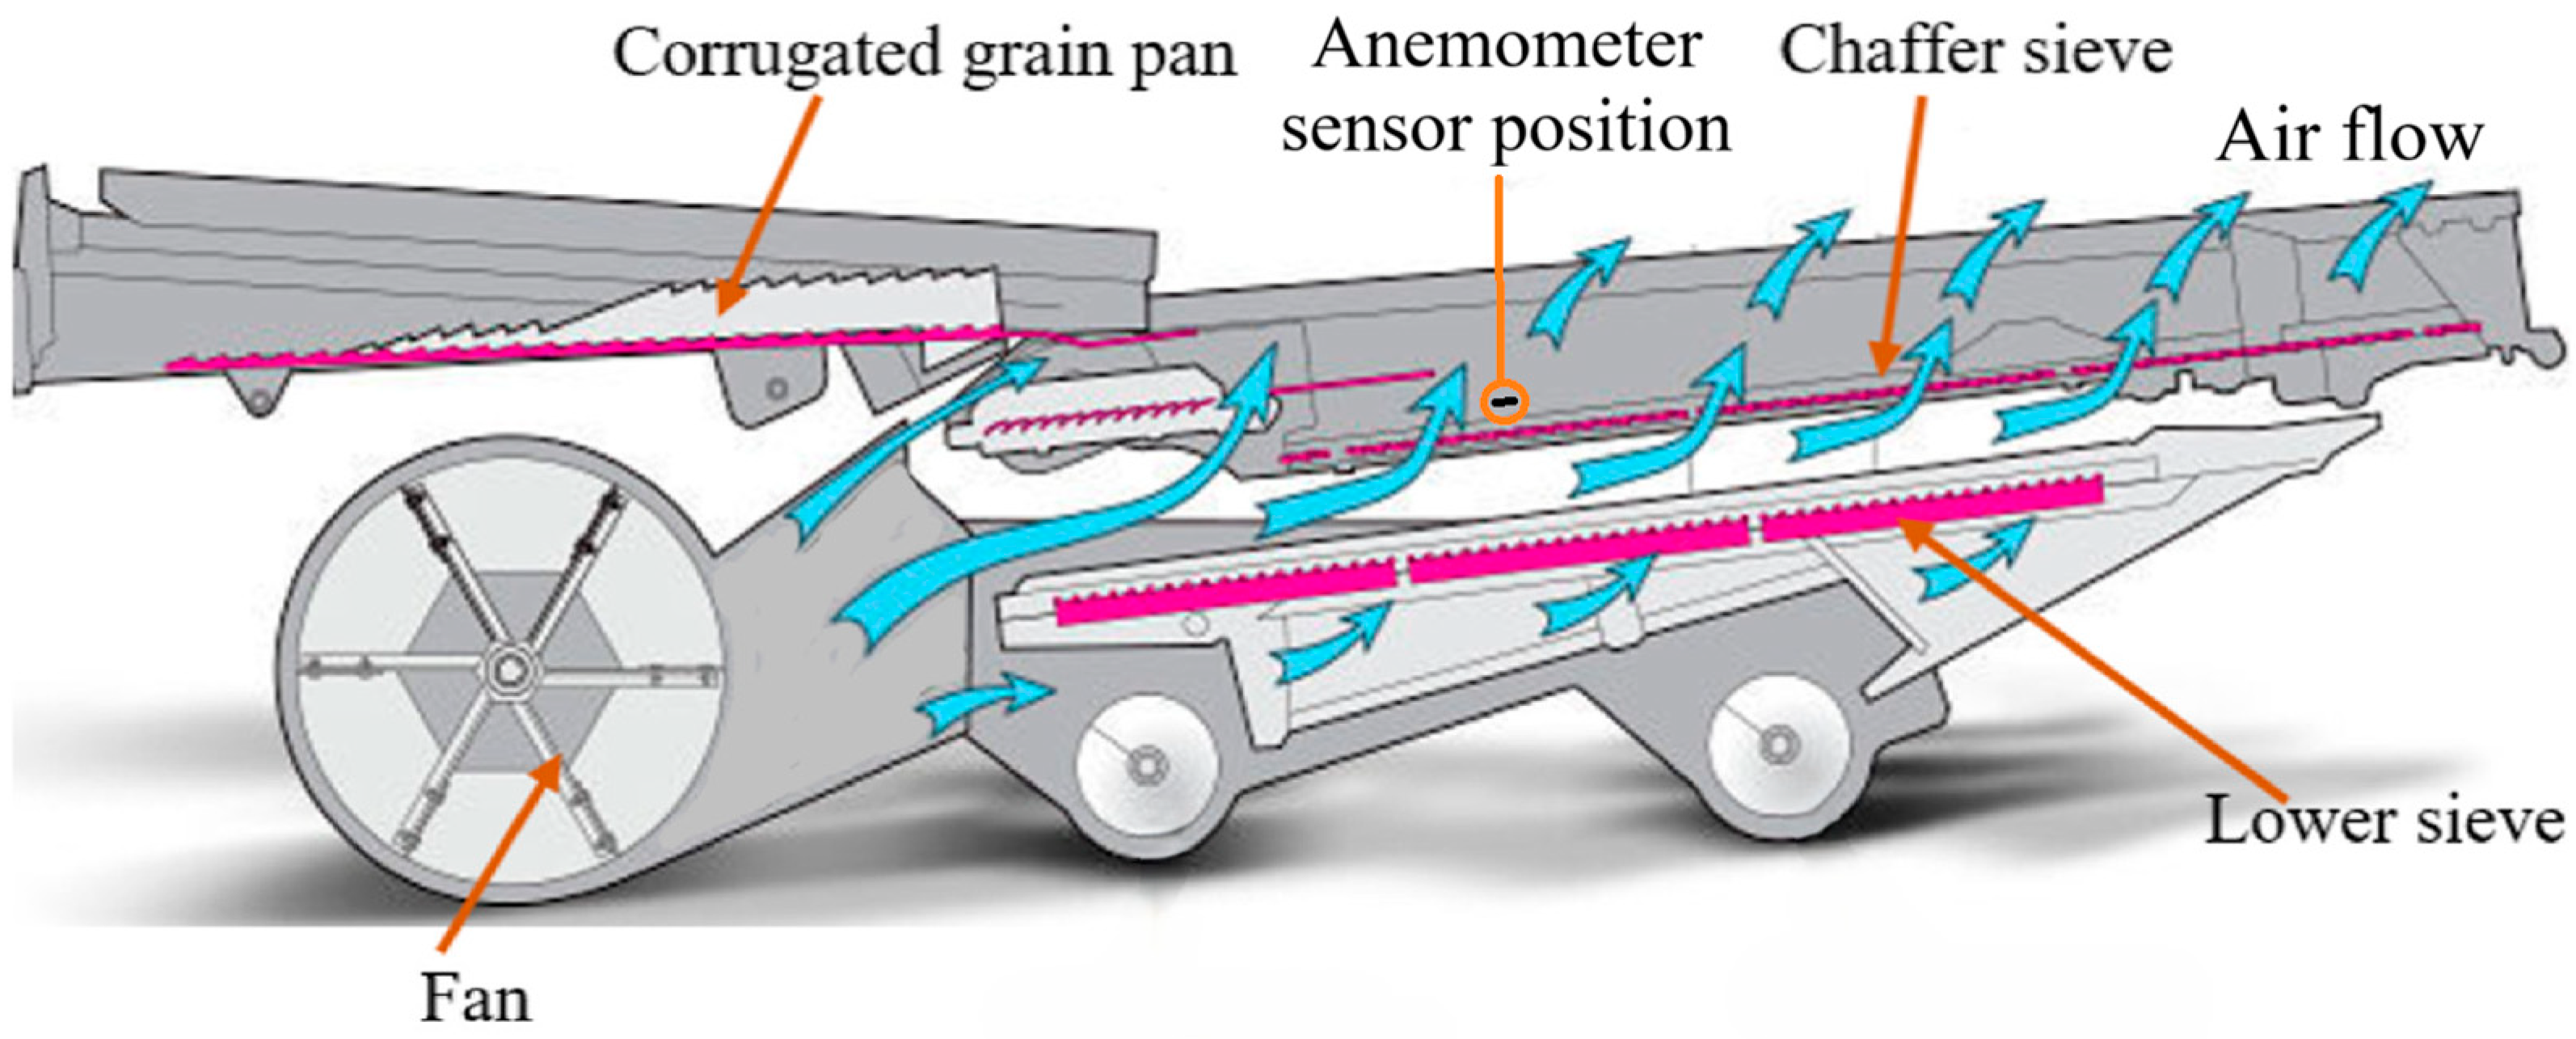
The performance of a combine harvester is conditioned by the optimization of the operation of its cleaning system, since a large part of the material (grains and MOG) passes through the cleaning system. The airflow, created by the fan of the combine cleaning system, is unevenly distributed on the surface of the upper sieve, which leads to significant grain losses [16,21,22,23,24].
There is a limited number of studies regarding the airflow velocity profile over the surfaces of the sieve of the combine harvester cleaning system, but to achieve this objective, it is necessary to develop a high-performance sensor (anemometer), thus enabling the continuous measurement of the airflow velocity [25,26,27,28].
Worldwide, there are several methods used to measure the airflow velocity: with hot wire anemometers, with (mechanical) vanes, with ultrasound, by measuring differential pressure, etc. [29,30]. Evaluation of the air flow velocity using a hot wire anemometer is the most widely used method, especially for low air velocities (<1 m/s). These anemometers are based on the heat transfer that occurs between the anemometer sensor and the surrounding air [31,32].
Given the small size of the sensor used in the construction of hot-wire anemometers, they can detect the small variations in air velocity. One of the main disadvantages of using hot-wire anemometers is the need for temperature compensation, as they are sensitive to temperature variations [33,34,35]. Temperature compensation of a hot-wire anemometer during the determination of air velocity is important because any temperature variation leads to a change in air velocity values [33,34,36,37].
Anemometer calibration is a laborious process that involves the use of a calibration test bed through which the air velocity is varied while maintaining precise control of the environment temperature [38,39].
During the operation of the anemometer, distortions may occur that would lead to errors in the determinations of the air flow velocity; in order to eliminate these distortions, a low-pass filter is used [40].
This paper presents the construction and calibration of an anemometric sensor, based on an NTC thermistor, which is necessary to measure the airflow velocity at the level of the sieve surfaces of the cleaning system of combine harvesters when these are tested in order to optimize the airflow according to the aerodynamic characteristics of various grains specific to various species of agricultural crops that are to be harvested, but only when the harvesting machines are not in operation and there are no materials on the sieve surface (grains and MOG) by driving only the fan of the cleaning system, or it can be used in laboratory stands where the working process of the cleaning systems of seed cleaning and conditioning machines is studied when the anemometric sensor determines the airflow velocity profile created by the fan at the level of the cleaning sieves. In principle, a thermistor is used to determine the temperature; this is achieved due to the variation of electrical resistance with temperature. To measure air velocity, the temperature of the NTC is raised by supplying it with electricity at a constant current. Once the sensor is brought to the desired temperature, the variation in voltage that appears at its terminals due to the air flowing over the NTC depends on the air velocity. The calibration was carried out in a wind tunnel for an airflow velocity between 0 and 4.5 m/s.
Unlike commercial anemometers (which are financially expensive and can determine the air flow velocity at a single point), the novelty of this work consists in the design and development of a calibrated, low-cost anemometer sensor intended for multi-point mapping of the air flow on the surface of the screen of the combine harvester cleaning system.
The scientific contributions of this study are multiple. First, a generalizable thermal compensation model for NTC thermistor anemometry at very low air velocities (0–4.5 m/s) is introduced, in which both the slope and the intercept of the correction function vary linearly with the thermal gradient ΔT between the sensor and the ambient air (Equation (10))—a reproducible calibration methodology, applicable beyond the specific sensor built in this study. Second, the multi-point acquisition capability allows, for the first time at this spatial resolution, a quantitative characterization of the non-uniform distribution of airflow velocity on the cleaning screen surface, providing empirical data on flow heterogeneity, difficult to obtain with commercial single-point anemometers. Third, the study establishes a statistical validation protocol (paired t-test, Bland-Altman agreement analysis, coefficient of variation) that can serve as a methodological template for validating other low-cost IoT sensors developed for precision agriculture applications, independent of the measurement variable involved. Moreover, it should be emphasized that the anemometer was developed using low-cost electronic components (NTC-type thermistor, Arduino Uno board, TMP117 temperature sensor board, ADS1115 analog—digital convertor and LM 317 integrated circuit in a constant current source configuration). The temperature compensation of the readings provided by the proprietary hardware is based on a mathematical protocol that is implemented in the MS Excel environment (which is largely used by students, engineers, scientists, farmers, etc.), thus avoiding the need for any other sophisticated and expensive software. The validity of the data provided by the proposed system was statistically confirmed using the Bland-Altman t-test procedure, which proved the almost perfect agreement with the data provided by the commercial Testo 405i anemometer.
2. Materials and Methods
Common thermal anemometers usually use a Wheatstone bridge configuration to detect the resistance variations of the sensitive element. In this paper, this variant was optimized by replacing the passive bridge with a constant current source based on the LM317 integrated circuit, connected to a 16-bit analog-to-digital converter (ADS1115) and a passive analog RC filter (fc = 16 Hz). This configuration allows the acquisition and processing of voltage signals in the millivolt range specific to the very low velocity range (up to 1 m/s), a range in which mechanical propeller anemometers become inoperable due to friction in the bearings. The processing of the signal received from the sensor is ensured at the software level, where the algorithm dynamically adjusts the coefficients of the 3rd-degree polynomial equation based on the ambient temperature read in real time by the TMP117 sensor (with an accuracy of ±0.1 °C), ensuring highly accurate thermal compensation.
The NTC (Negative Temperature Coefficient) type thermistor operates based on the principle that its electrical resistance decreases as its temperature increases. Thus, temperature may be obtained by measuring the electrical resistance [41].
Heating of the thermistor is achieved due to the Joule effect; when air flows over the heated NTC, the thermistor is cooled and its electrical resistance changes. Assuming a constant intensity of the electric current, the voltage drops over the NTC will depend only on its resistance and will be directly related to the air flow velocity.
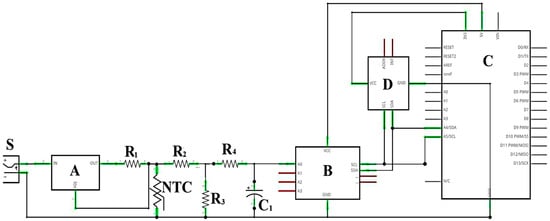
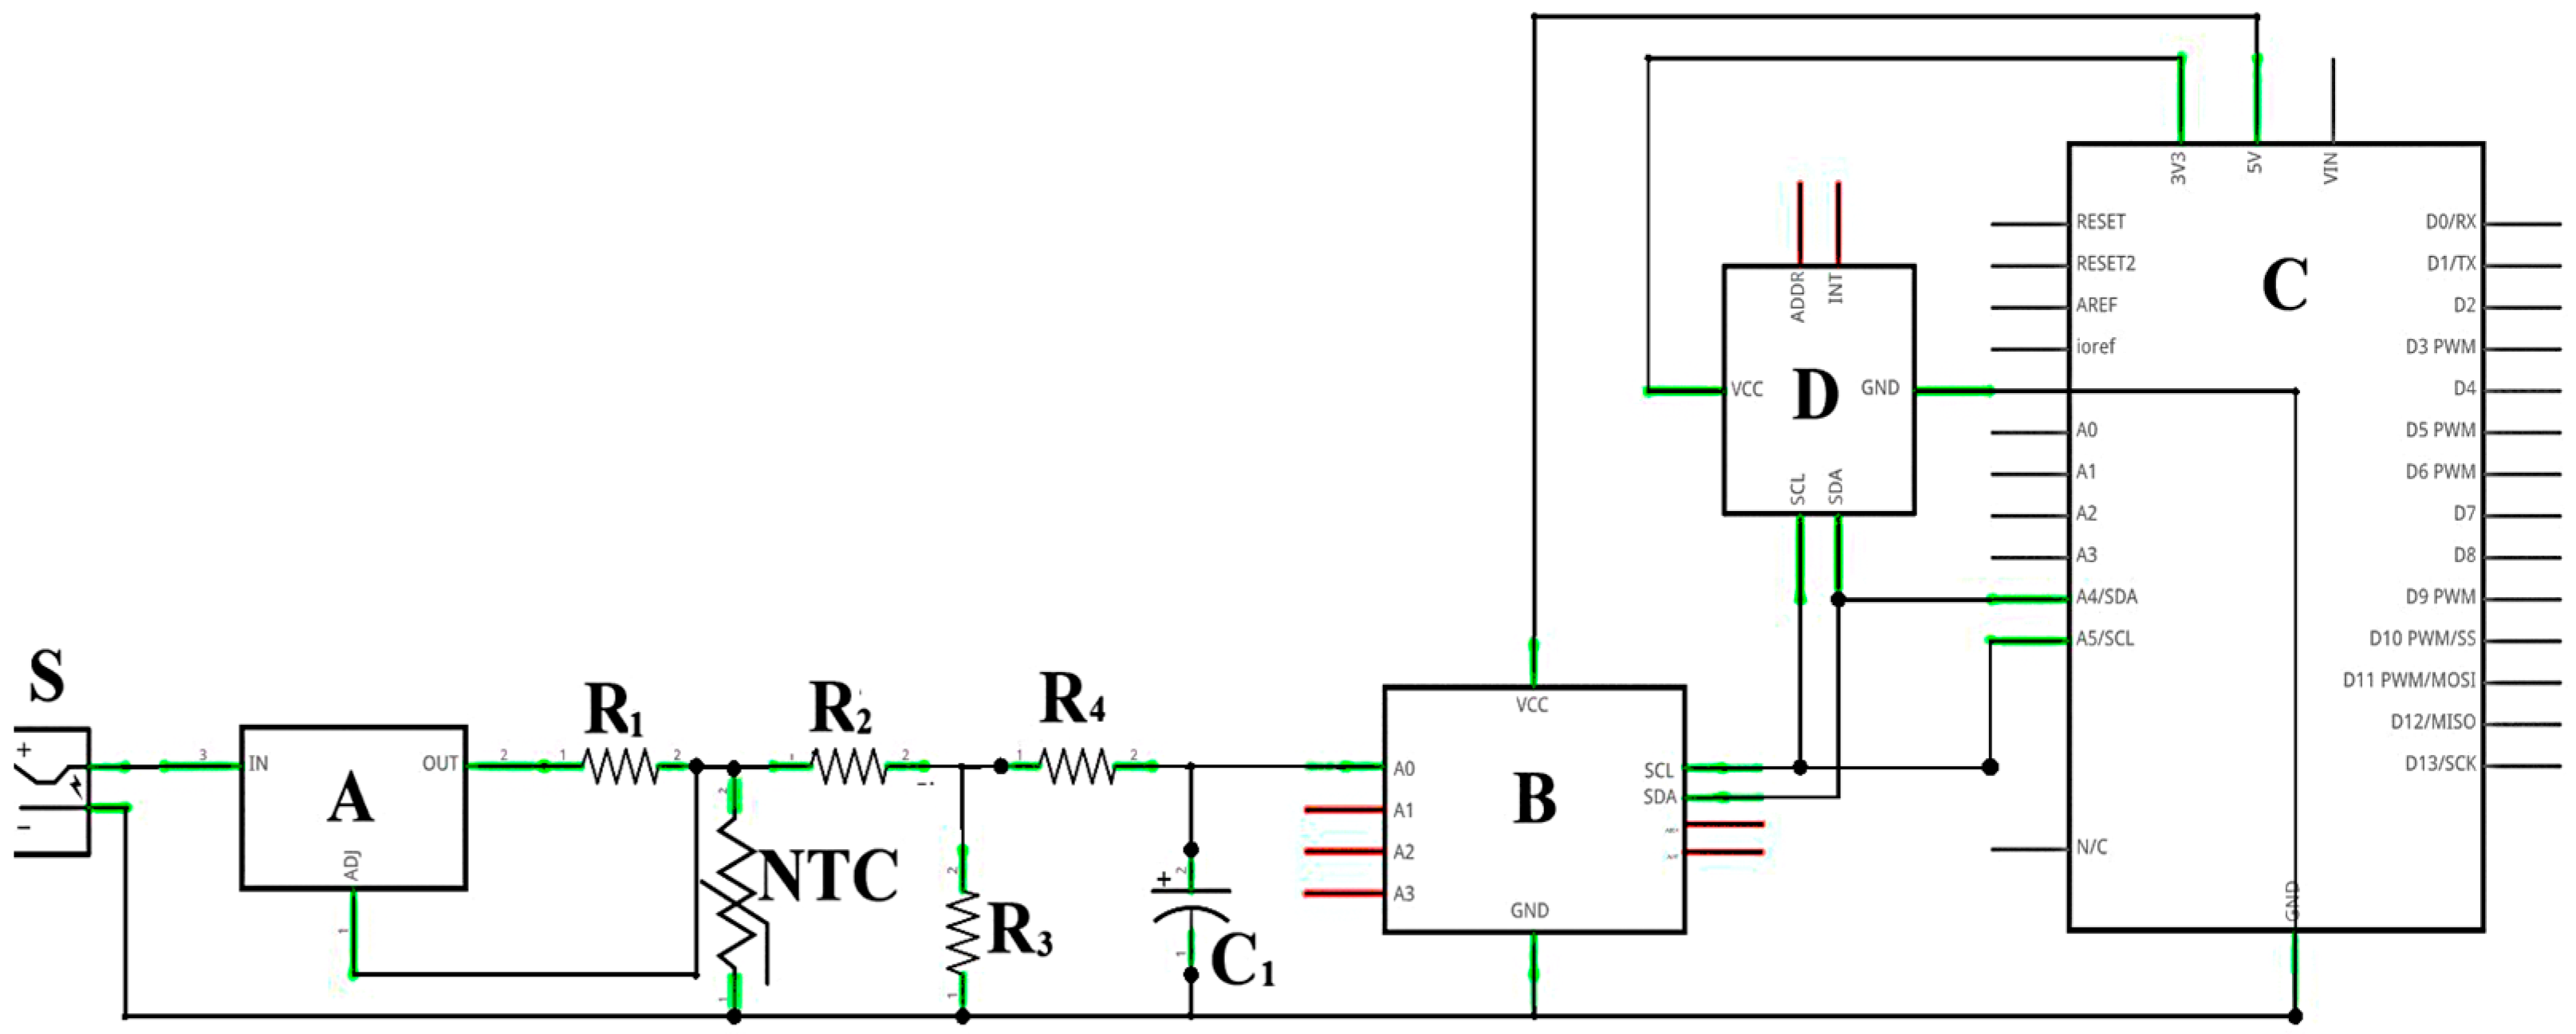
In order to build the anemometer, an NTC thermistor, type TTDO-10KC3-14 TewaTemperature Sensors Ltd. Lublin, Poland was used; according to the manufacturer data, its precision is ±0.2 °C for a temperature range between −40 °C and 250 °C. The LM317 voltage regulator was used in order to obtain a constant current source (Figure 1) (https://www.electronicecircuits.com/electronic-circuits/lm317-constant-current-calculator/ (accessed on 3 June 2025)).
Figure 1.
Schematic of the NTC anemometer setup. S—power source; A—constant current source based on the LM317 I.C.; B—ADS1115 analog-digital converter; C—Arduino UNO board; D—TMP117 temperature sensor; R1 = 56 Ω, R2 = 40 kΩ, R3 = 10 kΩ, R4 = 1 kΩ; C1 = 10 µF.
The operating temperature of the NTC was similar to the temperature of the testo 405i anemometer; a testo 883-2 thermal imaging camera was used to determine the temperature of the NTC sensor and the anemometer. After these measurements, it was concluded that the actual operating temperature was 85 °C.
The electrical resistance of the thermistor at 85 °C was calculated using the resistance-temperature relationship from the NTC datasheet:
where is the NTC resistance at temperature (°C), is the NTC resistance at 25 °C, (from the thermistor datasheet).
The sensor supply voltage was 24 volts and was provided by the stabilized source S (Figure 1). The supply voltage was chosen aiming to obtain the shortest possible heating time of the sensor without damaging it. The heating time was considered to be the time required for the anemometric sensor to reach the operating temperature of 85 °C starting from the ambient temperature.
Knowing the resistance of the NTC at a temperature of 85 °C (1070 Ω) and its supply voltage, the intensity of the current passing through the NTC was determined (Equation (2)).
where (A) is the current intensity and (V) is the supply voltage.
When using the LM 317 voltage stabilizer as a constant current source, the value of the resistance R1 was calculated using the relation (Equation (3)) (Ibid):
where is the reference voltage of the LM317 integrated circuit and is the constant current.
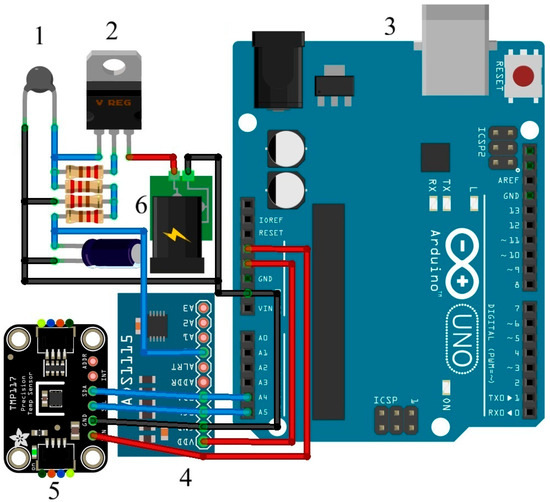
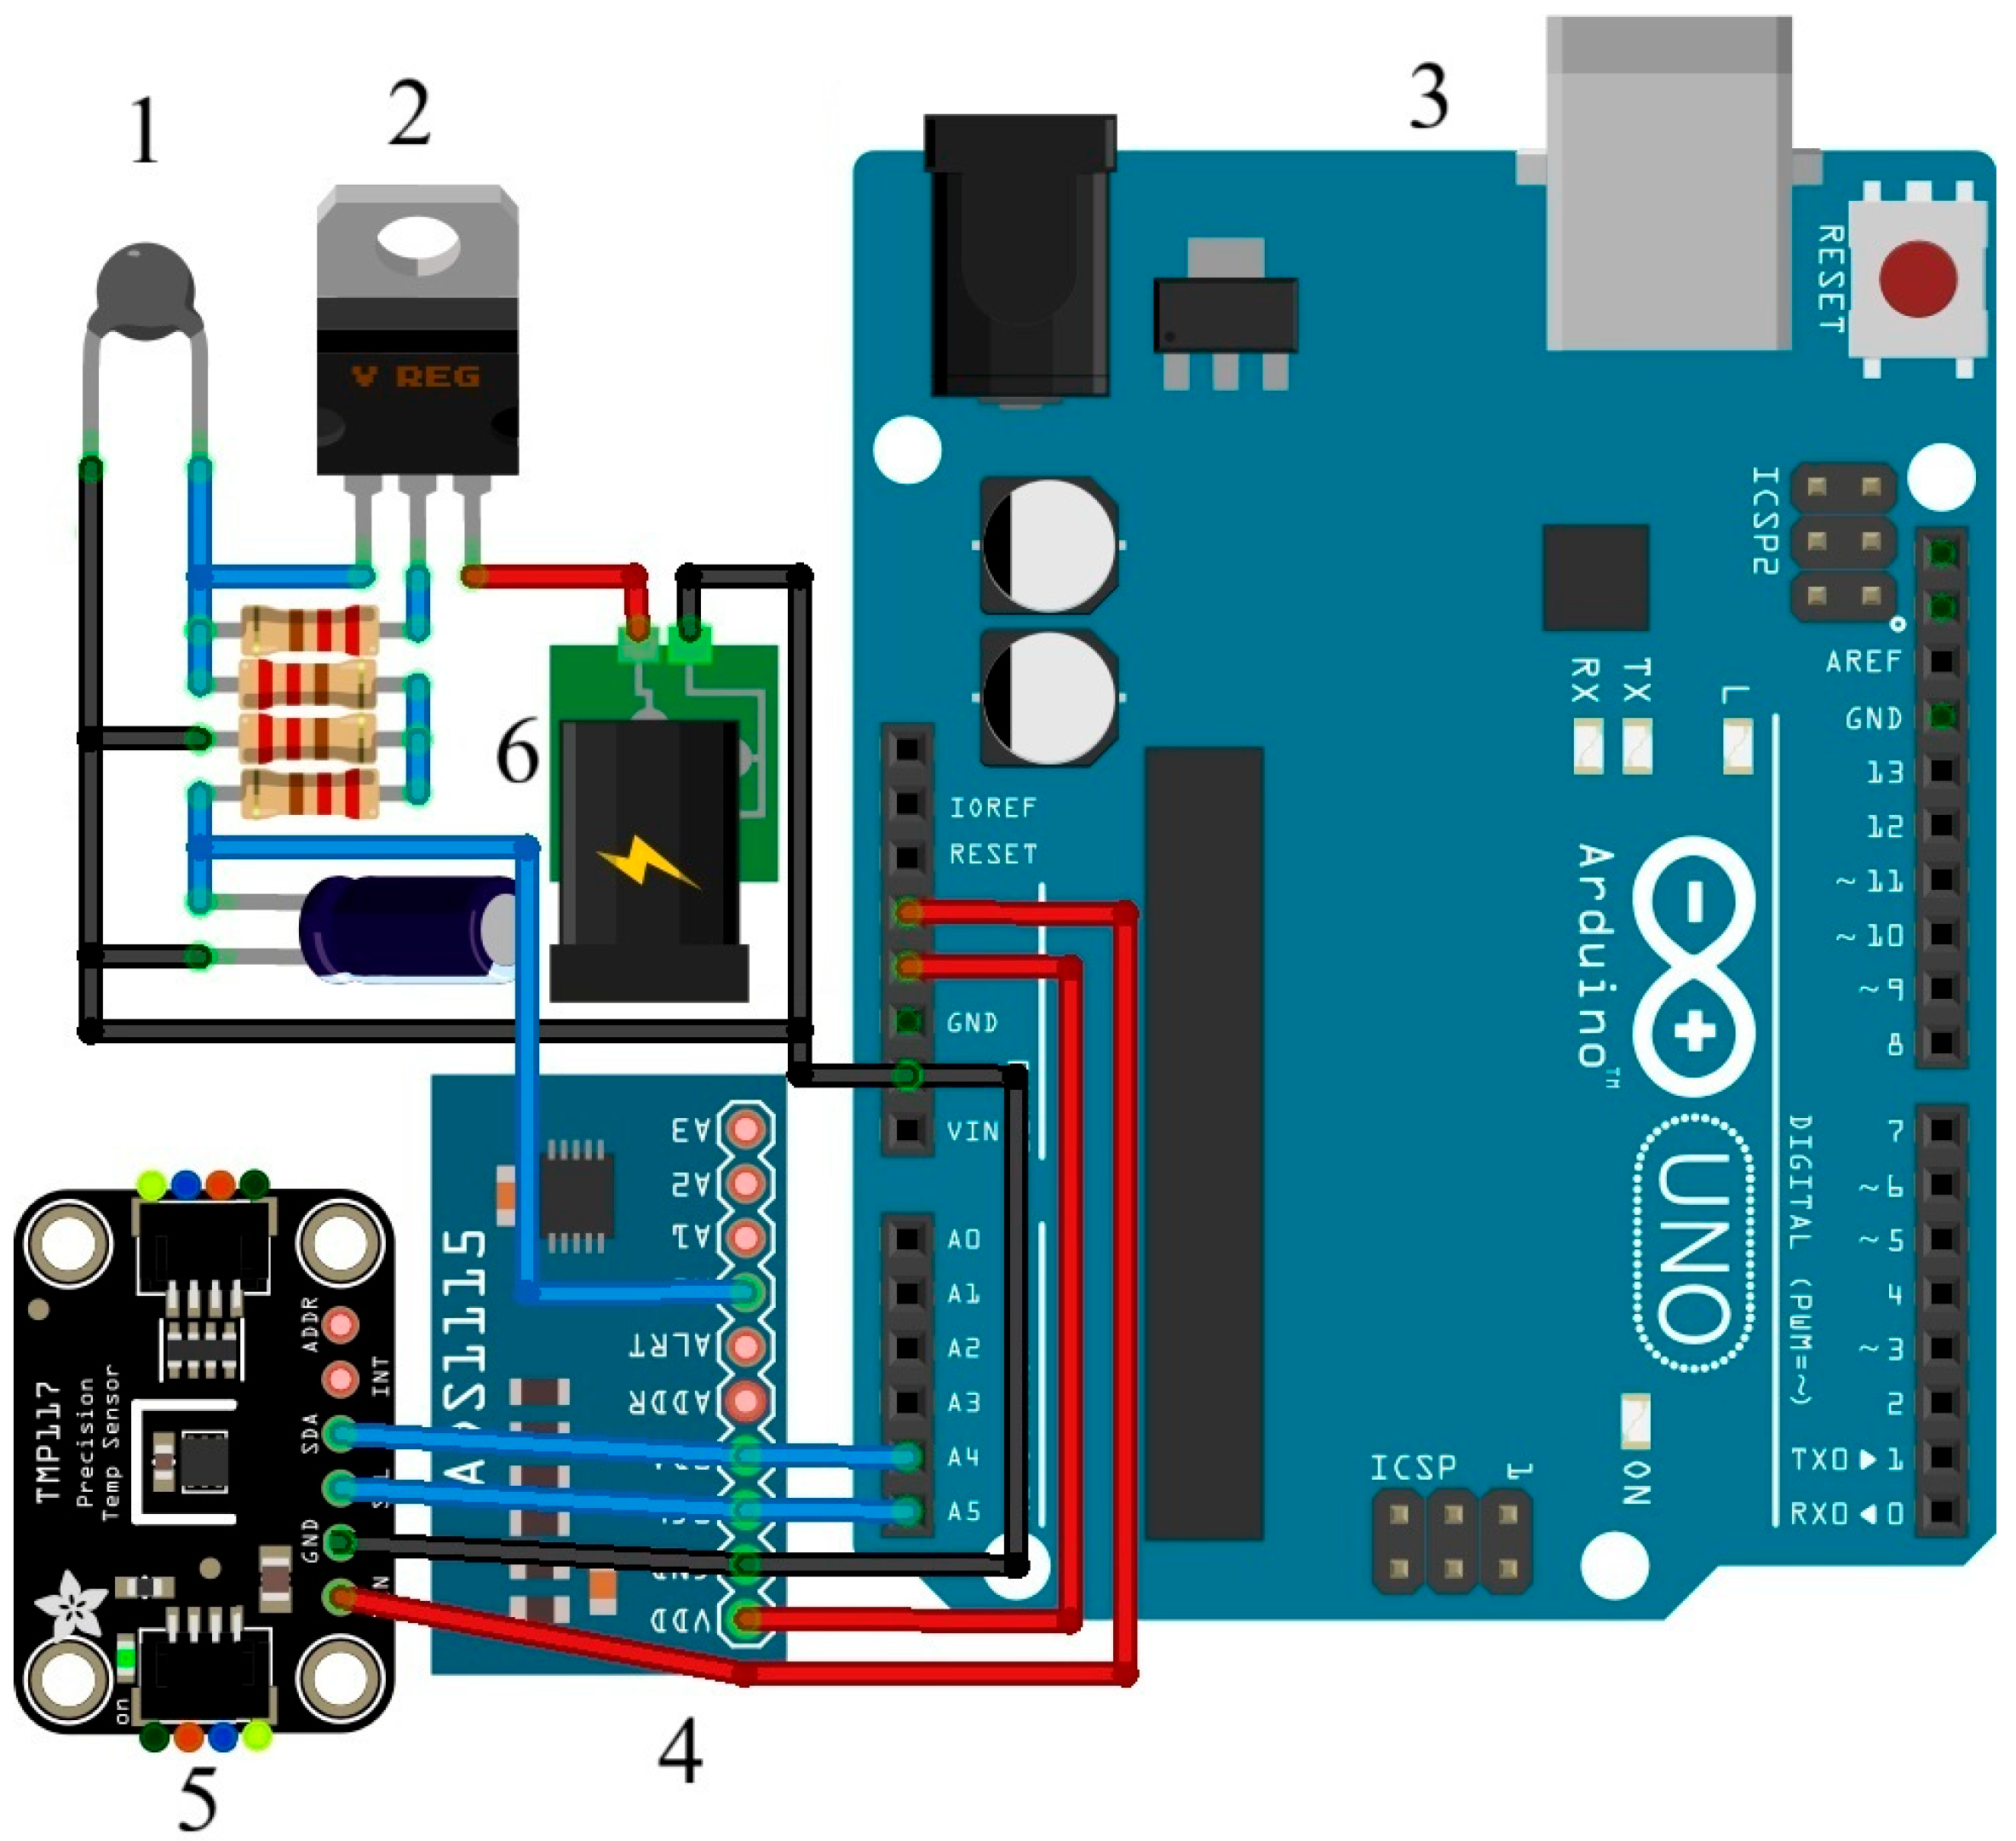
The voltage reading from the NTC terminals was performed by the Arduino microcontroller and the ADS1115 analog-to-digital converter (Figure 2). The conversion from analog to digital was provided by the 16-bit analog-to-digital converter ADS1115, which was used to increase the resolution of the obtained data, being able to detect small voltage variations.
Figure 2.
General view of the NTC anemometer. 1—NTC sensor; 2—constant current source using the LM317 I.C.; 3—Arduino UNO board; 4 –ADS1115 analog-digital converter; 5—TMP117 temperature sensor; 6—stabilized power supply.
The reduction of the voltage necessary for the operation of the ADS (from 24 V to 5 V) was achieved using a voltage divider composed of resistors R2 and R3 (Figure 1). The values of the voltage divider resistors (R2 and R3) were determined using the relationship (Equation (4)):
where (V) is the desired output voltage and (V) is the input voltage.
The reduction of the high-frequency noise was achieved using an RC-type low-pass filter, consisting of the capacitor C1 and resistor R4 (Figure 1). The cut-off frequency of the low pass filter (16 Hz) was calculated with the relationship (Equation (5)):
During the experimental tests, the ambient temperature was measured using a TMP117 precision temperature sensor, with an accuracy of ±0.1 °C in the temperature range −20–50 °C and a resolution of 0.0078 °C per 16 bits, according to the manufacturer’s specifications.
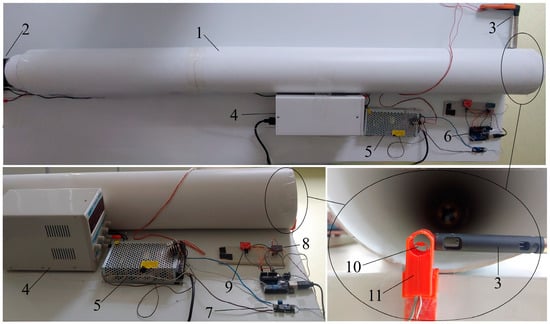
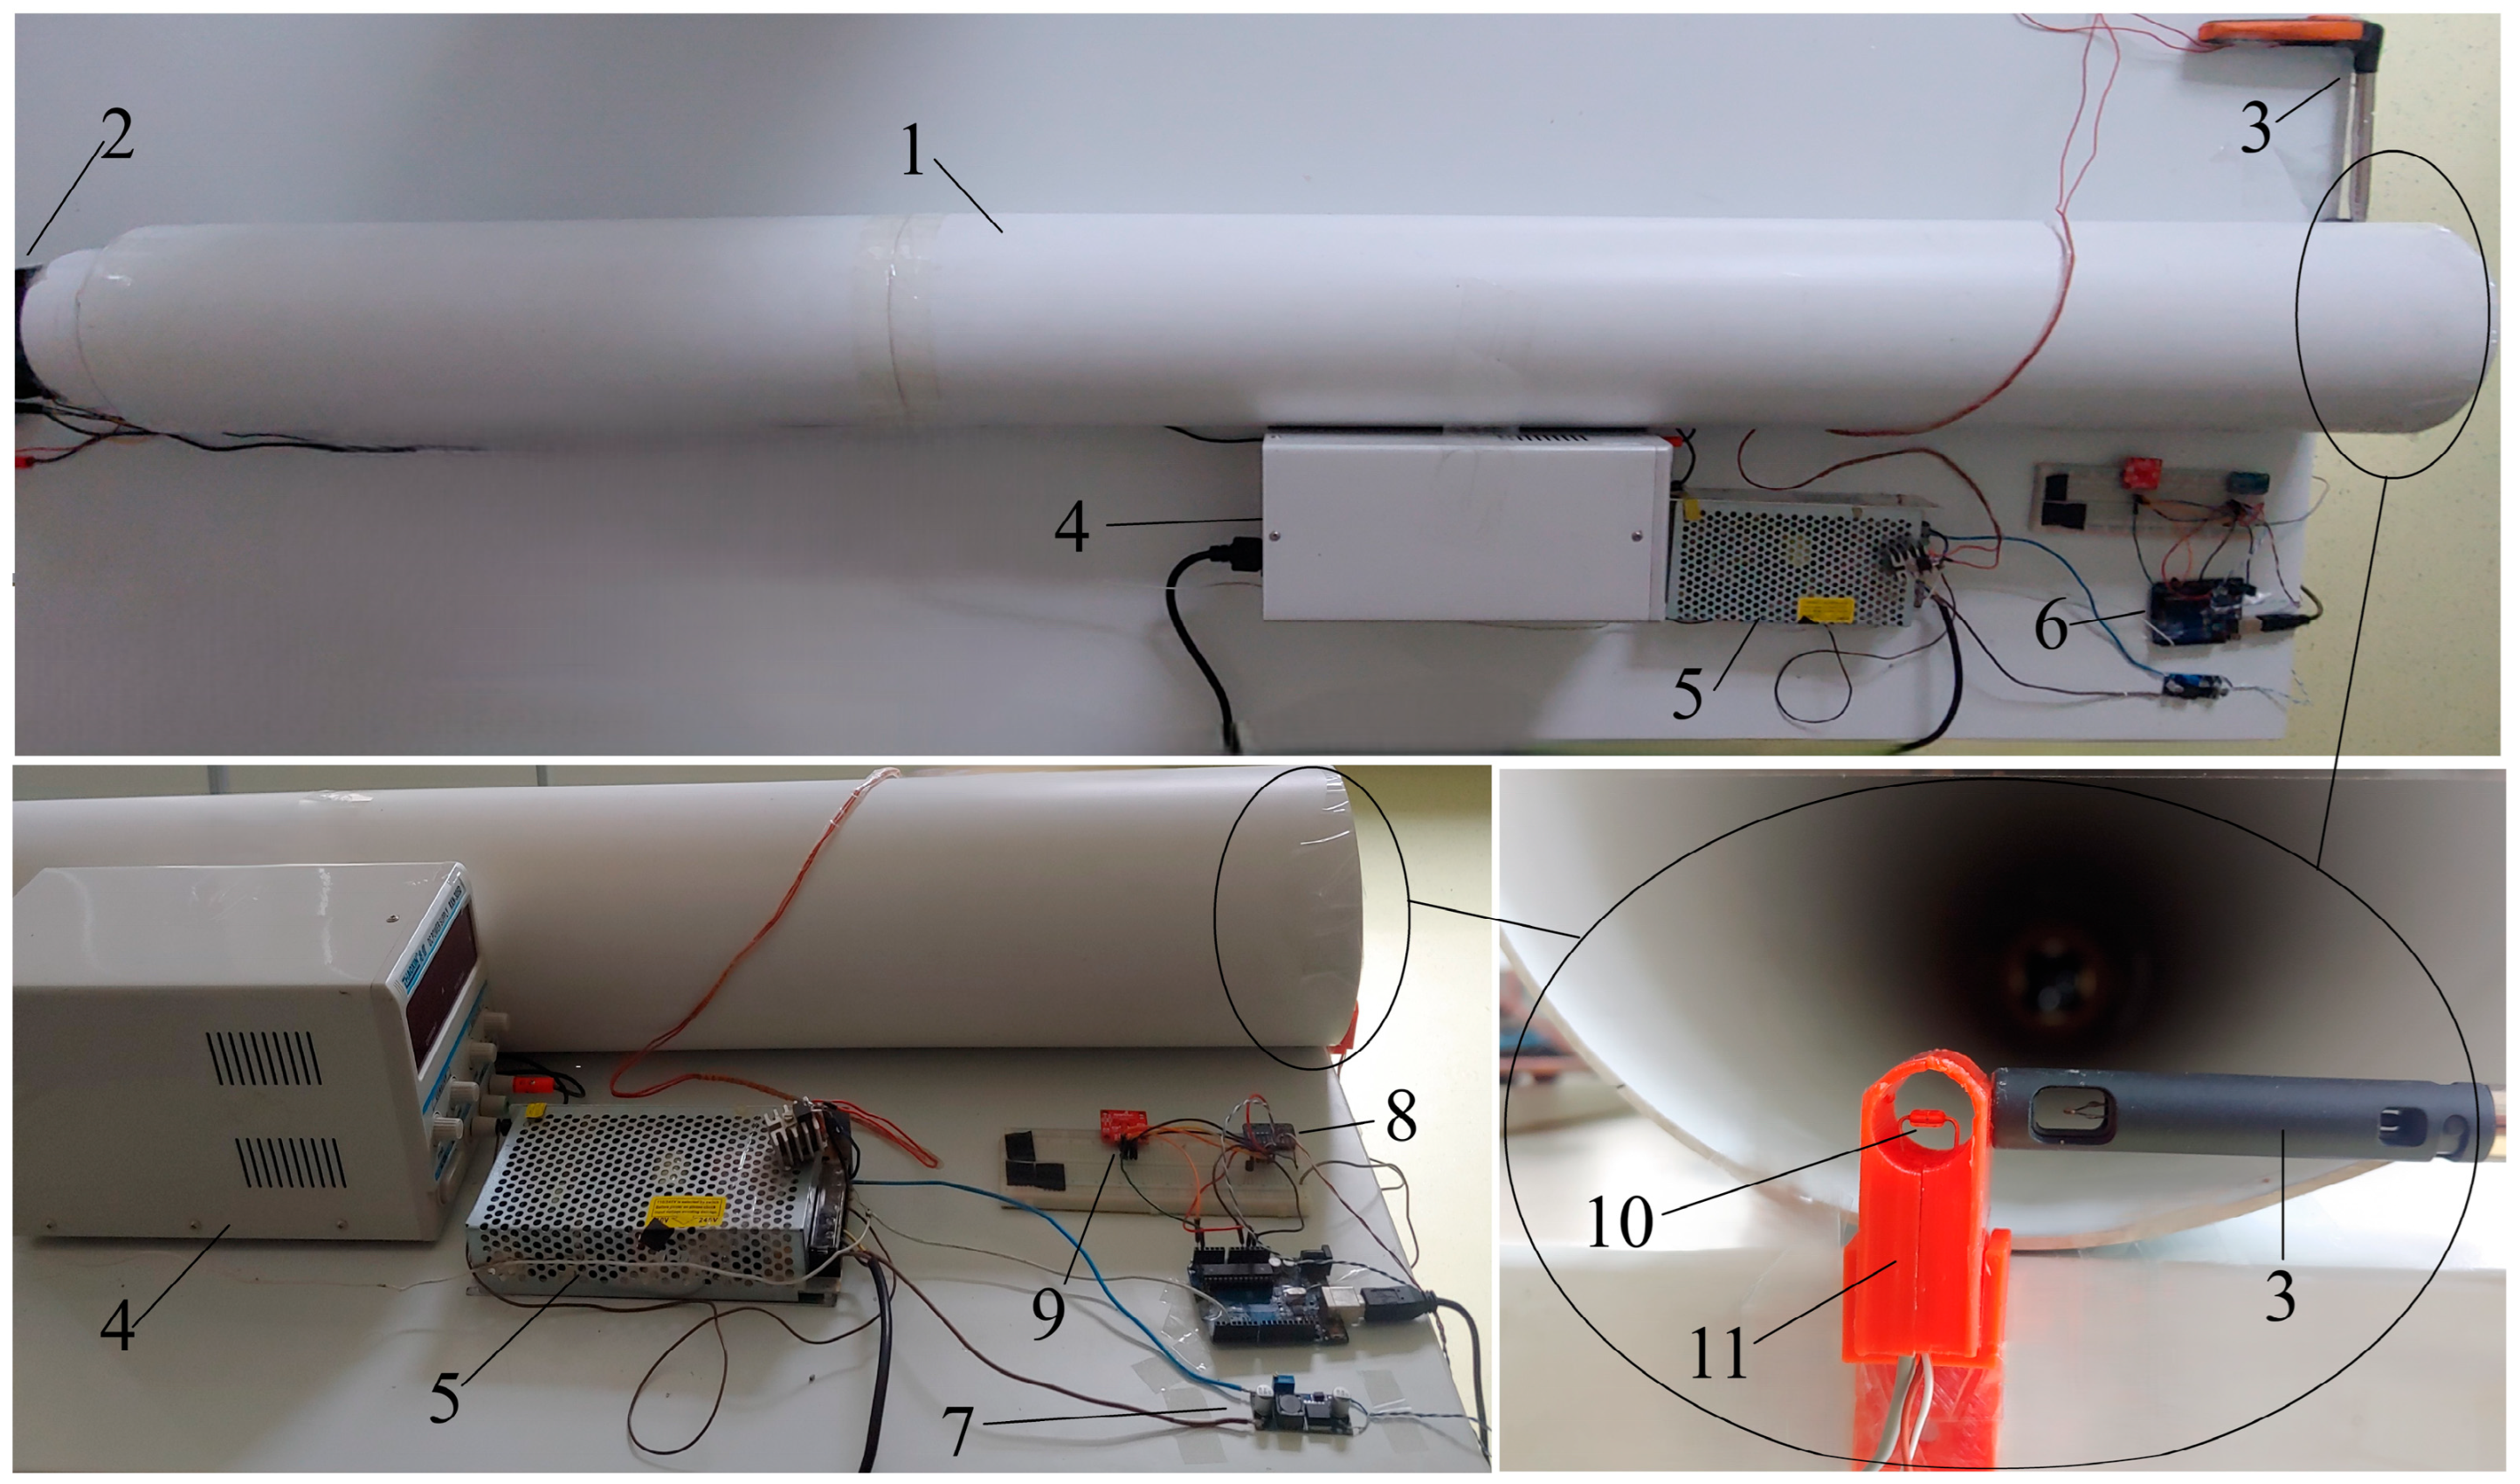
In order to calibrate the NTC anemometric sensor, a test bed consisting of a wind tunnel was designed (Figure 3). This calibration process was performed using the calibrated anemometer testo 405i [42] as a reference.
Figure 3.
Test bed for the calibration of the NTC anemometer. 1—wind tunnel—150 mm PVC pipe; 2—fan; 3—testo 405 anemometer; 4—adjustable power source; 5—12 V stabilized power source; 6—Arduino UNO board; 7—XL6009 voltage boost module; 8—ADS1115 analog—digital converter; 9—TMP117 temperature sensor; 10—NTC sensor; 11—housing of the NTC sensor.
By means of an adjustable voltage source, the fan speed was changed, thus allowing variations of the air flow velocity in the wind tunnel. The fan used was equipped with a speed monitoring sensor.
The resulting voltage at the NTC terminals, the ambient temperature, and the fan speed were processed by the Arduino UNO microcontroller and transmitted to a PC for parameter monitoring and further processing.
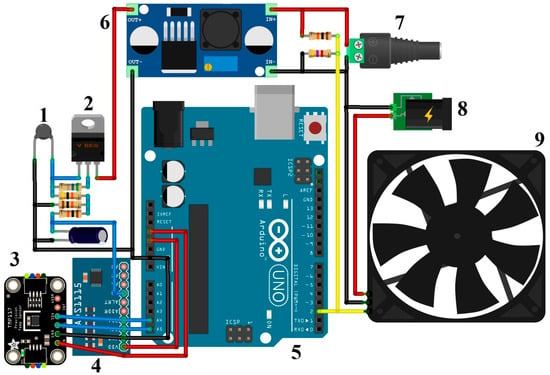
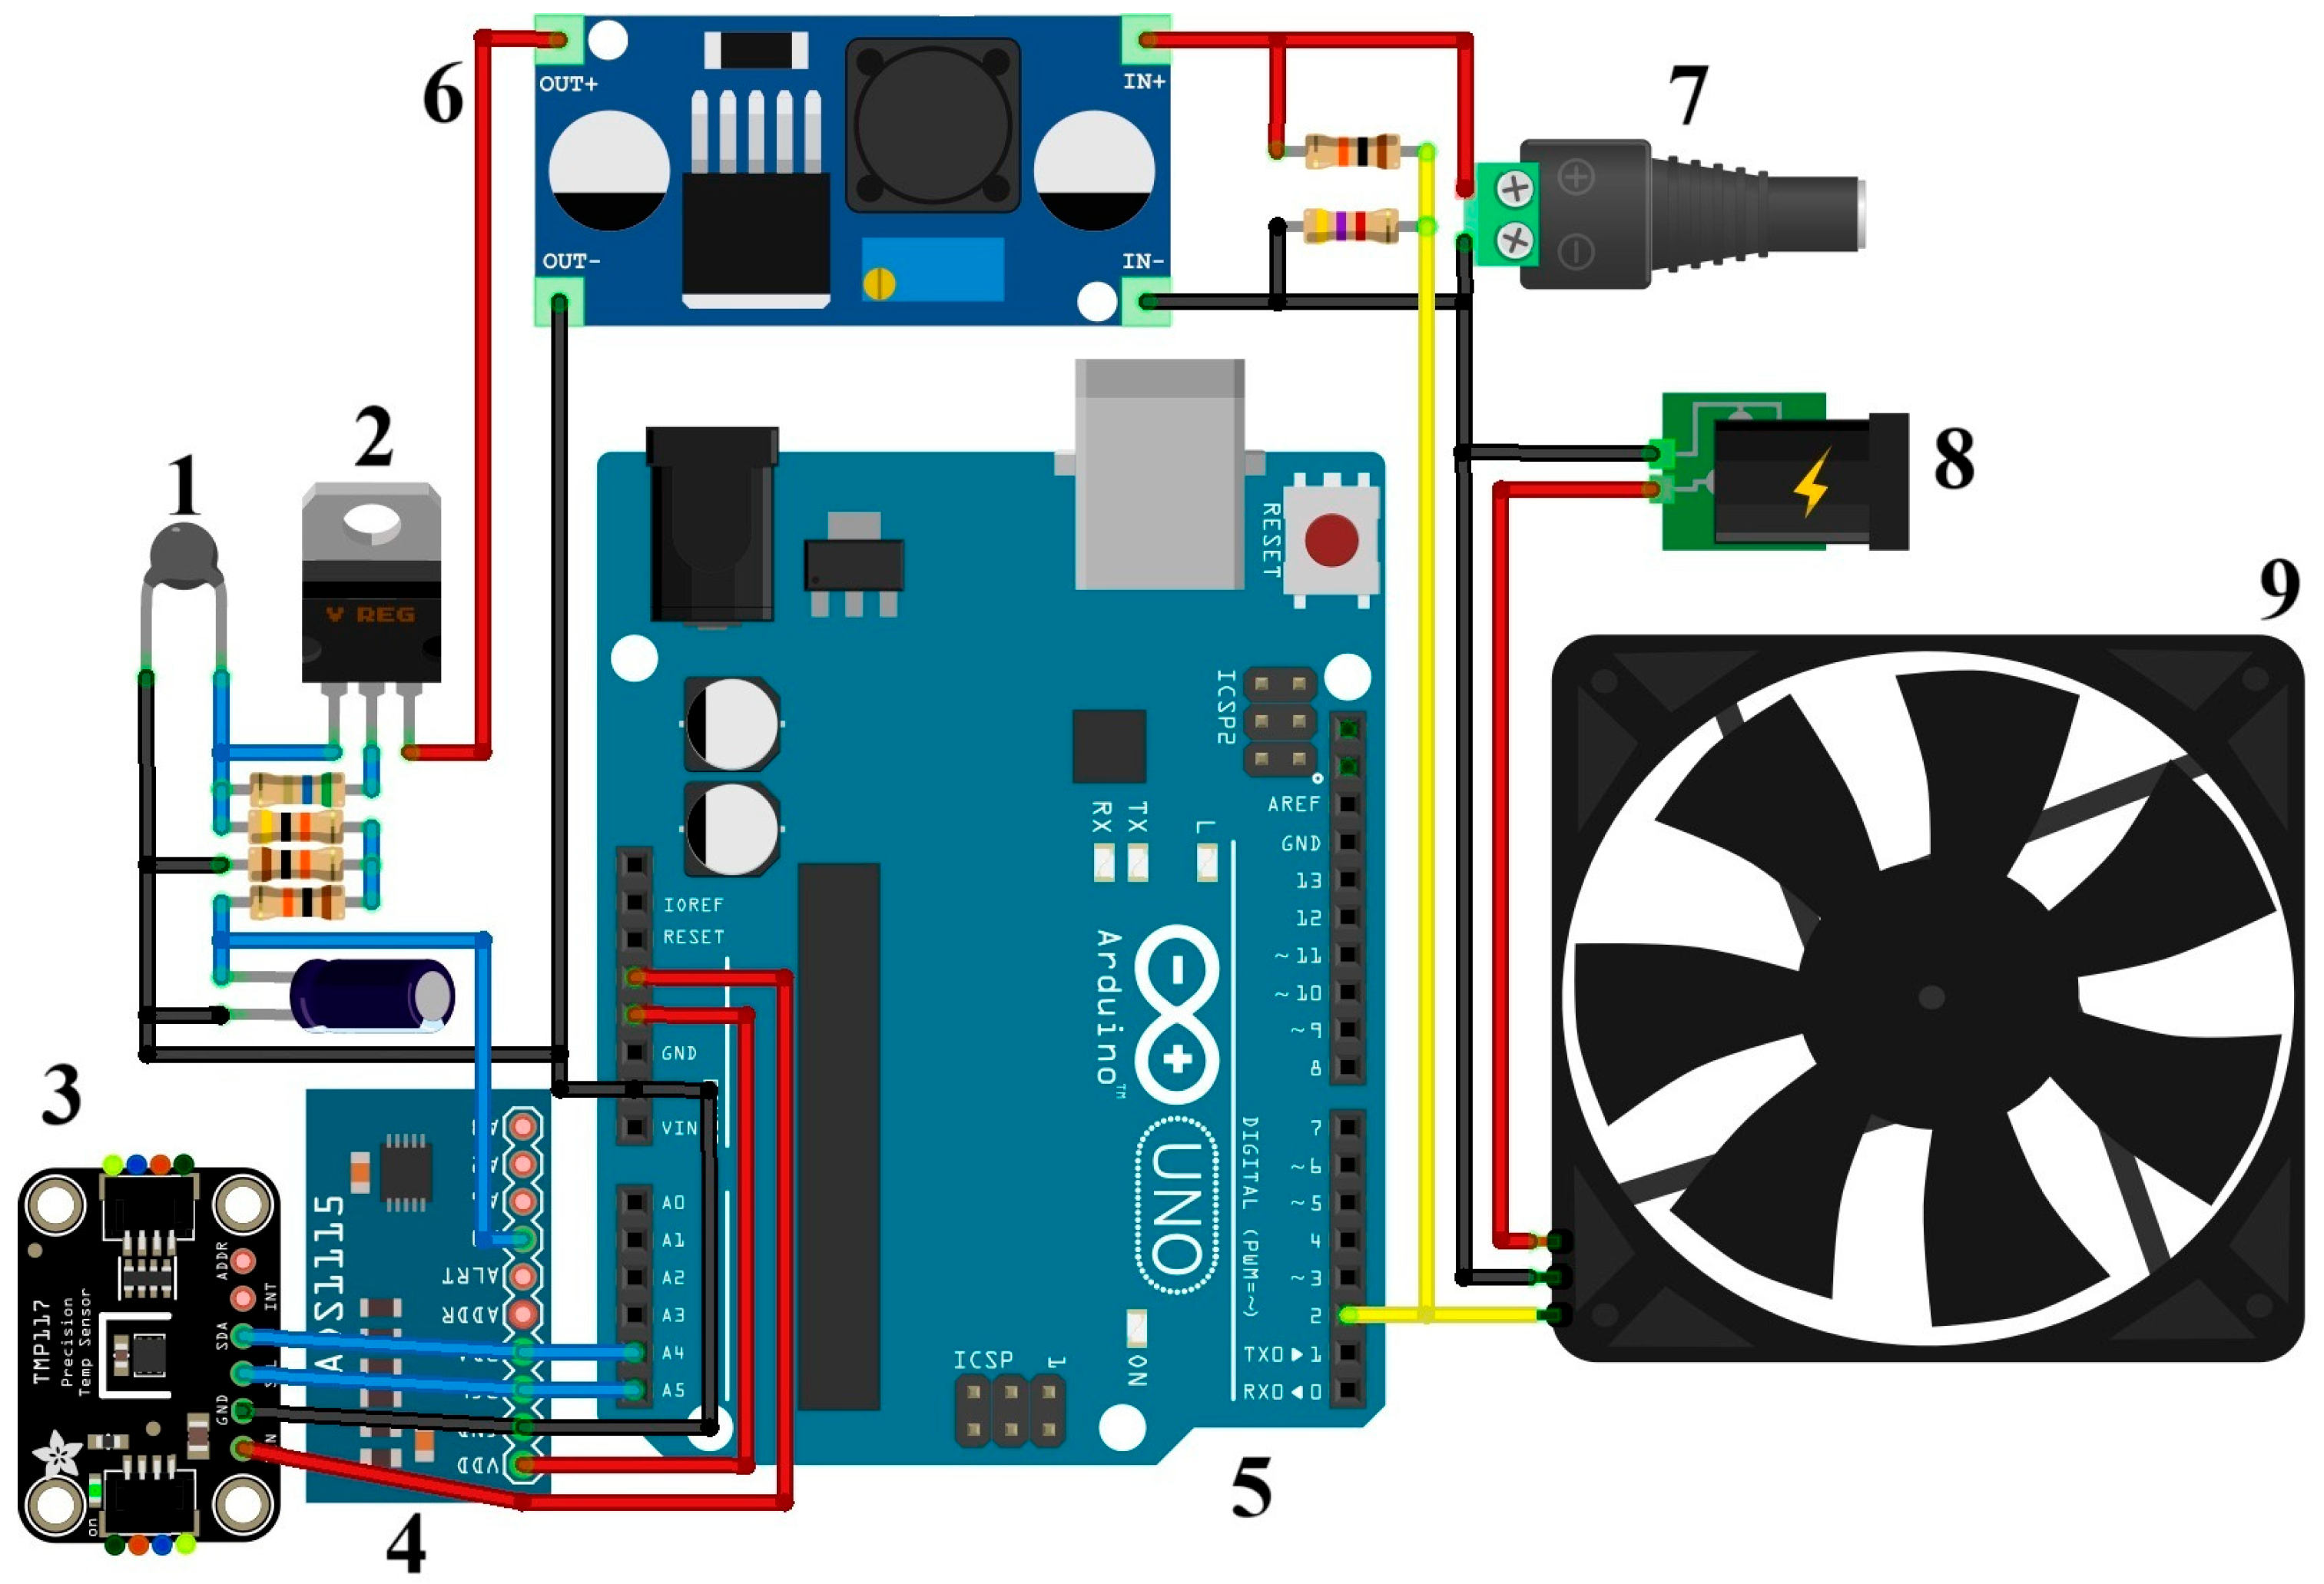
To ensure the 24 V voltage necessary to power the NTC anemometric sensor, the XL6009 voltage boost module was used, through which the 12 V stabilized voltage was raised to 24 V (Figure 4).
Figure 4.
Schematics of the calibration test bed. 1—NTC sensor; 2—LM317 I.C.; 3—TMP117 temperature sensor; 4—ADS1115 analog—digital converter; 5—Arduino UNO board; 6—XL6009 voltage boost module; 7—12 V power source; 8—adjustable power source; 9—fan.
The sensor housing was made using a 3D printer; the electrical components of the sensor (LM317, R1, R2, R3, R4, and C1) and the NTC sensor itself were inserted inside the housing. The anemometric NTC sensor was positioned in the middle of the housing, in a transverse plane to the direction of the airflow, in order to obtain the best possible accuracy by uniform cooling.
The NTC sensor calibration was performed at an ambient temperature of 22 °C. The fan speed was changed using the variable voltage source, resulting in air flow velocity in the wind tunnel comprised between 0 and 4.5 m/s. To increase the measurement accuracy, the average of 100 airflow velocity measurements (performed with the testo 405i anemometer) and voltage readings of the NTC sensor were used for each single fan speed.
All experiments were conducted in September and October 2025.
Statistical analysis was performed in the Matlab R2024b software using the t-test and Bland-Altman analysis.
3. Results
3.1. Sensor Calibration
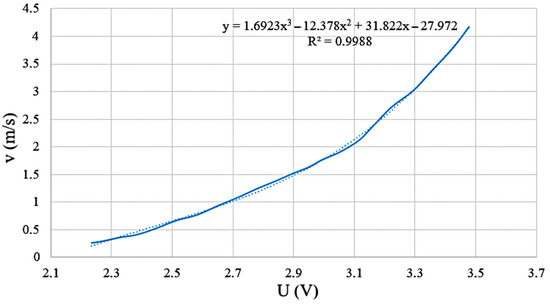
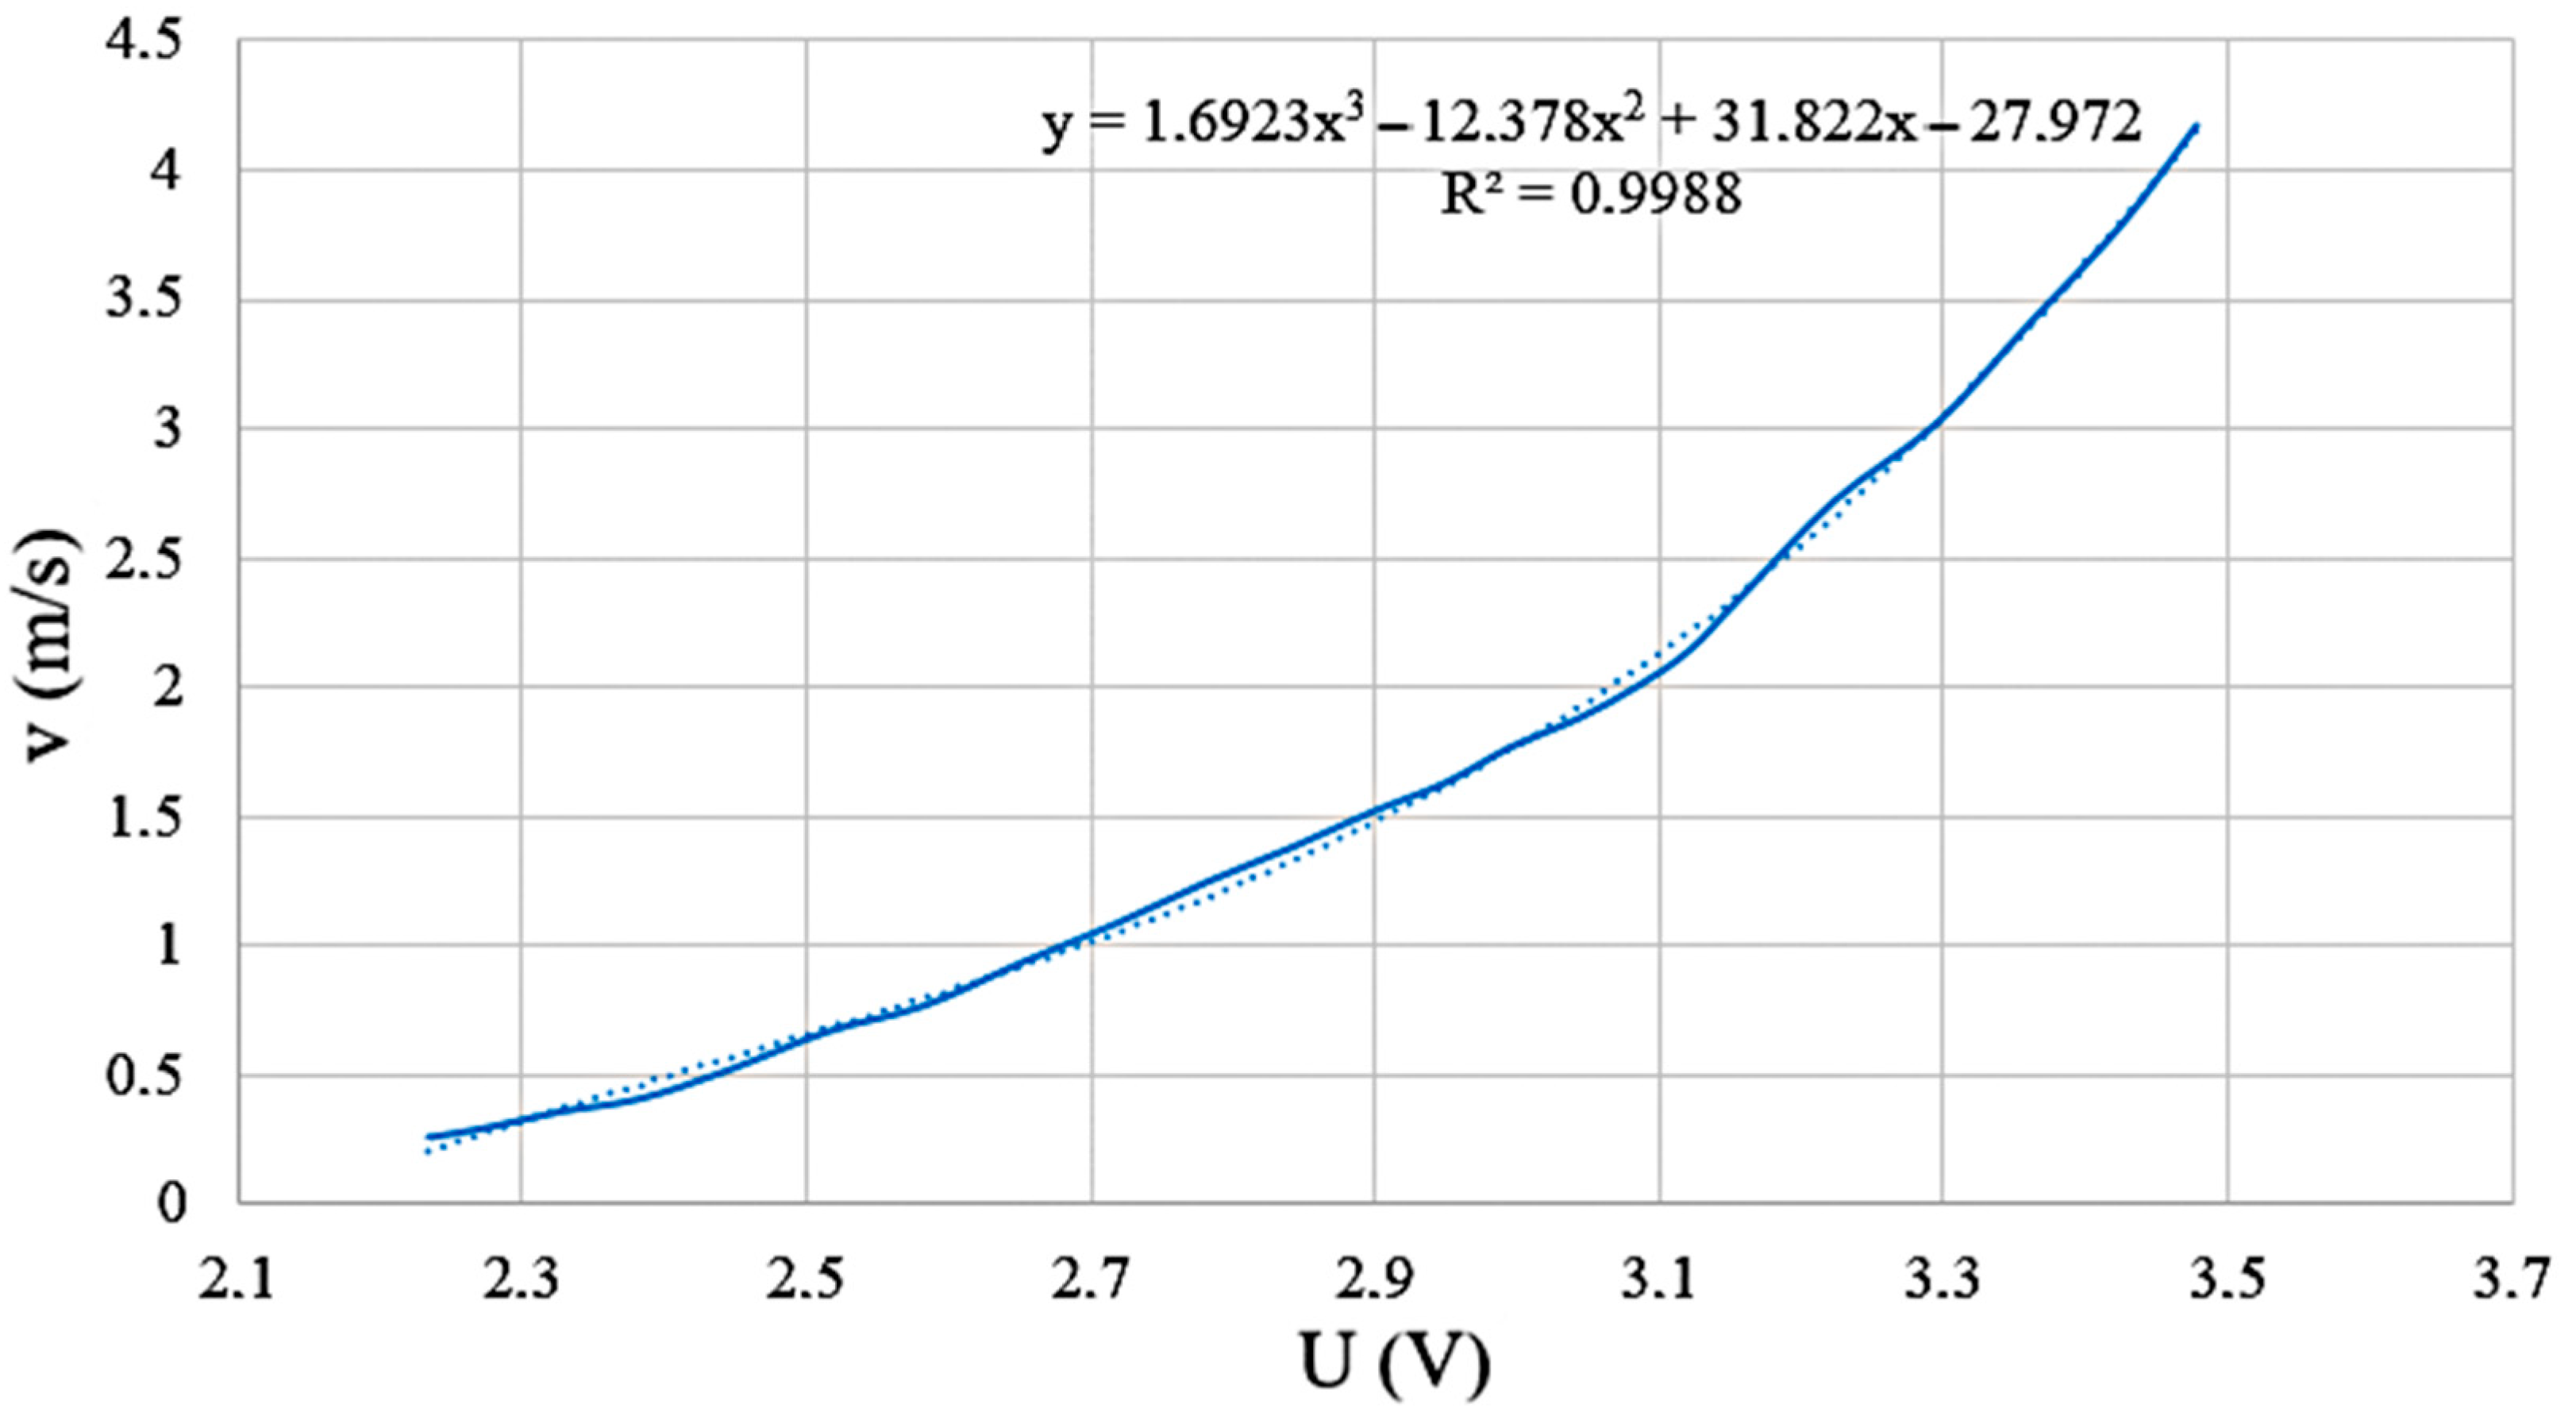
A 3rd order polynomial equation was found to give the best correlation (Pearson coefficient R2 = 0.9988) between the voltage obtained from the NTC sensor and the airflow velocity given by the testo 405i anemometer (Figure 5, Equation (6)):
where (m/s) is the air velocity and (V) is the NTC voltage reading.
Figure 5.
Voltage vs. air velocity. U (V)—NTC voltage; v (m/s)—air velocity.
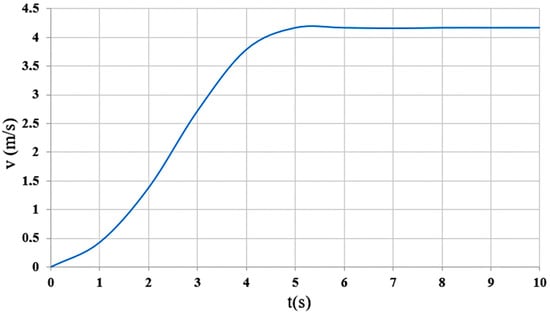
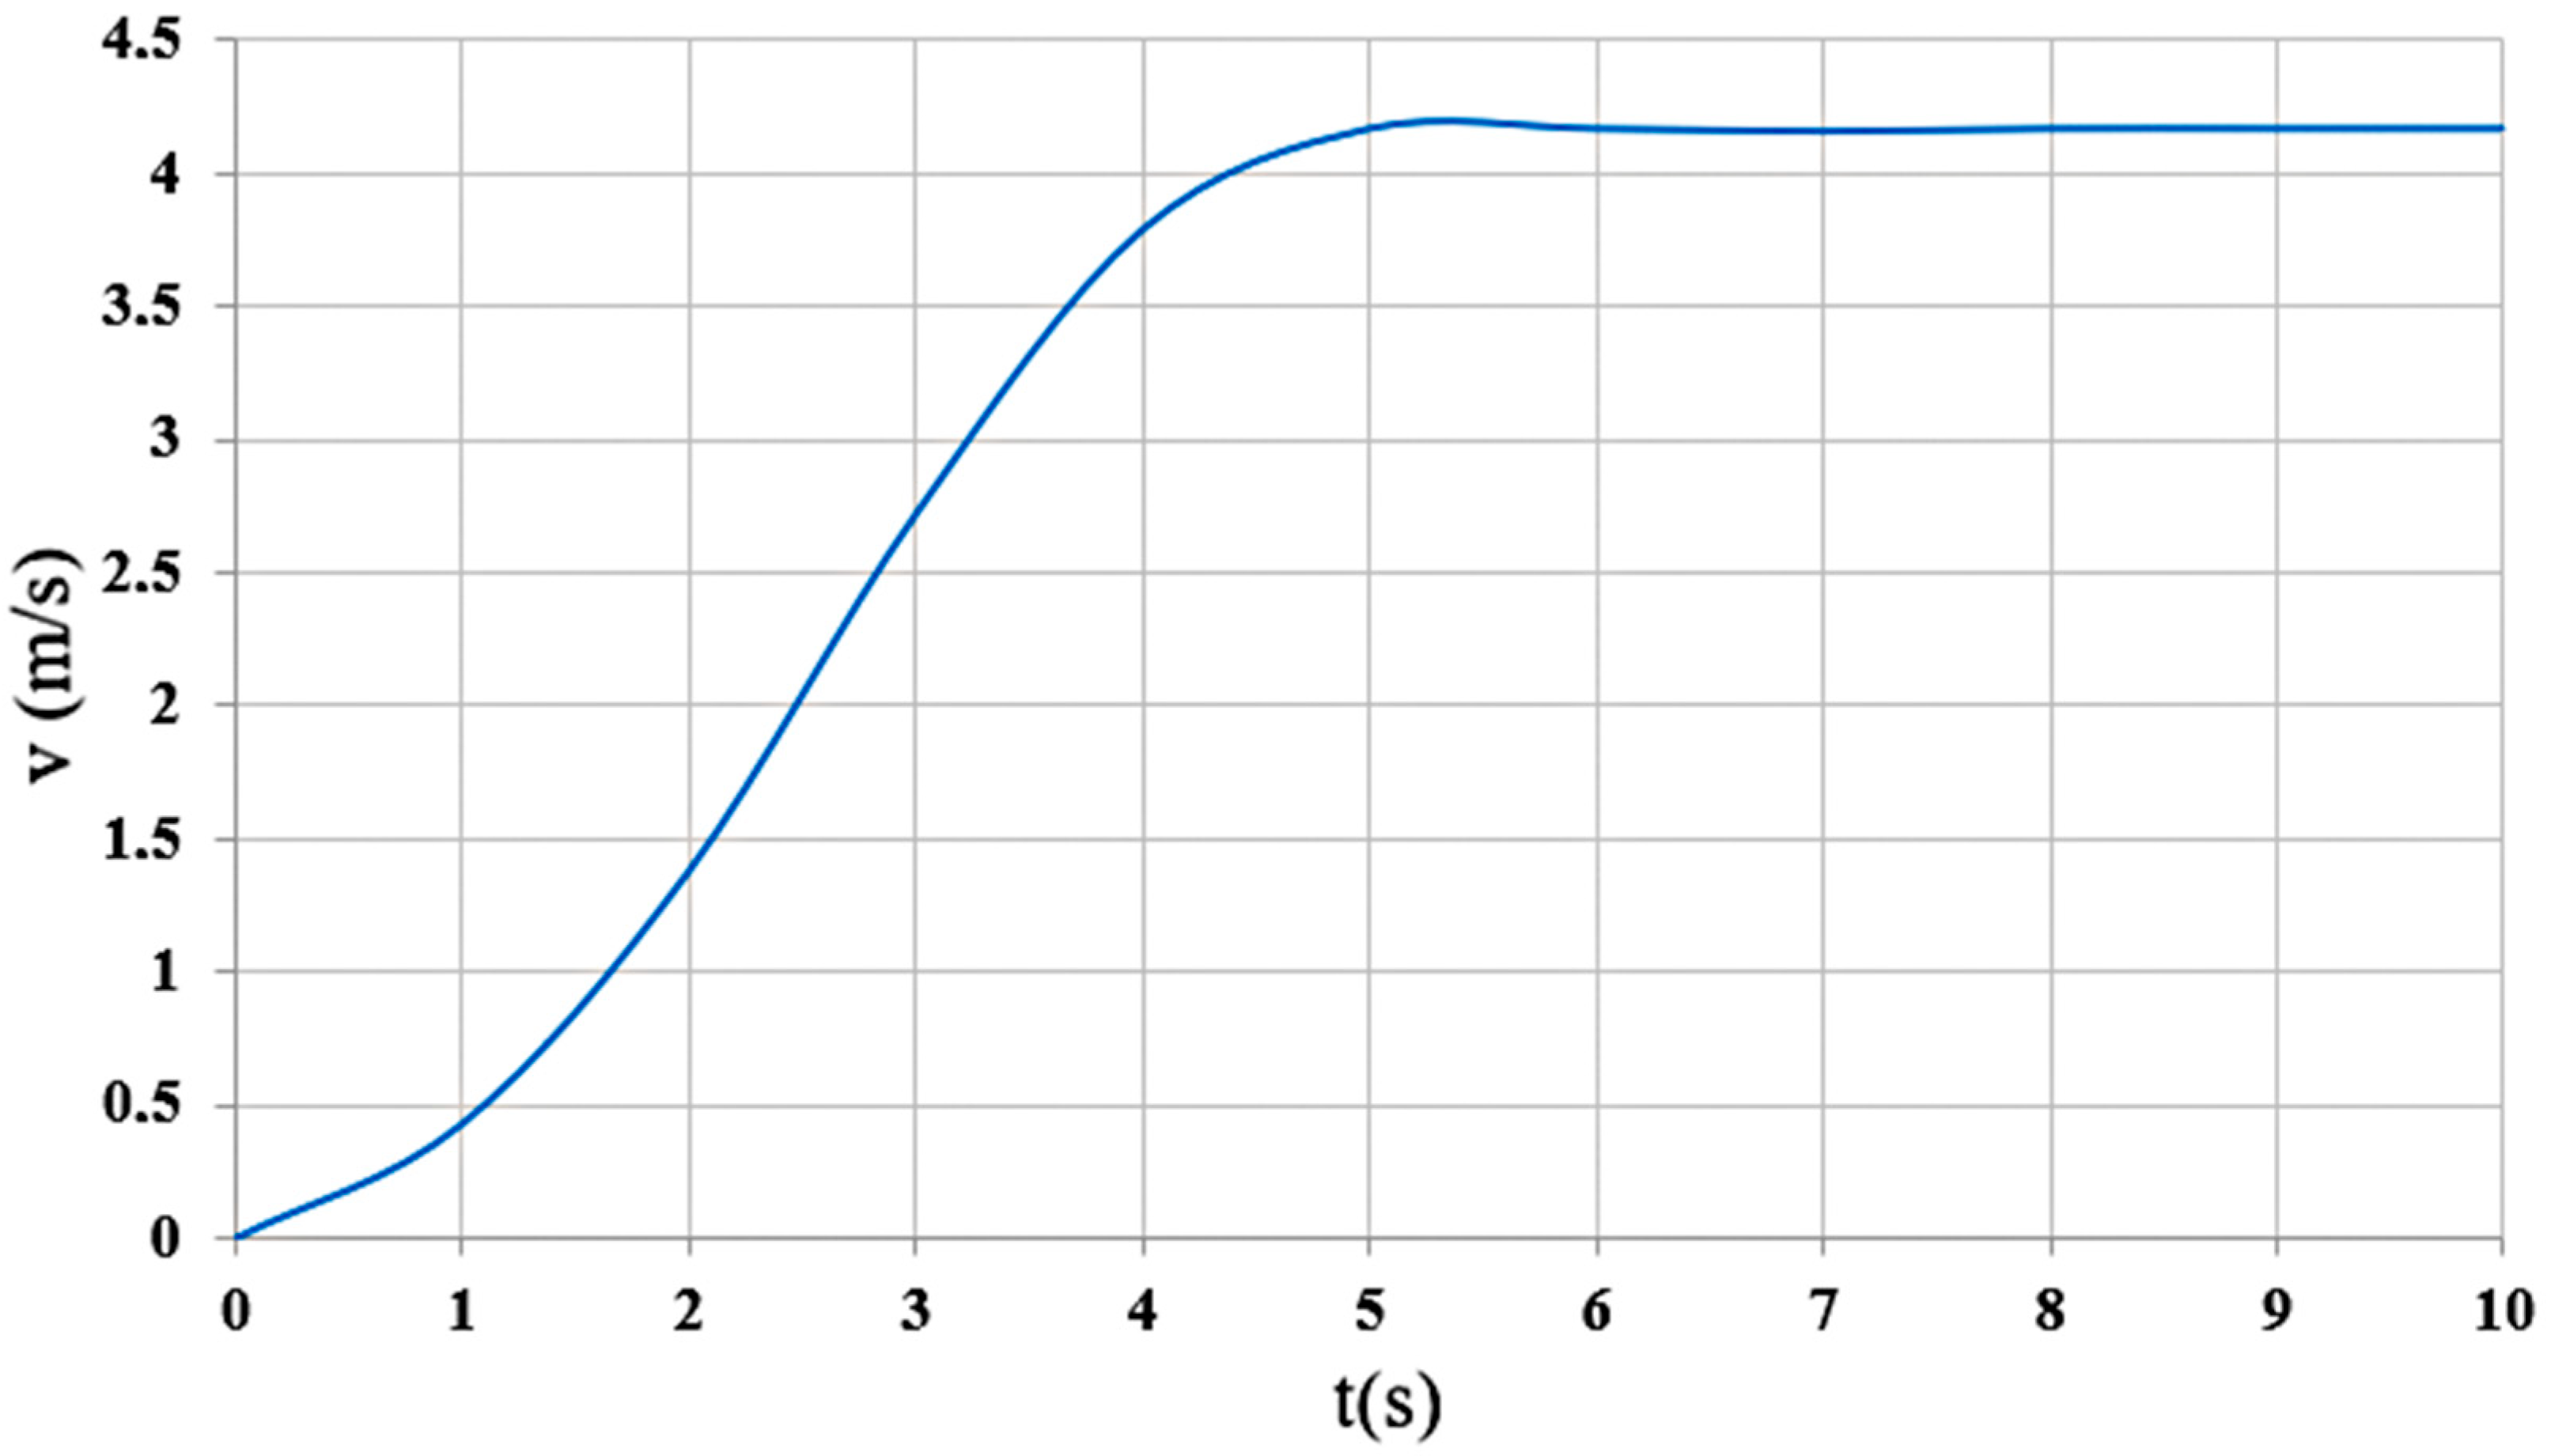
In order to determine the measurement accuracy, it is necessary to establish the response time (Figure 6). The response time was determined in the calibration stand; for this purpose, an air velocity of 4.2 m/s was created in the wind tunnel by means of a fan, after which the anemometric sensor was supplied with electrical voltage.
Figure 6.
Graphical representation of the response time of the anemometric sensor. v (m/s)—air velocity, t (s)—time.
It is observed that the time required for the anemometric sensor to reach from 0 to 4.2 m/s corresponds to an interval of 0–5 s; after this interval, the curve flattens out, and the recorded air velocity remains constant at 4.2 m/s. From the analysis of the graph, it appears that the time required for the anemometric sensor to reach from 0 to 4.2 m/s is 5 s.
3.2. Temperature Compensation
Because the anemometric sensor is based on a thermistor, sensitive to changes in environmental temperature, temperature compensation was necessary to get accurate values of the air flow velocity.
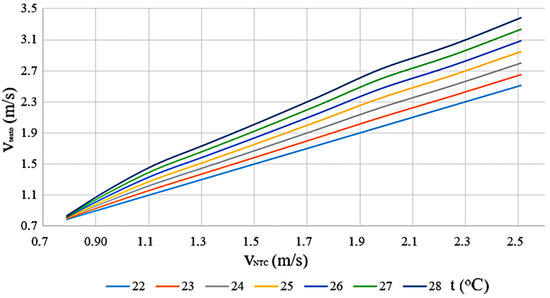
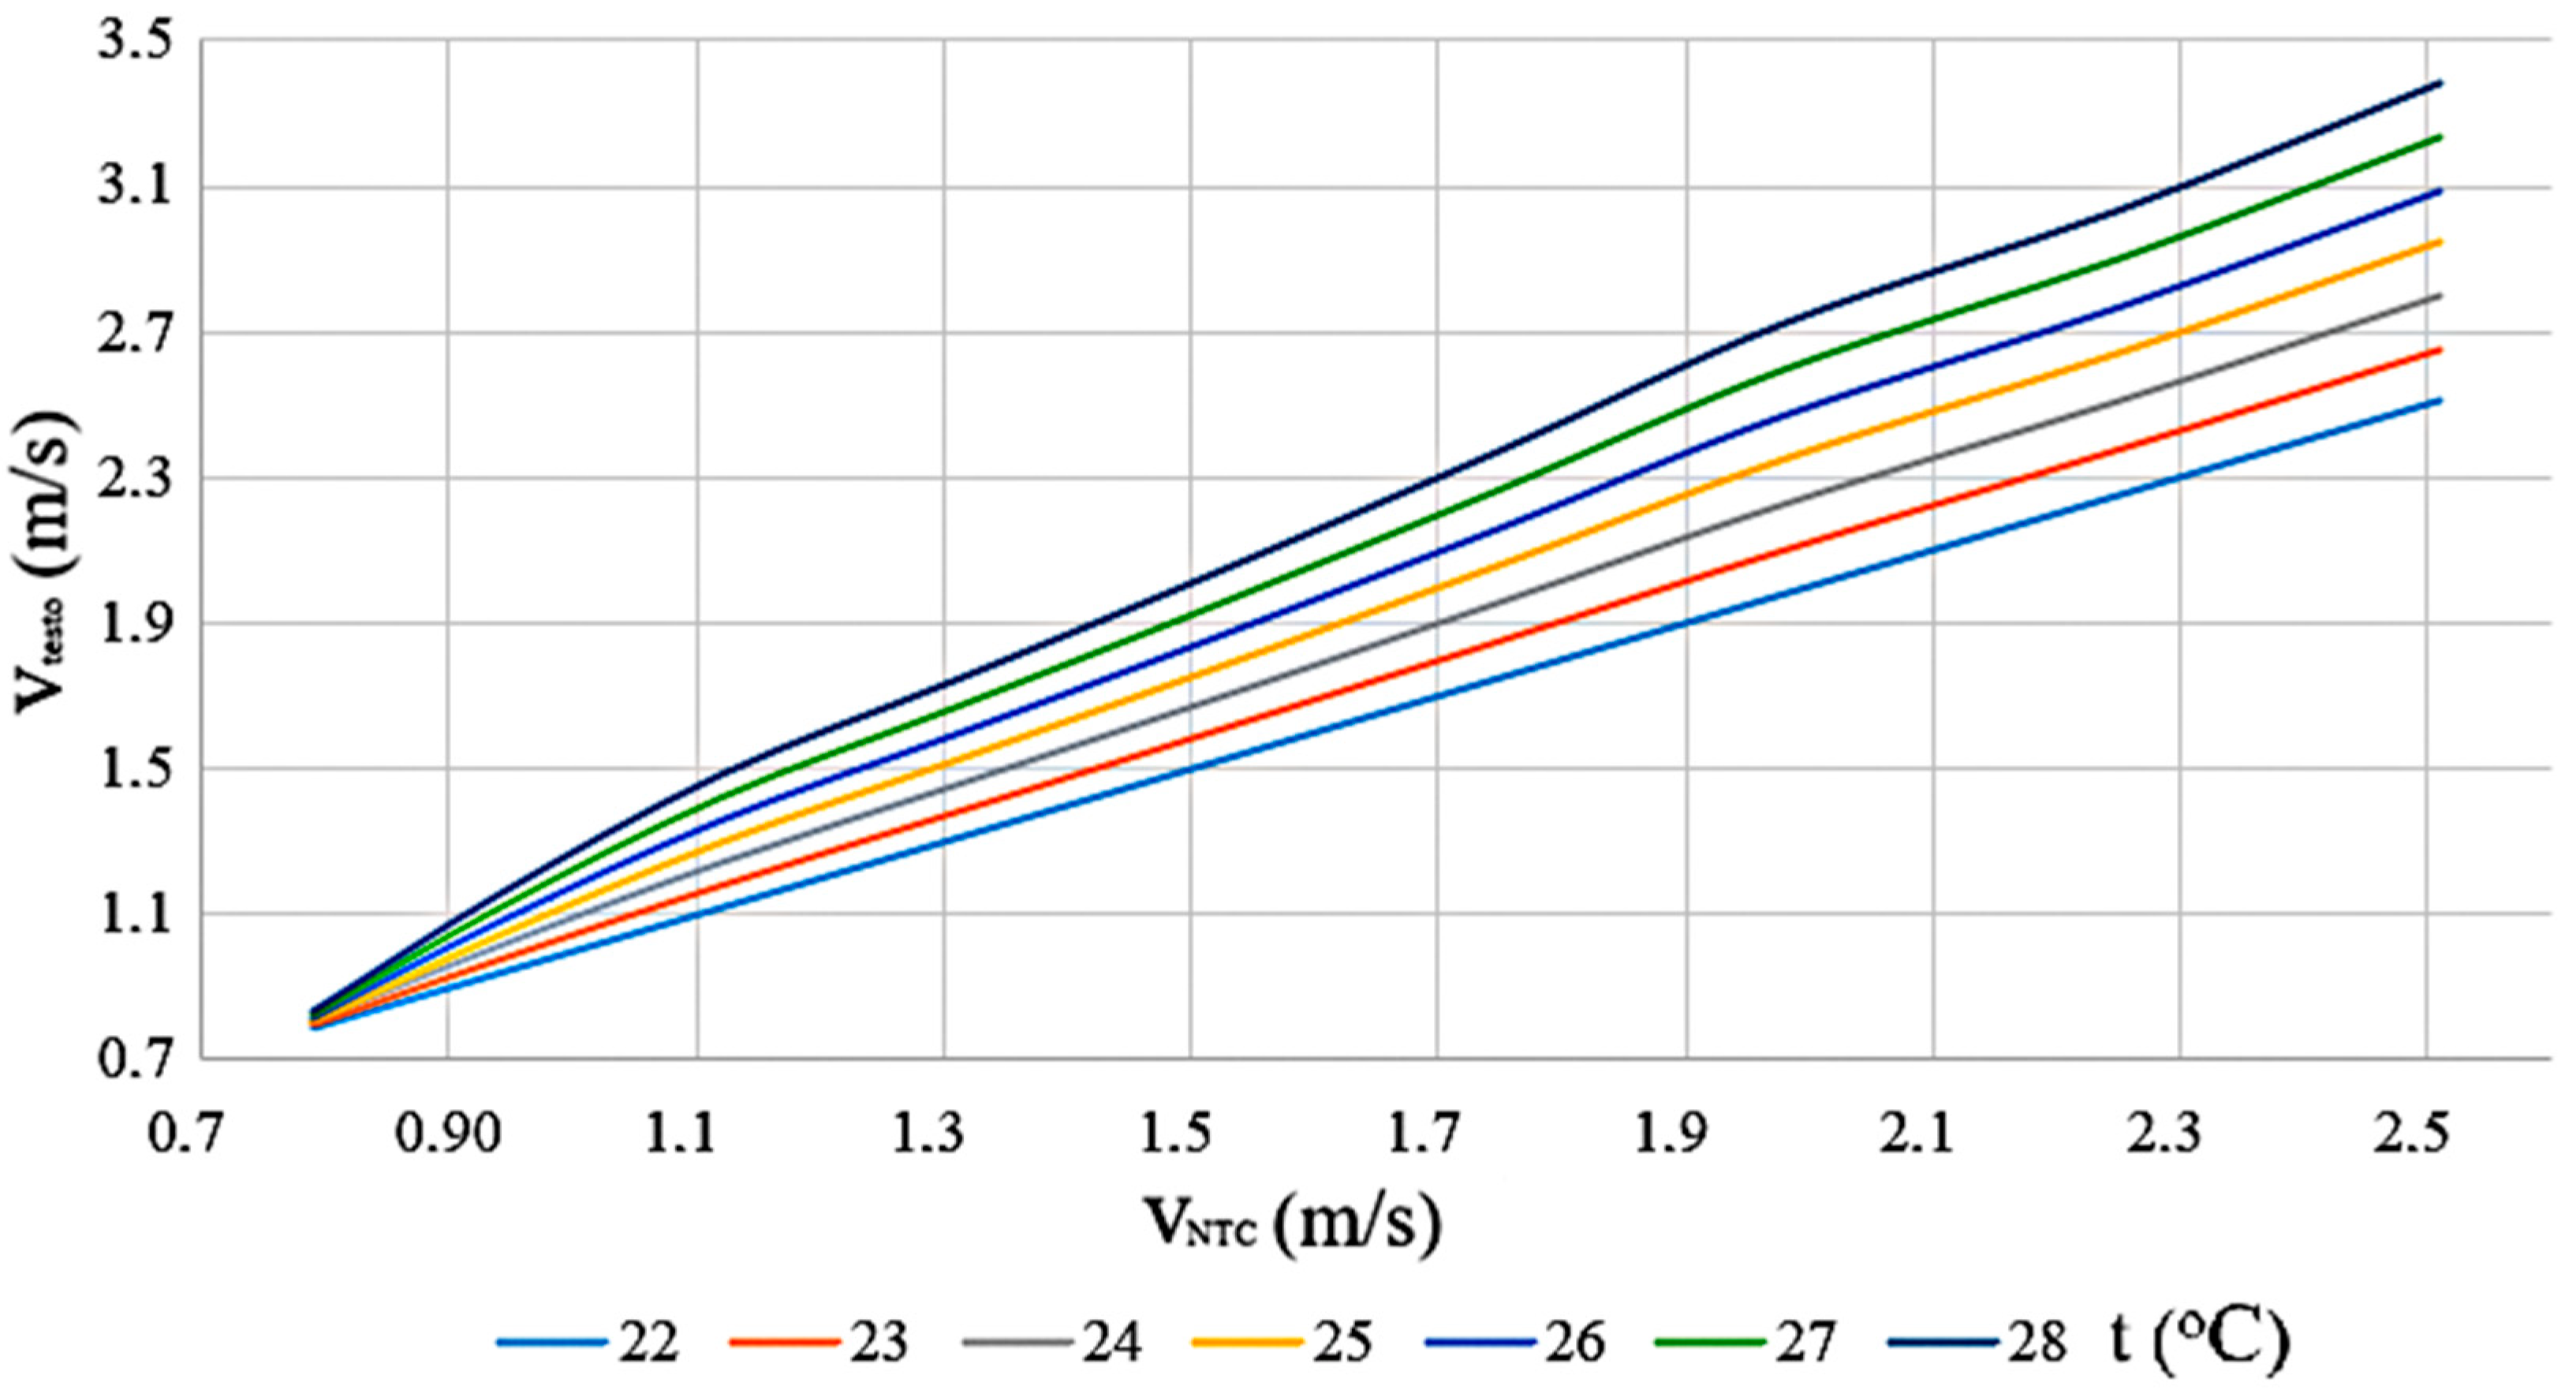
Temperature compensation was achieved by applying a correction to the air flow velocity as a function of the ambient temperature. By using the calibration results at 22 °C, tests were performed at 25 and 28 °C, and by double interpolation, airflow velocity values were obtained at different intermediate temperatures, respectively 23, 24, 26, and 27 °C (Figure 7).
Figure 7.
Air velocity reading as a function of temperature. vtesto—air velocity readings with the testo 405i anemometer; vNTC—air velocity readings with the NTC anemometer; t—environment temperature.
The following equations were used for double interpolation (Equations (7) and (8)):
where: (°C)—unknown temperature; (°C)—initial temperature; (°C)—final temperature.
where: (m/s)–unknown air velocity; (m/s)—final air velocity; (m/s)—initial air velocity.
Figure 7 shows the variation of the air flow velocity as a function of the ambient temperature.
At air flow velocity lower than 0.8 m/s, the influence of temperature over the difference between the velocity evaluated with the NTC anemometer and the one displayed by the testo anemometer was not significant (less than 0.05 m/s); as an example, at an air flow velocity of 0.83 m/s (testo 405i anemometer) and a temperature of 22 °C, the air flow velocity recorded by the NTC anemometer sensor was 0.82 m/s; at the same velocity (0.83 m/s) and at a temperature of 28 °C, the air flow velocity determined by the NTC anemometer sensor was 0.79 m/s.
For air velocities higher than 0.8 m/s, there were significant differences between the values measured with the testo anemometer and the ones recorded by the NTC sensor. Therefore, for an air velocity of 1.51 m/s measured with the testo 405i anemometer at 22 °C, the values obtained from the NTC sensor have increased by 0.09 m/s at 23 °C and by 0.51 m/s at 28 °C; at 2.51 m/s, the differences (for the same temperatures as above) have shifted to 1.15 m/s and 1.87 m/s, respectively.
Since the air flow velocity determined with the NTC has decreased when the temperature has increased, it was necessary to take into account the temperature variation, which was calculated using the following equation (Equation (9)):
where: (°C)—NTC temperature (85 °C); (°C)—environmental temperature, measured with the TMP115 sensor.
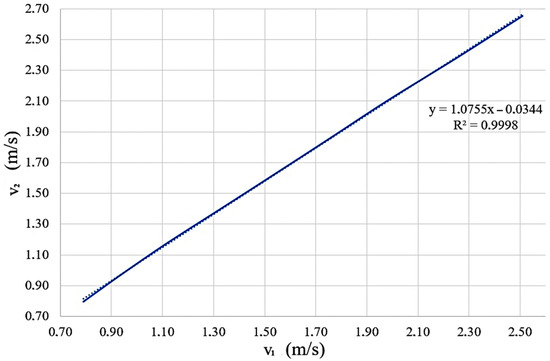
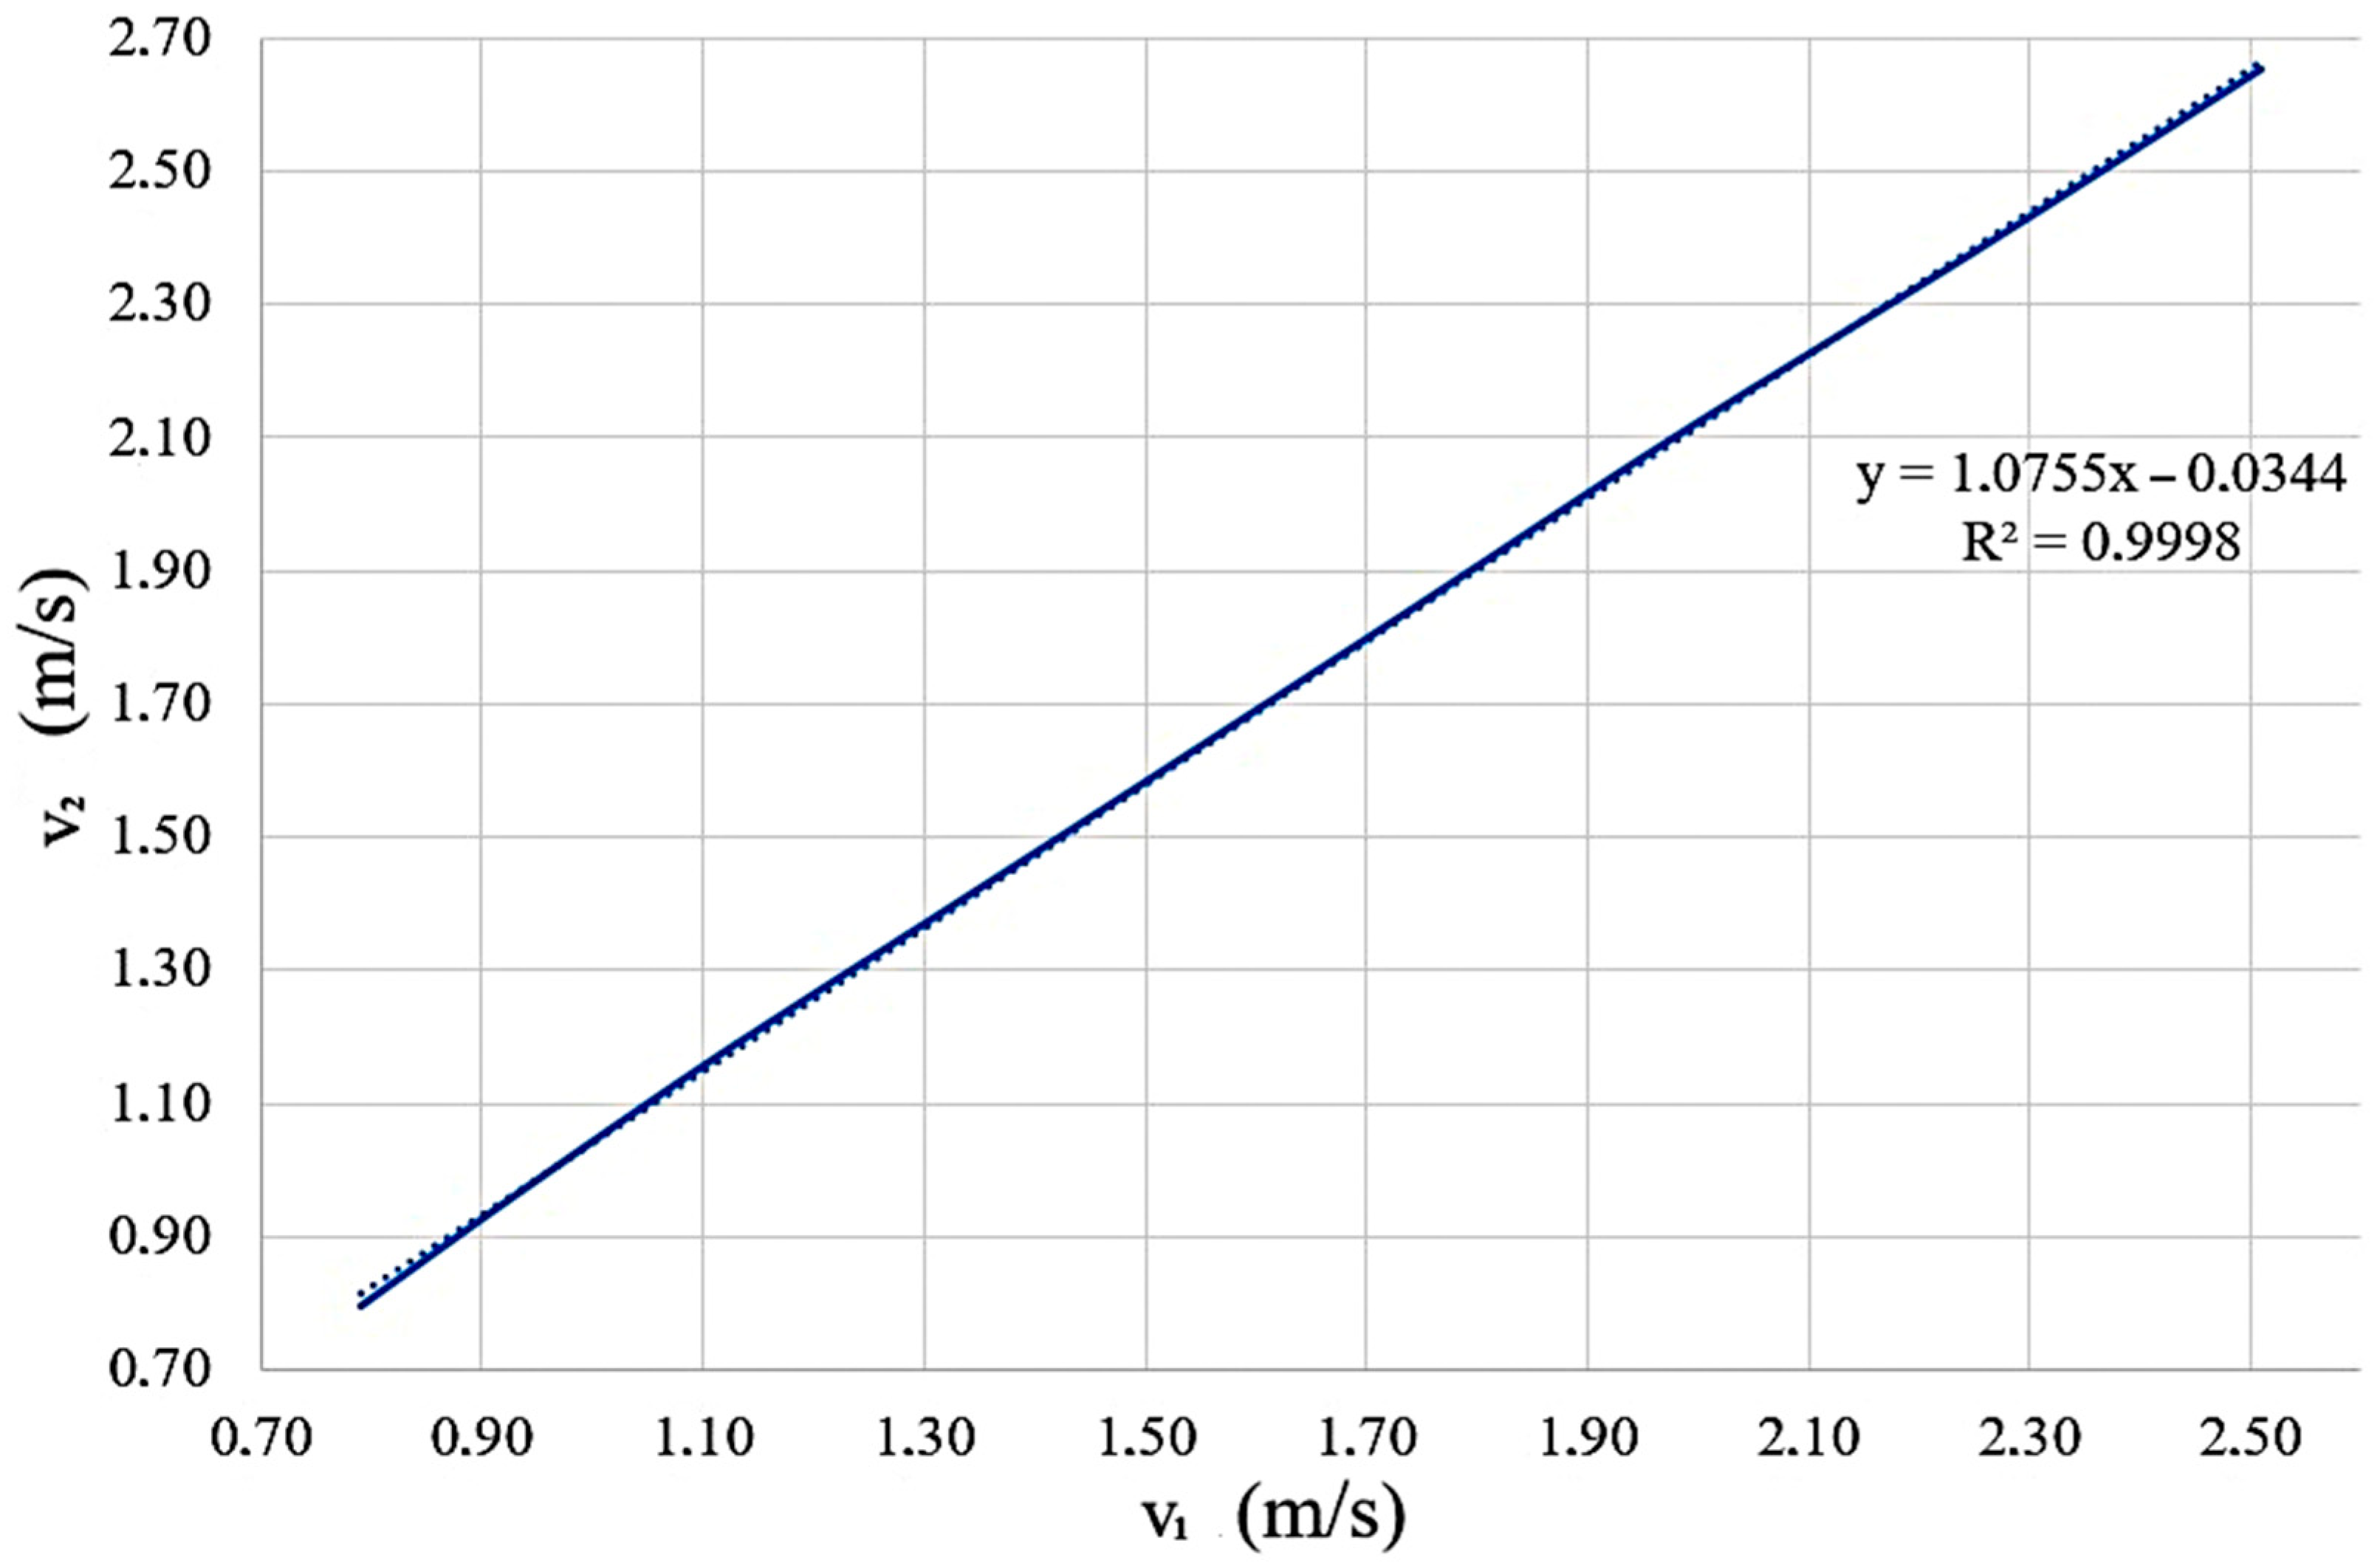
Based on the air velocity data (determined with NTC sensor) obtained at 22 °C, and the data obtained at 23 °C, a linear equation was obtained (Figure 8). Using this model, 6 equations were obtained relating the air velocity data at 22 °C and the air velocity data obtained at temperatures from 23 °C to 28 °C.
Figure 8.
Graphical representation of the equation obtained between the air flow velocity determined at a temperature of 22 °C and the air flow velocity determined at a temperature of 23 °C. v1—air velocity at 22 °C; v2—air velocity at 23 °C.
Using the above-mentioned equations, a formula for temperature compensation of the air velocity was obtained (Equation (10)):
where (m/s) is the air velocity measured with the NTC anemometer.
3.3. Statistical Analysis and Error Calculation
In order to estimate the systematic errors, the arithmetic mean of 100 air velocity measurements (for the same fan speed and a temperature of 28 °C, made with the NTC anemometer after applying temperature compensation) was calculated, using the anemometer testo 405i as reference. The relationship used for the systematic error was:
where —arithmetic mean of 100 velocity readings with the NTC anemometer; and —arithmetic mean of 100 velocity readings with the testo 405i anemometer.
After determining the systematic errors, it was concluded that the maximum deviation from the real value was ±0.07 m/s.
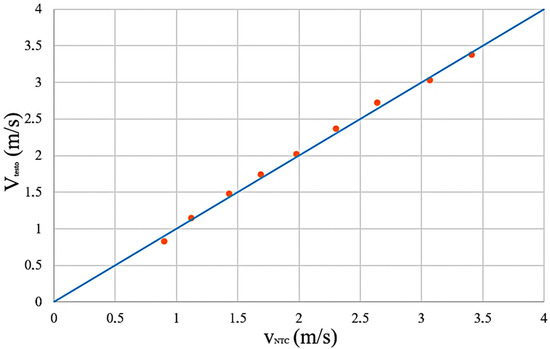
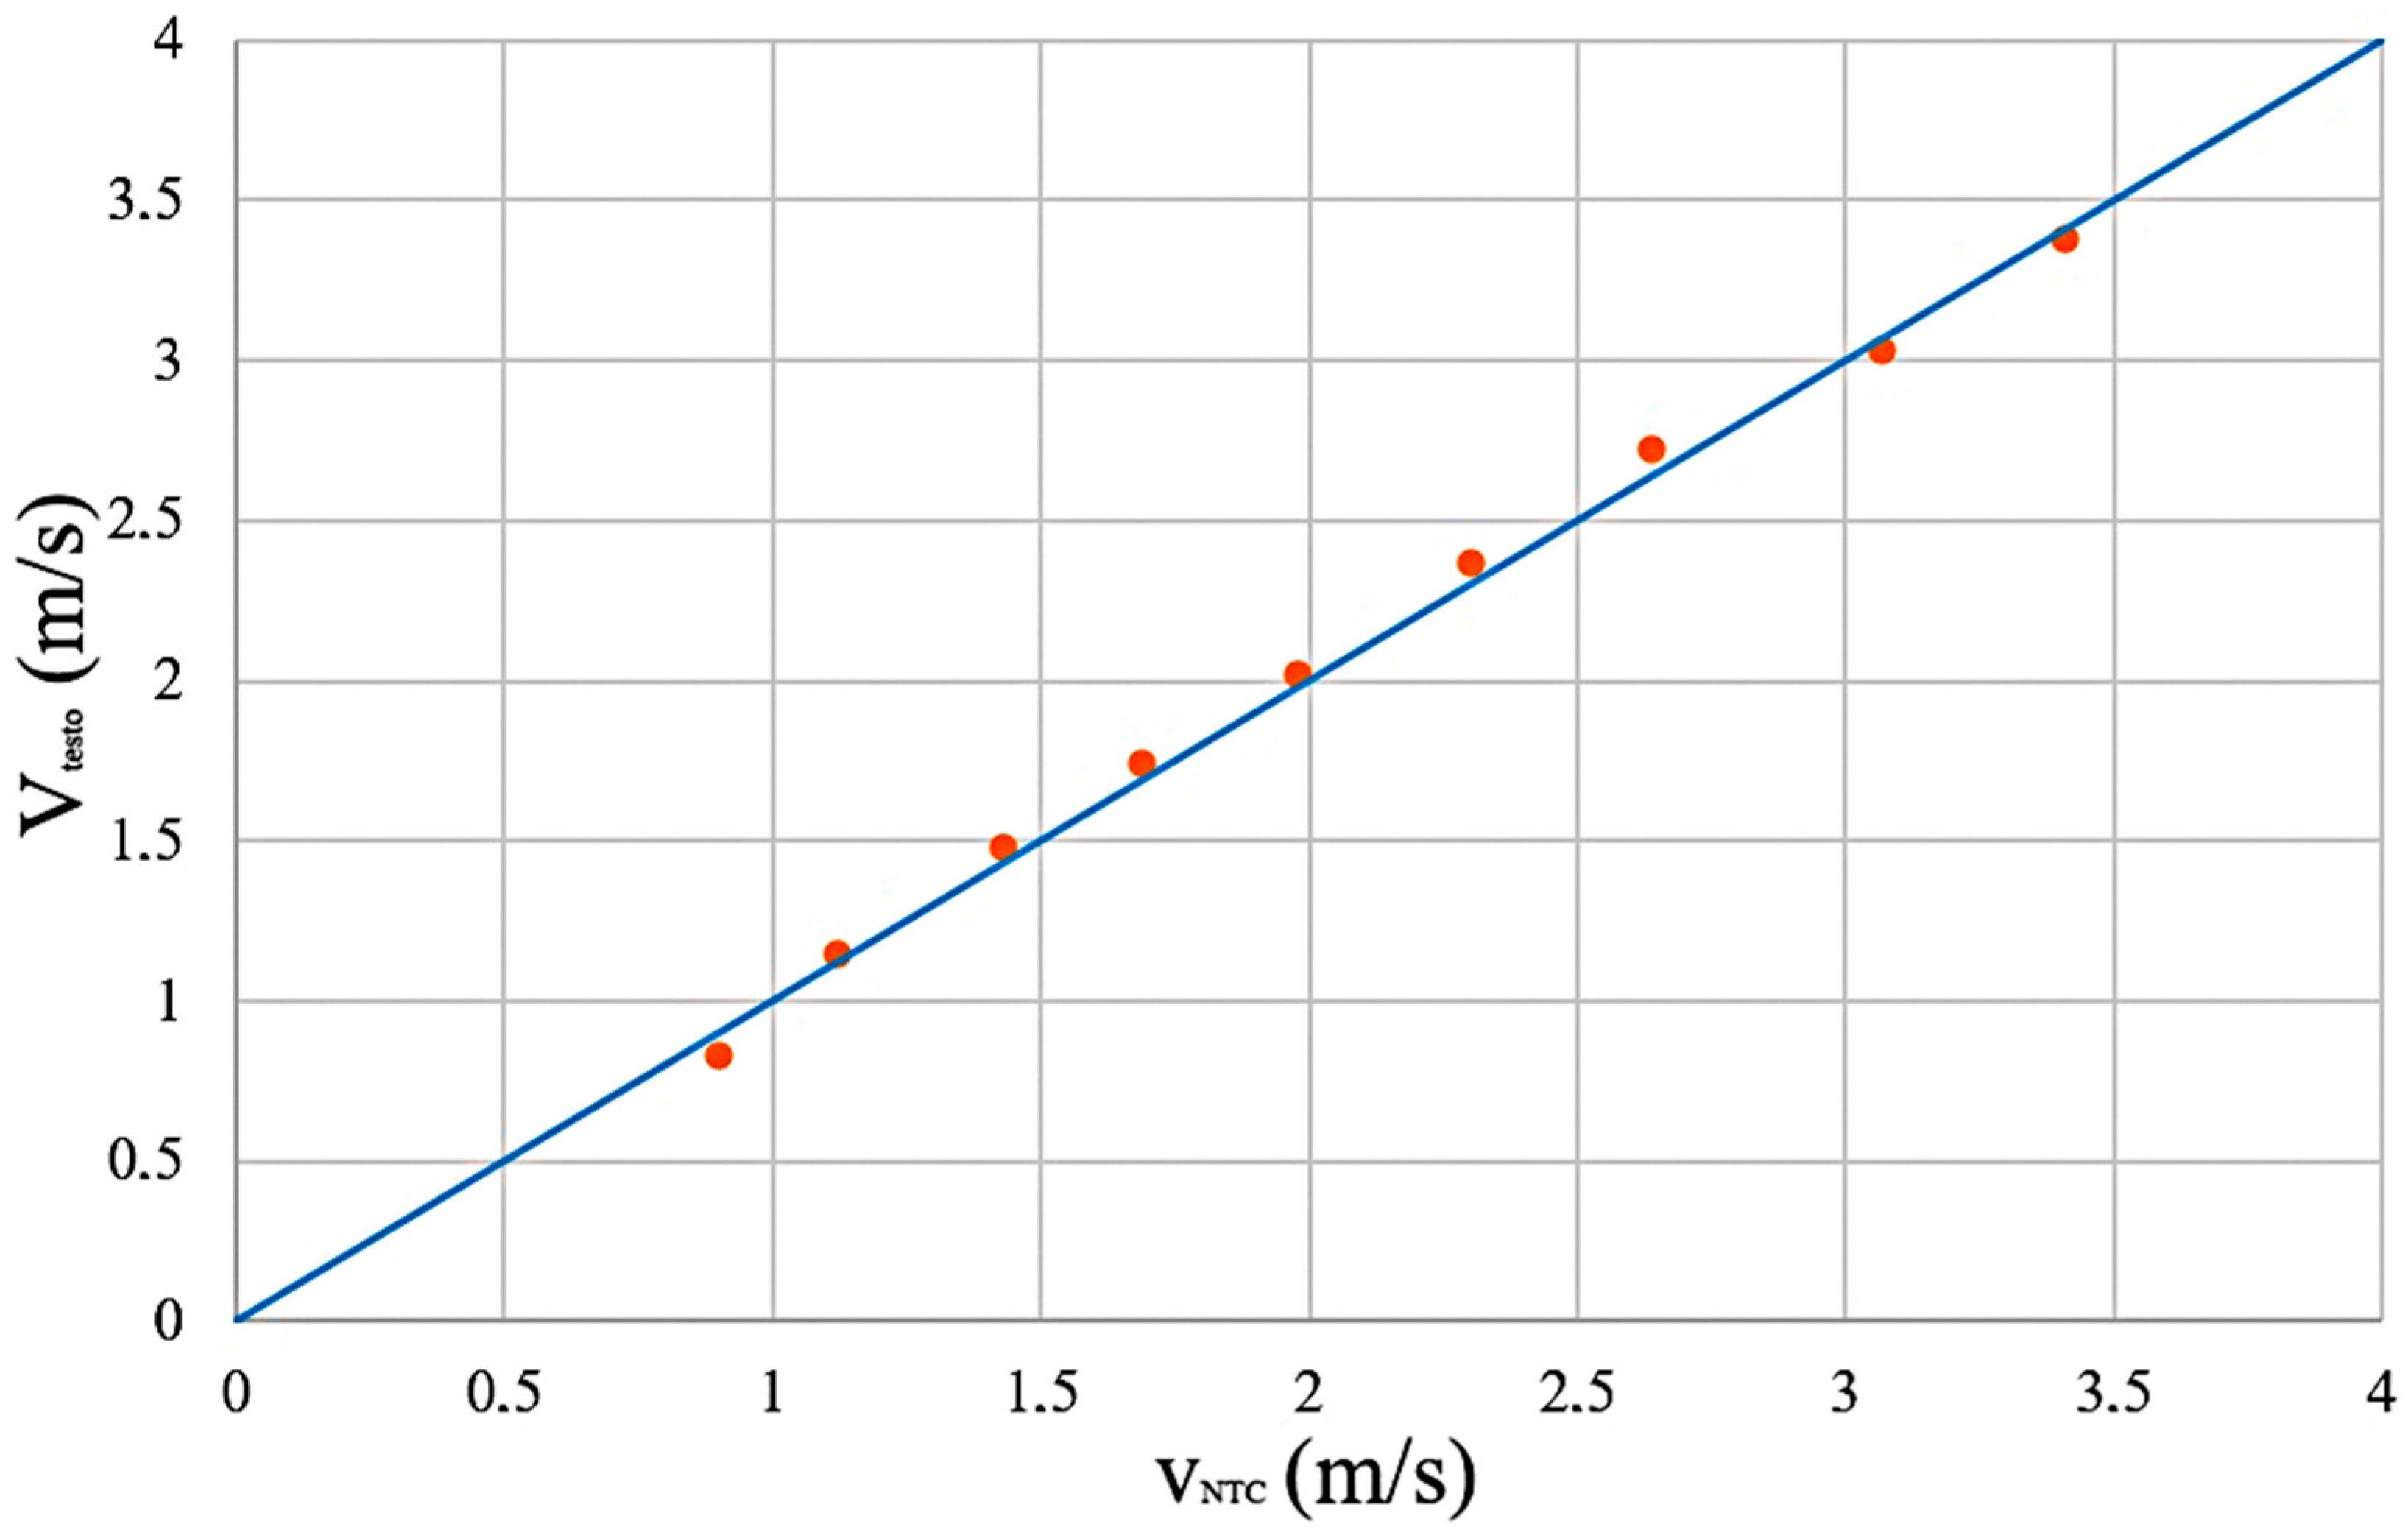
The chart in Figure 9 presents the deviation of the velocity values obtained with the NTC anemometer sensor compared to the testo 405i anemometer after the sample standard deviation was calculated using the equation:
where: —standard deviation; —number of measurements; —individual values; –arithmetic mean.
Figure 9.
Deviations between NTC and testo 405i readings. VNTC—air velocity measured by the NTC anemometer; Vtesto—air velocity measured by the testo 405i anemometer.
The minimum deviation between the air velocity measurements made with the NTC anemometer sensor and the testo 405i anemometer was ±0.03 m/s, while the maximum deviation recorded was ±0.08 m/s, to this value is added the anemometer error, which is ±0.1 m/s.
The coefficient of variation (CV) or relative standard deviation measures the amount of dispersion around the mean in a dataset; it was calculated with the formula:
where is the standard deviation and is the arithmetic mean of 100 air velocity measurements.
The calculated relative standard deviation was 0.54%, which meant that there were no systematic errors in the dataset provided by the NTC anemometer.
The validation of the results from the NTC and testo 405i anemometers was carried out using the t-test and Bland-Altman analysis. The t-test was performed on a sample of 100 values determined with the anemometric sensor (denoted by x) and a second sample of 100 values determined by the testo 405i anemometer (denoted by y). The air velocity values determined by the NTC anemometric sensor varied in the range 2.49–2.62, and the values determined by the testo 405i anemometer varied in the range 2.53–2.57.
Following the application of the t-test, it appears that the estimated difference between the two means is positive and is in the range of 0.0103 and 0.0237.
The calculation relationships used in statistics for the t-test:
where: —t-test; , —number of values taken into account; —average of the values determined by the NTC; —average of the values determined by the testo 405i anemometer; —combined standard deviation; —degrees of freedom.
Since the p-value is very small (5.8112 ∙ 10−25), it excludes the probability that a value between the two means would occur by chance, which validates and supports the data obtained. The confidence interval is 95% for the difference in means (0.0514–0.0686), resulting in a difference between means of 0.06 (Table 1).
Table 1.
Results from the t-test.
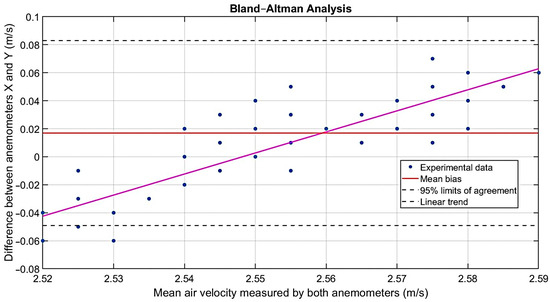
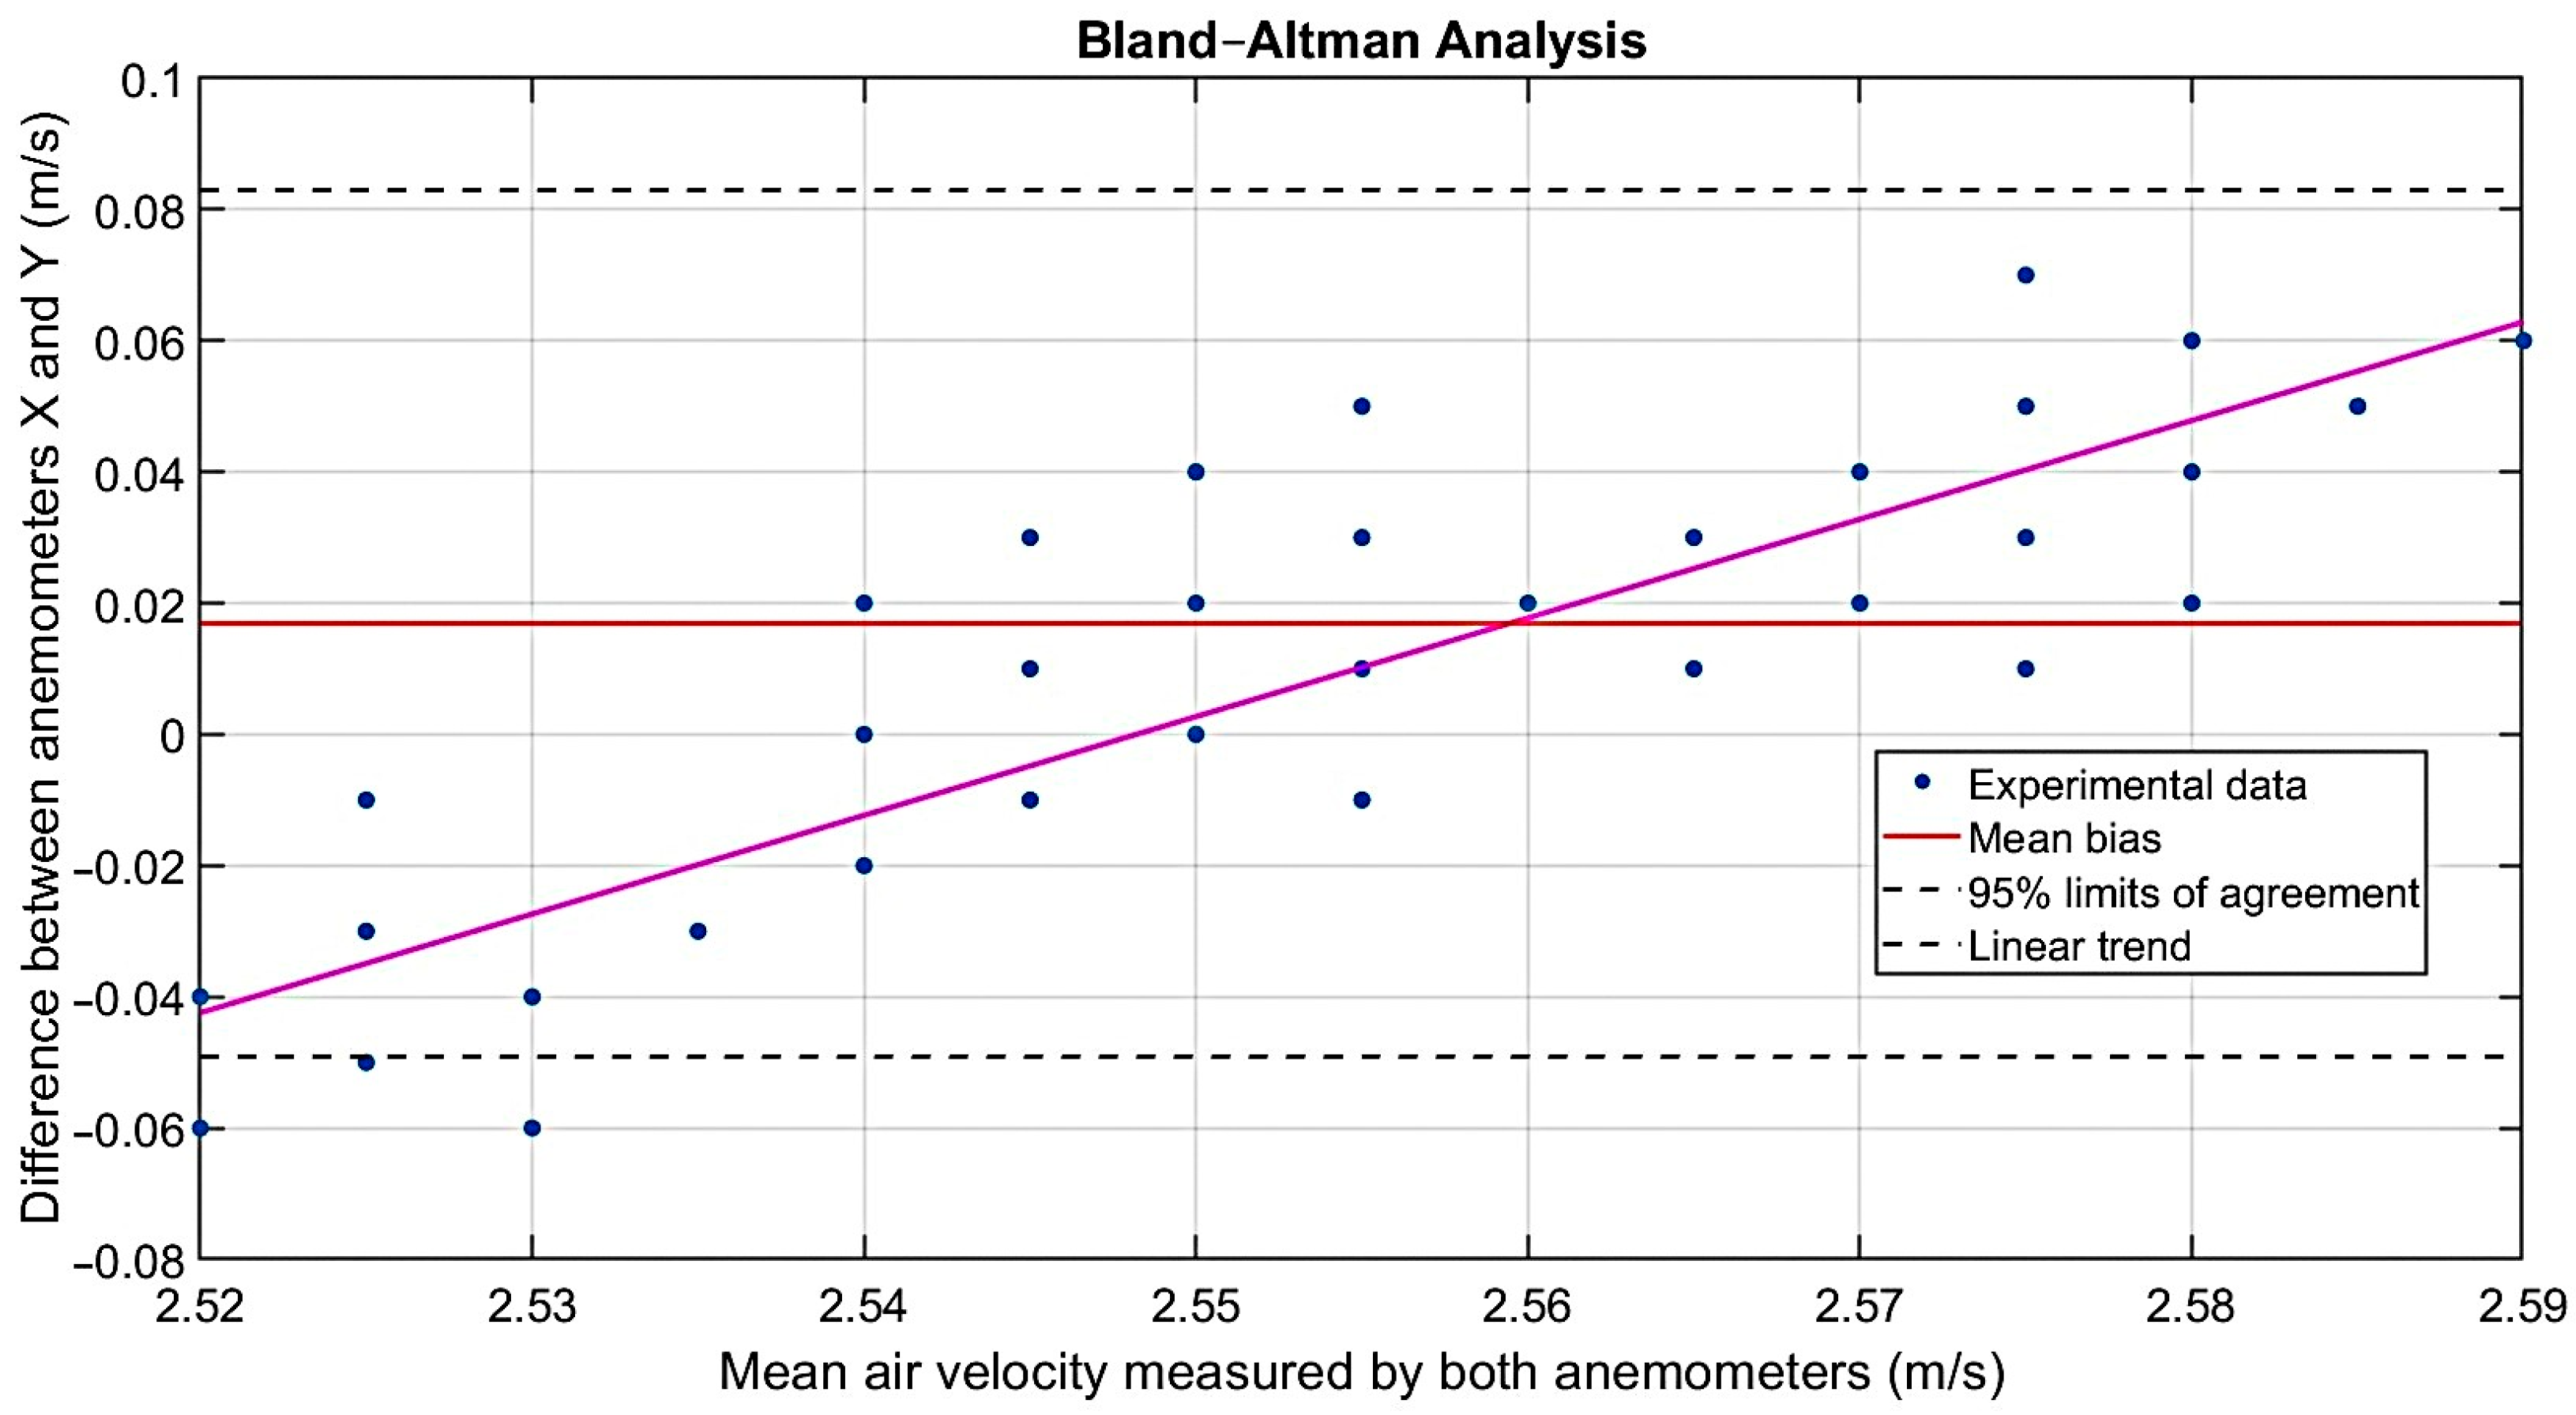
When determining the agreement between the results of the two determinations (NTC anemometer vs. testo 405i), the Bland-Altman method was applied (Figure 10).
Figure 10.
Bland-Altman analysis (the purple line is the average of the experimental data).
In implementing this statistical method the following equations were used to calculate the differences and the mean:
where: —the difference between the paired values (measured by NTC and testo 405i); —the air velocity determined by the NTC anemometer; —the air velocity determined by testo 405i.
where: —average of the two determinations
The differences obtained show how much the values measured with the NTC anemometer sensor deviate from the testo 405i anemometer.
The difference in the averages between the two sample values was determined, which determines whether the anemometer sensor measures the air velocity more or less than the testo 405i anemometer.
On the X axis of the graph is represented the average of the measurements between the two anemometers (NTC and testo 405i). On the Y axis of the graph is represented the difference (x − y) between the two anemometers. And the red line represents the difference between the averages of the two anemometers. The analysis results in a mean bias of approximately 0.0170, which means that the anemometer with NTC measures 0.03 m/s more than the testo 405i. Also, the standard deviation of the differences is 0.0337; it results in the upper agreement limit being 0.0831, and the lower agreement limit being −0.0491 and the confidence interval is 95%.
Therefore, the differences between the NTC anemometer sensor and the testo 405i anemometer are very small, the dispersion of the differences is reduced, and most of the values are within the agreement limits.
3.4. Practical Applicability of the Sensor
The developed anemometric sensor will be placed on an experimental stand, through which the working parameters of the cleaning system of the agricultural seed harvesters are studied, at the level of the upper surface of the sieve without using material (MOG) for cleaning or dust (Figure 11). To determine the airflow speed, only the fan of the stand will be operated; the anemometric sensor will measure the airflow velocity at the level of the upper surface of each sieve.
Figure 11.
Experimental stand for determining the velocity of the airflow created by the fan of the combine cleaning system [21].
After determining the air flow velocity profile across the entire surface of the upper sieve using the anemometric sensor (or a group of anemometric sensors mounted on the sieve surface), decisions will be made regarding the uniformity/non-uniformity of the air flow velocity profile still in the design phase, and if necessary, action will be taken to modify the constructive parameters of the combine harvester cleaning system or the flow generated by the fan to uniformize the air flow velocity profile and optimize the work process.
Unlike commercial anemometers (such as the testo 405i) that can determine the airflow velocity at a single point, the proposed anemometric sensor can measure the airflow velocity at multiple points simultaneously on the sieve surface of the combine harvester cleaning system.
While the use of commercial anemometers to perform a spatial mapping of the air flow velocity profile on the sieve surface involves high acquisition costs (eliminating the need to purchase multiple individual anemometers) and technical integration difficulties, the proposed sensor allows for the parallel connection of multiple independent sensors, ensuring real-time data acquisition from the entire surface of the cleaning system.
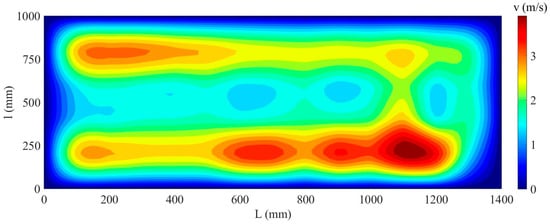
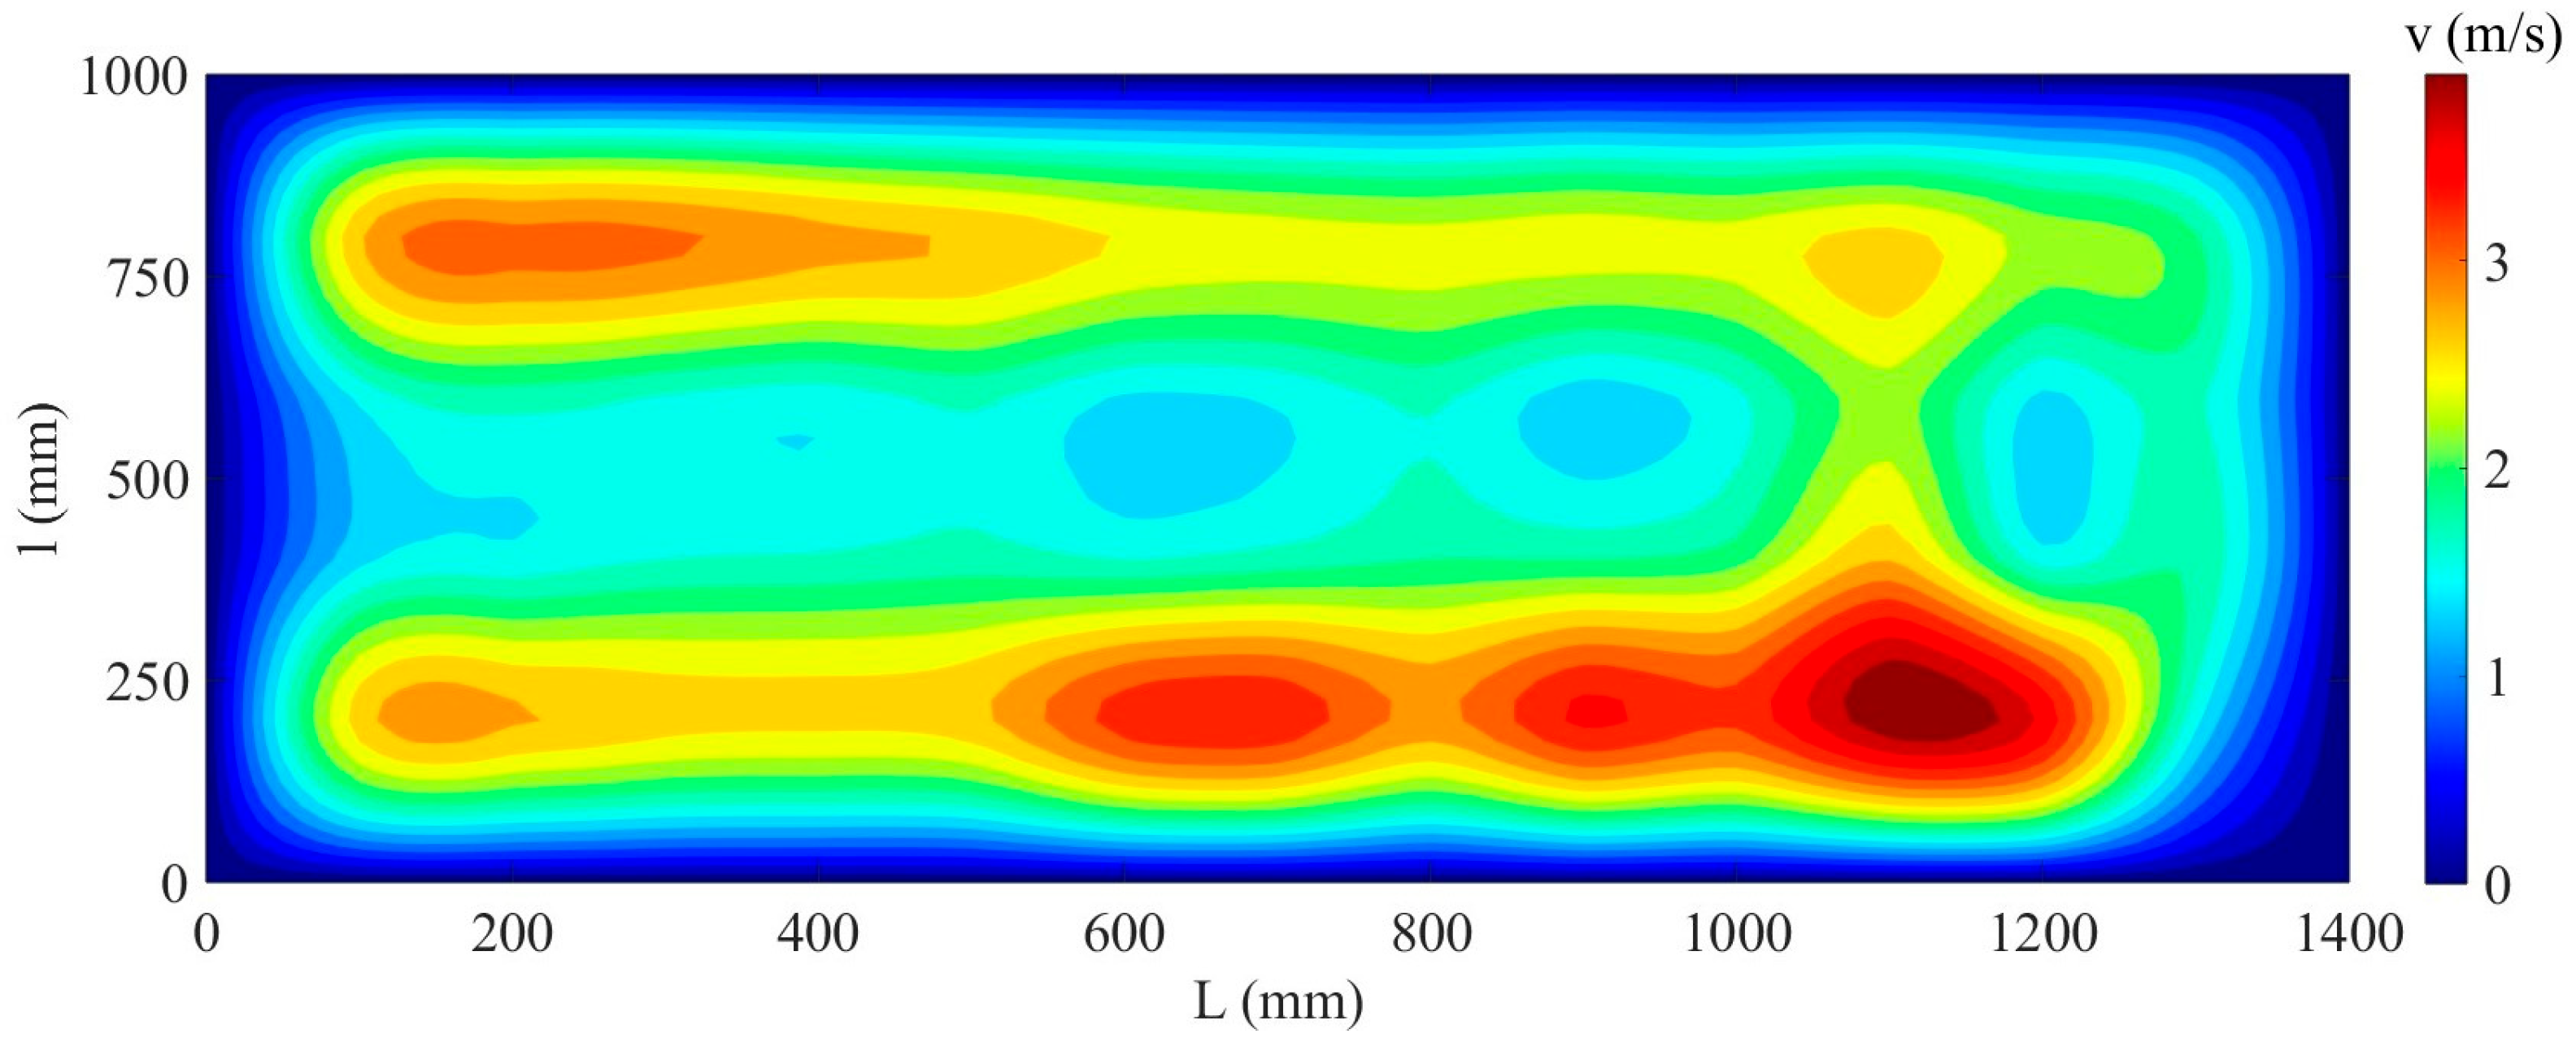
To support and validate the scientific approach, Figure 12 presents a (2D) image of the airflow velocity profile on the sieve surface, determined on a commercial and frequently used combine, at a fan speed of 800 RPM at a certain opening position of the upper and lower sieve, measured by means of the created NTC sensor.
Figure 12.
Airflow velocity profile, measured with the NTC sensor and generated by the cleaning system fan, determined on the sieve surface. L (mm)—sieve length; l (mm)—sieve width; v (m/s)—airflow velocity.
The non-uniform pattern observed in Figure 12 can be explained aerodynamically by the position and geometry of the cleaning system fan in relation to the sieve surface. The speed peaks recorded near the fan outlet (L = 0–200 mm and L = 1000–1300 mm) correspond to the areas where the air flow reaches the sieve with minimal energy losses, while on the central and rear surfaces the air flow velocity decreases, due both to the configuration of the fan type (the air flow is higher in the suction area and lower in the central area) and the divergence of the air flow as it moves away from the fan, as well as to the air redirection effect of the corrugated supply plane and especially the angle of the sieve louvers. This spatial correlation between the fan geometry, the sieve louvers setting, and the measured velocity field indicates that the non-uniformity of the airflow is not a measurement error but a structural feature of the cleaning system, which could be mitigated by repositioning the fan, resizing the air duct, or variable adjustment of the louvers opening angle.
The manufacturing cost of the sensor is a small fraction of the cost of a commercial hot-wire anemometer. The results demonstrate that high accuracy (bias = 0.0170 m/s) can be achieved with affordable and low-cost components, allowing the use of multiple sensors to measure airflow velocity at multiple locations. The small size of the NTC sensor also allows multiple sensors to be embedded directly into the air stream without disturbing the airfoil.
4. Discussion
The proposed sensor was designed exclusively as a tool for testing and aerodynamic optimization on an experimental stand during the design phase (test hall, laboratory without plant material, at temperatures of 22–28 °C). The sensor is not intended for direct measurements during field harvesting, where dust and plant debris would affect the proper functioning of the NTC. From a physical point of view, if the ambient temperature goes outside the range of 22–28 °C, the gradient ΔT = TNTC − Tambient changes. Although the software algorithm can mathematically extrapolate the equation, this operation introduces additional errors; therefore, for use at other laboratory temperatures, prior recalibration on the stand is mandatory.
Based on the experimental protocol, an anemometric sensor based on NTC can be built and calibrated that can work on a much larger range of airflow velocity and temperature than the one calibrated in this experience.
For good accuracy of the anemometric sensor, it is necessary to use precision components, especially resistors. Also, the use of shielded cable as a connecting element between the sensor components leads to the elimination of electromagnetic influences that occur during operation, but especially during calibration.
Measuring air velocity profiles on the sieve surface of combine harvester cleaning systems presents unique metrological challenges due to non-uniform flow distributions and low air velocities. Conventional mechanical anemometers have high mechanical inertia and a high starting threshold (>0.5 m/s), which makes them unsuitable for accurately determining low velocities. Pitot tubes, although robust, lose sensitivity to pressure differences when used at velocities below 2.0 m/s.
The reference anemometer used (testo 405i with calibration certificate) has a manufacturer-declared accuracy of ±0.1 m/s for the range 0–2 m/s and ±0.3 m/s for the range 2–15 m/s, with a resolution of 0.01 m/s. The calculated average error of the proposed sensor (bias = 0.0170 m/s) and the maximum deviation of ±0.08 m/s are within the error given by the reference anemometer (testo 405i). However, the expanded uncertainty of the developed sensor directly includes the uncertainty of the reference anemometer (testo 405i).
5. Conclusions
The aim and objectives of this paper are to design, build, and calibrate a low-cost thermistor (NTC) anemometric sensor, specifically developed for aerodynamic optimization studies of combine harvester cleaning systems, under controlled laboratory conditions. By replacing the conventional Wheatstone bridge with a constant current source (LM317), a 16-bit ADC converter (ADS1115), and an RC low-pass filter, the proposed architecture achieves the resolution required for accurate detection of fine voltage variations at low air velocities (<1 m/s), typical of flows at the sieve surface, a field in which mechanical anemometers are largely ineffective due to friction in the bearings.
As a novelty, the calibration was carried out in relation to the testo 405i anemometer in a specially built wind tunnel for this purpose, over the range 0–4.5 m/s, leading to a third-degree polynomial relationship between NTC voltage and air velocity, with an excellent correlation (R2 = 0.998). Since the thermal response of the sensor is sensitive to ambient temperature, a dedicated temperature compensation model was developed and validated over the range of 22–28 °C. Statistical validation by paired t-test and Bland-Altman analysis confirmed that, after compensation, the NTC sensor measurements were in close agreement with the reference instrument, with an average systematic error (bias) of only 0.017 m/s and 95% agreement limits ranging from −0.049 m/s to +0.083 m/s—falling within the tolerance declared by the manufacturer of the testo 405i anemometer.
The proposed sensor has a number of advantages over commercial single-point anemometers, in that it has a low cost per unit and small physical dimensions, which allow the use of several units in parallel, for simultaneous multi-point acquisition and, implicitly, for 2D/3D mapping of the air velocity profile over the entire surface of the sieve—a result difficult and expensive to obtain with commercial hot-wire or turbine anemometers. The preliminary airflow map obtained on a combine harvester cleaning system (Figure 12) illustrates this capability and confirms the sensor’s suitability for identifying non-uniformities in airflow distribution at the design stage.
The sensor has been calibrated and validated exclusively for use on experimental stands, in a controlled, dust-free, and crop residue (MOG)-free laboratory environment, and in the temperature range of 22–28 °C; outside this range, recalibration is required and the device is not intended for direct field measurements during harvest.
Future research will focus on extending the calibration range to lower or higher air velocities, as well as to larger temperature ranges, validating the sensor network under multi-point simultaneous acquisition conditions for agricultural combine cleaning systems at full scale, as well as evaluating the long-term stability and repeatability between sensors, with the aim of establishing this device as a standard, low-cost tool for aerodynamic optimization of pneumatic seed cleaning installations.
Author Contributions
Conceptualization, I.-A.D., P.-M.C., R.R., A.-I.T. and I.Ţ.; methodology, I.-A.D., P.-M.C., R.R., V.N.A., A.-I.T. and I.Ţ.; software, I.-A.D. and P.-M.C.; validation, I.Ţ. and P.-M.C.; formal analysis, R.R.; investigation, I.-A.D.; resources, I.-A.D., V.N.A. and P.-M.C.; data curation, I.-A.D., P.-M.C. and I.Ţ.; writing—original draft preparation, I.-A.D., P.-M.C. and I.Ţ.; writing—review and editing, I.-A.D., P.-M.C., R.R., V.N.A. and I.Ţ.; visualization, P.-M.C., R.R. and I.Ţ.; supervision, I.Ţ.; project administration, I.Ţ.; funding acquisition, I.-A.D. and I.Ţ. All authors have read and agreed to the published version of the manuscript.
Funding
This paper was financially supported by the doctoral grant, according to the Doctoral University Studies Contract, no. 10542/02.10.2023, concluded with the “Ion Ionescu de la Brad” University for Life Sciences in Iași, as the Organizing Institution for Doctoral University Studies (IOSUD).
Data Availability Statement
The original contributions presented in this study have been included in the article. Further inquiries can be directed to the corresponding author.
Acknowledgments
The authors sincerely thank the reviewers and editors for their valuable feedback and efforts. They also appreciate the support of the laboratory members, whose contributions were essential to this research.
Conflicts of Interest
The authors declare no conflicts of interest.
Abbreviations
The following abbreviations are used in this manuscript:
| NTC | Negative Temperature Coefficient |
| MOG | Material other than grain |
| IoT | Internet of Things |
| AI | Artificial intelligence |
| I.C. | Integrated Circuit |
References
- Araújo, S.O.; Peres, R.S.; Ramalho, J.C.; Lidon, F.; Barata, J. Machine Learning Applications in Agriculture: Current Trends, Challenges, and Future Perspectives. Agronomy 2023, 13, 2976. [Google Scholar] [CrossRef] [Scilit]
- Mansoor, S.; Iqbal, S.; Popescu, S.M.; Kim, S.L.; Chung, Y.S.; Baek, J.H. Integration of smart sensors and IOT in precision agriculture: Trends, challenges and future prospectives. Front. Plant Sci. 2025, 16, 1587869. [Google Scholar] [CrossRef] [Scilit] [PubMed]
- Karunathilake, E.M.B.M.; Le, A.T.; Heo, S.; Chung, Y.S.; Mansoor, S. The Path to Smart Farming: Innovations and Opportunities in Precision Agriculture. Agriculture 2023, 13, 1593. [Google Scholar] [CrossRef] [Scilit]
- Albiero, D.; Garcia, A.P.; Umezu, C.K.; Leme de Paulo, R. Swarm robots in mechanized agricultural operations: A review about challenges for research. Comput. Electron. Agric. 2022, 193, 106608. [Google Scholar] [CrossRef] [Scilit]
- Aijaz, N.; Lan, H.; Raza, T.; Yaqub, M.; Iqbal, R.; Pathan, M.S. Artificial intelligence in agriculture: Advancing crop productivity and sustainability. J. Agric. Food Res. 2025, 20, 101762. [Google Scholar] [CrossRef] [Scilit]
- Miller, T.; Mikiciuk, G.; Durlik, I.; Mikiciuk, M.; Łobodzińska, A.; Śnieg, M. The IoT and AI in Agriculture: The Time Is Now—A Systematic Review of Smart Sensing Technologies. Sensors 2025, 25, 3583. [Google Scholar] [CrossRef] [Scilit] [PubMed]
- Elbasi, E.; Mostafa, N.; Alarnaout, Z.; Zreikat, A.I.; Cina, E.; Varghese, G.; Shdefat, A.; Topcu, A.E.; Abdelbaki, W.; Mathew, S.; et al. Artificial Intelligence Technology in the Agricultural Sector: A Systematic Literature Review. IEEE Access 2023, 11, 171–202. [Google Scholar] [CrossRef] [Scilit]
- Ghobadpour, A.; Monsalve, G.; Cardenas, A.; Mousazadeh, H. Off-Road Electric Vehicles and Autonomous Robots in Agricultural Sector: Trends, Challenges, and Opportunities. Vehicles 2022, 4, 843–864. [Google Scholar] [CrossRef] [Scilit]
- Rajak, P.; Ganguly, A.; Adhikary, S.; Bhattacharya, S. Internet of Things and smart sensors in agriculture: Scopes and challenges. J. Agric. Food Res. 2023, 14, 100776. [Google Scholar] [CrossRef] [Scilit]
- Soussi, A.; Zero, E.; Sacile, R.; Trinchero, D.; Fossa, M. Smart Sensors and Smart Data for Precision Agriculture: A Review. Sensors 2024, 24, 2647. [Google Scholar] [CrossRef] [Scilit] [PubMed]
- Aarif, K.O.; Alam, A.; Hotak, Y. Smart Sensor Technologies Shaping the Future of Precision Agriculture: Recent Advances and Future Outlooks. J. Sens. 2024, 2025, 2460098. [Google Scholar] [CrossRef] [Scilit]
- Rizan, N.; Balasundram, S.K.; Shahbazi, A.B.; Balachandran, U.; Shamshiri, R.R. Internet-of-Things for Smart Agriculture: Current Applications, Future Perspectives, and Limitations. Agric. Sci. 2024, 15, 1446–1475. [Google Scholar]
- Al-Sammarraie, M.A.J.; Alhadithi, S.A. Determination of Grain Losses on Combine Harvester. J. Sci. Eng. Res. 2021, 8, 196–202. [Google Scholar]
- Regmi, S.; Rexroad, W.; Lecher, T.; Allen, C.M. Combine soybean harvesting performance with grain loss distribution. J. Agric. Food Res. 2025, 23, 102241. [Google Scholar] [CrossRef] [Scilit]
- Wang, J.; Shan, C.; Gou, F.; Qian, Z.; Ni, Y.; Liu, Z.; Jin, C. A Review of Key Technologies and Intelligent Applications in Soybean Mechanized Harvesting: Chinese and International Perspectives. J. Biosyst. Eng. 2025, 50, 79–104. [Google Scholar] [CrossRef] [Scilit]
- Liang, Z.; Wada, M.E. Development of cleaning systems for combine harvesters: A review. Biosyst. Eng. 2023, 236, 79–102. [Google Scholar] [CrossRef] [Scilit]
- Miu, P. Combine Harvesters Theory, Modeling, and Design; CRC Press, part of the Taylor & Francis Group, USA Parkway NW; CRC Press: Boca Raton, FL, USA, 2015; pp. 1–9. [Google Scholar]
- Xu, L.; Li, Y.; Chai, X.; Wang, G.; Liang, Z.; Li, Y.; Li, B. Numerical simulation of gas–solid two-phase flow to predict the cleaning performance of rice combine harvesters. Biosyst. Eng. 2020, 190, 11–24. [Google Scholar] [CrossRef] [Scilit]
- Liu, Z.; Yang, T.; Li, P.; Wang, J.; Xu, J.; Jin, C. The Design and Experimentation of a Differential Grain Moisture Detection Device for a Combined Harvester. Sensors 2024, 24, 4551. [Google Scholar] [CrossRef] [Scilit] [PubMed]
- Wang, K.; Xie, R.; Ming, B.; Hou, P.; Xue, J.; Li, S. Review of Combine Harvester Losses for Maize and Influencing Factors. Int. J. Agric. Biol. Eng. 2021, 14, 1–10. [Google Scholar] [CrossRef] [Scilit]
- Dumbravă, I.A.; Cârlescu, P.M.; Roșca, R.; Ţenu, I. Installation and Advanced Method for the Evaluation of Air Velocity over the Sieves of the Cleaning Unit of Combine Harvesters. Agriculture 2025, 15, 2173. [Google Scholar] [CrossRef] [Scilit]
- Chen, P.; Yang, H.; Zhao, C.; Pei, J.; Gu, F.; Wang, Y.; Yu, Z.; Wu, F. Current Status and Future Prospects of Simulation Technology in Cleaning Systems for Crop Harvesters. Agriculture 2026, 16, 446. [Google Scholar] [CrossRef] [Scilit]
- Pustovaya, O.A.; Pustovoy, E.A.; Usanov, V.S.; Sakharov, V.A.; Lipkan, A.V.; Kotenko, D.S. Development of an Automatic Adjustment System for Air-and-Screen Cleaning of a Modernized Combine Harvester. BIO Web Conf. 2025, 179, 15001. [Google Scholar] [CrossRef] [Scilit]
- Wang, L.; Chai, X.; Huang, J.; Hu, J.; Cui, Z. Efficient and Low-Loss Cleaning Method for Non-Uniform Distribution of Threshed Materials Based on Multi-Wing Curved Combination Air Screen in Computational Fluid Dynamics/Discrete Element Method Simulations. Agriculture 2024, 14, 895. [Google Scholar] [CrossRef] [Scilit]
- Dumbravă, I.-A.; Cârlescu, P.-M.; Roșca, R.; Țenu, I. Study of the air velocity field in the combine harvesting cleaning system. Lucr. Ştiinţ. 2024, 67, 95–100. [Google Scholar]
- Yin, J.; Cui, Y.; Zha, Z.; Yu, Q.; Guan, P.; Wang, Y.; Wang, X.; Geng, D. Study and Testing of a Front-Blowing and Rear-Suction Enhanced Cleaning Technology for Grain Combine Harvesters. Agriculture 2025, 15, 1722. [Google Scholar] [CrossRef] [Scilit]
- Liang, Z.; Xu, L.; De Baerdemaeker, J.; Li, Y.; Saeys, W. Optimisation of a multi-duct cleaning device for rice combine harvesters utilising CFD and experiments. Biosyst. Eng. 2020, 190, 25–40. [Google Scholar] [CrossRef] [Scilit]
- Zhang, K.; Shen, H.; Wang, H.; Xu, X.; Han, T.; Guo, H. Automatic Monitoring System for Threshing and Cleaning of Combine Harvester. IOP Conf. Ser. Mater. Sci. Eng. 2018, 452, 042124. [Google Scholar] [CrossRef] [Scilit]
- Stornelli, V.; Ferri, G.; Leoni, A.; Pantoli, L. The assessment of wind conditions by means of hot wire sensors and a modifed Wheatstone bridge architecture. Sens. Actuators A Phys. 2017, 262, 130–139. [Google Scholar] [CrossRef] [Scilit]
- Leoni, A.; Stornelli, V.; Pantoli, L.A. A low-cost portable spherical directional anemometer for fixed points measurement. Sens. Actuators A Phys. 2018, 280, 543–551. [Google Scholar] [CrossRef] [Scilit]
- Jerotić, A.; Đokić, D.; Atanasijević, P.; Mihailović, P. Non-bridge NTC thermistor anemometer with programmable sensitivity. Flow Meas. Instrum. 2024, 96, 102544. [Google Scholar] [CrossRef] [Scilit]
- Zhou, T.; Zhang, Z.; Tian, Y.; Xi, Z.; Dou, X.; Liu, W.; Zhang, G.; Gao, C. A Calibration Facility for Hot-Wire Anemometers in Extremely Low Speed with Air Temperature and Humidity Variable and Controllable. Appl. Sci. 2024, 14, 1587. [Google Scholar] [CrossRef] [Scilit]
- Miheev, N.I.; Molochnikov, V.M.; Kratirov, D.V.; Hayrnasov, K.R.; Zanko, P.S. Hot-wire measurements with automatic compensation of ambient temperature changes. Therm. Sci. 2015, 19, 509–520. [Google Scholar] [CrossRef] [Scilit]
- Atanasijević, P.; Mihailović, P. Temperature compensation of NTC thermistors based anemometer. Sens. Actuators A Phys. 2019, 285, 210–215. [Google Scholar] [CrossRef] [Scilit]
- Ligęza, P.; Jamróz, P. A Hot-Wire Anemometer with Automatically Adjusted Dynamic Properties for Wind Energy Spectrum Analysis. Energies 2022, 15, 4618. [Google Scholar] [CrossRef] [Scilit]
- Souza, E.L.D.J.; Santos, T.L.M. Transient compensation for thermistor-based sensors in constant temperature configuration. Sens. Actuators A Phys. 2020, 305, 111920. [Google Scholar] [CrossRef] [Scilit]
- Ardekani, M.A.; Farhani, F. Experimental study on response of hot wire and cylindrical hot film anemometers operating under varying fluid temperatures. Flow Meas. Instrum. 2009, 20, 174–179. [Google Scholar] [CrossRef] [Scilit]
- Gao, Y.; Ramirez, B.C.; Hoff, S.J. Omnidirectional thermal anemometer for low airspeed and multi-point measurement applications. Comput. Electron. Agric. 2016, 127, 439–450. [Google Scholar] [CrossRef] [Scilit]
- Pezzotti, S.; D’Iorio, J.I.; Nadal-Mora, V.; Pesarini, A. A wind tunnel for anemometer calibration in the range of 0.2–1.25 m/s. Flow Meas. Instrum. 2011, 22, 338–342. [Google Scholar] [CrossRef] [Scilit]
- Santos, V.C.V.; Santos, T.L.M. On the variance propagation of thermistor-based measurements with a digital temperature controller. Measurement 2022, 192, 110863. [Google Scholar] [CrossRef] [Scilit]
- Song, Z.; Chen, Z.; Du, G. Research progress on negative temperature coefficient thermistors: Review. J. Mater. Sci. Mater. Electron. 2025, 36, 688. [Google Scholar] [CrossRef] [Scilit]
- Dumbravă, I.A.; Cârlescu, P.M.; Țenu, I. Development of an anemometer for measuring air flow velocity in agriculture. Agron. Ser. Sci. Res. 2024, 67, 90–94. [Google Scholar]

Disclaimer/Publisher’s Note: The statements, opinions and data contained in all publications are solely those of the individual author(s) and contributor(s) and not of MDPI and/or the editor(s). MDPI and/or the editor(s) disclaim responsibility for any injury to people or property resulting from any ideas, methods, instructions or products referred to in the content. |
© 2026 by the authors. Licensee MDPI, Basel, Switzerland. This article is an open access article distributed under the terms and conditions of the Creative Commons Attribution (CC BY) license.