


Abstract
Plant factories with artificial light (PFAL) enable precise environmental control for vertical indoor agricultural production systems. However, their multi-layer configuration often creates stagnant air zones with significant temperature and humidity gradients. While ventilation systems are essential for mitigating these issues, their effective design requires accurate and distributed climate monitoring. The deployment of distributed microclimate sensors in PFAL environments remains challenging when multiple identical I2C sensors are required, particularly in low-cost monitoring architectures. Because of their fixed I2C addresses, these devices cannot be connected directly to the same bus without conflicts, prompting the need for multiple controllers and thereby increasing system costs. This study evaluates the implementation of a low-cost, multiplexed IoT sensor network for PFAL microclimate monitoring based on an ESP32 microcontroller and an I2C multiplexer (TCA9548A). This network enables simultaneous operation of five SHT20 temperature and humidity sensors at different levels within a PFAL structure. The multiplexing architecture generated coherent multipoint measurements, demonstrating its practical suitability for microclimate monitoring in PFAL environments. However, the system’s performance was compromised by its reliance on the local Wi-Fi network, resulting in intermittent connectivity failures and significant data loss during internet outages. The presented findings and observed limitations underscore the need for complementary strategies, such as local data buffering or a dedicated private network, to ensure reliable long-term monitoring in smart agricultural environments.
1. Introduction
1.1. The Role of Microclimate in PFAL Applications
Plant Factories with Artificial Lighting (PFALs) are a specific type of controlled environment agriculture (CEA) facility. They integrate multi-layer vertical shelves, LED lighting and, commonly, soilless cultivation. To maintain optimal growing conditions, PFALs require precise environmental control systems, including air conditioning, ventilation, CO2 enrichment, nutrient delivery, and automation [1,2,3,4]. Among these, air circulation is essential for ensuring uniform growing conditions by promoting convective heat transfer, reducing temperature gradients, and homogenizing the canopy environment [5]. Insufficient air circulation leads to heat and humidity stratification, creating heterogeneous microclimates that impair transpiration, photosynthesis, and overall physiological performance, resulting in uneven growth, increased disease susceptibility, and reduced yield [6,7].
In this context, the microclimate within a PFAL is inherently complex. According to Gu and Goto [8], the microclimate is influenced by a combination of external disturbances and internal control mechanisms that regulate the internal environmental conditions. Consequently, significant spatial variability may develop within the growing environment, making high-resolution, spatially distributed environmental monitoring essential for effective climate management in multi-layer PFALs.
1.2. Internet of Things (IoT) for Smart Farming
Internet of Things (IoT) technologies enable devices to communicate intelligently and collaboratively. According to ISO/IEC 20924:2024 [9], an IoT network consists of an architecture of connected devices that links events in the physical (analog) world to the virtual (digital) world. A stable internet connection enables device communication, data collection, and automated transmission to cloud servers for remote storage and access. Consequently, most IoT systems and devices support internet connectivity through internal chips or external modules using communication protocols, such as IEEE 802.11-2016 Wi-Fi (Wireless Fidelity) [10], used in local area networks (LANs).
In the context of smart farming, IoT technologies are integrated with sensor devices, embedded controllers, big data analytics, and decision-making platforms to automate agricultural monitoring and management. By enabling real-time data collection, remote monitoring, and intelligent decision-making, IoT can improve farming reliability, cost-effectiveness, and crop productivity [11,12,13]. In CEA, microcontroller (MCU) boards and IoT devices enable automated control of lighting, climate, and irrigation, as well as monitoring of environmental variables [14]. In such applications, MCUs provide digital and analog inputs/outputs, communication interfaces, program memory, and internet connectivity, supporting reliable data acquisition, environmental monitoring, and automated microclimate regulation. In accordance with Mansoor et al. [15], these systems improve yield and efficiency, while reducing the need for specialized labor. Together, these technologies enable the development of advanced smart farming solutions capable of minimizing costs and human labor in plant production [16,17].
Taken together, IoT networks integrate control systems, sensor devices, environmental monitoring, and actuating equipment for microclimate management in smart indoor farms [18]. Accordingly, previous studies have presented IoT-based environmental monitoring and control approaches with different functionalities and levels of maturity across smart farming systems [19,20,21,22], including smart PFALs [23,24,25,26]. These architectures range from low-cost, cloud-connected sensor nodes to more sophisticated control units incorporating artificial intelligence (AI) algorithms [27,28]. Such solutions support real-time environmental monitoring and regulation of variables, helping maintain optimal conditions for plant growth.
1.3. Problem Statement and Proposed Solution
In multi-layer PFAL systems, individual cultivation zones can experience distinct microclimate conditions due to differences in vertical position, airflow, and spatial layout. Consequently, multipoint data acquisition is essential for accurately detecting environmental variables and capturing their spatial variability. This requires the seamless integration of heterogeneous sensors with centralized data management platforms [29,30]. A typical architecture consists of a central server communicating with multiple distributed sensing nodes that continuously collect and transmit data to cloud-based systems for analysis and storage [19]. However, frequent data transmission and network requests can create communication bottlenecks and increase energy demands on sensor nodes.
Recent studies have demonstrated that multiplexed sensor arrays can detect and classify plant volatiles with over 97% accuracy [31], highlighting their potential for multimodal, high-resolution sensing. Extending this capability to PFAL monitoring requires modular IoT architectures that can support multiple sensors, including multiple identical devices. Such architectures can enable comprehensive multimodal monitoring of plant responses and environmental dynamics, facilitating data-driven management and precision control in advanced PFAL environments [32].
Despite these advancements, distributed sensor networks face technical barriers, including hardware incompatibility, communication constraints, and limited scalability [33,34,35]. These challenges are particularly relevant when deploying multiple identical sensors with fixed communication addresses. A key constraint in such multi-sensor arrays arises from the addressing limitations of the Inter-Integrated Circuit (I2C) protocol. I2C is a serial communication protocol that allows multiple devices to communicate over two wires, while sharing the same data bus and clock signal [36]. Devices with fixed I2C addresses, such as the SHT20 sensor, prevent multiple identical units from sharing a single bus. This limitation forces the use of multiple MCUs to accommodate additional sensors, increasing system cost, complexity, and power consumption, which limits the scalability of sensing architectures in smart PFALs.
To overcome this bottleneck, we hypothesize that integrating an I2C multiplexer (TCA9548A) with an ESP32 microcontroller enables simultaneous, stable, and low-cost data acquisition from multiple identical SHT20 sensors in a PFAL system. Therefore, the primary objective of this study is to validate the operation of a modular multi-sensor network for microclimate monitoring, overcoming the identified limitations of the I2C bus while maintaining data integrity without requiring multiple controllers. Complementary objectives are to: (1) present the development of the hardware and firmware for simultaneous operation of five SHT20 sensors and (2) evaluate the system’s performance in terms of data coherence, sampling reliability, and operational stability under real-world conditions in a PFAL environment.
2. Materials and Methods
2.1. Characterization of Cultivation Environment
The experiment was conducted in the Environmental Control Laboratory (LCA), at the School of Agricultural Engineering (FEAGRI/UNICAMP/SP/BRAZIL), located at coordinates 22°48′57″ S, 47°03′33″ W, and 640 m altitude. The study was conducted in a climate-controlled chamber with internal dimensions of 6.7 m × 3.7 m × 3.7 m, maintained at 21 ± 1 °C through a forced-air evaporative cooling system (model Mi 072E, equipped with four 230 V fans, Mipal, Cabreúva, Brazil). Three steel shelving units, each measuring 0.45 m × 0.93 m × 2.95 m, were positioned parallel to the evaporator airflow and spaced 1 m apart. Each unit, covered with protective sheeting, contained six cultivation levels with 0.4 m vertical spacing between shelves, serving as independent production units for the study.
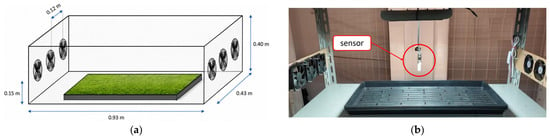
To investigate the impact of forced air circulation on microclimate homogeneity, each cultivation shelf was equipped with micro-ventilation units (model DFS802512H 4P DC, 12 V, 0.25 A, 80 mm × 80 mm × 24.5 mm, airflow capacity 64.5 m3 h−1, Akasa, Dongguan, China). Three units served as air inlets, while an additional three were positioned as outlets to exhaust air from the shelf, thereby establishing continuous air circulation. The spatial arrangement of these units, designed to minimize stagnant air zones, is detailed in Figure 1a. Areas without micro-ventilation were randomly distributed across shelf levels and maintained as reference regions for comparison with areas subjected to active airflow. Sensors were placed at the geometric centers of each shelf’s control volume, above the plant canopy level (see Figure 1b), providing a representative measurement location for the microclimatic conditions within the experimental setup.
Figure 1.
Experimental plant growth unit. (a) Dimensions of the unit; (b) sensor positioning.
The initial characterization of the cultivation chamber’s conditions was performed to establish the baseline spatial heterogeneity of the PFAL system and provide environmental context for the evaluation of the distributed microclimate monitoring network. Since PFAL systems are characterized by spatial variability in airflow and thermal conditions, the characterization of temperature and air velocity distributions was used to support the assessment of multipoint environmental monitoring.
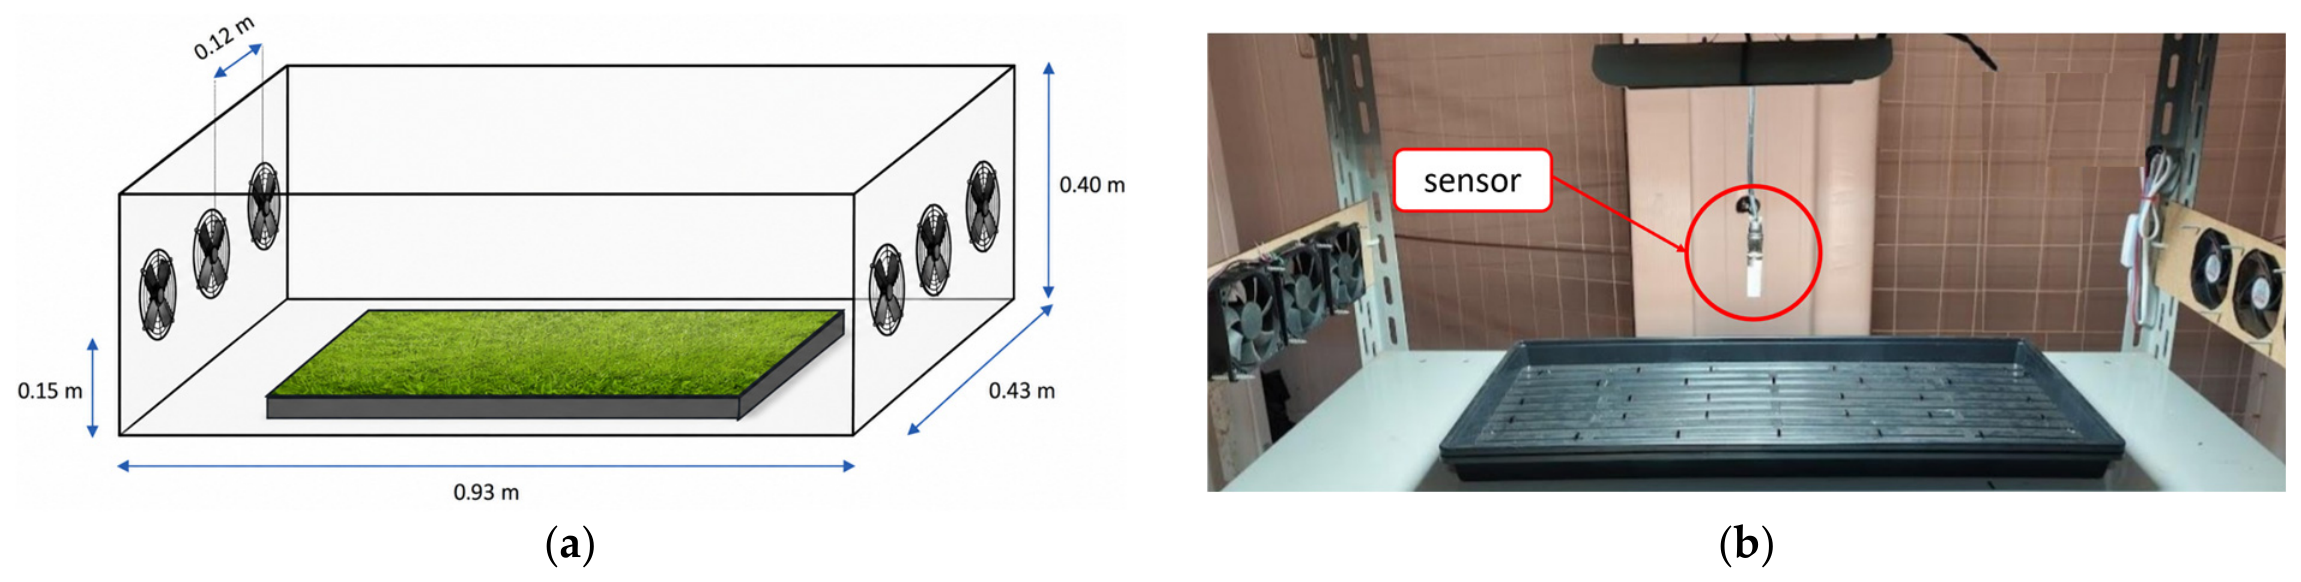
The microclimate conditions and their spatial distribution across the cultivation shelves were mapped using a hot-wire anemometer (model DT-3880, range 0.1–25.0 m s−1, accuracy ± 0.1 m s−1, CEM, Shenzhen, China). Measurements were performed with the micro-ventilation fans operating, at a height of 10 cm above the unit base, with sampling points spaced every 10 cm in the horizontal plane. Air temperature ranged between 20.5–22.0 °C, while air velocities ranged from 0.5 to 2.8 m s−1. Figure 2 illustrates the resulting spatial distribution, with temperature and air velocity represented in Figure 2a and Figure 2b, respectively. The black rectangle delineates the cultivation tray area, whereas the blue arrows indicate the direction of forced airflow generated by the micro-ventilation fans.
Figure 2.
Microclimate characterization in the horizontal plane. (a) Temperature; (b) Air velocity. Blue arrows indicate the direction of forced airflow.
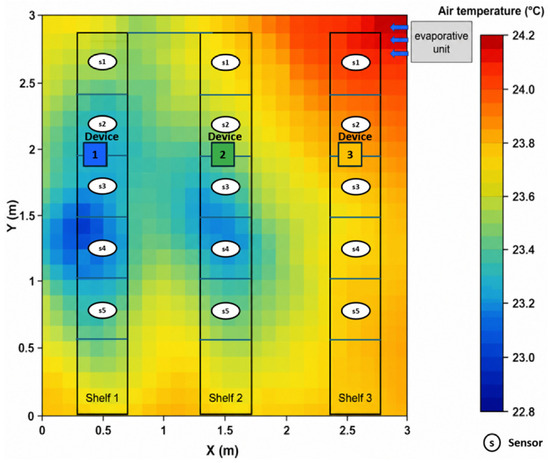
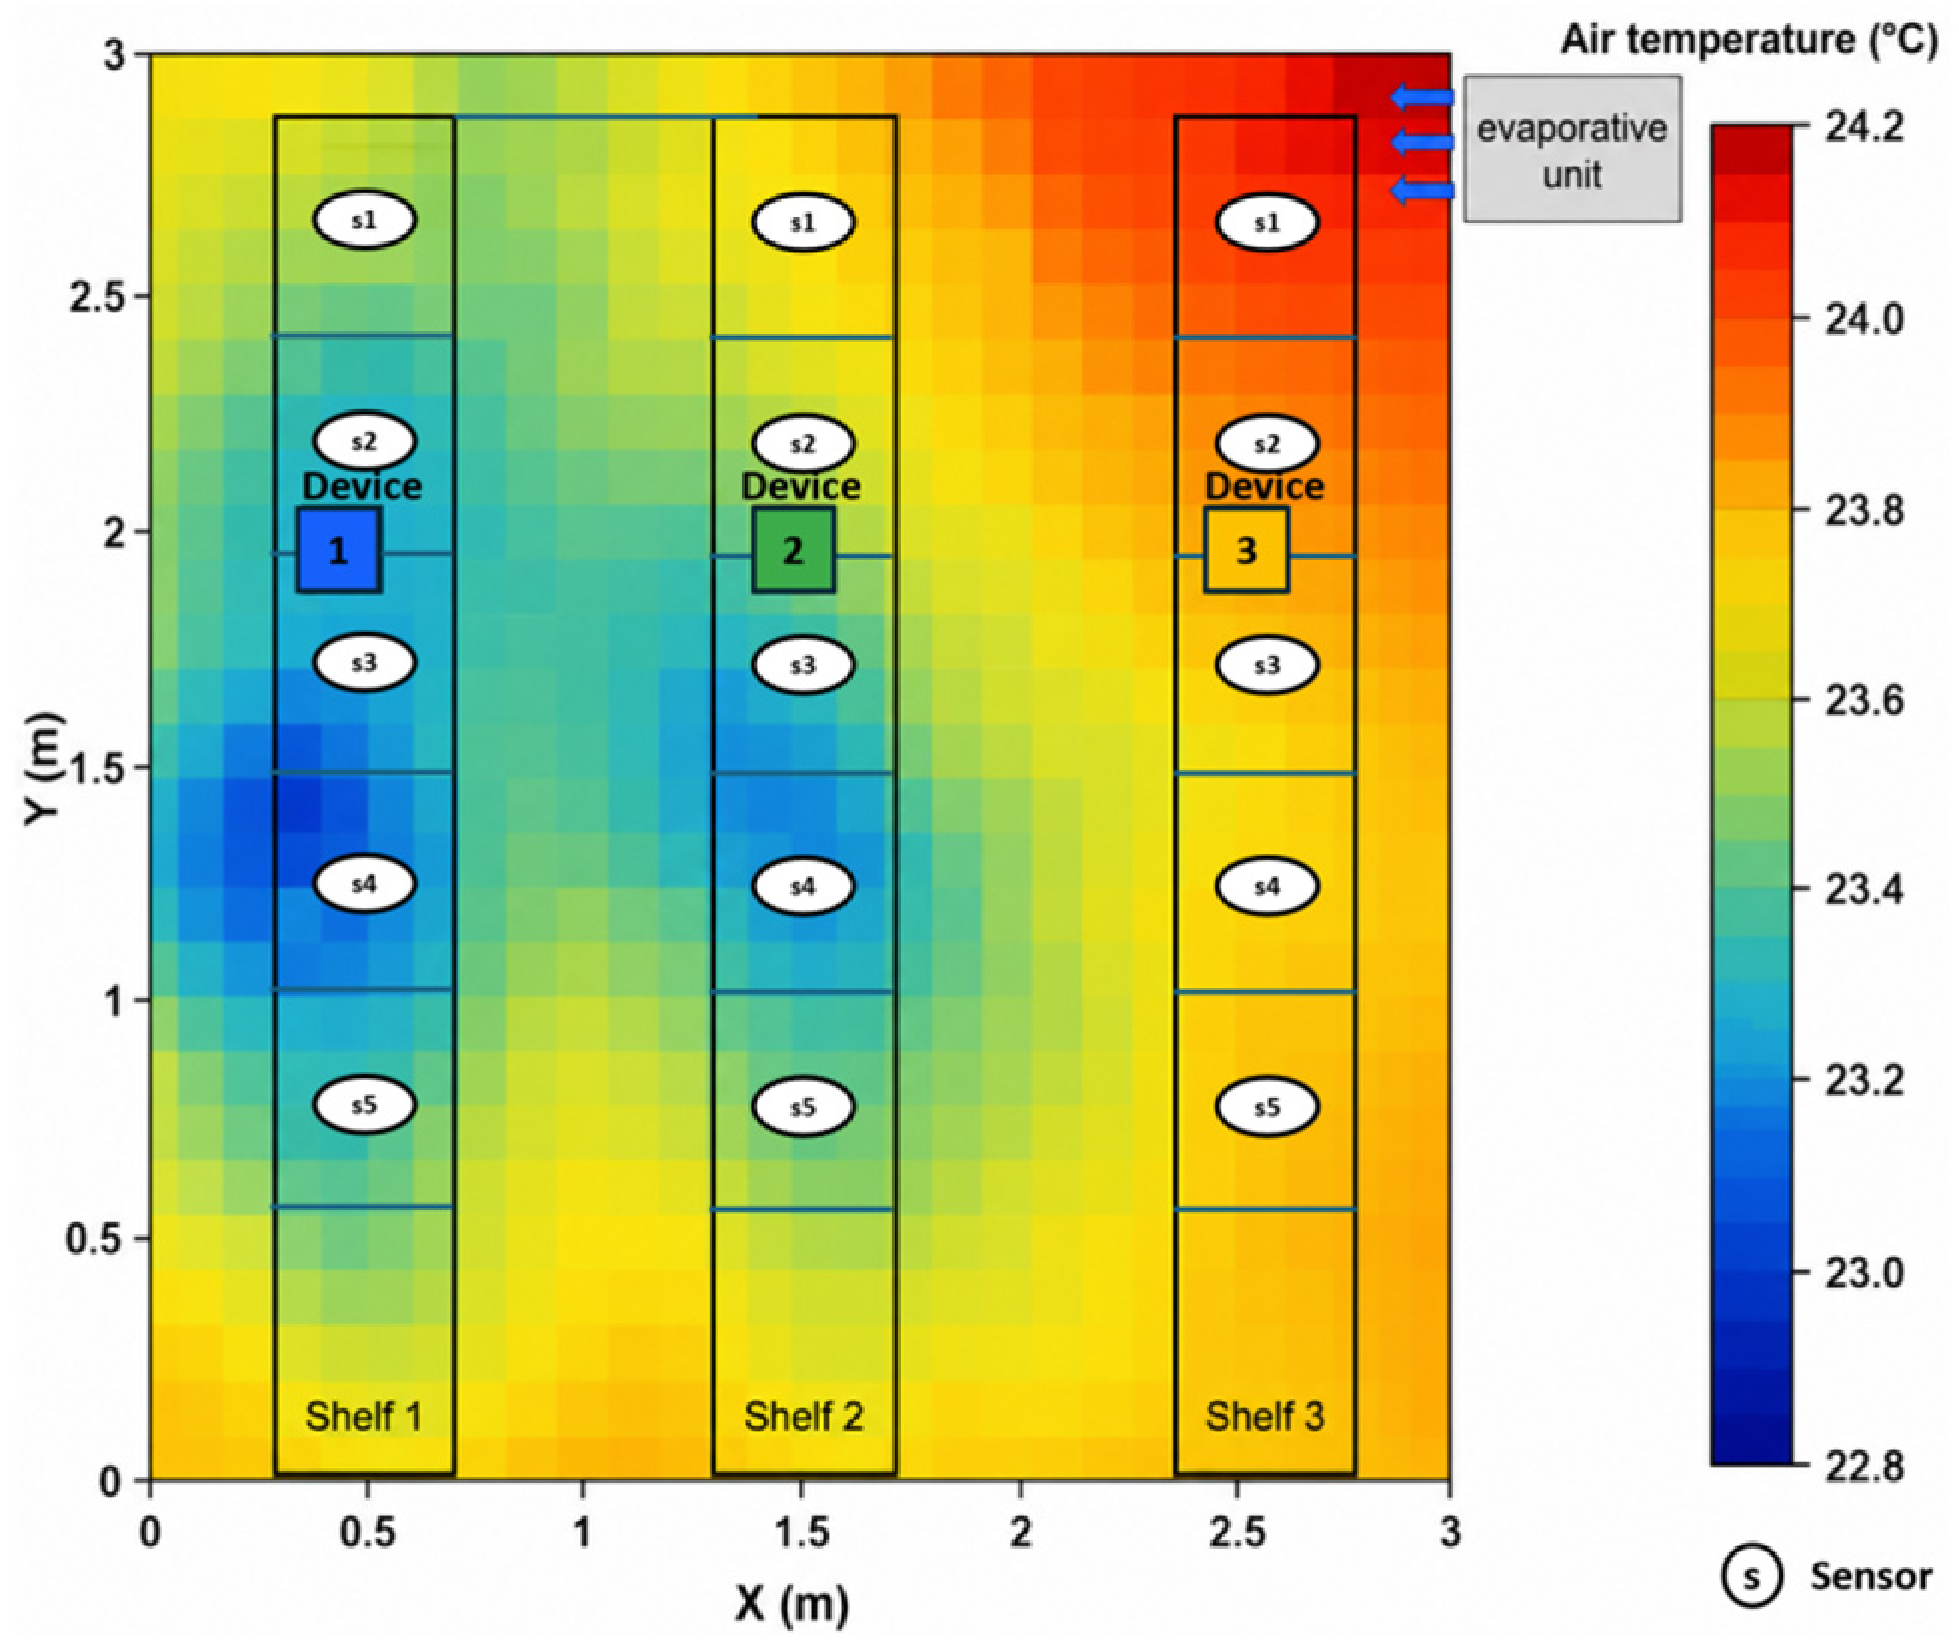
Additionally, the chamber’s baseline temperature distribution was mapped to characterize the thermal gradient generated by the forced-air evaporation system. Measurements were taken during the lighting photoperiod at a setpoint of 23 °C using a grid of points spaced every 0.5 m covering the entire central volume of the chamber parallel to the evaporator’s airflow direction. The resulting spatial thermal distribution within the cultivation chamber is presented in Figure 3.
Figure 3.
Temperature gradient, in °C, and device positioning, in the vertical plane. The coloured squares represent the devices, while the white markers show sensor positions.
The numbered markers in Figure 3 indicate the locations of the three monitoring devices, providing a spatial reference for interpreting the microclimate variability. The corresponding sensor locations are also shown to support the evaluation of distributed monitoring architecture under heterogeneous environmental conditions.
2.2. Hardware Design and Electronic Development
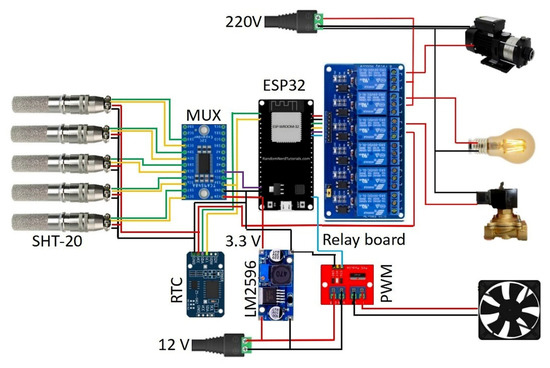
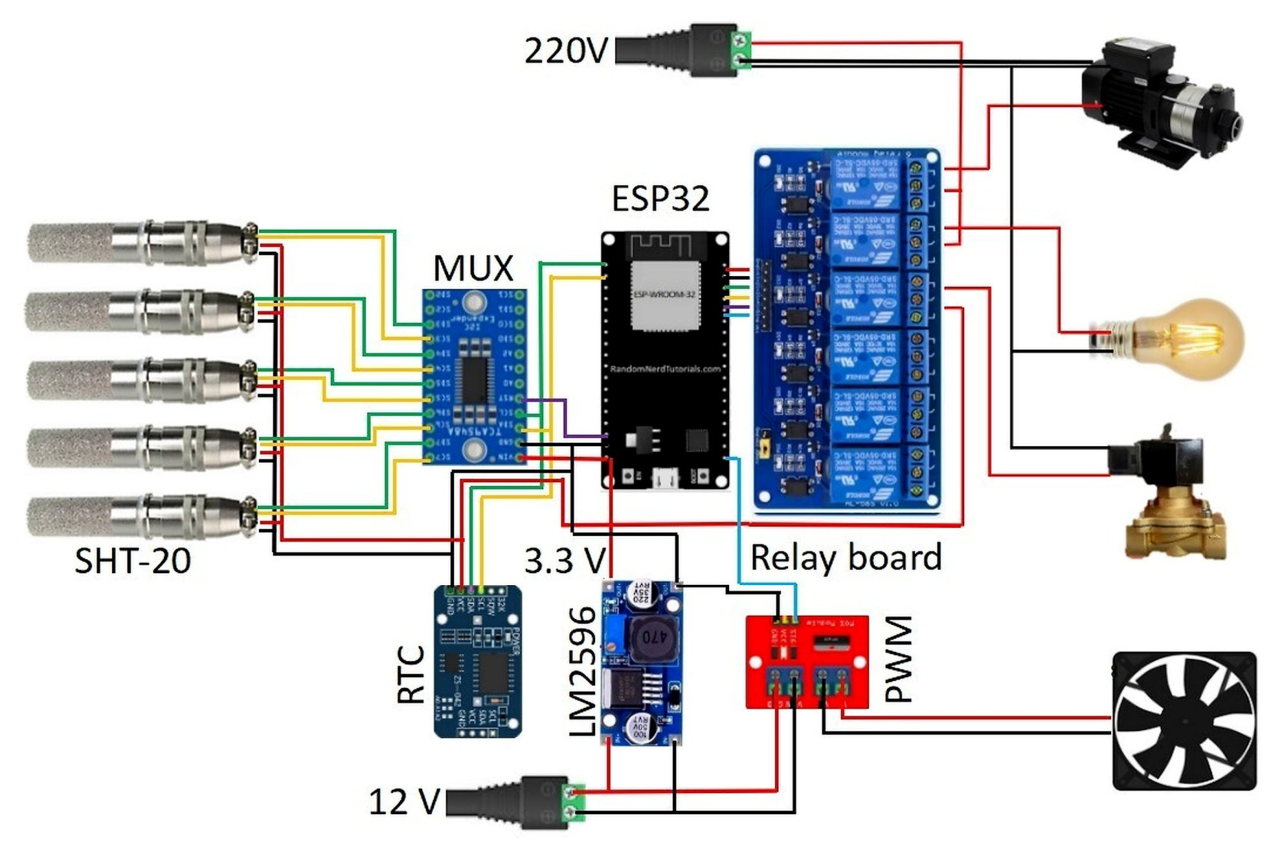
Three identical data-acquisition units were prototyped to evaluate the practical implementation of a multiplexed sensor architecture for PFAL microclimate monitoring. Each unit consisted of an ESP32 microcontroller (ESP-WROOM-32 module, 3.3 V, 2.4 GHz Wi-Fi, two I2C bus interfaces, Espressif, Shanghai, China), a TCA9548A I2C multiplexer (8-channel I2C, 1.65–5.5 V, Texas Instruments, Dallas, TX, USA), and an array of five SHT20 temperature and relative humidity (RH) sensors (I2C interface, 2.1–3.6 V, Sensirion, Stäfa, Switzerland). Each unit, including its five multiplexed sensors, was considered an independent experimental unit for all analyses (see Figure 4).
Figure 4.
Hardware schematic of the ESP32-based control unit. Red and black lines indicate the power supply wires, while green and yellow lines represent the I2C communication bus. The remaining lines represent the wires used for control signals.
The ESP32 microcontroller was selected due to its integrated Wi-Fi communication capabilities, low cost, and compatibility with the I2C-based sensor network. The TCA9548A multiplexer enabled the simultaneous integration of multiple identical sensors within a single I2C bus. Each SHT20 sensor has an 8-s response time and IP65 protection, making it suitable for high-humidity controlled-environment applications. The operating ranges of the SHT20 sensor are 0–100% RH (±3%) and −40 to 125 °C (±0.3 °C) for temperature measurements.
All three devices were powered by an AC-DC switching power supply (110/220 VAC to 12 VDC), with an individual step-down DC-DC converter module (LM2596, Texas Instruments, Dallas, TX, USA) in each unit to supply the required operating voltages (3–5 VDC) for the controllers, sensors, and peripheral modules. A high-precision Real-Time Clock (RTC) chip module (DS3231, I2C interface, 2.3–5.5 V, Maxim Integrated, San Jose, CA, USA) is also proposed for time stamping. This module contains a crystal oscillator and a small backup battery, allowing the system to maintain temporal synchronization during power interruptions or system resets.
Automation capabilities are provided by a 6-channel relay module (input 5 V, output 30 V DC or 250 V AC) for on/off switching and a Pulse Width Modulation (PWM) module for variable output control. Together, these modules expanded the control capabilities by supporting both discrete and variable-speed operation. Although both modules were incorporated into the hardware, only the relay module was used in this study. One relay controlled the LED lighting according to the defined photoperiod, while a second relay controlled the operation of the micro-ventilation fans based on the temperature and RH setpoints. The PWM module was retained to support variable-speed actuator control in future implementations. This configuration enabled real-time environmental monitoring while supporting actuator control through dedicated hardware, with the ESP32 processing sensor data and coordinating control signals to regulate the microclimate.
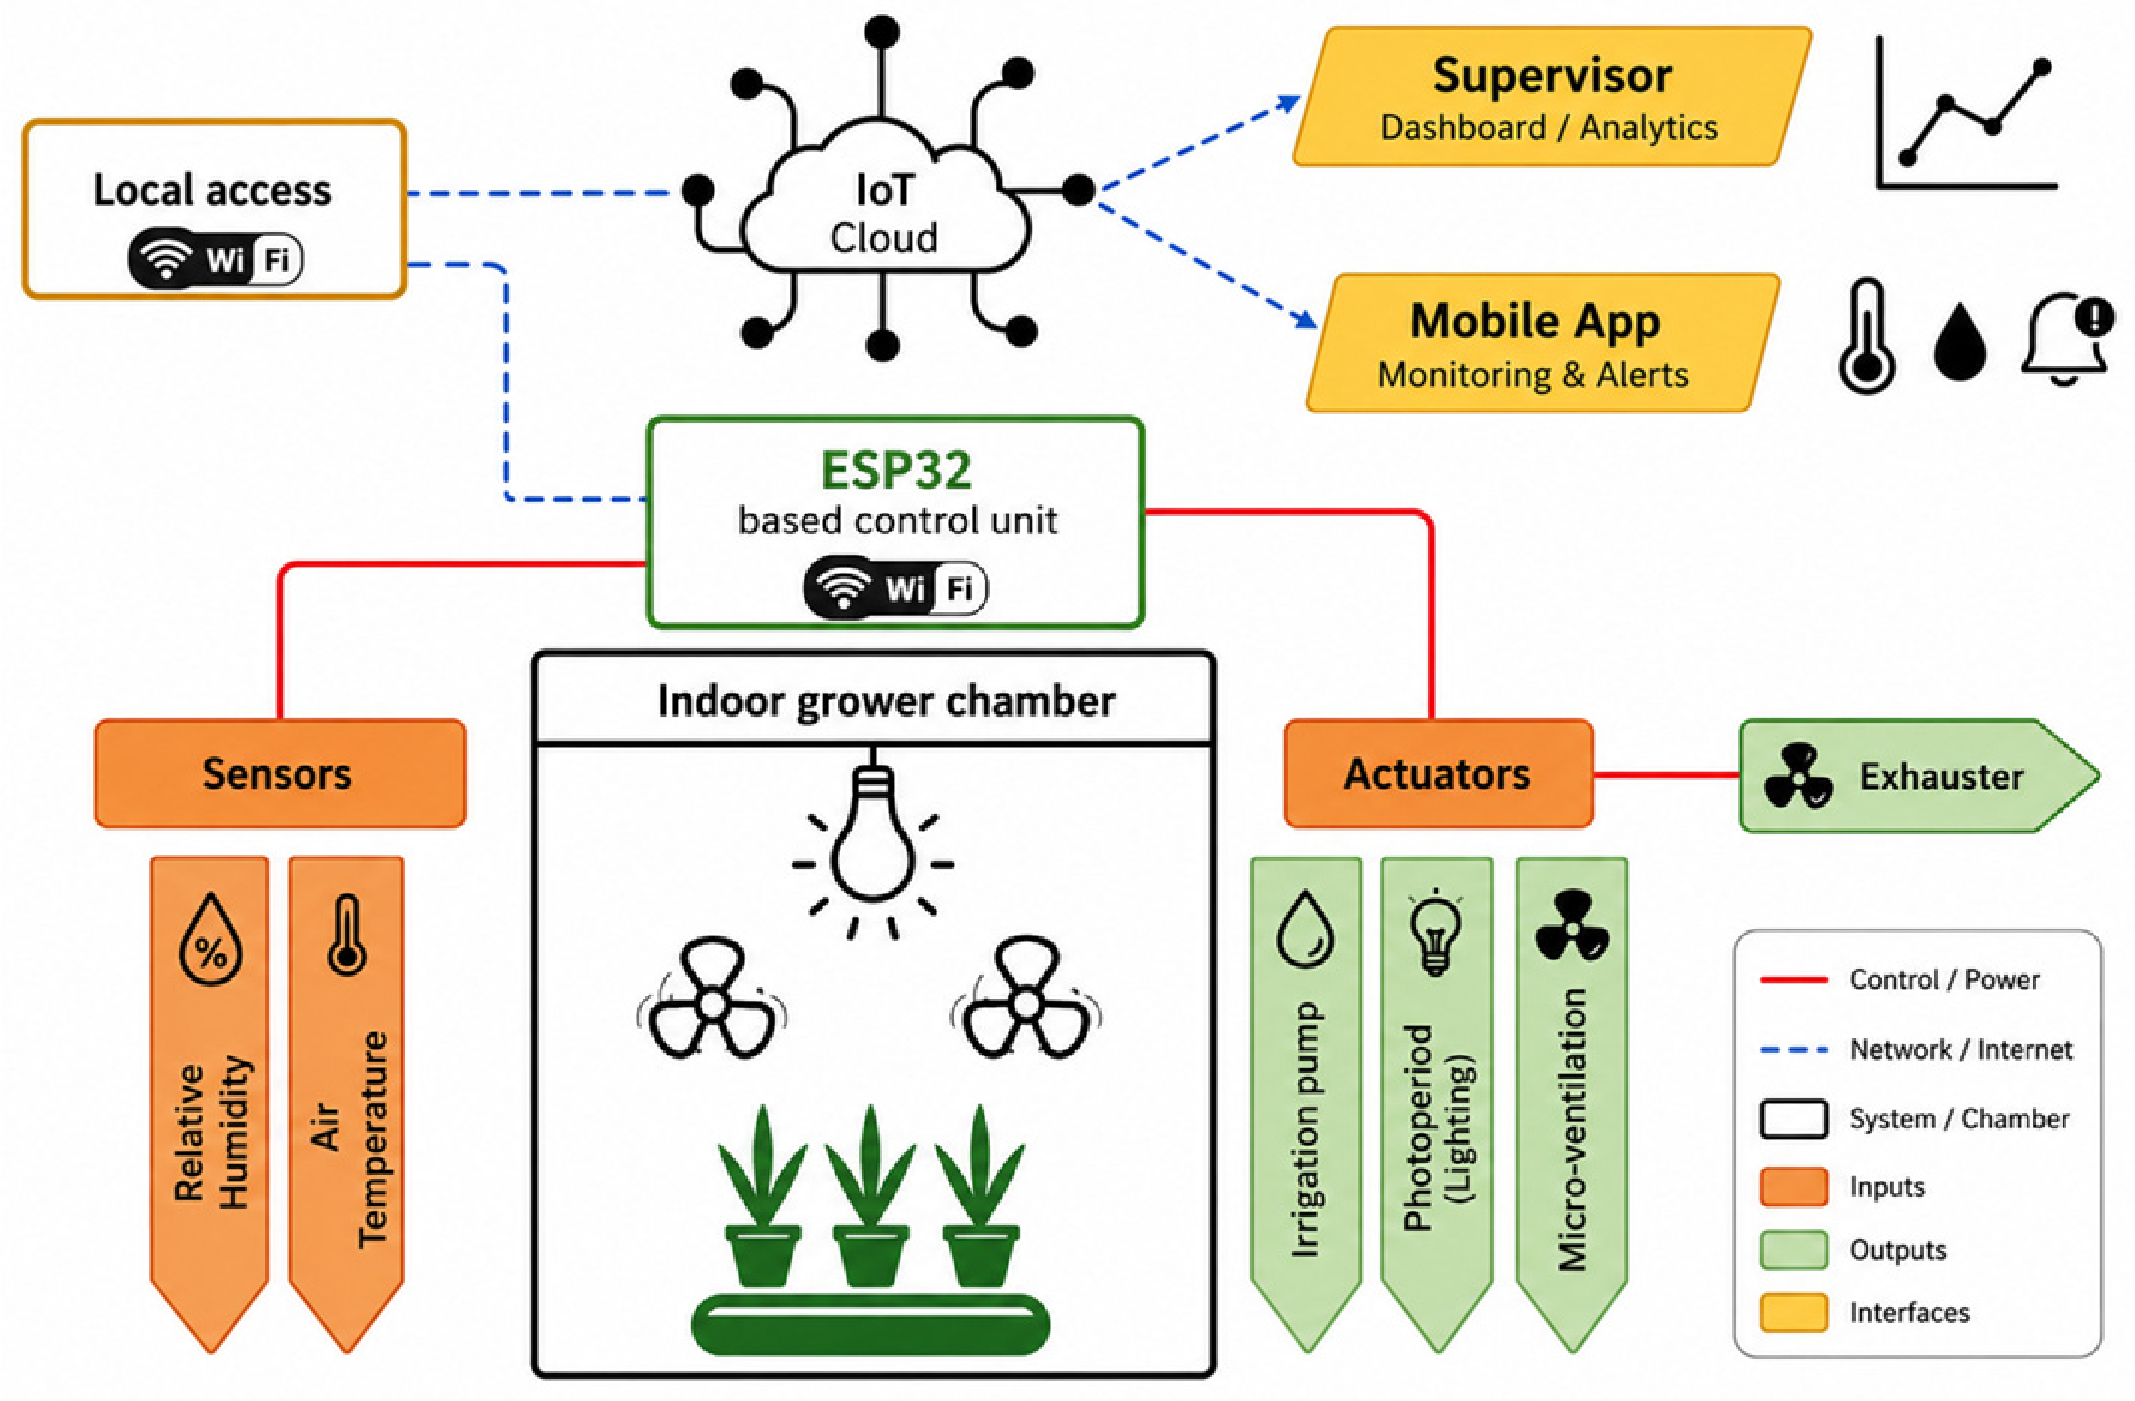
The schematic diagram in Figure 5 illustrates the IoT-based system designed for microclimate monitoring and control within an indoor plant growth chamber. The ESP32 serves as the central interface between the sensing hardware and software components across the network. Programmed using the Arduino Integrated Development Environment (IDE), version 2.3.6, and the C++ programming language via the Arduino framework, the ESP32 acquires data from the sensors, transmits it for local and remote monitoring, and executes established control routines. Using its built-in Wi-Fi module, the ESP32 connected to a LAN connected through the institution’s public network infrastructure, enabling the transmission of sensor data to a cloud platform. The cloud platform provides centralized data storage, allowing continuous access to microclimate data through both a local supervisory dashboard and a mobile application. The supervisory dashboard supports real-time visualization and analysis of the collected data on a local computer, whereas the mobile application enables remote monitoring via smartphone. During system operation, the remote monitoring functionality was primarily used to detect communication interruptions, such as data transmission losses caused by network connectivity issues and internet outages, and to notify the research team so that the underlying causes could be investigated and the system reset when necessary.
Figure 5.
Schematic diagram of the IoT system.
2.3. Microclimate Data Acquisition Architecture
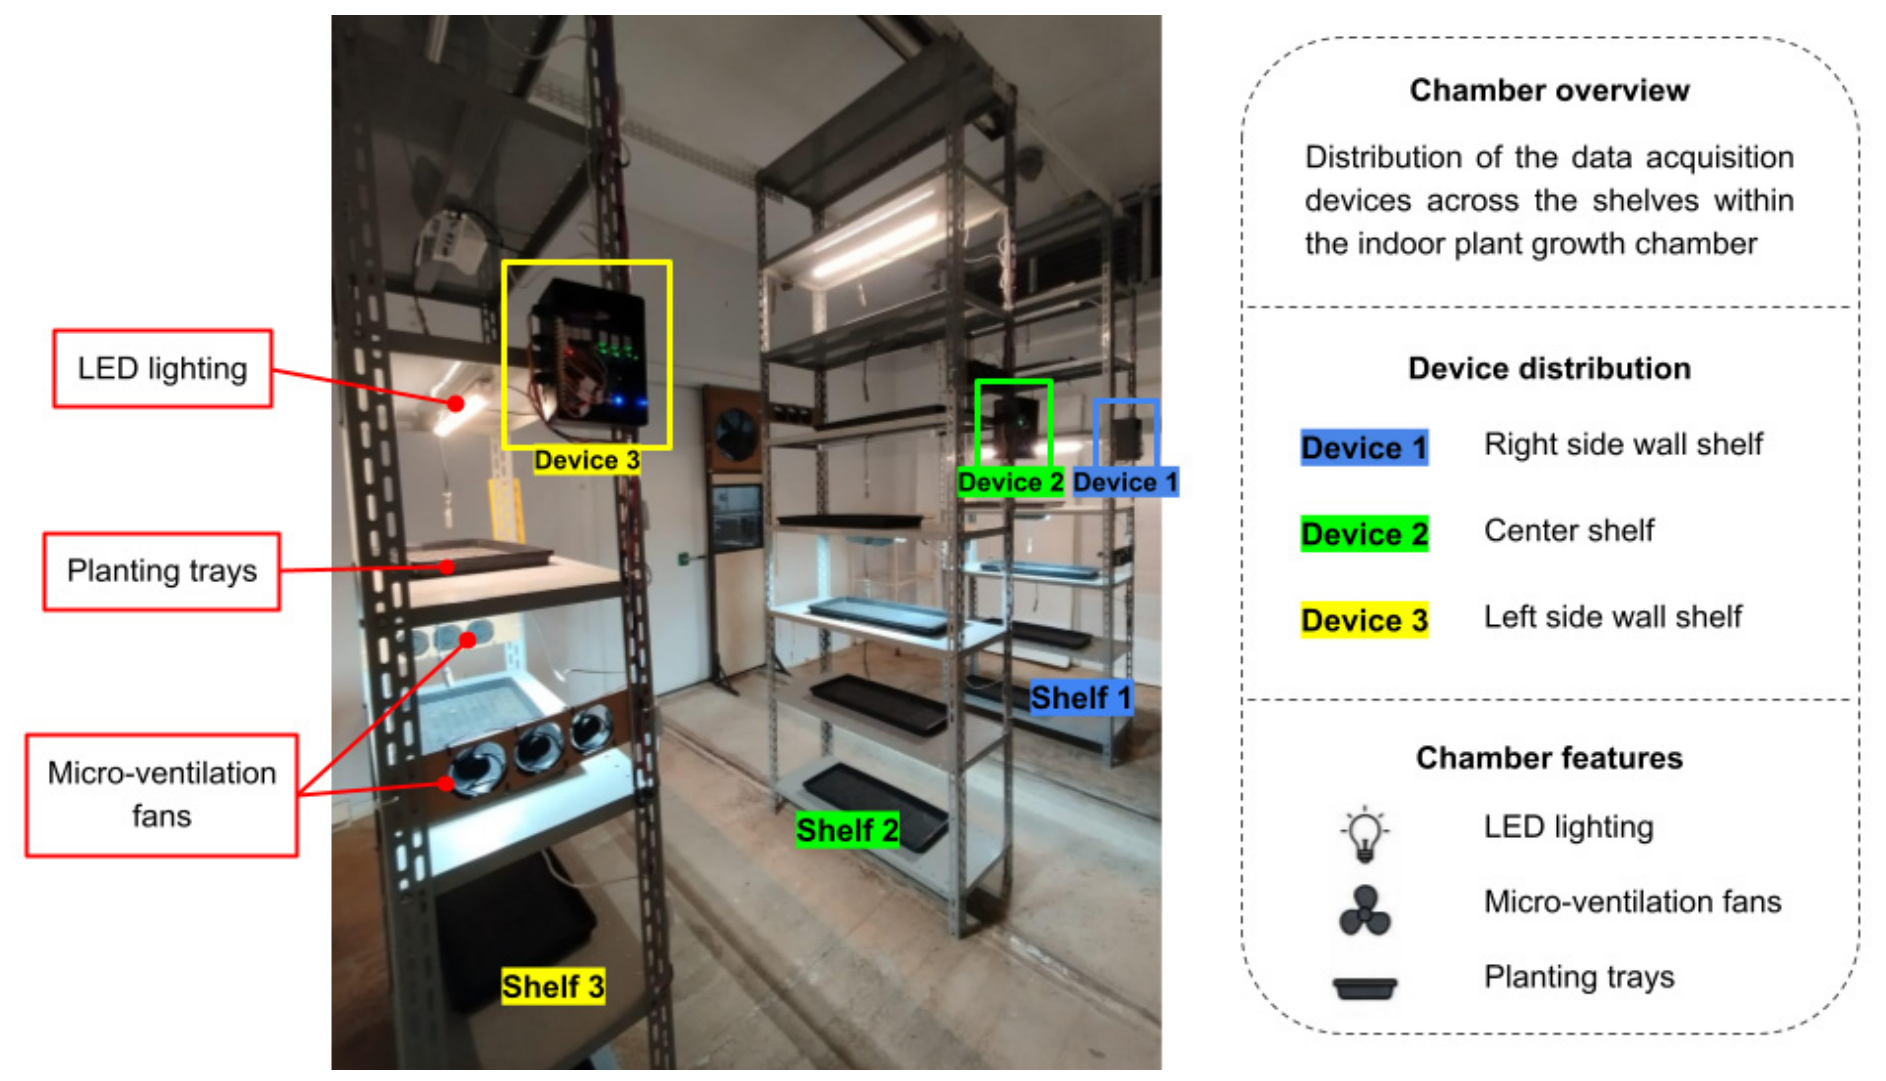
The system incorporates multiple sensors to measure key environmental parameters such as air temperature and RH, and calculate vapor pressure deficit (VPD), which are critical for maintaining optimal plant growth conditions. Three microclimate control and monitoring devices were assembled and installed across the three shelves within the plant growth chamber, as shown in Figure 6. Each device incorporated the same sensor configuration to capture representative microclimate conditions, and operated using an identical data-acquisition frequency, or sampling interval, which was maintained throughout the growth cycle. This distributed arrangement enabled simultaneous monitoring of microclimate variables at multiple locations within the chamber and assessment of spatial and temporal variations.
Figure 6.
Device positioning and shelf distribution within the plant growth chamber.
For data management and visualization, the IoT network integrates a cloud-based database implemented via Google App Script, utilizing JavaScript (V8 runtime) for backend operations. Data logging was configured to occur according to the sampling interval, although its continuity was dependent on the stability of the internet connection. Each device transmitted its measurements to a dedicated Google Sheets spreadsheet, allowing the independent tracking of data from sensors positioned on the growth shelves. This cloud interface enables automatic data upload, storage, and retrieval, providing a framework for remote access to data, despite identifiable transmission bottlenecks under experimental conditions. The system’s architecture, therefore, demonstrates a cost-efficient and replicable prototype for smart agriculture applications, illustrating how open-source software and affordable microcontrollers can be leveraged to develop functional local acquisition units for environmental monitoring in PFAL environments.
The developed firmware made use of open-source libraries, such as: ‘Wire.h’ for I2C protocol management; ‘uFire_SHT20.h’ for SHT20 sensor interface with the ESP32; ‘TCA9548.h’ for I2C multiplexer interface with ESP32; ‘WiFi.h’ for LAN wireless communication; and ‘SimpleTimer.h’ and ‘HTTPClient.h’ for temporized data sample collection and sending data to Google Sheets, respectively. Additionally, ‘RTClib.h’ is used to generate real-world variables in terms of date, encompassing the year, month, and day, and also the time, tracking hour, minute, and second.
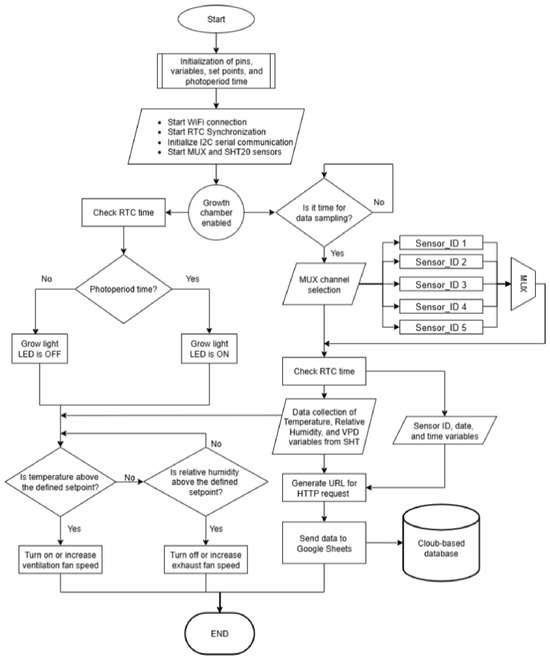
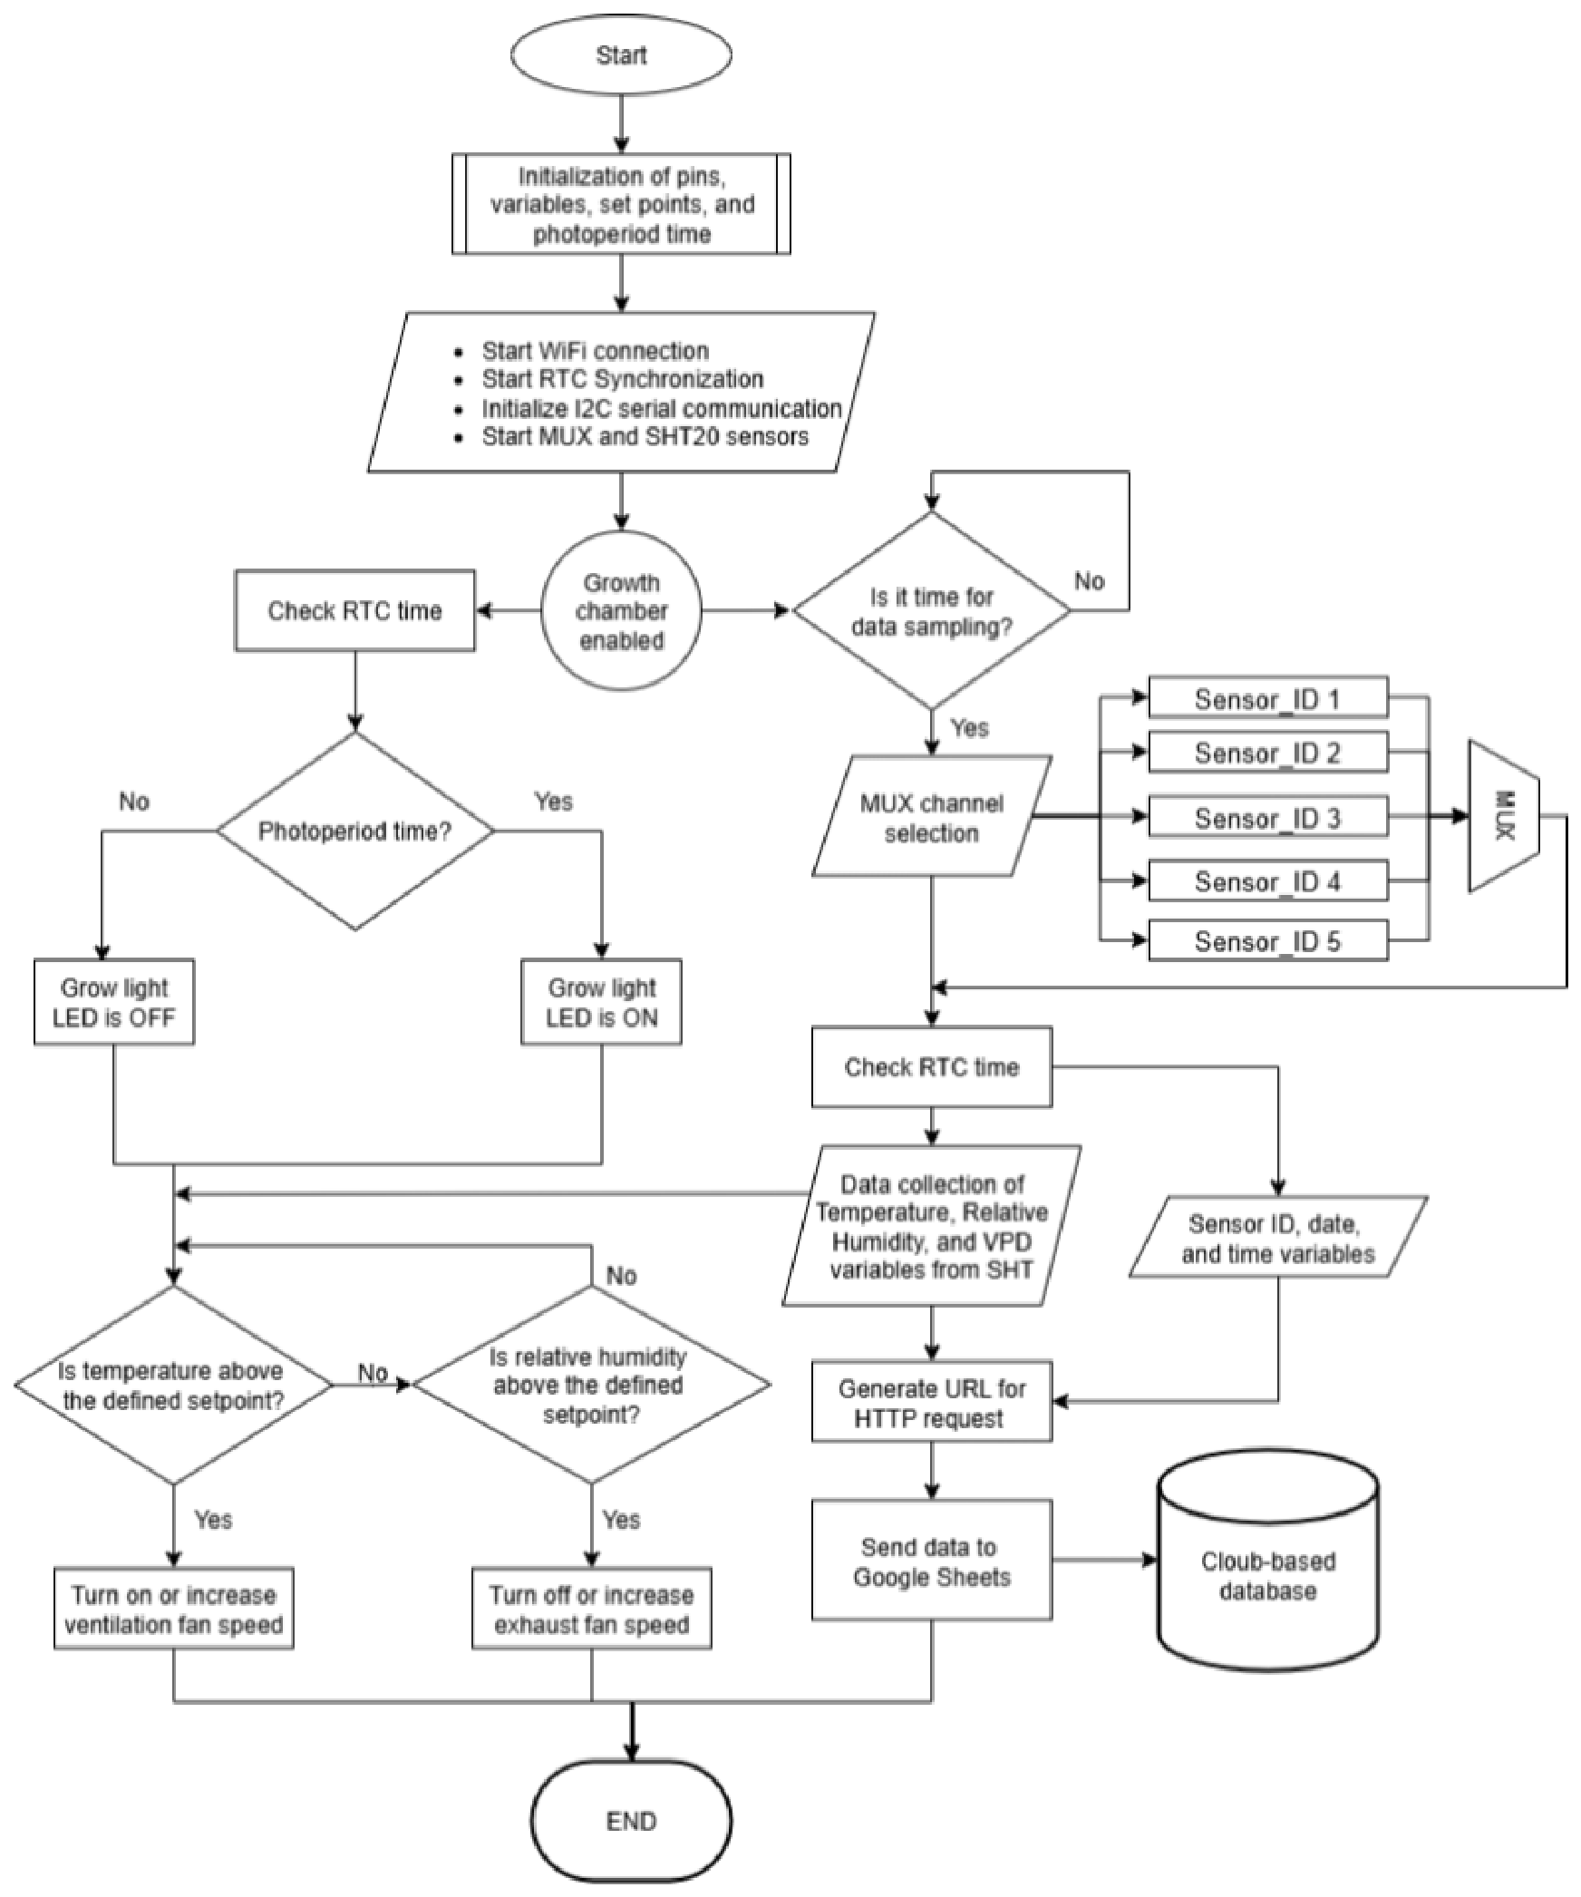
The flowchart presented in Figure 7 illustrates the cyclic logical sequence implemented in the ESP32. The firmware integrates near real-time data acquisition, cloud communication, and automation routines within the same continuous loop. The RTC provides continuous timekeeping and time-dependent automation, such as photoperiod regulation. The multiplexer enables communication with up to eight SHT20 sensors without requiring software modification, with each sensor accessed through a specific channel (Sensor_ID). During each sampling cycle, sensor data is read, formatted into a URL string, and transmitted to Google Sheets via an HTTP request that includes device identification, timestamp, and measured variables. Following data acquisition, the automation routine utilizes the RTC to control LED lighting within a fixed photoperiod of 16 h on (from 5:00 PM to 8:59 AM) and 8 h off (from 9:00 AM to 4:59 PM), while micro-ventilation and exhaust fans adjust airflow according to temperature and RH thresholds. To simplify system design, irrigation control was excluded from the current firmware implementation.
Figure 7.
Algorithm flowchart diagram.
This hybrid routine configuration allows real-time monitoring and control of the system while maintaining flexibility and minimizing the need for complex wiring or additional communication hardware. In this design, the use of a locally established access point within the institutional network framework enables the evaluation of the system’s robustness under varying internet availability conditions. The collected data were subjected to a structured experimental and statistical treatment to evaluate device performance and data reliability.
2.4. Experimental Conditions and Statistical Analysis
Two independent microgreen growth cycles were conducted, with all three units operating simultaneously. Arugula microgreens were selected due to their short cultivation period. Each cycle spanned nine days, beginning from the onset of the photoperiod, and included three experimental batches to ensure statistical robustness and enable comparison among devices. Both cycles were performed under comparable environmental conditions, ensuring that observed variations were primarily attributed to system performance rather than external factors. Two data acquisition scenarios were evaluated: cycle 1 employed at 40-s sampling intervals to provide sufficient temporal resolution for five sensors, while cycle 2 was set to operate at a 20-s interval to assess performance under a higher sampling demand. This experimental design enabled a comparative evaluation of the data-acquisition performance under two representative operational conditions, considering sensing consistency and communication-related performance metrics, such as temporal stability, sampling continuity, and data completeness. In this context, system performance was evaluated against the theoretical acquisition capacity of the hardware architecture as well as the practical limitations observed during wireless data transmission.
Data processing and statistical analysis were performed to evaluate system performance across cultivation cycles and devices. The datasets were processed to extract daily and hourly values for each sensor. The average sampling interval and total number of acquired data points were compared with theoretical expectations, to quantify the temporal, consistency, continuity and acquisition performance of the automated monitoring system. For simplicity, the quantity of data collected was expressed in magnitude and as a percentage of the expected number of observations under ideal operating conditions. The ratio between the actual and theoretical number of acquired data points over the same period was computed. The resulting metric provides a standardized measure of data completeness, facilitating direct comparison across devices, experimental conditions, and collection cycles. Furthermore, given the different sampling intervals between cycles, a temporal normalization was applied to standardize all measurements to a common hourly rate using the formula:
Normalized value = Data points/time interval (hours).
Descriptive statistics, including mean, standard deviation (SD), coefficient of variation (CV), minimum, and maximum value, were calculated for each device in both cultivation cycles. As the normalized data violated assumptions of normality and homoscedasticity, non-parametric tests were employed for inferential analysis. The Mann–Whitney U test was used to compare data acquisition performance between cycles, while the Kruskal–Wallis test, followed by Dunn’s post-hoc analysis with Bonferroni correction, was used to evaluate differences between devices within each cycle. Statistical significance was set as p < 0.05. Descriptive analysis was made in Python 3.12.10 to evaluate system performance between the two crop cycles.
In addition to the data-acquisition performance analysis, the spatial distribution of the Wi-Fi signal intensity inside the growth chamber was characterized to distinguish transmission-related losses from acquisition-related effects. The wireless signal was surveyed using the Wi-Fi Analyzer application version 9.4 (https://olgor.com/, accessed on 6 December 2025) to quantify potential attenuation caused by the chamber’s internal geometry, metallic structures, and shelving arrangement. A 4 × 4 measurement grid of 16 points was established within the chamber, and three measurements per minute were recorded at each point to capture average signal strength and short-term fluctuations. A 200-point interpolated grid with contour visualization was then generated in Python 3.12.10. This procedure provided complementary information for interpreting data-acquisition discrepancies and distinguishing limitations associated with the sensing architecture from those caused by wireless communication conditions.
3. Results
The results presented in this section evaluate the performance of the developed monitoring system based on the collected microclimate data. Device performance was assessed across the two cultivation cycles, with a focus on data acquisition and measurement consistency. Comparative analyses were conducted to evaluate device performance under a real cultivation scenario and to characterize the effects of communication conditions on data availability. Moreover, the coherence of microclimate data and instantaneous gradients collected from multiple sensors within the same controlled environment was examined. Ultimately, the results provide an assessment of hardware operation, including sensing consistency, data acquisition performance, and system limitations based on the recorded microclimate parameters, number of collected data points, and the data acquisition intervals.
3.1. Data Collection Device Performance
A total of three data-acquisition devices, each equipped with five multiplexed SHT20 sensors, were evaluated across two 9-day cultivation cycles. Table 1 summarizes the mean values and CV for microclimate conditions recorded by each device and the main data acquisition performance indicators.
Table 1.
Summary of data collection performance.
Temperature, RH, and VPD values were consistent across devices within each cycle, indicating comparable sensing performance among the three acquisition units. In contrast, data completeness varied substantially, revealing limitations in data acquisition and wireless transmission under experimental conditions. The reported completeness values, in %, represent the proportion of the theoretical acquisition capacity of each device, corresponding to 97,200 and 194,400 data points for cycles 1 and 2, respectively. Wi-Fi instability led to a data loss ranging from 61.38% to 76.15%. Although cycle 2 achieved higher acquisition rates and shorter mean sampling intervals, overall data completeness remained limited, indicating that the system did not consistently achieve its theoretical acquisition capacity. Thus, the sensor-multiplexing architecture functioned as intended under stable connectivity conditions, while network constraints limited end-to-end performance.
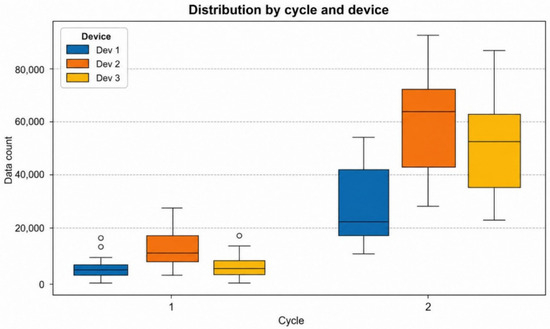
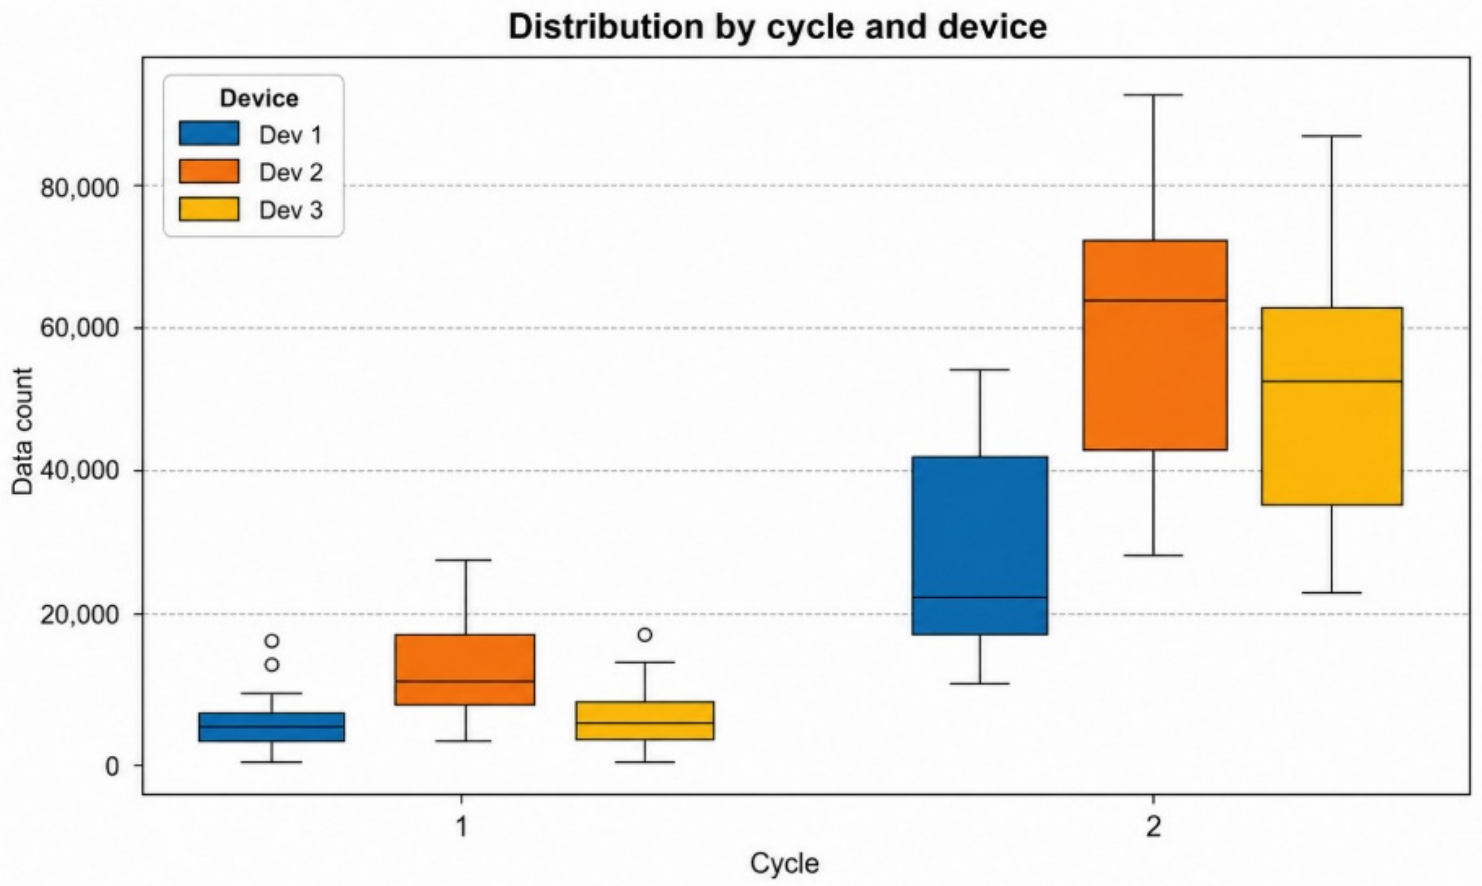
Figure 8 presents the normalized data count across cycle 1 and cycle 2. Although cycle 2 achieved higher data acquisition, the ranking among devices remained unchanged from cycle 1, with device 2 recording the highest values, followed by device 3 and 1. The wider interquartile ranges and longer whiskers in cycle 2 indicate greater variability in recorded data, likely associated with increased sampling demand and its effects on data transmission. These results suggest that higher acquisition rates improved data throughput while also increasing variability in system performance.
Figure 8.
Amount of data collected per sensor regarding cycle 1 and cycle 2 for each device.
Table 2 presents descriptive statistics of the normalized hourly acquisition rate for each cycle and device. Considering the average acquisition rate across the three devices, cycle 2 achieved a substantially higher value of 47,620 data points per hour, compared with 9975 data points per hour in cycle 1. This represents a 378% increase, corresponding to a 4.78-fold increase in acquisition throughput. Furthermore, the CV decreased from 52.3% to 36.3%, indicating greater consistency in the normalized acquisition rate among the three devices under increased sampling demand. However, overall data completeness remained below the theoretical acquisition capacity due to communication-related interruptions observed during the data acquisition process.
Table 2.
Descriptive statistics: data collection for each cycle and device.
Given the non-normal distribution of acquisition metrics, non-parametric tests were applied. The Mann–Whitney U test revealed significant differences between cycles (U = 102, p < 0.001), within-cycle comparisons. Kruskal–Wallis test also showed significant differences among devices (Cycle 1: H = 32.5, p < 0.001; Cycle 2: H = 42.8, p < 0.001). Post-hoc tests indicated that device 2 consistently achieved the highest acquisition performance in both cycles.
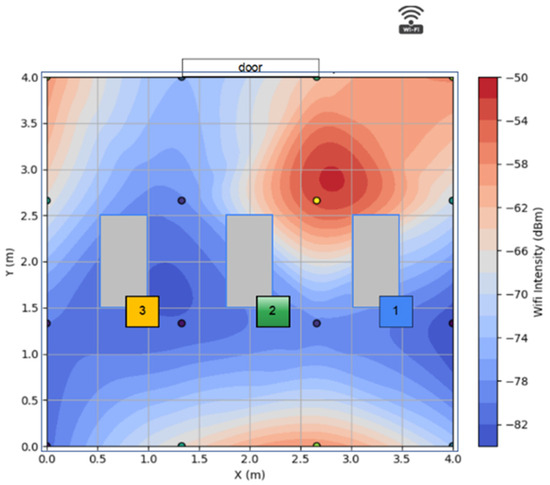
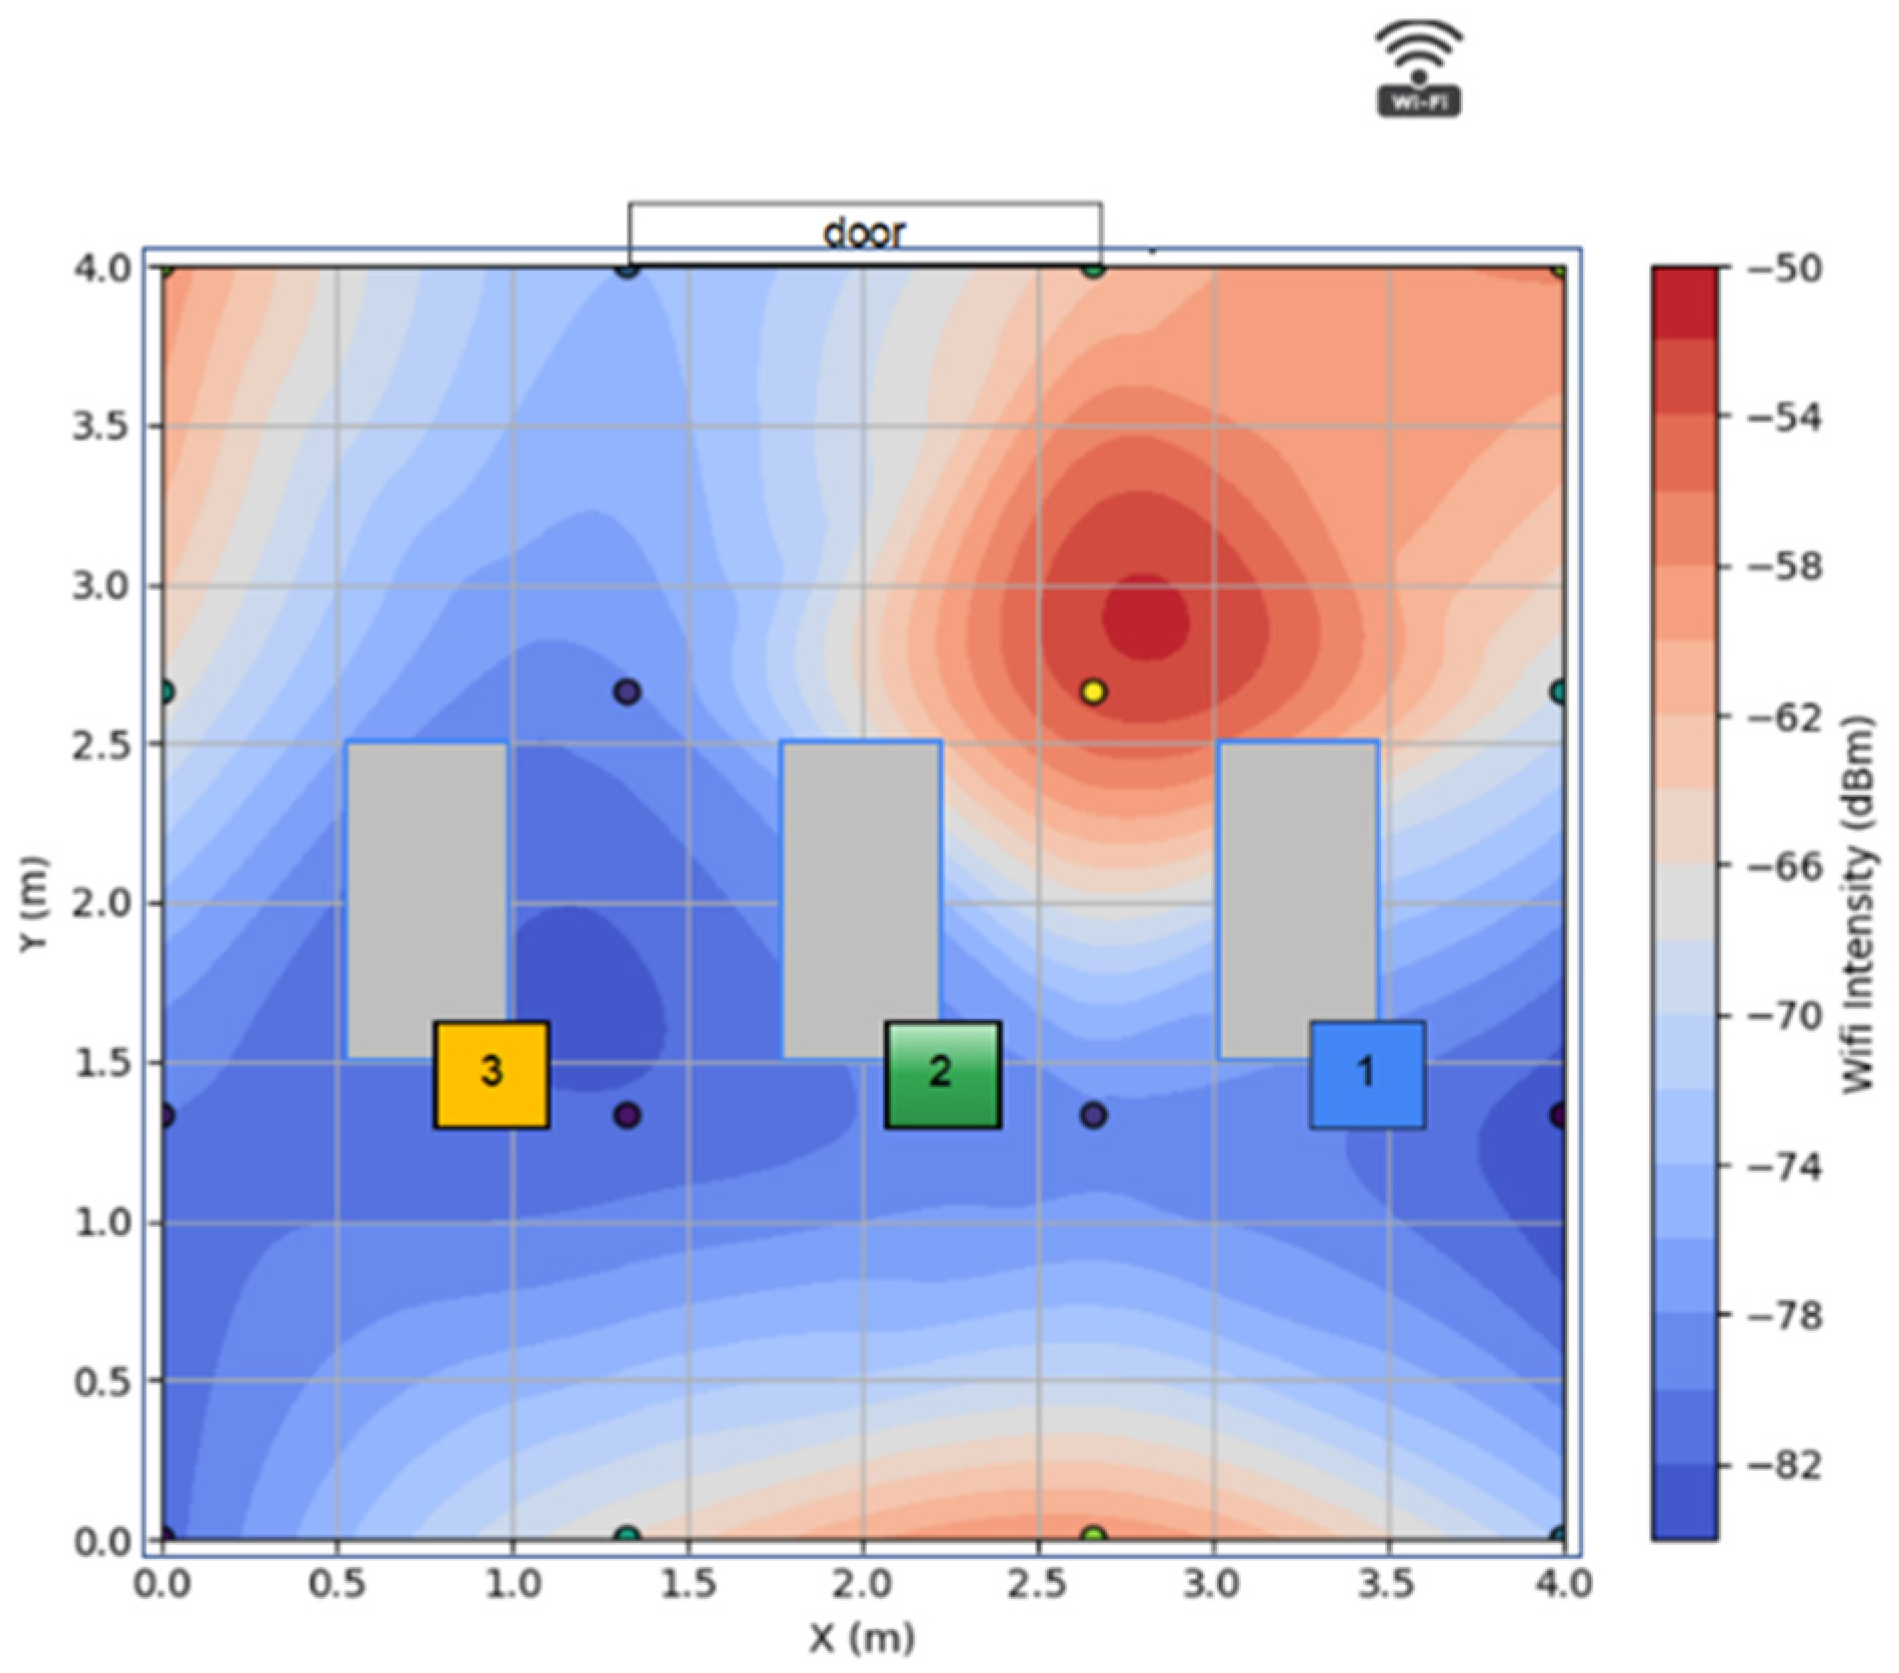
To further investigate the observed differences in data completeness, a Wi-Fi signal strength map, shown in Figure 9, was generated to provide a visual representation of the wireless communication conditions within the growth chamber. All devices were located within regions exhibiting Received Signal Strength Indicator (RSSI) values between −70 and −82 dBm, corresponding to relatively weak signal conditions. However, a localized region with stronger signal strength of approximately −50 dBm, consistent with a partial line-of-sight (LOS) condition, was identified near the chamber entrance. Device 2 was positioned facing this region, whereas devices 1 and 3 were located behind structural elements and experienced lower RSSI values. This spatial distribution corresponded with the observed transmission performance, with device 2 exhibiting higher data completeness than the other two devices.
Figure 9.
Wi-Fi signal strength mapping inside the growth chamber in the horizontal plane. The grey area represents the shelving units, while coloured squares indicate device positions.
Overall, the RSSI distribution is consistent with the observed differences in data completeness, although this relationship should be interpreted as an association rather than definitive evidence of causality. The presented map represents the measured spatial distribution based on instantaneous, point-based measurements of signal strength rather than a direct, continuous quantification of signal attenuation caused by individual structural components. Therefore, without an independent reference measurement, the contribution of Wi-Fi attenuation cannot be distinguished from other wireless propagation effects within the chamber.
3.2. Data Collection Interval and Distribution
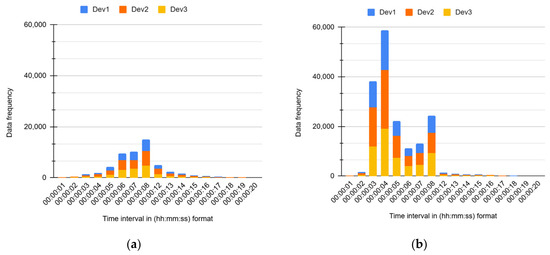
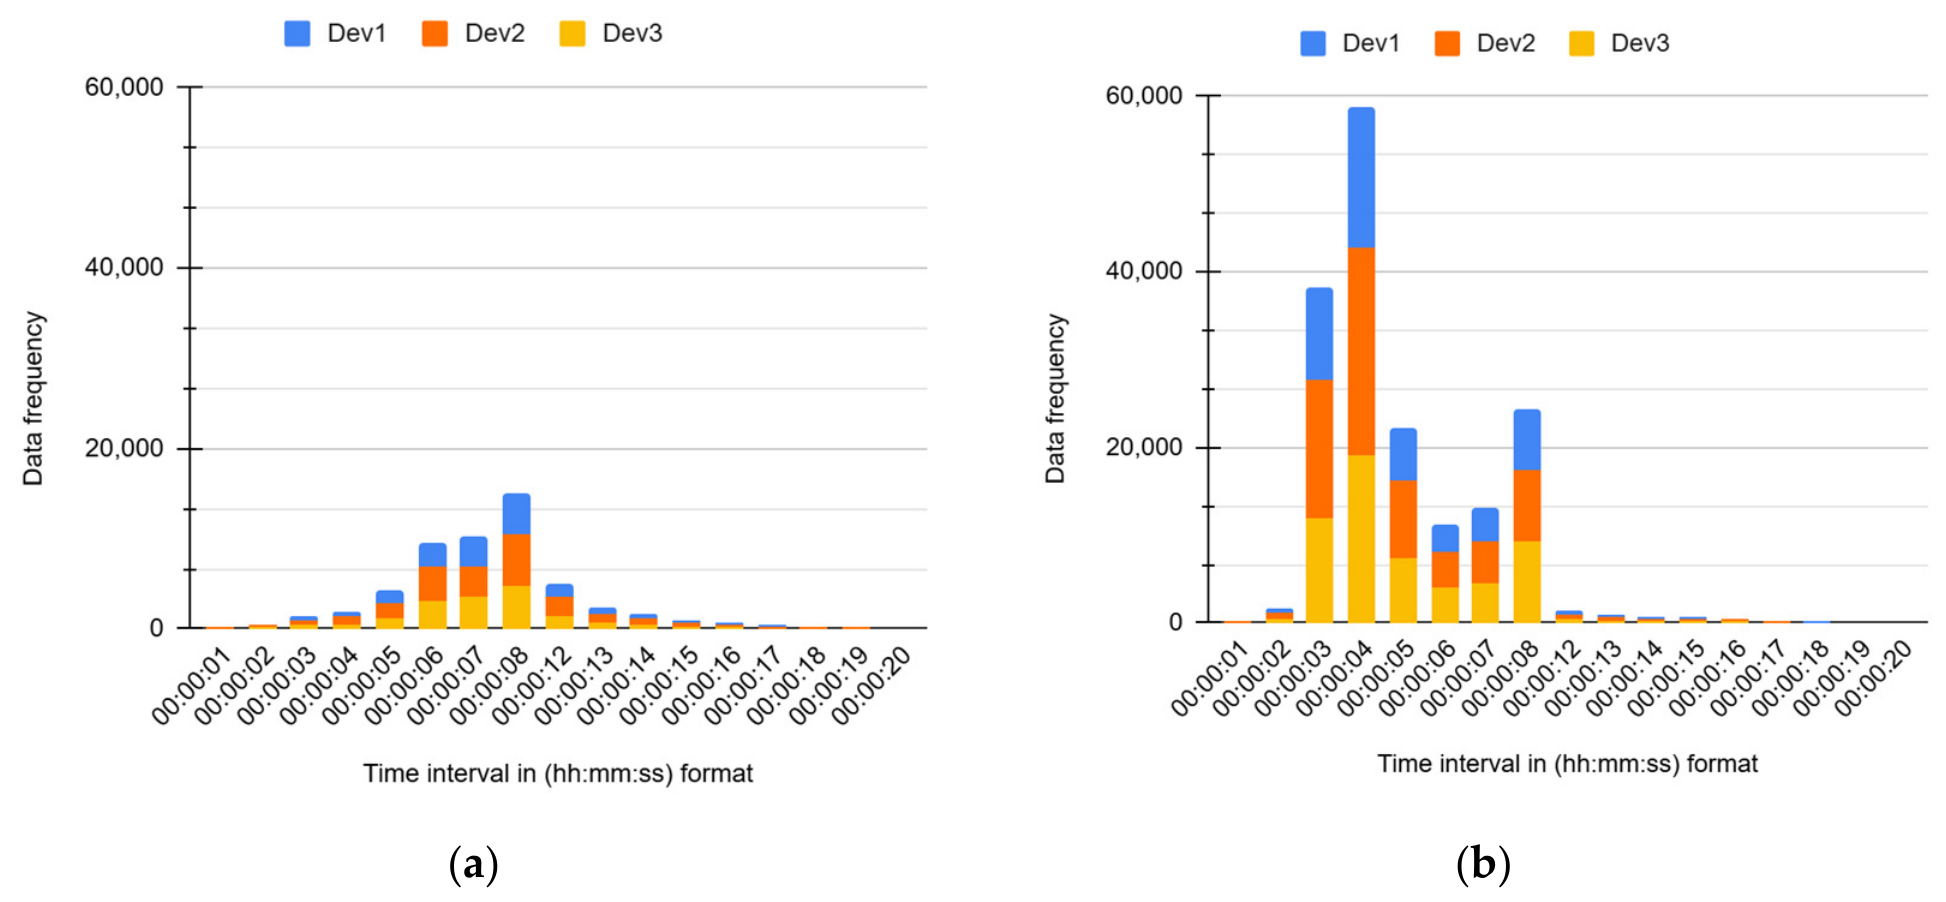
To provide a deeper understanding of the internal acquisition logic and the impact of network instability, Figure 10 shows the frequency distribution of intervals between consecutive readings stored in the cloud. The figure presents the 20 most frequent time intervals observed across the three devices in each cultivation cycle. For all devices, most intervals during both cycles fell within the first 20 s, representing 70.67% in cycle 1 and 90.37% in cycle 2 of the successfully transmitted data. This concentration of short intervals indicates that, when connectivity was available, the system generally maintained a regular sampling routine despite the observed transmission bottlenecks.
Figure 10.
The 20 most frequent time intervals between readings for (a) cycle 1; (b) cycle 2.
As illustrated in Figure 10a, the histogram reveals a dominant peak at 8 s for all devices in the first growth cycle, where the mode is consistently 00:00:08. In the second cycle (see Figure 10b), a shift toward shorter intervals is observed, with the mode converging to 00:00:04 for all devices, suggesting improved internal synchronization and faster sampling performance under higher demand. Nevertheless, because Figure 10 includes only successfully transmitted readings, the observed distributions reflect the timing of records reaching the cloud and do not necessarily represent the internal acquisition or synchronization behavior of the devices.
The histogram also exhibits several smaller peaks in both cycles. These recurring peaks indicate that, besides the intended acquisition frequency, the system occasionally experienced communication delays caused by temporary Wi-Fi interruptions and delayed sensor readings. Occasional longer intervals were also observed, indicating intermittent communication interruptions due to network connectivity issues. For instance, during the first cycle, the maximum gaps recorded were 23:52:43 for device 1, 15:23:12 for device 2, and 24:07:02 for device 3. In the second cycle, the longest intervals were 18:08:09 and 18:08:26 for devices 1 and 2, respectively, and 14:21:53 for device 3.
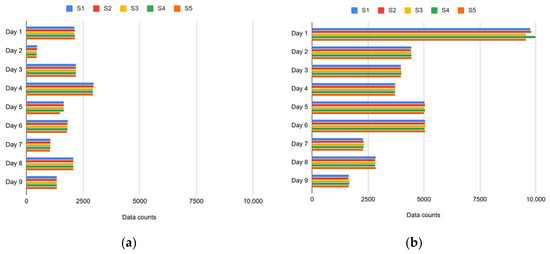
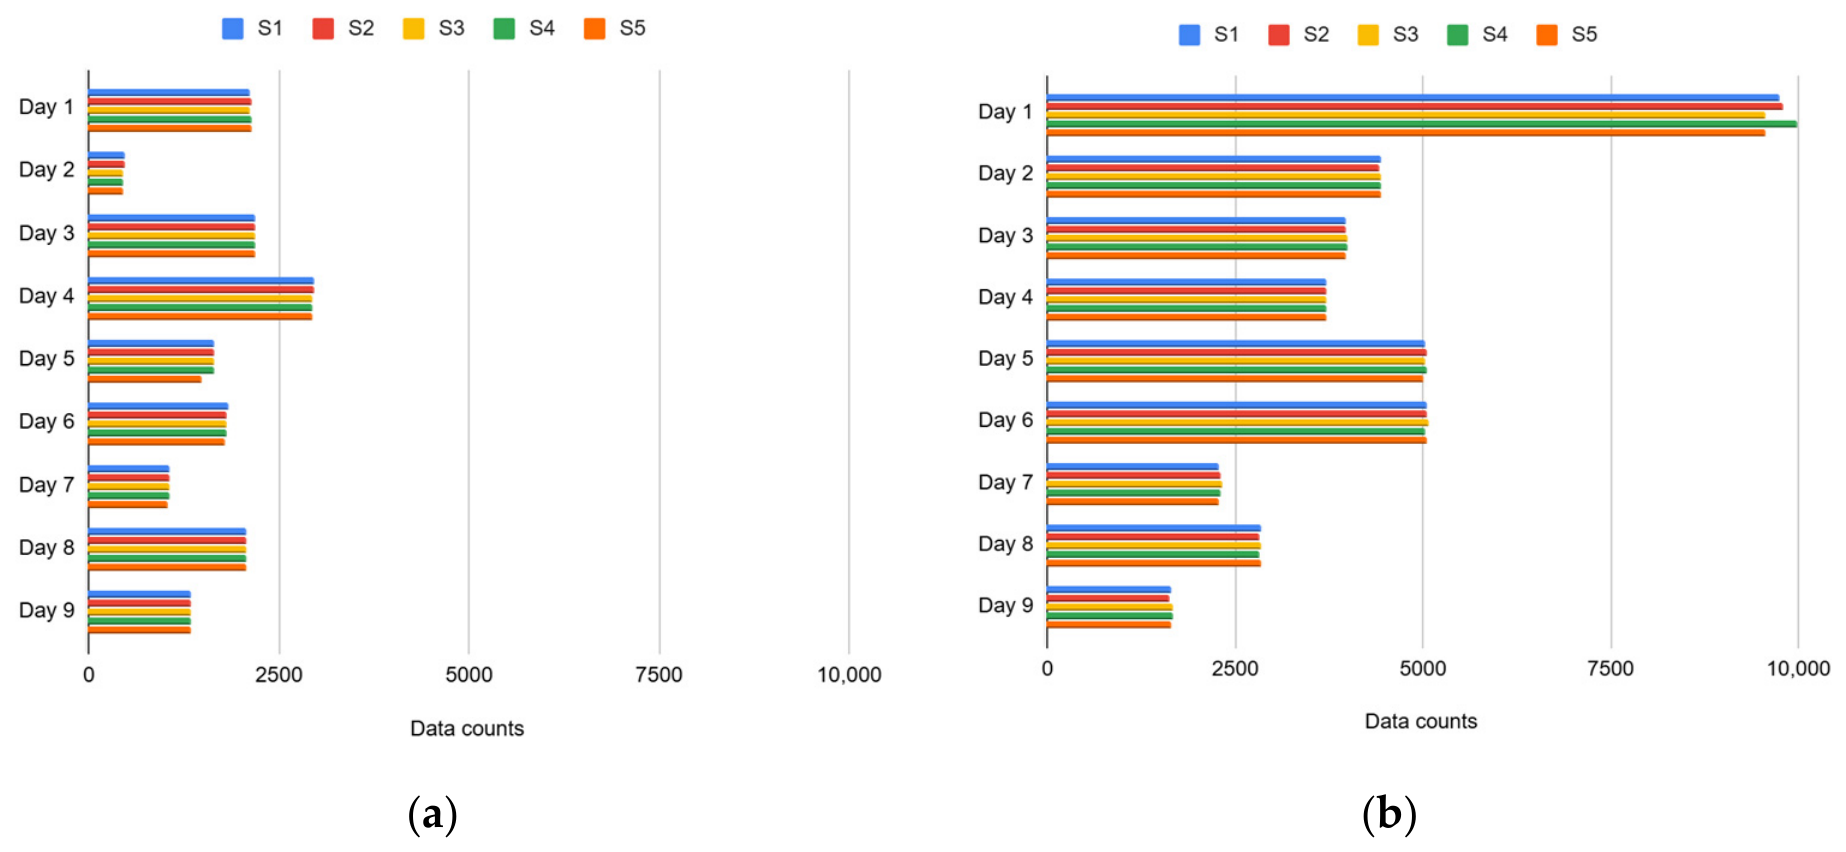
Figure 11 complements this analysis by presenting the daily number of records collected by each sensor. The figure allows the variation in data availability to be compared across the nine monitoring days and among the five sensors (S1–S5) in each cycle. In both cycles, extended and irregular gaps were observed on some days, significantly affecting the total amount of collected data. For instance, the lowest data representation occurred on day 2 in cycle 1, with 2.94% of the total data collected during that cycle, followed by day 9 in cycle 2, which obtained 4.27%. Despite these interruptions, the sensors exhibited relatively consistent daily data collection patterns across the three devices combined, confirming stable acquisition performance whenever connectivity was available.
Figure 11.
Amount of data collected per sensor per day regarding (a) cycle 1; (b) cycle 2.
3.3. Data Coherence and Microclimate Mapping
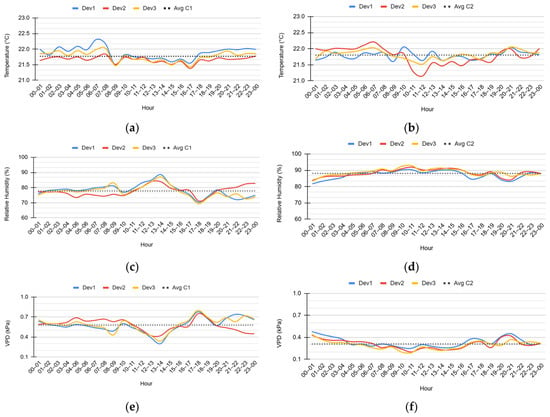
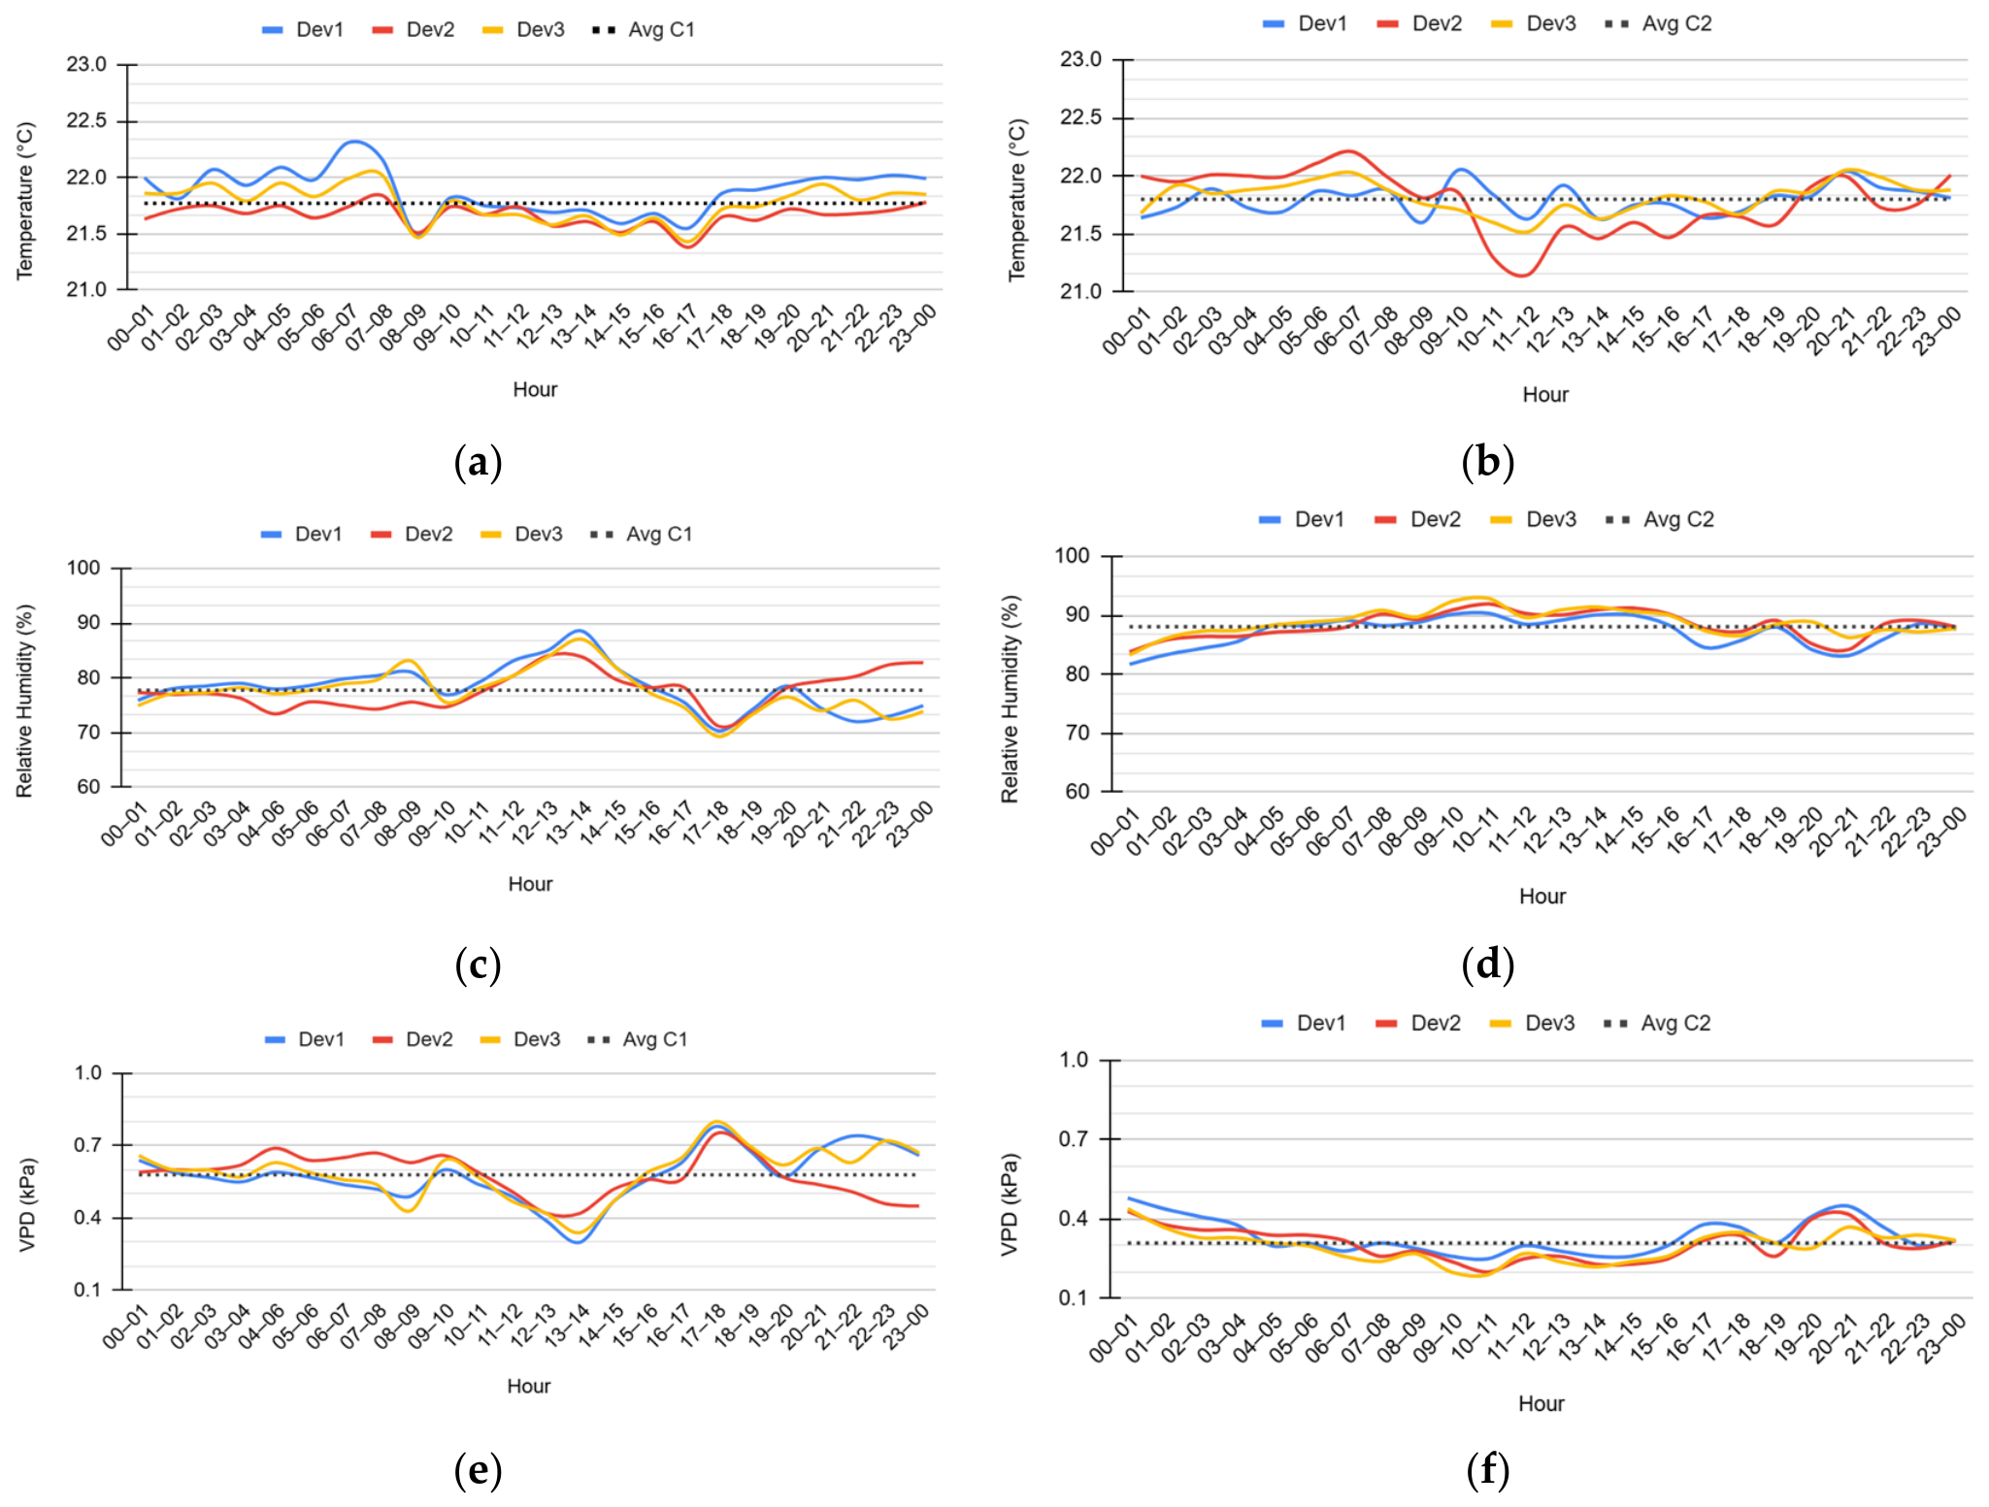
As a final performance analysis, this subsection evaluates the coherence and consistency of the microclimate measurements recorded across monitoring devices and cultivation cycles. Figure 12 presents the temporal profiles of temperature, RH, and VPD over a representative 24-h period. Figure 12a,c,e correspond to cycle 1, whereas Figure 12b,d,f represent cycle 2. All devices showed highly similar temporal trends, with close agreement in temperature, consistent RH variations, and coherent VPD dynamics.
Figure 12.
Daily environmental behavior between devices based on hourly mean: (a) temperature cycle 1; (b) temperature cycle 2; (c) RH cycle 1; (d) RH cycle 2; (e) VPD cycle 1; (f) VPD cycle 2.
Temperature consistency (see Figure 12a,b): the data demonstrate a strong agreement among the three independent devices throughout both cycles. Temperature profiles were nearly superimposed during the dark period, from 9:00 AM to 4:59 PM, and exhibited similar daily fluctuations during the photoperiod. Small deviations were observed at specific times, but the overall temporal patterns remained consistent. The close alignment of measurements indicates consistent temperature acquisition among sensors, supporting the practical suitability of the multiplexed sensing architecture for distributed microclimate monitoring within the evaluated PFAL setup. Furthermore, no evidence of I2C addressing conflicts or communication anomalies was observed under the tested operating conditions. The smooth transition between light and dark periods is consistent with the expected thermal dynamics of the PFALs’ environment.
RH consistency (see Figure 12c,d): a similarly high level of agreement was observed for RH measurements across devices. All traces followed congruent temporal patterns and exhibited the complementary behavior with temperature observed under the controlled environmental conditions. RH exhibited temporal variation with higher values occurring during periods of lower temperature, specifically the dark cycle. The absence of substantial deviations among devices indicates that the sensing architecture consistently captured RH dynamics under the evaluated conditions. Moreover, the sensors successfully represented short-term environmental variations, demonstrating the system’s capability to characterize temporal changes in humidity values.
VPD dynamics (see Figure 12e,f): as a derived parameter from temperature and RH measurements, VPD provides a final validation of the system’s integrated data integrity. The calculated VPD curves for all devices followed similar temporal patterns in both cycles. This overlap demonstrates that the system not only collects raw temperature and RH data accurately but also processes them coherently to yield a consistent secondary variable. VPD remained within agronomically relevant ranges for plant growth during both cycles, with predictable behavior associated with the temperature and RH dynamics.
In summary, the analysis of hourly mean values for temperature, RH, and VPD revealed coherent microclimate behavior throughout both cultivation cycles, with only minor variations between devices. Collectively, these observations demonstrate that the multiplexed sensing architecture was capable of representing the microclimate dynamics of the cultivation environment under the evaluated conditions. Importantly, the high level of agreement among devices indicates that the limitations identified in this study, particularly significant data loss during cloud uploading, are primarily associated with communication-related constraints affecting data continuity, rather than inconsistencies in the environmental measurements successfully acquired.
4. Discussion
4.1. Device Performance Under Varying Sampling Conditions
The distribution of sampling intervals exhibited a strongly right-skewed behavior, characterized by a dominant cluster of short intervals and a small number of long gaps (see Table 1 and Figure 10). Occasional long intervals between readings, likely caused by network instability, were found to be the primary cause of shifts in the mean time intervals. For instance, the mean interval was approximately 6.9 min in cycle 1, while cycle 2 exhibited a mean of 3.5 min, while the corresponding medians were only 8 and 4 s, respectively. This marked divergence between mean and median suggests that intermittent Wi-Fi outages, rather than failures in the data acquisition chain (SHT20 sensors, TCA9548A multiplexer, and ESP32), were the primary cause of extended gaps. This interpretation is supported by the fact that modal intervals remained stable, indicating that the system maintained consistent acquisition logic whenever connectivity was available. Similarly, Espinosa-Gavira et al. [37] used the time difference between consecutive data receptions as an indicator of data acquisition performance and stability in synchronized sensor networks.
Under varying operational demands, the interval distribution remained dominated by short acquisition periods, between 5 and 10 s, indicating efficient I2C communication and consistent sensor-multiplexing performance under stable connectivity. Although data completeness remained limited due to end-to-end transmission interruptions, cycle 2 (27.6–38.6%) achieved higher completeness compared with cycle 1 (23.9–31.5%). This suggests that higher sampling frequency reduced the relative influence of sporadic long-interval events by increasing the successful observations. This finding is consistent with Miller et al. [17], who identified connectivity and infrastructure limitations as the main technical barriers to large-scale IoT adoption in agriculture.
Overall, the proposed sensing architecture demonstrated practical suitability for multipoint microclimate monitoring under the evaluated PFAL conditions. No evidence of I2C address conflicts or acquisition inconsistencies was observed, and measurement coherence was maintained during stable connectivity periods. Nevertheless, the low data completeness indicates that device performance was constrained primarily by wireless communication interruptions rather than by limitations of the sensing architecture itself. Similar communication challenges have been reported as a barrier in large-scale agricultural IoT deployments [17]. Moreover, robust data management strategies have been highlighted as essential for maintaining data continuity under remote monitoring conditions [15].
Therefore, future work should focus on improving communication reliability and data continuity. Private networks or alternative wireless communication solutions may be considered to enhance connectivity and network stability, especially in near-real-time operations that demand continuous, high-throughput data transmission [38,39,40]. For shorter sampling intervals, timestamping data at the device level during acquisition and upon reception at the server is recommended to quantify transmission delays and evaluate the impact of network instability on acquisition performance [37].
4.2. Influence of Wi-Fi Coverage on Data Completeness
Building on the analysis of network-related data losses presented in the previous section, this subsection examines the relationship between spatial variability in Wi-Fi signal strength and the differences in data completeness observed among devices. In both experimental cycles, the devices exhibited a consistent ranking, with device 2 achieving the highest data count, followed by device 3 and device 1 (see Table 1 and Figure 8). This pattern coincided with the spatial distribution of RSSI values (shown in Figure 9), as device 2 was located in a region with comparatively stronger signal conditions, where data completeness reached 31.8% and 38.6% in cycles 1 and 2, respectively. In contrast, devices located in regions with lower RSSI values exhibited reduced data completeness.
Within indoor environments, spatial variability in RSSI is commonly attributed to the combined effects of wireless network characteristics and physical obstructions [41]. In CEA, climate variables such as temperature and humidity have also been reported to influence wireless signal propagation [42,43].
Under the conditions evaluated in this study, the LOS provided a useful framework for interpreting Wi-Fi coverage within the cultivation chamber. Although the chamber door represented the primary LOS obstruction, signal attenuation was also observed throughout the chamber interior, indicating that signal strength was influenced by multiple features of the cultivation system rather than a single structural barrier. Potential contributors include internal geometry and infrastructure of the cultivation system, including isolating walls, vertical shelving, equipment arrangement, metallic structure, and humidity conditions. However, without an independent reference measurement, the present experimental design does not allow their individual contributions to signal attenuation to be quantified.
The spatial correlation between RSSI and data completeness suggests that wireless communication conditions contributed to the differences in transmission performance among devices. Within this configuration, device 2 appeared to benefit from a comparatively more favorable propagation path or partial LOS condition, resulting in fewer transmission interruptions and improved data completeness across both cultivation cycles. Nevertheless, the observed variability cannot be attributed solely to Wi-Fi attenuating elements, as other communication-related factors (e.g., multipath propagation, antenna orientation, and router placement) may also have affected signal propagation and transmission reliability [44].
In summary, the results indicate that Wi-Fi communication performance within the PFAL environment was influenced by device placement and the chamber’s internal configuration. Despite RSSI values between −51 dBm and −60 dBm being generally considered adequate for indoor wireless communication [45], data completeness remained below 38.6% in this study. This observation suggests that acceptable RSSI values alone are insufficient to ensure reliable end-to-end data transmission under PFAL conditions. Instead, the combined effects of signal propagation, environmental attenuation, and network instability likely contributed to the observed differences in data completeness among devices and the substantial data losses.
From a practical perspective, these findings highlight the importance of considering wireless communication constraints during PFAL system deployment. Optimizing sensor and router placement, together with the strategic use of signal repeaters, may reduce signal attenuation and improve connectivity [44]. Furthermore, implementing complementary data acquisition strategies, such as parallel local data storage or wired communication, could facilitate the identification of communication bottlenecks while providing a backup strategy to preserve data integrity during network interruptions.
4.3. Implications for PFAL Microclimate Monitoring
Despite the communication-related limitations previously discussed, the data successfully acquired during periods of active connectivity provide valuable insights into the applicability of distributed microclimate monitoring in PFAL systems. The coherent measurements across devices indicate that the ESP32–TCA9548A sensing architecture possesses a functional local acquisition capacity for high-resolution environmental monitoring under heterogeneous environmental conditions.
As observed in cycle 2, increasing the sampling frequency improved dataset density and temporal resolution, enabling the detection of fine-scale environmental variations that may otherwise remain undetected in less frequent sampling. This high-resolution monitoring is particularly relevant in CEA, where climatic heterogeneity can induce non-uniform plant growth and affect crop performance [46]. Distributed sensor networks have been shown to effectively characterize environmental variability in protected cultivation systems and improve understanding of crop responses to localized microclimatic conditions [47].
The initial thermal characterization of the cultivation chamber (presented in Figure 3) revealed inherent temperature gradients ranging from 22.2 to 24.4 °C under a 23 °C setpoint, indicating considerable spatial heterogeneity associated with airflow distribution. These gradients highlight the importance of distributed environmental sensing in PFAL systems, where localized climatic conditions may influence crop development and environmental control strategies.
During both cultivation cycles, the monitoring system recorded mean temperature fluctuations within a relatively narrow range of 0.63 to 0.89 °C (see Table 1). The consistency of these measurements across devices demonstrates the system’s capability to capture stable and spatially consistent environmental conditions throughout the cultivation period, highlighting its suitability for identifying localized microclimate dynamics within indoor vertical farming environments.
In addition to temperature monitoring, RH and VPD measurements provide further evidence of the system’s ability to capture biologically relevant environmental processes, particularly transpiration and moisture introduced through irrigation. An inverse relationship between RH and VPD was consistently observed throughout both cultivation cycles, with VPD values predominantly ranging from 0.29–0.73 kPa in cycle 1, and 0.24–0.57 kPa in cycle 2. According to Niu et al. [5], VPD values between 0.6–1.0 kPa are considered favorable for plant growth, whereas values between 0.5–0.7 kPa have been recommended for micro-plant factory production systems [48]. Although temporal variations in RH were expected during cultivation, the monitored VPD values remained within ranges commonly reported for CEA, reflecting a balanced relationship between moisture in the air and the plant transpiration requirements.
Finally, the simultaneous operation of the five SHT20 sensors without addressing conflicts or data anomalies and accurate measurements confirms the practical suitability of the I2C multiplexing architecture for distributed environmental sensing in PFAL conditions [49]. Throughout both cultivation cycles, the sensing architecture provided coherent and synchronized environmental measurements across all monitoring units, demonstrating its capacity to support high-resolution microclimate mapping within an indoor vertical farming system.
4.4. Overall Performance and Observed Limitations
The implementation of the multiplexer-based acquisition strategy enabled correct operation of the sensing hardware under conditions of stable connectivity. While the use of the TCA9548A multiplexer to resolve I2C address conflicts is a well-established technical solution, this study contributes to a systematic validation of its application within the practical constraints of a PFAL environment.
The local sensor architecture performed as expected, with high coherence and synchronization in the acquired data, thereby validating the I2C multiplexing architecture. Yet, overall system performance was constrained by wireless communication reliability. Analysis revealed a critically low data completeness rate, ranging from 23% to 38.6% of the theoretical maximum, indicating a loss of more than 60% of transmitted measurements. This data loss, primarily attributed to transmission over Wi-Fi, significantly degraded end-to-end system performance.
Based on the reviewed literature, explicit recommendations regarding the minimum data completeness required for PFAL monitoring or acceptable levels of data loss were not identified. However, the impact of missing data depends on the application context, with real-time decision support and closed-loop control systems generally requiring higher data availability than data logging applications. Therefore, the observed transmission instability limits the suitability of the current implementation for applications requiring continuous and reliable operations.
From an operational perspective, these findings highlight that the practical deployment of distributed environmental monitoring systems in PFALs depends not only on hardware performance but also on network robustness. Future improvements should prioritize network resilience, including local data storage, such as SD cards or flash memory, to preserve data integrity during connectivity interruptions [50,51].
5. Conclusions
The developed monitoring system demonstrated consistent and coherent microclimate sensing behavior across two cultivation cycles. The ESP32–TCA9548A architecture enabled comparable data acquisition performance across all devices under both experimental conditions.
Nevertheless, overall data completeness was significantly affected by variability in the local Wi-Fi network, suggesting that end-to-end system performance was primarily constrained by wireless communication instability rather than by limitations in the sensing hardware. The observed differences in data availability were mainly attributable to signal attenuation and network interruptions within the PFAL environment, highlighting the critical role of communication infrastructure in enclosed agricultural monitoring systems.
The presented findings demonstrate that the effective deployment of IoT-based monitoring networks in smart plant factory systems requires the integration of both functional sensing hardware and robust wireless communication design. Appropriate device placement, adequate signal coverage, and buffering strategies are therefore important considerations for effective communication and continuous data acquisition.
Despite the identified network connectivity issues, the findings experimentally support the practical applicability of multiplexer-based sensor architectures for distributed microclimate monitoring. This experimental evaluation demonstrates their feasibility as a local data-acquisition prototype for monitoring heterogeneous environmental conditions commonly observed in PFAL systems.
From a systems perspective, the proposed architecture supports the practical implementation of modular, low-cost IoT solutions for environmental monitoring in indoor farming applications, provided that the communication constraints inherent to controlled environments are appropriately addressed. The results also indicate potential of such systems for environmental monitoring and future decision-support applications, while acknowledging that data continuity remains dependent on network conditions.
Looking ahead, future work should focus on long-term deployment across diverse PFAL environments, incorporating additional operational conditions, and cross-facility validation. The integration of local storage, buffering mechanisms, and feedback-control capabilities should also be investigated to strengthen system resilience and operational robustness. Such efforts may improve the generalizability of the findings and facilitate the broader adoption of microclimate management strategies in commercial PFALs.
Author Contributions
Conceptualization, A.O., D.S., E.F.N. and T.Q.Z.C.; methodology, A.O. and D.S.; software, A.O. and D.S.; validation, all authors; formal analysis, A.O., D.S. and T.Q.Z.C.; investigation, A.O. and D.S.; resources, T.Q.Z.C.; data curation, A.O. and D.S.; writing—original draft preparation, A.O. and D.S.; writing—review and editing, all authors; visualization, all authors; supervision, E.F.N., L.T.M., L.F.V.P. and T.Q.Z.C.; project administration, T.Q.Z.C.; funding acquisition, E.F.N., L.T.M., L.F.V.P. and T.Q.Z.C. All authors have read and agreed to the published version of the manuscript.
Funding
This research was financed by Fund for Support of Teaching, Research and Extension (FAEPEX), of University of Campinas (UNICAMP) (Process nº 2501/24) and by the Coordenação de Aperfeiçoamento de Pessoal de Nível Superior—Brasil (CAPES)—Finance Code 001.
Institutional Review Board Statement
Not applicable.
Informed Consent Statement
Not applicable.
Data Availability Statement
The original data presented in this study are openly available in REDU (UNICAMP Research Data Repository) at https://doi.org/10.25824/redu/9AZYIO.
Acknowledgments
During the preparation of this manuscript/study, the authors used ChatGPT 5.6, Google Gemini 3.6, and NotebookLM 1.52.8, for the purposes of improving the readability and language of the manuscript, as well as to assist in programming and troubleshooting the device’s firmware code and data analysis. The authors have reviewed and edited the output and take full responsibility for the content of this publication.
Conflicts of Interest
The authors declare no conflicts of interest.
References
- Kozai, T. Role and characteristics of PFALs. In Plant Factory Basics, Applications and Advances, 1st ed.; Elsevier: Amsterdam, The Netherlands, 2022; pp. 25–55. [Google Scholar] [CrossRef] [Scilit]
- Silva, L.M.; Cruz, L.P.; Pacheco, V.S.; Machado, E.C.; Purquerio, L.F.V.; Ribeiro, R.V. Energetic efficiency of biomass production is affected by photoperiod in indoor lettuce cultivation. Theor. Exp. Plant Physiol. 2022, 34, 265–276. [Google Scholar] [CrossRef] [Scilit]
- Bantis, F.; Chatzigeorgiou, I.; Sismanis, M.; Ntinas, G.K.; Koukounaras, A. Vegetable Production in PFALs: Control of Micro-Environmental Factors, Principal Components and Automated Systems. Agriculture 2024, 14, 642. [Google Scholar] [CrossRef] [Scilit]
- Guo, M.; Jin, Z.; Ma, L.; Ou, S. Application of plant factory with artificial lighting in horticultural production: Current progress and future trends. Hortic. Plant J. 2026, 12, 747–763. [Google Scholar] [CrossRef] [Scilit]
- Niu, G.; Kozai, T.; Sabeh, N. Physical environmental factors and their properties. In Plant Factory, 2nd ed.; Elsevier: Amsterdam, The Netherlands, 2020; pp. 185–195. [Google Scholar] [CrossRef] [Scilit]
- Abaajeh, A.R.; Kingston, C.E.; Harty, M. Environmental factors influencing the growth and pathogenicity of microgreens bound for the market: A review. Renew. Agric. Food Syst. 2023, 39, e4. [Google Scholar] [CrossRef] [Scilit]
- Kang, L.; Van Hooff, T. On the improvement of air distribution performance in a vertical farm: Impact of airflow rate and baffles. Therm. Sci. Eng. Prog. 2025, 65, 103842. [Google Scholar] [CrossRef] [Scilit]
- Gu, X.; Goto, E. Evaluation of plant canopy microclimates with realistic plants in plant factories with artificial light using a computational fluid dynamics model. Build. Environ. 2024, 264, 111876. [Google Scholar] [CrossRef] [Scilit]
- Standard ISO/IEC 20924:2024; ISO/IEC Internet of Things (IoT) and Digital Twin—Vocabulary. International Organization for Standardization: Geneva, Switzerland, 2024. Available online: https://www.iso.org/standard/88799.html (accessed on 10 May 2025).
- IEEE 802.11-2016; IEEE Standard for Information Technology—Telecommunications and Information Exchange Between Systems Local and Metropolitan Area Networks—Specific Requirements—Part 11: Wireless LAN Medium Access Control (MAC) and Physical Layer (PHY) Specifications. IEEE Standard Association: Piscataway, NJ, USA, 2016. Available online: https://standards.ieee.org/ieee/802.11/5536 (accessed on 10 May 2025).
- Bandemegala, S.T.P.; Souza, D.; Lantin, S. Towards self-reliance beyond Earth: Standardizing controls for plant growth systems using BRIDGES. In Proceedings of the 53rd International Conference on Environmental Systems (ICES), Louisville, KY, USA, 21–25 July 2024; Available online: https://hdl.handle.net/2346/98989 (accessed on 10 May 2025).
- Jaimes, G.M.; Solano, M.S.; Soriano, L.A. Design and Implementation of Low-Cost Redundant Subsystems for PFAL Reliability. Agriculture 2026, 16, 1297. [Google Scholar] [CrossRef] [Scilit]
- Kumar, V.; Sharma, K.V.; Kedam, N.; Patel, A.; Kate, T.R.; Rathnayake, U. A comprehensive review on smart and sustainable agriculture using IoT technologies. Smart Agric. Technol. 2024, 8, 100487. [Google Scholar] [CrossRef] [Scilit]
- Li, H.; Guo, Y.; Zhao, H.; Wang, Y.; Chow, D. Towards automated greenhouse: A state of the art review on greenhouse monitoring methods and technologies based on Internet of Things. Comput. Electron. Agric. 2021, 191, 106558. [Google Scholar] [CrossRef] [Scilit]
- Mansoor, S.; Iqbal, S.; Popescu, S.M.; Kim, S.L.; Chung, Y.S.; Baek, J.-H. Integration of smart sensors and IOT in precision agriculture: Trends, challenges and future prospectives. Front. Plant Sci. 2025, 16, 1587869. [Google Scholar] [CrossRef] [Scilit] [PubMed]
- Kabir, M.S.N.; Reza, M.N.; Chowdhury, M.; Ali, M.; Samsuzzaman, M.; Lee, K.Y.; Chung, S.O. Technological trends and engineering issues on vertical farms: A review. Horticulturae 2023, 9, 1229. [Google Scholar] [CrossRef] [Scilit]
- Miller, T.; Mikiciuk, G.; Durlik, I.; Mikiciuk, M.; Łobodzińska, A.; Śnieg, M. The IoT and AI in Agriculture: The Time Is Now—A Systematic Review of Smart Sensing Technologies. Sensors 2025, 25, 3583. [Google Scholar] [CrossRef] [Scilit]
- Saad, M.H.; Hamdan, N.M.; Sarker, M.R. State of the art of urban smart vertical farming automation system: Advanced topologies, issues and recommendations. Electronics 2021, 10, 1422. [Google Scholar] [CrossRef] [Scilit]
- Rajak, P.; Ganguly, A.; Adhikary, S.; Bhattacharya, S. Internet of Things and smart sensors in agriculture: Scopes and challenges. J. Agric. Food Res. 2023, 14, 100776. [Google Scholar] [CrossRef] [Scilit]
- Shamshiri, R.R.; Hameed, I.A.; Thorp, K.R.; Balasundram, S.K.; Shafian, S.; Fatemieh, M.; Sultan, M.; Mahns, B.; Samiei, S. Greenhouse automation using wireless sensors and IoT instruments integrated with artificial intelligence. In Intelligent Internet of Things; IntechOpen: London, UK, 2021. [Google Scholar] [CrossRef] [Scilit]
- Nurussa’adah, S.N.; Sari, S.; Rohman, T.; Alfanny, M.; Wicaksono, A. Design and Build an Environmental Conditioning System on a Smart Growth Box for Microgreens. In Proceedings of the 2022 11th Electrical Power, Electronics, Communications, Controls and Informatics Seminar (EECCIS), Malang, Indonesia, 23–25 August 2022; pp. 123–128. [Google Scholar] [CrossRef] [Scilit]
- Thilakarathne, N.N.; Bakar, M.S.; Abas, P.E.; Yassin, H. Towards making the fields talks: A real-time cloud enabled IoT crop management platform for smart agriculture. Front. Plant Sci. 2023, 13, 1030168. [Google Scholar] [CrossRef] [Scilit]
- Kozai, T. Current status of PFALs and smart PFALs. In Smart Plant Factory; Springer: Singapore, 2018; pp. 3–13. [Google Scholar] [CrossRef] [Scilit]
- Chowdhury, M.E.; Khandakar, A.; Ahmed, S.; Hamdalla, J.; Haque, F.; Reaz, M.B.; Al Shafei, A. Design, Construction and Testing of IoT Based Automated Indoor Vertical Hydroponics Farming Test-Bed in Qatar. Sensors 2020, 20, 5637. [Google Scholar] [CrossRef] [Scilit]
- Evan, N.; Anisa, N.; Nurfitriyani, S.J.; Alexandra, J. IoT Architectural Design for Microgreens Cultivation. In Proceedings of the International Conference on Information Management and Technology (ICIMTech), Semarang, Indonesia, 11–12 August 2022; pp. 225–230. [Google Scholar] [CrossRef] [Scilit]
- Alves, R.G.; Lima, F.; Guedes, Í.M.R.; Gimenez, S.P. Dynamic light optimization in vertical farming using an IoT-driven digital twin framework and artificial intelligence. Appl. Soft Comput. 2025, 174, 112985. [Google Scholar] [CrossRef] [Scilit]
- Dzaky, M.A.F.; Nugroho, A.P.; Prasetyatama, Y.D.; Falah, M.A.F.; Sutiarso, L.; Okayasu, T. Mini plant factory development using IoT and cloud system for urban greens cultivation. IOP Conf. Ser. Earth Environ. Sci. 2022, 1116, 012028. [Google Scholar] [CrossRef] [Scilit]
- Kaya, C. Intelligent Environmental Control in Plant Factories: Integrating Sensors, Automation, and AI for Optimal Crop Production. Food Energy Secur. 2025, 14, e70026. [Google Scholar] [CrossRef] [Scilit]
- Anik, S.M.H.; Gao, X.; Meng, N.; Agee, P.R.; McCoy, A.P. A cost-effective, scalable, and portable IoT data infrastructure for indoor environment sensing. J. Build. Eng. 2022, 49, 104027. [Google Scholar] [CrossRef] [Scilit]
- Zhao, H.; Zha, L.; Zhang, J. Towards a socio-technical framework for sustainable plant factories: A review of multi-modal sensing, hybrid modeling, and intelligent control. Inf. Process. Agric. 2026, in press. [Google Scholar] [CrossRef] [Scilit]
- Li, Z.; Liu, Y.; Hossain, O.; Paul, R.; Yao, S.; Wu, S.; Ristaino, J.B.; Zhu, Y.; Wei, Q. Real-time monitoring of plant stresses via chemiresistive profiling of leaf volatiles by a wearable sensor. Matter 2021, 4, 2553–2570. [Google Scholar] [CrossRef] [Scilit]
- Wang, L.; Xiao, M.; Guo, X.; Yang, Y.; Zhang, Z.; Lee, C. Sensing Technologies for Outdoor/Indoor Farming. Biosensors 2024, 14, 629. [Google Scholar] [CrossRef] [Scilit]
- Silveira, F.; Corrêa, R.G.; Baierle, I.C.; Landaverde, R.; Barbedo, J.G. Behavioral profile of farmers in the adoption of agriculture 4.0 technologies in the agri-food system: A case study in Brazil. Front. Sustain. Food Syst. 2025, 9, 1624753. [Google Scholar] [CrossRef] [Scilit]
- Liu, Y.; Mousavi, S.; Pang, Z.; Ni, Z.; Karlsson, M.; Gong, S. Plant Factory: A New Playground of Industrial Communication and Computing. Sensors 2022, 22, 147. [Google Scholar] [CrossRef] [Scilit]
- Rathor, A.S.; Choudhury, S.; Sharma, A.; Nautiyal, P.; Shah, G. Empowering vertical farming through IoT and AI-Driven technologies: A comprehensive review. Heliyon 2024, 10, e34998. [Google Scholar] [CrossRef] [Scilit]
- Texas Instruments. A Basic Guide to I2C (Application Note SBAA565); Texas Instruments: Dallas, TX, USA, 2022; Available online: https://www.ti.com/lit/pdf/sbaa565 (accessed on 19 March 2025).
- Espinosa-Gavira, M.; Agüera-Pérez, A.; Palomares-Salas, J.; Sierra-Fernández, J.M.; Remigio-Carmona, P.; González de la Rosa, J.J. Characterization and performance evaluation of ESP32 for real-time synchronized sensor networks. Procedia Comput. Sci. 2024, 237, 261–268. [Google Scholar] [CrossRef] [Scilit]
- Zhivkov, T.; Sklar, E.I.; Botting, D.; Pearson, S. 5G on the Farm: Evaluating Wireless Network Capabilities and Needs for Agricultural Robotics. Machines 2023, 11, 1064. [Google Scholar] [CrossRef] [Scilit]
- Hashmi, A.U.H.; Mir, G.U.; Sattar, K.; Ullah, S.S.; Alroobaea, R.; Iqbal, J.; Hussain, S. Effects of IoT Communication Protocols for Precision Agriculture in Outdoor Environments. IEEE Access 2024, 12, 46410–46421. [Google Scholar] [CrossRef] [Scilit]
- Hosny, K.M.; El-Hady, W.M.; Samy, F.M. Technologies, Protocols, and applications of Internet of Things in greenhouse Farming: A survey of recent advances. Inf. Process. Agric. 2025, 12, 91–111. [Google Scholar] [CrossRef] [Scilit]
- Booranawong, A.; Sengchuai, K.; Buranapanichkit, D.; Jindapetch, N.; Saito, H. RSSI-Based Indoor Localization Using Multi-Lateration with Zone Selection and Virtual Position-Based Compensation Methods. IEEE Access 2021, 9, 46223–46239. [Google Scholar] [CrossRef] [Scilit]
- Botero-Valencia, J.; Martinez-Perez, A.; Hernández-García, R.; Castano-Londono, L. Exploring Spatial Patterns in Sensor Data for Humidity, Temperature, and RSSI Measurements. Data 2023, 8, 82. [Google Scholar] [CrossRef] [Scilit]
- Apavatjrut, A. Sensor-Driven RSSI Prediction via Adaptive Machine Learning and Environmental Sensing. Sensors 2025, 25, 5199. [Google Scholar] [CrossRef] [Scilit]
- Waqas, M.; Abbas, Q.; Qureshi, A.; Amin, F.; Díez, T.; Rios, C.U.; Gongora, H.F. Advanced Line-of-Sight (LOS) model for communicating devices in modern indoor environment. PLoS ONE 2024, 19, e0305039. [Google Scholar] [CrossRef] [Scilit]
- Wei, B.; Song, H.; Katto, J.; Kikkawa, T. RSSI–CSI Measurement and Variation Mitigation with Commodity Wi-Fi Device. IEEE Internet Things J. 2023, 10, 6249–6258. [Google Scholar] [CrossRef] [Scilit]
- Bicamumakuba, E.; Reza, M.N.; Jin, H.; Samsuzzaman; Lee, K.-H.; Chung, S.-O. Multi-Sensor Monitoring, Intelligent Control, and Data Processing for Smart Greenhouse Environment Management. Sensors 2025, 25, 6134. [Google Scholar] [CrossRef] [Scilit] [PubMed]
- Zhang, C.; Mao, H.; Wu, D.; Liu, Y.; Yang, Q.; Deng, B.; Guan, Z.; Ding, B.; Chen, F. Climatic heterogeneity in a large chrysanthemum greenhouse resolved by a LoRa-based wireless sensor network. Sci. Hortic. 2025, 344, 114109. [Google Scholar] [CrossRef] [Scilit]
- Dzaky, M.A.F.; Nugroho, A.P.; Prasetyatama, Y.D.; Sutiarso, L.; Falah, M.A.F.; Okayasu, T. Control of vapor pressure deficit (VPD) in micro-plant factory (McPF) to enhanced spinach microgreens growth. Sci. Hortic. 2024, 332, 113229. [Google Scholar] [CrossRef] [Scilit]
- Guo, Y.; Fan, S.; Geng, Y.; Liu, Y.; Zhang, F. A Review of the Role of Sensor in the Vertical Farms: Superiority and Prospects. Food Front. 2026, 7, e70206. [Google Scholar] [CrossRef] [Scilit]
- Sarangi, A.K. No Net IoT: A new Data format for Buffered Stream with data compression to remove data loss during network outage. In Proceedings of the 2020 International Conference on Emerging Trends in Information Technlogy and Engineering (ic-ETITE), Vellore, India, 24–25 February 2020; pp. 1–5. [Google Scholar] [CrossRef] [Scilit]
- Pompeo, J.; Yu, Z.; Zhang, C.; Wu, S.; Zhang, Y.; Gomez, C.; Correll, M. Assessing the stability of indoor farming systems using data outlier detection. Front. Plant Sci. 2025, 15, 1270544. [Google Scholar] [CrossRef] [Scilit]

Disclaimer/Publisher’s Note: The statements, opinions and data contained in all publications are solely those of the individual author(s) and contributor(s) and not of MDPI and/or the editor(s). MDPI and/or the editor(s) disclaim responsibility for any injury to people or property resulting from any ideas, methods, instructions or products referred to in the content. |
© 2026 by the authors. Licensee MDPI, Basel, Switzerland. This article is an open access article distributed under the terms and conditions of the Creative Commons Attribution (CC BY) license.