


Abstract
The development of reliable computer vision systems for poultry slaughterhouses requires robust segmentation methods capable of handling challenging industrial conditions. This study evaluated the structural behavior, computational performance, and consistency of three segmentation pipelines for broiler chicken carcass inspection: (i) an edge-based approach using Canny detection and morphological operations, (ii) a threshold-based method using global binarization and contour extraction, and (iii) a deep learning-based approach for automatic background removal implemented with the rembg library. A dataset of 587 RGB images acquired in commercial slaughterhouses was analyzed. Segmentation performance was assessed using Intersection over Union, Dice coefficient, Overlap Error, Structural Similarity Index, Edge Preservation Index, and Fisher Discriminant Ratio, complemented by qualitative analyses of discordance maps and Sobel edge visualizations. Results showed that overlap-based metrics alone were insufficient, as high IoU and Dice values often concealed important boundary differences. Classical methods exhibited lower computational cost and processing times compatible with real-time applications but presented limitations in contour stability. The deep learning-based approach generated more continuous and structurally coherent boundaries, although at higher computational cost. These findings demonstrate that segmentation methods produce distinct structural representations that can directly affect the reliability of artificial intelligence systems for poultry inspection.
1. Introduction
The poultry industry has undergone substantial technological transformation over recent decades, driven by increasing demands for food safety, operational efficiency, traceability, and process automation [1,2]. Despite these advances, post-mortem inspection in commercial slaughterhouses still relies predominantly on manual evaluation performed by trained inspectors responsible for identifying contamination, lesions, carcass defects, and other sanitary abnormalities [3]. Although effective, manual inspection procedures are inherently susceptible to subjectivity, operator fatigue, variability in decision-making, and limitations associated with high-speed processing lines, particularly in large-scale industrial environments [4].
In this context, the incorporation of computer vision systems and artificial intelligence technologies into poultry processing lines has gained increasing attention as part of the broader transition toward Industry 4.0 and smart food production systems [5]. Automated inspection approaches have the potential to improve standardization, reduce human-related variability, enhance operational throughput, and support more reliable decision-making processes in industrial environments [6]. Furthermore, machine vision systems enable continuous, non-contact inspection procedures that may contribute to reducing cross-contamination risks while improving traceability and quality control [7,8].
However, the implementation of reliable computer vision systems in poultry slaughterhouses remains challenging due to the complexity of industrial acquisition conditions. Factors such as illumination variability, reflections caused by surface moisture, heterogeneous backgrounds, rapid carcass movement, overlapping anatomical structures, and operational constraints directly interfere with image quality and compromise the stability of subsequent image processing stages [9]. Unlike controlled laboratory datasets, industrial acquisition environments introduce substantial visual variability, requiring segmentation pipelines capable of maintaining structural consistency under adverse conditions.
Within computer vision systems, image segmentation represents one of the most critical stages of the processing pipeline, since it defines the spatial representation of the region of interest that will subsequently be used for feature extraction, quantitative analysis, and artificial intelligence–based classification [10]. Inadequate segmentation may introduce background artifacts, contour distortions, and inconsistencies in object representation, directly affecting the quality and reliability of downstream analytical procedures. In industrial poultry inspection, segmentation inaccuracies may compromise the identification of contamination, lesions, and pathological alterations, ultimately affecting food safety and inspection reliability.
The importance of segmentation extends beyond simple object isolation. Different segmentation pipelines may generate substantially distinct structural representations of the same object, even when overlap-based similarity metrics indicate apparently satisfactory agreement. Variations in contour continuity, edge localization, and region homogeneity may influence the extraction of morphological, spectral, and textural features commonly used in machine learning and deep learning models. Consequently, segmentation quality should be evaluated by considering spatial overlap, structural consistency, boundary preservation, computational feasibility, and performance under real acquisition conditions [11].
Over the years, a wide range of segmentation strategies has been proposed for industrial and agricultural computer vision applications, including threshold-based approaches, edge-detection methods, clustering techniques, region-growing algorithms, and, more recently, deep learning-based architectures [10,12]. Classical segmentation approaches are generally computationally efficient and relatively easy to implement, making them attractive for real-time industrial applications. Nevertheless, these methods often show limited performance under conditions involving non-uniform illumination, low contrast, reflections, and heterogeneous backgrounds [13].
In parallel, deep learning-based segmentation methods have demonstrated substantial advances in image analysis tasks by learning hierarchical and context-aware feature representations directly from data [14]. Background removal approaches based on salient object detection and semantic segmentation have also gained attention as preprocessing strategies capable of isolating foreground regions while suppressing irrelevant contextual information [15]. Despite these advances, deep learning methods often require substantially higher computational resources and may exhibit limited generalization capability when exposed to industrial conditions different from those represented during training [16].
Most studies involving segmentation evaluation focus primarily on overlap-based metrics, such as Intersection over Union and Dice coefficient, frequently emphasizing segmentation agreement while overlooking differences in contour representation and structural consistency [17,18]. However, in industrial inspection scenarios, accurate boundary delineation is particularly relevant because subtle contour variations may directly affect feature extraction and subsequent classification stages. Therefore, complementary analyses involving edge-sensitive metrics and qualitative spatial evaluation become essential for understanding the operational behavior of segmentation pipelines under real acquisition conditions.
In this context, the present study investigates the structural and computational behavior of different image segmentation pipelines applied to broiler chicken carcass inspection under complex industrial acquisition conditions. Rather than establishing a universally optimal segmentation method, the objective of this work is to analyze how different segmentation strategies behave regarding structural consistency, boundary representation, computational efficiency, and inter-method variability in real slaughterhouse environments. Three segmentation pipelines were evaluated, including edge-based, threshold-based, and deep learning-based approaches, using RGB images acquired under operational industrial conditions. The study combines quantitative metrics, edge-sensitive analyses, computational evaluation, and qualitative visualization strategies to provide a more comprehensive assessment of segmentation behavior and its potential implications for downstream artificial intelligence applications.
2. Materials and Methods
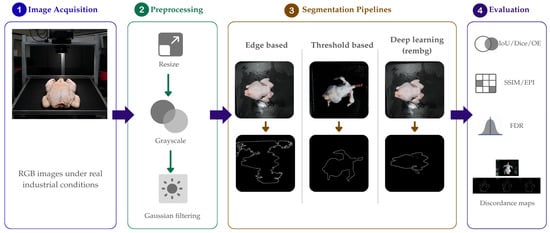
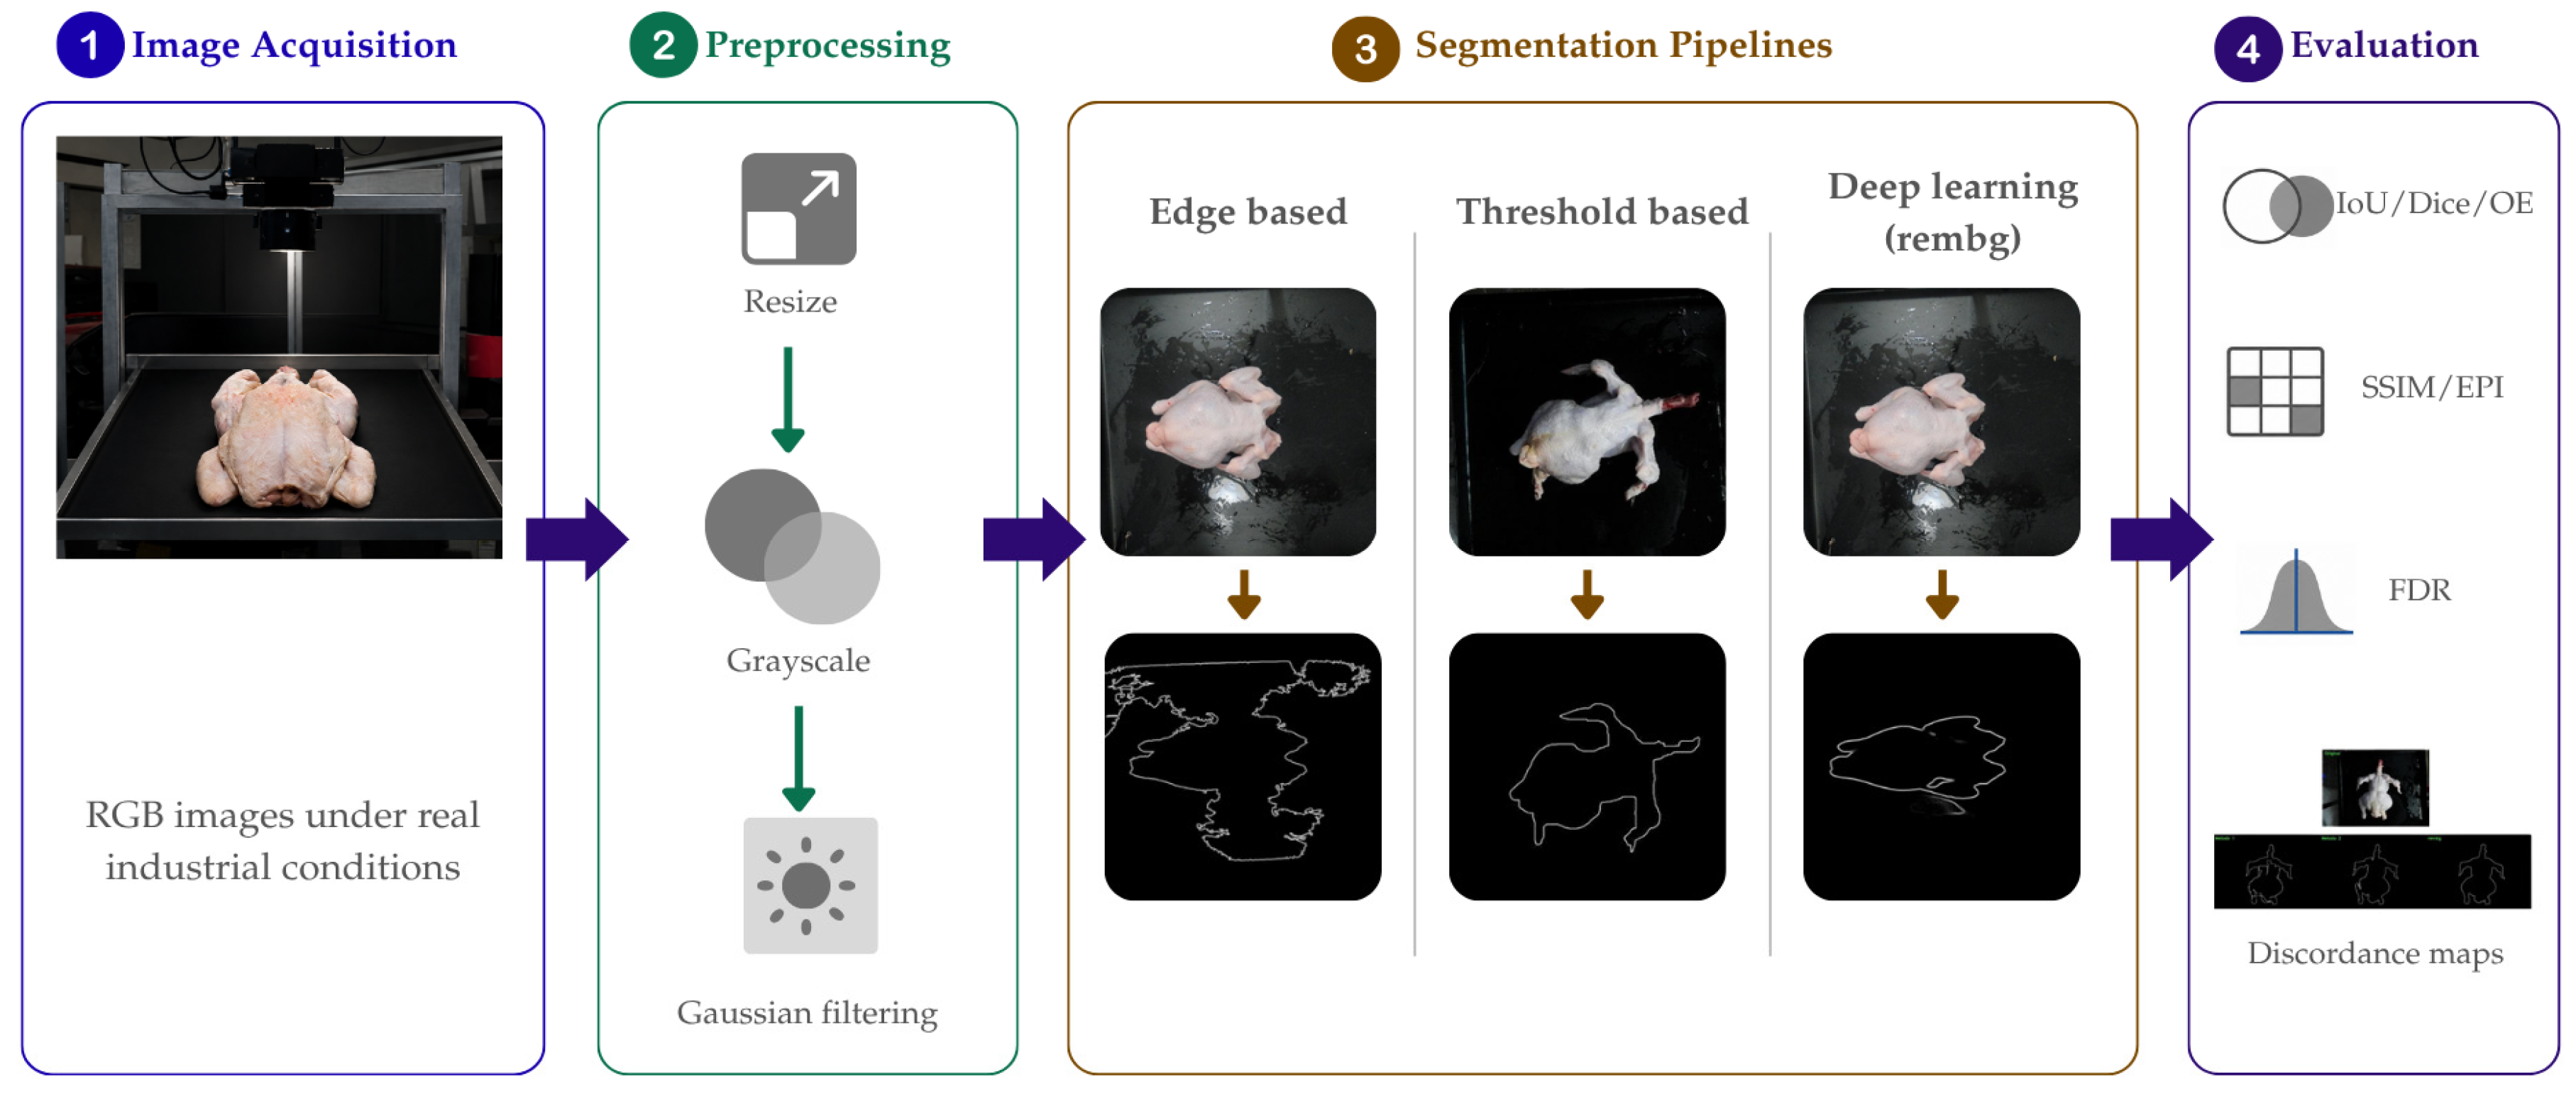
The experimental workflow included image acquisition, preprocessing, segmentation, binary mask generation, pairwise structural comparison between methods, and quantitative and qualitative evaluation of segmentation consistency. The complete experimental pipeline adopted in this study is illustrated in Figure 1.
Figure 1.
Graphical overview of the proposed image segmentation pipeline for broiler carcass inspection.
The study was conducted between May and November 2024 at the Department of Biosystems Engineering (ZEB) of the Faculty of Animal Science and Food Engineering (FZEA), University of São Paulo (USP), Fernando Costa campus, located in Pirassununga, São Paulo, Brazil. Computational analyses were performed at the Laboratory of Agricultural Machinery and Precision Agriculture (LAMAP), with additional support from the Laboratory of Technology and Information Systems (LTSI).
2.1. Image Acquisition
Image acquisition was carried out in two poultry slaughterhouses located in the municipalities of Pirassununga and Holambra, São Paulo, Brazil, with prior authorization from the technical managers responsible for each facility. One facility was a commercial poultry slaughterhouse (Holambra Alimentos), operating under Federal Inspection Service (SIF) supervision. The second was the Frigorífico-Escola of the University of São Paulo (USP), a teaching and research slaughterhouse registered with the São Paulo State Inspection Service (SISP), where practical activities and animal product processing are conducted. All acquisition procedures were performed under routine operating conditions and under the supervision of a licensed veterinarian to ensure compliance with biosafety regulations, hygiene protocols, and official sanitary inspection standards.
To provide controlled yet operationally realistic acquisition conditions, a dedicated acquisition structure was developed using stainless steel components compatible with industrial hygienization procedures. The acquisition system allowed fixed camera positioning and standardized image capture while preserving the environmental variability naturally present in slaughterhouse facilities. During acquisition, carcasses were individually positioned in dorsal decubitus orientation under naturally varying illumination conditions representative of real industrial operation scenarios.
RGB images were acquired using a Sony Cyber-shot DSC-HX1 digital camera (Sony Group Corporation, Tokyo, Japan) with a spatial resolution of 1280 × 720 pixels. A total of 587 images were collected, including 260 contaminated carcasses presenting visible fecal contamination and 327 non-contaminated carcasses. Sample classification was performed through expert visual inspection conducted by a trained veterinarian, who confirmed the presence or absence of contamination in each sample prior to computational analysis.
The evaluation was also stratified according to contamination status because contaminated and non-contaminated carcasses may exhibit visual differences that influence image segmentation. The presence of contamination can modify color, texture, contrast, and local edge definition, potentially affecting foreground-background separability. Therefore, the grouping was based primarily on visual characteristics associated with contamination rather than differences in background complexity. This analysis was also considered relevant because segmentation quality may influence subsequent image analysis stages, including feature extraction and classification.
Industrial acquisition conditions introduced several sources of variability into the dataset. Due to hygienic requirements associated with slaughterhouse operation, the acquisition surface required continuous cleaning throughout the collection process, resulting in the presence of water residues and reflective regions that occasionally introduced visual artifacts into the images. Additionally, infrastructure limitations associated with humid industrial environments restricted the use of auxiliary illumination systems because of electrical safety concerns. Therefore, images were acquired under the naturally varying illumination conditions of the commercial slaughterhouses, without controlling or measuring light intensity. Combined with rapid operational routines and carcass positioning variability, these conditions generated a heterogeneous acquisition scenario representative of real industrial poultry inspection environments.
2.2. Image Preprocessing
The use of RGB imaging was motivated by its practical applicability in industrial environments and compatibility with real-time computer vision systems commonly employed in automated inspection procedures. Prior to segmentation, all images underwent a preprocessing stage aimed at reducing acquisition variability, standardizing image dimensions, and improving structural consistency for subsequent segmentation operations.
Initially, all images were resized to a fixed spatial resolution of 800 × 600 pixels in order to ensure dimensional uniformity across samples and reduce computational cost during processing. Subsequently, RGB images were converted to grayscale to support intensity-based segmentation operations and edge extraction procedures.
To attenuate high-frequency noise and reduce local intensity fluctuations caused by reflections and surface moisture, Gaussian filtering was applied using a 7 × 7 convolution kernel. This preprocessing stage contributed to smoothing local image variations while preserving the global structural organization of the carcasses, improving contour continuity and region homogeneity for subsequent segmentation procedures. The preprocessing operations described in this section were implemented directly within the computational pipeline developed for this study.
2.3. Segmentation Pipelines
Three distinct segmentation pipelines were evaluated in order to investigate different computational strategies for carcass extraction under industrial acquisition conditions. The selected approaches represent classical edge-based and threshold-based segmentation methods, as well as a deep learning-based background removal strategy.
2.3.1. Edge-Based Segmentation Pipeline
The first segmentation pipeline was based on edge detection using the Canny operator. Initially, the preprocessed grayscale image was subjected to edge extraction in order to identify intensity discontinuities associated with object boundaries. Canny edge detection was performed using lower and upper threshold values of 30 and 120, respectively. Because edge fragmentation frequently occurs under industrial conditions involving noise and illumination variability, morphological closing operations were subsequently applied using a structuring element with dimensions of 25 × 25 pixels.
The morphological reconstruction stage aimed to reconnect discontinuous contour regions and generate spatially coherent structures corresponding to the carcass boundaries. After contour reconstruction, the largest connected contour detected in the image was selected under the assumption that it represented the primary object of interest. The resulting region was then converted into a binary segmentation mask representing the extracted carcass structure.
2.3.2. Threshold-Based Segmentation Pipeline
The second segmentation approach employed global thresholding applied to the grayscale image. A fixed threshold value of 50 was used to separate foreground and background regions according to pixel intensity distributions. Following binarization, contour extraction was performed to identify connected regions corresponding to potential carcass structures.
Similarly, to the edge-based approach, the largest connected component identified in the binary image was selected as the final segmented region. This method was included due to its low computational complexity, straightforward implementation, and frequent application in industrial computer vision systems operating under real-time constraints.
2.3.3. Deep Learning-Based Segmentation Pipeline
The third segmentation pipeline employed the rembg library, which implements deep learning-based background removal techniques using pretrained salient object segmentation models. Unlike classical methods based primarily on intensity or edge information, the rembg approach performs foreground extraction through hierarchical feature representation and contextual analysis learned from large-scale image datasets.
For each image, the segmentation output generated by the rembg pipeline included an alpha channel corresponding to the estimated foreground region. This alpha channel was extracted and converted into a binary mask representing the segmented carcass structure. Although this approach presents increased computational cost compared to classical pipelines, it enables more adaptive segmentation behavior under conditions involving background heterogeneity, reflections, and complex object boundaries. The segmentation pipeline was implemented in Python version 3.10.0 using Visual Studio Code version 1.122.0 on Microsoft Windows 11 Home Single Language. Background removal was performed using the rembg library version 2.0.67, with the pre-trained U2-Net model and default processing parameters. No manual threshold adjustment or additional user-defined segmentation parameters were applied. Each image was processed individually, and the output alpha mask generated by rembg was used to separate the foreground from the background. The procedure was executed on a computer equipped with an 11th Gen Intel(R) Core(TM) i3-1115G4 @ 3.00 GHz processor (Intel Corporation, Santa Clara, CA, USA) and 20 GB of RAM.
2.4. Quantitative Evaluation Metrics
Quantitative evaluation was performed through pairwise structural comparisons between the segmentation outputs generated by the evaluated pipelines. Rather than establishing absolute segmentation accuracy against manually annotated masks, the analysis focused on investigating inter-method agreement, structural consistency, edge preservation behavior, and computational performance under industrial acquisition conditions.
The evaluation framework included complementary metrics widely employed in image segmentation analysis [19], allowing the investigation of spatial overlap, structural similarity, disagreement behavior, boundary consistency, and foreground-background separability.
The Intersection over Union (IoU) metric was used to quantify the overlap between segmentation masks generated by different pipelines. Similarly, the Dice coefficient was employed to evaluate spatial agreement between segmented regions. To investigate disagreement behavior, the Overlap Error (OE) metric was computed, providing a complementary measure of spatial inconsistency between masks.
Structural similarity between segmentation outputs was evaluated using the Structural Similarity Index (SSIM), which considers luminance, contrast, and structural information. In addition, contour consistency was analyzed using the Edge Preservation Index (EPI), computed from Sobel gradient representations extracted from the binary masks. Finally, the Fisher Discriminant Ratio (FDR) was used to investigate the separability between foreground and background intensity distributions under industrial acquisition conditions.
The mathematical formulations corresponding to the evaluation metrics employed in this study are presented in Table 1.
Table 1.
Summary of evaluation metrics and mathematical formulations used for segmentation algorithm pairwise comparisons.
2.5. Qualitative Analysis Using Discordance Maps
In addition to quantitative evaluation, qualitative spatial analyses were performed using discordance maps in order to investigate localized variability between segmentation pipelines. Unlike global similarity metrics, discordance maps provide spatial representations of disagreement behavior, enabling the identification of regions where segmentation methods produce structurally inconsistent outputs.
For each image, the binary masks generated by the evaluated segmentation pipelines were spatially stacked, and pixel-wise standard deviation was computed across the corresponding masks. Regions presenting high variability indicated disagreement between segmentation methods, whereas regions with low variability indicated structural consistency among pipelines.
The resulting variability maps were normalized to the 8-bit range for visualization purposes and subsequently analyzed together with edge representations generated using Sobel operators. In most cases, disagreement regions were concentrated along object boundaries, reflecting differences in contour delineation strategies adopted by the evaluated pipelines. These analyses provided complementary information to the edge-sensitive quantitative metrics and contributed to a more comprehensive understanding of segmentation behavior under industrial acquisition conditions.
3. Results
The evaluated segmentation pipelines exhibited distinct structural and computational behaviors under industrial acquisition conditions, particularly in scenarios involving illumination variability, reflections caused by surface moisture, and heterogeneous backgrounds. Although substantial agreement was observed in the global representation of the segmented regions, important differences emerged regarding contour continuity, edge localization, and structural consistency among the evaluated approaches.
The quantitative results obtained from pairwise comparisons between segmentation pipelines are summarized in Table 2.
Table 2.
Performance of segmentation methods for broiler chicken carcasses under contaminated and non-contaminated conditions.
Regarding dataset distribution, the number of valid processed images remained relatively balanced across pairwise comparisons, ranging from 252 to 260 samples in the contaminated group and from 314 to 323 samples in the non-contaminated group. These variations were primarily associated with the successful generation of valid segmentation masks by each evaluated pipeline.
From a computational perspective, the classical segmentation pipelines exhibited substantially lower processing times compared to the deep learning-based approach. The edge-based and threshold-based methods presented average processing times close to 0.01 s per image under both contaminated and non-contaminated conditions, demonstrating compatibility with real-time industrial applications. In contrast, the rembg-based pipeline required approximately 2.44 s per image for contaminated samples and up to 2.51 s for non-contaminated samples, reflecting the substantially higher computational demand associated with deep learning-based inference procedures.
Despite the differences in computational cost, overlap-based metrics revealed relatively high agreement between segmentation outputs generated by the evaluated methods. Pairwise comparisons involving the edge-based and threshold-based pipelines generally presented the highest similarity values, whereas comparisons involving the rembg pipeline exhibited greater variability across multiple evaluation metrics.
The FDR demonstrated consistently low minimum values across all evaluated conditions, reaching 0.0001 in all comparisons. These results indicate limited separability between foreground and background intensity distributions under industrial acquisition conditions. The presence of reflections, surface moisture, and illumination heterogeneity produced substantial overlap between intensity distributions, reducing the effectiveness of globally intensity-based segmentation strategies. Nevertheless, maximum FDR values varied considerably across comparisons, particularly in analyses involving the rembg pipeline, where values reached up to 6.1491 in contaminated samples. This increased variability suggests that the deep learning-based approach generated structurally distinct segmentation representations compared to the classical pipelines.
The OE metric also revealed substantial variability across pairwise comparisons. In contaminated images, minimum OE values ranged from 0.0346 to 0.0860, whereas maximum values varied between 0.7619 and 0.9304. For non-contaminated samples, minimum OE values ranged from 0.0386 to 0.0917, while maximum values reached up to 0.9970 in specific comparisons. Higher disagreement levels were predominantly observed in comparisons involving the rembg pipeline, whereas lower disagreement values were generally associated with comparisons between the classical segmentation methods.
The Edge Preservation Index revealed more pronounced differences between segmentation pipelines than overlap-based metrics. In contaminated images, minimum EPI values ranged from 0.0024 to 0.1610, while maximum values varied between 0.1446 and 0.5063. For non-contaminated samples, minimum values remained low, ranging from 0.0041 to 0.0136, although maximum values reached values close to 1.0 in specific cases. Overall, pairwise comparisons involving the rembg pipeline exhibited lower edge agreement than those observed between the edge-based and threshold-based methods, indicating distinct contour delineation behaviors among the evaluated approaches.
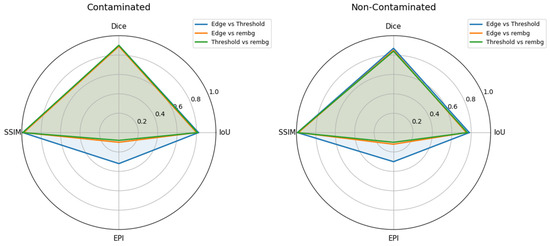
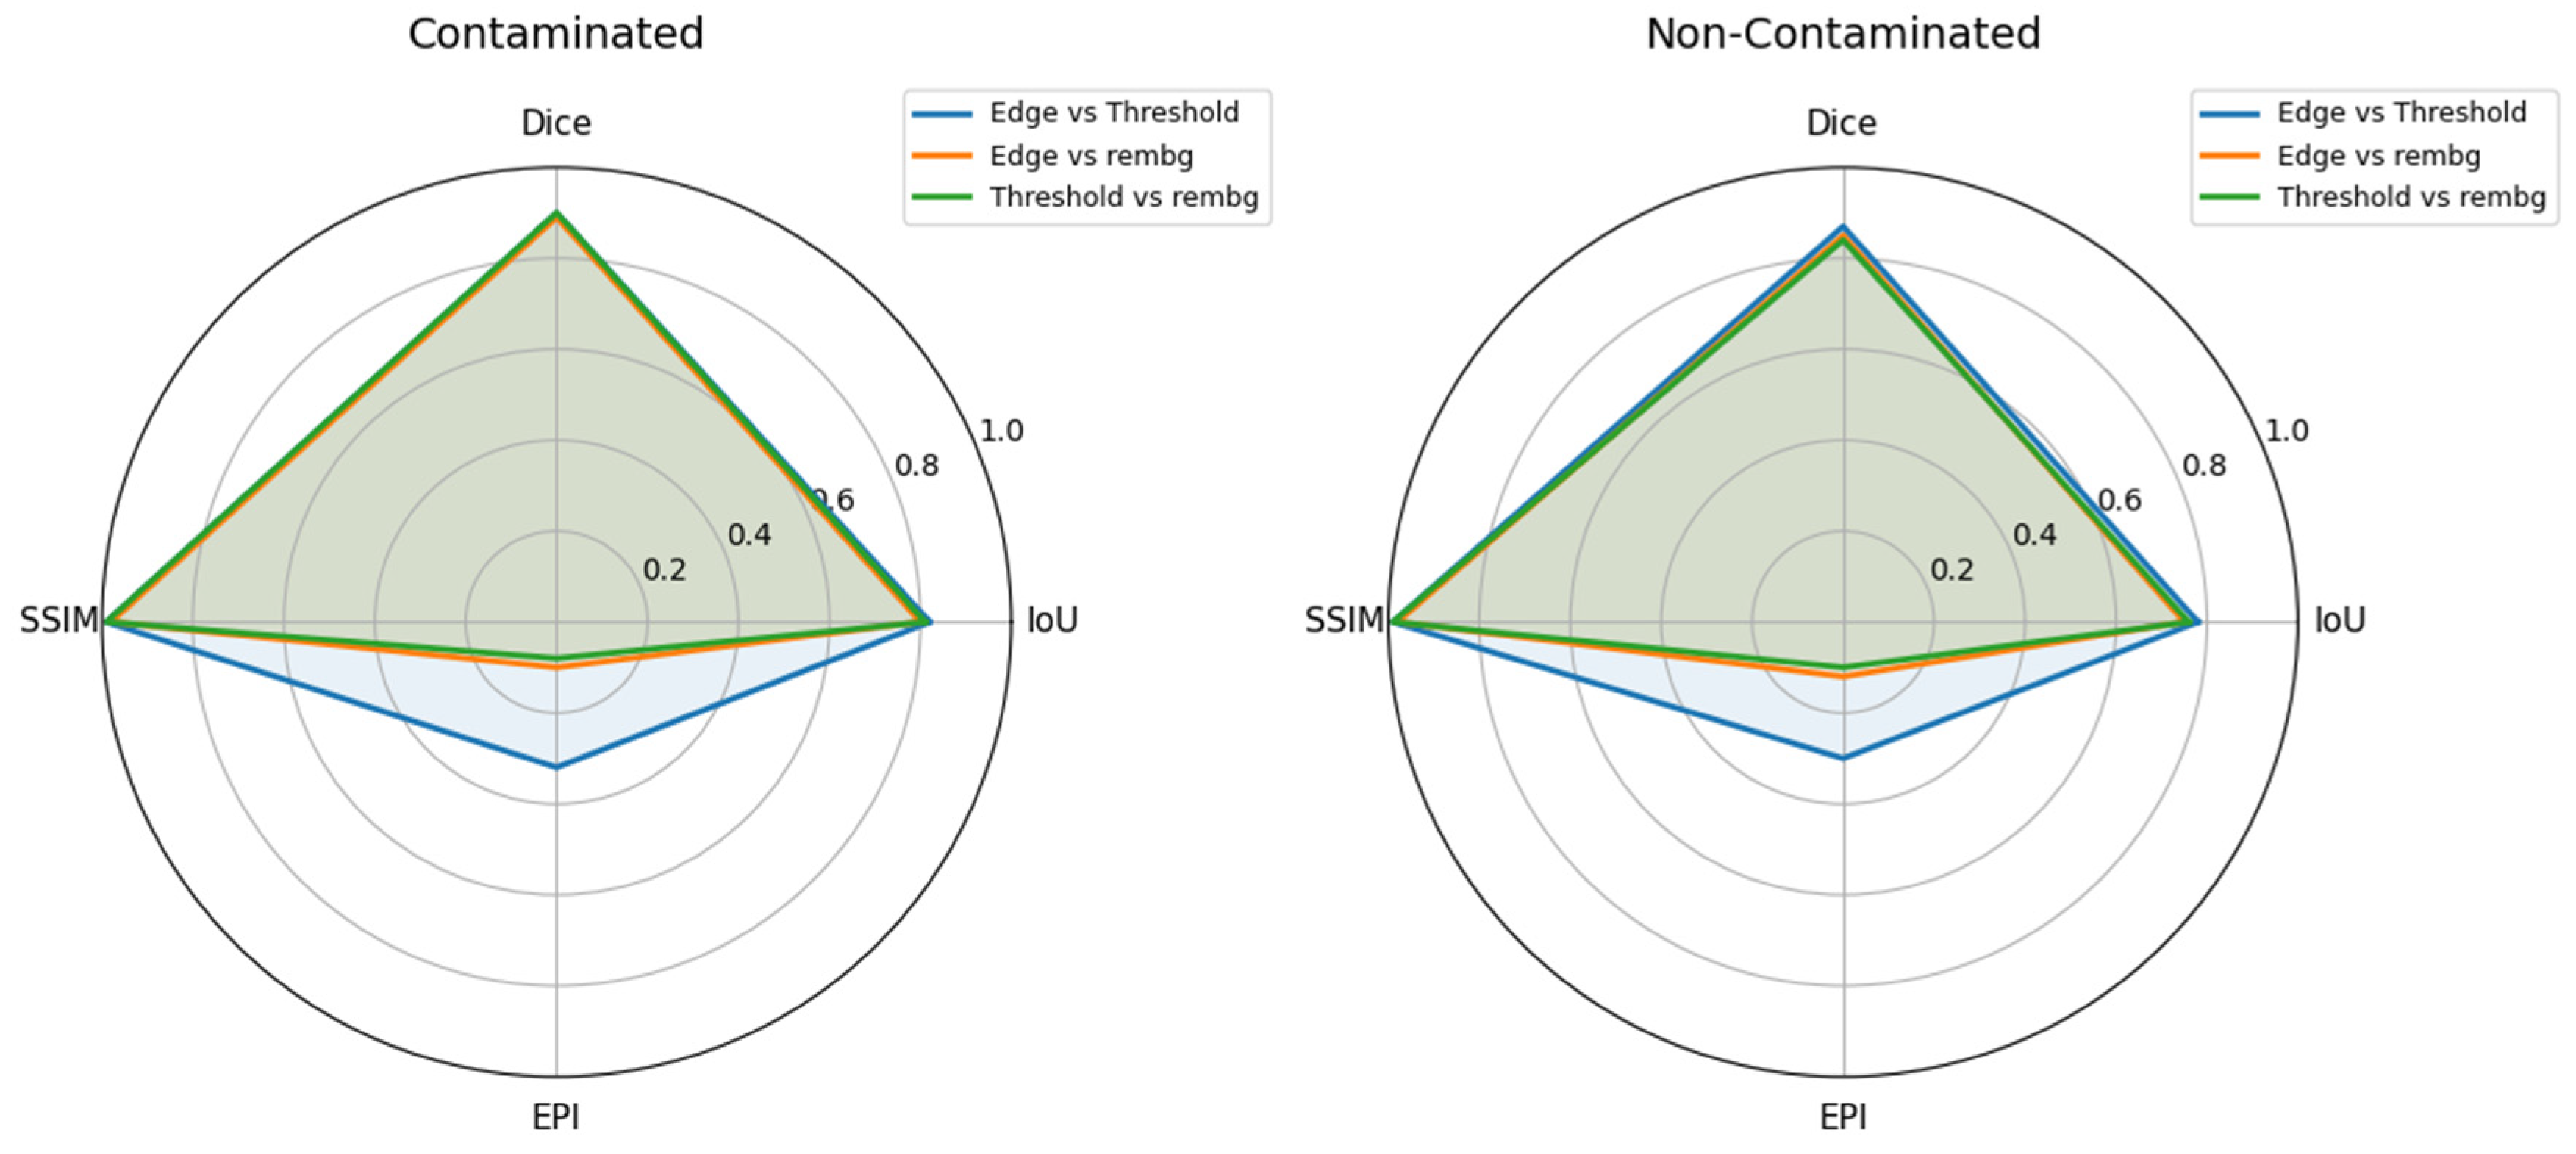
To further investigate segmentation consistency across methods, radar plots summarizing the principal evaluation metrics were generated for contaminated and non-contaminated conditions, as illustrated in Figure 2.
Figure 2.
Radar plots of segmentation performance metrics for pairwise comparisons between segmentation pipelines in contaminated (left) and non-contaminated (right) images. Edge = edge-based segmentation pipeline; Threshold = threshold-based segmentation pipeline; rembg = deep learning-based background removal approach. Metrics include Intersection over Union (IoU), Dice coefficient, Structural Similarity Index (SSIM), and Edge Preservation Index (EPI).
For contaminated images, IoU and Dice metrics exhibited consistently high values across all pairwise comparisons, remaining predominantly within the approximate range of 0.80 to 0.90. Similarly, SSIM values remained close to 1.0, indicating high structural similarity between segmentation outputs. However, EPI values remained substantially lower, typically varying between approximately 0.10 and 0.35. This discrepancy demonstrates that high overlap agreement does not necessarily correspond to equivalent boundary representation among segmentation pipelines. In other words, segmentation methods may produce similar object regions while simultaneously exhibiting important differences in contour localization and edge continuity.
A similar pattern was observed for non-contaminated samples. IoU values remained predominantly between approximately 0.75 and 0.85, while Dice coefficients remained close to 0.85–0.90. Structural similarity values again remained close to 1.0, whereas EPI values continued to present reduced magnitudes, generally varying between 0.10 and 0.30. Although differences between pairwise comparisons were slightly less pronounced than those observed in contaminated conditions, lower edge agreement was again predominantly associated with comparisons involving the rembg pipeline.
Overall, the radar plots indicate that overlap-based metrics alone are insufficient to fully characterize segmentation behavior under industrial acquisition conditions. While region-based metrics suggest high agreement between methods, edge-sensitive analyses reveal substantial variability in contour representation and structural consistency.
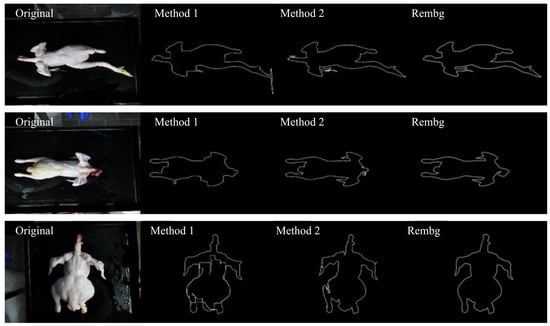
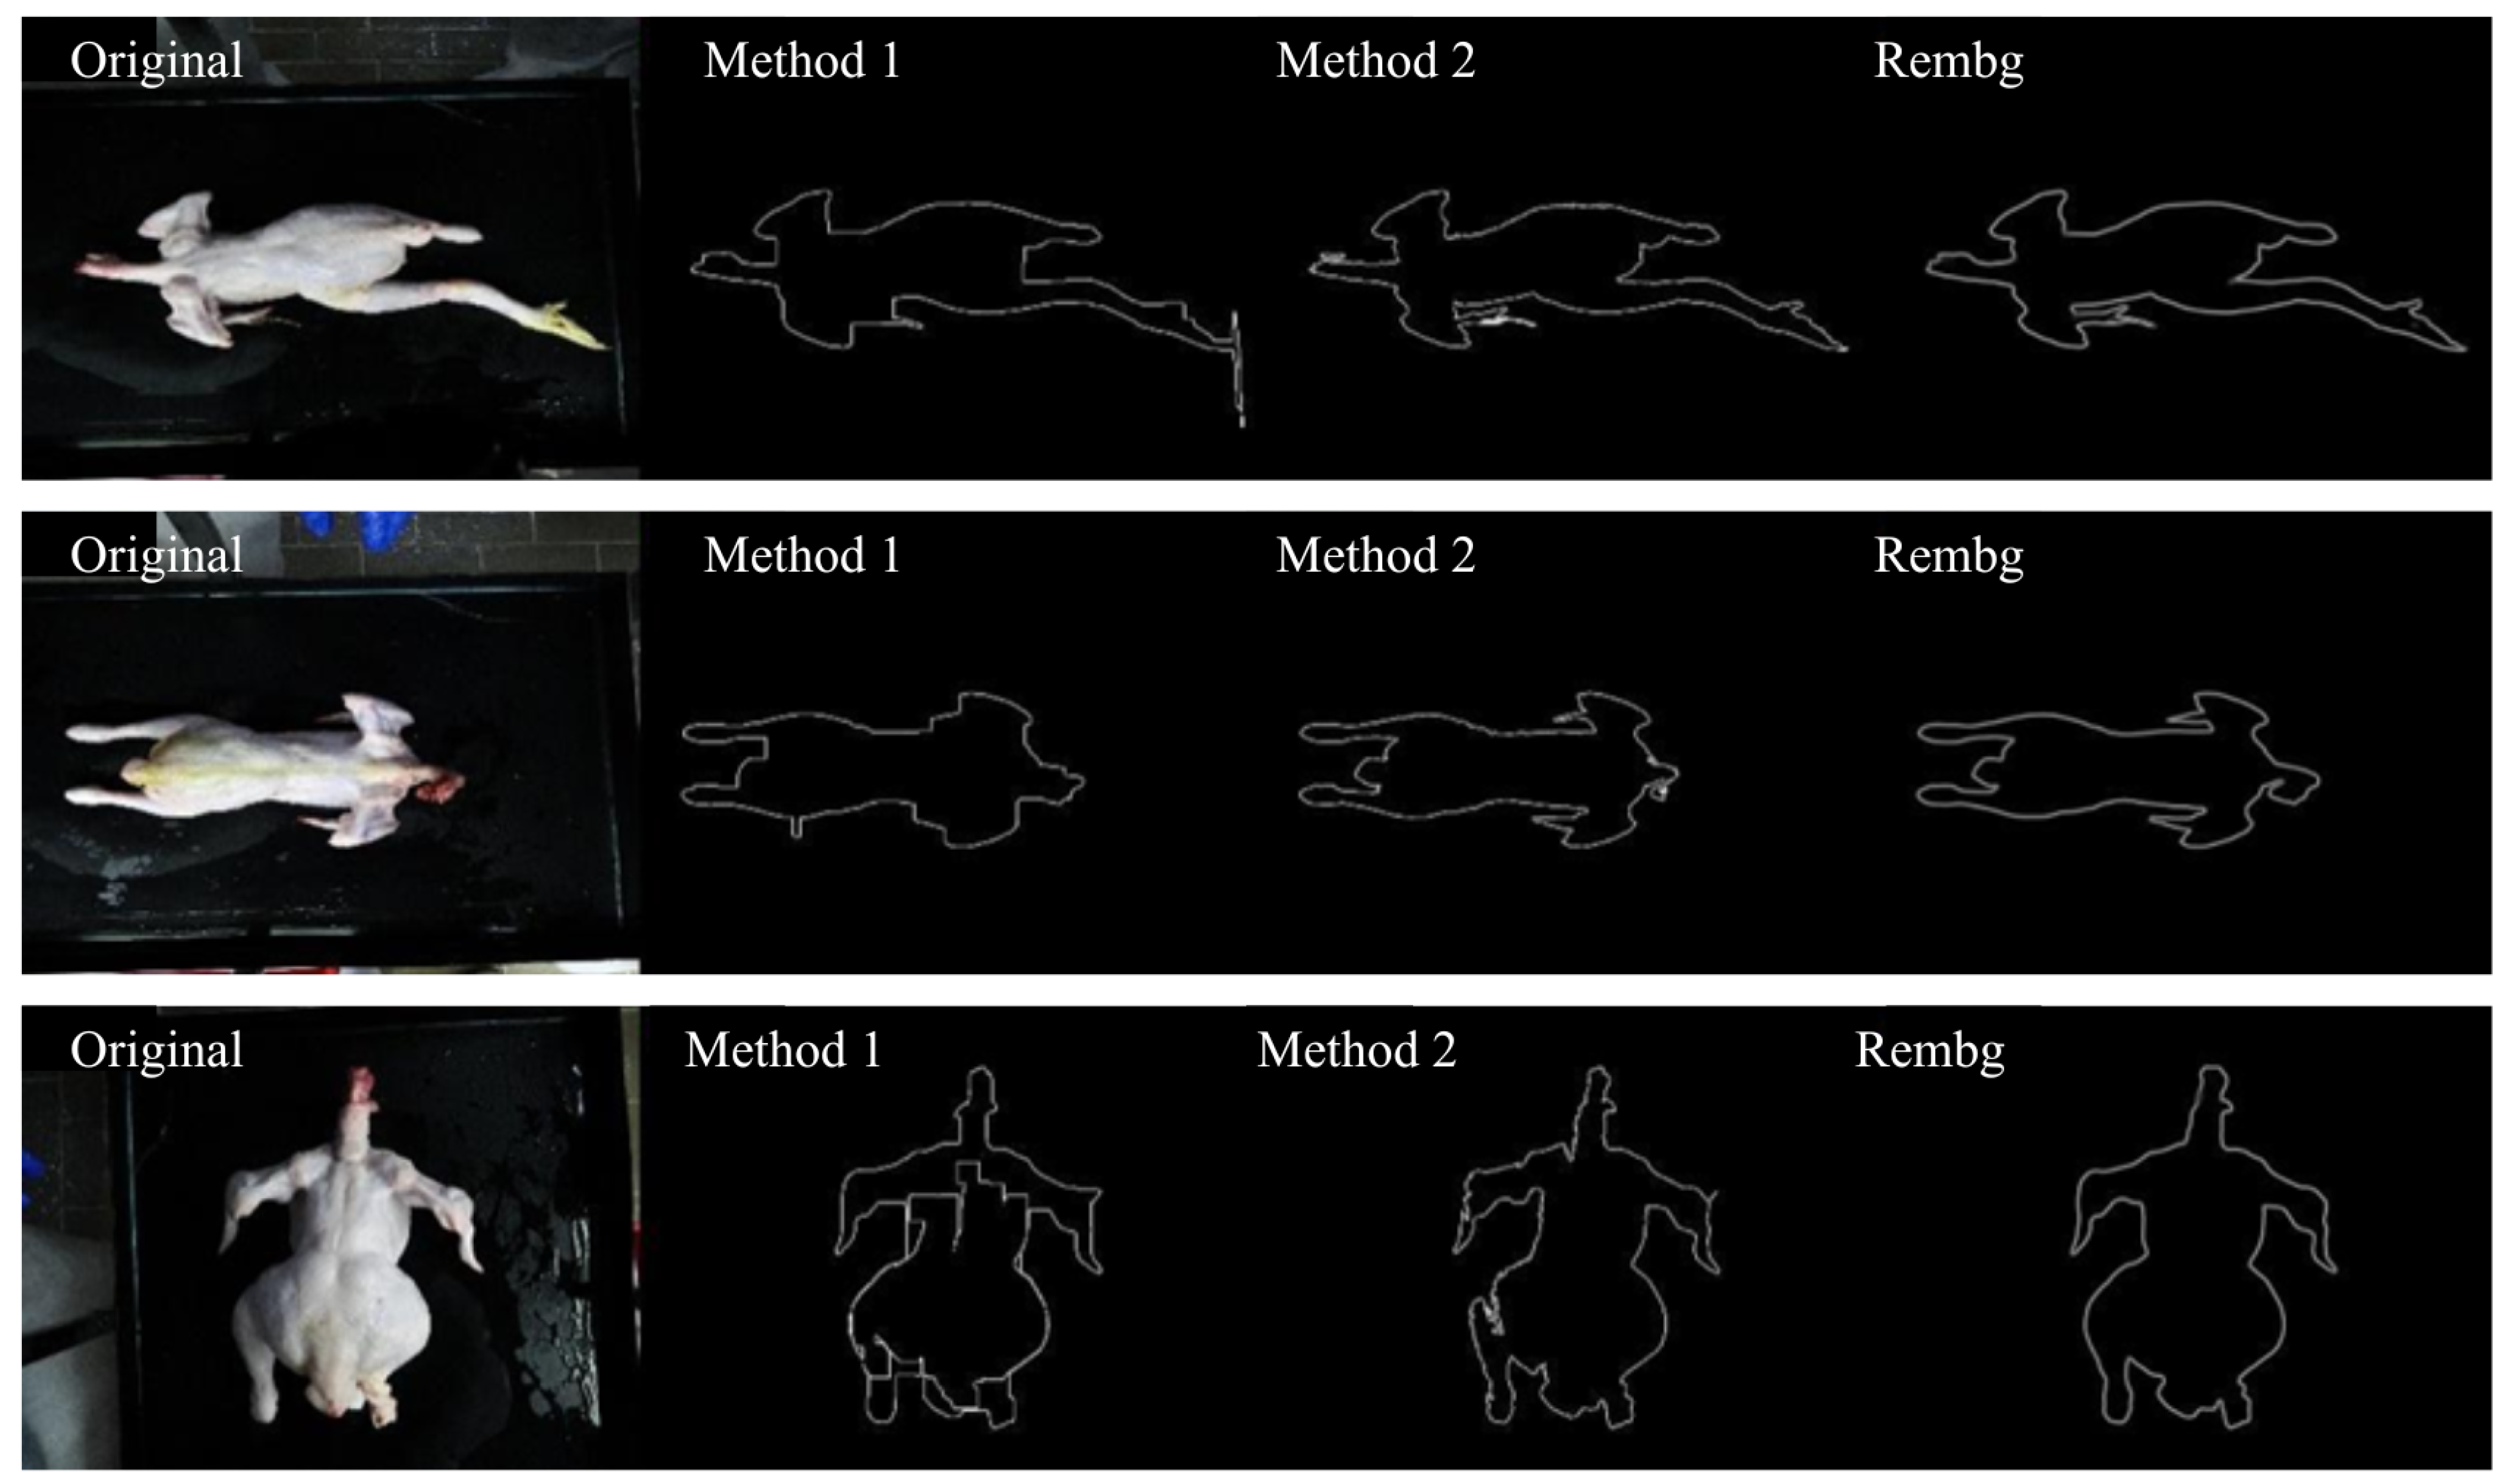
To complement the quantitative analyses, qualitative edge visualizations were generated using Sobel operators applied to the binary masks produced by each segmentation pipeline. Representative examples are presented in Figure 3.
Figure 3.
Edge map comparison of segmentation methods. Each row shows the original image followed by the corresponding Sobel-based edge maps obtained from Method 1, Method 2, and rembg, illustrating differences in boundary delineation.
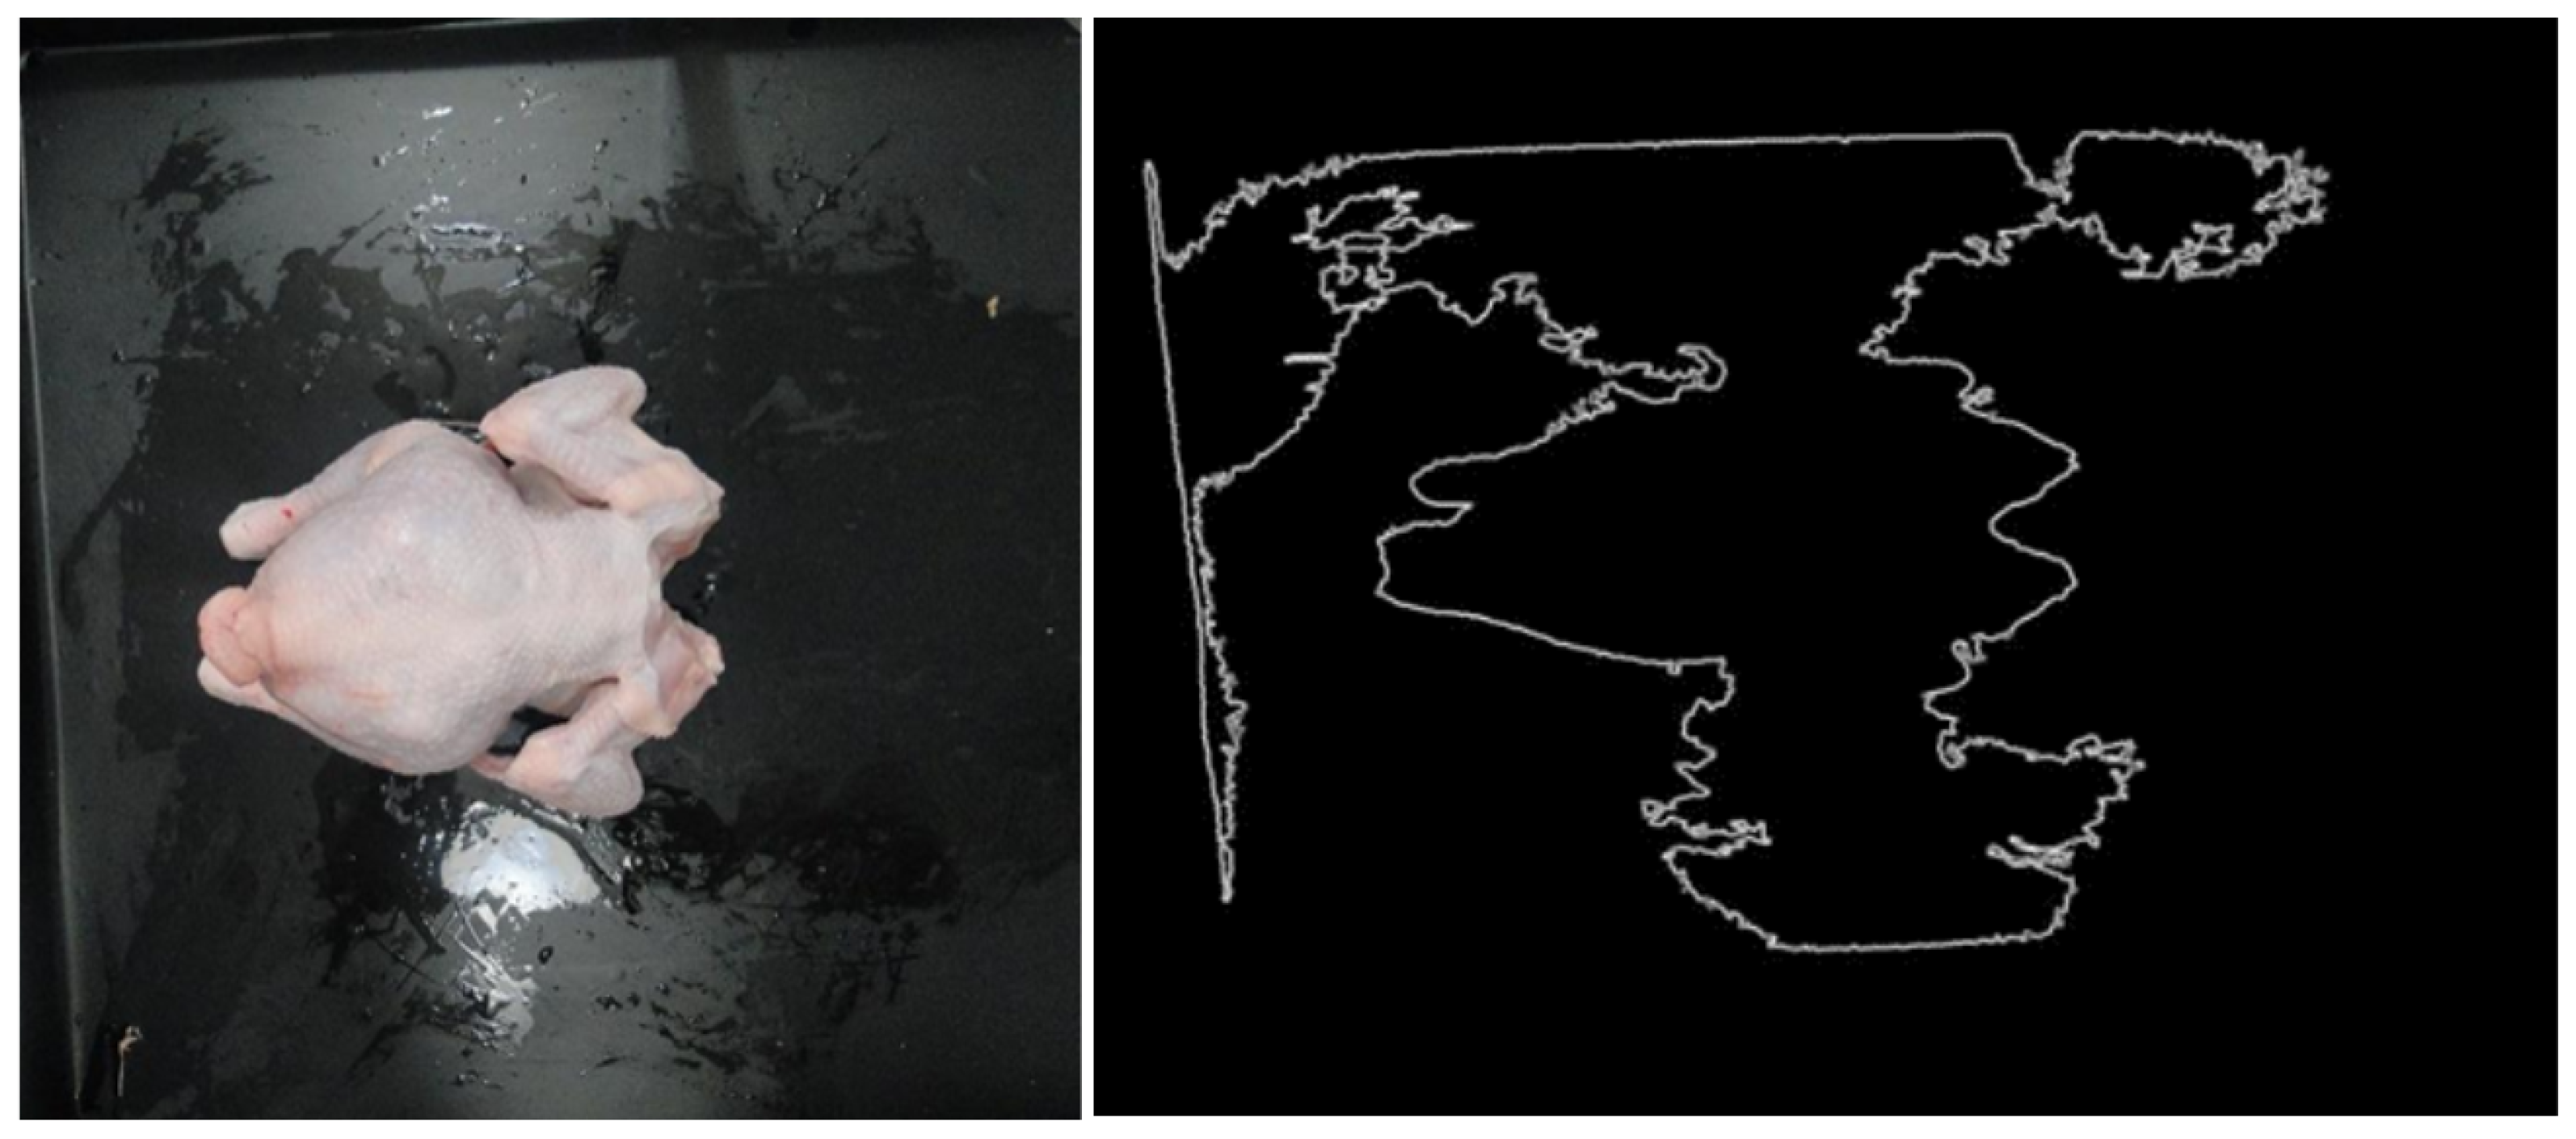
Visual inspection of the edge maps revealed substantial differences in contour organization between the evaluated methods. The edge-based pipeline frequently produced fragmented and irregular contours, particularly in regions affected by reflections and low local contrast. The threshold-based pipeline generated comparatively smoother boundaries, although localized inconsistencies and contour discontinuities remained observable under heterogeneous illumination conditions.
In contrast, the rembg-based approach generated more continuous and structurally coherent contour representations across both contaminated and non-contaminated samples. This behavior indicates that the deep learning-based pipeline adopted a substantially different strategy for foreground extraction and boundary representation compared to the classical segmentation approaches.
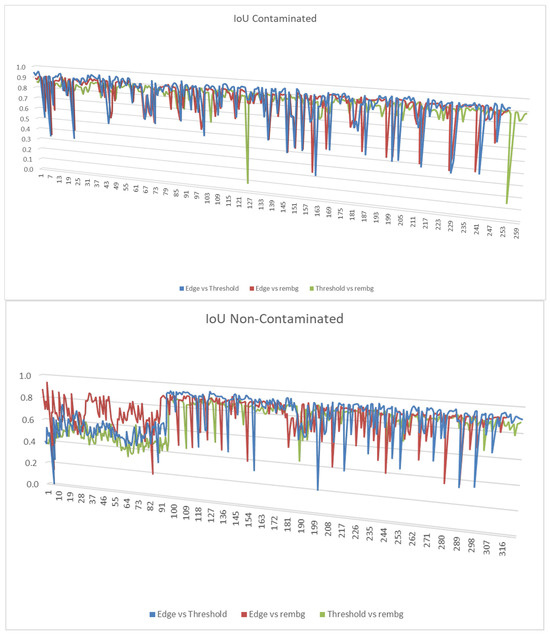
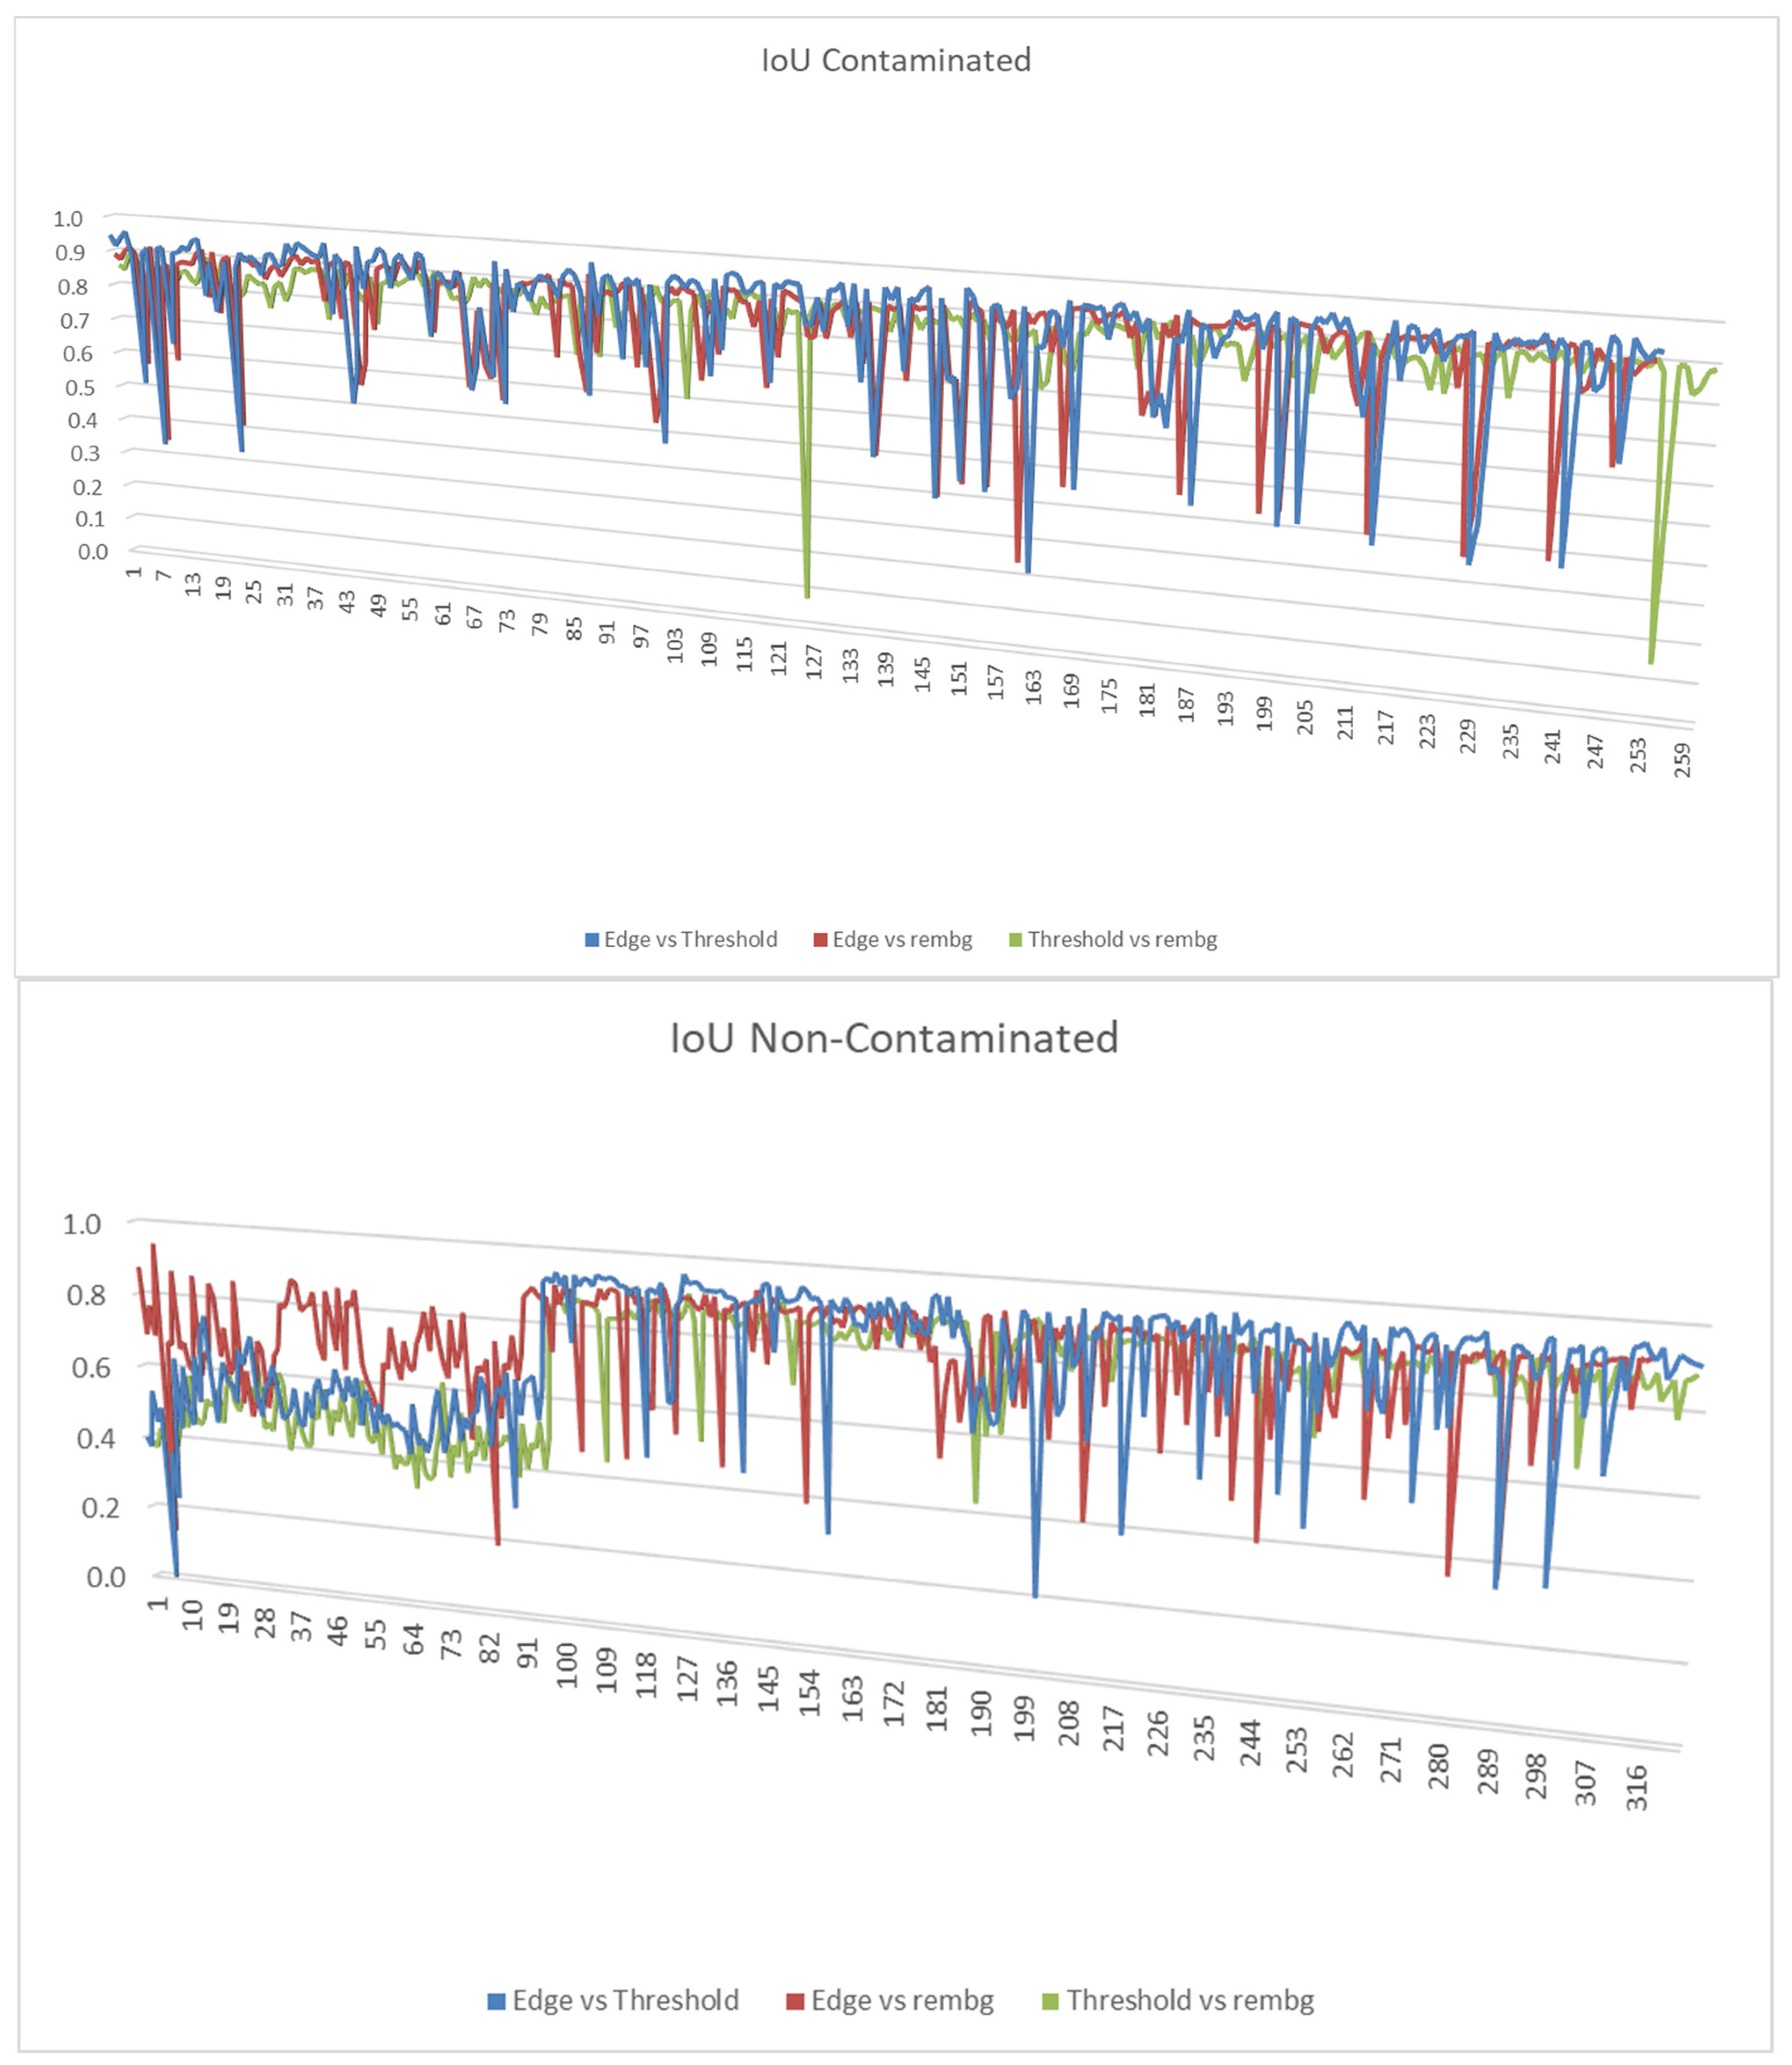
The variability in segmentation agreement across individual samples was further investigated through image-wise analysis of the Intersection over Union metric, as illustrated in Figure 4.
Figure 4.
Curves of the Intersection over Union metric per image, highlighting the variability of pairwise comparisons between the segmentation methods.
For contaminated samples, IoU values remained predominantly concentrated between approximately 0.60 and 0.85 across most images, with higher agreement levels observed in the initial portion of the dataset. However, localized reductions in IoU were observed throughout the acquisition sequence, with some samples presenting values approaching zero. These abrupt reductions indicate isolated cases in which segmentation pipelines generated substantially different structural representations of the carcasses.
For non-contaminated samples, greater variability was observed throughout the dataset, particularly in the initial acquisition regions, where IoU values ranged approximately from 0.40 to 0.85. Although intermediate portions of the dataset presented more concentrated agreement values, localized fluctuations remained observable across the acquisition sequence.
The observed variability demonstrates that segmentation agreement is highly dependent on acquisition conditions and image-specific characteristics. Factors such as reflections, carcass positioning variability, local illumination changes, and surface moisture contributed to inconsistent segmentation behavior across individual samples, particularly in comparisons involving the deep learning-based pipeline. The observed variability was primarily associated with the industrial acquisition conditions and was not substantially influenced by the contamination status of the carcasses.
Overall, the results indicate that the evaluated segmentation pipelines generate distinct structural representations of the same objects, even when overlap-based metrics suggest apparently satisfactory agreement. These differences become particularly evident in edge-sensitive analyses and qualitative visualizations, reinforcing the importance of combining complementary evaluation strategies when analyzing segmentation behavior under industrial acquisition conditions.
4. Discussion
The results obtained in this study demonstrate that the behavior of image segmentation pipelines under industrial poultry inspection conditions cannot be fully characterized using overlap-based metrics alone. Although the evaluated methods frequently exhibited high agreement in terms of region overlap, substantial differences emerged regarding contour continuity, edge localization, structural consistency, and computational feasibility. These findings reinforce the importance of analyzing segmentation pipelines not only from the perspective of spatial agreement, but also considering their operational behavior and potential influence on downstream artificial intelligence applications.
Industrial acquisition conditions played a fundamental role in the variability observed throughout the segmentation process. Unlike controlled laboratory environments, poultry slaughterhouses present substantial visual complexity associated with non-uniform illumination, reflections caused by surface moisture, heterogeneous backgrounds, carcass positioning variability, and operational constraints related to high-throughput processing lines. These factors directly affect image quality and interfere with the stability of preprocessing and segmentation operations.
Additionally, operational requirements associated with hygienization procedures introduced further variability into the acquisition process. Continuous cleaning of the acquisition surface generated reflective regions and residual water artifacts that altered local intensity distributions and interfered with contour definition. Simultaneously, infrastructure limitations restricted the use of auxiliary illumination systems in humid industrial environments due to electrical safety concerns. Together, these factors produced a highly heterogeneous acquisition scenario representative of real industrial operating conditions.
4.1. Structural Behavior of the Classical Segmentation Pipelines
The edge-based segmentation pipeline demonstrated satisfactory performance regarding global object localization, as indicated by the relatively high IoU and Dice values observed across pairwise comparisons. These results suggest that the Canny-based approach was capable of identifying the general spatial extent of the carcass regions under most acquisition conditions. However, edge-sensitive analyses revealed important limitations associated with contour stability and boundary continuity.
The low and highly variable EPI values indicate that the edge-based pipeline frequently produced inconsistent contour representations, particularly in transition regions between object and background. In the present study, this behavior suggests that Gaussian smoothing and gradient-based edge detection were insufficient to preserve contour continuity under the heterogeneous acquisition conditions encountered in commercial slaughterhouses. Similar observations were reported by Sung and Lee [22], who showed that Gaussian smoothing reduces high-frequency noise but also attenuates gradient magnitude and partially suppresses fine boundary information, particularly under low-contrast conditions.
This effect became particularly evident under industrial acquisition conditions involving reflections and surface moisture. Variations in local intensity distributions introduced spurious edge responses and contour fragmentation, requiring morphological reconstruction procedures to reconnect discontinuous structures. This suggests that morphological reconstruction alone cannot compensate for the intensity variability introduced during image acquisition, particularly when reflections and moisture interfere with edge definition.
These findings agree with previous studies reporting that classical edge-based and threshold-based segmentation methods are highly affected by non-uniform illumination and local intensity variations [23,24]. In the present study, these effects were intensified by reflections and moisture commonly observed in poultry slaughterhouses, resulting in fragmented contours even after morphological reconstruction.
Similarly, the threshold-based segmentation pipeline exhibited satisfactory global overlap agreement while presenting limitations regarding boundary consistency. The relatively low computational complexity associated with global thresholding represents an important advantage for industrial applications requiring real-time operation. However, in the present study this sensitivity became more evident under industrial acquisition conditions, where reflections and heterogeneous illumination increased the overlap between foreground and background intensity distributions, making the selection of a single global threshold insufficient for consistent carcass extraction.
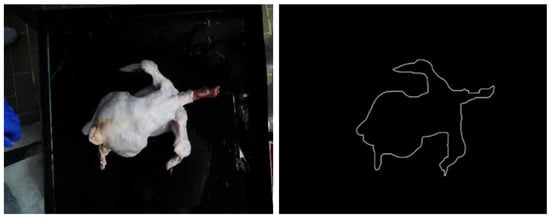
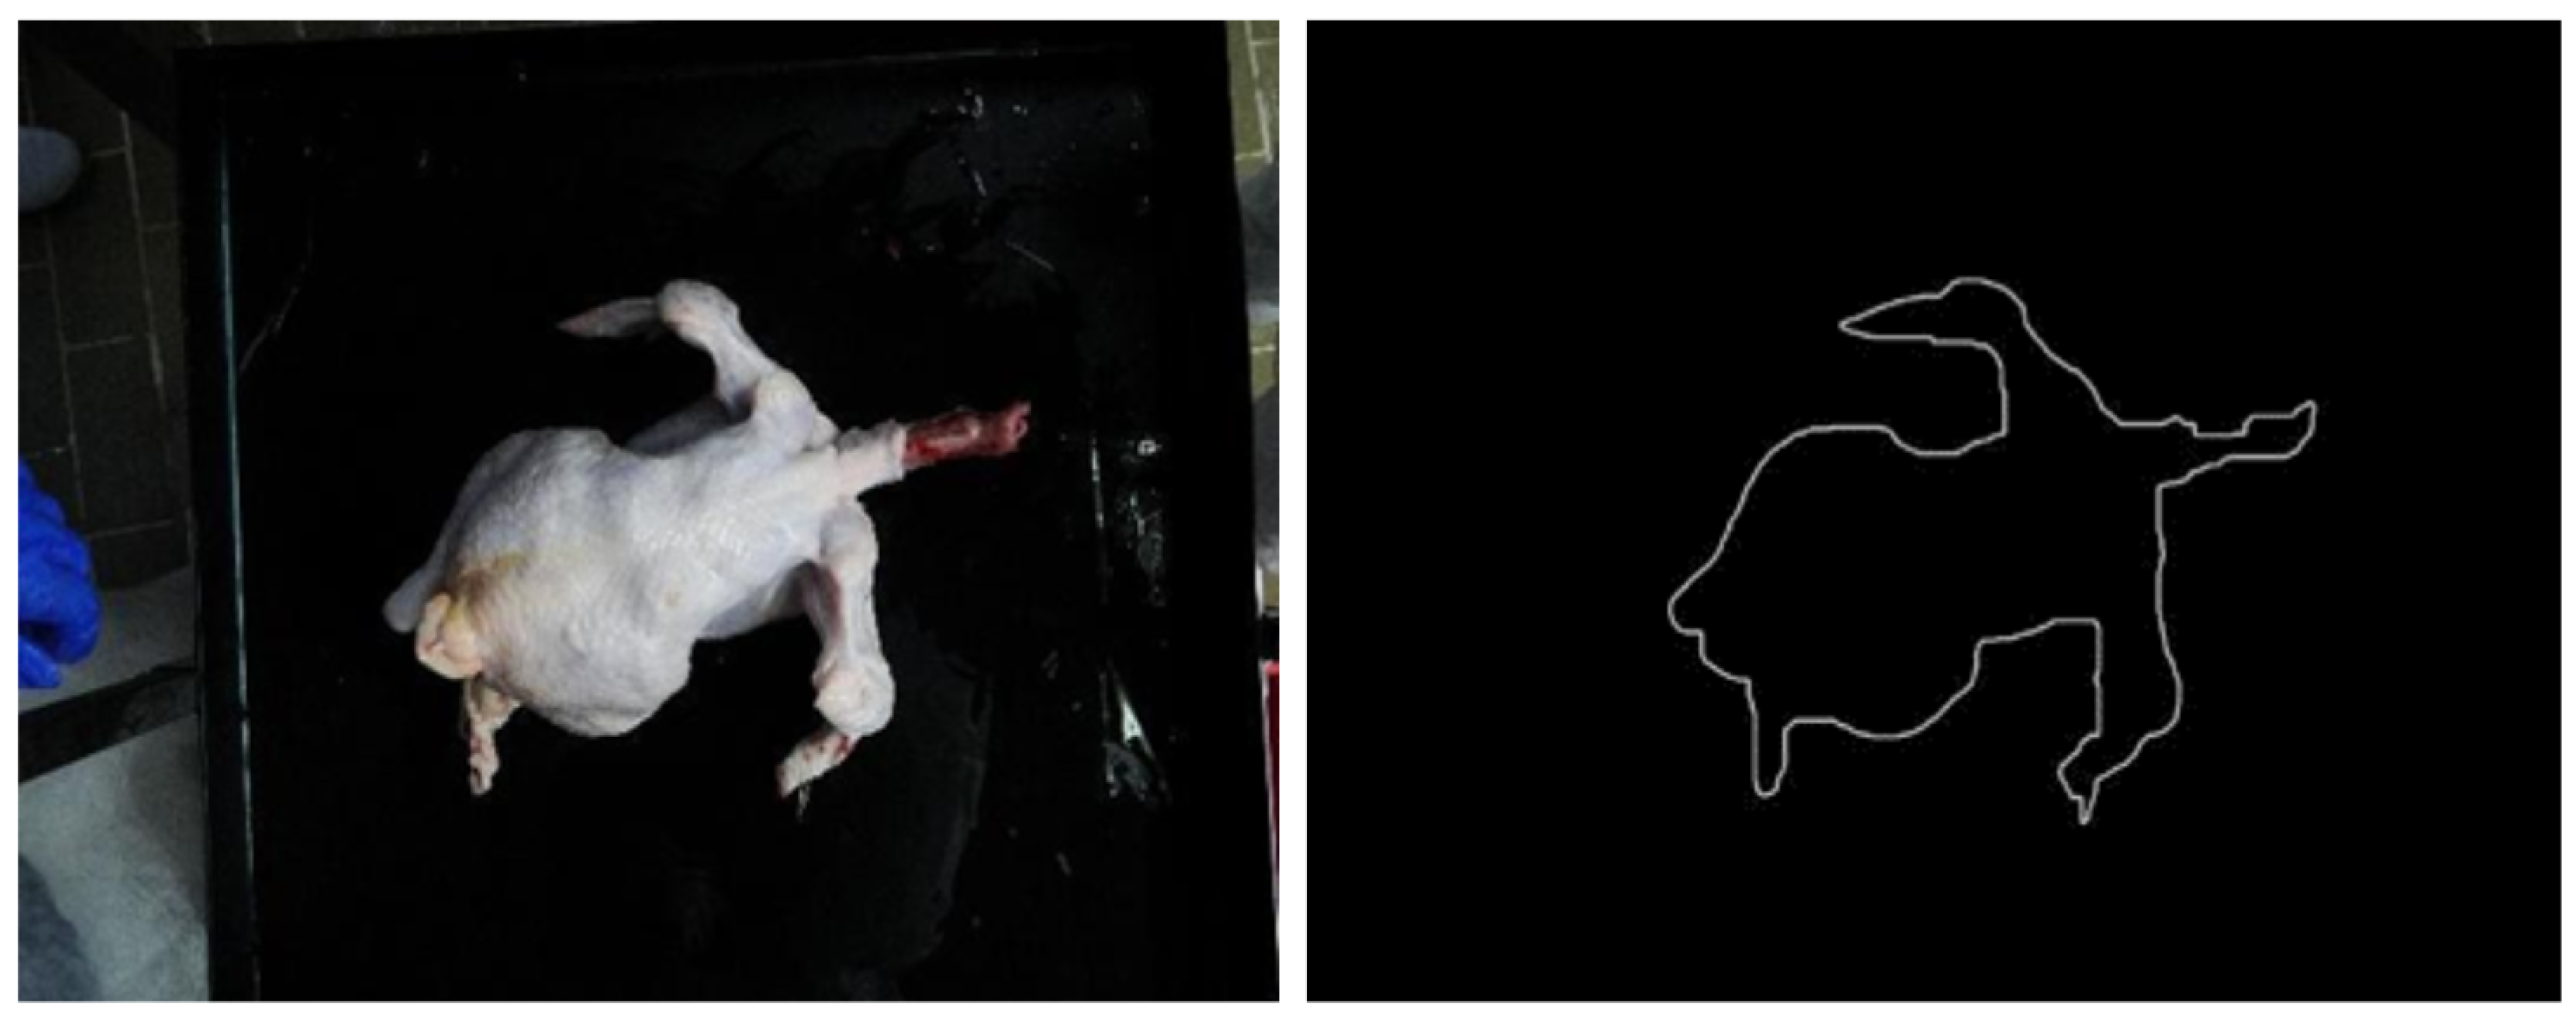
The observed behavior of the threshold-based pipeline under heterogeneous acquisition conditions, Figure 5, reflects the intrinsic limitations of global thresholding techniques. Under conditions involving reflections, non-uniform illumination, and overlapping intensity distributions, variations in pixel intensity compromise the definition of a single global threshold, resulting in inconsistent region extraction and reduced boundary consistency. Similar limitations of global thresholding methods have been reported under non-uniform illumination, where variations in lighting and overlapping intensity distributions frequently compromise object delineation and segmentation accuracy [25,26].
Figure 5.
Failure cases of threshold-based segmentation under low contrast and illumination variability.
The failure cases presented in Figure 5 demonstrate that the main limitation of the threshold-based pipeline was not the identification of the carcass itself, but the preservation of anatomically coherent boundaries under heterogeneous illumination conditions.
The low FDR values quantitatively support the visual observations presented in Figure 5, indicating that foreground and background became less distinguishable under industrial acquisition conditions. Similar reductions in thresholding performance have been reported under non-uniform illumination [27,28], although the effects observed here were further aggravated by moisture-related reflections and heterogeneous industrial backgrounds.
Importantly, both classical pipelines demonstrated that overlap-based metrics may overestimate segmentation quality in scenarios involving large homogeneous regions. Because IoU and Dice primarily evaluate spatial overlap, segmentation masks presenting substantially different contour definitions may still produce relatively high agreement values when the central object regions remain similar. This phenomenon explains the discrepancy observed between overlap-based metrics and edge-sensitive analyses throughout the present study.
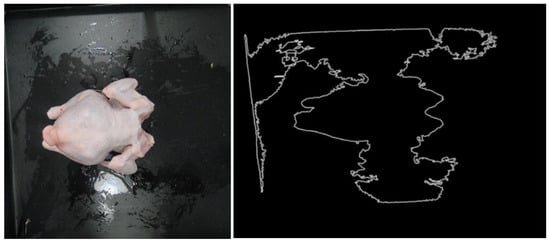
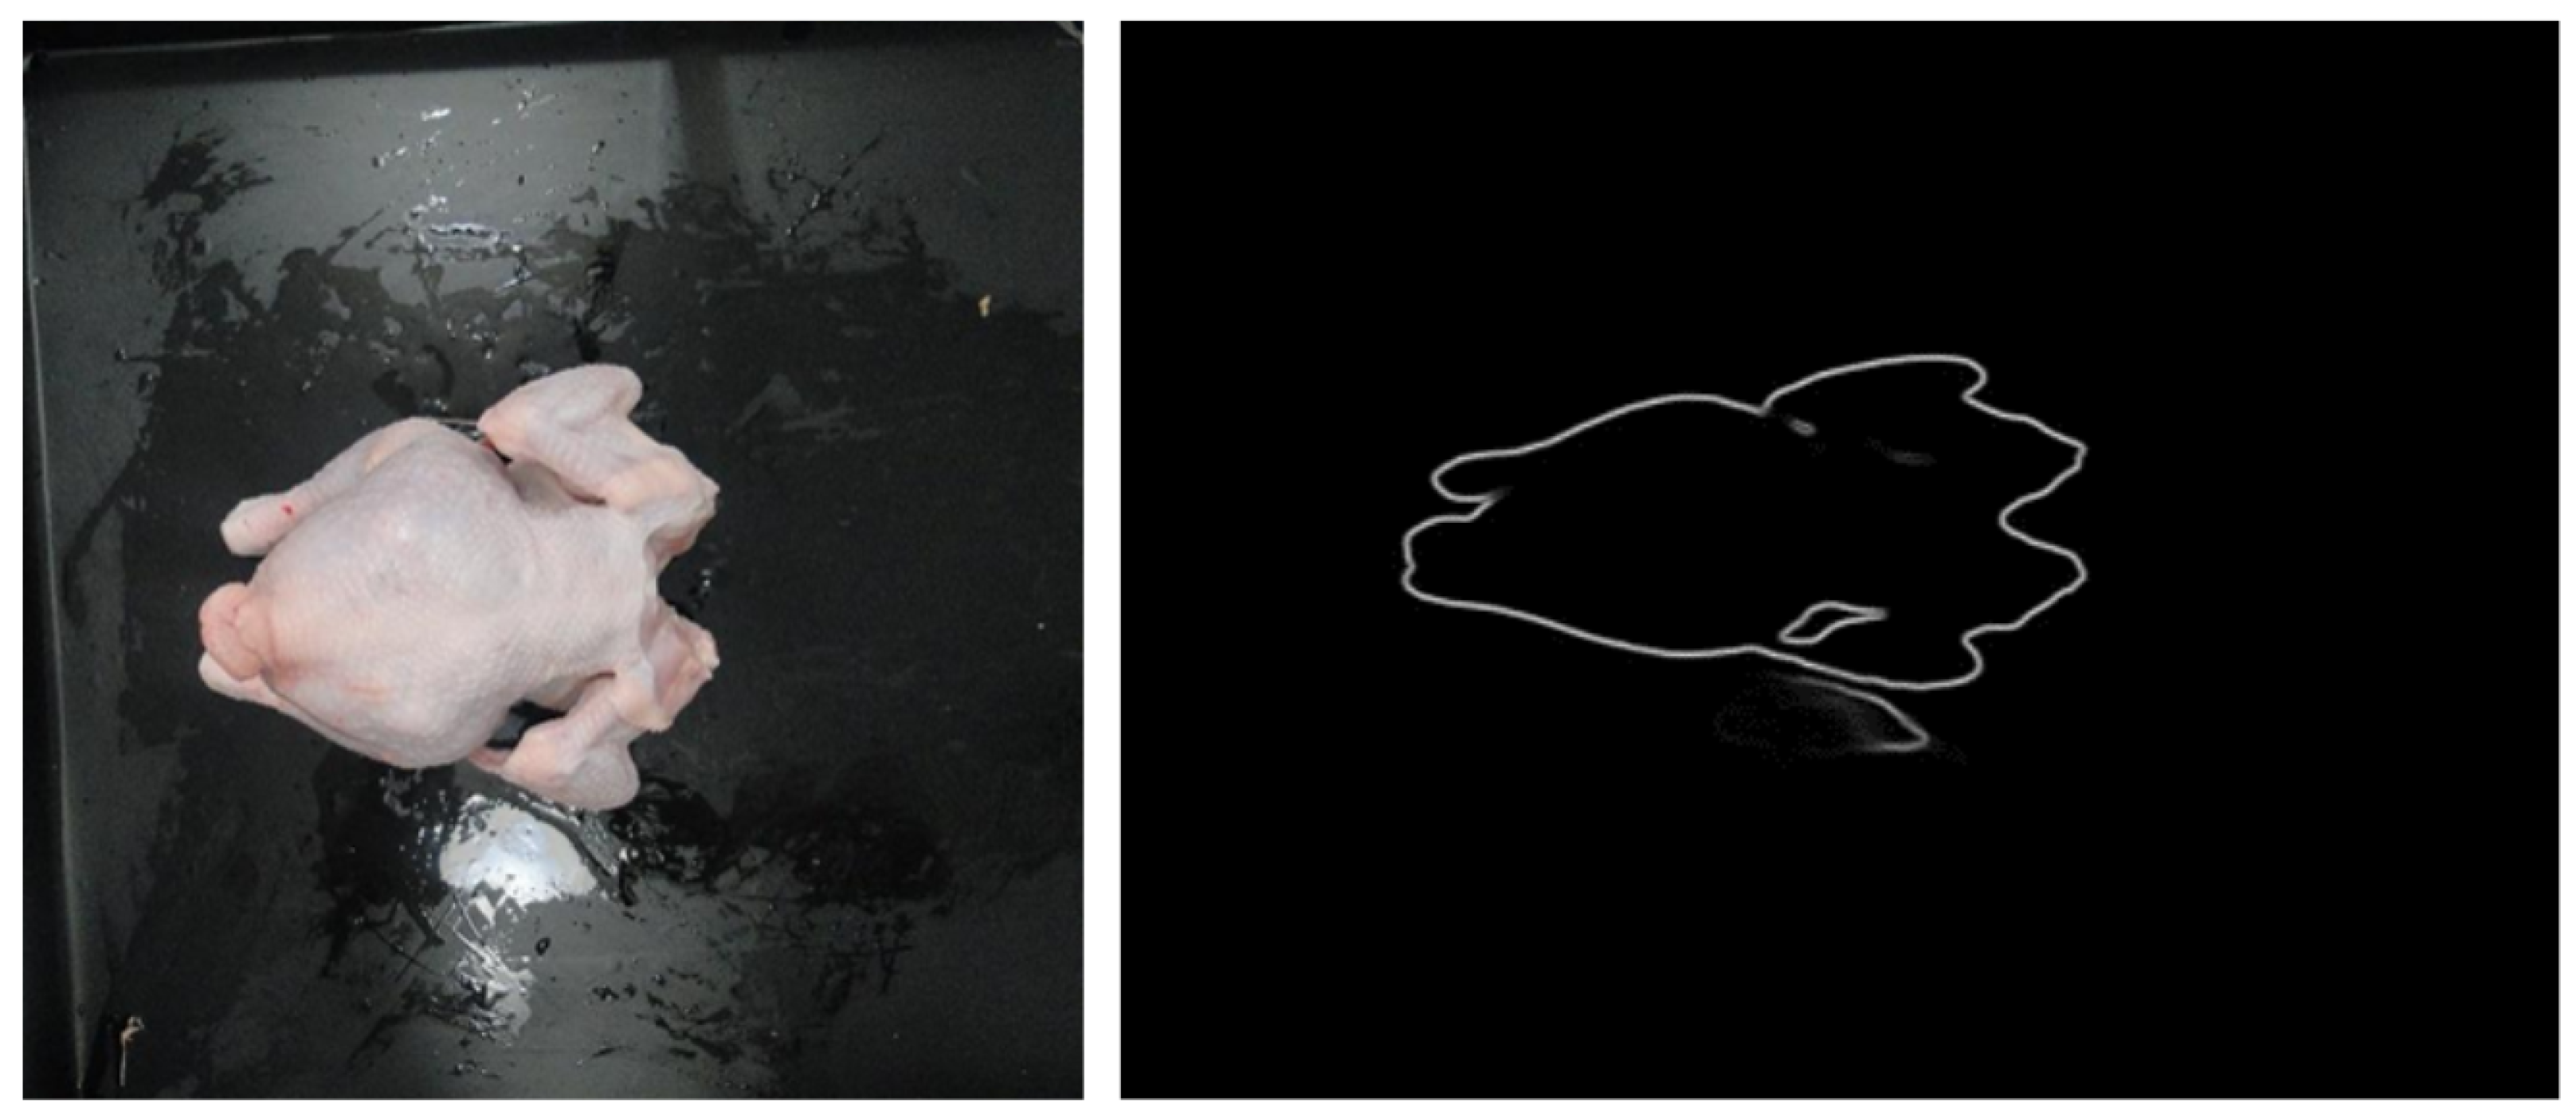
The limitations associated with contour continuity became particularly evident in regions affected by reflections and low local contrast. Figure 6 illustrates representative failure cases observed in the edge-based segmentation pipeline, where fragmented contours and discontinuous boundaries were generated under industrial acquisition conditions involving moisture-related reflections and heterogeneous illumination patterns.
Figure 6.
Example of edge-based segmentation showing fragmented contours and boundary inconsistencies under industrial acquisition conditions.
Together, the qualitative observations and quantitative metrics indicate that gradient-based segmentation is strongly influenced by the acquisition conditions adopted in this study. This finding highlights the importance of considering industrial environmental variability when selecting segmentation strategies for poultry inspection systems.
4.2. Structural Behavior of the Deep Learning-Based Pipeline
The rembg-based segmentation pipeline exhibited substantially different structural behavior compared to the classical approaches. Pairwise comparisons involving the deep learning-based method presented greater variability in FDR, OE, and EPI metrics, indicating that the generated segmentation masks followed a distinct contour representation strategy.
The distinct structural behavior observed for the rembg pipeline is likely related to its ability to exploit contextual and hierarchical image information rather than relying exclusively on local intensity distributions or gradient magnitude. In the present study, this characteristic allowed the segmentation model to maintain more coherent contour representations even under heterogeneous acquisition conditions. Unlike classical segmentation methods primarily based on intensity distributions or local gradients, deep learning approaches perform foreground extraction using hierarchical feature representations learned from large-scale datasets, enabling greater robustness to heterogeneous visual conditions and complex object-background relationships [14].
Qualitative analyses revealed that the rembg pipeline generated more continuous and visually coherent contour structures across both contaminated and non-contaminated samples. Even under reflections, heterogeneous backgrounds, and illumination variability, the deep learning-based approach maintained more stable boundary organization than the classical methods. This behavior is likely associated with the contextual information exploited by deep learning models, which reduces the dependence on local intensity variations. Similar behavior has been reported in poultry and food inspection studies, where deep learning-based segmentation methods achieved improved boundary delineation under challenging acquisition conditions [29,30].
Importantly, the lower agreement observed between rembg and the classical pipelines should not necessarily be interpreted as reduced segmentation quality. Instead, these differences indicate that the evaluated methods generated distinct structural representations of the same objects. The discordance maps and edge visualizations demonstrated that disagreements were concentrated predominantly along contour regions, whereas central object regions remained relatively consistent across methods.
The differences observed in contour representation have practical implications beyond the segmentation stage. This observation is particularly relevant for downstream artificial intelligence applications. Variations in contour organization, edge continuity, and background suppression may directly influence feature extraction procedures commonly employed in machine learning and deep learning pipelines. Morphological descriptors, spectral distributions, texture features, and convolutional representations are all sensitive to segmentation quality and structural consistency. Consequently, segmentation pipelines producing apparently similar overlap metrics may still generate substantially different inputs for subsequent classification stages.
Nevertheless, the improved structural consistency achieved by the rembg approach was associated with substantially longer processing times. Average inference times exceeding 2 s per image remain incompatible with direct deployment in high-speed industrial poultry processing lines without hardware acceleration or inference optimization strategies. Commercial poultry slaughterhouses typically process more than 100 carcasses per minute, requiring segmentation pipelines capable of maintaining low-latency operation under continuous processing conditions. In the present study, the rembg pipeline increased processing time by approximately 250-fold compared with the classical approaches (2.5 s versus 0.01 s per image), highlighting the practical trade-off between segmentation quality and computational efficiency in high-throughput industrial environments.
This trade-off between computational efficiency and segmentation consistency represents one of the central findings of the present study. While classical approaches offer reduced computational demand and compatibility with real-time industrial operation, deep learning-based methods provide improved structural consistency at the expense of substantially increased computational complexity. These findings are in agreement with recent studies on poultry and agricultural computer vision systems [31,32], which also reported that improvements in segmentation quality are frequently accompanied by increased computational demand. Similar to the present study, these works highlight that the choice of the segmentation strategy depends on the operational requirements of the intended application.
From a practical perspective, the three segmentation pipelines present different computational cost–benefit characteristics for industrial implementation. The edge-based and threshold-based methods processed images in approximately 0.01 s per image, requiring relatively low computational resources and making them suitable for real-time applications. In contrast, the deep learning-based pipeline required approximately 2.5 s per image, representing a substantially higher computational demand. Although this approach produced more coherent contour representations and improved foreground extraction under challenging industrial conditions, its deployment in high-throughput slaughterhouses may require more powerful hardware or inference optimization. Therefore, rather than selecting a universally superior segmentation strategy, the results suggest that the most appropriate pipeline depends on whether computational efficiency or contour representation is prioritized in the target application.
The improved contour organization achieved by the deep learning-based approach can be visually observed in Figure 7. Compared to the classical pipelines, the rembg-based method generated smoother and more continuous boundary representations, particularly in anatomically complex regions and under conditions involving heterogeneous backgrounds and reflective surfaces.
Figure 7.
Visual comparison between segmentation methods, highlighting the improved boundary coherence achieved by the deep learning-based approach.
The visual improvements observed in Figure 7 reinforce the quantitative results, indicating that the deep learning-based pipeline preserved contour continuity more effectively than the classical methods under heterogeneous industrial conditions.
4.3. Implications for Industrial Computer Vision Systems
One of the most relevant findings of this study is that overlap-based metrics alone are insufficient to comprehensively characterize segmentation behavior under industrial acquisition conditions. In several pairwise comparisons, high IoU, Dice, and SSIM values coexisted with low EPI values and substantial contour variability, demonstrating that region agreement does not necessarily imply equivalent boundary representation. This observation reinforces recent recommendations that segmentation quality should be evaluated using complementary quantitative metrics rather than overlap measures alone, allowing a more comprehensive assessment of structural and boundary characteristics [19].
The differences in contour organization observed among the evaluated segmentation pipelines have important implications for industrial computer vision systems, particularly those employing artificial intelligence models for defect detection, contamination analysis, or carcass classification. Segmentation pipelines define the structural representation of the region of interest that will subsequently be processed by downstream analytical stages. Consequently, inconsistencies in contour organization and background suppression may propagate throughout the computational pipeline and directly affect classification performance and feature reliability.
The present study therefore demonstrates that preprocessing and segmentation are not merely preliminary stages preceding artificial intelligence models. The differences observed among the evaluated pipelines indicate that segmentation directly influences the structural representation of the object and, consequently, the quality of the information available for subsequent analytical stages.
Furthermore, the results demonstrate that segmentation evaluation frameworks should integrate complementary quantitative and qualitative analyses. In the present study, overlap-based metrics alone were insufficient to explain the structural differences identified through edge-sensitive measures, discordance maps, and visual inspection. This integrated evaluation strategy becomes particularly important under real industrial acquisition conditions, where visual variability and operational constraints introduce substantial complexity into computer vision applications.
Overall, the findings indicate that no single segmentation pipeline was optimal for all evaluation criteria. While the classical approaches provided lower computational cost and processing times compatible with real-time applications, the deep learning-based pipeline generated more coherent contour representations under heterogeneous industrial conditions. Therefore, segmentation strategies should be selected according to the specific requirements of the intended application, considering computational feasibility, contour representation, and compatibility with downstream analytical tasks.
5. Conclusions
This study investigated the structural and computational behavior of different image segmentation pipelines applied to broiler chicken carcass inspection under real industrial acquisition conditions. The results demonstrated that segmentation behavior cannot be adequately characterized using overlap-based metrics alone, since methods presenting high spatial agreement frequently produced substantially different contour representations and boundary organizations.
The classical segmentation pipelines based on edge detection and global thresholding exhibited low computational cost and processing times compatible with real-time industrial applications. However, both approaches demonstrated sensitivity to illumination variability, reflections, surface moisture, and heterogeneous backgrounds, leading to inconsistencies in contour continuity and boundary preservation under challenging acquisition conditions.
In contrast, the deep learning-based segmentation pipeline generated more continuous and structurally coherent contour representations, demonstrating improved boundary consistency and foreground extraction under adverse industrial scenarios. Nevertheless, this improved structural behavior was associated with substantially higher computational demand, which may limit direct deployment in high-throughput industrial environments without optimization strategies or hardware acceleration.
The combined analysis of overlap-based metrics, edge-sensitive measures, discordance maps, computational performance, and qualitative visual inspection demonstrated that different segmentation pipelines generate distinct structural representations of the same object. These differences are particularly relevant because segmentation quality directly influences the consistency of regions subsequently used in feature extraction, pattern recognition, and downstream artificial intelligence applications.
The results also indicated that the observed segmentation behavior was primarily influenced by the industrial acquisition conditions, regardless of the contamination status of the carcasses. This finding suggests that illumination variability, reflections, and background heterogeneity had a greater impact on segmentation performance than the presence of visible contamination.
Therefore, the findings of this study reinforce that preprocessing and segmentation should not be interpreted merely as preliminary stages preceding classification models, but rather as fundamental components that directly affect the reliability and operational feasibility of automated inspection systems.
This study has some limitations. The segmentation pipelines were evaluated through pairwise comparisons without manually annotated reference masks, which prevented the assessment of absolute segmentation accuracy. In addition, only three segmentation pipelines representing classical and deep learning-based approaches were evaluated. Future studies should include manually annotated ground truth data and additional segmentation methods to further investigate segmentation behavior under industrial poultry inspection conditions.
Overall, the proposed evaluation framework contributes to the development of more reliable computer vision systems for poultry inspection by integrating structural, computational, and qualitative analyses under real industrial acquisition conditions. The results also provide important insights regarding the trade-offs between computational efficiency, contour consistency, and industrial applicability when selecting segmentation pipelines for intelligent inspection systems operating in poultry processing environments.
Author Contributions
Conceptualization: J.R.R. and M.M.B.; methodology: L.E.T.P. and A.R.B.T.; validation: J.R.R. and M.M.B.; formal analysis: J.R.R., L.E.T.P. and A.R.B.T.; investigation: C.C.S. and B.M.T.; resources: M.M.B. and A.R.B.T.; data curation: J.R.R., L.E.T.P. and A.R.B.T.; writing—original draft preparation: J.R.R. and L.E.T.P.; writing—review and editing: J.R.R., L.E.T.P., M.M.B. and A.R.B.T.; visualization: C.C.S. and B.M.T.; supervision: M.M.B.; project administration: J.R.R. and M.M.B.; funding acquisition: J.R.R. and M.M.B. All authors have read and agreed to the published version of the manuscript.
Funding
Funding Code 001, by Coordination for the Improvement of Higher Education Personnel (Coordenação de Aperfeiçoamento de Pessoal de Nível Superior—CAPES)—Brazil (Funding Code 001) and the Luiz de Queiroz Agricultural Studies Foundation (Fundação de Estudos Agrários Luiz de Queiroz—FEALQ).
Institutional Review Board Statement
Not applicable.
Informed Consent Statement
Not applicable.
Data Availability Statement
The raw data supporting the conclusions of this article will be made available by the authors on request.
Acknowledgments
The authors thank laboratory technician Carlos Agnaldo Teixeira for his technical support during image processing activities. To the poultry slaughterhouses located in Holambra and Pirassununga, São Paulo, Brazil, for providing access to their facilities and supporting data collection. Financial support from the Coordination for the Improvement of Higher Education Personnel (Coordenação de Aperfeiçoamento de Pessoal de Nível Superior—CAPES), Brazil (Funding Code 001), and the Luiz de Queiroz Agricultural Studies Foundation (Fundação de Estudos Agrários Luiz de Queiroz—FEALQ) is gratefully acknowledged.
Conflicts of Interest
The authors declare no conflicts of interest.
Abbreviations
The following abbreviations are used in this manuscript:
| CNN | Convolutional Neural Network |
| RGB | Red, Green and Blue |
| IoU | Intersection over Union |
| Dice | Dice Coefficient |
| OE | Overlap Error |
| SSIM | Structural Similarity Index |
| EPI | Edge Preservation Index |
| FDR | Fisher Discriminant Ratio |
References
- André-Zarna, C.; Simmen, K.; Albretsen, K.H.; Berg, P.; Njaastad, E.B. Meat Industry 5.0—A review of technological approaches and robotic systems in the meat processing industry. Trends Food Sci. Technol. 2026, 167, 105439. [Google Scholar] [CrossRef] [Scilit]
- Ojo, R.O.; Ajayi, A.O.; Owolabi, H.A.; Oyedele, L.O.; Akanbi, L.A. Internet of Things and Machine Learning techniques in poultry health and welfare management: A systematic literature review. Comput. Electron. Agric. 2022, 200, 107266. [Google Scholar] [CrossRef] [Scilit]
- Sandberg, M.; Ghidini, S.; Alban, L.; Capobianco Dondona, A.; Blagojevic, B.; Bouwknegt, M.; Lipman, L.; Dam, J.S.; Nastasijevic, I.; Antic, D. Applications of computer vision systems for meat safety assurance in abattoirs: A systematic review. Food Control 2023, 150, 109768. [Google Scholar] [CrossRef] [Scilit]
- Libera, K.; Schut, D.; Kritsi, E.; van Steijn, L.; Dallman, T.; Lipman, L. Detecting wing fractures in chickens using deep learning, photographs and computed tomography scanning. Poult. Sci. 2025, 104, 105264. [Google Scholar] [CrossRef] [Scilit] [PubMed]
- Chao, K.; Henry, A.; Park, B.; Richard, B.; Kim, M.S.; Henry, A. Computer vision in the poultry industry. In Computer Vision Technology in the Food and Beverage Industries; Elsevier: Amsterdam, The Netherlands, 2012; pp. 330–351. [Google Scholar] [CrossRef]
- Park, B. Quality Evaluation of Poultry Carcass. In Computer Vision Technology for Food Quality Evaluation; Elsevier: Amsterdam, The Netherlands, 2016; pp. 213–241. [Google Scholar] [CrossRef] [Scilit]
- Tran, M.; Truong, S.; Fernandes, A.F.A.; Kidd, M.T.; Le, N. CarcassFormer: An end-to-end transformer-based framework for simultaneous localization, segmentation and classification of poultry carcass defect. Poult. Sci. 2024, 103, 103765. [Google Scholar] [CrossRef] [Scilit] [PubMed]
- Xing, L.; Wang, Y.; Luo, R.; Zou, L. Application of Computer Vision Technology in Agricultural Products and Food Inspection. J. Phys. Conf. Ser. 2021, 1915, 032045. [Google Scholar] [CrossRef] [Scilit]
- Xu, Z.; Han, Y.; Zhao, D.; Li, K.; Li, J.; Dong, J.; Shi, W.; Zhao, H.; Bai, Y. Research Progress on Quality Detection of Livestock and Poultry Meat Based on Machine Vision, Hyperspectral and Multi-Source Information Fusion Technologies. Foods 2024, 13, 469. [Google Scholar] [CrossRef] [Scilit] [PubMed]
- Albukhnefis, A.L.; Al-Fatlawi, T.T.; Hakem Alsaeedi, A. Image Segmentation Techniques: An In-Depth Review and Analysis. J. Al-Qadisiyah Comput. Sci. Math. 2024, 16, 195–215. [Google Scholar] [CrossRef] [Scilit]
- Liyanage, M.; Viduranga, M.M.; Senadeera, S.; Godaliyadda, R.; Ekanayake, P.; Jayasinghe, R. Beyond Overlap: Topology-Aware Evaluation for Biomedical Image Segmentation. In Proceedings of the 2025 IEEE 19th International Conference on Industrial and Information Systems (ICIIS); IEEE: New York, NY, USA, 2026; pp. 192–197. [Google Scholar] [CrossRef] [Scilit]
- Modzelewska-Kapituła, M.; Jun, S. The application of computer vision systems in meat science and industry—A review. Meat Sci. 2022, 192, 108904. [Google Scholar] [CrossRef] [Scilit] [PubMed]
- Roy, L.; De, S.; Chakraborty, S. Digital Image Analysis in Food and Bioprocess Industries. In Artificial Intelligence in Food Science; Academic Press: Cambridge, MA, USA, 2026; Available online: https://www.sciencedirect.com/science/chapter/edited-volume/abs/pii/B9780443264689000230 (accessed on 13 March 2026).
- Minaee, S.; Boykov, Y.Y.; Porikli, F.; Plaza, A.J.; Kehtarnavaz, N.; Terzopoulos, D. Image Segmentation Using Deep Learning: A Survey. IEEE Trans. Pattern Anal. Mach. Intell. 2021, 44, 3523–3542. [Google Scholar] [CrossRef] [Scilit] [PubMed]
- Liang, J.; Liu, Y.; Vlassov, V. The Impact of Background Removal on Performance of Neural Networks for Fashion Image Classification and Segmentation. In Proceedings of the 2023 Congress in Computer Science, Computer Engineering, & Applied Computing (CSCE); IEEE: New York, NY, USA, 2023; pp. 1960–1968. [Google Scholar] [CrossRef] [Scilit]
- Peng, M.; Liu, Y.; Qadri, I.A.; Bhatti, U.A.; Ahmed, B.; Sarhan, N.M.; Awwad, E. Advanced image segmentation for precision agriculture using CNN-GAT fusion and fuzzy C-means clustering. Comput. Electron. Agric. 2024, 226, 109431. [Google Scholar] [CrossRef] [Scilit]
- Wu, X.; Li, Z.; Tao, C.; Han, X.; Chen, Y.W.; Yao, J.; Zhang, J.; Sun, Q.; Li, W.; Liu, Y.; et al. DEA: Data-efficient augmentation for interpretable medical image segmentation. Biomed. Signal Process. Control 2024, 89, 105748. [Google Scholar] [CrossRef] [Scilit]
- Zheng, Q.; Gao, Y.; Zhou, M.; Li, H.; Lin, J.; Zhang, W.; Chen, X. Semi or fully automatic tooth segmentation in CBCT images: A review. PeerJ Comput. Sci. 2024, 10, e1994. [Google Scholar] [CrossRef] [Scilit] [PubMed]
- Vlăsceanu, G.V.; Tarbă, N.; Voncilă, M.L.; Boiangiu, C.A. Selecting the Right Metric: A Detailed Study on Image Segmentation Evaluation. Brain 2025, 15, 295–318. [Google Scholar] [CrossRef] [Scilit]
- Riehle, D.; Reiser, D.; Griepentrog, H.W. Robust index-based semantic plant/background segmentation for RGB- images. Comput. Electron. Agric. 2020, 169, 105201. [Google Scholar] [CrossRef] [Scilit]
- Xu, H.; Blonder, B.; Jodra, M.; Malhi, Y.; Fricker, M. Automated and accurate segmentation of leaf venation networks via deep learning. New Phytol. 2021, 229, 631–648. [Google Scholar] [CrossRef] [Scilit] [PubMed]
- Sung, T.L.; Lee, H.J. Depth edge detection using edge-preserving filter and morphological operations. Int. J. Syst. Assur. Eng. Manag. 2020, 11, 812–817. [Google Scholar] [CrossRef] [Scilit]
- Pattnaik, T.; Kanungo, P.; Sahoo, P.K.; Kar, T.; Jain, P.; Soliman, M.S.; Islam, M.T. An Efficient Low Complex-Functional Link Artificial Neural Network-Based Framework for Uneven Light Image Thresholding. IEEE Access 2024, 12, 118315–118338. [Google Scholar] [CrossRef] [Scilit]
- Cardenas-Gallegos, J.S.; Severns, P.M.; Klimeš, P.; Lacerda, L.N.; Peduzzi, A.; Soranz Ferrarezi, R. Reliable plant segmentation under variable greenhouse illumination conditions. Comput. Electron. Agric. 2025, 229, 109711. [Google Scholar] [CrossRef] [Scilit]
- Ng, H.F. Automatic thresholding for defect detection. Pattern Recognit. Lett. 2006, 27, 1644–1649. [Google Scholar] [CrossRef] [Scilit]
- Pattnaik, T.; Kanungo, P.; Kar, T.; Sahoo, P.K. Multiple linear regression based illumination normalization for non-uniform light image thresholding. e-Prime—Adv. Electr. Eng. Electron. Energy 2024, 7, 100411. [Google Scholar] [CrossRef] [Scilit]
- Aldridge, D.J.; Owens, C.M.; Maynard, C.; Kidd, M.T.; Scanes, C.G. Impact of light intensity or choice of intensity on broiler performance and behavior. J. Appl. Poult. Res. 2022, 31, 100216. [Google Scholar] [CrossRef] [Scilit]
- Swanson, A.; Soro, A.B.; Hannon, S.; Whyte, P.; Bolton, D.J.; Tiwari, B.K.; Gowen, A. Visible spectral imaging (443–726 nm) for evaluating ultraviolet decontamination and predicting bacterial spoilage of vacuum packed chicken breasts. LWT 2022, 169, 113996. [Google Scholar] [CrossRef] [Scilit]
- Gorji, H.T.; Shahabi, S.M.; Sharma, A.; Tande, L.Q.; Husarik, K.; Qin, J.; Chan, D.E.; Baek, I.; Kim, M.S.; MacKinnon, N.; et al. Combining deep learning and fluorescence imaging to automatically identify fecal contamination on meat carcasses. Sci. Rep. 2022, 12, 2392. [Google Scholar] [CrossRef] [Scilit] [PubMed]
- Shams, M.Y.; Elmessery, W.M.; Oraiath, A.A.T.; Elbeltagi, A.; Salem, A.; Kumar, P.; El-Messery, T.M.; El-Hafeez, T.A.; Abdelshafie, M.F.; El-Wahhab, G.G.A.; et al. Automated on-site broiler live weight estimation through YOLO-based segmentation. Smart Agric. Technol. 2025, 10, 100828. [Google Scholar] [CrossRef] [Scilit]
- Khan, H.; Iftikhar, S.; Ward, R.; Davy, S.; Breslin, J.G. BiAgriNet: Binarized Knowledge-Distilled Network for Real-Time Semantic Segmentation in Agriculture. IEEE Access 2025, 13, 192374–192390. [Google Scholar] [CrossRef] [Scilit]
- Chen, Y.; Xu, C.; Zhang, P.; Peng, X.; Fu, D.; Hu, Z. A Semantic Segmentation Method for Segmenting Chicken Parts Based on a Lightweight DeepLabv3+. J. Food Process. Eng. 2025, 48, e70180. [Google Scholar] [CrossRef] [Scilit]

Disclaimer/Publisher’s Note: The statements, opinions and data contained in all publications are solely those of the individual author(s) and contributor(s) and not of MDPI and/or the editor(s). MDPI and/or the editor(s) disclaim responsibility for any injury to people or property resulting from any ideas, methods, instructions or products referred to in the content. |
© 2026 by the authors. Licensee MDPI, Basel, Switzerland. This article is an open access article distributed under the terms and conditions of the Creative Commons Attribution (CC BY) license.