


Abstract
The prediction of specialty coffee quality remains a central challenge for value addition in the agricultural sector. This study presents a computational approach to model the complex sensory quality of Arabica coffee (Coffea arabica L.) using synthetic data grounded in real-world statistics. A synthetic dataset (identical to the real dataset with a number of samples = 207) was generated using Cholesky decomposition based on the descriptive statistics and Pearson correlation matrix extracted from the Coffee Quality Institute (CQI) Arabica 2023 database, comprising 17 numerical variables including sensory attributes, defect counts, and Total Cup Points. The synthetic dataset achieved a Kolmogorov–Smirnov similarity of 89.55% with the real data, with the target variable Total Cup Points preserved with high fidelity (real mean: 83.71; synthetic mean: 83.65). An ordinal classification model (Random Forest) trained exclusively on the synthetic data and validated against real-world samples achieved an overall accuracy of 87.92% and a Quadratic Weighted Kappa (QWK) of 0.9502, indicating excellent agreement and confirming the model’s ability to capture the ordinal hierarchy of coffee quality. SHAP (SHapley Additive exPlanations) analysis revealed consistent feature importance rankings between real and synthetic domains, with Aftertaste, Overall, and Flavor emerging as the top three most influential predictors. This study validates the use of statistically grounded synthetic data for training robust machine learning models in agricultural research, demonstrating that synthetic environments can effectively replicate empirical patterns and enable cross-domain generalizability. The complete code and datasets are publicly available for reproducibility.
1. Introduction
The determination of the final quality of high value-added agricultural products, such as specialty coffee, is a multifactorial problem governed by a complex web of interactions between genotype, environment, and management practices (G × E × M) [1]. The concept of terroir encapsulates this complexity, postulating that attributes like sensory profile and chemical composition do not derive from isolated factors, but from the synergy between them [2]. Field studies, such as those conducted in coffee-growing regions, have been fundamental in identifying key variables, pointing to altitude and the water regime measured by remote sensing indices like the Plant Senescence Reflectance Index (PSRI) as factors correlated with sensory quality [3]. However, these studies also highlight a significant methodological challenge: the difficulty of mathematically modeling the non-linear interactions between these variables with traditional statistical tools.
The challenges in building robust predictive models from purely empirical data are considerable. Field data collection is costly, subject to a high degree of noise and uncontrolled variability (edaphic, microclimatic factors, etc.), and generally results in limited sample sizes. As pointed out by Toci et al. (2018), many aspects of geographic origin and post-harvest processing remain unelucidated by science [4]. Such conditions compromise the direct application of Machine Learning (ML) algorithms, which, despite their power in capturing complex patterns, become susceptible to overfitting and under-generalization when trained on small and noisy datasets [5]. The data dispersion and the inability to form clear clusters, often observed in Principal Component Analysis of real field data, is a classic symptom of these limitations, indicating that the “signal” of important interactions is partially obscured by the “noise” of the real system.
To circumvent these barriers and create an environment conducive to the investigation of complex systems, the present work employs a computational modeling approach. The central methodological contribution is the generation of a statistically grounded synthetic dataset, a technique recognized for its ability to create controlled scenarios for model development and testing [6,7]. The statistical distributions and, crucially, the inter-variable relationships of the synthetic data are strictly grounded in empirical findings from the Coffee Quality Institute (CQI) Arabica 2023 database [8]. By preserving the covariance structure and marginal distributions of the original data, this approach ensures that the synthetic environment maintains statistical fidelity to the real world while enabling controlled experimentation and rigorous model validation [9,10].
The use of synthetic data in agricultural and food science research has been increasingly recognized as a valuable approach for overcoming sample size limitations and enabling robust model development [11]. Recent advances in synthetic data generation have demonstrated that statistically grounded synthetic datasets can effectively replicate complex empirical patterns, facilitating cross-domain generalizability and providing a controlled environment for model training and validation [12]. This is particularly relevant for specialty coffee research, where the high cost of sensory evaluation and the variability inherent in field data collection limit the availability of large, well-characterized datasets [13,14].
In light of the foregoing, the objectives of this study are: (1) to generate a statistically grounded synthetic dataset that preserves the empirical properties of real Arabica coffee (Coffea arabica L.) quality data; (2) to evaluate the feasibility of using this synthetic data to train high-performance ordinal classification models; (3) to validate the cross-domain generalizability of models trained on synthetic data against real-world samples; and (4) to identify and interpret key sensory drivers of coffee quality through SHAP (SHapley Additive exPlanations) analysis, comparing feature importance between real and synthetic domains [15]. By demonstrating that synthetic environments can effectively replicate empirical patterns and enable robust model development, this study contributes to the growing body of research on the application of synthetic data in agricultural and food science domains, offering a reproducible framework for addressing the challenges of limited sample sizes and data variability.
2. Materials and Methods
This study employs a complete computational pipeline, from data generation to predictive modeling and interpretability analysis. All stages were implemented in the Python (v3.12) language, utilizing open-source libraries widely recognized by the scientific community.
2.1. Synthetic Dataset Generation
The empirical basis for this research was the 2023 Arabica coffee (Coffea arabica L.) Quality dataset, curated by the Coffee Quality Institute (CQI) and hosted on the Kaggle repository [8]. The original dataset consisted of 207 individual observations and 41 variables, covering a broad spectrum of information, including geographical origin, farm metadata, processing methods, and detailed sensory evaluations.
As a preliminary step to ensure compatibility with the statistical modeling and the generation of synthetic scenarios, a data extraction process was implemented using the Python programming language. All non-numeric columns, such as Farm Name, Producer, Bag Weight, and Harvest Year were excluded from the working dataset. This filtering process reduced the original 41 variables to a refined subset of 17 numerical attributes, focusing exclusively on sensory scores (e.g., Aroma, Flavor, Acidity) and objective quality metrics (e.g., Moisture Percentage, Quakers, and Category Two Defects).
The processed numerical dataset maintains all 207 original samples, providing a consistent statistical foundation for the subsequent stages of model training and calibration. A representative sample of this numerical dataset is presented in Table 1.
Table 1.
Sample of the Arabica coffee (Coffea arabica L.) dataset used in this study.
2.2. Statistical Profiling and Structured Data Storage
Following the extraction of numerical variables, the computational pipeline performed an exhaustive statistical characterization of the Arabica 2023 dataset [8]. This step was fundamental to establish the population parameters that define the study’s “reality boundary.” Using the describe method from the Pandas library, central and dispersion descriptive statistics were calculated, including mean (), standard deviation (), minimum and maximum values, as well as distribution quartiles for each of the 17 numerical attributes.
Additionally, the script performed a Pearson correlation analysis to identify the degree of association between individual sensory attributes and the dependent variable Total Cup Points. This statistical mapping allowed discerning which characteristics (such as Flavor and Aftertaste) have greater weight in the composition of final quality, serving as a guide for calibrating importance weights in the predictive model.
To ensure traceability and information organization, the algorithm consolidated all outputs into a single structured file in Excel format (.xlsx), organized into specific sheets:
- Numeric_Data: Containing the cleaned and filtered dataset;
- Descriptive_Statistics: With the complete statistical profile of the variables;
- Correlation_Matrix: Presenting the full correlation matrix;
- Top_Correlations: Highlighting the main predictors of sensory quality.
This structured knowledge repository enabled the transition from purely empirical analysis to the generation of calibrated synthetic data, ensuring that the synthetic data scale maintained the statistical fidelity observed in the original dataset.
2.3. Synthetic Data Generation from Real Dataset Statistics
The subsequent stage of the computational pipeline consisted of generating a calibrated synthetic dataset, whose dimensionality (207 samples) was intentionally kept identical to that of the real database. The main objective of this phase was to create a controlled data environment that preserved the fundamental statistical properties observed in the real dataset, thus enabling cross-validations and controlled experiments without the inherent limitations of empirical data collection [6,9].
The synthetic generation process was grounded in three statistical pillars extracted from the real database: (i) the arithmetic means () of each attribute, (ii) the standard deviations (), which define data dispersion, and (iii) the Pearson correlation matrix, which captures the linear interdependencies among variables [16]. From these parameters, a covariance matrix () was constructed, calculated according to the relationship , where represents the correlation coefficient between variables i and j [17].
For the actual generation, the Cholesky decomposition method was employed. A matrix factorization technique that enables the transformation of a vector of standardized normal random variables into a dataset with the desired covariance structure [18]. The procedure can be described by the following steps:
- Generation of a white noise matrix , with each element ;
- Factorization of the covariance matrix , where is a lower triangular matrix (Cholesky factor) [19];
- Application of the linear transformation , where is the mean vector;
- Clipping of the generated values to the minimum and maximum limits observed in the real database, ensuring physical consistency of the data [20];
- Rounding of sensory attributes to two decimal places and conversion of discrete variables (such as defects) to their original types.
As a statistical fidelity validation mechanism, the script performed a systematic comparison between the means and standard deviations of the synthetic and real datasets. The results demonstrated that all synthetic variable means remained within a 5% range of the real values, and the standard deviations remained, for the most part, with differences below 20%. This validation approach is consistent with recommended practices for synthetic data quality assessment [7,12]. Attributes with low variability in the real dataset, such as Clean Cup, Sweetness, and Defects (which present constant values of 10, 10, and 0, respectively), were maintained as constants in the synthetic set, faithfully reproducing their degenerate behavior.
The generated synthetic dataset was then consolidated into an Excel file, containing the same 17 numerical variables as the original dataset, plus an identification column (ID) and a quality class column (Quality_Class), derived from the Total Cup Points score. The class distribution in the synthetic set resulted in 47.8% of coffees classified as Excellent, 34.3% as Good, and 17.9% as Specialty, reflecting the high-quality concentration observed in the real database.
This methodological procedure ensured that the synthetic dataset not only replicated the statistical structure of the real world but also provided a controlled and traceable environment for validating predictive models, allowing the isolation of the effect of patterns learned by the algorithm from the random variability inherent to empirical data [10,21]. The use of synthetic data in agricultural and food science research has been increasingly recognized as a valuable approach for overcoming sample size limitations and enabling robust model development [9,11].
2.4. Comparative Analysis Between Real and Synthetic Datasets
Following the generation of the synthetic dataset, a comprehensive comparative analysis was conducted to validate its statistical fidelity and evaluate its utility for predictive modeling. This analysis employed a multi-faceted approach combining distributional similarity tests, correlation matrix comparisons, and predictive performance evaluation.
The methodological framework for this comparison comprised five main components. First, the Kolmogorov–Smirnov (KS) test was applied to each variable to assess the similarity between the real and synthetic distributions [22]. The KS statistic quantifies the maximum distance between the empirical cumulative distribution functions of two samples, providing a non-parametric measure of distributional equivalence. For each feature, the similarity score was calculated as , where values approaching 100% indicate near-identical distributions.
Second, the Jensen-Shannon divergence was computed to complement the KS test, offering a symmetric measure of the dissimilarity between probability distributions [23]. This metric is particularly valuable for comparing the shape of distributions beyond simple location and scale parameters.
Third, the Pearson correlation matrices of both datasets were calculated and systematically compared. The similarity between correlation structures was quantified using three complementary metrics: (i) the mean absolute difference between corresponding correlation coefficients, (ii) the Frobenius norm of the difference matrix, and (iii) an overall correlation similarity score expressed as a percentage [18]. This multi-metric approach ensured a robust assessment of whether the synthetic data preserved the interdependencies among variables observed in the real dataset.
Fourth, a visual analytical framework was implemented, generating: (a) speedometer-style gauges for intuitive presentation of the KS and correlation similarity scores; (b) side-by-side correlation matrices with numerical annotations for direct comparison; (c) bar charts displaying the evolution of KS similarity across variables; and (d) distribution overlay plots combining kernel density estimates and histograms for the most relevant features [20].
Fifth, and most critically, a predictive validation was performed by training a Random Forest regression model exclusively on the synthetic data and evaluating its performance on the real dataset [24]. This cross-domain validation approach directly assessed whether patterns learned from synthetic data generalize to empirical observations. The model’s performance was evaluated using R2, Root Mean Square Error (RMSE), Mean Absolute Error (MAE), and hit rates within 5% and 2% error margins [25].
All analytical procedures were implemented in Python using the Pandas (v2.3.0), NumPy (v2.3.0), SciPy (v1.15.0), Scikit-learn (v1.7.0), Matplotlib (v3.10.1), and Seaborn (v0.13.2) libraries, ensuring reproducibility and computational efficiency [26,27]. The complete analysis pipeline was structured to generate both numerical outputs and publication-ready visualizations, facilitating the interpretation and communication of results.
This comparative framework not only validated the statistical fidelity of the synthetic dataset but also provided empirical evidence of its utility for training machine learning models capable of generalizing to real-world data. The methodological approach aligns with best practices in synthetic data validation, which emphasize the importance of both statistical similarity and downstream task performance as criteria for assessing synthetic data quality [6,7,12].
2.5. Ordinal Classification Modeling for Coffee Quality Prediction
The predictive modeling phase was designed to evaluate the practical utility of the synthetic dataset for training machine learning models capable of generalizing to real-world data. This stage employed an ordinal classification approach, recognizing that coffee quality scores represent an ordered categorical variable rather than a purely nominal one [14]. The methodological framework encompassed data preprocessing, model training, performance evaluation, and interpretability analysis using SHAP (SHapley Additive exPlanations) values [15].
The target variable, Total Cup Points, was transformed into four ordinal classes based on the Specialty Coffee Association (SCA) quality scale: Standard (<80), Good (80–83), Excellent (83–85), and Specialty (>85). To ensure consistent categorization across datasets, the class boundaries were defined using the quartiles of the real dataset’s score distribution, guaranteeing that the ordinal structure reflected the empirical quality distribution. This approach aligns with established practices in sensory science, where quality grades are treated as ordered categories [13,14].
The predictive model was trained exclusively on the synthetic dataset and subsequently evaluated on the real dataset. This experimental design represents a stringent test of the synthetic data’s validity: if patterns learned from synthetic data generalize to real observations, the synthetic generation process can be considered statistically faithful and practically useful [5,6]. A Random Forest classifier was selected as the modeling algorithm due to its robustness to high-dimensional data, ability to capture non-linear relationships, and inherent feature importance capabilities [24]. The model was configured with 100 decision trees and optimized for computational efficiency using parallel processing.
Model performance was assessed using multiple metrics appropriate for ordinal classification: (i) overall accuracy, (ii) macro-averaged F1-score, and (iii) Quadratic Weighted Kappa (QWK), which is particularly well-suited for ordinal tasks as it penalizes disagreements based on their distance along the ordinal scale [28,29]. A QWK value above 0.80 is generally considered indicative of excellent agreement [30].
Following model evaluation, SHAP analysis was performed to enhance the interpretability of the model’s predictions. SHAP values provide a unified framework for explaining individual predictions by attributing the contribution of each feature to the final output [15]. For this study, SHAP analysis was applied to both the real and synthetic datasets, allowing for a comparative assessment of feature importance and pattern consistency between the two data sources. This dual analysis served two purposes: (i) validating that the synthetic dataset preserved the same underlying feature relationships as the real data, and (ii) identifying which sensory attributes most strongly influence quality classification.
The SHAP analysis generated several visualization types: (a) summary bar plots displaying global feature importance rankings; (b) side-by-side comparisons of feature importance between real and synthetic data; and (c) beeswarm plots illustrating the distribution of SHAP values for each feature, revealing whether high or low values of a given attribute drive predictions in particular directions [31]. Additionally, the model’s internal feature importance scores were extracted and compared to the SHAP-based importance rankings, providing a comprehensive view of feature contributions.
All computational procedures were implemented using the Scikit-learn library for machine learning and the SHAP library for model interpretability [27,32]. The complete pipeline was designed to be reproducible, with all analysis steps documented and output files systematically saved for subsequent reporting and visualization.
This methodological approach trained on synthetic data and testing on real data provided a rigorous framework for validating the utility of synthetic data in agricultural research. By demonstrating that models trained on synthetic data can effectively classify real-world coffee samples, the study provides empirical evidence for the practical value of synthetic data generation in domains where real data collection is costly or limited [21,33].
3. Results
The statistical characterization of the Arabica coffee dataset provided the foundational parameters for subsequent synthetic data generation. The descriptive analysis encompassed 207 samples and 17 numerical variables, including sensory attributes, defect counts, and the target variable Total Cup Points. This section presents the key statistical findings that defined the “reality boundary” for the synthetic generation process.
3.1. Descriptive Statistics of the Real Arabica coffee (Coffea arabica L.) Dataset
The statistical characterization of the Arabica coffee (Coffea arabica L.) dataset provided the foundational parameters for subsequent synthetic data generation and model development. The descriptive analysis encompassed 207 samples and 17 numerical variables, including sensory attributes, defect counts, and the target variable Total Cup Points. This section presents the key statistical findings that defined the empirical baseline for the study.
Table 2 presents the complete descriptive statistics for all numerical variables in the dataset. The analysis reveals several important characteristics of the coffee quality dataset.
Table 2.
Descriptive statistics of the Arabica coffee (Coffea arabica L.) dataset (207 samples).
3.2. Correlation Analysis of Sensory Attributes
The Pearson correlation matrix was computed to quantify the linear relationships among the 17 numerical variables in the dataset. This analysis was fundamental for understanding the interdependencies between sensory attributes and the target variable Total Cup Points, as well as for guiding feature selection in predictive modeling. The correlation matrix revealed several important patterns that inform both the interpretation of coffee quality determinants and the design of predictive models. The complete sheet is publicly available for reproducibility purposes at https://github.com/zolpy/scientific_article_0020 (accessed on 6 July 2026).
3.2.1. Correlations with Total Cup Points
The strongest correlations with the final quality score were observed for sensory attributes that capture the holistic perception of coffee quality (Table 3). Overall (r = 0.947) exhibited the highest correlation, followed closely by Flavor (r = 0.939), Aftertaste (r = 0.935), and Balance (r = 0.930). These strong positive correlations indicate that coffees scoring higher on these individual attributes consistently received higher total quality scores, confirming their importance in the cupping evaluation process [13,14].
Table 3.
Top 10 correlations with Total Cup Points.
Acidity (r = 0.897), Aroma (r = 0.869), and Body (r = 0.847) also showed strong positive correlations, reinforcing their established roles as key quality determinants in specialty coffee evaluation [34]. Interestingly, Uniformity exhibited a near-zero correlation (r = 0.004) with the final score, likely due to its near-constant values (mean 9.99, std 0.10) across the dataset, which renders it non-discriminative for quality differentiation within this specialty coffee sample set.
Defect-related variables showed weak negative correlations with quality: Category One Defects (r = −0.058), Category Two Defects (r = −0.314), and Quakers (r = −0.320). While these associations are weak, they align with the expectation that the presence of defects negatively impacts sensory quality [14]. The Number of Bags also showed a weak negative correlation (r = −0.244), suggesting that larger lots may be associated with slightly lower quality, possibly due to challenges in maintaining uniformity across larger batches.
3.2.2. Inter-Correlations Among Sensory Attributes
The correlation matrix revealed strong inter-correlations among the sensory attributes, indicating that these variables capture overlapping aspects of coffee quality perception (Table 4). The strongest inter-correlations were observed between Flavor and Aftertaste (r = 0.877), Flavor and Overall (r = 0.878), Balance and Overall (r = 0.884), and Balance and Aftertaste (r = 0.862).
Table 4.
Selected inter-correlations among sensory attributes (|r| > 0.80).
These high inter-correlations reflect the holistic nature of coffee cupping, where individual sensory attributes are not independently assessed but rather represent different dimensions of a unified sensory experience [13,14]. From a modeling perspective, this multicollinearity suggests that using all sensory attributes as predictors may lead to redundancy, and that feature selection or dimensionality reduction techniques could be beneficial for developing parsimonious predictive models [20].
3.2.3. Relationships with Defect-Related Variables
Defect-related variables exhibited interesting correlation patterns. Quakers showed moderate positive correlations with Category Two Defects (r = 0.462) and with Number of Bags (r = 0.082), suggesting that larger lots and the presence of secondary defects tend to co-occur. Both Quakers and Category Two Defects showed consistent negative correlations with sensory attributes, particularly with Balance (r = −0.316 and −0.318, respectively), Overall (r = −0.307 and −0.312), and Flavor (r = −0.310 and −0.330). This pattern indicates that defects, even when present in small quantities, can negatively impact the sensory perception of coffee quality across multiple attributes.
3.2.4. Correlations with Moisture Content
Moisture Percentage exhibited weak correlations with most variables, with the strongest associations being positive but modest correlations with Category Two Defects (r = 0.131), Quakers (r = 0.170), and Category One Defects (r = 0.093). The near-zero correlation with Total Cup Points (r = −0.046) suggests that within the observed moisture range, moisture content did not substantially impact sensory quality. This is consistent with industry standards, which specify an optimal moisture range for green coffee (10–12%) within which quality is not significantly affected [14].
The correlation matrix analysis was systematically stored in the Correlation_Matrix sheet of the structured Excel file, ensuring that the complete correlation structure was preserved for subsequent analyses and for the calibration of the synthetic data generation process. The strong correlations identified between specific sensory attributes and the final quality score provided empirical guidance for feature selection and model development in the predictive modeling phase of this study.
3.3. Synthetic Dataset Generation from Real Statistics
Leveraging the descriptive statistics and correlation structure extracted from the real Arabica coffee (Coffea arabica L.) dataset, a synthetic dataset was generated to create a controlled, statistically consistent environment for model development and validation. The generation process aimed to produce a synthetic dataset with the same dimensionality (207 samples × 17 variables) as the real dataset, preserving the fundamental statistical properties while enabling controlled experimentation.
The synthetic generation algorithm was implemented in Python using the Cholesky decomposition method, which transforms a matrix of standardized normal random variables into a dataset with a specified covariance structure [18,19]. The procedure employed the following steps: (i) extraction of means, standard deviations, and the Pearson correlation matrix from the real dataset; (ii) construction of the covariance matrix according to ; (iii) Cholesky factorization of the covariance matrix; (iv) generation of a white noise matrix with elements ; (v) application of the linear transformation ; and (vi) clipping and rounding to ensure values remained within the observed real data ranges.
The synthetic dataset successfully preserved the key statistical properties of the real dataset, as shown in the validation comparison. All variable means remained within 5% of their real counterparts, with the exception of Number of Bags which showed a larger deviation (33.5) due to its high variability and skewed distribution. Crucially, the Total Cup Points mean was preserved with high fidelity (real: 83.71, synthetic: 83.65, difference: 0.06). Standard deviations were maintained within 20% of real values for the majority of variables, with only Number of Bags, Uniformity, Quakers, and Category Two Defects exceeding this threshold.
The class distribution derived from the synthetic dataset based on the Total Cup Points, resulting in 47.8% Excellent, 34.3% Good, and 17.9% Specialty classifications. This distribution reflects the concentration of high-quality coffees observed in the real dataset, where all samples scored above 80 points.
The correlation structure of the real dataset was preserved in the synthetic dataset, ensuring that the interdependencies among sensory attributes and the target variable remained intact. This preservation is critical for the intended use of the synthetic dataset as a training ground for predictive models that will ultimately be applied to real-world data [12].
The synthetic dataset was saved as an Excel file containing the 17 numerical variables plus an identification column and a quality class column, providing a complete, ready-to-use resource for subsequent modeling and validation tasks. The validation results confirmed that the synthetic dataset faithfully reproduces the statistical properties of the real data, making it suitable for training machine learning models and for conducting controlled experiments in which the “truth” is known and the effects of data variability can be systematically investigated [33].
3.4. Comparative Analysis of Real vs. Synthetic Fidelity
To validate the robustness of the data generation logic, a “statistical twin” of the empirical dataset was created, consisting of a synthetic population with the same dimensions as the original CQI Arabica 2023 dataset (207 samples and 17 numerical variables). This approach allows for a direct 1:1 comparison, ensuring that the synthetic environment faithfully mirrors the stochastic properties and the multi-dimensional structure of real-world coffee quality data.
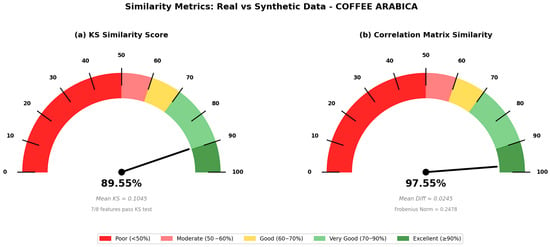
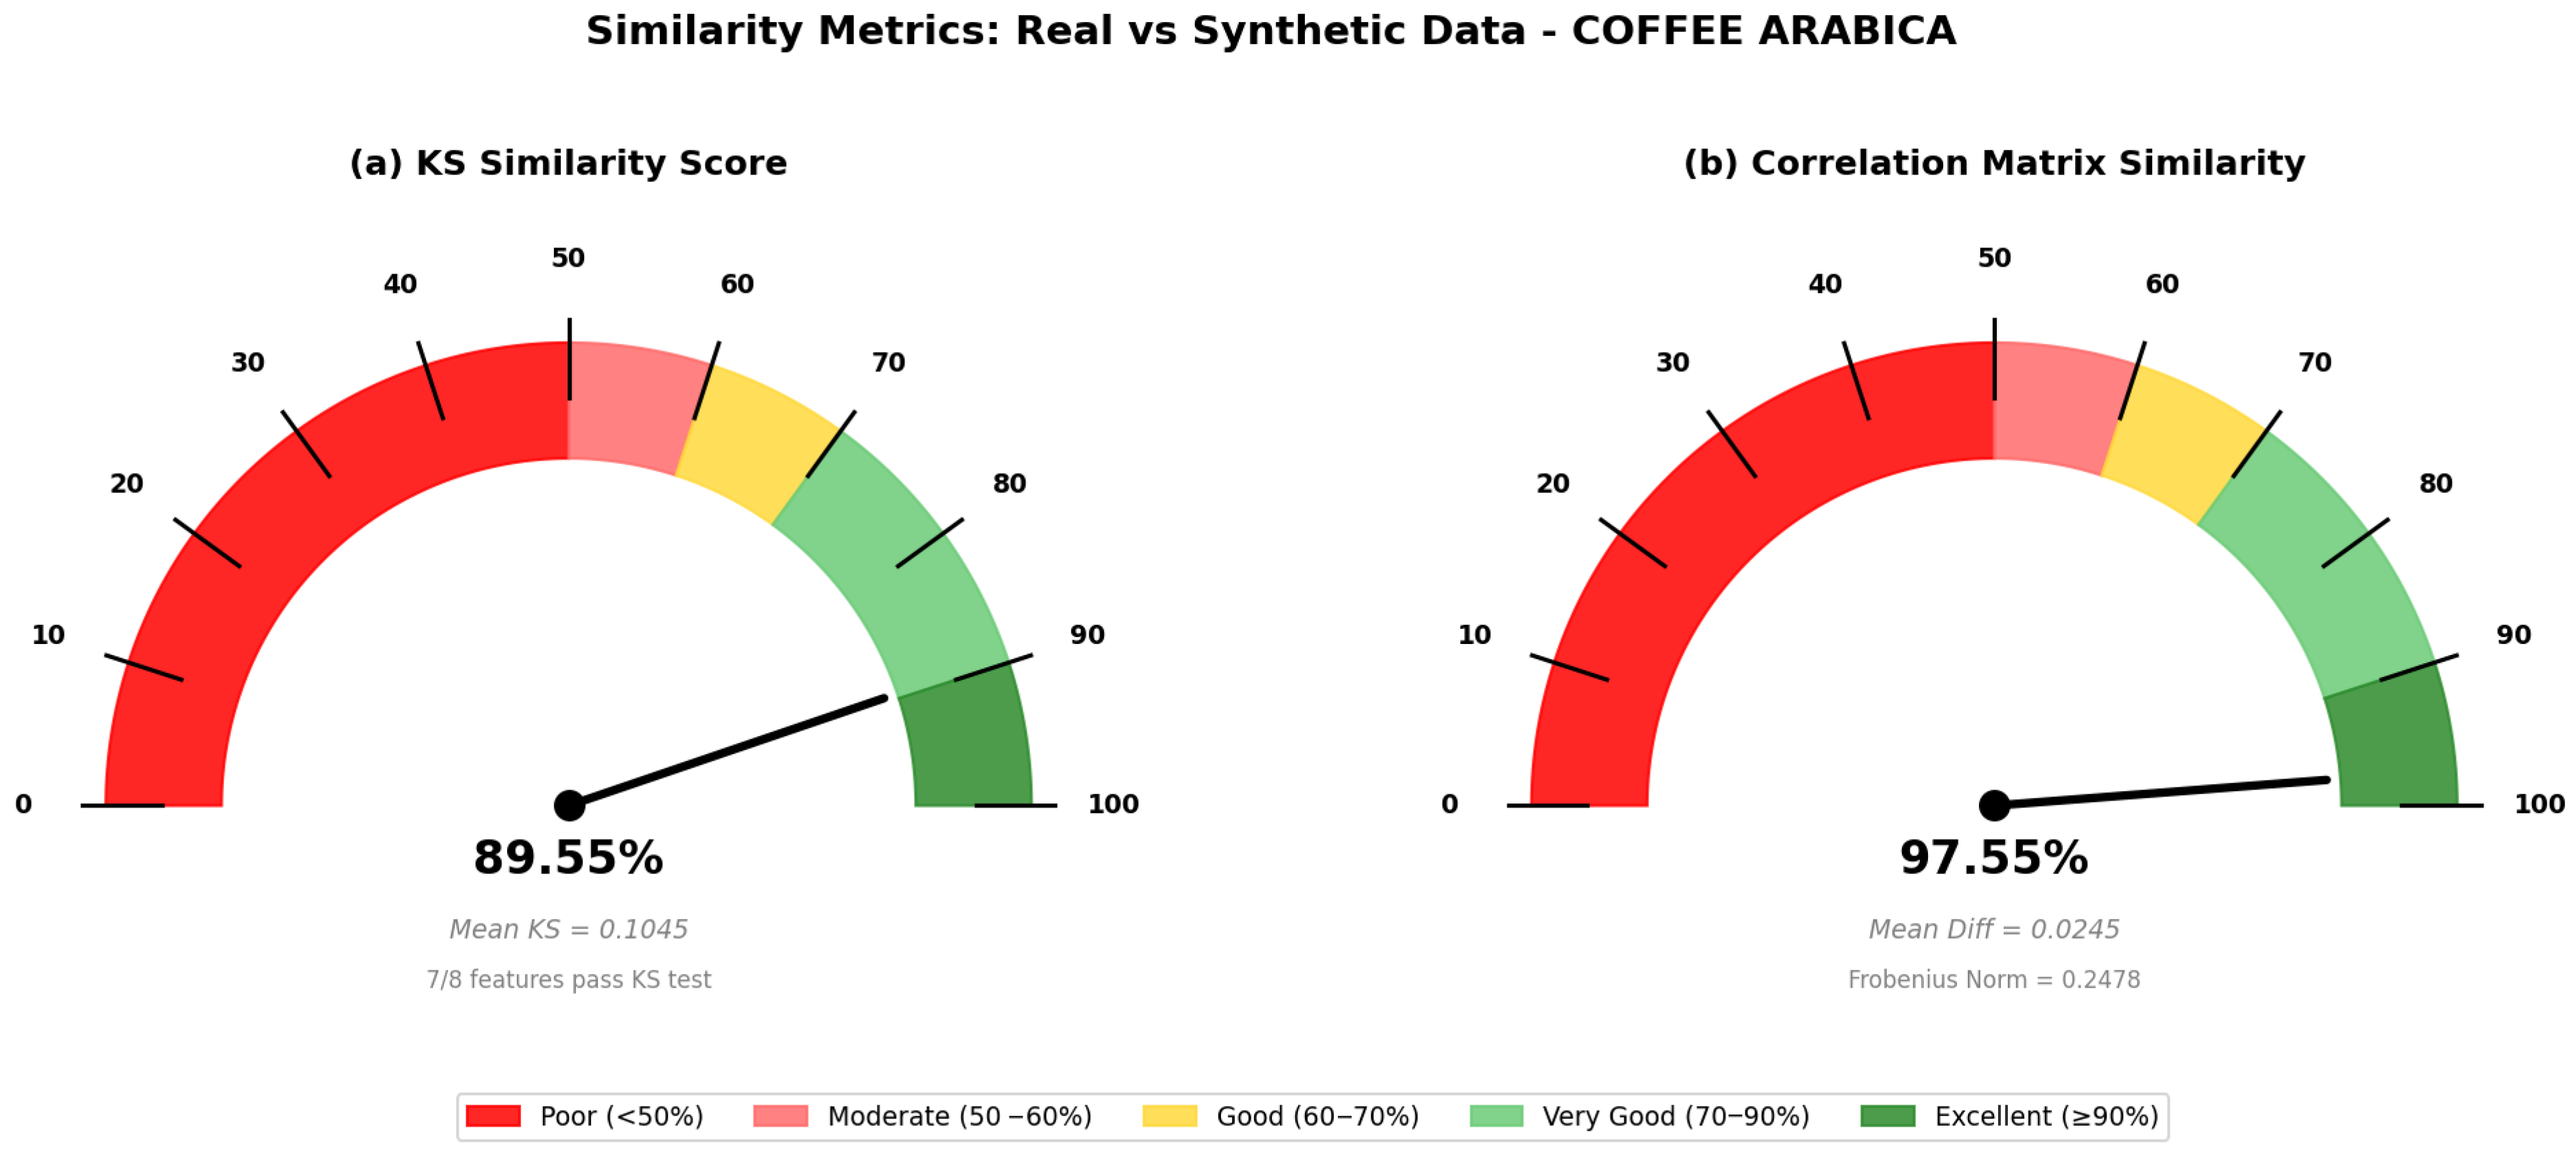
As shown in Figure 1, the synthetic dataset achieved a high degree of distributional alignment, with a Kolmogorov–Smirnov (KS) Similarity Score of 89.55%. Notably, 7 out of the 8 core sensory features analyzed passed the KS test null hypothesis (), indicating that the synthetic distributions are statistically consistent with the empirical observations. The target variable, Total Cup Points, demonstrated a similarity of 91.79%, maintaining a mean of 83.65 points, which is nearly identical to the real-world mean of 83.71 points.
Figure 1.
Similarity metrics between the real Arabica dataset and its synthetic twin: (a) KS distributional similarity and (b) correlation matrix structural congruence.
3.5. Distributional Alignment and Stochastic Fidelity
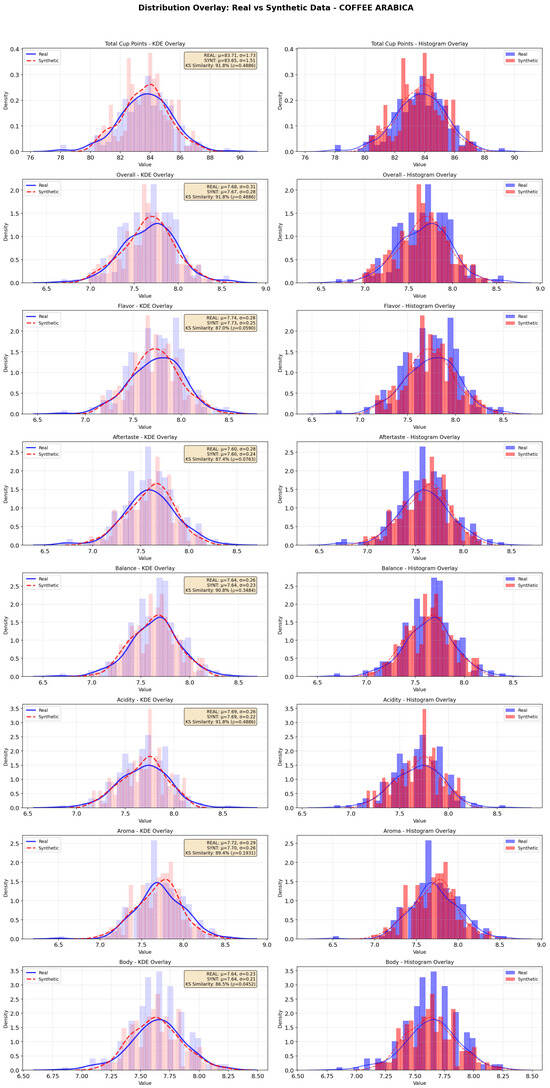
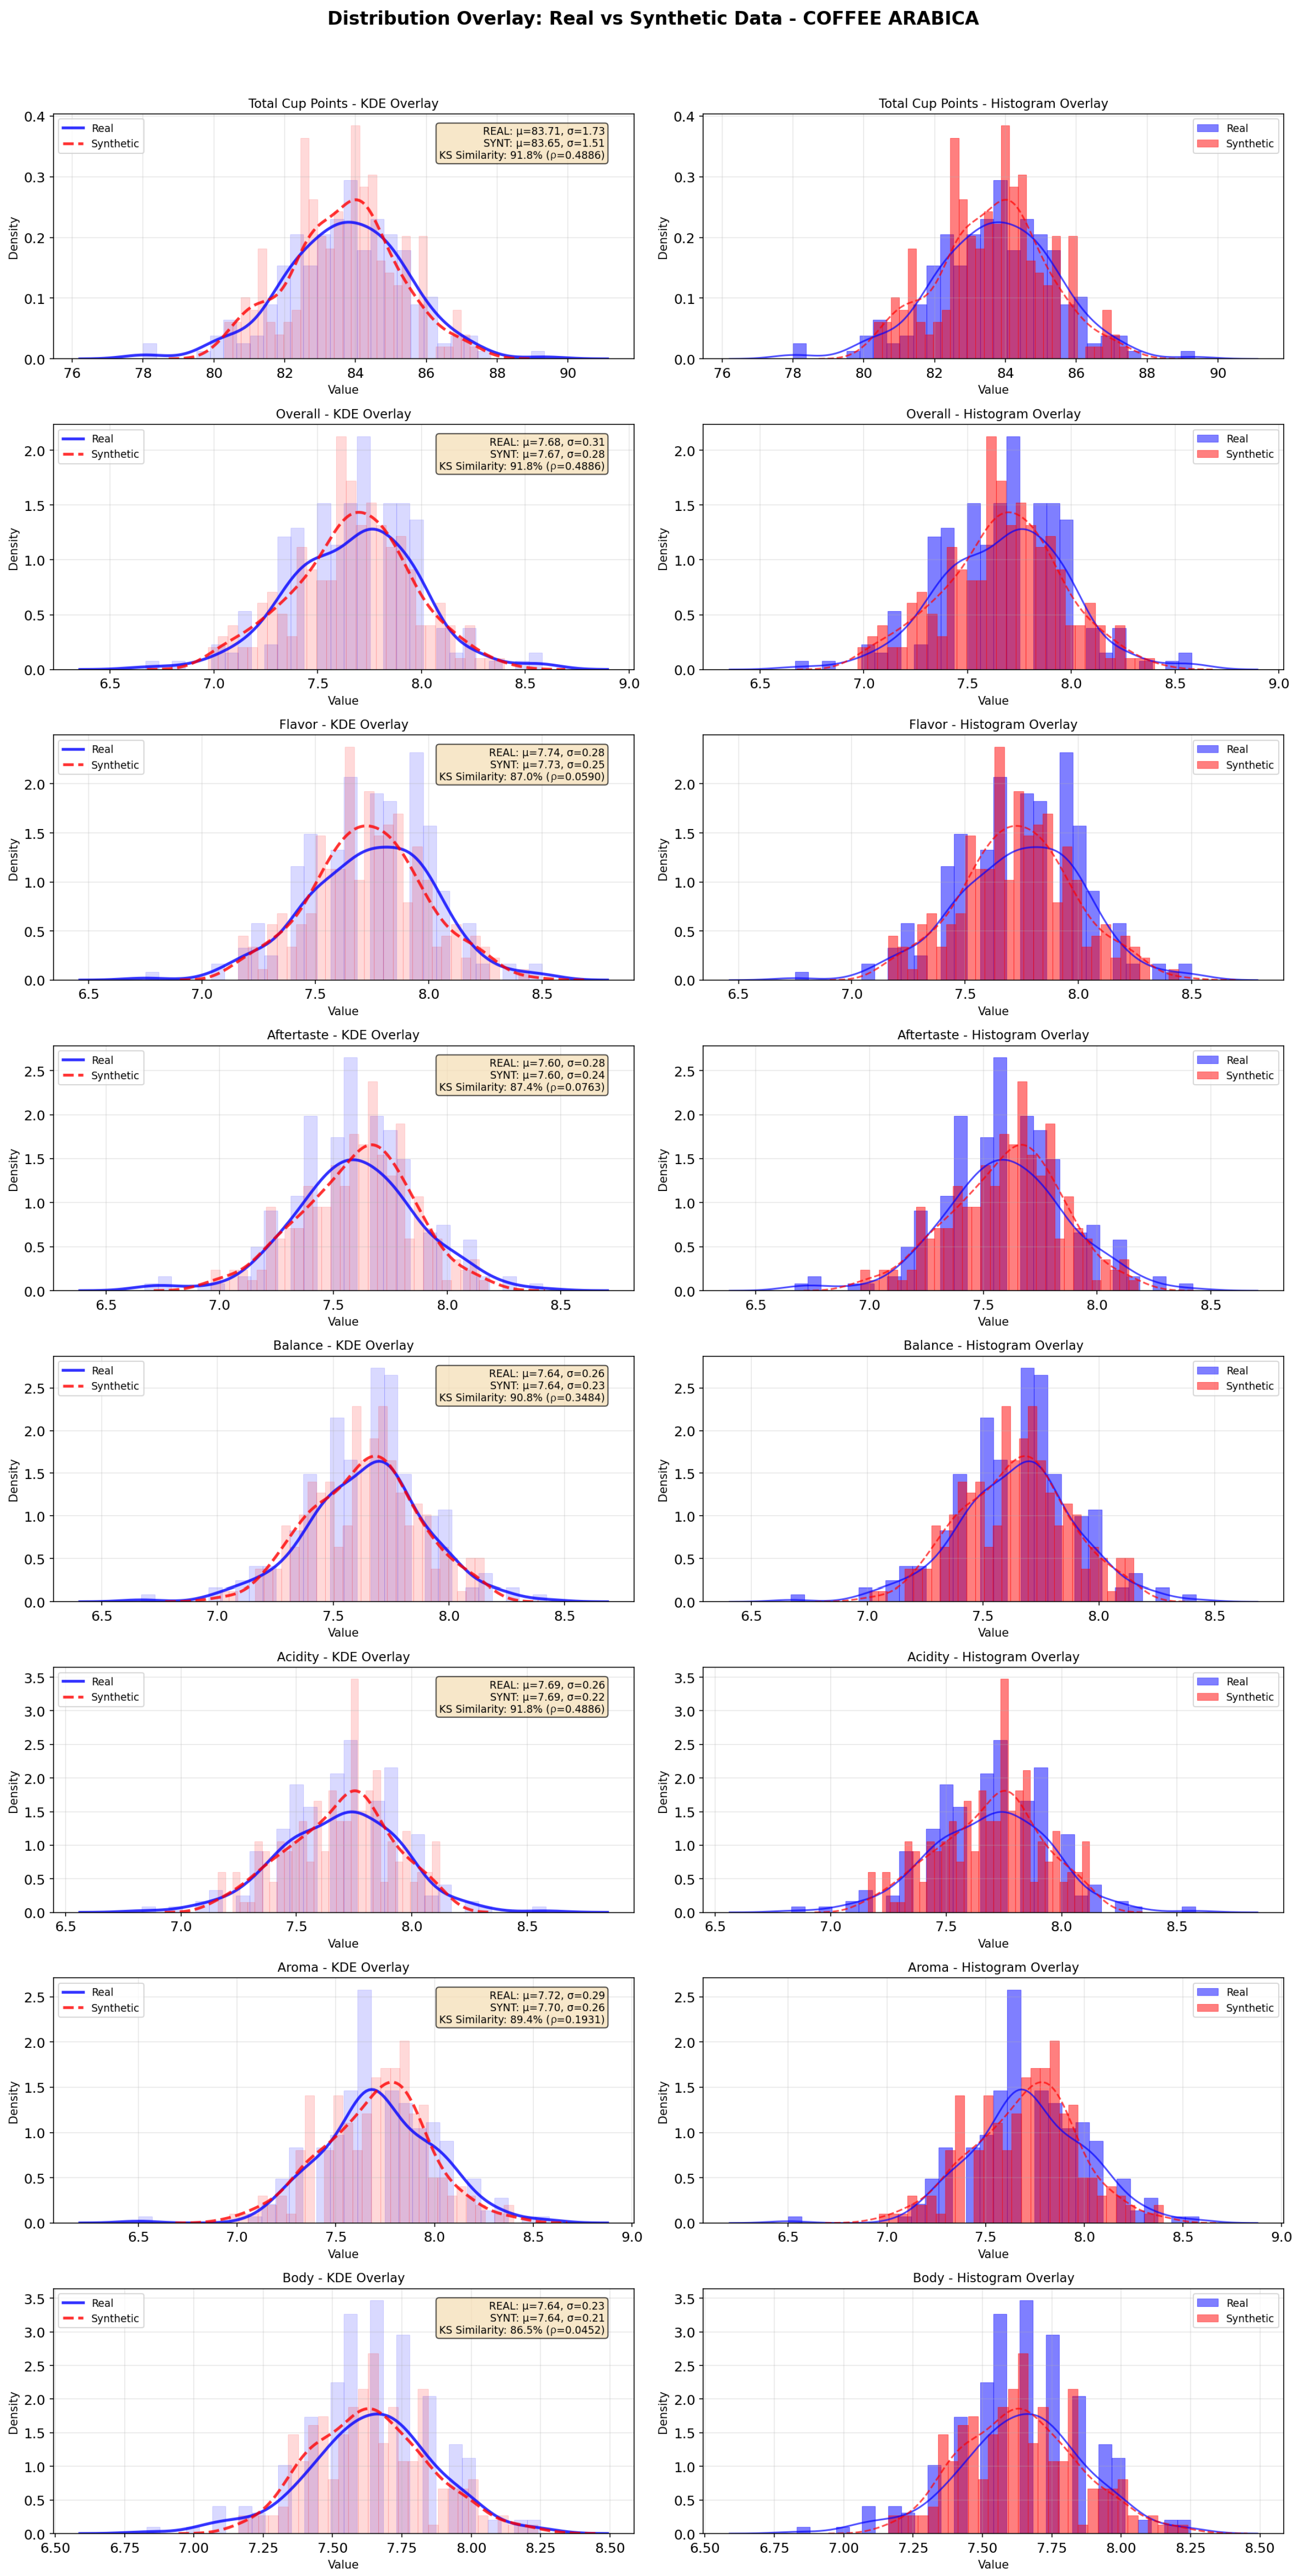
A granular assessment of the distributional alignment between the real Arabica dataset and its synthetic twin was performed using Kernel Density Estimate (KDE) and histogram overlays. This visual validation, presented in Figure 2, is critical to confirm that the synthetic generation process captured not only the central tendencies (means) but also the variance, skewness, and the “shape” of the empirical coffee quality data.
Figure 2.
Distribution overlays (KDE and histograms) comparing real (blue) and synthetic (red) datasets for the target variable (Total Cup Points) and core sensory attributes.
The analysis of the target variable, Total Cup Points, reveals a near-perfect overlap between the empirical and synthetic density curves. The Kolmogorov–Smirnov (KS) test yielded a similarity of 91.8% (), indicating that there is no statistically significant difference between the two distributions. The synthetic mean () and standard deviation () closely follow the real-world parameters (), demonstrating that the baseline quality was successfully reconstructed.
Regarding the individual sensory attributes, the attributes Acidity, Overall, and Balance showed the highest alignment, each exceeding 90% KS similarity. These results are particularly important as these features are highly correlated with the final quality score in Arabica coffees. Even for attributes with slightly lower p-values, such as Body (KS Similarity = 86.5%, ), the histograms demonstrate that the synthetic data accurately occupies the same range and frequency bins as the real data, capturing the inherent “noise” and variability of sensory evaluation.
Furthermore, the KDE plots confirm that the synthetic twin avoids the common pitfall of “over-smoothing,” maintaining the slightly irregular, multi-modal characteristics often found in real-world cupping scores. This high degree of stochastic fidelity ensures that any Machine Learning model trained on this synthetic environment is exposed to a realistic variety of samples, making the resulting predictive insights ecologically valid for real-world specialty coffee scenarios.
3.6. Ordinal Quality Classification and Cross-Domain Transferability
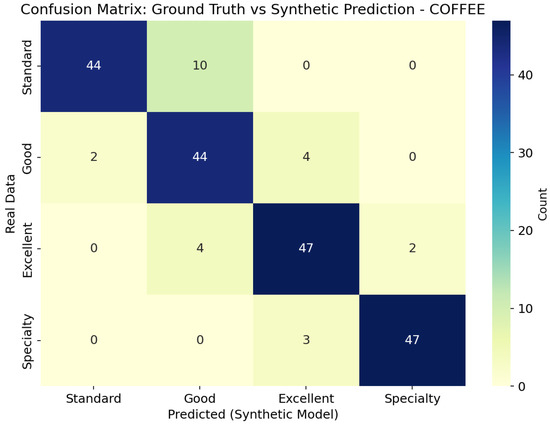
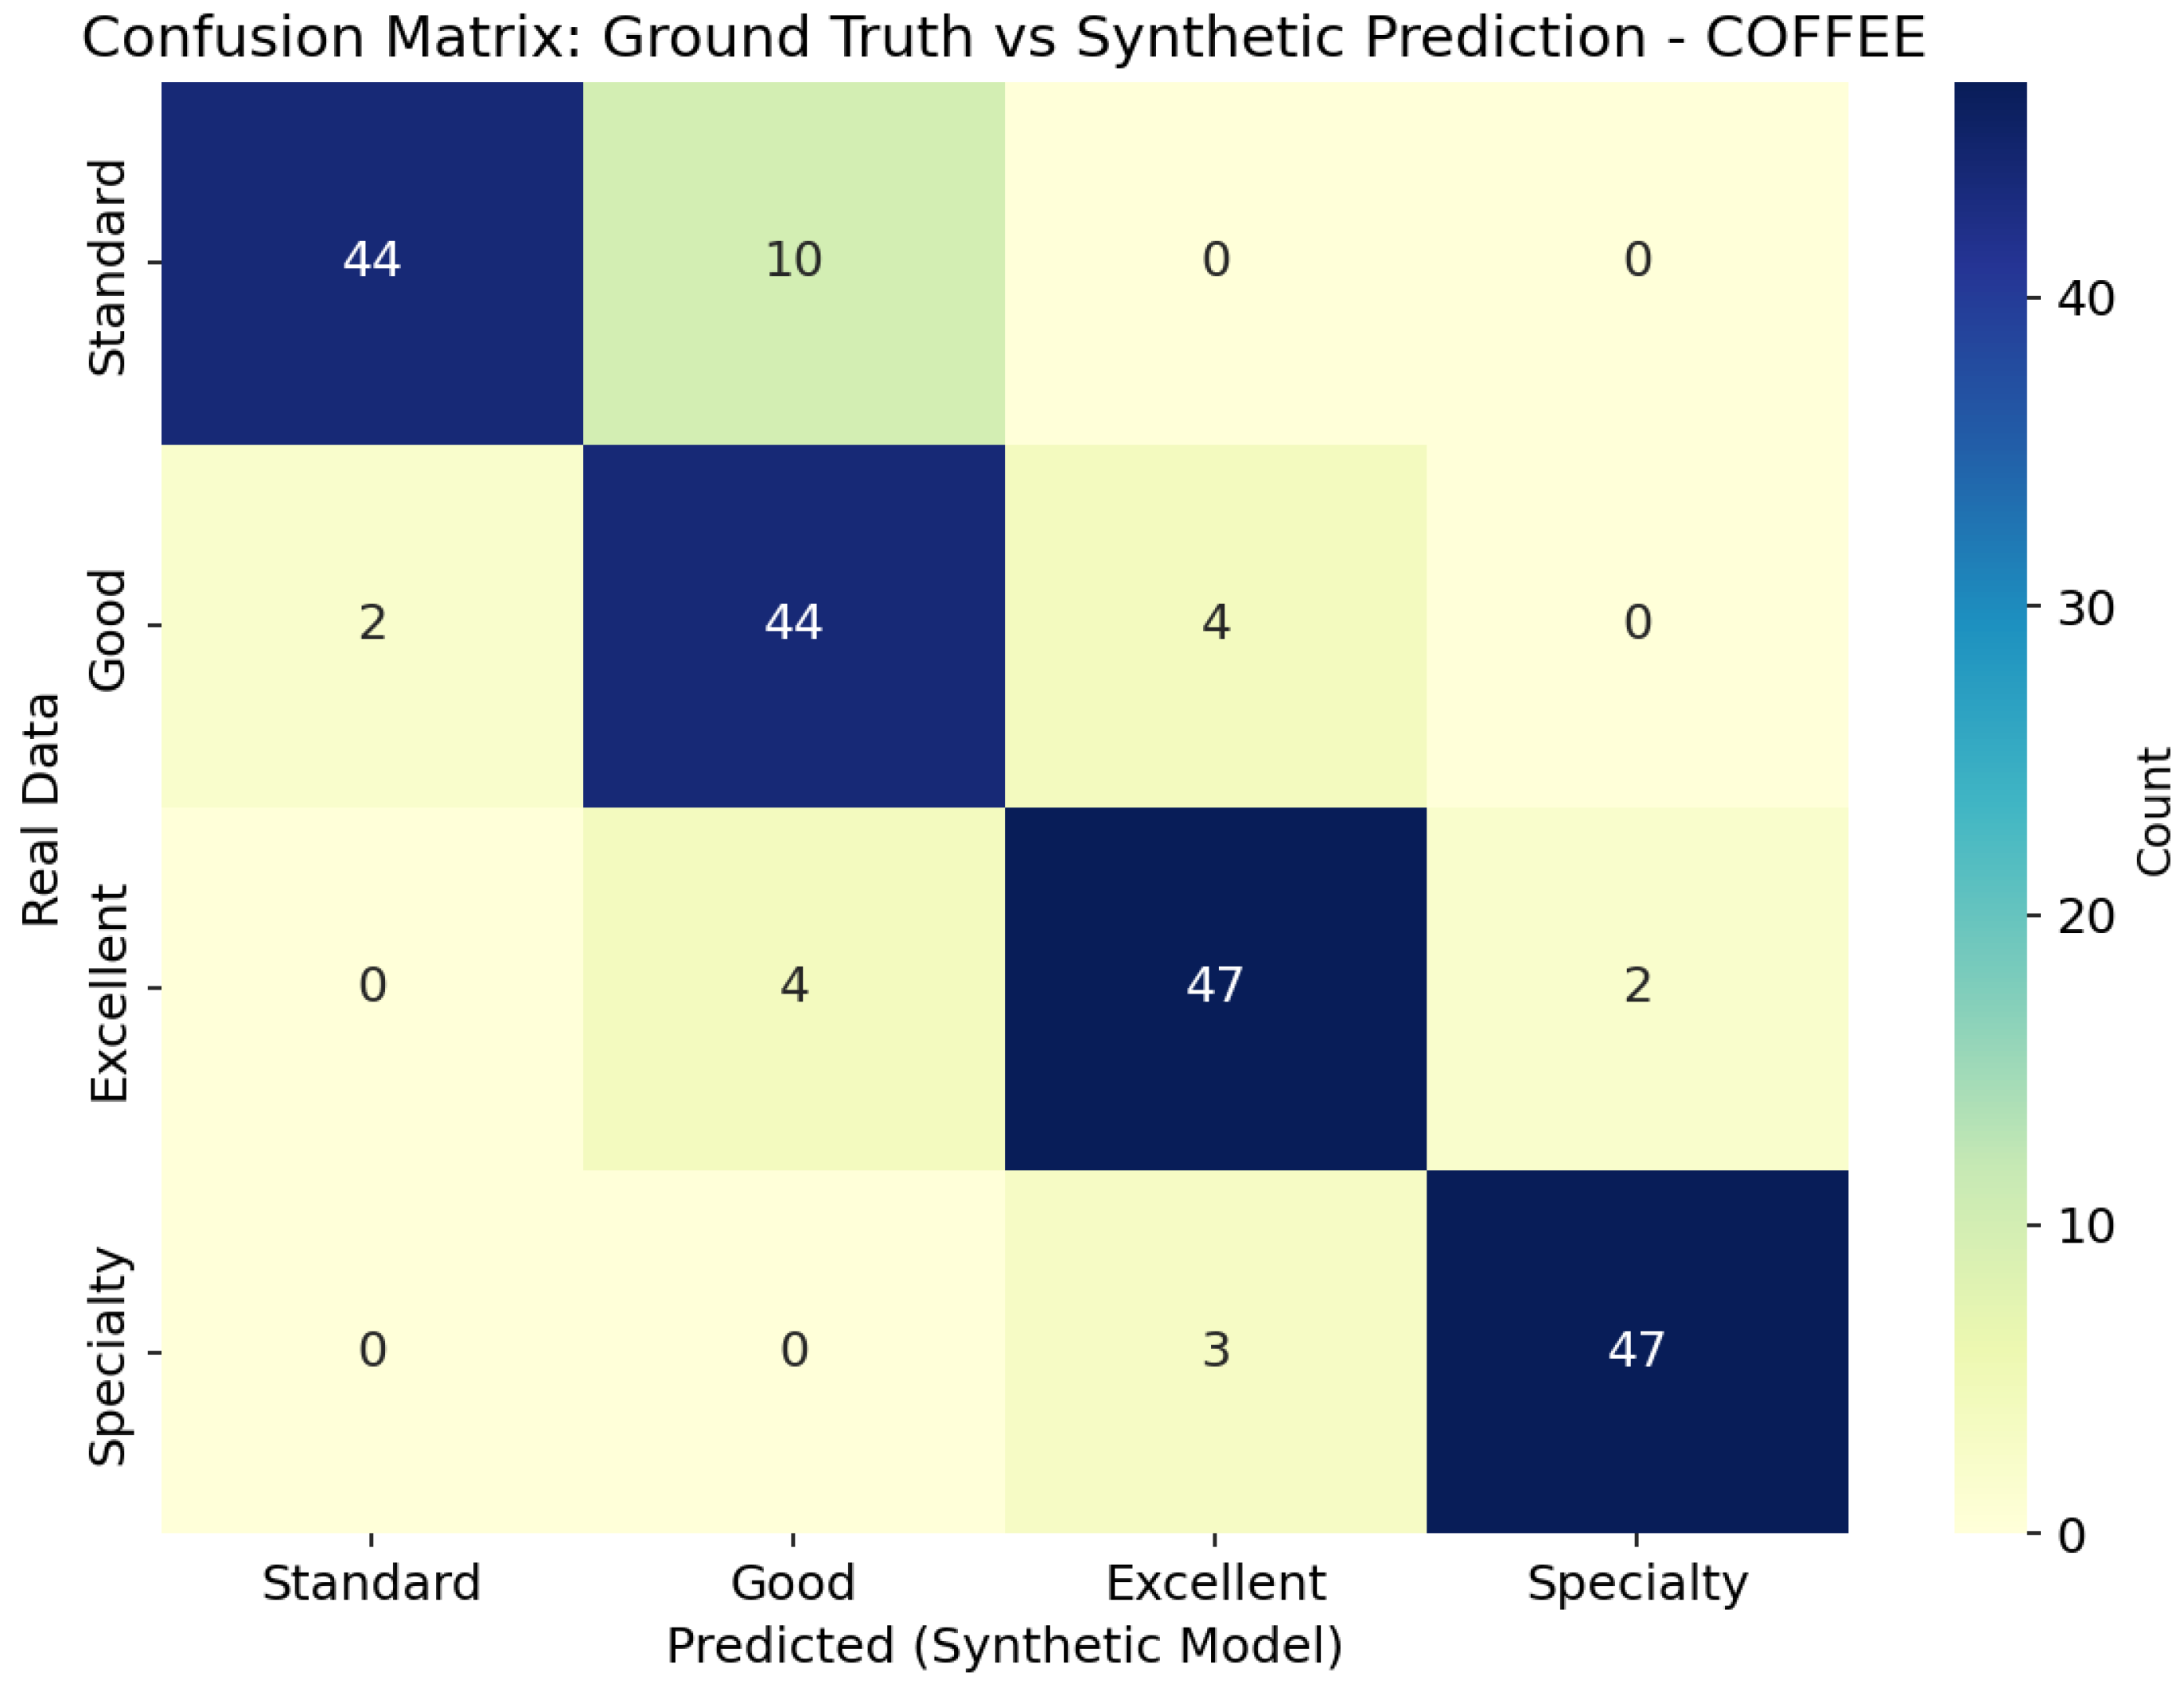
The classification results, summarized in the confusion matrix (Figure 3) and detailed in Table 5, demonstrate robust predictive performance. The model achieved an Overall Accuracy of 87.92%, correctly classifying 182 out of 207 real samples. However, for ordinal quality data, the most critical metric is the Quadratic Weighted Kappa (QWK), which penalizes severe misclassifications (e.g., predicting Specialty for a Standard sample) more heavily than minor errors between adjacent classes. The model achieved a QWK of 0.9502, which is considered an “Excellent” agreement in the literature [30]. This high score confirms that the model successfully captured the ordinal hierarchy of coffee quality, effectively distinguishing the subtle sensory boundaries between commercial and specialty-grade coffees.
Figure 3.
Confusion Matrix: Real-world ground truth vs. predictions from the model trained on synthetic data. Rows represent actual classes; columns represent predicted classes.
Table 5.
Classification performance of the Random Forest model trained on synthetic data and evaluated on real data.
As shown in Table 5, the model demonstrated strong performance across all four quality classes. The Specialty class achieved the highest F1-score (0.95), with precision of 0.96 and recall of 0.94, indicating that the model effectively identified the highest-quality coffees with minimal false positives. The Standard class also showed excellent precision (0.96), though its recall was slightly lower (0.81), suggesting that some Standard coffees were misclassified as higher grades, an expected outcome given the continuum nature of sensory evaluation. The Good and Excellent classes maintained balanced F1-scores of 0.81 and 0.88, respectively, demonstrating consistent performance across intermediate quality tiers.
The confusion matrix reveals that all classification errors were confined to adjacent quality classes, with zero occurrences of extreme misclassifications (e.g., Standard predicted as Specialty or vice versa). This pattern is particularly significant for sensory applications, where the transition between quality categories often represents a continuum rather than discrete jumps. The 10 Standard samples misclassified as Good, the 4 Good samples misclassified as Excellent, and the 4 Excellent samples misclassified as Good reflect the inherent subjectivity and variability in sensory evaluation, further validating that the synthetic-trained model has learned realistic, rather than artificially rigid, decision boundaries.
3.7. XAI Pattern Recovery: Comparing SHAP Feature Importance in Real and Synthetic Domains
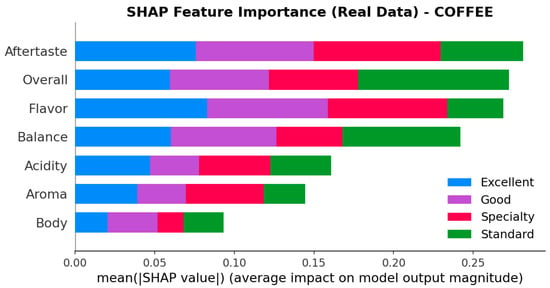
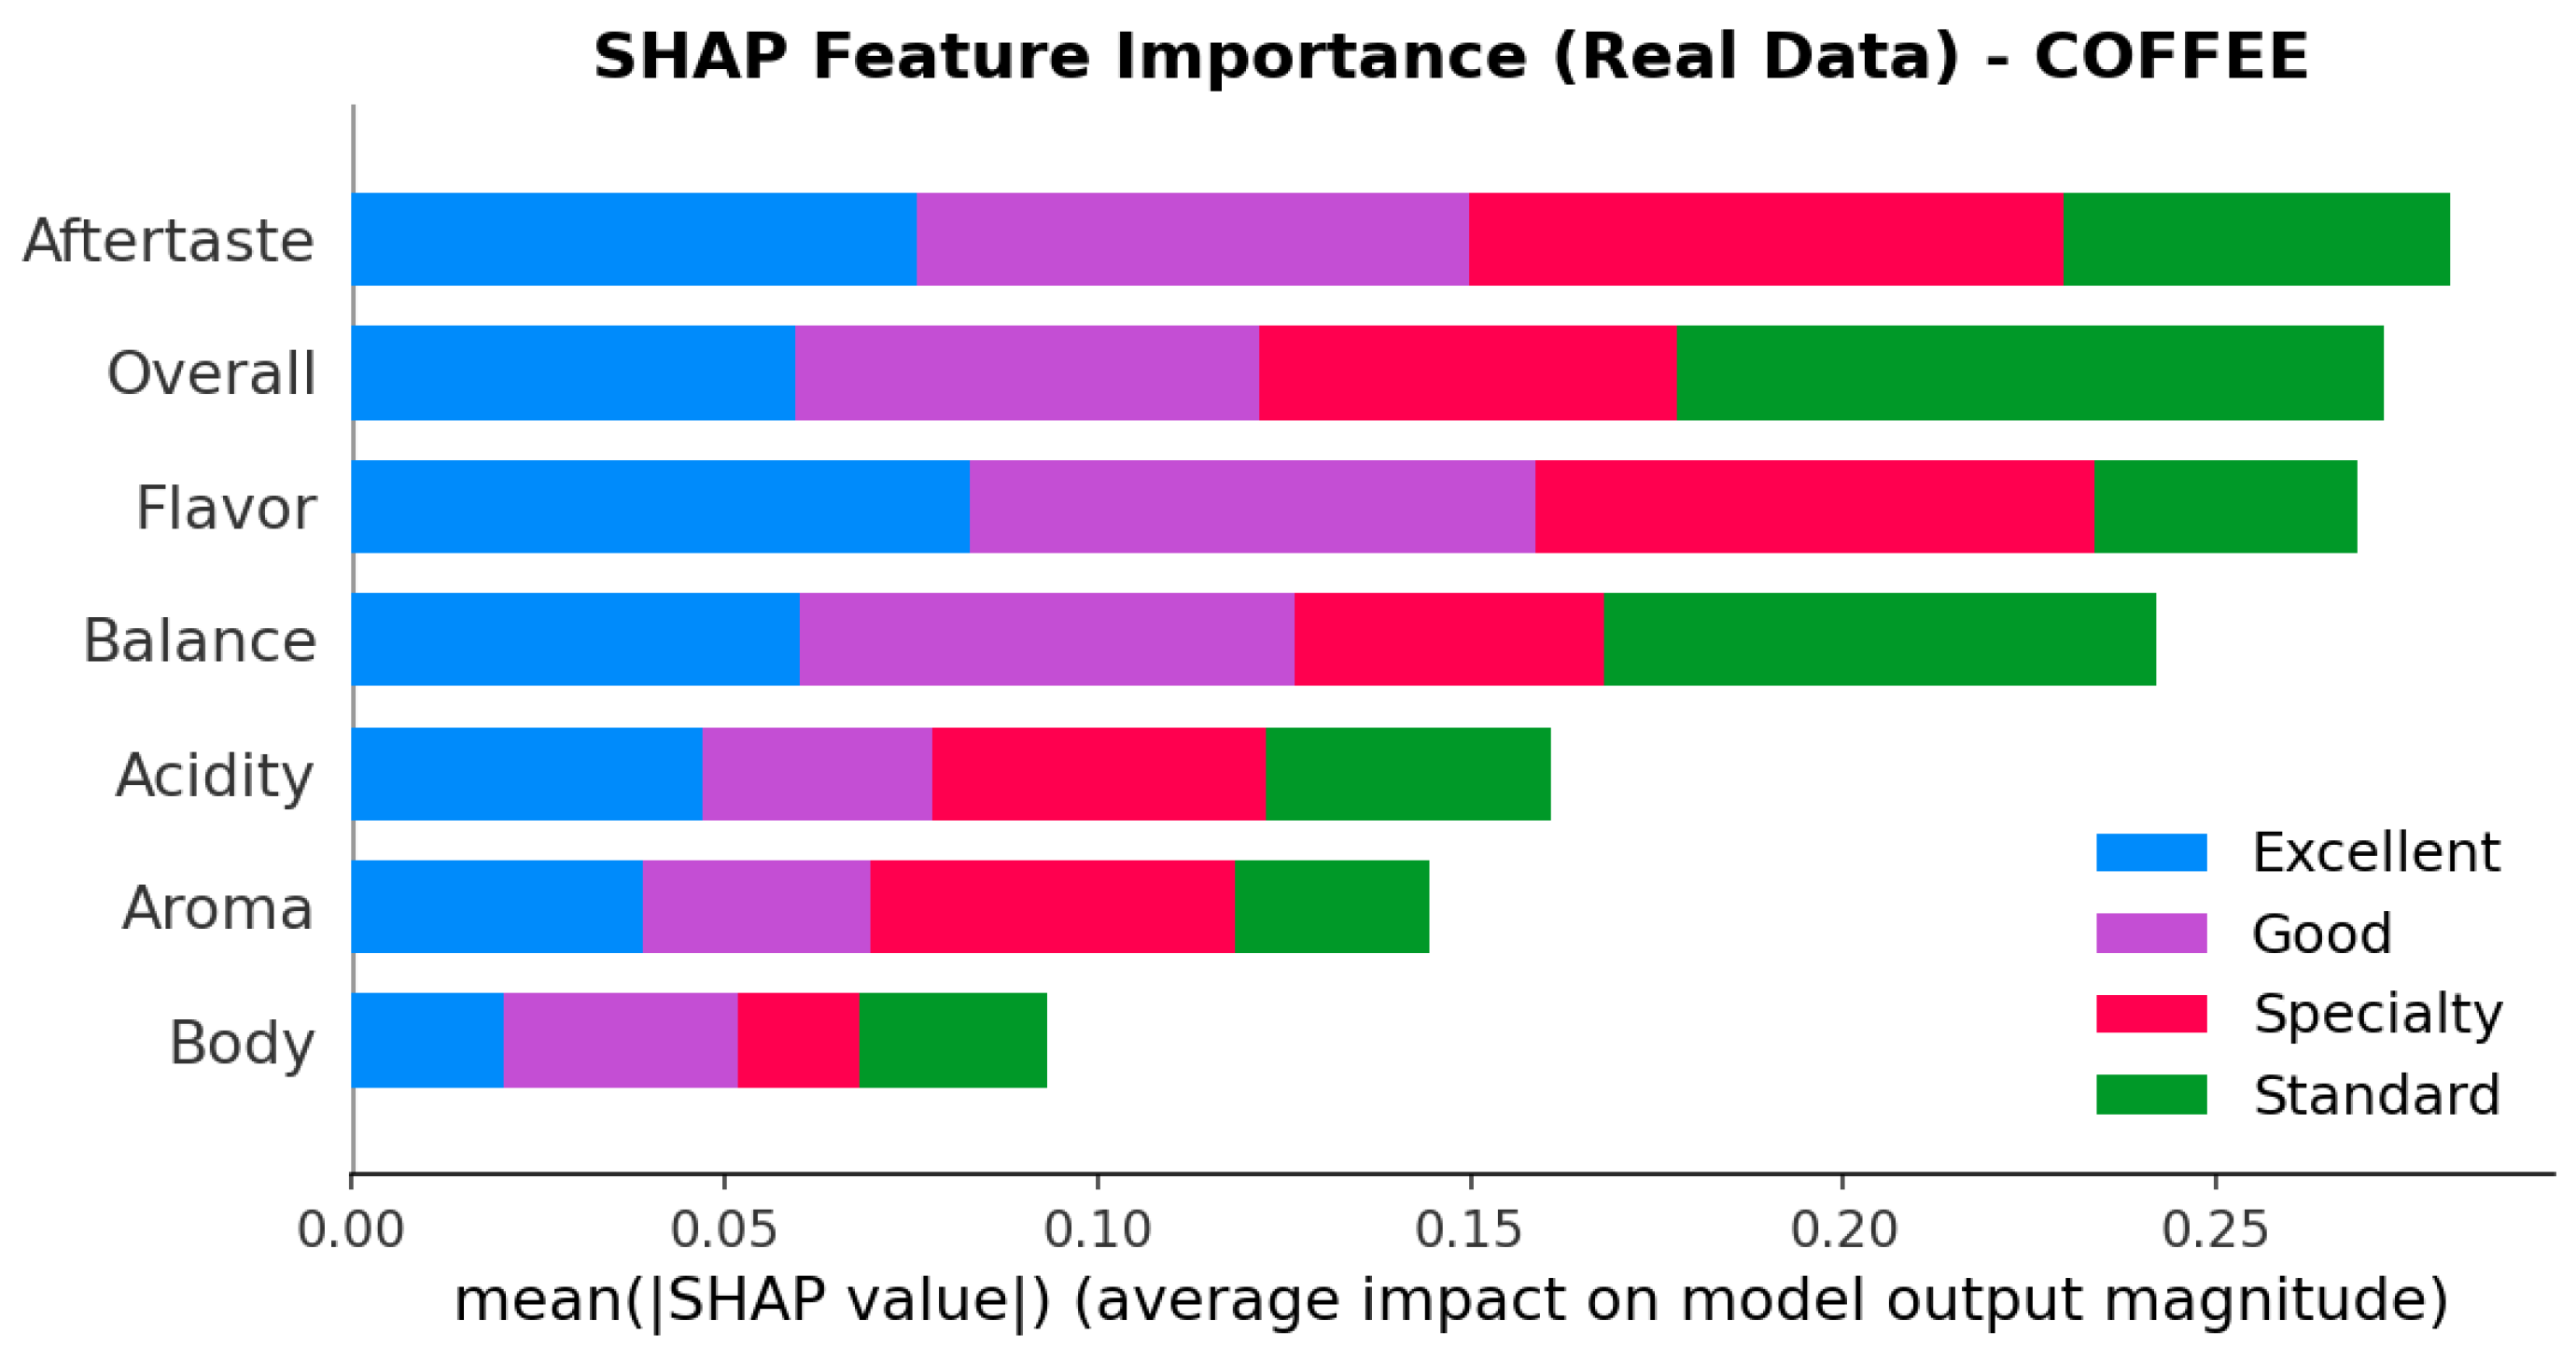
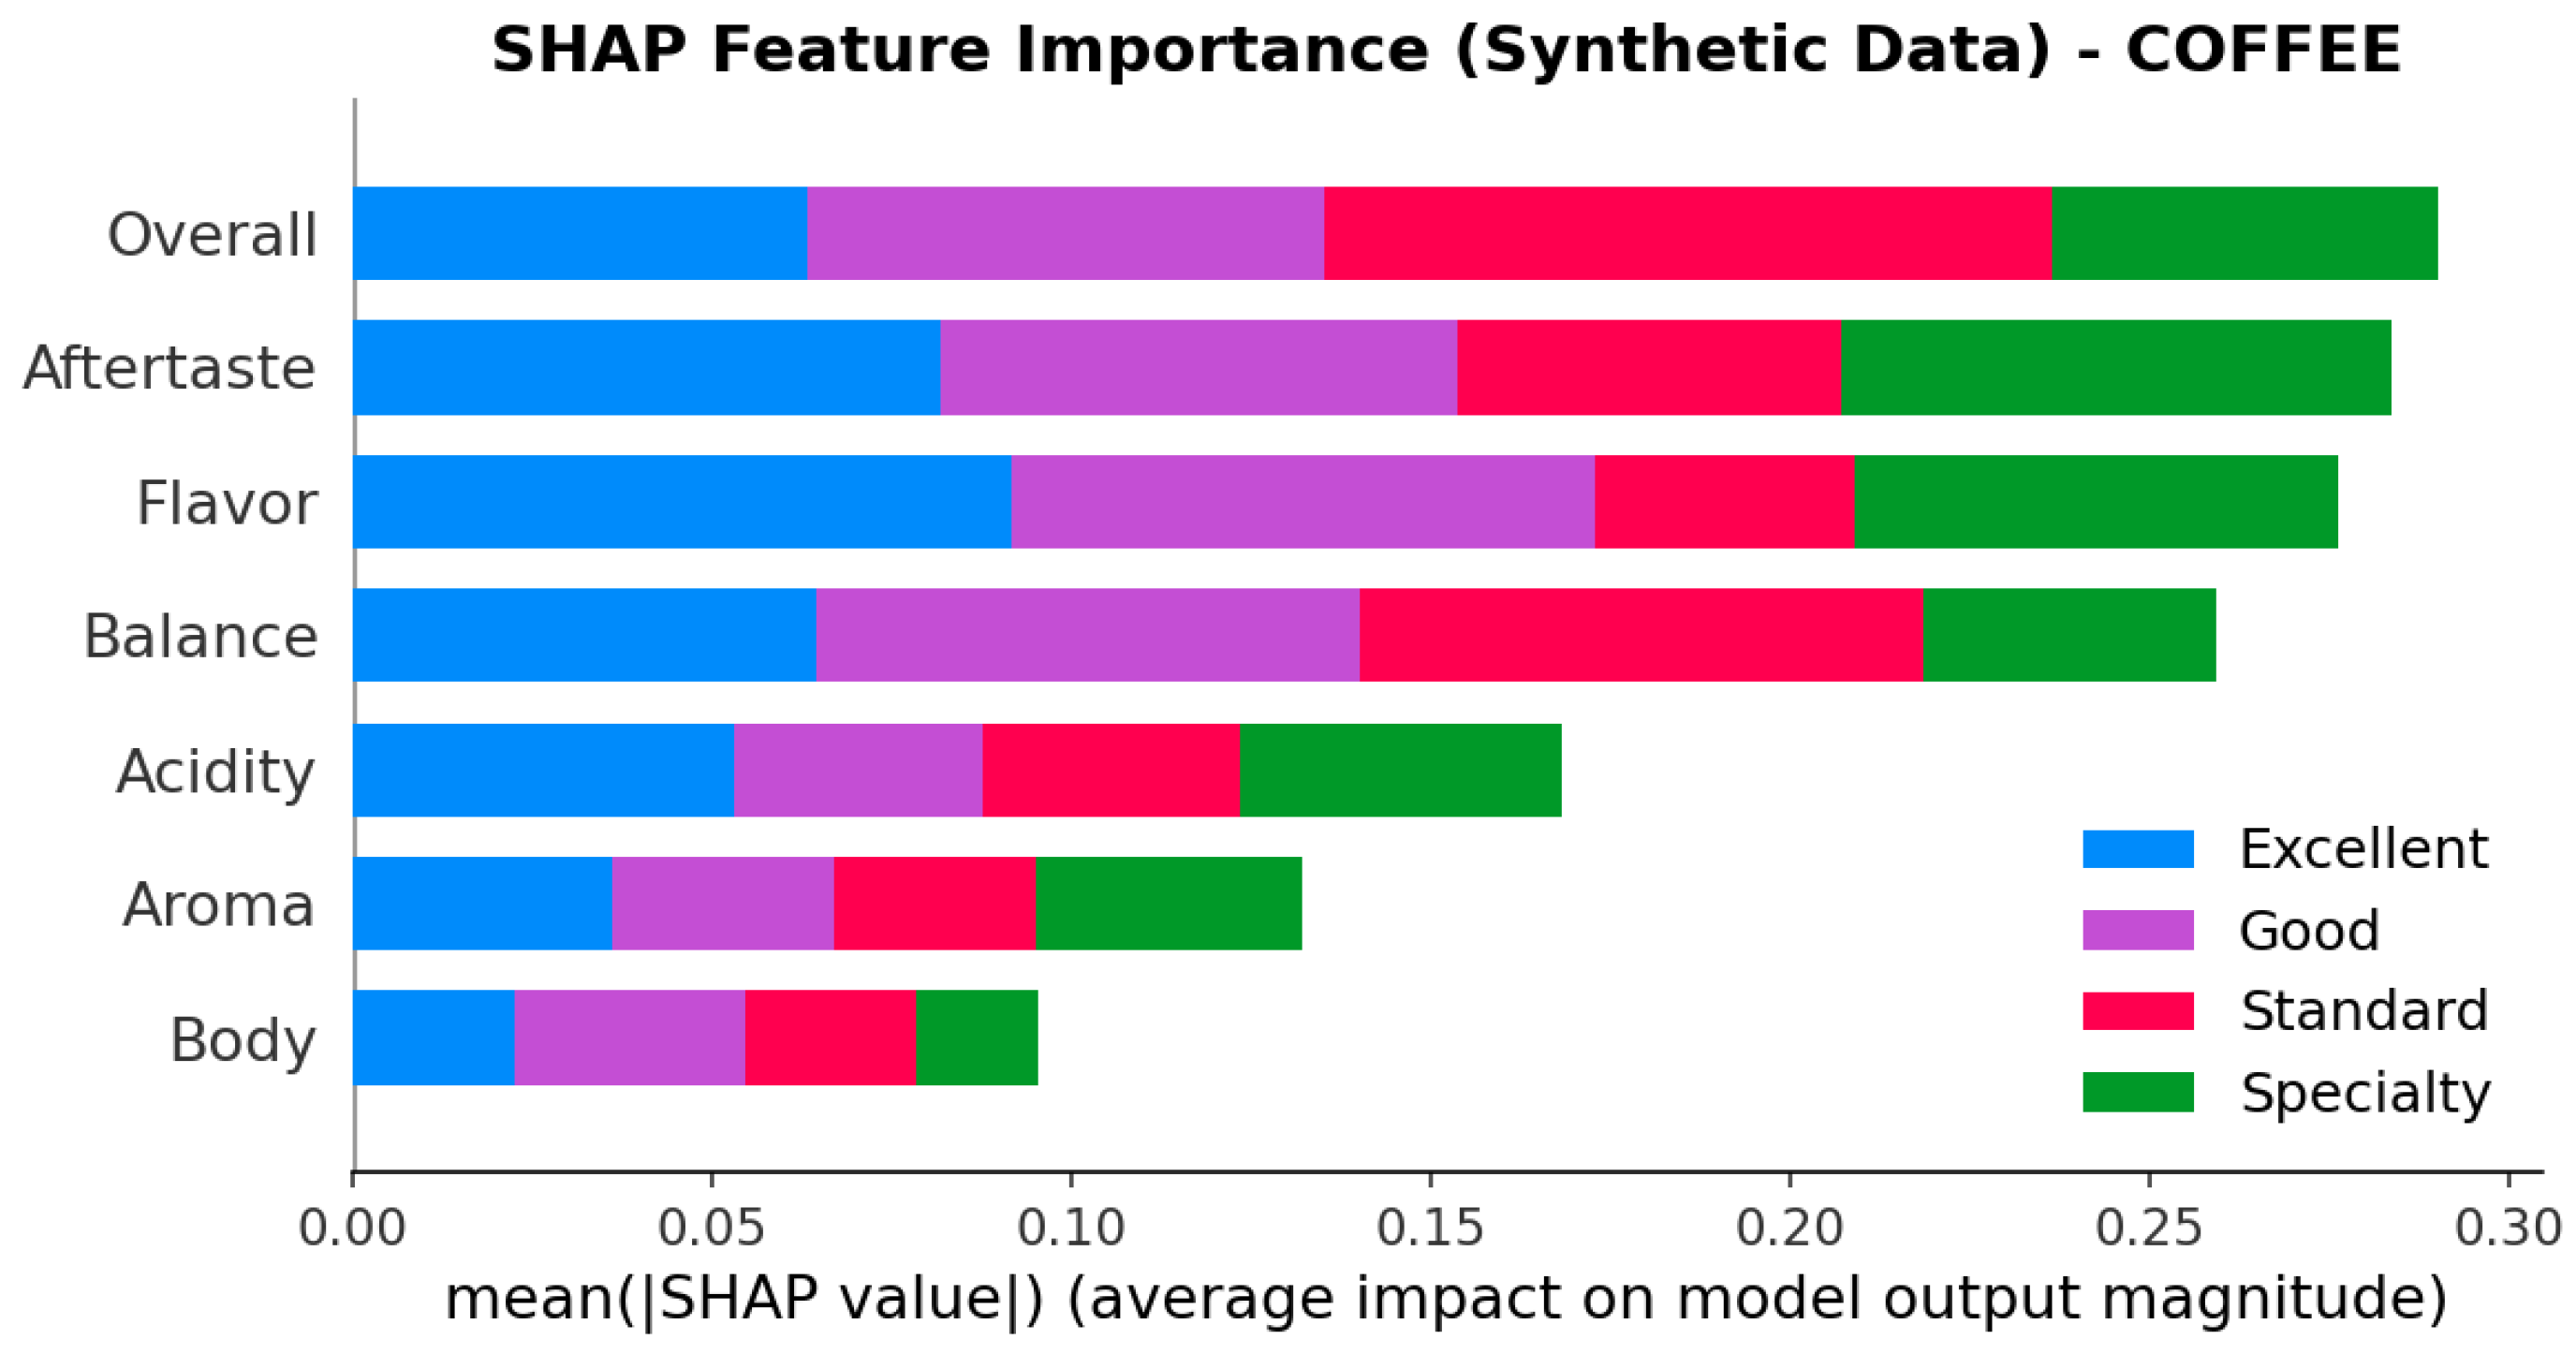
To ensure that the predictive performance was rooted in agronomically and sensorially valid patterns rather than statistical artifacts, an interpretability analysis was conducted using SHAP (SHapley Additive exPlanations). By comparing the feature importance rankings extracted from the real-world CQI dataset (Figure 4) and the synthetic twin (Figure 5), we can validate the model’s decision-making consistency across both domains.
Figure 4.
SHAP Feature Importance (Real Data): Mean absolute impact of sensory attributes on the classification of the four quality tiers.
Figure 5.
SHAP Feature Importance (Synthetic Data): Consistency check showing the attributes prioritized by the model during training in the simulated environment.
A high degree of congruence was observed between the two importance profiles. In both scenarios, Aftertaste, Overall, and Flavor emerged as the top three most influential predictors. In the real dataset, Aftertaste showed the highest average impact on model output magnitude, followed closely by Overall. In the synthetic dataset, these two attributes swapped positions but maintained nearly identical SHAP values (approximately 0.28). This consistency is a definitive proof that the synthetic generation process successfully captured the core sensory drivers of coffee quality.
Furthermore, the contribution of each class (Specialty, Excellent, Good, and Standard) to the total feature importance follows a balanced distribution in both plots. For instance, the “Specialty” class (red/green bars in the legends) is consistently associated with high values in Flavor and Balance in both datasets. Attributes like Body and Aroma were consistently ranked as lower-impact refining factors.
4. Conclusions
This study demonstrated the efficacy of using synthetic data, grounded in empirical statistics and the Pearson correlation structure of a real Arabica coffee (Coffea arabica L.) dataset, to train high-performance ordinal classification models. By employing a comprehensive computational pipeline from statistical profiling and Cholesky-based synthetic data generation to SHAP-driven interpretability analysis, it was established that the synthetic environment faithfully replicates the stochastic properties, interdependencies, and sensory drivers of real-world coffee quality.
The synthetic dataset, comprising 207 samples identical in dimensionality to the original CQI Arabica 2023 dataset, achieved a Kolmogorov–Smirnov similarity of 89.55% with the real data, with 7 out of 8 core sensory features passing the KS test null hypothesis (p > 0.05). The target variable, Total Cup Points, was preserved with high fidelity (real mean: 83.71; synthetic mean: 83.65), confirming that the synthetic generation process captured not only central tendencies but also the variance, skewness, and distributional shape of the empirical data.
The ordinal classification model, trained exclusively on the synthetic dataset and validated against real-world samples, achieved an overall accuracy of 87.92% and a Quadratic Weighted Kappa (QWK) of 0.9502, indicating excellent agreement and confirming the model’s ability to capture the ordinal hierarchy of coffee quality. Significantly, all classification errors were confined to adjacent quality classes, with zero occurrences of extreme misclassifications, reflecting the continuum nature of sensory evaluation.
The SHAP (SHapley Additive exPlanations) analysis further validated the consistency of the synthetic environment by revealing near-identical feature importance rankings between the real and synthetic domains. In both scenarios, Aftertaste, Overall, and Flavor emerged as the top three most influential predictors, with nearly identical SHAP values (approximately 0.28). This congruence confirms that the synthetic generation process successfully preserved the core sensory drivers of coffee quality, validating the ecological validity of the simulated environment.
The methodological framework presented used synthetic data generation grounded in empirical statistics, cross-domain validation, and interpretability analysis provided a robust template for addressing the challenges of limited sample sizes and data variability in agricultural and food science research. By demonstrating that models trained on synthetic data can generalize effectively to real-world observations, this study provides empirical evidence for the practical utility of synthetic data in domains where empirical data collection is costly, time-consuming, or subject to high noise levels.
Future work should extend this approach to other coffee varieties and growing regions, incorporate additional sensory attributes, and explore the integration of environmental and processing variables.
Author Contributions
Conceptualization, L.C.B.J. and C.S.A.G.S.; Methodology, L.C.B.J., C.S.A.G.S. and O.L.L.; Software, L.C.B.J.; Validation, L.C.B.J. and C.S.A.G.S.; Investigation, O.L.L.; Writing—original draft, L.C.B.J. and C.S.A.G.S.; Writing—review & editing, O.L.L., E.T.d.A. and R.R.M.; Supervision, E.T.d.A. and R.R.M.; Funding acquisition, R.R.M. All authors have read and agreed to the published version of the manuscript.
Funding
The research is supported by Coordination for the Improvement of Higher Education Personnel (CAPES) and National Council for Scientific and Technological Development (CNPq).
Institutional Review Board Statement
Not applicable.
Informed Consent Statement
Not applicable.
Data Availability Statement
The complete code and datasets are publicly available at https://github.com/zolpy/scientific_article_0020 (accessed on 6 July 2026), ensuring full reproducibility and facilitating further research in this area.
Conflicts of Interest
The authors declare no conflicts of interest.
References
- Vaast, P.; Bertrand, B.; Perriot, J.-J.; Guyot, B.; Génard, M. Fruit thinning and shade improve bean characteristics and beverage quality of coffee (Coffea arabica L.) under optimal conditions. J. Sci. Food Agric. 2006, 86, 97–204. [Google Scholar] [CrossRef] [Scilit]
- Peng, Y.; Roell, Y.E.; Odgers, N.P.; Møller, A.B.; Beucher, A.; Greve, M.B.; Greve, M.H. Mapping and describing natural terroir units in Denmark. Geoderma 2021, 394, 115014. [Google Scholar] [CrossRef] [Scilit]
- Sarmento, C.S.A.G.; Lemos, O.L.; Boffo, E.F.; Matsumoto, S.N.; Castro, I.T.P.; Alvarenga, Y.A. Relations between Sensory Quality and Spectral Indices in Brazilian Arabica Coffees. An. Acad. Bras. Ciênc. 2025, 97, e20240921. [Google Scholar] [CrossRef] [Scilit] [PubMed]
- Toci, A.T.; De Moura Ribeiro, M.V.; De Toledo, P.R.A.B.; Boralle, N.; Pezza, H.R.; Pezza, L. Fingerprint and authenticity of roasted coffees by H-NMR: The Brazilian coffee case. Food Sci. Biotechnol. 2018, 27, 19–26. [Google Scholar] [CrossRef] [Scilit] [PubMed]
- Goodfellow, I.; Bengio, Y.; Courville, A. Deep Learning; Adaptive Computation and Machine Learning Series; The MIT Press: Cambridge, MA, USA, 2016; ISBN 978-0262035613. [Google Scholar]
- Nikolenko, S.I. Synthetic Data for Deep Learning. arXiv 2019, arXiv:1909.11512. [Google Scholar] [CrossRef] [Scilit]
- Achterberg, J.; van Dijk, B.; Ul Islam, S.; Epiphaniou, G.; Maple, C.; Haas, M.; Spruit, M. Metrics That Matter: A Practical Survey on Synthetic Data Evaluation. Eng. Arch. Prepr. 2026. [Google Scholar] [CrossRef] [Scilit] [PubMed]
- Olesya Slonce. DF Arabica Clean 2023. Kaggle. Available online: https://www.kaggle.com/datasets/olesyaslonce/df-arabica-clean-2023 (accessed on 6 July 2026).
- Min, X.; Ye, Y.; Xiong, S.; Chen, X. Computer Vision Meets Generative Models in Agriculture: Technological Advances, Challenges and Opportunities. Appl. Sci. 2025, 15, 7663. [Google Scholar] [CrossRef] [Scilit]
- Perez-Montes, F.; Olivares-Mercado, J.; Sanchez-Perez, G.; Benitez-Garcia, G.; Prudente-Tixteco, L.; Lopez-Garcia, O. Analysis of Real-Time Face-Verification Methods for Surveillance Applications. J. Imaging 2023, 9, 21. [Google Scholar] [CrossRef] [Scilit] [PubMed]
- Afonso, M.; Giufrida, V. Editorial: Synthetic data for computer vision in agriculture. Front. Plant Sci. 2023, 14, 1277073. [Google Scholar] [CrossRef] [Scilit] [PubMed]
- Nowok, B.; Raab, G.M.; Dibben, C. synthpop: Bespoke creation of synthetic data in R. J. Stat. Softw. 2016, 74, 1–26. [Google Scholar] [CrossRef] [Scilit]
- Lingle, T.R. The Coffee Cupper’s Handbook: A Systematic Guide for Coffee Professionals; Specialty Coffee Association of America: Irvine, CA, USA, 2001. [Google Scholar]
- Specialty Coffee Association. SCA Protocols: Cupping Specialty Coffee; Specialty Coffee Association: Irvine, CA, USA, 2021; Available online: https://sca.coffee/ (accessed on 6 July 2026).
- Lundberg, S.M.; Lee, S.I. A unified approach to interpreting model predictions. In Advances in Neural Information Processing Systems; Curran Associates, Inc.: Red Hook, NY, USA, 2017; Volume 30, pp. 4765–4774. [Google Scholar]
- Pearson, K. Note on regression and inheritance in the case of two parents. Proc. R. Soc. Lond. 1895, 58, 240–242. [Google Scholar] [CrossRef] [Scilit]
- Anderson, T.W. An Introduction to Multivariate Statistical Analysis, 3rd ed.; Wiley Series in Probability and Statistics; Wiley-Interscience: Hoboken, NJ, USA, 2003; ISBN 978-0471360919. [Google Scholar]
- Golub, G.H.; Van Loan, C.F. Matrix Computations, 4th ed.; Johns Hopkins Studies in the Mathematical Sciences; Johns Hopkins University Press: Baltimore, MD, USA, 2013; ISBN 978-1-4214-0794-4. [Google Scholar]
- Cholesky, A.L. On the numerical solution of systems of linear equations. Bull. Soc. Ingénieurs Civ. Fr. 1924, 76, 147–153. [Google Scholar] [CrossRef] [Scilit]
- Hastie, T.; Tibshirani, R.; Friedman, J. The Elements of Statistical Learning: Data Mining, Inference, and Prediction, 2nd ed.; Springer Series in Statistics; Springer: Berlin/Heidelberg, Germany, 2009; ISBN 978-0-387-84857-0. [Google Scholar]
- Drechsler, J. Synthetic Datasets for Statistical Disclosure Control: Theory and Implementation; Lecture Notes in Statistics; Springer: Berlin/Heidelberg, Germany, 2011; Volume 201, ISBN 978-1-4614-0325-8. [Google Scholar]
- Massey, F.J. The Kolmogorov-Smirnov test for goodness of fit. J. Am. Stat. Assoc. 1951, 46, 68–78. [Google Scholar] [CrossRef] [Scilit]
- Lin, J. Divergence measures based on the Shannon entropy. IEEE Trans. Inf. Theory 1991, 37, 145–151. [Google Scholar] [CrossRef] [Scilit]
- Breiman, L. Random forests. Mach. Learn. 2001, 45, 5–32. [Google Scholar] [CrossRef] [Scilit]
- Willmott, C.J.; Matsuura, K. Advantages of the Mean Absolute Error (MAE) over the Root Mean Square Error (RMSE) in Assessing Average Model Performance. Clim. Res. 2005, 30, 79–82. [Google Scholar] [CrossRef] [Scilit]
- McKinney, W. Data structures for statistical computing in Python. In Proceedings of the 9th Python in Science Conference, Austin, TX, USA, 28 June–3 July 2010; pp. 56–61. [Google Scholar] [CrossRef] [Scilit]
- Pedregosa, F.; Varoquaux, G.; Gramfort, A.; Michel, V.; Thirion, B.; Grisel, O.; Blondel, M.; Prettenhofer, P.; Weiss, R.; Dubourg, V.; et al. Scikit-learn: Machine learning in Python. J. Mach. Learn. Res. 2011, 12, 2825–2830. [Google Scholar]
- Cohen, J. Weighted kappa: Nominal scale agreement with provision for scaled disagreement or partial credit. Psychol. Bull. 1968, 70, 213–220. [Google Scholar] [CrossRef] [Scilit] [PubMed]
- Fleiss, J.L.; Levin, B.; Paik, M.C. Statistical Methods for Rates and Proportions, 3rd ed.; Wiley Series in Probability and Statistics; Wiley-Interscience: Hoboken, NJ, USA, 2003; ISBN 978-0-471-52629-2. [Google Scholar]
- Landis, J.R.; Koch, G.G. The measurement of observer agreement for categorical data. Biometrics 1977, 33, 159–174. [Google Scholar] [CrossRef] [Scilit] [PubMed]
- Lundberg, S.M.; Lee, S.I. A Unified Approach to Interpreting Model Predictions. In Proceedings of the 31st International Conference on Neural Information Processing Systems, NIPS’17; Curran Associates Inc.: Red Hook, NY, USA, 2017; pp. 4768–4777. ISBN 9781510860964. [Google Scholar]
- Lundberg, S.M.; Erion, G.; Chen, H.; DeGrave, A.; Prutkin, J.M.; Nair, B.; Katz, R.; Himmelfarb, J.; Bansal, N.; Lee, S.I. From local explanations to global understanding with explainable AI for trees. Nat. Mach. Intell. 2020, 2, 56–67. [Google Scholar] [CrossRef] [Scilit] [PubMed]
- Rankin, D.; Black, M.; Bond, R.; Wallace, J.; Mulvenna, M.; Epelde, G. Reliability of Supervised Machine Learning Using Synthetic Data in Health Care: Model to Preserve Privacy for Data Sharing. JMIR Med. Inform. 2020, 8, e18910. [Google Scholar] [CrossRef] [Scilit] [PubMed]
- Toledo, P.R.A.B.; Pezza, L.; Pezza, H.R.; Toci, A.T. Relationship Between the Different Aspects Related to Coffee Quality and Their Volatile Compounds. Compr. Rev. Food Sci. Food Saf. 2016, 15, 705–719. [Google Scholar] [CrossRef] [Scilit] [PubMed]

Disclaimer/Publisher’s Note: The statements, opinions and data contained in all publications are solely those of the individual author(s) and contributor(s) and not of MDPI and/or the editor(s). MDPI and/or the editor(s) disclaim responsibility for any injury to people or property resulting from any ideas, methods, instructions or products referred to in the content. |
© 2026 by the authors. Licensee MDPI, Basel, Switzerland. This article is an open access article distributed under the terms and conditions of the Creative Commons Attribution (CC BY) license.