


Abstract
The broiler industry plays a crucial role in global food security and faces sustainability challenges that drive research aimed at assessing the environmental impacts of production. In this context, the objective of this study was to evaluate the environmental performance of different growth stages of broiler chickens in a Brazilian poultry industry. The analysis followed the Life Cycle Assessment (LCA) methodology and the ReCiPe 2016—Midpoint H calculation method. The data used were primary, provided by a company in the sector, and secondary, obtained from the Ecoinvent 3 inventory database. SimaPro version 9.5 software was used to perform the LCA analyses, with a functional unit of 1 kg of live broiler chicken and a system boundary at the farm gate. The results revealed that, at all stages, freshwater ecotoxicity had the greatest environmental impact, linked to the production of feed ingredients such as soybean and corn grains and crude soybean oil. Across the entire chain, the global warming potential value was 1.69 kg CO2-eq, with the final fattening stage showing the worst environmental performance. The study contributes to quantifying environmental performance and identifying critical inputs associated with environmental burdens in broiler production systems, providing evidence to support environmental management and sustainability assessment in poultry production.
1. Introduction
Food production is increasingly challenged by the need to meet growing global demand while reducing pressure on natural resources and mitigating environmental impacts [1,2]. Among livestock sectors, poultry production plays a key role in food security due to its high feed efficiency, short production cycle, and relatively lower environmental footprint compared with other animal protein systems [3,4]. Brazil is one of the world’s largest producers and the leading exporter of chicken meat, with annual production exceeding 14 million tons [5]. Despite its productive efficiency, poultry farming contributes to greenhouse gas emissions, nutrient losses, and environmental pressures associated with feed production and resource consumption [6].
Improving the environmental performance of poultry systems has become increasingly important as demand for animal protein continues to rise [7]. Feed production is frequently identified as one of the main environmental hotspots in poultry supply chains, particularly due to the cultivation of soybean and corn-based ingredients [8,9]. In this context, Life Cycle Assessment (LCA) has become one of the most widely used methodologies for quantifying environmental impacts, identifying hotspots, and supporting sustainability-oriented decision-making throughout agri-food systems [10,11,12].
Although numerous LCA studies have evaluated poultry production systems, most analyses focus on aggregated production stages or complete supply chains. Comparatively fewer studies have investigated environmental impacts separately across broiler fattening phases, limiting the identification of stage-specific hotspots and opportunities for targeted environmental improvements [13]. This limitation is particularly relevant in Brazil, where large-scale and highly integrated poultry production systems are strongly connected to grain-based feed supply chains.
Therefore, this study evaluates the environmental performance of four broiler fattening phases in a Brazilian poultry production system using Life Cycle Assessment. The objective is to identify the main environmental impact categories and the key inputs responsible for environmental burdens throughout the broiler growth cycle. By examining impacts at each fattening stage, the study contributes to a more detailed understanding of environmental hotspot distribution in large-scale poultry production systems and supports the development of more efficient environmental management strategies.
2. Performance Management in Agribusiness and the Poultry Industry
According to Surya et al. [14], agribusiness is characterized by the interconnection between acquisition, processing, distribution, and marketing of products originating from farms or agro-industries, encompassing sectors such as food crops, horticulture, livestock, plantations, family industries, and small-scale trade. This system constitutes a central element of industrial development, structured based on the agricultural conditions and potentials of rural areas, and involves complex exchanges of materials among producers, processors, consumers, and waste management systems, including fertilization, feed production, animal nutrition, and bioenergy [15].
Agribusiness management faces multiple challenges. Globalization has intensified the complexity of agricultural supply chains, composed of networks of suppliers, distributors, and retailers, each with its own regulations and specific requirements [16,17]. Another relevant challenge is commodity price volatility, which directly impacts profitability and complicates strategic forecasting [18,19]. In addition, environmental factors, such as climate change and extreme events, affect the availability and cost of inputs [20]. Although technological advances can increase productivity and efficiency, their adoption involves high investment costs, requiring careful analyses of the feasibility of integrating them into operations [21].
In the poultry sector, broiler production has undergone a process of specialization and vertical integration since the 1950s [22]. The production chain includes breeders, hatcheries, grow-out farms, slaughterhouses, wholesalers, and retailers [23]. Initially, breeders produce eggs for incubation, generating day-old chicks that are sent to farms, where they are fattened until reaching the average market weight of approximately 2 kg, between the fifth and seventh weeks of life [13]. After slaughter, the meat is directed to distribution and marketing. In vertically integrated systems, companies provide chicks, feed, medication, and transport, while independent producers handle the rearing [22].
Efficient management involves attention to health, welfare, and legislation [24], as well as the adoption of strict biosecurity protocols to prevent high-impact diseases such as coccidiosis and colibacillosis [25,26]. Critical factors include stocking density, which directly influences profitability and unit costs. While higher densities may reduce fixed costs per bird, excessive density leads to stress, health problems, and lower meat quality [24].
Another essential element is litter management; litter, composed of absorbent material mixed with manure, serves to reduce moisture and pathogen exposure [27]. Excessive moisture increases the proliferation of harmful microorganisms, impairs weight gain, and raises the incidence of footpad dermatitis [28,29,30]. Additionally, litter is a significant source of ammonia emissions, whose release depends on factors such as temperature, pH, and nitrogen content [31].
Feed accounts for approximately 70% of total production costs and varies according to growth phases [13]. Feed efficiency, measured as the ratio between feed intake and weight gain, is crucial for competitiveness and sustainability [32]. In recent decades, genetic, nutritional, and technological advances have reduced the time required to reach market weight from 12 weeks in the 1960s to less than six weeks today [33].
Thermal stress, especially in tropical and subtropical regions, remains a significant challenge. The absence of sweat glands makes birds vulnerable to high temperatures, affecting feed consumption, growth, and survival [34,35]. Measures such as proper ventilation and thermal insulation of poultry houses are essential to minimize losses [36].
In Brazil, broiler production has established itself as a strategic activity for agribusiness, with a strong presence in both domestic and international markets. Productivity gains are associated with improvements in feed conversion, genetics, automation, and management [37]. However, the sector still faces the challenge of balancing economic growth and sustainability, given impacts such as ammonia and nitrous oxide emissions and intensive use of natural resources [38].
In this context, sustainability engineering emerges as a strategic approach to integrate social, environmental, and economic dimensions throughout the product life cycle [39]. In the poultry sector, it contributes to Sustainable Development Goals (SDGs) such as SDG 2 (zero hunger and sustainable agriculture) and SDG 8 (decent work and economic growth), but it must also mitigate adverse effects on SDGs such as SDG 13 (climate action) and SDG 15 (life on land) [40,41].
Life Cycle Assessment (LCA) is one of the main methodologies used to quantify the environmental impacts of production systems [42,43]. By considering all stages—from input production to final distribution—LCA allows the identification of critical points and opportunities for improvement, guiding decision-making and the adoption of more sustainable practices. Therefore, in Brazilian poultry farming, its application is essential to reconcile competitiveness, production efficiency, and environmental preservation.
3. Life Cycle Assessment and Broiler Production
The increasing limitation of the environment’s capacity to absorb the impacts of human activities has led to the more systematic incorporation of environmental issues into decision-making processes across economic, political, and industrial spheres. In this context, Life Cycle Assessment (LCA) has emerged as an essential methodology, developed from the need to understand and mitigate environmental impacts associated with products, from their conception to final disposal [44,45].
LCA adopts a “cradle-to-grave” perspective, considering all phases of a product’s life cycle: raw material extraction, manufacturing, use, and end-of-life disposal. Its analysis categories include impacts on ecosystems, use of natural resources, and human health [46,47]. The main difference compared to other environmental assessment methods lies in the direct relationship between product functionality and environmental performance, i.e., in the quantification of emissions and resource use based on the function performed [44].
Bjørn et al. [48] highlight four fundamental characteristics of LCA. The first is the life-cycle perspective, compared to the biological cycle of living beings: a product, like an organism, has a beginning, growth, and end, passing through resource extraction, manufacturing, use, and waste management. Recycling and reuse processes, in turn, generate new life cycles. This holistic view prevents the transfer of impacts between stages, allowing the identification of adverse effects in phases not initially targeted. Although widely applied to physical products, the methodology can also be used for analyzing complex systems, such as energy chains, transportation, waste management, and urban infrastructure.
The second characteristic is the comprehensive scope of environmental impacts. LCA considers up to 15 indicator categories, including climate change, freshwater use, land occupation and transformation, aquatic eutrophication, human health toxicity, depletion of non-renewable resources, and chemical ecotoxicity. The use of multiple indicators is essential to avoid the mitigation of one impact from causing an inadvertent increase in another. A classic example is replacing fossil fuels with biofuels: although it reduces greenhouse gas emissions during use, it may cause negative impacts during harvesting and extraction, such as increased water scarcity and soil degradation.
The third characteristic is the quantitative nature of LCA, which allows objective comparisons between products, processes, or production systems. The method is structured in two stages: first, an inventory of all emissions and resource uses is carried out; then, these data feed mathematical cause-and-effect models that convert measured flows into consolidated environmental indicators [48]. This approach reduces data complexity to a set of comparable indicators, allowing prioritization of corrective actions and improvements.
The fourth characteristic is its scientific basis. LCA relies on direct measurements, such as records of water consumption or emissions in industrial environments, as well as mass and energy balances. The models used to associate emissions with environmental impacts are based on proven causal relationships. Nevertheless, practical application of the methodology requires value judgments, especially when weighting indicators or defining temporal horizons for impact consideration [48].
International standardization of LCA is conducted by the International Organization for Standardization (ISO), which establishes guidelines for methodology application and interpretation. The ISO 14000 [49] series defines guidelines for environmental management systems, with ISO 14040:2006 [46] as the main standard for structuring LCA. Complementary standards, such as ISO 14044:2006 [50], detail the phases of inventory, impact assessment, and interpretation, replacing previous versions (ISO 14041, 14042, and 14043 [51,52,53]). Other specific standards include ISO 14046:2014 [54], focused on assessing the water footprint of products, processes, and organizations.
Therefore, LCA has established itself as a strategic tool to support sustainable decision-making across sectors, enabling the identification of critical points, comparison of alternatives, and integration of environmental variables into planning and operational processes. By combining a comprehensive perspective with scientific rigor and international standardization, the methodology helps align environmental, economic, and social objectives, mitigating risks and promoting more responsible production practices.
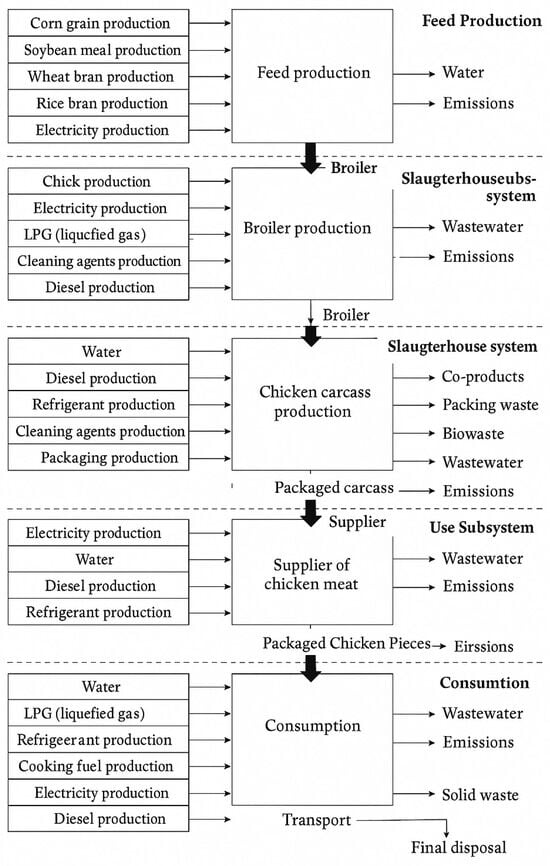
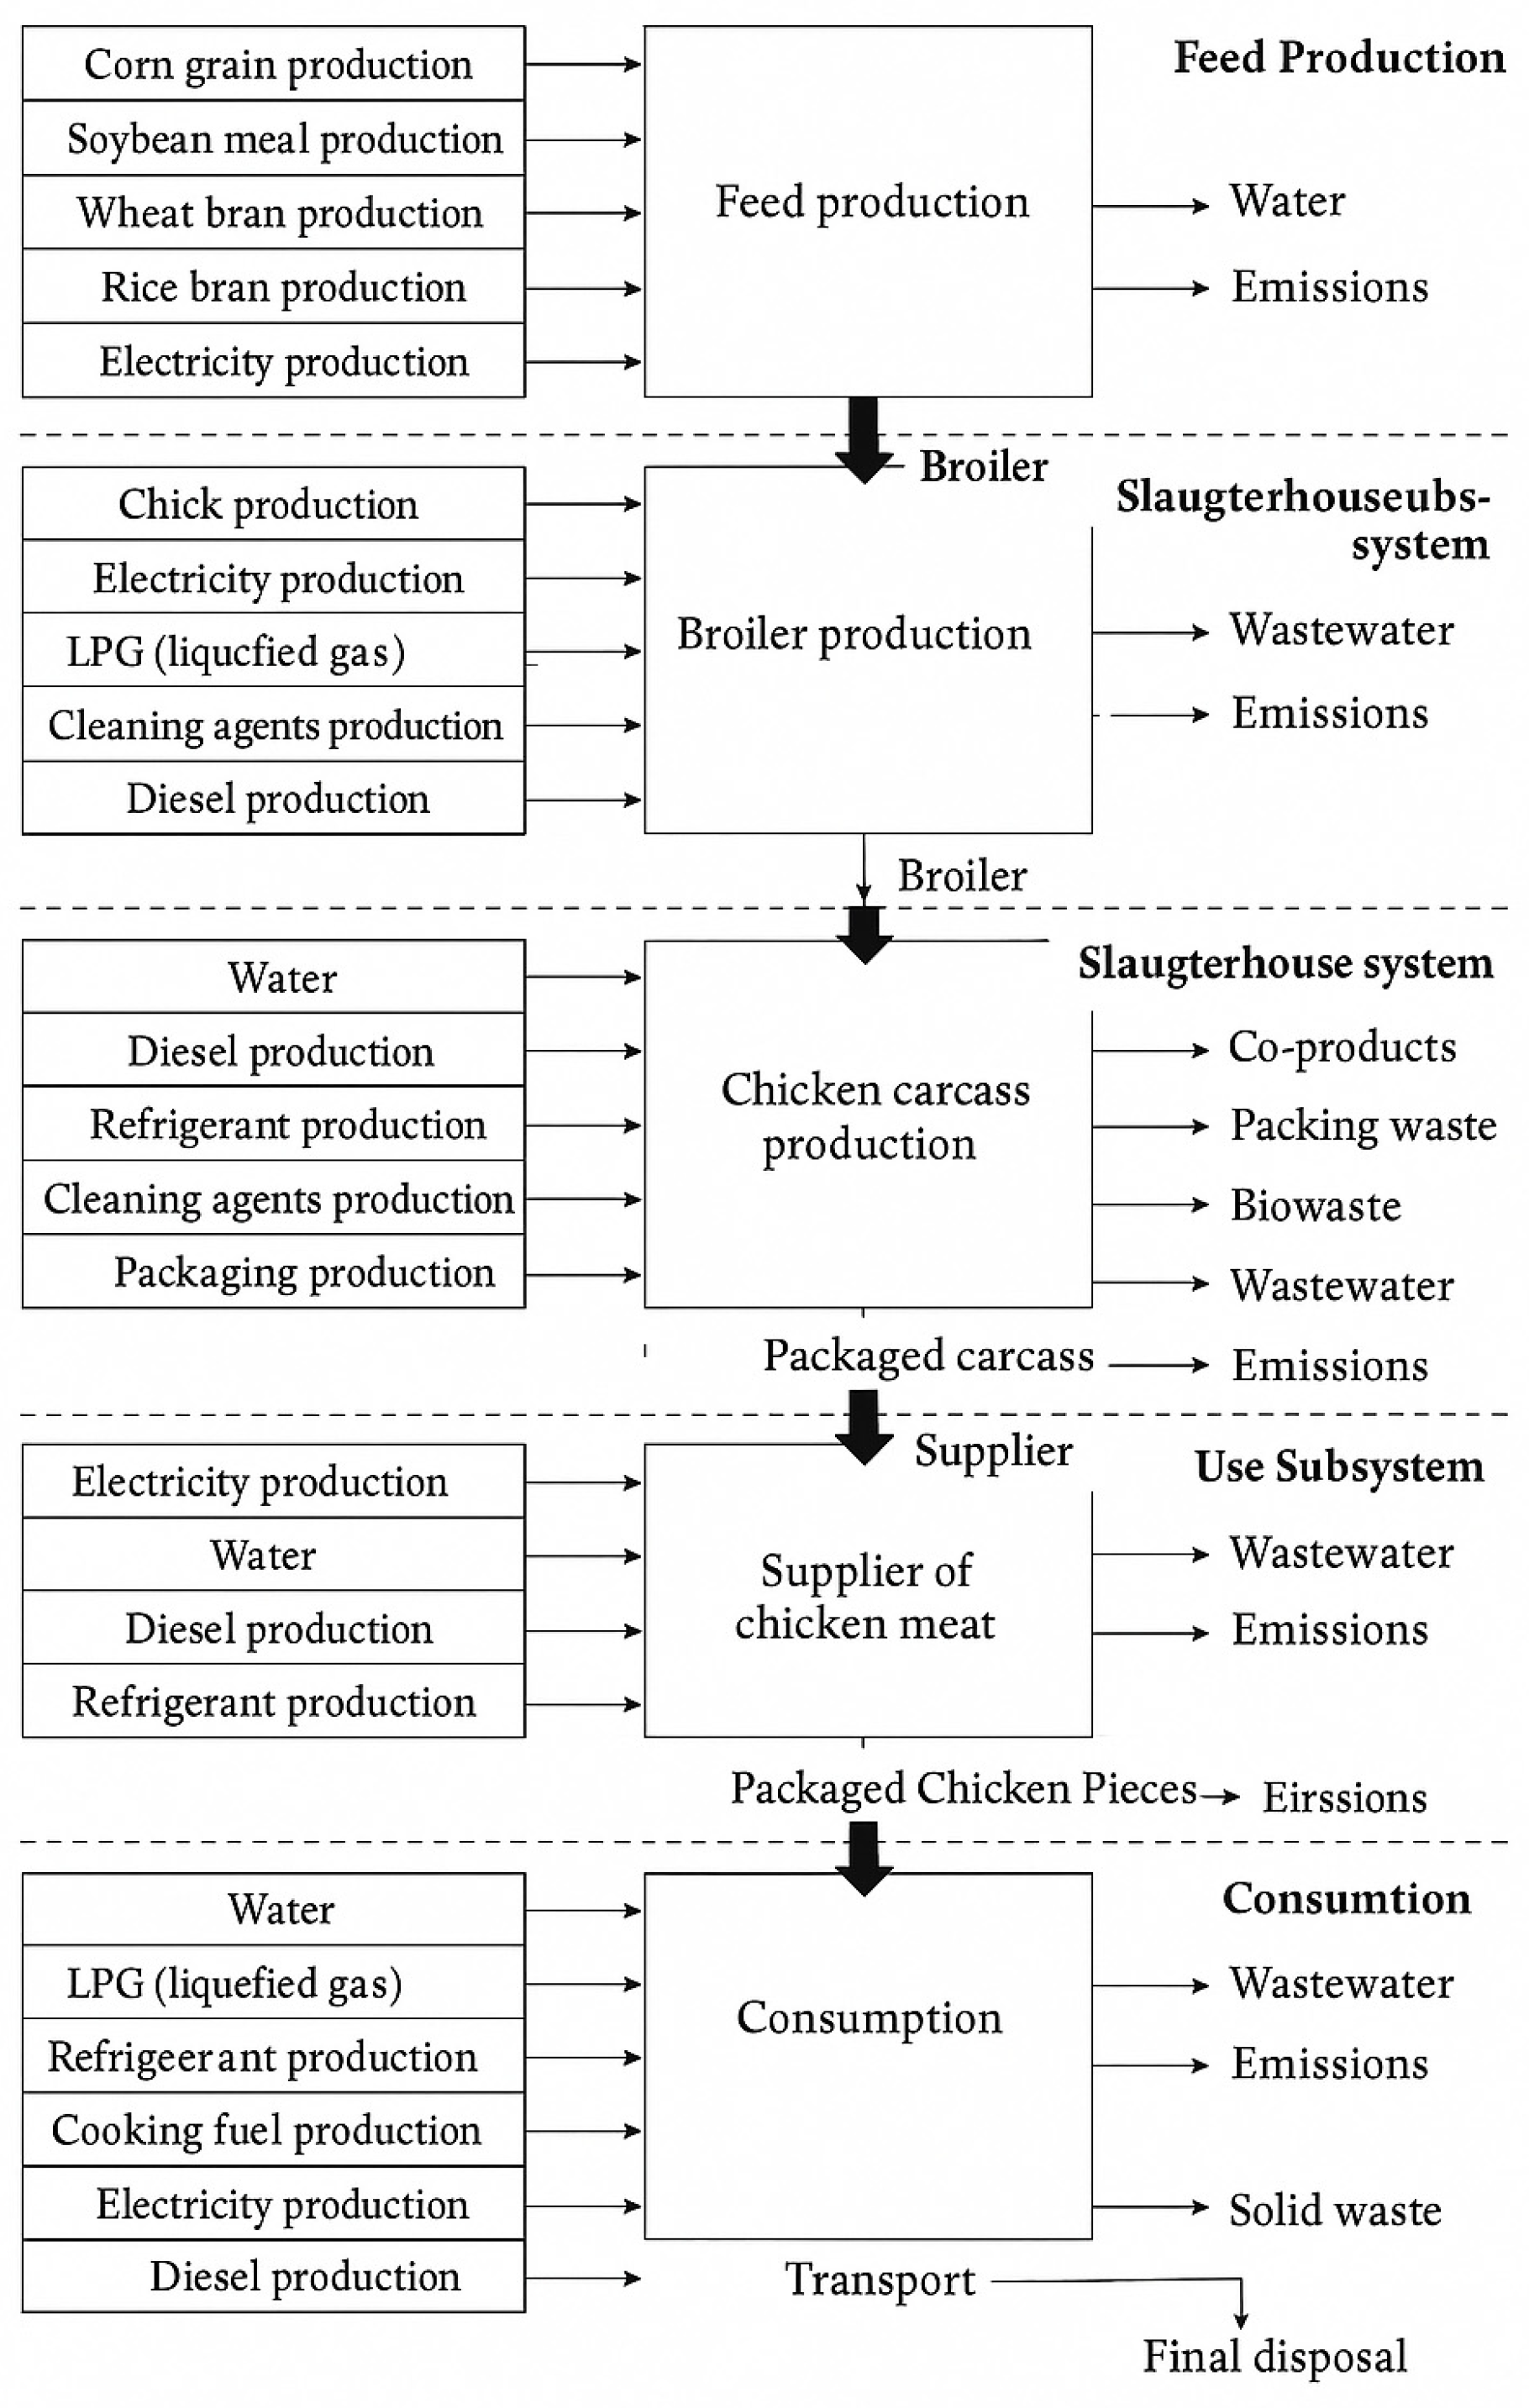
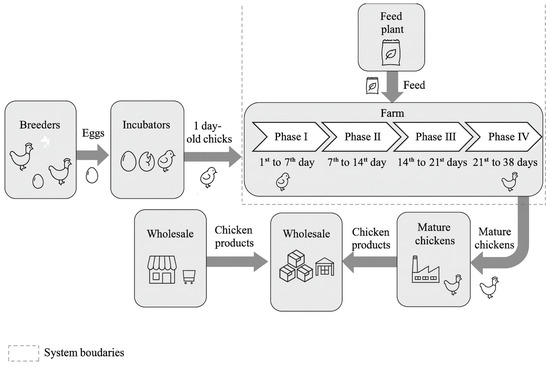
LCA has been widely applied to measure environmental impacts in the poultry production chain, characterized by its complexity and interconnection of stages [55,56]. In this context, the methodology can be used to assess the environmental impacts of a poultry production system, which is complex and interconnected across multiple stages, as illustrated in Figure 1, showing an example of a broiler agro-industrial system [55,56].
Figure 1.
Commercial poultry production system. Source: Adapted from Azmi et al. [56].
Studies delimit the system of analysis according to different perspectives, such as “cradle-to-grave,” “cradle-to-slaughterhouse,” or “cradle-to-farm,” generally using functional units based on kilograms of live weight or carcass [57]. The main environmental indicators employed include Global Warming Potential (GWP), Acidification Potential (AP), and Eutrophication Potential (EP), with feed production being the most impactful stage, potentially representing up to 80–91% of the total, especially due to fossil fuel use and soybean meal production [1,58,59,60].
Comparative research shows regional variations and differences between housing systems [61,62], revealing that free-range and organic production models tend to have lower environmental impacts [63,64]. Studies also differentiate the contributions of production and slaughter stages, highlighting packaging and electricity use at the slaughterhouse [65]. Seasonal factors influence environmental performance, with higher impacts in winter due to additional fuel use for heating [66].
LCA is also used to assess the effects of genetic improvement [4], feed composition, and the use of additives, such as proteases, which reduce multiple impact categories [67,68]. Finally, optimization techniques, such as data envelopment analysis and genetic algorithms, have been applied to increase productivity and reduce emissions, demonstrating that higher production efficiency tends to be associated with reduced environmental impacts [69,70,71].
4. Materials and Methods
This research is descriptive in nature, as its primary objective was to evaluate and identify environmental impacts and the inputs that contribute most to these impacts during the fattening phases of broiler chicken production [72]. The study aimed to describe observed phenomena and explore contributing relationships to provide insights for the sustainable development of the poultry sector. In this sense, the logic employed is inductive, as trends and generalizations can be identified from particular data observations [73].
The research approach is essentially quantitative, as structured procedures were used for data collection and analysis of numerical data, which are described in the study stages [74]. The data are of both primary and secondary origin, as they include information provided by a broiler industry company and data from the Ecoinvent 3 inventory.
The study was conducted using primary data obtained from a commercial poultry production system located in Brazil. The evaluated operation follows a vertically integrated production model, which is characteristic of the Brazilian poultry sector. Data were provided directly by the participating company and included information related to feed formulation and input consumption throughout the broiler fattening cycle. The assessed production system represents a commercial-scale broiler operation operating under standard industrial production practices. The environmental assessment focused on the production phases and feed-related inputs reported by the company during the evaluated production cycle.
The evaluated production system corresponds to a large-scale commercial broiler operation located in Brazil’s Center-West region, characterized by a tropical climate with a marked dry season. The production unit operates under the vertically integrated model predominant in the Brazilian poultry sector, in which the integrating company supplies chicks, feed, technical assistance, and transportation, while contracted growers are responsible for on-farm rearing. The housing system consists of conventional closed broiler houses equipped with mechanical ventilation, evaporative cooling pads, nipple drinkers, and automated feed distribution systems, which represent standard infrastructure for large-scale industrial broiler production in Brazil. Birds are reared on built-up litter composed of wood shavings reused across multiple production cycles, following standard Brazilian commercial practices. The genetic line used corresponds to a fast-growing commercial hybrid widely adopted in Brazilian industrial poultry production. Stocking density is consistent with the commercial standards applied in the Brazilian integration system and compatible with the certification requirements of the company’s export markets. Due to confidentiality restrictions imposed by the participating company, the exact numerical values of stocking density, precise geographic coordinates, and the specific identity of the genetic line cannot be disclosed. Nevertheless, the technical descriptors provided above are sufficient to characterize the production system in a manner consistent with LCA methodological requirements and to support evaluation of the representativeness and applicability of the inventory data. The results should therefore be interpreted as representative of large-scale, vertically integrated commercial broiler production in Brazil rather than as specific to a single farm or facility.
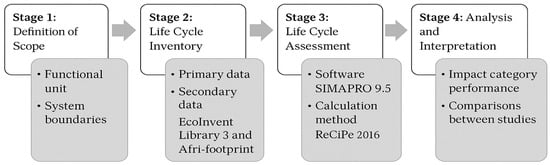
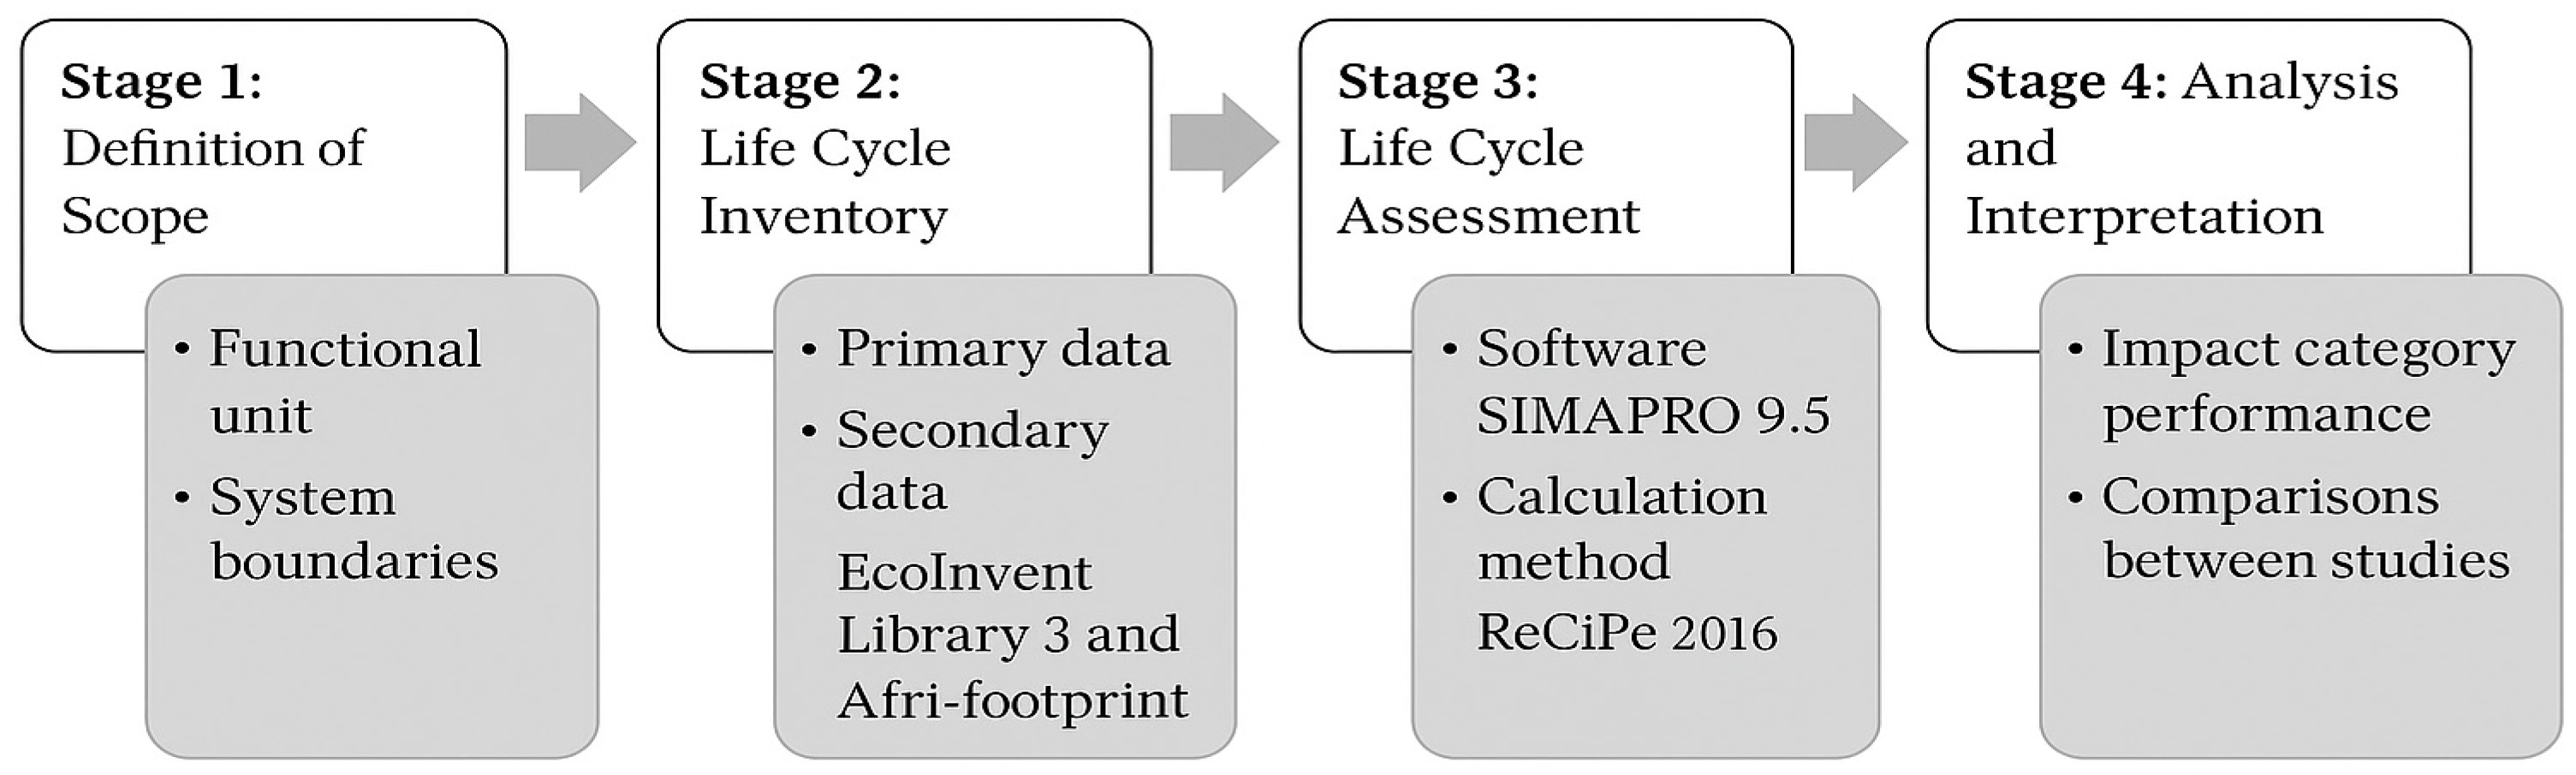
The methodological structure was divided into four main stages (Figure 2), following ISO 14040 [46], namely:
Figure 2.
Four-stage methodological approach. Source: Authors.
- Stage 1: Definition of scope and system boundaries;
- Stage 2: Life cycle inventory;
- Stage 3: Life cycle impact assessment;
- Stage 4: Data analysis and interpretation.
4.1. Stage 1: Definition of Scope
The first step of LCA is the definition of the goal and scope, which also includes the boundaries of the systems to be assessed and the functional unit. The functional unit is the quantitative reference measure of a product system’s performance and is used for comparison across different studies and approaches [75].
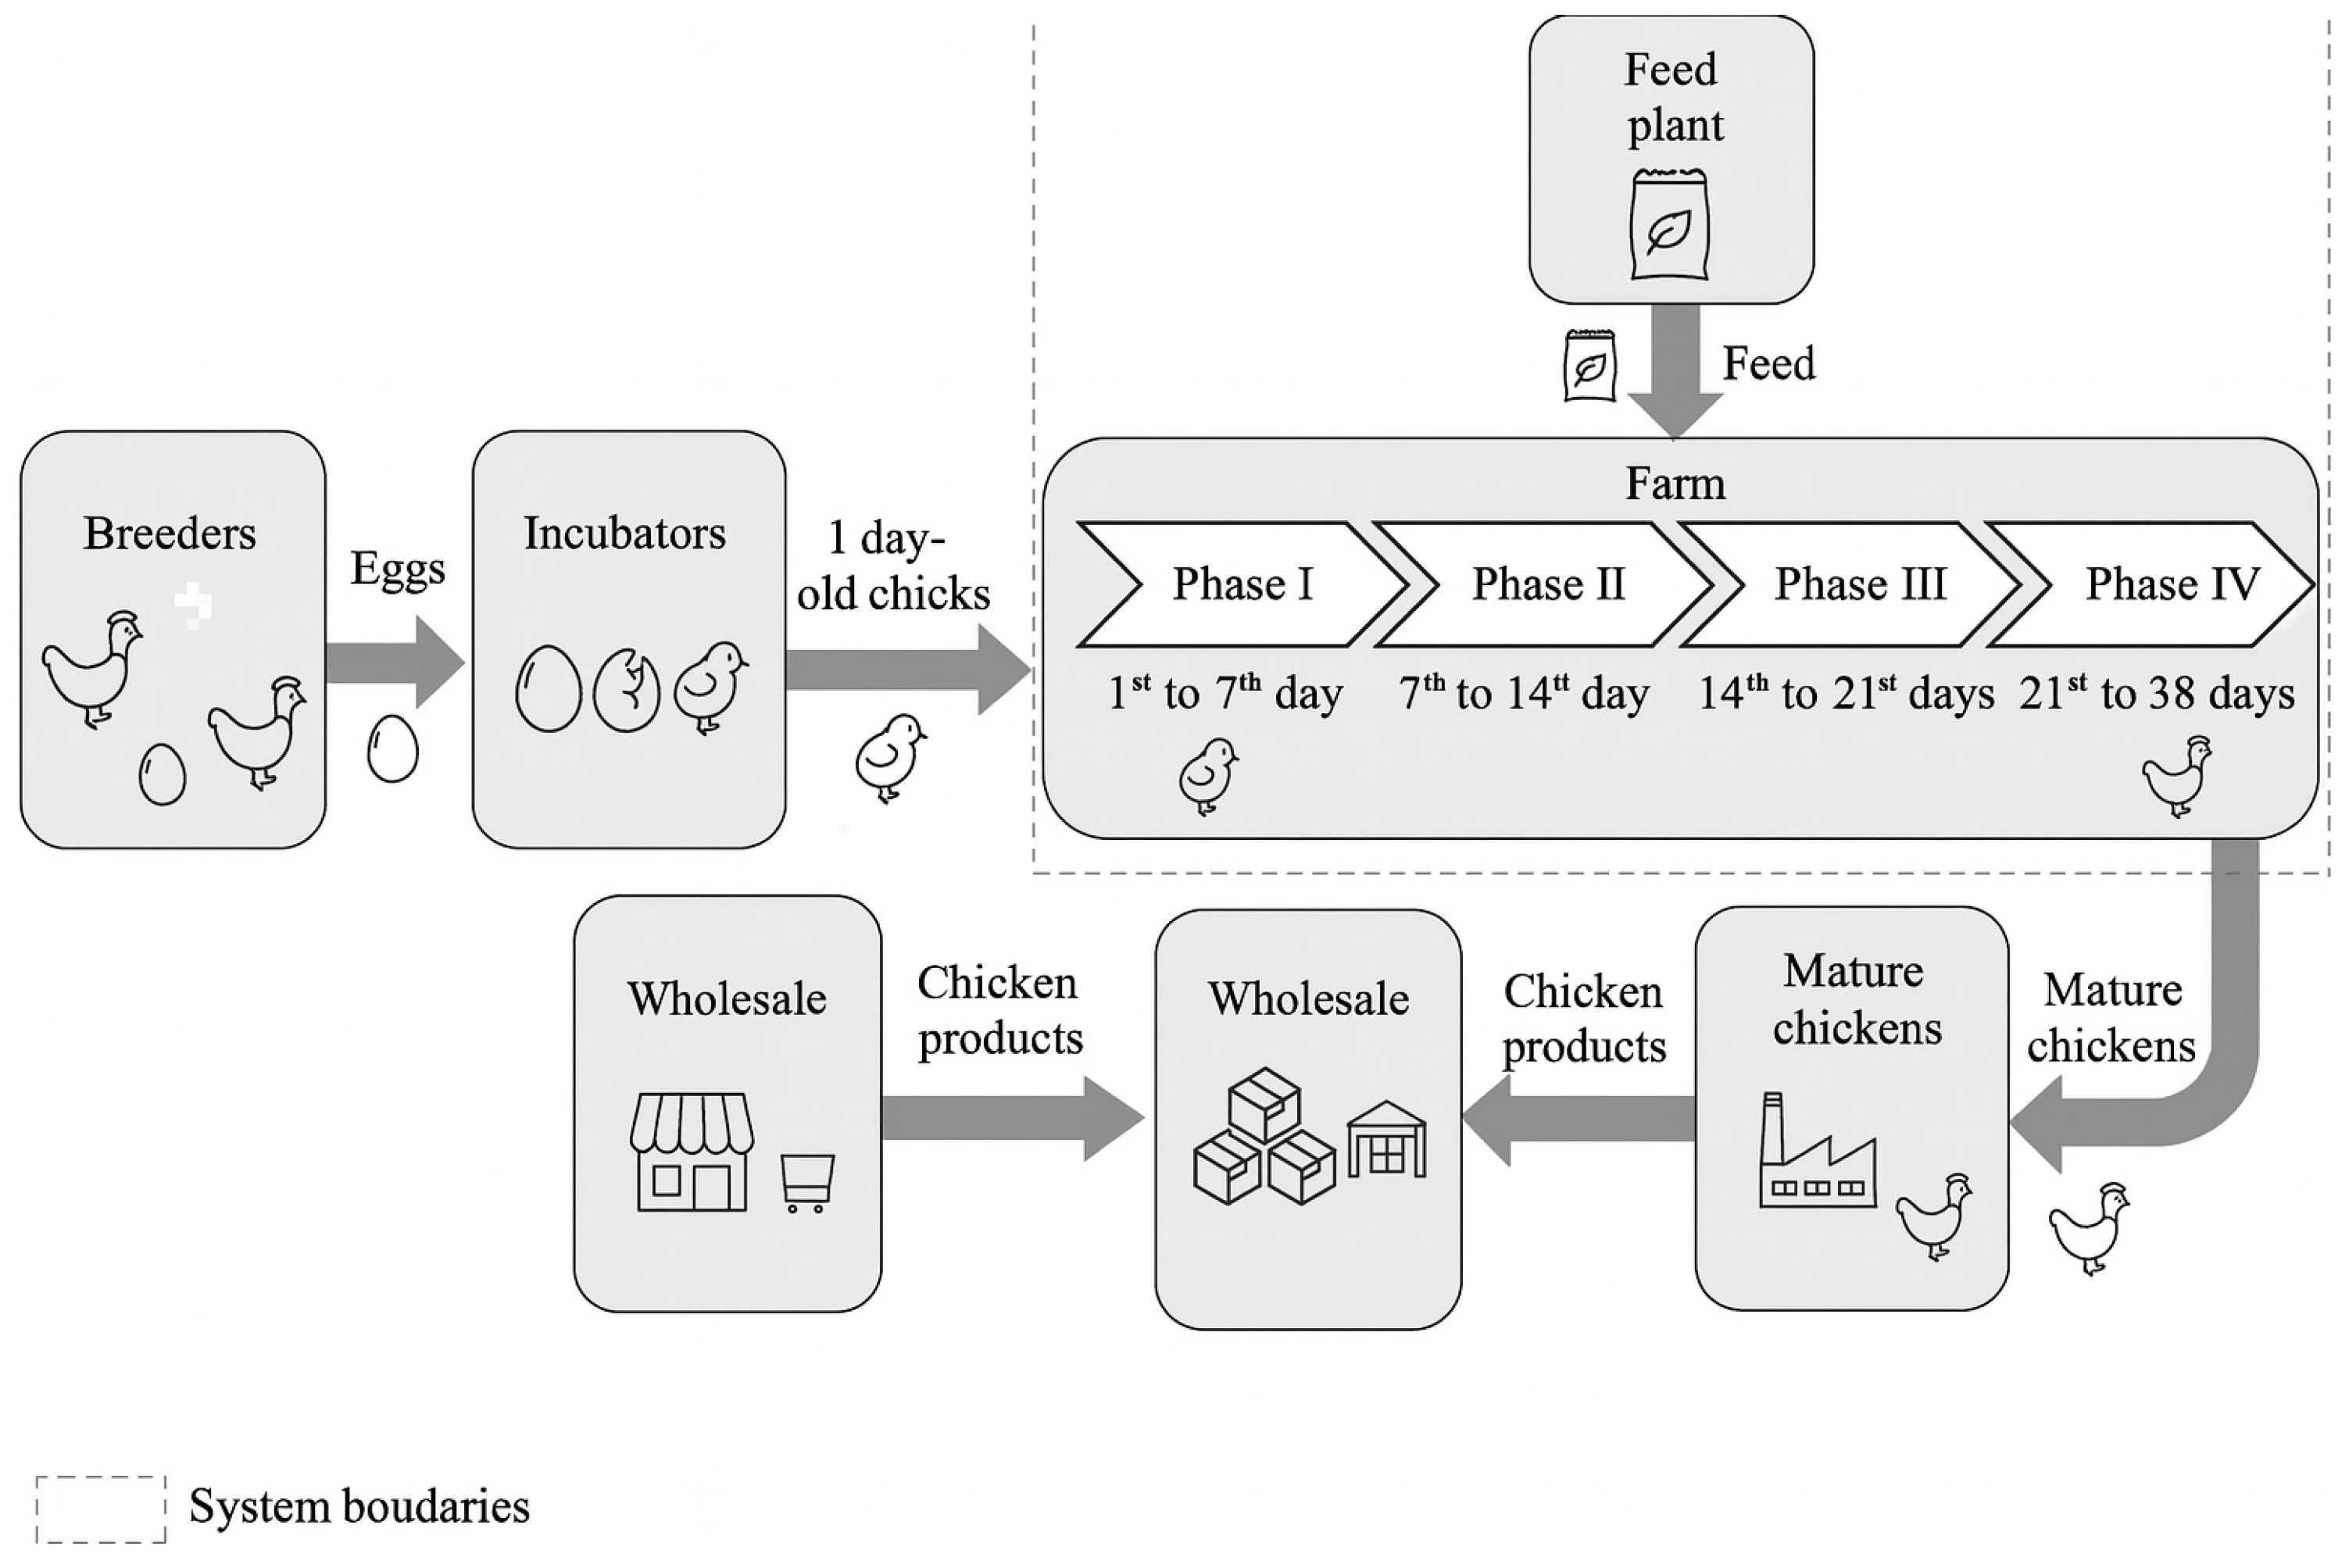
For this research, the primary objective of the LCA was to apply the methodology to calculate the environmental impacts of producing 1 kg of live broiler chicken, which serves as the functional unit, considering four fattening phases of broilers from the first day of life (Figure 3):
Figure 3.
Limits of the system under study. Source: Authors.
- Phase 1: 1st to 7th day;
- Phase 2: 7th to 14th day;
- Phase 3: 14th to 21st day;
- Phase 4: 21st to 38th day.
Figure 3 illustrates broiler chicken production with the defined system boundaries. The system boundaries include the bird rearing process at the farm gate, excluding subsequent processes such as processing and distribution. They also do not include prior stages, such as breeders and hatcheries, due to limitations in the available data.
4.2. Inventory Assumptions and Data Quality
The system boundary adopted in this study was cradle-to-farm-gate rather than gate-to-gate. In addition to on-farm activities, upstream processes associated with feed ingredient production were incorporated through secondary datasets available in the Ecoinvent 3 database and modeled in SimaPro® 9.5. Therefore, the environmental impacts associated with the production of agricultural inputs were included in the assessment.
Primary inventory data were obtained directly from operational records provided by the participating poultry company, including feed formulation and input consumption during each fattening phase. Secondary data were obtained from the Ecoinvent 3 database and were selected according to availability and compatibility with the assessed processes. The inventory presented in Table 1 includes the main feed-related inputs used during broiler production. Inputs contributing negligibly to mass and environmental relevance were excluded according to common LCA practice. The study focused on the dominant material flows associated with feed production, which represented the largest contribution to environmental impacts identified in the assessment.
Table 1.
Main inputs of the system for the production of 1 kg of live broiler chicken.
Special attention was given to agricultural inputs because soybean grain, corn grain, and soybean oil represented the main contributors to environmental impacts. Although Ecoinvent datasets are internationally recognized and widely used in LCA studies, some background processes may not fully reflect regional characteristics of Brazilian agricultural systems. Consequently, the results should be interpreted considering the inherent limitations associated with the geographical representativeness of secondary datasets.
4.3. Stage 2: Life Cycle Inventory
For this case study, primary data were collected from a Brazilian broiler industry, and inventory data were obtained from the Ecoinvent 3 library—allocation, cut-off by classification Unity, and the Agri-footprint economic unit substitution library. The inputs used are presented in Table 1.
In Table 1, it can be observed that the main data relate to the composition of the broilers’ feed, and the upstream production processes of these components were obtained from the Ecoinvent 3 database and the Agri-footprint substitution library. The evaluated production system operates within the Brazilian poultry integration model, in which feed formulation and production management are coordinated to achieve high productivity and feed conversion efficiency. The feed composition presented in Table 1 reflects the typical nutritional structure of Brazilian broiler production, predominantly based on corn grain, soybean grain, and soybean oil. These ingredients are closely associated with Brazil’s agricultural production profile and represent the main environmental drivers identified in this study.
The inventory presented in Table 1 includes the principal feed-related inputs associated with broiler production during the evaluated fattening phases. These inputs were selected because they represented the main material flows reported by the participating company and constituted the basis of the environmental assessment performed in this study. Detailed primary data regarding electricity consumption, heating systems, ventilation equipment, lighting systems, automated feeding equipment, and other operational energy uses were not available for the assessed production system. Consequently, these processes were not modeled as individual inventory flows. The environmental assessment therefore emphasizes the contribution of feed-related inputs and their associated upstream agricultural processes.
Environmental modeling was performed using SimaPro® 9.5 software. Secondary inventory data were obtained from the Ecoinvent database (version 3.9.1) and the Agri-footprint database (version 6.0). The Ecoinvent datasets were implemented according to the cut-off system model available in the database. Whenever Brazilian-specific datasets were unavailable, the most representative datasets available in the databases were selected based on technological similarity and compatibility with the assessed production processes. Consequently, some background processes may not fully represent regional characteristics of Brazilian agricultural systems. This limitation should be considered when interpreting the results. The selected databases provide internationally recognized inventory data and are widely used in Life Cycle Assessment studies, supporting methodological consistency and comparability with previous research.
4.4. Stage 3: Life Cycle Impact Assessment
For the analysis of environmental impacts based on the acquired data, the software SimaPro version 9.5 was used, which provides inventory databases and impact assessment methods. To calculate the environmental indicators, the ReCiPe 2016—Midpoint (H) method was applied. In the ReCiPe method, 18 midpoint indicators and three endpoint indicators are determined. For each midpoint and endpoint, factors based on three types of perspectives are included: individualist, hierarchist, and egalitarian. These perspectives reflect choices related to issues such as the expected development of new technologies that could prevent future damage, time, and appropriate management [76].
From the individualist perspective, concerns are short-term, focusing on technological optimism, human adaptation, and immediate impacts. The hierarchist perspective refers to the scientific consensus model regarding credible timeframes and impact mechanisms. The egalitarian perspective is associated with long-term temporal concerns. The main goal of the method is to reduce the inventory to a limited number of indicators that indicate the relative severity of environmental impact categories [76].
According to Ige et al. [76], the impact assessment process consists of classification, normalization, characterization, and weighting:
- Classification: The environmental impact calculated in the inventory is grouped into a set of known environmental impact categories.
- Characterization: Evaluates the relative contribution of each environmental impact by summing the product of the quantity of each substance and its characterization factor. Each substance has a specific characterization factor that measures the potential impact per unit of emission. This factor determines which substance or process contributed to each impact category. Equation (1) presents the characterization of generic factors
- = impact indicator of category ;
- = amount of intervention type ;
- = characterization factor linking the intervention to the impact category ;
For non-generic characterization factors, human health impact variables are considered
where:
Cic = ∑iQi × CFic(substance, location, exposed area, time, environmental behavior)CI_c = \sum_i Q_i\times CF_{ic}(substance, location, exposed\area, time, environmental\behavior)Cic = i∑Qi × Cfic (substance, location, exposed area, time, environmental behavior)
- i: substance;
- s: emission location;
- l: receptor-related exposure area;
- t: period considered for the potential contribution to the impact;
- : Environmental behavior;
- Environmental\behavior = environmental behavior;
- Normalization: Comparison between impact categories to reduce the number of factors to be evaluated. A reference is used to divide the sum of each category indicator result
- = normalized indicator;
- = category indicator from the characterization phase;
- = reference value.
The impact categories selected using the ReCiPe 2016 Midpoint method are described in Table 2 below, along with their respective units and abbreviations.
Table 2.
Categories of environmental impacts.
4.5. Stage 4: Analysis and Interpretation
In the final stage, the results obtained from the LCA were analyzed with respect to each fattening phase described previously. To ensure that the emissions results encompass the entire life cycle, the data input for each phase is cumulative; that is, the inputs from one phase are carried over to the subsequent stage. Correlations between emissions and inputs as well as upstream production processes were discussed, along with comparisons to results obtained by other authors in the scientific literature on the same topic.
4.6. Sensitivity Analysis
A sensitivity analysis was performed to evaluate the robustness of the Life Cycle Assessment results, following the recommendations of ISO 14040 and ISO 14044. The analysis focused on the main feed ingredients identified as environmental hotspots throughout the broiler fattening phases, namely soybean grain, corn grain, and soybean oil. A variation of ±10% was applied to the inventory quantities of these inputs while maintaining all other model parameters constant. The effects of these variations were evaluated for the impact categories Global Warming Potential (GWP) and Freshwater Ecotoxicity (FETP), which represented relevant environmental indicators in the assessed system. The objective was to verify whether reasonable variations in the inventory data could significantly alter the environmental performance of the evaluated phases or modify the identification of the main environmental hotspots.
5. Results
The results obtained using SimaPro were divided into four main phases corresponding to the broiler fattening stages, from the first day of life of the chicks to the final growth cycle for slaughter, with a functional unit of 1 kg of live broiler chicken.
5.1. Phase 1: Inputs from the 1st to 7th Day
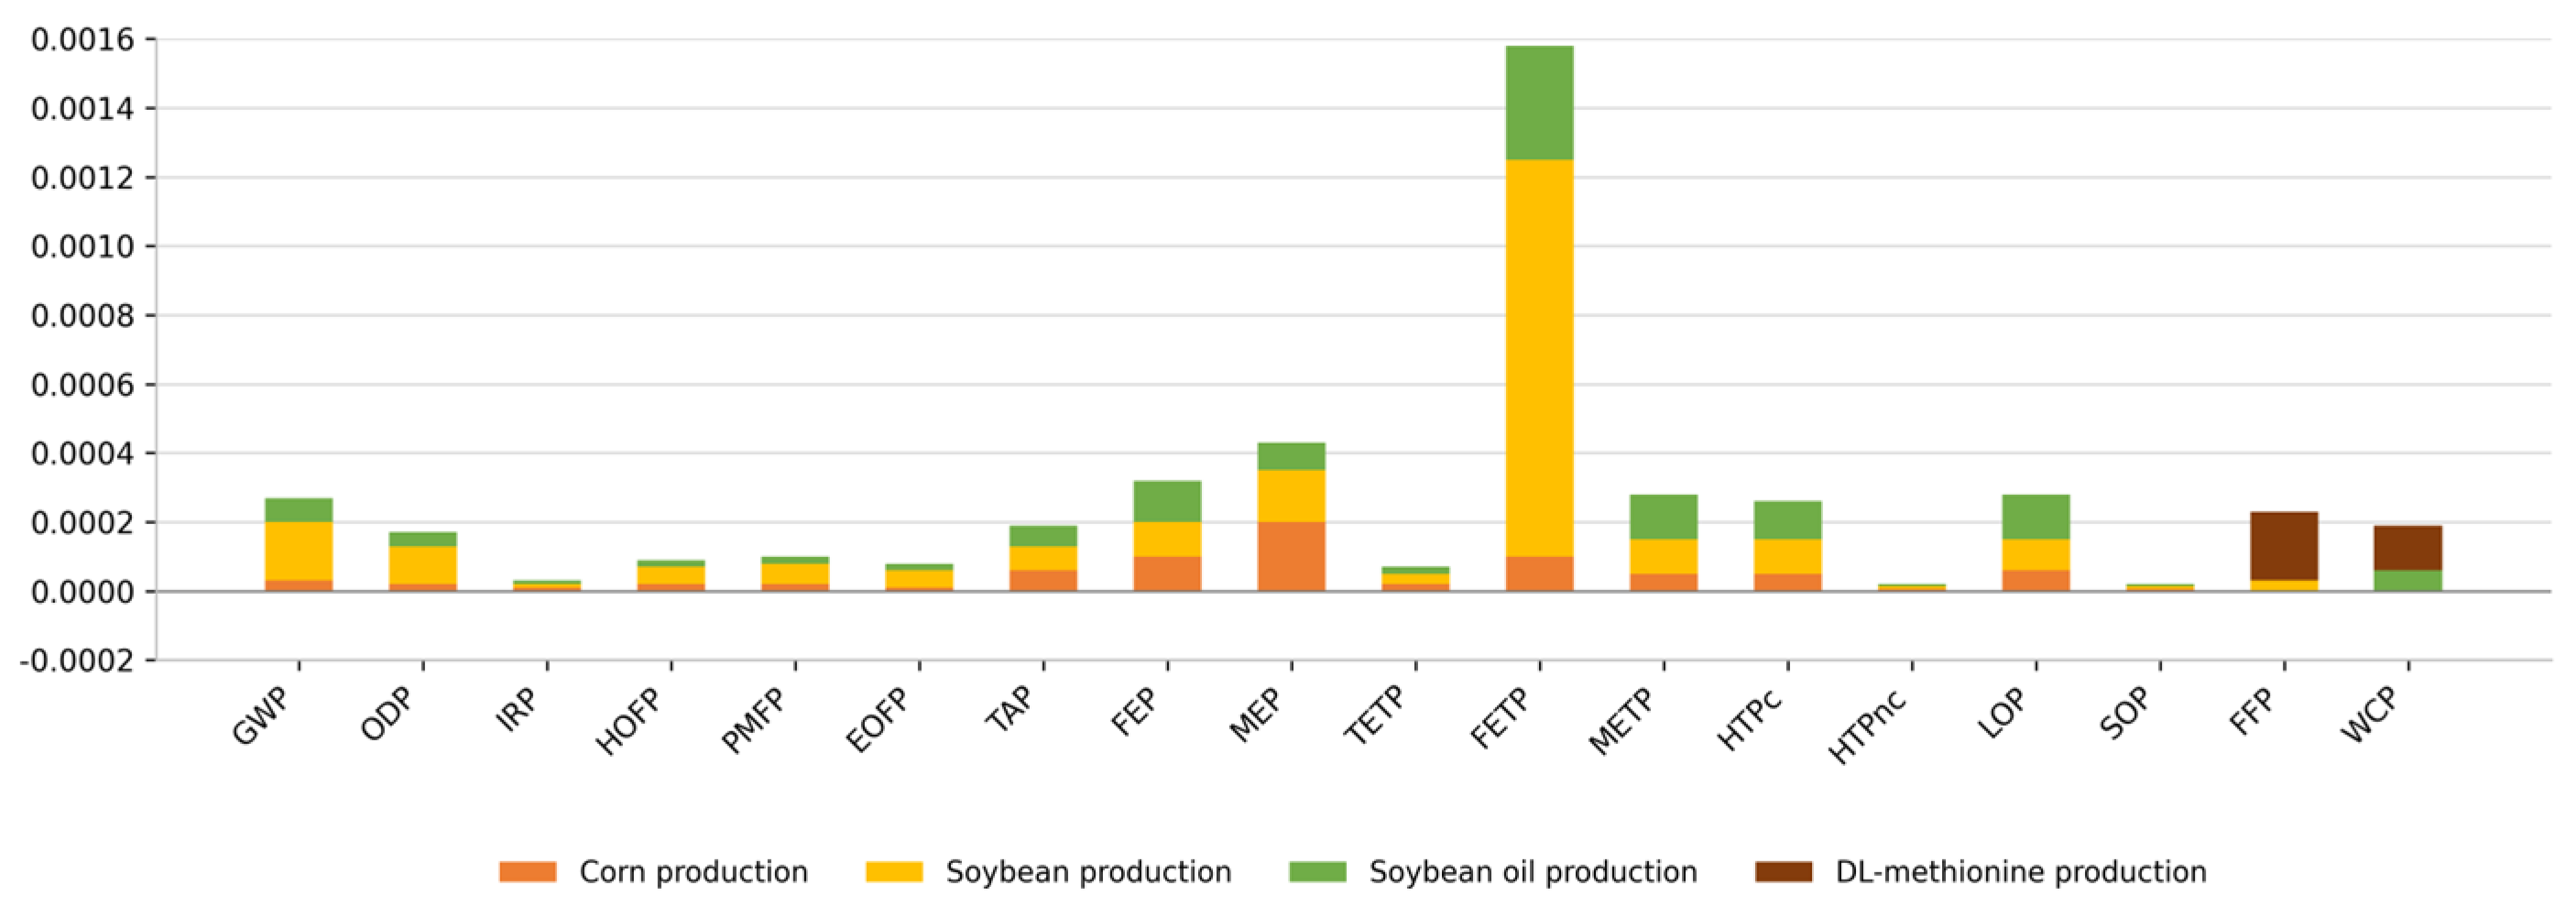
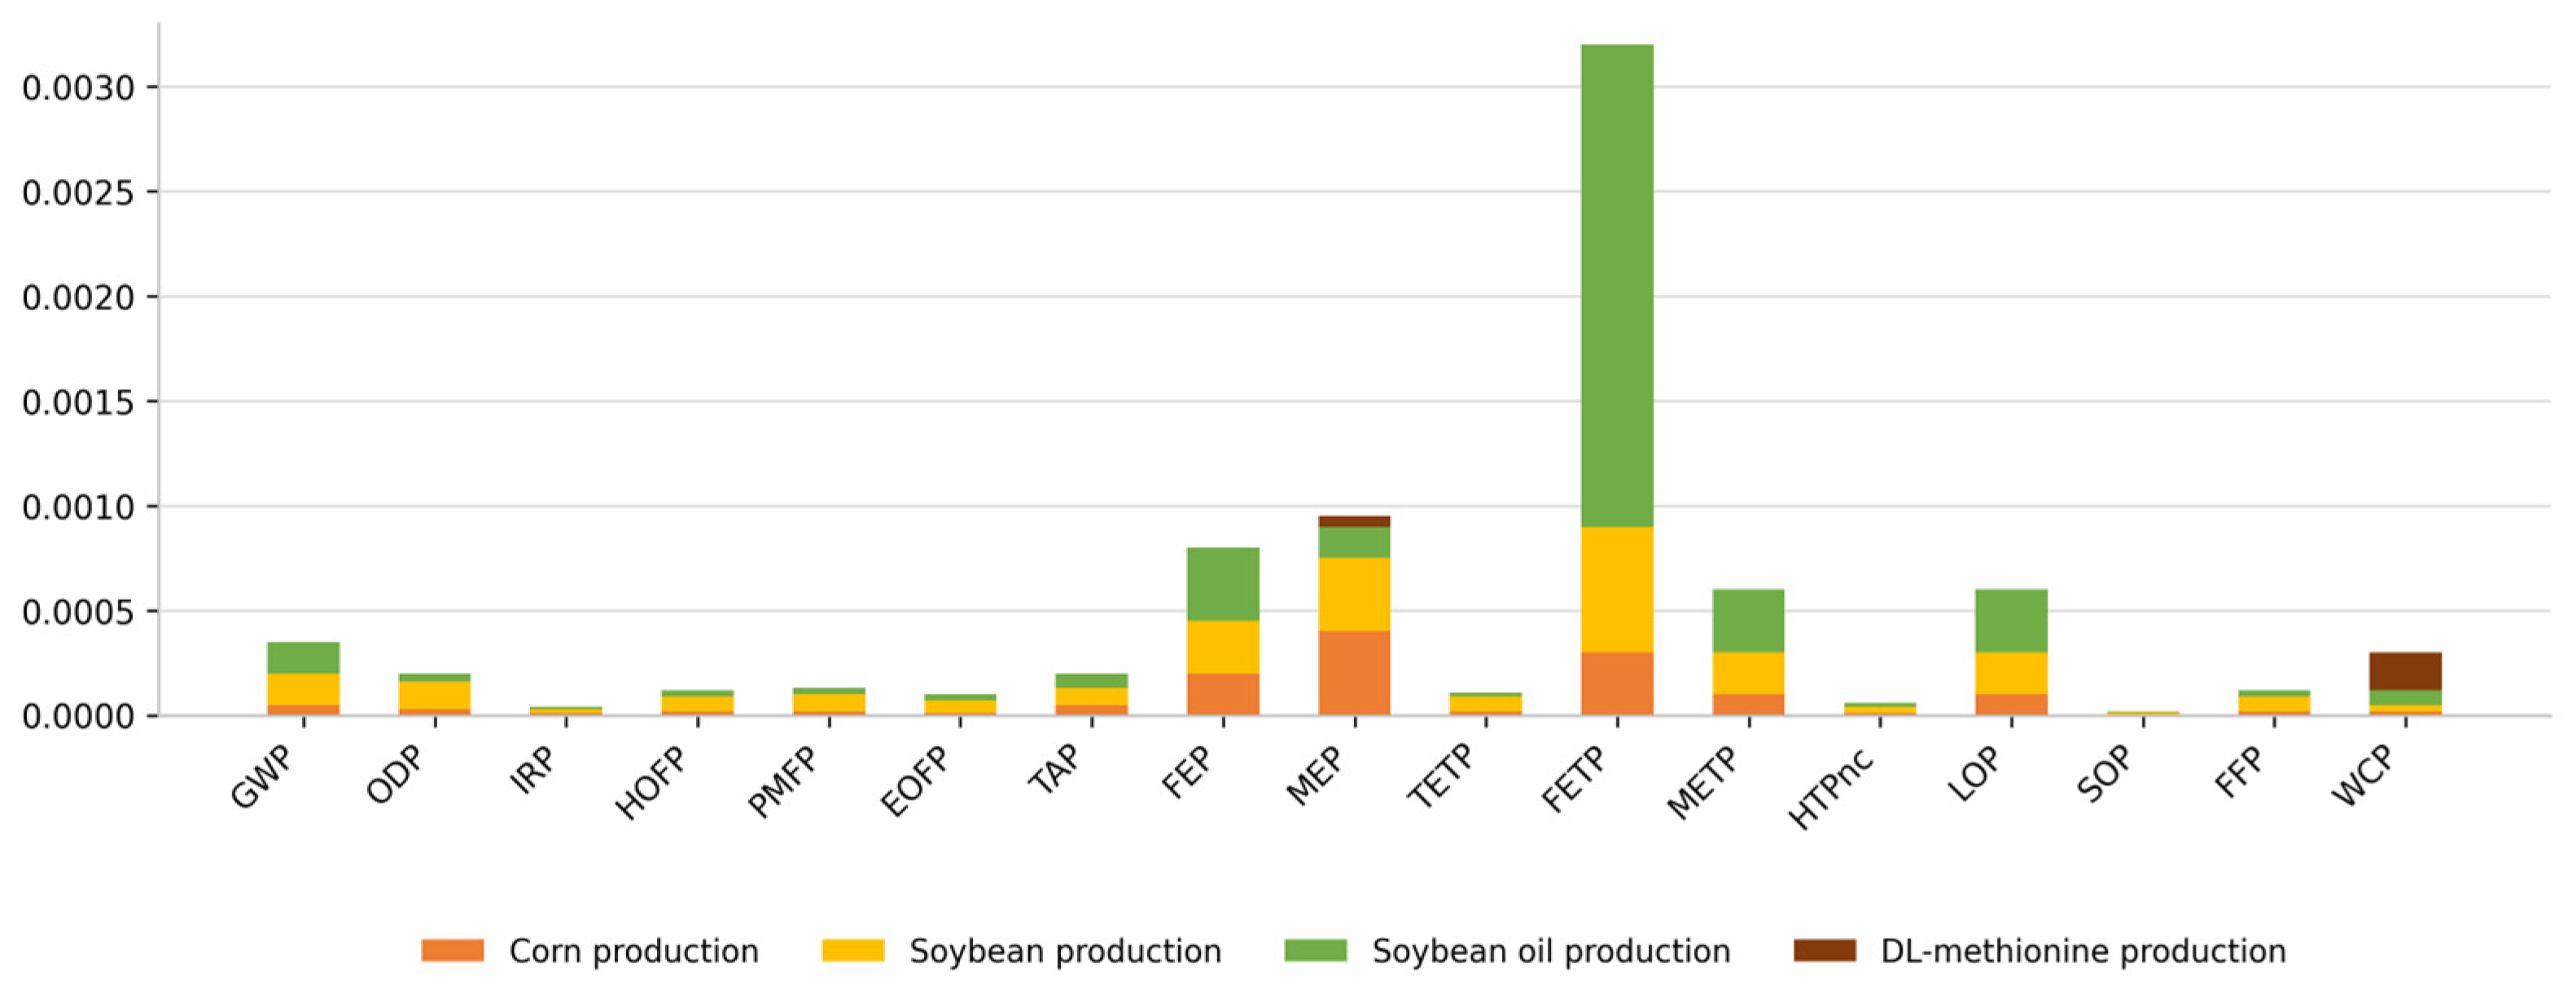
In the first fattening phase of broilers, the environmental impact category with the highest value was freshwater ecotoxicity (FETP), followed by smaller contributions from other categories such as global warming (GWP), marine eutrophication (MEP), freshwater eutrophication (FEP), land use, marine ecotoxicity (METP), and human carcinogenic toxicity (HTPc), as shown in Figure 4.
Figure 4.
Environmental impact categories—Phase 1. Source: Authors.
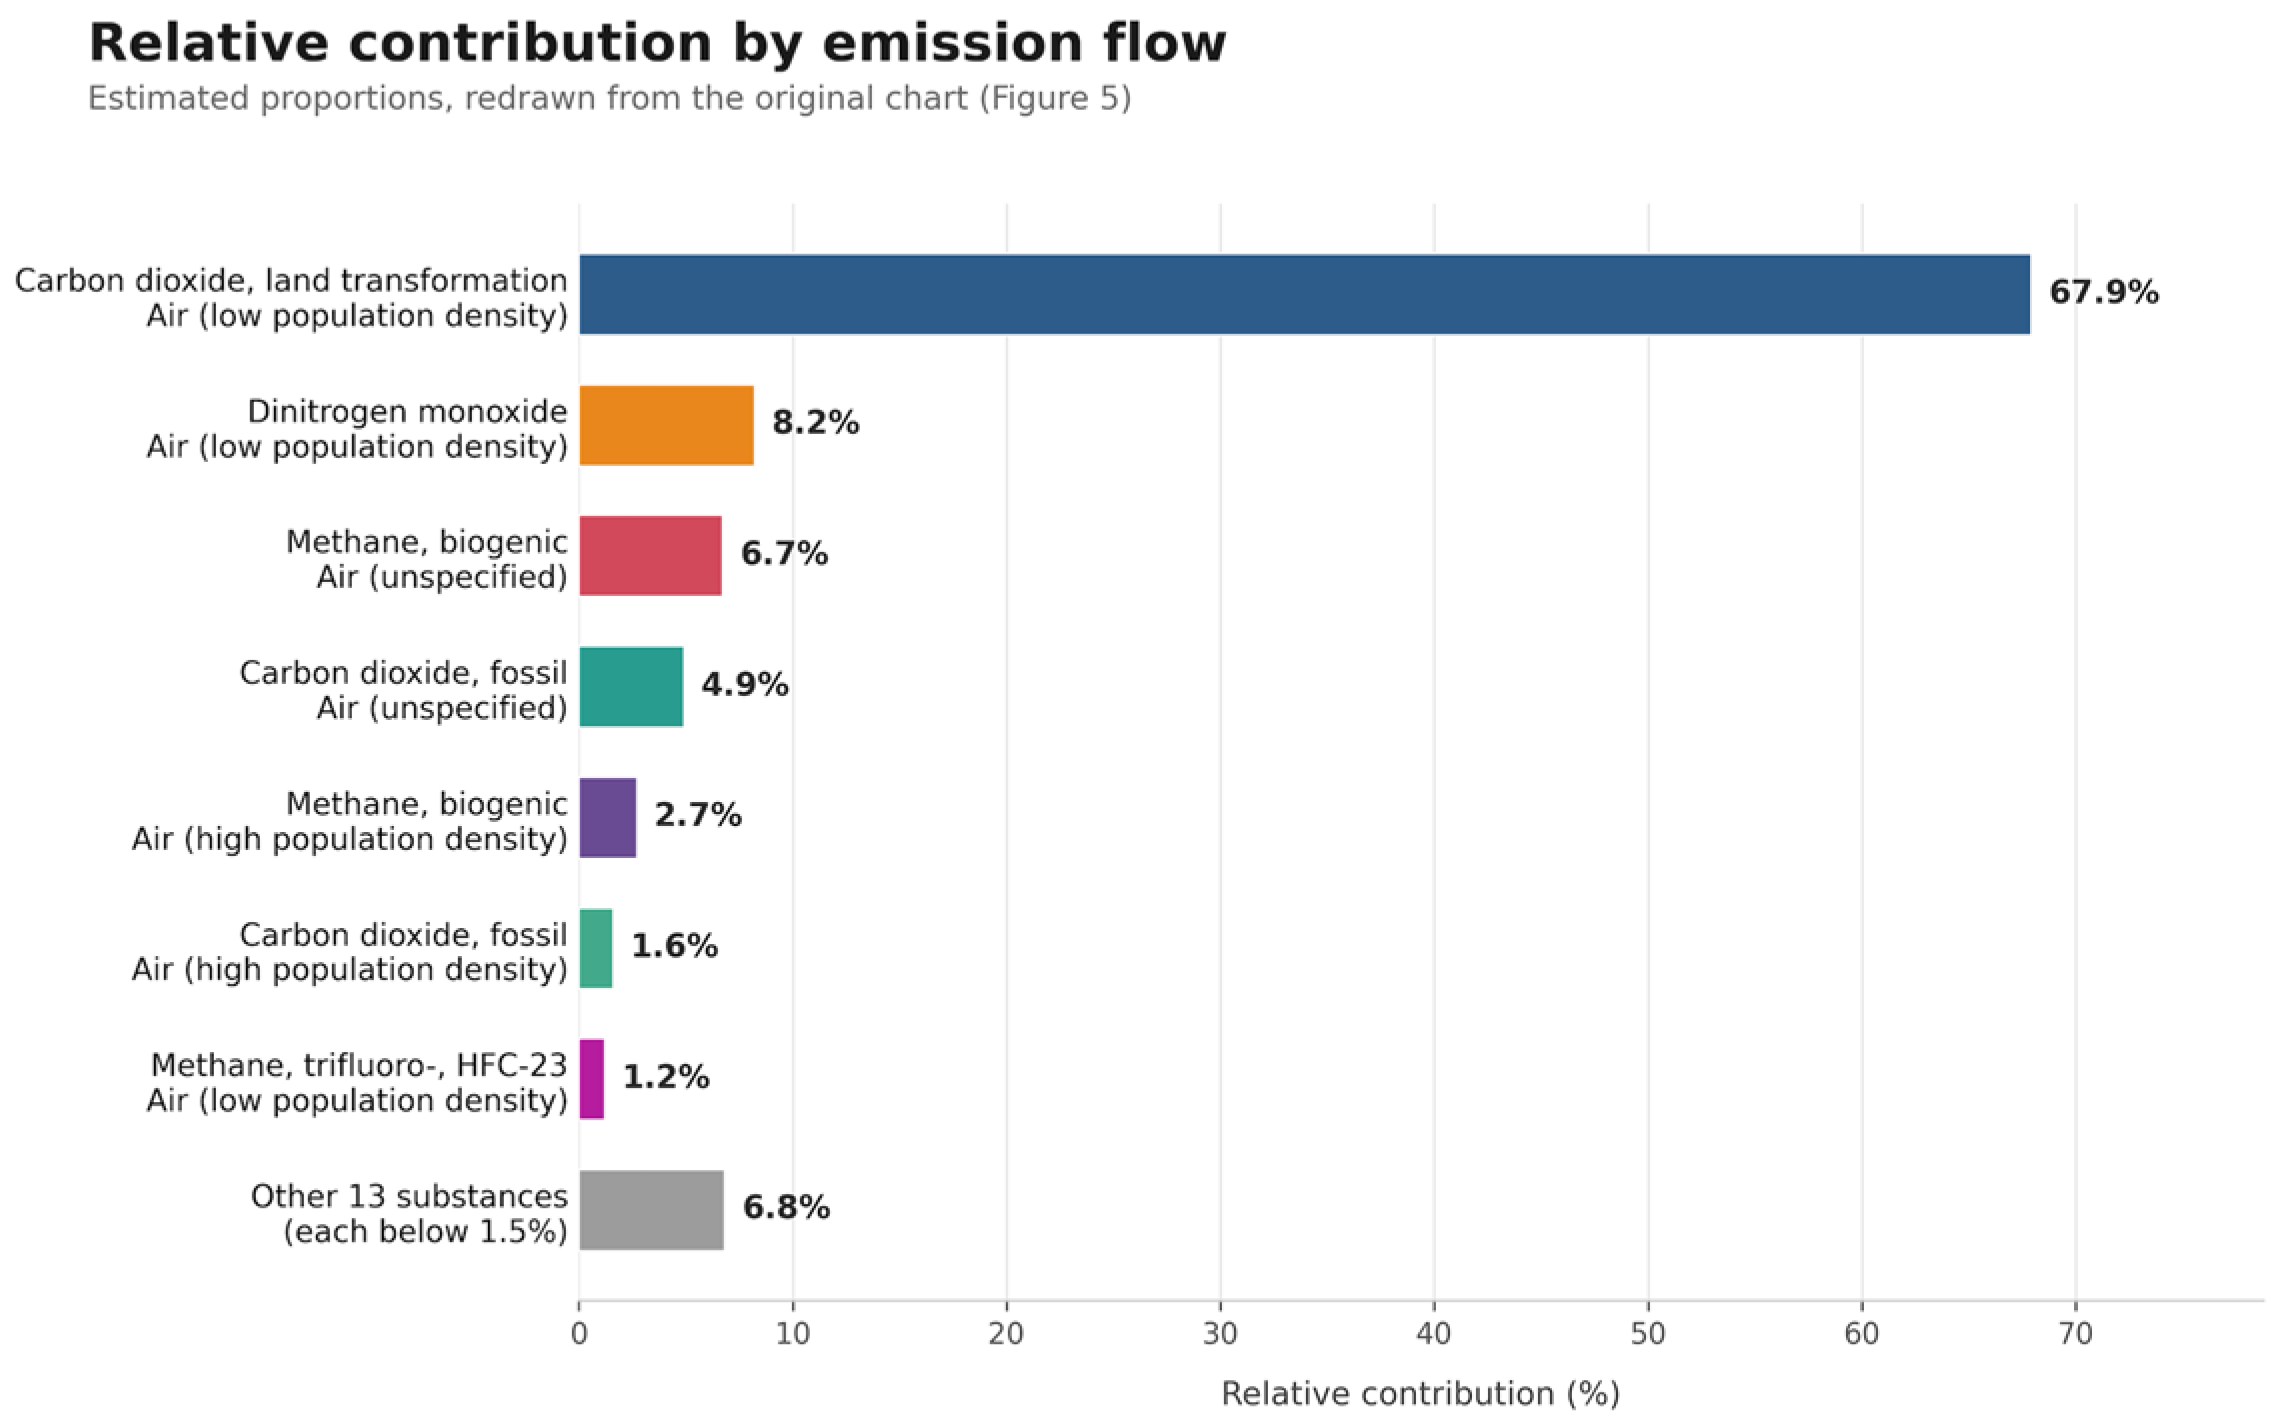
Regarding the contribution of each process input, soy production had the highest values across impact categories, followed by corn grain production and crude soybean oil. For atmospheric emissions contributing to global warming, the greatest contribution came from carbon dioxide (CO2), primarily from land transformation and, to a lesser extent, fossil fuels. Nitrous oxide (N2O) emissions were also observed, as shown in Figure 5.
Figure 5.
Atmospheric emissions that contribute to global warming—Phase 1. Source: Authors.
The environmental profile observed during the first growth phase is closely associated with the nutritional requirements of young chicks. Although feed consumption is relatively low during this stage, diets are formulated with highly digestible ingredients to support rapid physiological development and immune system maturation. Consequently, environmental impacts are already strongly influenced by soybean- and corn-based feed ingredients, which represent the main contributors to upstream agricultural emissions and ecotoxicity-related impacts.
5.2. Phase 2: Inputs from the 7th to 14th Day
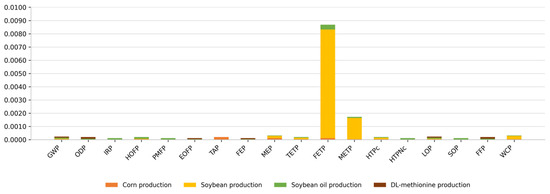
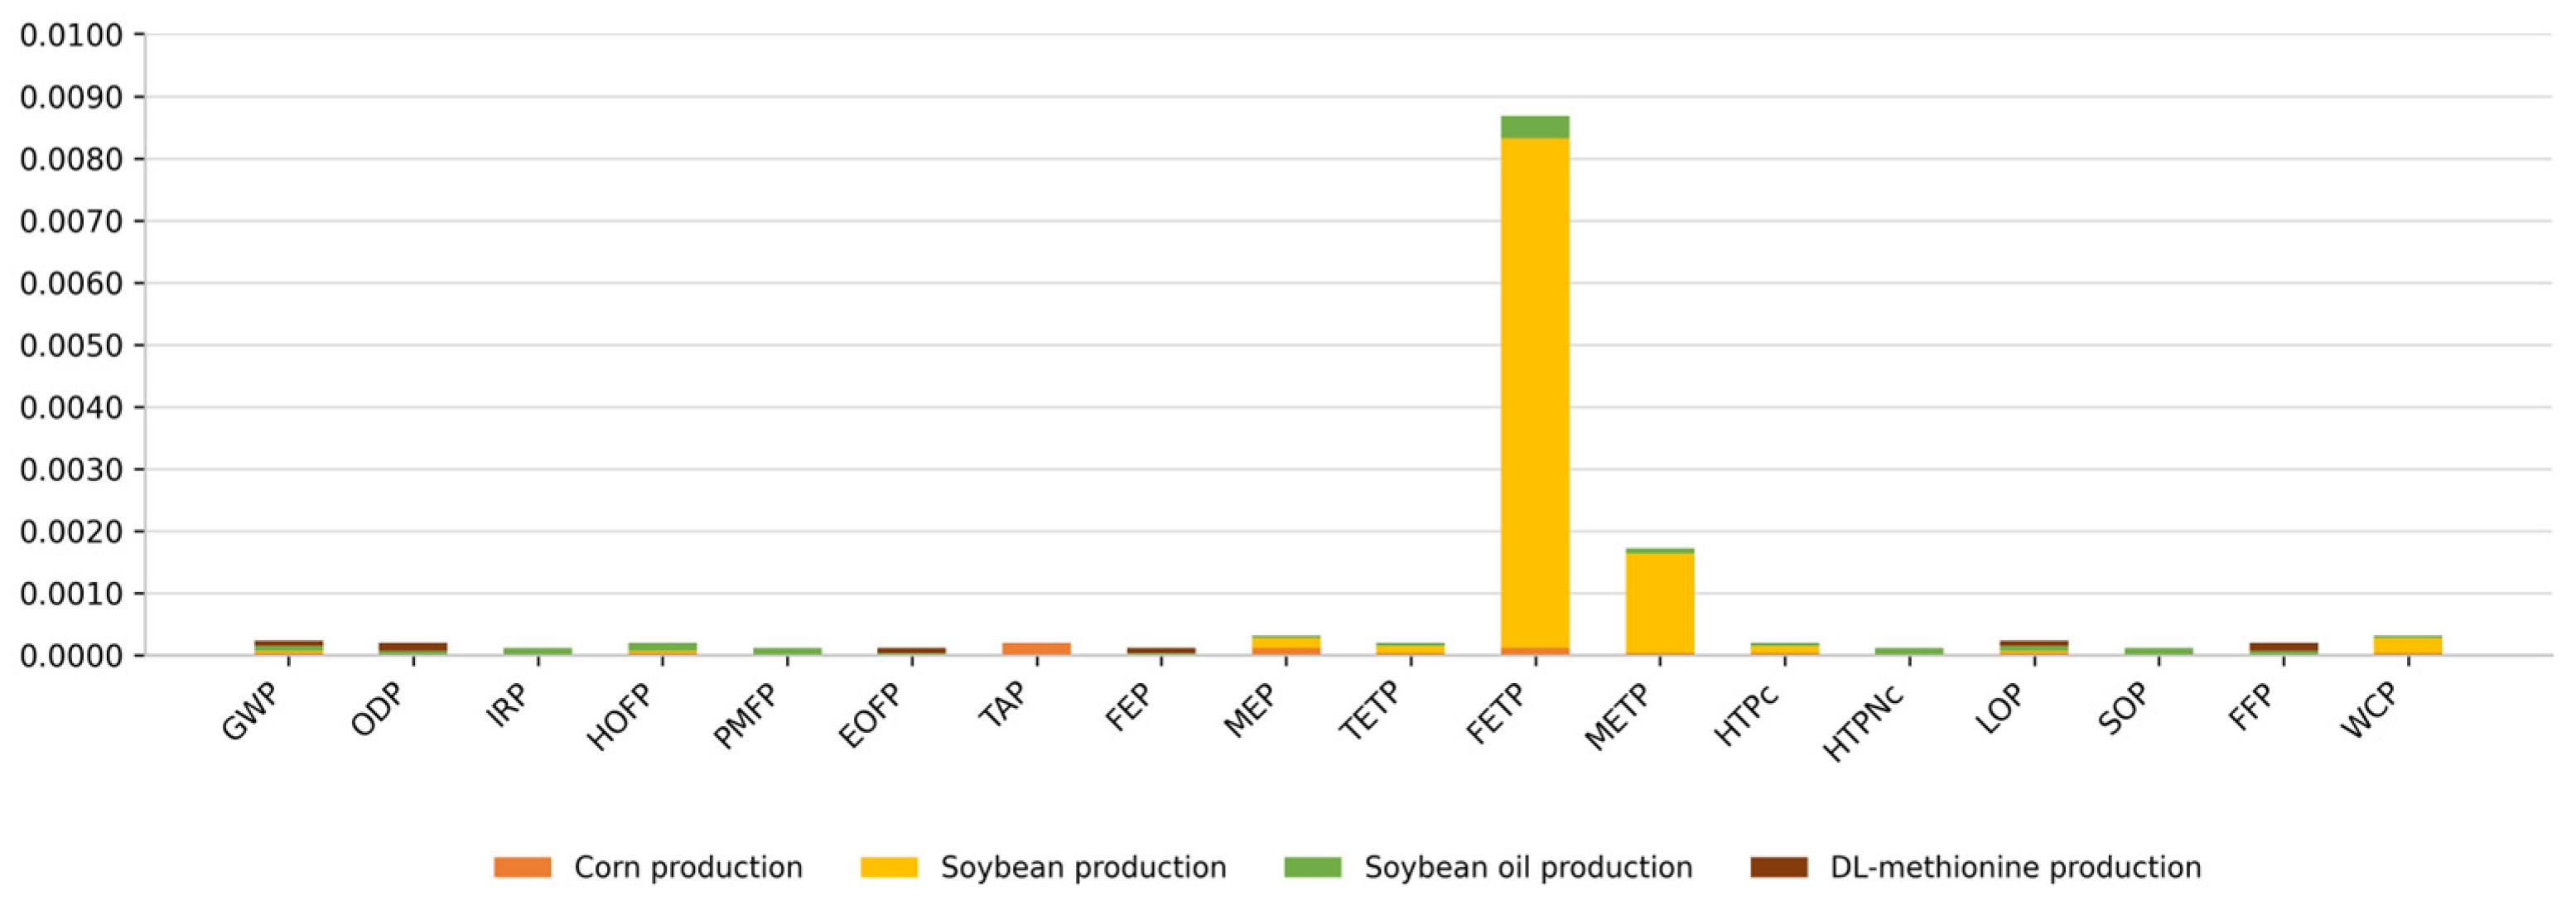
In the second fattening phase, corresponding to the 7th to 14th day, Figure 6 shows that the environmental impact category with the highest contribution was again freshwater ecotoxicity (FETP), similar to the previous phase. Smaller contributions were observed for marine eutrophication (MEP), freshwater eutrophication (FEP), land use (LOP), marine ecotoxicity (METP), global warming (GWP), and human carcinogenic toxicity (HTPc).
Figure 6.
Environmental impact categories—Phase 2. Source: Authors.
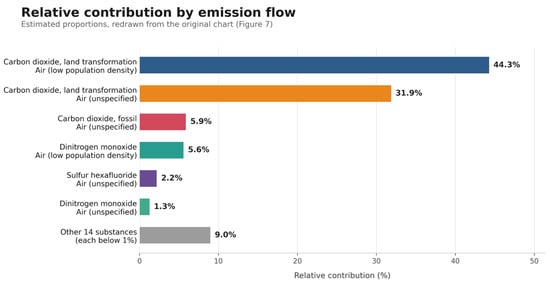
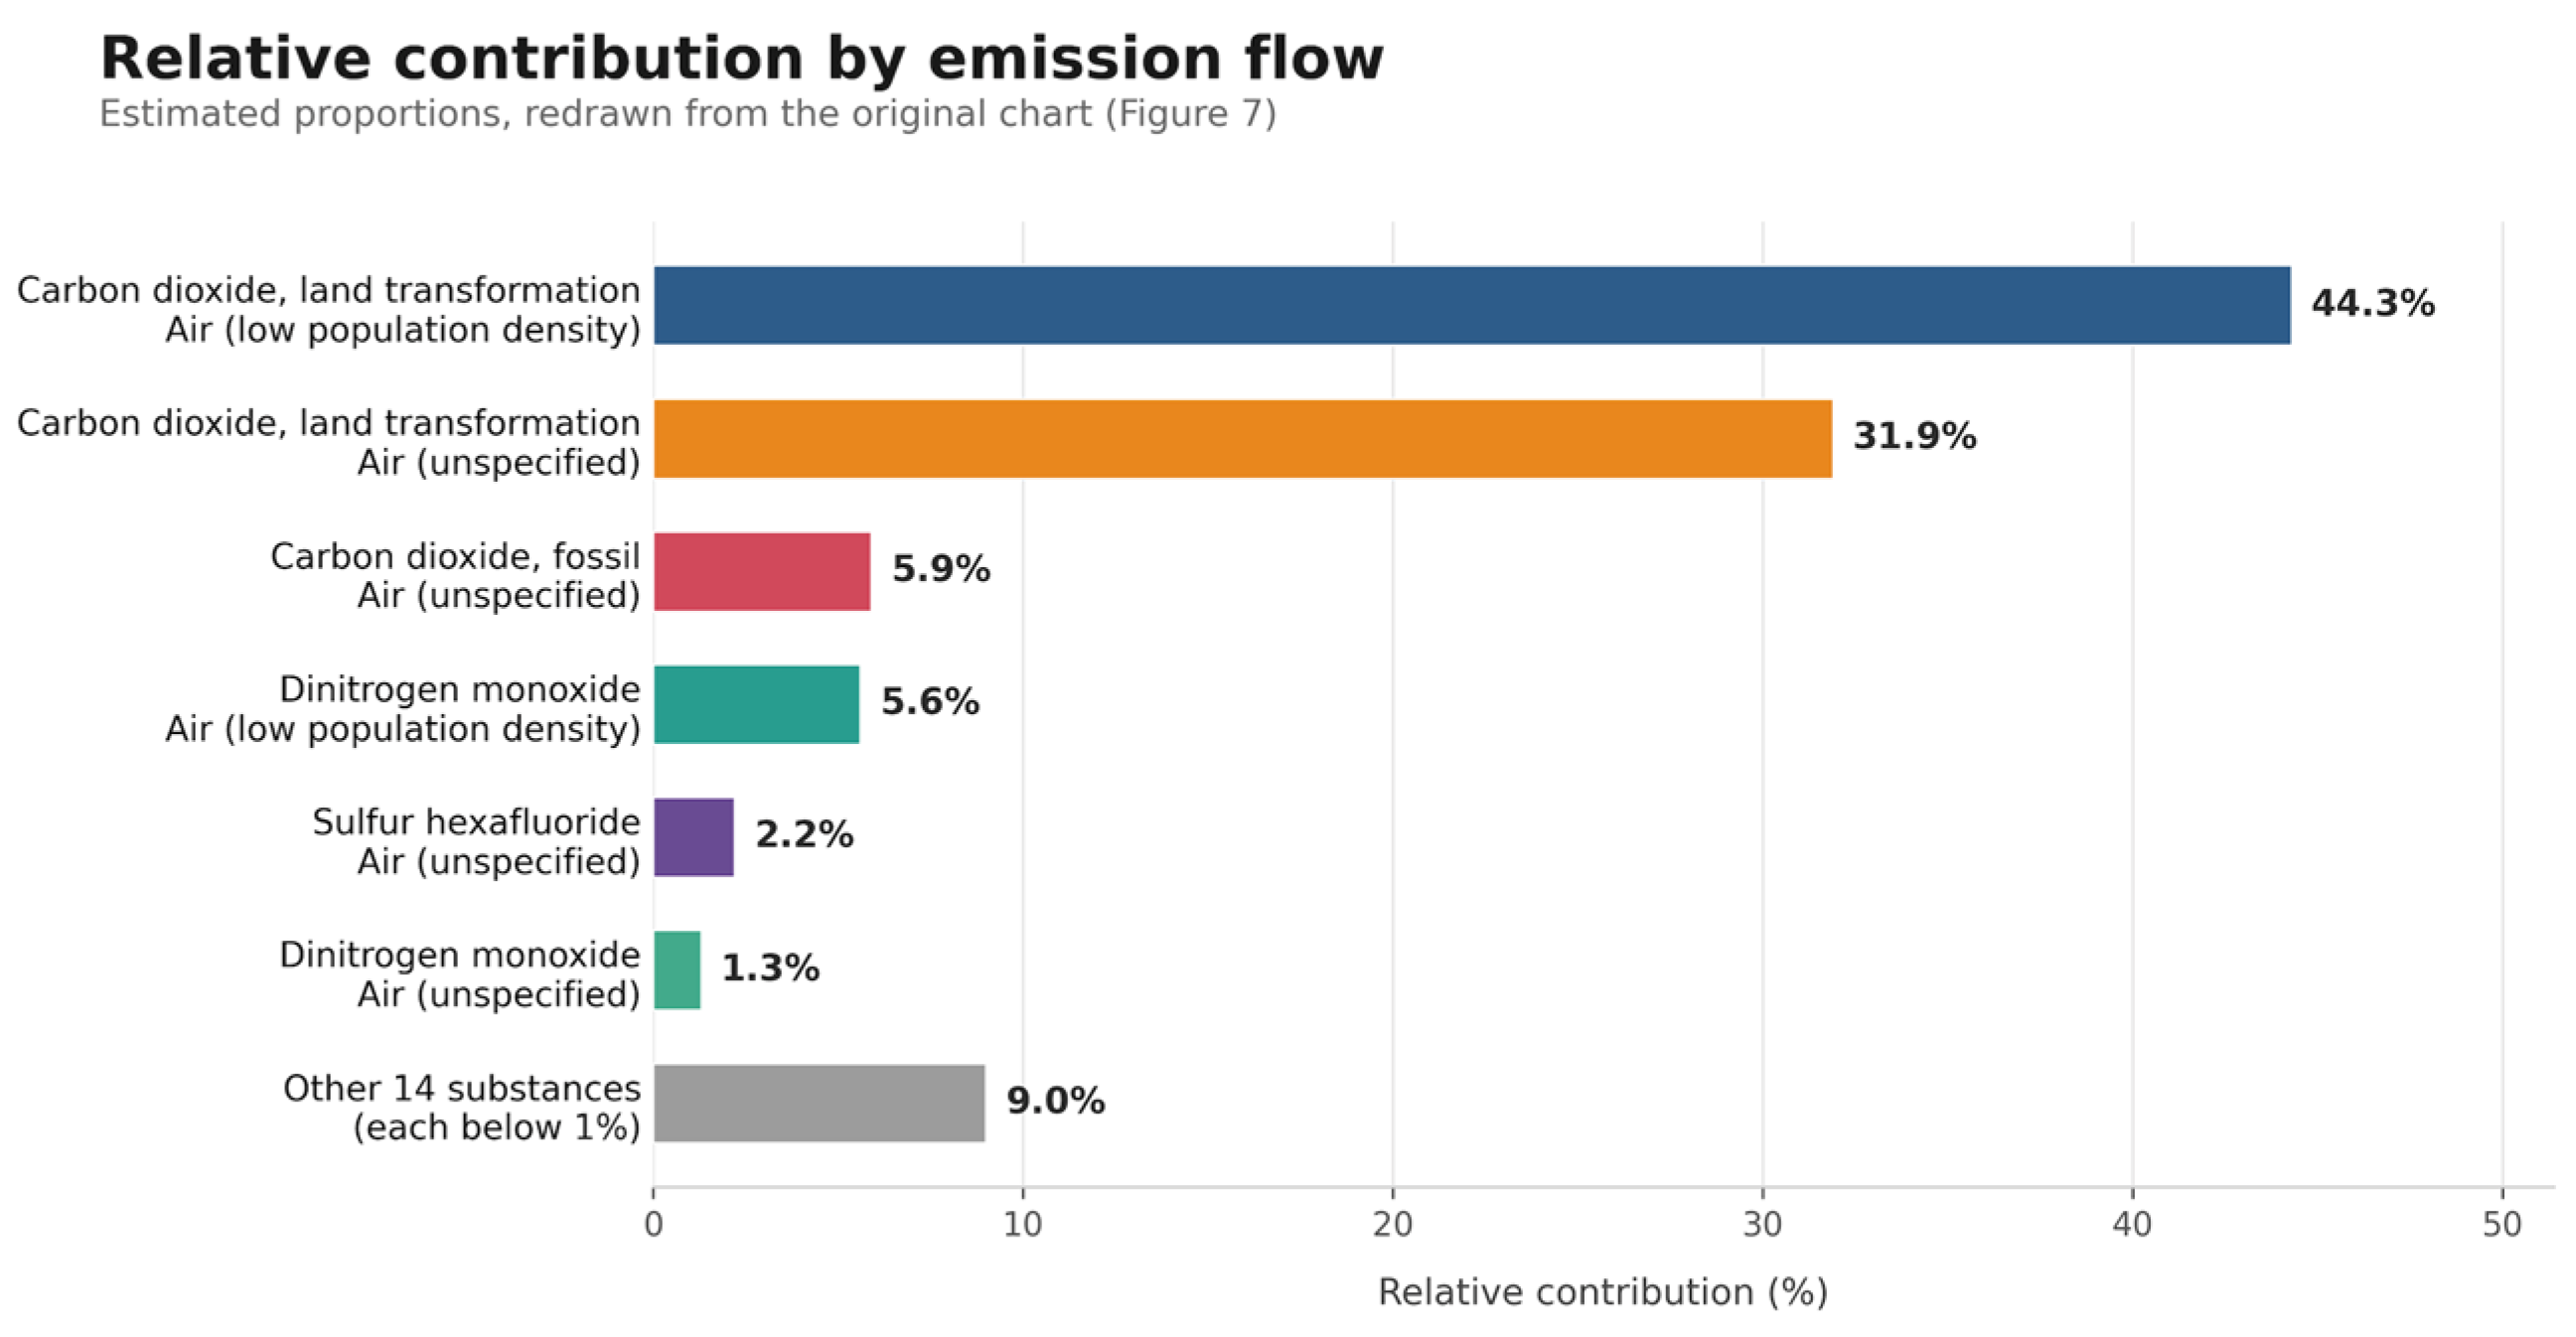
Regarding the contribution of each process input, crude soybean oil had the highest value, followed by soybean grain production and corn grain production. For atmospheric emissions contributing to global warming, the largest contribution came from carbon dioxide (CO2), originating from land transformation and fossil fuels, with a smaller proportion from nitrous oxide (N2O) (Figure 7).
Figure 7.
Atmospheric emissions that contribute to global warming—Phase 2. Source: Authors.
During the second growth phase, birds experience accelerated weight gain and increased feed intake. As a result, the environmental contribution of feed-related inputs becomes more pronounced. The predominance of soybean-derived ingredients reflects the growing protein requirements necessary to sustain muscle development, while the continued importance of corn is associated with its role as the principal energy source in broiler diets.
5.3. Phase 3: Inputs from the 14th to 21st Day
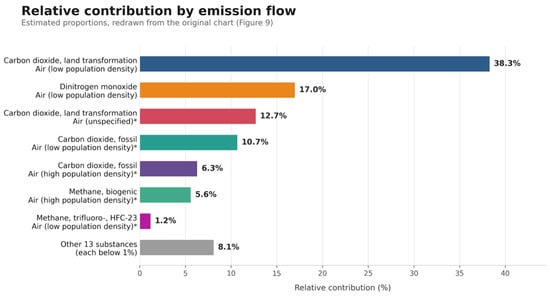
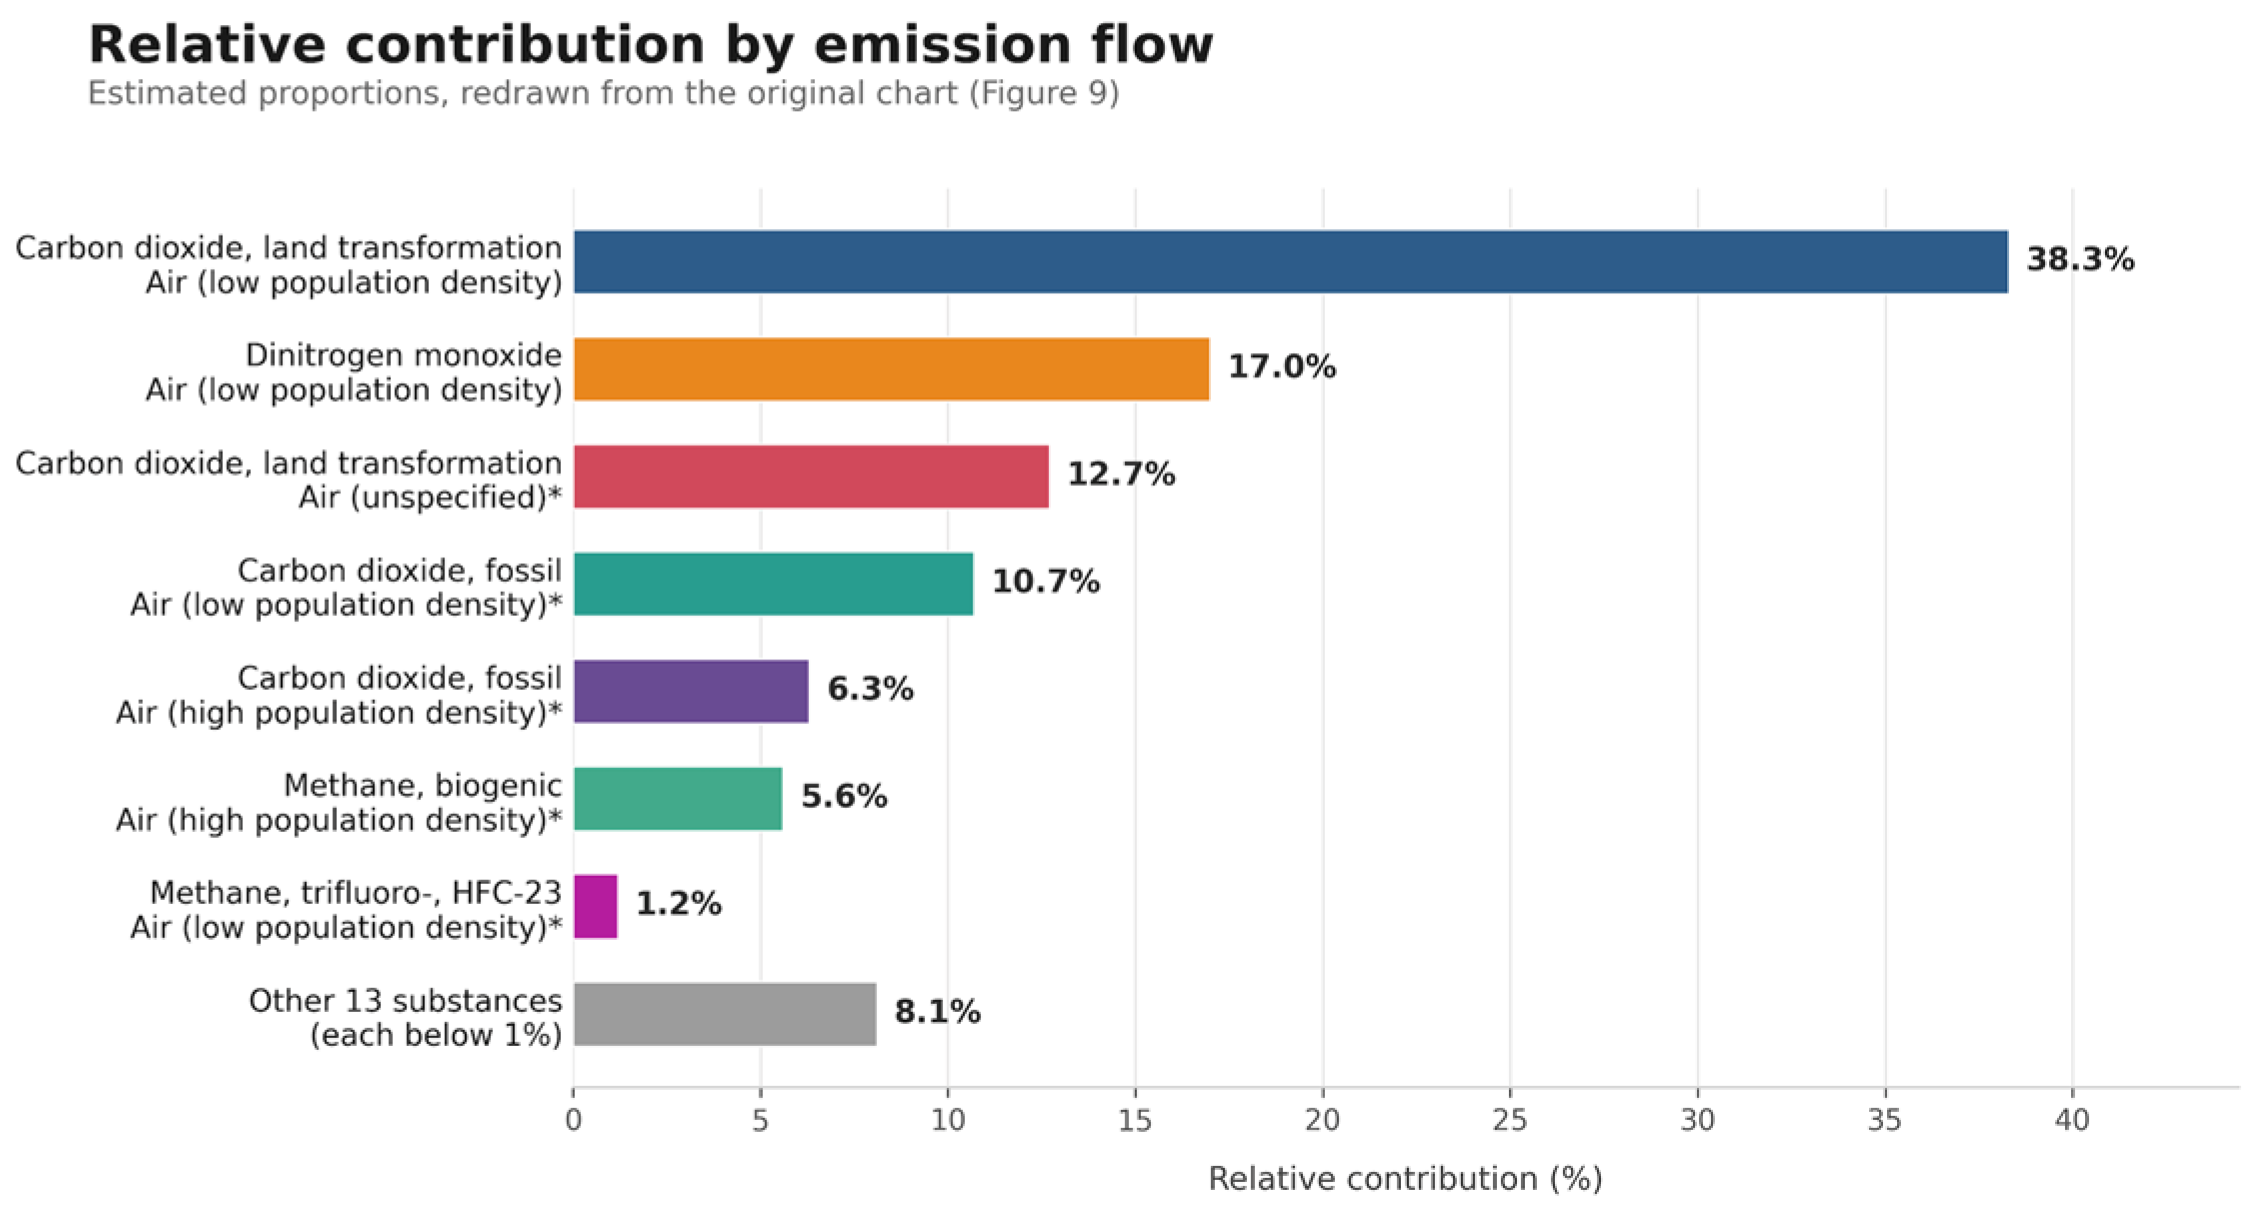
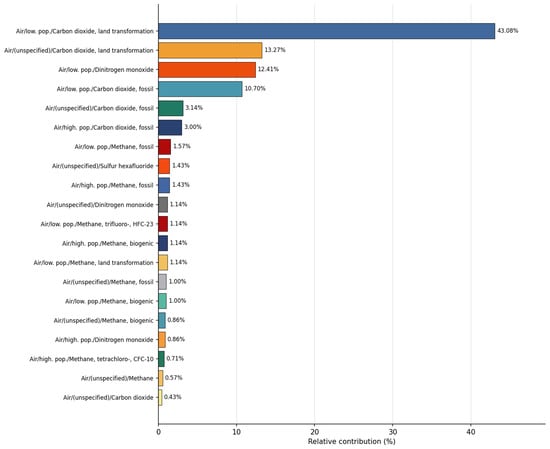
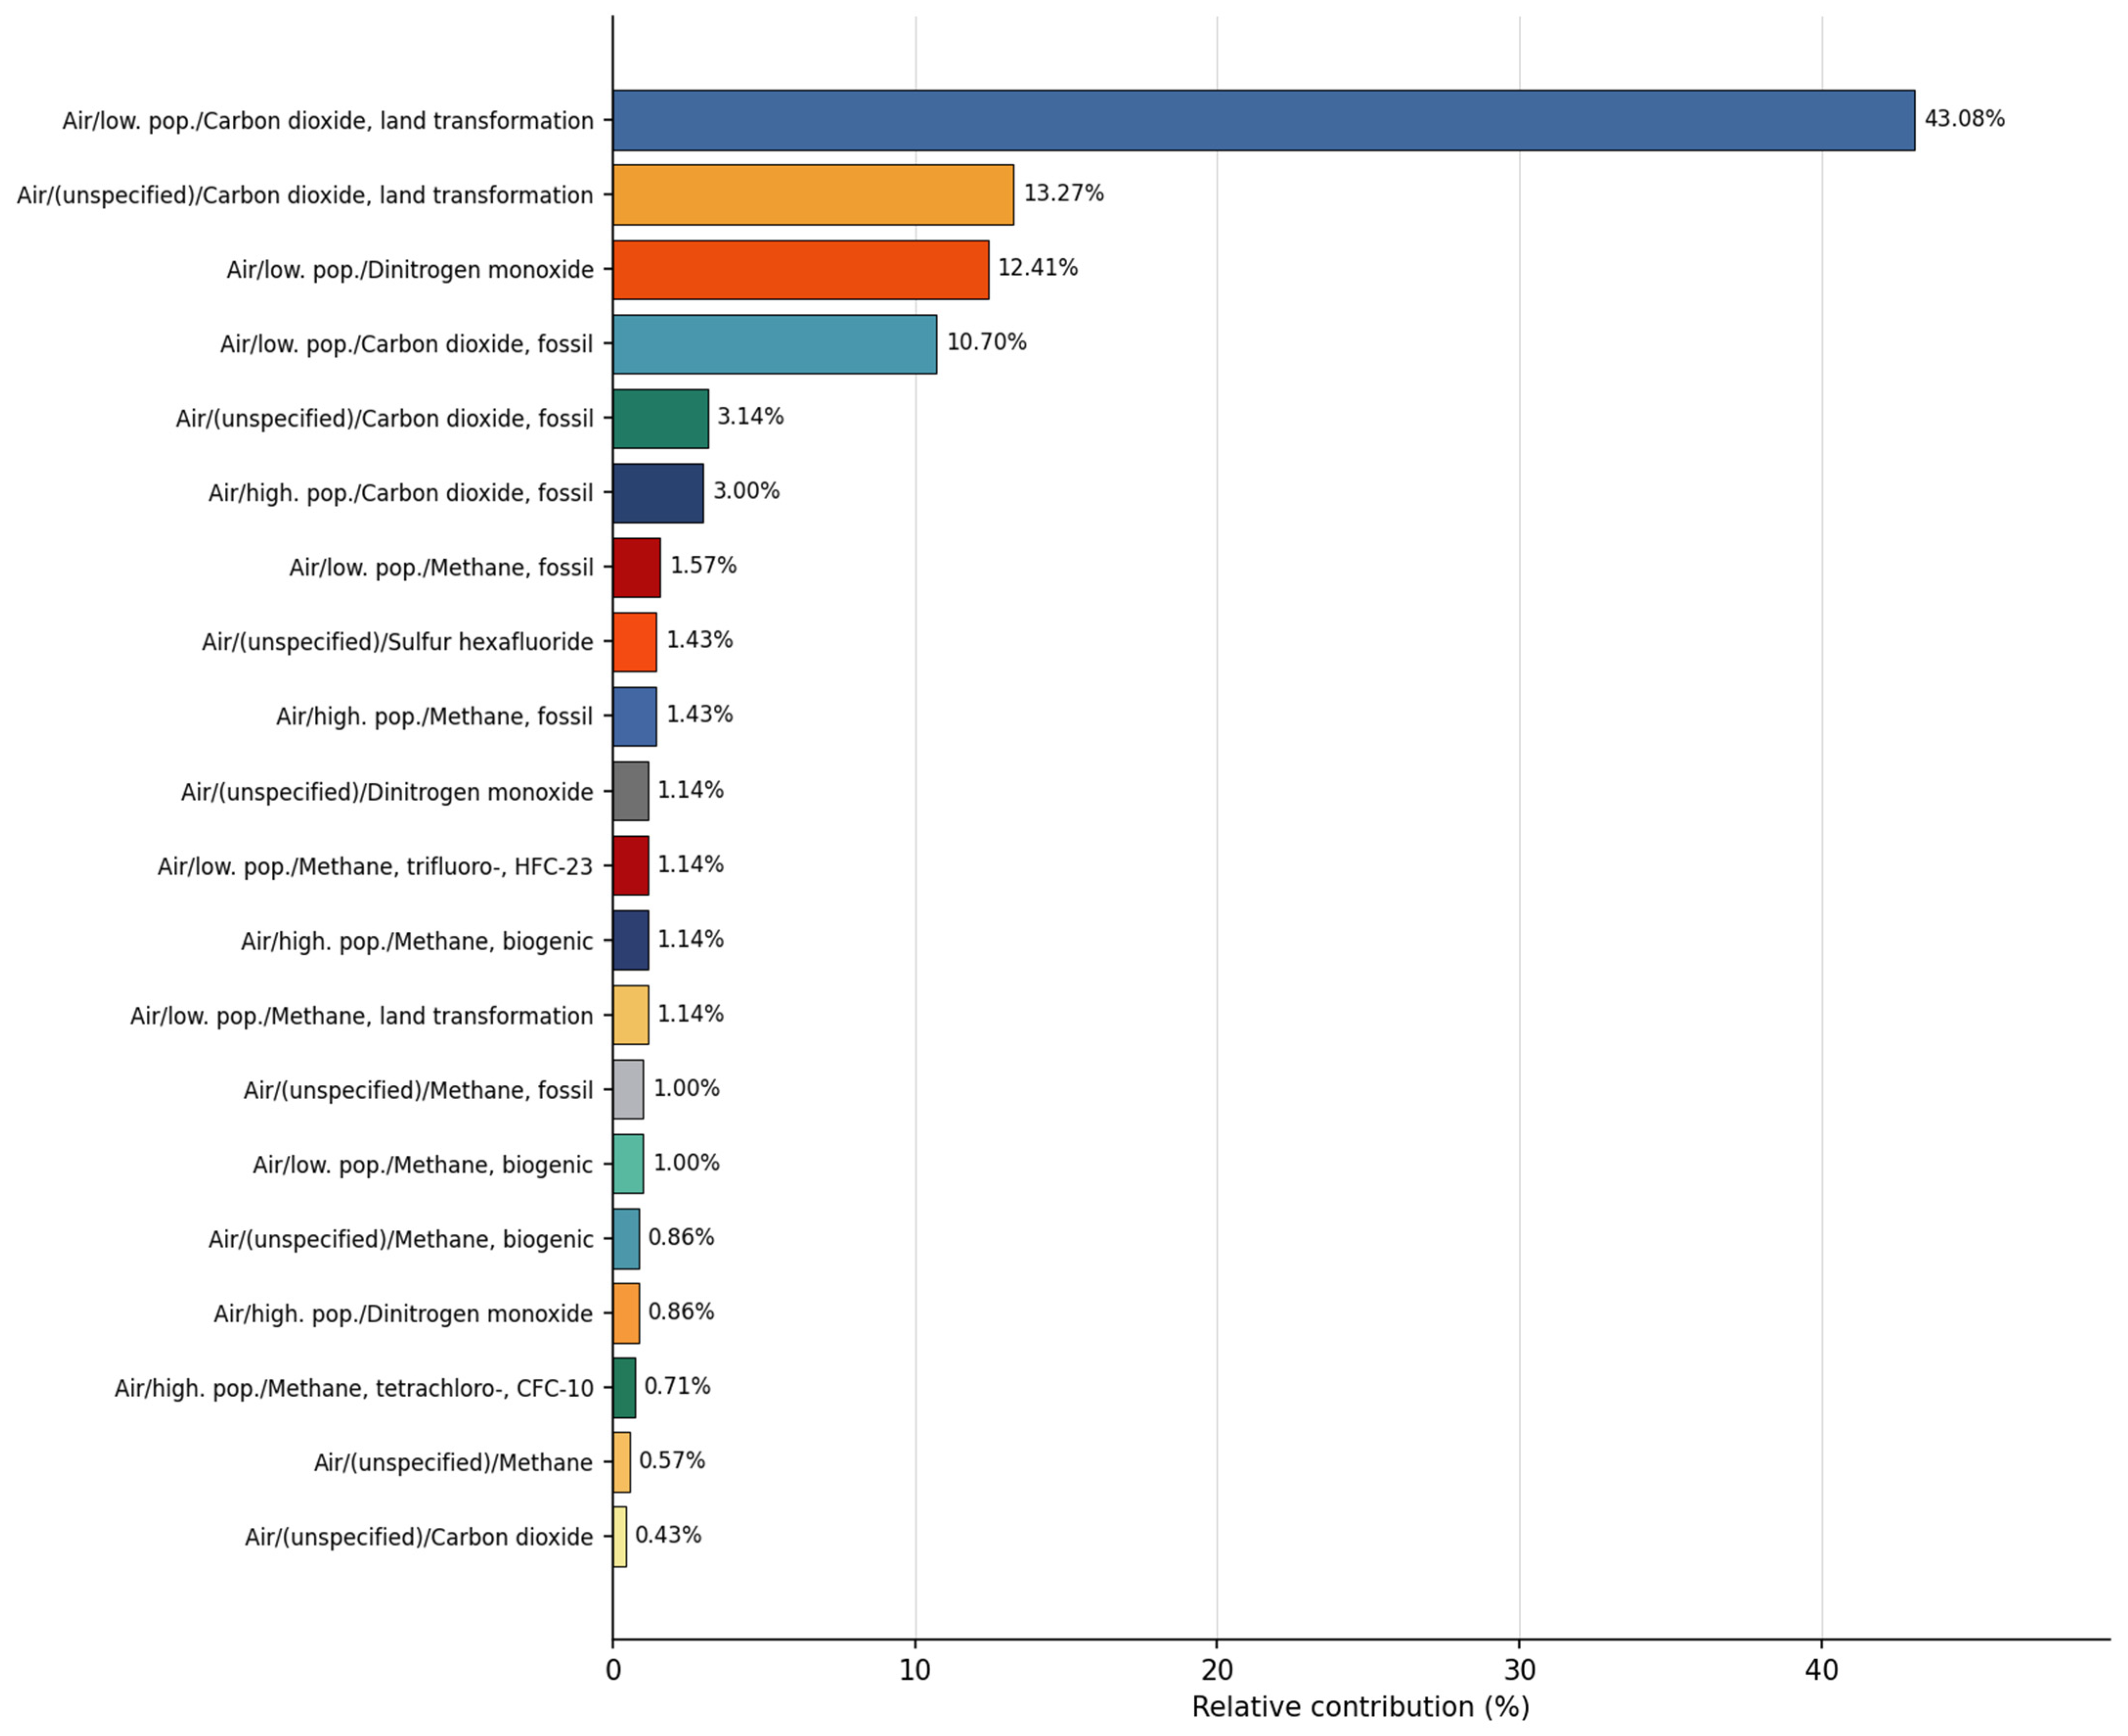
In the third fattening phase, corresponding to the 14th to 21st day, freshwater ecotoxicity (FETP) remained the environmental impact category with the highest value, as in the previous growth phases, as shown in Figure 8. Another impact category with a smaller contribution was marine ecotoxicity (METP). Among the process inputs, soy production was the largest contributor, with minimal participation from other inputs. Regarding atmospheric emissions contributing to global warming, carbon dioxide (CO2) from land transformation accounted for the largest share, followed by nitrous oxide (N2O) and carbon dioxide (CO2) derived from fossil fuels (Figure 9).
Figure 8.
Environmental impact categories—Phase 3. Source: Authors.
Figure 9.
Atmospheric emissions that contribute to global warming—Phase 3. Source: Authors.
The environmental hotspot distribution observed in the third phase is largely explained by the cumulative increase in feed demand associated with rapid biomass accumulation. At this stage, broilers convert nutrients into body mass at high rates, requiring substantial quantities of feed ingredients whose upstream agricultural production is associated with land occupation, fertilizer use, and ecotoxicity-related emissions.
5.4. Phase 4: Inputs from the 21st to 38th Day
In the fourth fattening phase, corresponding to the 21st to 38th day, freshwater ecotoxicity (FETP) remained the environmental impact category with the highest value, as in the previous growth phases (Figure 10). Another impact category with a smaller contribution was marine ecotoxicity (METP).
Figure 10.
Environmental impact categories—Phase 4. Source: Authors.
Among the process inputs, soy production was the largest contributor. Regarding atmospheric emissions contributing to global warming, carbon dioxide (CO2) from land transformation accounted for the predominant share of emissions, followed by nitrous oxide (N2O) (Figure 11).
Figure 11.
Atmospheric emissions that contribute to global warming—Phase 4. Source: Authors.
The higher environmental contribution observed during the final fattening phase is primarily explained by increased feed consumption associated with rapid biomass accumulation. As broilers approach market weight, nutritional requirements increase substantially, leading to greater demand for feed ingredients and, consequently, higher upstream environmental burdens. Therefore, the environmental profile of the final phase reflects not only the duration of the stage but also the cumulative effect of resource consumption throughout the production cycle.
5.5. Comparison Between Phases
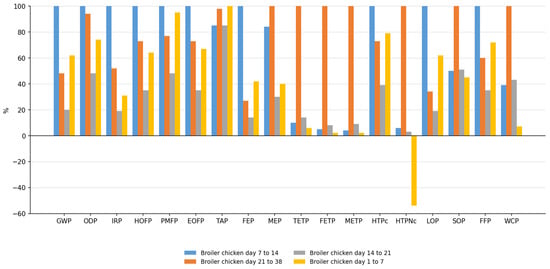
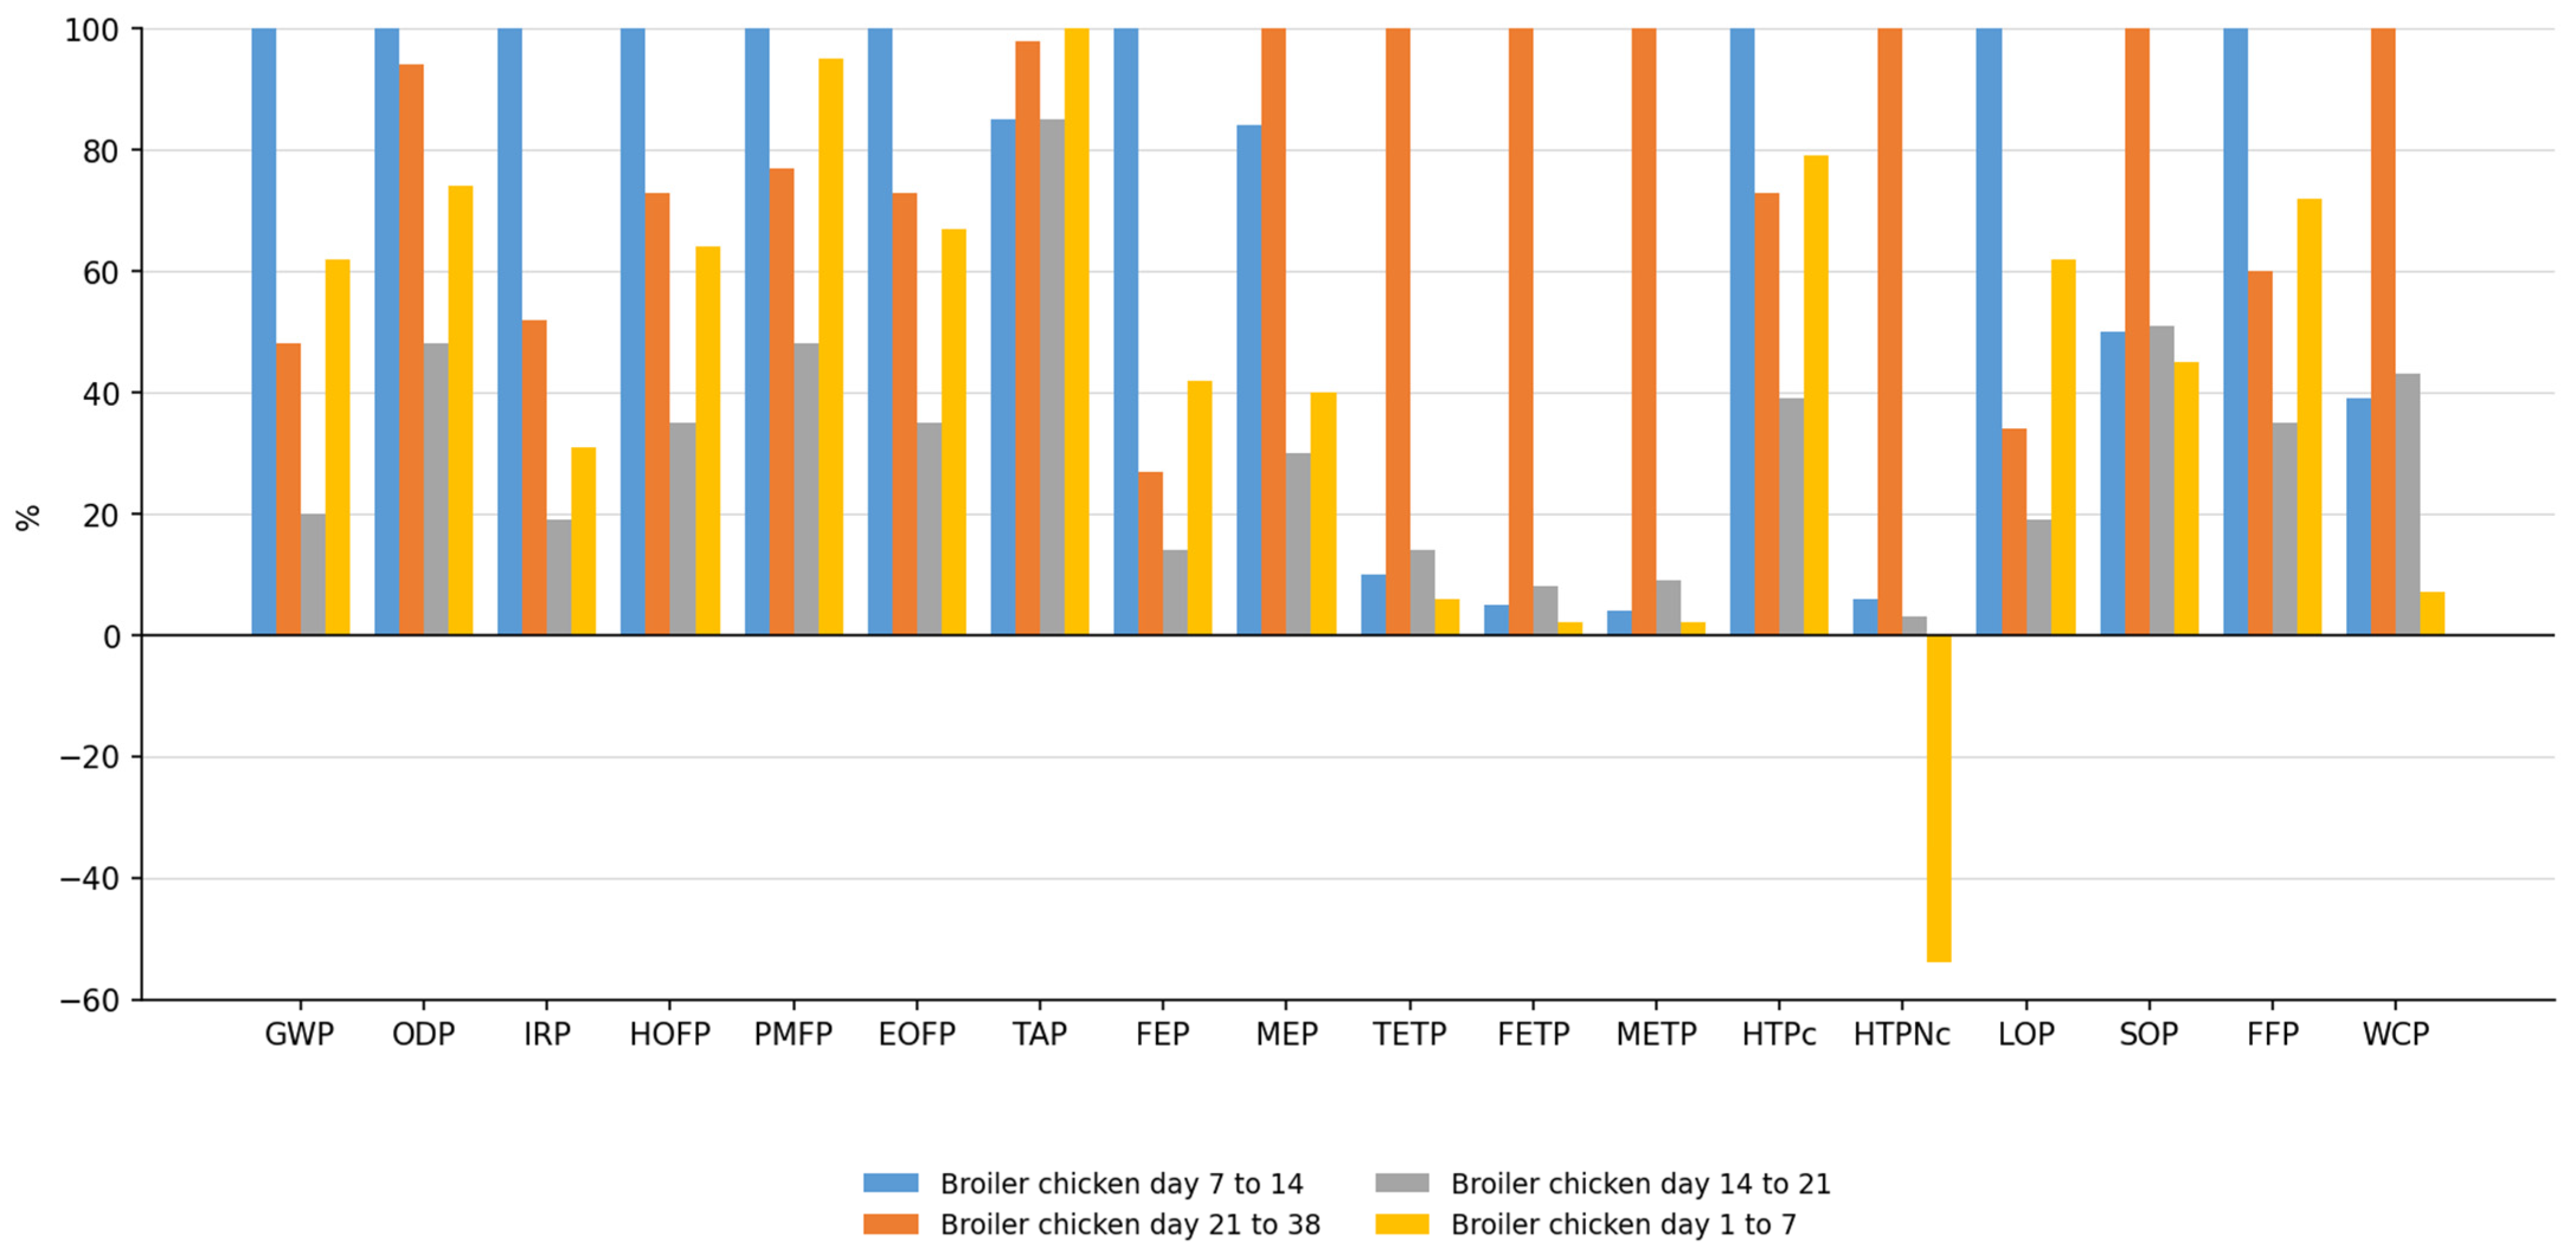
The characterization values of each impact category based on the fattening phases are presented in Table 3 and illustrated in Figure 12 as a percentage contribution. It is important to note that the Global Warming Potential results presented in Table 3 represent the contribution of a single environmental impact category. Therefore, the phase exhibiting the highest GWP value does not necessarily correspond to the phase with the highest overall environmental burden when all impact categories are considered simultaneously.
Table 3.
Environmental impact categories for each fattening phase.
Figure 12.
Percentage contribution of environmental impact categories per fattening phase. Source: Authors (2026).
The progressive increase in environmental impacts across the fattening phases can be explained by changes in broiler physiology and nutritional requirements throughout the production cycle. As birds grow, feed intake increases substantially to sustain muscle development and body mass accumulation. Consequently, greater quantities of soybean grain, corn grain, and soybean oil are required, increasing the environmental burdens associated with agricultural production, land use, fertilizer application, and associated emissions.
The predominance of freshwater ecotoxicity throughout all phases is closely linked to the upstream production of feed ingredients, particularly soybean-based products, which are associated with pesticide use and emissions affecting aquatic ecosystems. Similarly, the contribution to global warming is strongly influenced by agricultural production processes and land transformation associated with feed cultivation. Therefore, the environmental hotspot distribution observed in this study reflects not only the quantity of feed consumed but also the environmental characteristics of the agricultural systems that support broiler nutrition.
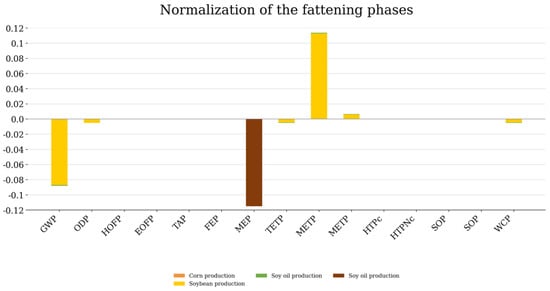
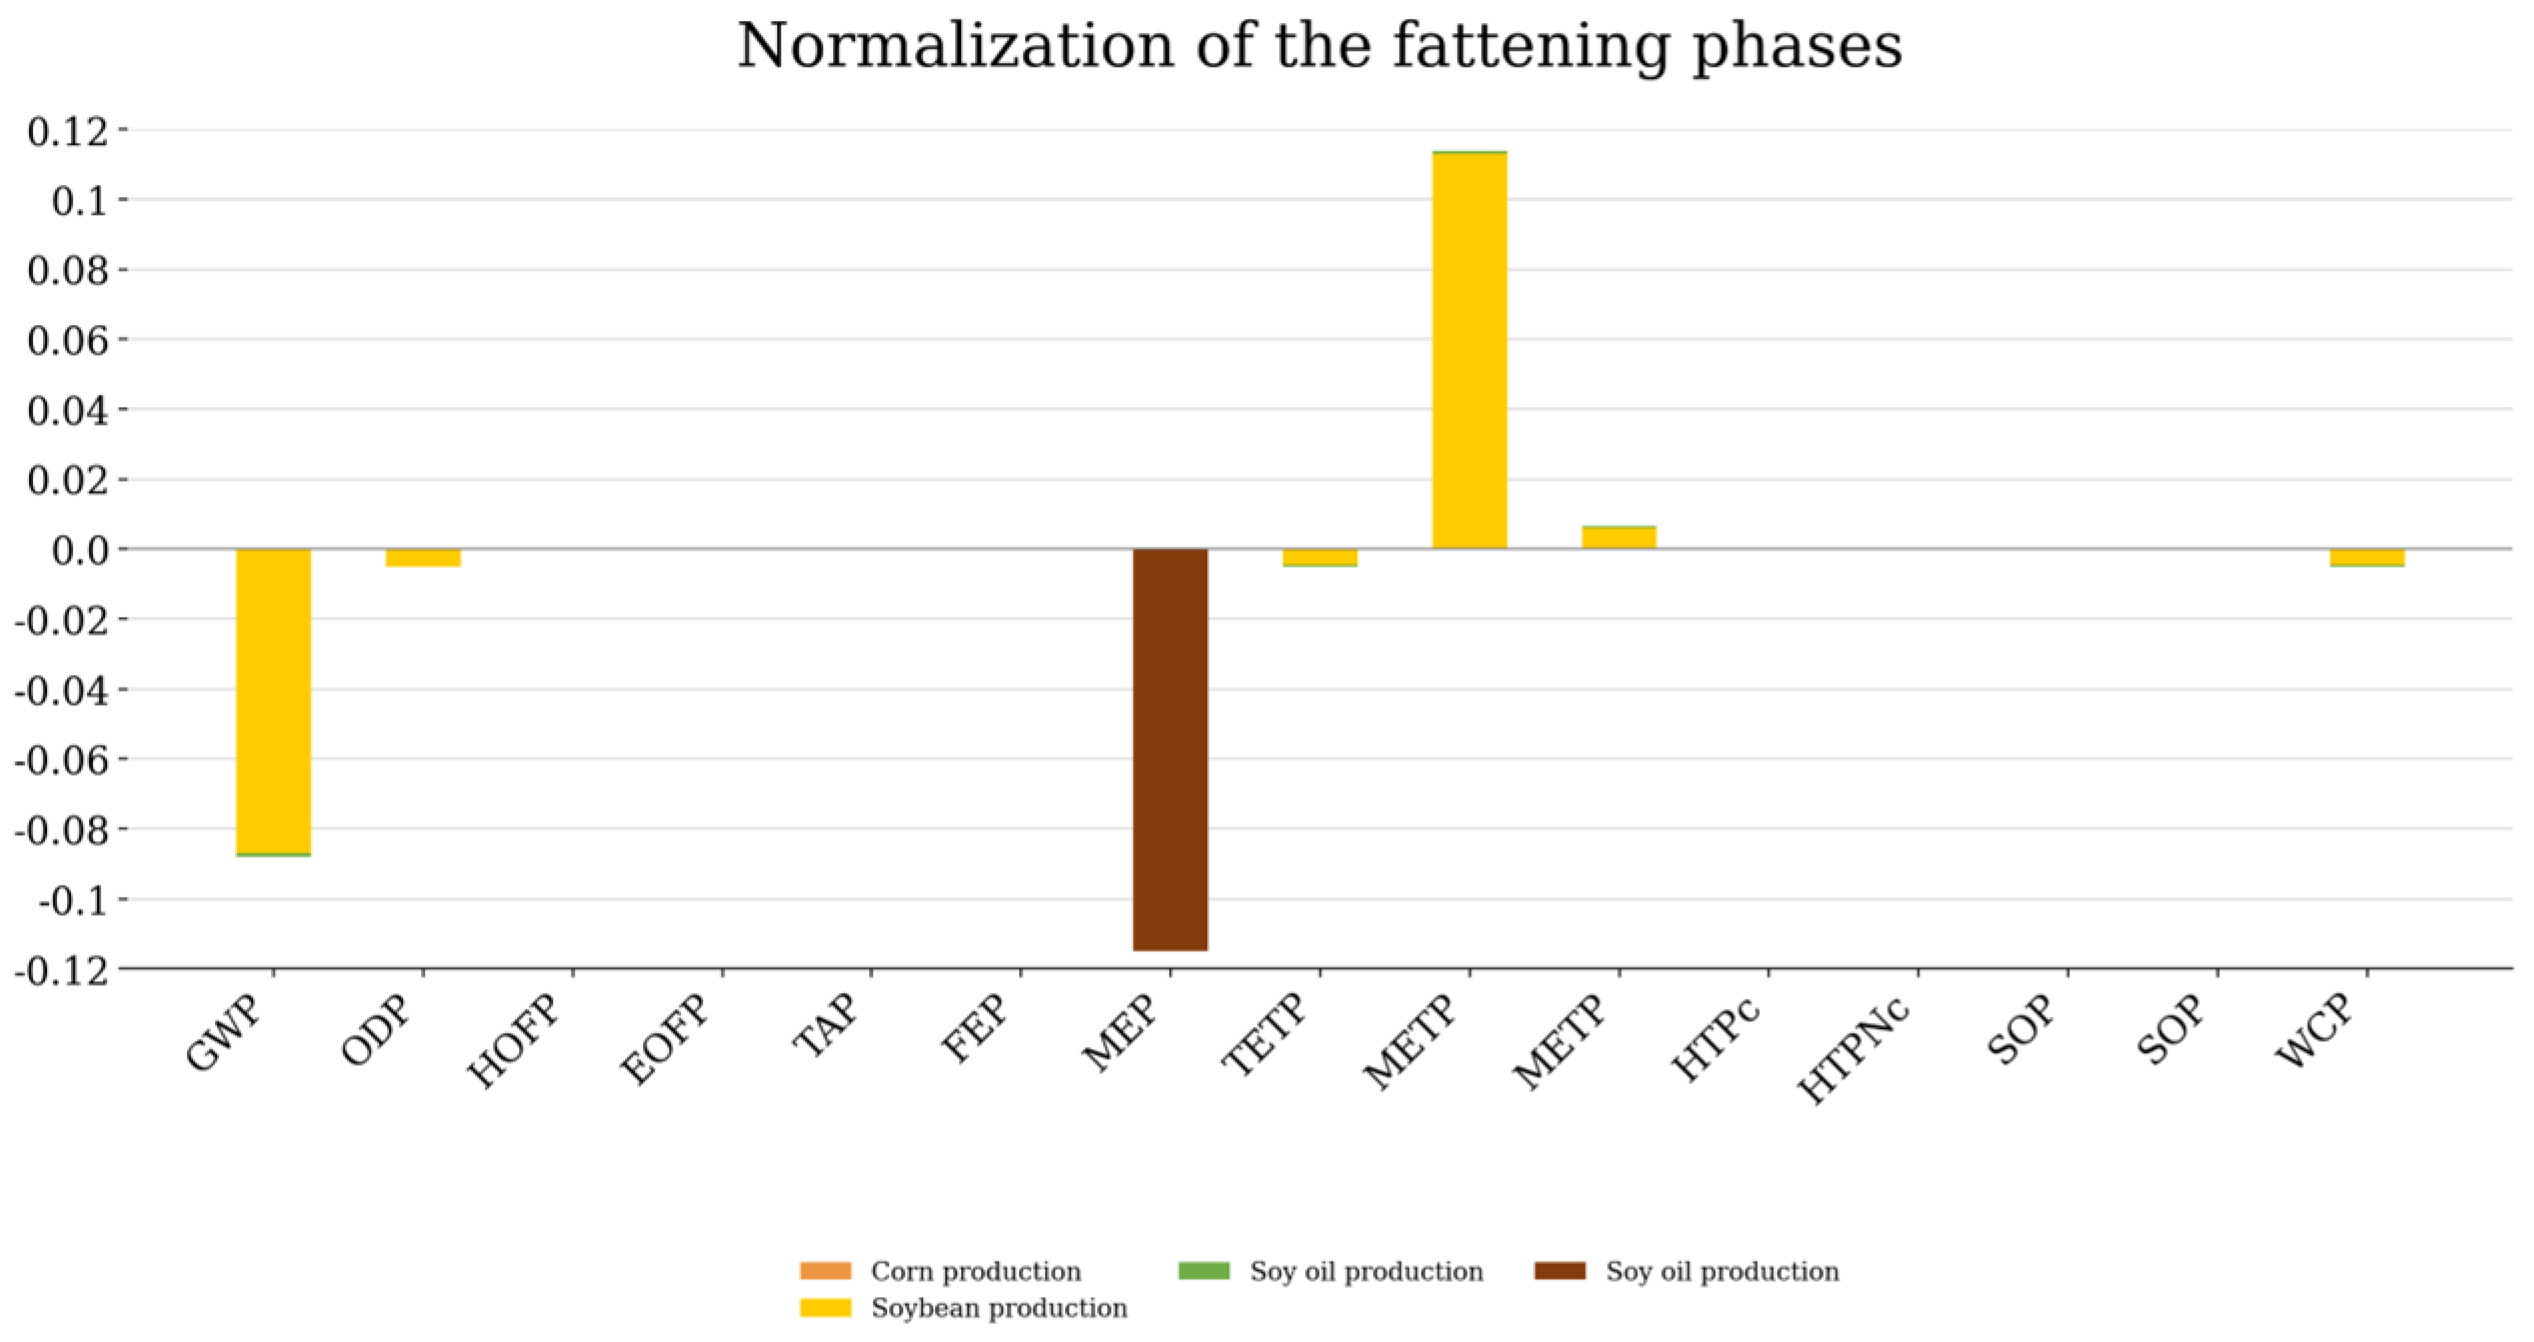
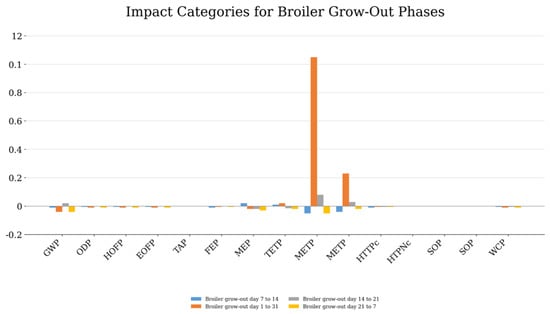
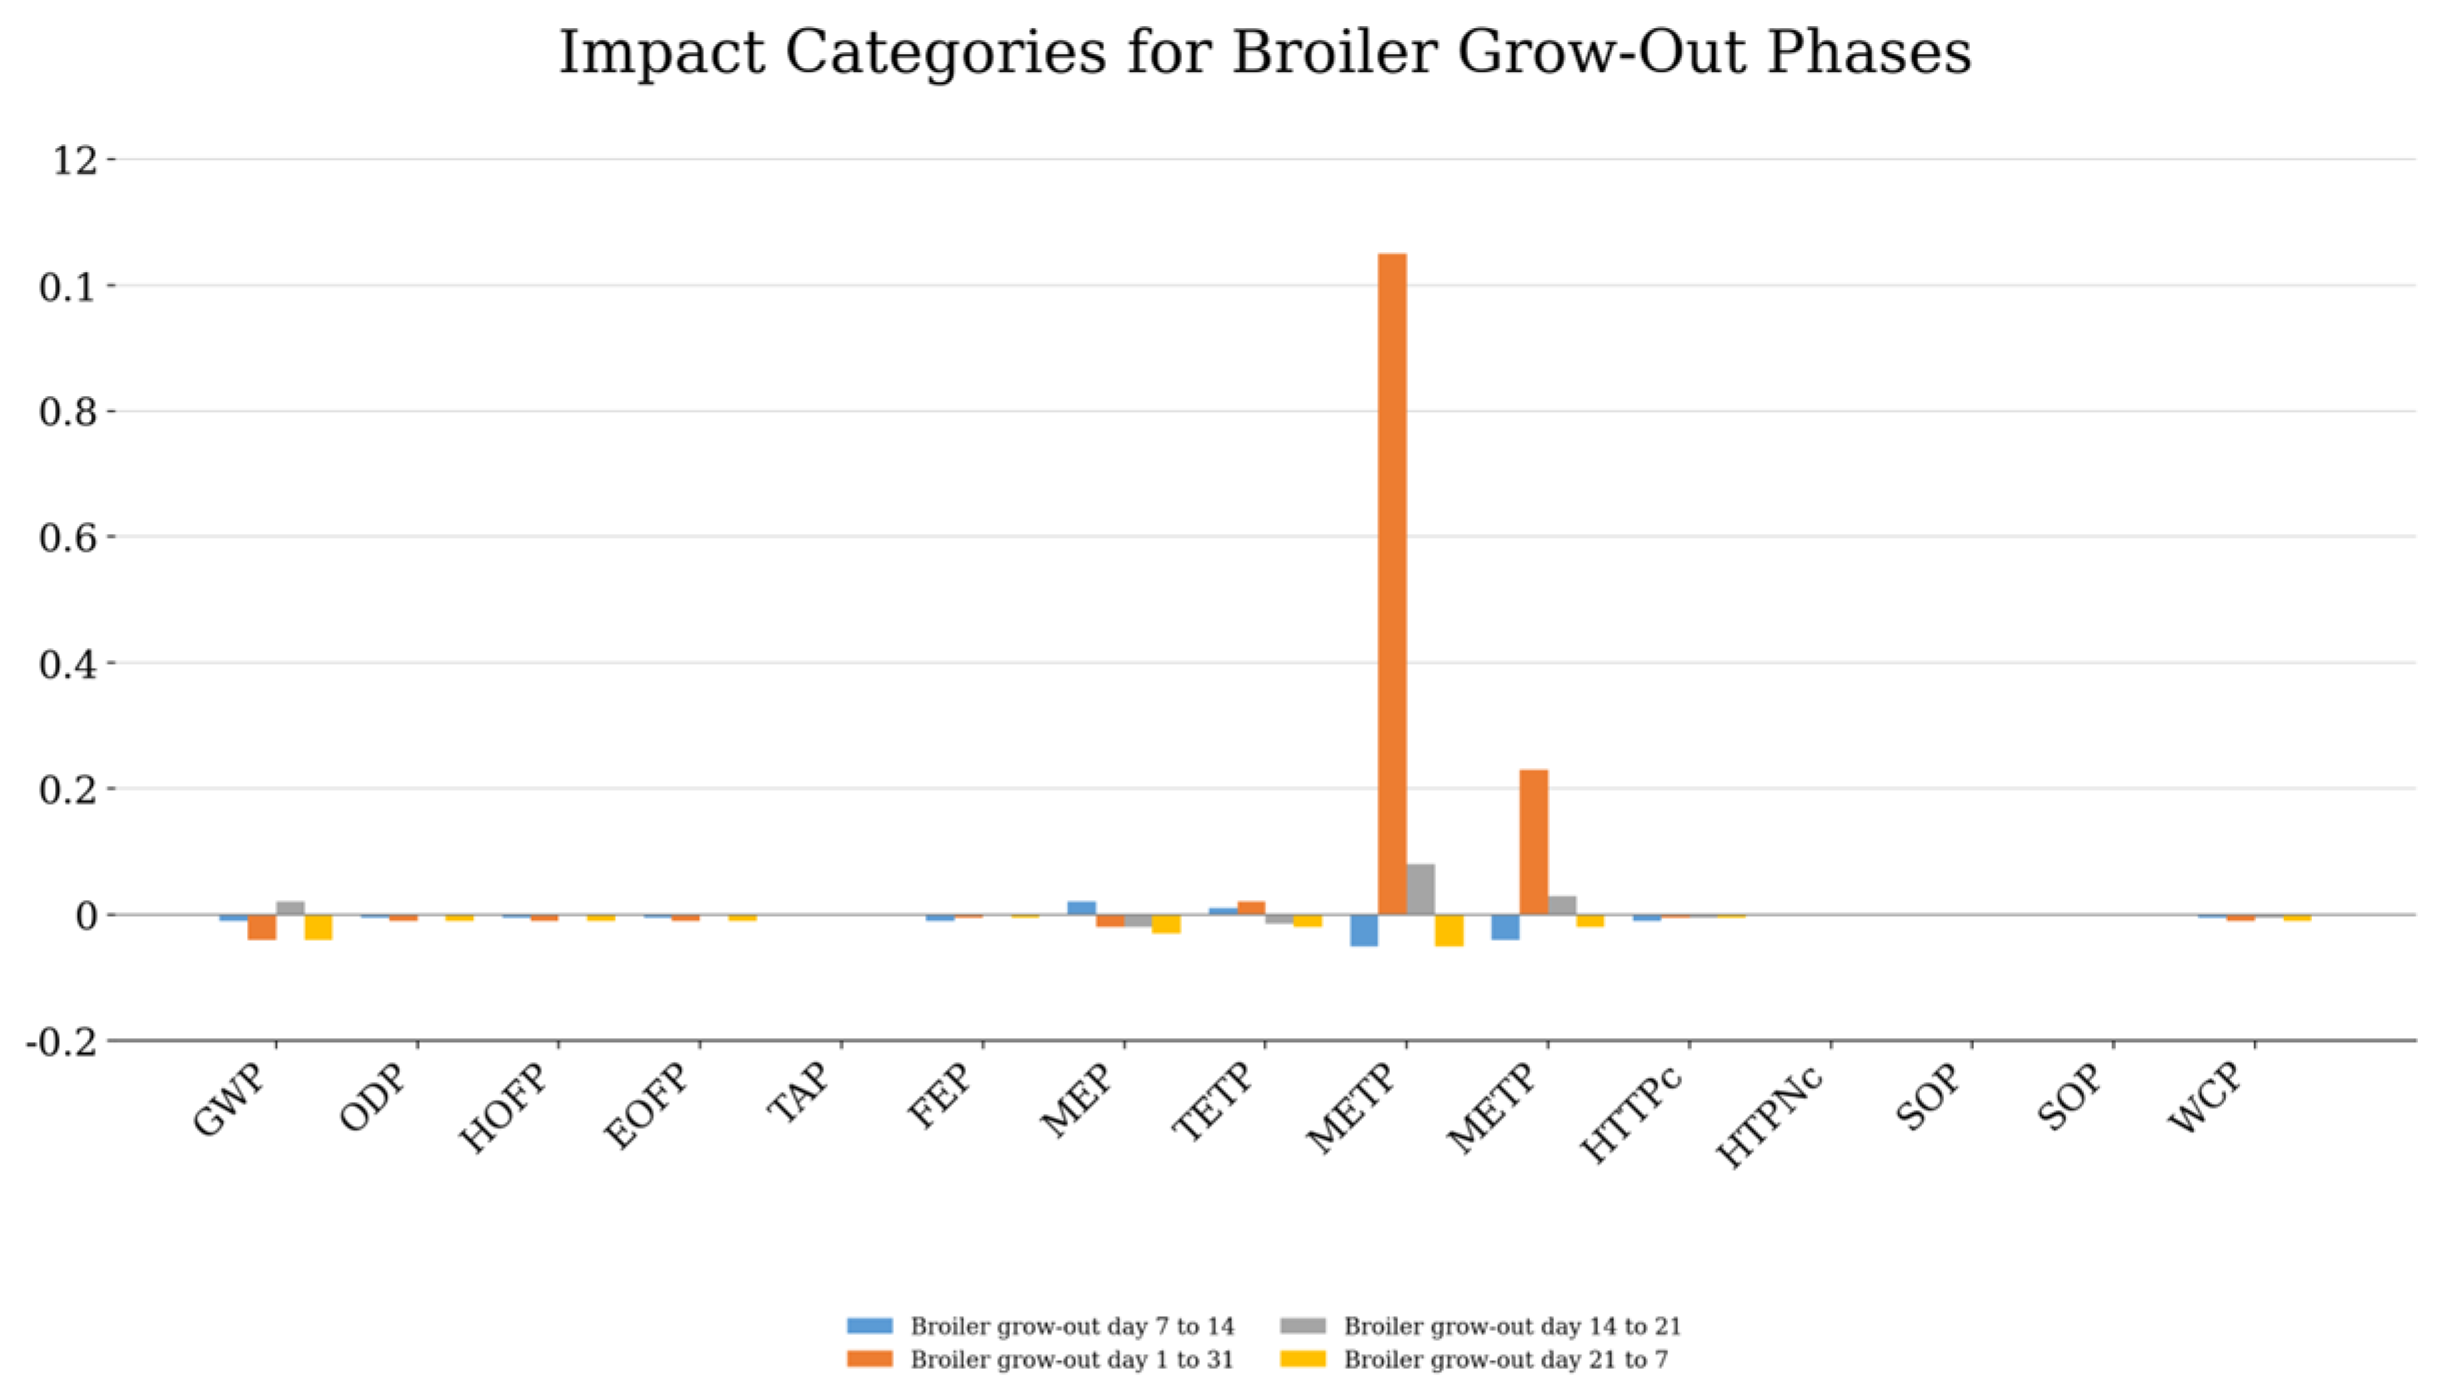
The characterization values for each fattening phase were normalized to a common, unitless scale to allow identification of the most significant impact categories. Figure 13 presents the normalized results in a graph, showing that the final fattening phase exhibited the highest environmental impact values, particularly in the freshwater ecotoxicity (FETP) and marine ecotoxicity (METP) categories. The normalized assessment provides a broader perspective of environmental performance because it considers the relative contribution of multiple impact categories rather than a single environmental indicator. Although Phase 2 presented the highest value for Global Warming Potential, the normalization results indicated that Phase 4 exhibited the greatest overall environmental burden due to its combined contribution across several impact categories, particularly freshwater ecotoxicity and marine ecotoxicity. Consequently, the interpretation of environmental performance differs depending on whether individual impact categories or normalized results are considered.
Figure 13.
Normalization of the fattening phase. Source: Authors (2026).
6. Discussion
The GWP ranged from 0.712 kg CO2-eq in Phase 3 to 3.53 kg CO2-eq in Phase 2, considering the production of 1 kg of live chicken. Although the initial phases exhibited the highest absolute GWP values, the normalized analysis revealed that Phase 4 contributed the greatest relative share to the total system, particularly in freshwater ecotoxicity (FETP) and marine ecotoxicity (METP). This distinction reflects the cumulative nature of the inventory structure and the substantial increase in feed consumption as broilers approach market weight, which amplifies upstream agricultural burdens during the final growth stage.
The predominance of FETP across all phases is closely associated with upstream agricultural activities required for feed production. Soybean and corn cultivation involve agricultural inputs and emissions—including heavy metals, pesticides, and nitrate leaching—that contribute to ecotoxicity-related pathways in the life cycle inventory. This result aligns with Pelletier [77], who identified the agricultural phase as the main source of feed-related impacts, and with Silva et al. [62], Nielsen et al. [59], Bengtsson & Seddon [1], Cesari et al. [60], and Andretta et al. [58], in all of whom feed formulation emerges as the central environmental driver. The strong dependence of Brazilian poultry systems on grain-based feed originating from large-scale agricultural production reinforces that environmental improvements cannot be addressed solely at the farm level but require integrated strategies involving feed formulation, agricultural management, and supply-chain coordination.
The contribution of land transformation-related CO2 emissions is influenced by the modeling assumptions embedded in the background datasets used to represent agricultural production. Although Ecoinvent is widely applied in LCA studies, some agricultural processes may not fully capture regional characteristics of Brazilian systems, including land-use dynamics, crop productivity, and management practices. Consequently, the results should be interpreted considering the inherent limitations of the geographical representativeness of secondary datasets. Furthermore, because detailed operational data for heating, ventilation, electricity consumption, and lighting were unavailable, these processes were not explicitly represented in the inventory. While feed production is consistently identified in the literature as the dominant environmental hotspot in poultry systems, the exclusion of operational energy uses may influence the relative contribution of certain impact categories and should be considered when interpreting the results.
The GWP value obtained in this study (1.69 kg CO2-eq/kg live chicken, farm gate) is consistent with international references: Pelletier [77] (1.40 kg CO2-eq, USA), González-García et al. [65] (1.62 kg CO2-eq, Portugal), and Kalhor et al. [60] (1.4–3.3 kg CO2-eq, Iran). In the Brazilian context, it approximates Silva et al. [62] for the Midwest region (1.45 kg CO2-eq) and remains lower than Alves et al. [78] (2.0–3.37 kg CO2-eq). Higher values reported by Leinonen et al. [79] and Payandeh et al. [69] (4.41–5.66 and 5.78 kg CO2-eq, respectively) are likely attributable to differences in production systems, stocking densities, and feed composition, while the highest values—such as Bengtsson & Seddon [1] (3.71 kg CO2-eq) and Cesari et al. [60] (5.52 kg CO2-eq)—reflect broader system boundaries extending beyond the farm gate. Regarding intra-phase patterns, while Cesari et al. [60] identified higher environmental impacts in heavier chickens due to longer production cycles and poorer feed conversion, the present study found higher GWP values in the initial phases, which may relate to specific feeding management practices and the cumulative inventory structure adopted.
Mitigation strategies should prioritize feed reconfiguration, combining improvements in feed conversion efficiency with ingredients of reduced environmental footprint. Innovative alternatives, such as partial substitution of soybean and corn meal with insect-derived ingredients, show sustainable potential [80]; however, Smetana et al. [81] caution that species selection and production efficiency must be carefully evaluated to avoid introducing new critical impact points. By providing phase-disaggregated data for each impact category, this study offers inputs for optimization modeling and the development of environmental performance indicators applicable in audits and certifications, contributing to a more competitive and environmentally responsible poultry sector.
Table 4 presents a comparison of the GWP values obtained in this study with national and international LCA studies on broiler production systems, including different system boundaries, locations, and functional units, allowing contextualization of the results within the existing literature.
Table 4.
Comparisons of other broiler production studies regarding Global Warming Potential (GWP).
Study Limitation and Future Research
An important limitation of this study is that no formal sensitivity analysis or uncertainty assessment was performed. Although the inventory was developed using primary production data and established life cycle databases, environmental results may be influenced by variations in operational parameters such as feed conversion efficiency, feed ingredient composition, and background processes represented in secondary databases. Because feed-related inputs were identified as the main environmental hotspots, variations in these parameters could affect the magnitude of impact indicators, particularly Global Warming Potential and Freshwater Ecotoxicity. Future studies should incorporate sensitivity analyses, uncertainty assessments, and scenario-based evaluations to investigate the robustness of environmental results under different production and feed management conditions.
Additional limitations are associated with the availability of detailed inventory information regarding transportation logistics and energy consumption. Although feed production was identified as the dominant environmental hotspot, future studies should incorporate detailed transportation distances, electricity consumption, thermal energy use, and region-specific agricultural inventories to further improve the representativeness and completeness of environmental assessments in Brazilian poultry production systems.
Although primary operational data were obtained directly from the participating company, some information related to housing conditions, stocking density, genetic lineage, and detailed environmental management practices was not available for disclosure. Consequently, caution should be exercised when extrapolating the results to all poultry production systems, since environmental performance may vary according to management practices, climatic conditions, and production characteristics.
The main limitations of this research lie in data restrictions, which prevented the inclusion of prior processes (such as incubation) and subsequent processes (slaughter, distribution, and consumption), as well as the consideration of variations among different companies and production systems. These limitations constrain the extrapolation of results to the entire Brazilian poultry sector.
As a future research agenda, it is recommended to: (i) expand the scope of analysis to the entire production chain, incorporating all stages from incubation to final consumption; (ii) conduct inter-company and inter-regional comparisons to assess the role of operational efficiency in impact mitigation; (iii) investigate the life cycle of innovative feed formulations, including agro-industrial by-products and emerging proteins; and (iv) integrate multi-objective optimization techniques to balance economic and environmental performance.
The interpretation of the results should consider certain limitations associated with the available production system descriptors. Information regarding housing infrastructure, stocking density, genetic line, local climatic conditions, and other operational management parameters was not available for disclosure. These factors may influence environmental performance and contribute to variability among poultry production systems. Consequently, caution should be exercised when directly extrapolating the results to production systems operating under different environmental, technological, or managerial conditions. Nevertheless, the evaluated system reflects a commercial-scale, vertically integrated poultry production model that is widely adopted in Brazil, supporting the relevance of the identified environmental hotspots and impact patterns.
Although each limitation identified in this study can be individually justified by data availability constraints, their combined effect should be considered when interpreting the results. The absence of sensitivity and uncertainty analyses, together with the lack of detailed information regarding transportation, operational energy consumption, and certain production system descriptors, may influence the magnitude of the calculated environmental impacts and the relative contribution of specific processes. Consequently, while the identified environmental hotspots provide important insights into the assessed production system, their exact ranking and quantitative contribution should be interpreted with appropriate caution.
7. Conclusions
This study demonstrated that environmental impacts vary substantially across broiler fattening phases and that freshwater ecotoxicity represents the dominant impact category throughout the production cycle, primarily associated with soybean grain, corn grain, and soybean oil. Although global warming potential remained relevant—with Phase 2 exhibiting the highest absolute GWP value—the normalized assessment revealed that Phase 4 presented the greatest overall environmental burden when all impact categories were considered simultaneously, particularly in freshwater and marine ecotoxicity. This distinction highlights the importance of considering multiple impact categories rather than relying on a single environmental indicator when assessing poultry production systems.
The phase-specific perspective adopted in this research provides additional insight into the temporal distribution of environmental burdens and contributes to a more detailed understanding of how environmental hotspots evolve throughout the broiler growth cycle. Unlike most previous studies that report impacts at the whole-system level, this approach supports the identification of stage-specific opportunities for environmental improvement within large-scale integrated poultry systems.
The findings indicate that environmental improvements in Brazilian poultry systems should prioritize feed-related strategies, including optimization of feed composition, improvements in feed conversion efficiency, and the adoption of agricultural practices capable of reducing impacts associated with grain production. Although broiler production is often considered one of the most efficient livestock systems, the systemic LCA analysis reveals significant mitigation opportunities, particularly in the feed production stage, reinforcing the interdependence between the poultry sector and upstream agricultural supply chains.
The results should be interpreted within the assumptions and system boundaries adopted in the study. Future research should incorporate sensitivity analyses, uncertainty assessments, and scenario-based evaluations to investigate the robustness of environmental results under varying feed formulations, feed conversion ratios, and operational conditions, as well as expand the system boundaries to include energy consumption, transportation logistics, and region-specific agricultural inventories to improve the representativeness of environmental assessments in Brazilian poultry production systems.
The findings of this study should be interpreted within the scope of the available inventory data and the system boundaries adopted. Although the results consistently indicate the importance of feed-related inputs as major contributors to environmental impacts in the evaluated production system, additional studies incorporating operational energy consumption, transportation processes, uncertainty assessment, and sensitivity analysis would be valuable to further validate the relative magnitude and ranking of environmental hotspots. Therefore, the conclusions presented herein should be regarded as representative of the assessed commercial Brazilian broiler production system rather than universally applicable to all poultry production systems.
Author Contributions
Conceptualization, J.M.B.; methodology, G.A.d.M. and M.G.M.P.; software, G.A.d.M., J.S.d.C. and A.D.d.S.; Validation, G.A.d.M., M.G.M.P., J.S.d.C., A.D.d.S., M.C.A.d.M. and T.H.N.; formal analysis, J.M.B., M.d.S.P. and R.F.R.; investigation, J.M.B., M.d.S.P. and R.F.R.; resources, M.G.M.P.; data curation, J.M.B., M.d.S.P. and R.F.R.; writing—original draft, J.M.B.; writing—review & editing, J.M.B., G.A.d.M., M.G.M.P., J.S.d.C., A.D.d.S., M.C.A.d.M., A.L.M.S., M.d.S.P., R.F.R. and T.H.N.; visualization, G.A.d.M., M.G.M.P., J.S.d.C., A.D.d.S., M.C.A.d.M., A.L.M.S. and T.H.N.; supervision, G.A.d.M., M.G.M.P., J.S.d.C., A.D.d.S., M.C.A.d.M., A.L.M.S. and T.H.N.; project administration, G.A.d.M., M.G.M.P., J.S.d.C. and A.L.M.S. All authors have read and agreed to the published version of the manuscript.
Funding
This research received no external funding.
Institutional Review Board Statement
Not applicable.
Informed Consent Statement
Not applicable.
Data Availability Statement
Detailed information regarding housing characteristics, stocking density, genetic line, exact geographical location, and specific management practices could not be disclosed due to confidentiality agreements established with the participating company.
Acknowledgments
The authors would like to thank the Federal University of Lavras (UFLA), the University of Brasilia (UnB), and the Federal University of Viçosa, Rio Paranaíba Campus (UFV/CRP), for the support in the development of this research.
Conflicts of Interest
The authors declare no conflict of interest.
References
- Bengtsson, J.; Seddon, J. Cradle to retailer or quick service restaurant gate life cycle assessment of chicken products in Australia. J. Clean. Prod. 2013, 41, 291–300. [Google Scholar] [CrossRef] [Scilit]
- Godfray, H.C.J.; Beddington, J.R.; Crute, I.R.; Haddad, L.; Lawrence, D.; Muir, J.F.; Pretty, J.; Robinson, S.; Thomas, S.M.; Toulmin, C. Food security: The challenge of feeding 9 billion people. Science 2010, 327, 812–818. [Google Scholar] [CrossRef] [Scilit] [PubMed]
- Erdaw, M.M.; Beyene, W.T. Trends prospects the socio-economic contribution of poultry production in sub-Saharan Africa: A review. World’s Poult. Sci. J. 2022, 78, 835–852. [Google Scholar] [CrossRef] [Scilit]
- Leinonen, I.; Kyriazakis, I. How can we improve the environmental sustainability of poultry production? Proc. Nutr. Soc. 2016, 75, 265–273. [Google Scholar] [CrossRef] [Scilit] [PubMed]
- ABPA. Brazilian Association of Animal Protein. Sector Data [WWW Document]. 2023. Available online: https://abpa-br.org/ (accessed on 14 September 2024).
- Couch, J.R. Evaluation of Poultry Manure as a Feed Ingredient. World’s Poult. Sci. J. 1974, 30, 279–289. [Google Scholar] [CrossRef] [Scilit]
- Khan, S.; Fouzder, S.; Sarkar, P. Productivity profitability of commercial broiler chickens under various farming conditions. J. Exp. Biol. Agric. Sci. 2023, 11, 209–215. [Google Scholar] [CrossRef] [Scilit]
- Campos, I.; Valente, L.; Matos, E.; Marques, P.; Freire, F. Life-cycle assessment of animal feed ingredients: Poultry fat poultry by-product meal hydrolyzed feather meal. J. Clean. Prod. 2020, 252, 119845. [Google Scholar] [CrossRef] [Scilit]
- Foley, J.A.; Ramankutty, N.; Brauman, K.A.; Cassidy, E.S.; Gerber, J.S.; Johnston, M.; Mueller, N.D.; O’Connell, C.; Ray, D.K.; West, P.C.; et al. Solutions for a cultivated planet. Nature 2011, 478, 337–342. [Google Scholar] [CrossRef] [Scilit] [PubMed]
- Taylor, R.; Omed, H.; Edwards-Jones, G. The greenhouse emissions footprint of free-range eggs. Poult. Sci. 2014, 93, 231–237. [Google Scholar] [CrossRef] [Scilit] [PubMed]
- Arikan, O.; Mulbry, W.; Lansing, S. Effect of temperature on methane production from field-scale anaerobic digesters treating dairy manure. Waste Manag. 2015, 43, 108–113. [Google Scholar] [CrossRef] [Scilit] [PubMed]
- Robert, M.; Thomas, A.; Bergez, J. CMFDM: A methodology to guide the design of conceptual model of farmers’ decision-making processes. Agric. Syst. 2016, 148, 86–94. [Google Scholar] [CrossRef] [Scilit]
- Mramba, R.P.; Mapunda, P.E. Management factors associated with the survival and market weight of broiler chickens among small-scale farmers in the Dodoma City of Tanzania. Heliyon 2024, 10, e33907. [Google Scholar] [CrossRef] [Scilit] [PubMed]
- Surya, B. Rural agribusiness-based agropolitan area development and environmental management sustainability: Regional economic growth perspectives. Int. J. Energy Econ. Policy 2021, 11, 142–157. Available online: https://www.zbw.eu/econis-archiv/bitstream/11159/8106/1/176296323X_0.pdf (accessed on 14 September 2024). [CrossRef] [Scilit]
- Fernandez-Mena, H.; Gaudou, B.; Pellerin, S.; MacDonald, G.K.; Nesme, T. Flows in Agro-food Networks (FAN): An agent-based model to simulate local agricultural material flows. Agric. Syst. 2020, 180, 102718. [Google Scholar] [CrossRef] [Scilit]
- Wang, K.; Yan, X.; Fu, K. Research on risk management of agricultural products supply chain based on blockchain technology Open. J. Bus. Manag. 2020, 8, 1551–1568. [Google Scholar] [CrossRef]
- Yildiz, K.; Ahi, M. Innovative decision support model for construction supply chain performance management. Prod. Plan. Control 2020, 33, 894–906. [Google Scholar] [CrossRef] [Scilit]
- Jin, Y.; Turvey, C. Hedging financial and business risks in agriculture with commodity-linked loans. Agric. Financ. Rev. 2022, 62, 41–57. [Google Scholar]
- Gowthaman, T.; Adarsh, V.S.; Sathees Kumar, K.; Manobharathi, K. A review of deep learning models for price prediction in agricultural commodities. Econ. Aff. 2023, 68, 561–568. [Google Scholar] [CrossRef] [Scilit]
- Salvini, G.; Dentoni, D.; Ligtenberg, A.; Herold, M.; Bregt, A. Roles and drivers of agribusiness shaping Climate-Smart Landscapes: A review. Sustain. Dev. 2018, 26, 533–543. [Google Scholar] [CrossRef] [Scilit]
- Hochman, G.; Wang, S.; Li, Q.; Gottlieb, P.D.; Xu, F.; Li, Y. Cost of organic waste technologies: A case study for New Jersey. AIMS Energy 2015, 3, 450–462. [Google Scholar] [CrossRef] [Scilit]
- Bryant, R.B.; Endale, D.M.; Spiegal, S.A.; Flynn, K.C.; Meinen, R.J.; Cavigelli, M.A.; Kleinman, P.J.A. Poultry manureshed management: Opportunities challenges for a vertically integrated industry. J. Environ. Qual. 2022, 51, 540–551. [Google Scholar] [CrossRef] [Scilit] [PubMed]
- Solano-Blanco, A.F.; González, J.E.; Medaglia, A.L. Production planning decisions in the broiler chicken supply chain with growth uncertainty. Oper. Res. Perspect. 2023, 10, 100273. [Google Scholar] [CrossRef] [Scilit]
- Tsiouris, V.; Georgopoulou, I.; Batzios, C.; Pappaioannou, N.; Ducatelle, R.; Fortomaris, P. High stocking density as a predisposing factor for necrotic enteritis in broiler chicks. Avian Pathol. 2015, 44, 59–66. [Google Scholar] [CrossRef] [Scilit] [PubMed]
- Jong, I.C.; Bos, B.; Harn, J.V.; Mostert, P.; Beest, D. Differences and variation in welfare performance of broiler flocks in three production systems. Poult. Sci. 2022, 101, 101933. [Google Scholar] [CrossRef] [Scilit] [PubMed]
- Yegani, M.; Korver, D.R. Factors affecting intestinal health in poultry. Poult. Sci. 2008, 87, 2052–2063. [Google Scholar] [CrossRef] [Scilit] [PubMed]
- Shepherd, E.M.; Fairchild, B.D. Footpad dermatitis in poultry. Poult. Sci. 2010, 89, 2043–2051. [Google Scholar] [CrossRef] [Scilit] [PubMed]
- De Jong, I.C.; Gunnink, H.; van Harn, J. Wet litter not only induces footpad dermatitis but also reduces overall welfare technical performance carcass yield in broiler chickens. J. Appl. Poult. Res. 2014, 23, 51–58. [Google Scholar] [CrossRef] [Scilit]
- Kaukonen, E.; Norring, M.; Valros, A. Effect of litter quality on foot pad dermatitis, hock burns and breast blisters in broiler breeders during the production period. Avian Pathol. 2016, 45, 667–673. [Google Scholar] [CrossRef] [Scilit] [PubMed]
- Shepherd, E.M.; Fairchild, B.D.; Ritz, C.W. Alternative bedding materials litter depth impact litter moisture footpad dermatitis. J. Appl. Poult. Res. 2017, 26, 518–528. [Google Scholar] [CrossRef] [Scilit]
- Liu, Z.; Wang, L.; Beasley, D.; Oviedo, E. Effect of moisture content on ammonia emissions from broiler litter: Alaboratory study. J. Atmos. Chem. 2007, 58, 41–53. [Google Scholar] [CrossRef] [Scilit]
- Willems, O.W.; Miller, S.P.; Wood, B.J. Aspects of selection for feed efficiency in meat producing poultry. World’s Poult. Sci. J. 2013, 69, 77–88. [Google Scholar] [CrossRef] [Scilit]
- Uni, Z.; Yahav, S. Managing prenatal development of broiler chickens to improve productivity and thermotolerance. In Managing the Prenatal Environment to Enhance Livestock Productivity; Springer: Berlin/Heidelberg, Germany, 2010; pp. 71–90. Available online: https://link.springer.com/chapter/10.1007/978-90-481-3135-8_3 (accessed on 11 May 2025).
- Jimoh, O.A.; Daramola, O.T.; Okin-Aminu, H.O.; Ojo, O.A. Performance hemato-biochemical indices oxidative stress markers of broiler chicken fed phytogenic during heat stress condition. J. Anim. Sci. Technol. 2022, 64, 970–984. [Google Scholar] [PubMed]
- Swayne, D. Diseases of Poultry, 13th ed.; John Wiley & Sons: Hoboken, NJ, USA, 2013; Available online: https://onlinelibrary.wiley.com/doi/book/10.1002/9781119421481 (accessed on 3 January 2025).
- Reece, F.N.; Deaton, J.W.; Harwood, F.W. Effect of Roof Insulation on the Performance of Broiler Chickens Reared Under High Temperature Conditions. Poult. Sci. 1976, 55, 395–398. [Google Scholar] [CrossRef] [Scilit]
- Oliveira, D.R.M.d.S.; Näss, I.d.A.; Mollo Neto, M.; Canuto, S.A.; Walker, R.; Vendrametto, O. Issues of Sustainability on the Brazilian Broiler Meat Production Chain. 2015. Available online: http://www.alice.cnptia.embrapa.br/alice/handle/doc/943506 (accessed on 14 September 2024).
- Leinonen, I.; Williams, A.; Kyriazakis, I. The effects of welfare-enhancing system changes on the environmental impacts of broiler and egg production. Poult. Sci. 2014, 93, 256–266. [Google Scholar] [CrossRef] [Scilit] [PubMed]
- Bustamante-Mora, A.; Diéguez-Rebolledo, M.; Hormazábal, Y.; Millar, L.; Cadena, R. Challenges and Opportunities for Sustainable Engineering: Products, Services, Technologies, and Social Inclusivity with a Gender Approach. Sustainability 2024, 16, 1888. [Google Scholar] [CrossRef] [Scilit]
- Gunnarsson, S.; Arvidsson Segerkvist, K.; Göransson, L.; Hansson, H.; Sonesson, U. Systematic mapping of research on farm-level sustainability in egg and chicken meat production. Sustainability 2020, 12, 3033. [Google Scholar] [CrossRef] [Scilit]
- Agenda 2030. Monitoring Sustainable Development Until 2030 [WWW Document]. 2018. Available online: https://www.pactoglobal.org.br/ods-e-agenda-2030/ (accessed on 19 May 2024).
- Sun, R.; Liu, X.; Li, D.; Zhuang, J.; Qi, S.; Meng, B.; Liu, M. Optimization of China’s pig production system to reduce environmental impacts based on a data envelopment and life cycle analysis model. Resour. Conserv. Recycl. 2022, 185, 106483. [Google Scholar] [CrossRef] [Scilit]
- Finnveden, G.; Hauschild, M.Z.; Ekvall, T.; Guinée, J.B.; Heijungs, R.; Hellweg, S.; Koehler, A.; Pennington, D.; Suh, S. Recent developments in Life Cycle Assessment. J. Environ. Manag. 2009, 91, 1–21. [Google Scholar] [CrossRef] [Scilit] [PubMed]
- Jolliet, O.; Saadé, M.; Shaked, S.; Jolliet, A.; Crettaz, P. Environmental Life Cycle Assessment; CRC Press: Boca Raton, FL, USA, 2015. [Google Scholar] [CrossRef] [Scilit]
- Byrne, D.; Lohman, H.; Cook, S.; Peters, G.; Guest, J. Life Cycle Assessment (LCA) of Urban Water Infrastructure: Emerging Approaches to Balance Objectives and Inform Comprehensive Decision-Making. Environ. Sci. Water Res. Technol. 2017, 3, 1002–1014. [Google Scholar] [CrossRef] [Scilit]
- ISO 14040:2006; Environmental Management—Life Cycle Assessment—Principles and Framework. ISO: Geneva, Switzerland, 2006. Available online: https://www.iso.org/standard/37456.html (accessed on 29 October 2024).
- Olsen, S.I.; Fantke, P.; Laurent, A.; Birkved, M.; Bey, N.; Hauschild, M.Z. Sustainability and LCA in Engineering Education—A Course Curriculum. Procedia CIRP 2018, 69, 627–632. [Google Scholar] [CrossRef] [Scilit]
- Bjørn, A.; Owsianiak, M.; Molin, C.; Laurent, A. Main Characteristics of LCA. In Life Cycle Assessment Theory and Practice; Hauschild, M.Z., Rosenbaum, R.K., Olsen, S.I., Eds.; Springer: Cham, Switzerland, 2018; pp. 9–16. [Google Scholar] [CrossRef] [Scilit]
- ISO 14000 Family; Environmental Management. International Organization for Standardization (ISO): Geneva, Switzerland. Available online: https://www.iso.org/standards/popular/iso-14000-family (accessed on 28 June 2026).
- ISO 14044:2006; Environmental Management—Life Cycle Assessment—Requirements and Guidelines. ISO: Geneva, Switzerland, 2006. Available online: https://www.iso.org/standard/38498.html (accessed on 28 June 2026).
- ISO 14041:1998; Environmental Management—Life Cycle Assessment—Goal and Scope Definition and Inventory Analysis. ISO: Geneva, Switzerland, 1998. Available online: https://www.iso.org/standard/23152.html (accessed on 28 June 2026).
- ISO 14042:2000; Environmental Management—Life Cycle Assessment—Life Cycle Impact Assessment. ISO: Geneva, Switzerland, 2000. Available online: https://www.iso.org/standard/23153.html (accessed on 28 June 2026).
- ISO 14043:2000; Environmental Management—Life Cycle Assessment—Life Cycle Interpretation. ISO: Geneva, Switzerland, 2000. Available online: https://www.iso.org/standard/23154.html (accessed on 28 June 2026).
- ISO 14046:2014; Environmental Management—Water Footprint—Principles, Requirements and Guidelines. ISO: Geneva, Switzerland, 2014. Available online: https://www.iso.org/standard/43263.html (accessed on 28 June 2026).
- Kheiralipour, K.; Rafiee, S.; Karimi, M.; Nadimi, M.; Paliwal, J. The environmental impacts of commercial poultry production systems using life cycle assessment: A review. World’s Poult. Sci. J. 2023, 80, 33–54. [Google Scholar] [CrossRef] [Scilit]
- Azmi, S.; Suprihatin, N.; Indrastin, S.; Romli, M. The Assessment of Environmental Impact of the Chicken Meat Agroindustry in Indonesia: Life Cycle Assessment (LCA) Perspective. Trop. Anim. Sci. J. 2023, 46, 249–260. [Google Scholar] [CrossRef] [Scilit]
- Silva, J.; Giehl, C.; Cardinal, K.; Andretta, I.; Ribeiro, A. Different life cycle assessment methods and causes of variation in estimates of global warming in chicken and pork production systems: A critical systematic review. Livest. Sci. 2023, 276, 105320. [Google Scholar] [CrossRef] [Scilit]
- Andretta, I.; Hickmann, F.M.W.; Remus, A.; Franceschi, C.H.; Mariani, A.B.; Orso, C.; Kipper, M.; Létourneau-Montminy, M.-P.; Pomar, C. Environmental Impacts of Pig and Poultry Production: Insights From a Systematic Review. Front. Vet. Sci. 2021, 8, 750733. [Google Scholar] [CrossRef] [Scilit] [PubMed]
- Nielsen, N.; Jørgensen, M.; Bahrndorff, S. Greenhouse Gas Emission from the Danish Broiler Production Estimated via LCA Methodology; Knowledge Centre for Agriculture: Aarhus, Denmark, 2011; Available online: https://www.researchgate.net/publication/316239621_Greenhouse_Gas_Emission_from_the_Danish_Broiler_Production_estimated_via_LCA_Methodology (accessed on 10 November 2024).
- Cesari, V.; Zucali, M.; Sandrucci, A.; Tamburini, A.; Bava, L.; Toschi, I. Environmental impact assessment of an Italian vertically integrated broiler system through a Life Cycle approach. J. Clean. Prod. 2017, 143, 904–911. [Google Scholar] [CrossRef] [Scilit]
- Wiedemann, S.G.; McGahan, E.J.; Murphy, C.M. Resource use environmental impacts from Australian chicken meat production. J. Clean. Prod. 2017, 140, 675–684. [Google Scholar] [CrossRef] [Scilit]
- Silva, V.; van der Werf, H.; Soares, S.; Corson, M. Environmental impacts of French Brazilian broiler chicken production scenarios: An LCA approach. J. Environ. Manag. 2014, 133, 222–231. [Google Scholar] [CrossRef] [Scilit] [PubMed]
- Rocchi, L.; Paolotti, L.; Rosati, A.; Boggia, A.; Castellini, C. Assessing the sustainability of different poultry production systems: Amulticriteria approach. J. Clean. Prod. 2019, 211, 103–114. [Google Scholar] [CrossRef] [Scilit]
- Boggia, A.; Paolotti, L.; Castellini, C. Environmental impact evaluation of conventional organic organic-plus poultry production systems using life cycle assessment. World’s Poult. Sci. J. 2010, 66, 95–114. [Google Scholar] [CrossRef] [Scilit]
- González-García, S.; Gomez-Fernández, Z.; Dias, A.C.; Feijoo, G.; Moreira, M.T.; Arroja, L. Life cycle assessment of broiler chicken production: APortuguese case study. J. Clean. Prod. 2014, 74, 125–134. [Google Scholar] [CrossRef] [Scilit]
- Kalhor, T.; Rajabipour, A.; Akram, A.; Sharifi, M. Environmental impact assessment of chicken meat production using life cycle assessment. Inf. Process. Agric. 2016, 3, 262–271. [Google Scholar] [CrossRef] [Scilit]
- Kebreab, E.; Liedke, A.; Caro, D.; Deimling, S.; Binder, M.; Finkbeiner, M. Environmental impact of using specialty feed ingredients in swine poultry production: Alife cycle assessment. J. Anim. Sci. 2016, 94, 2664–2681. [Google Scholar] [CrossRef] [Scilit] [PubMed]
- Leinonen, I.; Williams, A. Effects of dietary protease on nitrogen emissions from broiler production: Aholistic comparison using Life Cycle Assessment. J. Sci. Food Agric. 2015, 95, 304–311. [Google Scholar] [CrossRef] [Scilit] [PubMed]
- Payandeh, Z.; Kheiralipour, K.; Karimi, M.; Khoshnevisan, B. Joint data envelopment analysis and life cycle assessment for environmental impact reduction in broiler production systems. Energy 2017, 127, 768–774. [Google Scholar] [CrossRef] [Scilit]
- López-Andrés, J.J.; Aguilar-Lasserre, A.A.; Morales-Mendoza, L.F.; Azzaro-Pantel, C.; Pérez-Gallardo, J.R.; Rico-Contreras, J.O. Environmental impact assessment of chicken meat production via an integrated methodology based on LCA, simulation genetic algorithms. J. Clean. Prod. 2018, 164, 477–491. [Google Scholar] [CrossRef] [Scilit]
- Thévenot, A.; Aubin, J.; Tillard, E.; Vayssières, J. Accounting for farm diversity in life cycle assessment studies—The case of poultry production in a tropical island. J. Clean. Prod. 2013, 57, 280–292. [Google Scholar] [CrossRef] [Scilit]
- Gil, A.C. Métodos e Técnicas de Pesquisa Social, 6th ed.; Atlas: São Paulo, Brazil, 2008; Available online: https://www.kufunda.net/publicdocs/METODOS%20E%20TECNICAS%20DE%20PESQUISA%20SOCIAL%20-%20ANTONIO%20GIL.pdf (accessed on 28 June 2026).
- Lakatos, E.M.; Marconi, M.A. Fundamentos de Metodologia Científica; Atlas: São Paulo, Brazil, 2017; Available online: https://edisciplinas.usp.br/pluginfile.php/7237618/mod_resource/content/1/Marina%20Marconi%2C%20Eva%20Lakatos_Fundamentos%20de%20metodologia%20cient%C3%ADfica.pdf (accessed on 24 August 2025).
- Gerhardt, T.E.; Silveira, D.T. Métodos de Pesquisa. Editora da UFRGS, Porto Alegre. 2009. Available online: https://www.ufrgs.br/cursopgdr/downloadsSerie/derad005.pdf (accessed on 6 April 2025).
- Chau, C.K.; Leung, T.M.; Ng, W.Y. A review on Life Cycle Assessment, Life Cycle Energy Assessment and Life Cycle Carbon Emissions Assessment on buildings. Appl. Energy 2015, 143, 395–413. [Google Scholar] [CrossRef] [Scilit]
- Ige, O.E.; Olanrewaju, O.A.; Duffy, K.J.; Collins, O.C. Environmental impact analysis of Portland cement (CEM1) using the midpoint method. Energies 2022, 15, 2708. [Google Scholar] [CrossRef] [Scilit]
- Pelletier, N. Environmental performance in the US broiler poultry sector: Life cycle energy use and greenhouse gas, ozone depleting, acidifying and eutrophying emissions. Agric. Syst. 2008, 98, 67–73. [Google Scholar] [CrossRef] [Scilit]
- Alves, E.C.; Alves, I.H.d.S.; Soares, B.B.; Borges, A.F.; Jalal, A.; Jani, A.D.; Abreu-Junior, C.H.; Capra, G.F.; Nogueira, T.A.R. Resource recovery of biological residues from the Brazilian poultry industry in mitigating environmental impacts: Alife cycle assessment (LCA) approach. J. Clean. Prod. 2023, 416, 137895. [Google Scholar] [CrossRef] [Scilit]
- Leinonen, I.; Williams, A.; Wiseman, J.; Guy, J.; Kyriazakis, I. Predicting the environmental impacts of chicken systems in the United Kingdom through a life cycle assessment: Broiler production systems. Poult. Sci. 2012, 91, 8–25. [Google Scholar] [CrossRef] [Scilit] [PubMed]
- Vauterin, A.; Steiner, B.; Sillman, J.; Kahiluoto, H. The potential of insect protein to reduce food-based carbon footprints in Europe: The case of broiler meat production. J. Clean. Prod. 2021, 320, 128799. [Google Scholar] [CrossRef] [Scilit]
- Smetana, S.; Palanisamy, M.; Mathys, A.; Heinz, V. Sustainability of insect use for feed food: Life cycle assessment perspective. J. Clean. Prod. 2016, 137, 714–751. [Google Scholar] [CrossRef] [Scilit]
- Lima, N.D.S.; Nääs, I.A.; Garcia, R.G.; Moura, D.J. Environmental impact of Brazilian broiler production process: Evaluation using life cycle assessment. J. Clean. Prod. 2019, 237, 117752. [Google Scholar] [CrossRef] [Scilit]

Disclaimer/Publisher’s Note: The statements, opinions and data contained in all publications are solely those of the individual author(s) and contributor(s) and not of MDPI and/or the editor(s). MDPI and/or the editor(s) disclaim responsibility for any injury to people or property resulting from any ideas, methods, instructions or products referred to in the content. |
© 2026 by the authors. Licensee MDPI, Basel, Switzerland. This article is an open access article distributed under the terms and conditions of the Creative Commons Attribution (CC BY) license.