1. Introduction
Agriculture is a fundamental pillar of food systems and socioeconomic sustainability, especially in rural and peri-urban areas of middle-income countries [
1]. In Peru, agricultural activity remains an important source of employment, income, and food supply. According to World Bank estimates, agricultural employment represented between 23% and 24% of total employment between 2023 and 2025 [
2]. However, agricultural sustainability faces increasing pressure from urban expansion, loss of cultivable land, and soil transformation in peri-urban areas [
3,
4]. In addition, pesticide residues have been reported in Peruvian agricultural products, in some cases above permissible limits, creating concerns for productivity, food safety, and public health [
5,
6].
In this context, hydroponics has become increasingly relevant as an intensive production strategy capable of partially decoupling cultivation from soil restrictions, optimizing water use and improving control over plant nutrition, aspects that are particularly valuable in short-cycle vegetables with high commercial demand such as lettuce (
L. sativa) [
7]. However, the efficiency of these systems depends on the stability of critical variables in the nutrient solution and the growing microenvironment, including temperature, pH, electrical conductivity, and dissolved solids concentration, which are essential for maintaining crop performance and improving the resilience of soilless agricultural systems under climate change and urbanization pressures [
8]. Alterations in these variables can compromise nutrient absorption, root activity, and plant growth [
9,
10,
11]. This vulnerability is accentuated under high-temperature conditions, where root-zone heat stress can reduce lettuce physiological performance and agronomic quality, motivating interest in modern soilless cultivation technologies, thermal regulation, and continuous monitoring systems [
9,
12].
For lettuce grown in a closed-loop recirculating hydroponic system, the nutrient solution is commonly managed within slightly acidic pH ranges, generally close to 5.5–6.5, to favor nutrient availability and root uptake. Electrical conductivity is also used as an operational indicator of ionic concentration, with typical lettuce nutrient solutions commonly managed around low-to-moderate salinity ranges depending on cultivar, growth stage, and environmental conditions. In addition, adequate concentrations of macronutrients such as N, P, K, Ca, Mg, and S, together with micronutrients such as Fe, Mn, B, Zn, Cu, Mo, and Cl, are required to sustain leaf growth, root activity, and physiological performance in soilless systems [
7,
9,
10,
11,
13].
In small-scale and low-cost closed-loop recirculating PVC pipe-based hydroponic systems for lettuce cultivation operated under open-field or semi-controlled conditions, pump activation is often managed using fixed-timer schedules. Although this strategy is simple and easy to implement, it does not respond to short-term changes in the root-zone environment. Under outdoor summer conditions, solar radiation, air temperature, crop transpiration, and evaporation can rapidly modify physicochemical conditions, including nutrient solution temperature, dissolved oxygen availability, pH, and electrical conductivity. These changes affect oxygen solubility, nutrient availability, and root activity, making fixed recirculation schedules potentially insufficient for maintaining stable growing conditions [
13,
14,
15,
16,
17].
In response to these limitations, automation in recirculating hydroponic systems has advanced toward smart farming architectures based on sensors, Internet of Things (IoT) connectivity, automated actuation, and near-real-time control, with a special emphasis on pH and electrical conductivity (EC) [
18,
19]. Sneineh and Shabaneh [
20] implemented an ESP32-based system with sensors for pH, TDS, temperature, and water level, capable of automatically activating pumps and being monitored via the Blynk application, demonstrating the viability of IoT solutions for reducing manual intervention in hydroponics. Awal et al. [
15] developed an automated hydroponic monitoring system for tracking pH, temperature, EC, and TDS in nutrient solution, integrated with a mobile application and tested in spinach cultivation, successfully maintaining conditions close to optimal ranges with high measurement accuracy.
Other research has emphasized the design of low-cost architecture and replicable systems for urban agriculture. The SMART GROW system proposes an integrated IoT solution with an Android application and basic sensors for monitoring and controlling nutrient solution parameters in hydroponic systems, highlighting its affordability and ease of implementation [
21]. Similarly, Demir and Çiçek [
11] presented an ESP32-based architecture supported by MQTT, InfluxDB, Node-RED, and Grafana. This combination allowed continuous data logging, alarm management, safety functions, and multivariable monitoring and control in a hydroponic environment. The proposal offered a more structured and scalable technological framework than simpler monitoring platforms. Even so, as with other IoT-centered studies, its emphasis remained mainly on connectivity, data infrastructure, and system operation, while the direct effects on crop growth received less attention.
Regarding control strategies, more advanced approaches that go beyond passive monitoring have been explored. Waluyo et al. [
22] proposed a fuzzy logic-based system that regulates variables such as pH, lighting, and nutrients, comparing it with a fixed-time system and a natural system. Their results showed that fuzzy control improves plant growth rate and reduces energy consumption compared to the programmed method. Complementarily, Escalante-Mamani et al. [
23] designed and implemented an IoT-integrated fuzzy controller to regulate pH and EC in Nutrient Film Technique (NFT) systems, validated under real-world growing conditions in Cusco, Peru, demonstrating stability, low error, and robust behavior in the face of environmental disturbances. These studies represent a significant advance by introducing intelligent control instead of simple monitoring schemes; however, their scope is often limited to a small set of variables and, in some cases, lacks a comprehensive agronomic evaluation of the crop.
Furthermore, a recent study by Mohmed et al. [
24] explored the use of artificial intelligence (AI) to improve specific aspects of soilless crop production. They developed an artificial neural network (ANN)-based approach to optimize nutrient management in lettuce grown in hydroponic systems. Their model used crop and nutrient data to estimate weekly nitrogen, phosphorus, and potassium (NPK) requirements, reducing nutrient over-application by up to 40% without affecting plant growth or yield. However, the study focused primarily on nutrient formulation, rather than on automating recirculation or pump operation under open-field conditions.
Similarly, Fasciolo et al. [
25] proposed a hybrid approach in which they combined machine learning (ML) with physical modeling to estimate growth-related variables including fresh weight, leaf area, and water consumption in aeroponic systems. Their work demonstrated how predictive models can support decision-making and improve resource use in controlled agriculture. However, this type of approach was mainly oriented towards prediction and optimization, rather than the direct automation of physical control processes or their evaluation under real operating conditions.
Herrera-Arroyo et al. [
26] developed an intelligent hydroponic system in a controlled environment for lettuce cultivation, evaluating the effect of different nutrient solution concentrations on crop growth and quality. They concluded that an intermediate concentration optimizes the balance between productivity and resource use. Although this type of study provides relevant agronomic evidence, its focus on controlled environments limits the extrapolation of results to systems exposed to variable environmental conditions, such as open-field crops.
Overall, the reviewed studies show that recent hydroponic automation research has advanced in three complementary directions: IoT-based monitoring architectures for pH, EC, TDS, temperature, and water quality variables; intelligent controllers, particularly fuzzy logic approaches for regulating pH, EC, lighting, or nutrient delivery; and artificial intelligence models for nutrient optimization and crop growth prediction [
11,
15,
20,
21,
22,
23,
24,
25]. Despite these advances, several gaps remain relevant to the present study. Many implementations emphasize connectivity, dashboards, or prediction models rather than the operational response of the physical recirculation system. In addition, many studies are conducted in controlled, indoor, or small-scale environments, which limit their applicability to open-field, closed recirculating hydroponic production of lettuce. Finally, limited evidence is available on the direct comparison between sensor-triggered recirculation strategies and conventional fixed-timer operation under real outdoor thermal variability.
In this context, the present study aims to evaluate the operational performance of an automated closed-loop recirculating hydroponic system with PVC growing channels for lettuce cultivation, based on continuous sensing and threshold-controlled recirculation. The main contribution lies in the implementation and operational validation of a low-cost IoT architecture integrating multivariable sensing, near-real-time data transmission, remote visualization, and sensor-triggered ON/OFF pump activation based on predefined temperature and dissolved oxygen thresholds.
From a theoretical perspective, this research is based on the principles of precision agriculture and closed-loop threshold control, where continuous sensing enables the system to modify pump operation according to observed conditions. Methodologically, the study proposes an integrative approach that combines multivariable monitoring, near-real-time data processing, and automated threshold-based actuation, enabling a more accurate capture of the operational behavior of closed-loop recirculating hydroponic systems under uncontrolled environmental conditions.
In practical terms, the study showed that a low-cost IoT configuration can assist in the monitoring and operation of hydroponic systems exposed to outdoor heat loads. Along the Peruvian coast, where water availability is limited and urban expansion places additional pressure on food production areas, this type of solution becomes particularly relevant. The proposed system, built with accessible sensors, an ESP32-based control node, and a simple web platform, offers a viable route for managing small-scale hydroponic production without relying on complex or costly infrastructure. By supporting more precise use of water and nutrients, the approach also contributes to agricultural practices associated with Sustainable Development Goals 2 (Zero Hunger) and 12 (Responsible Consumption and Production) [
27].
2. Methodology
2.1. System Architecture Design
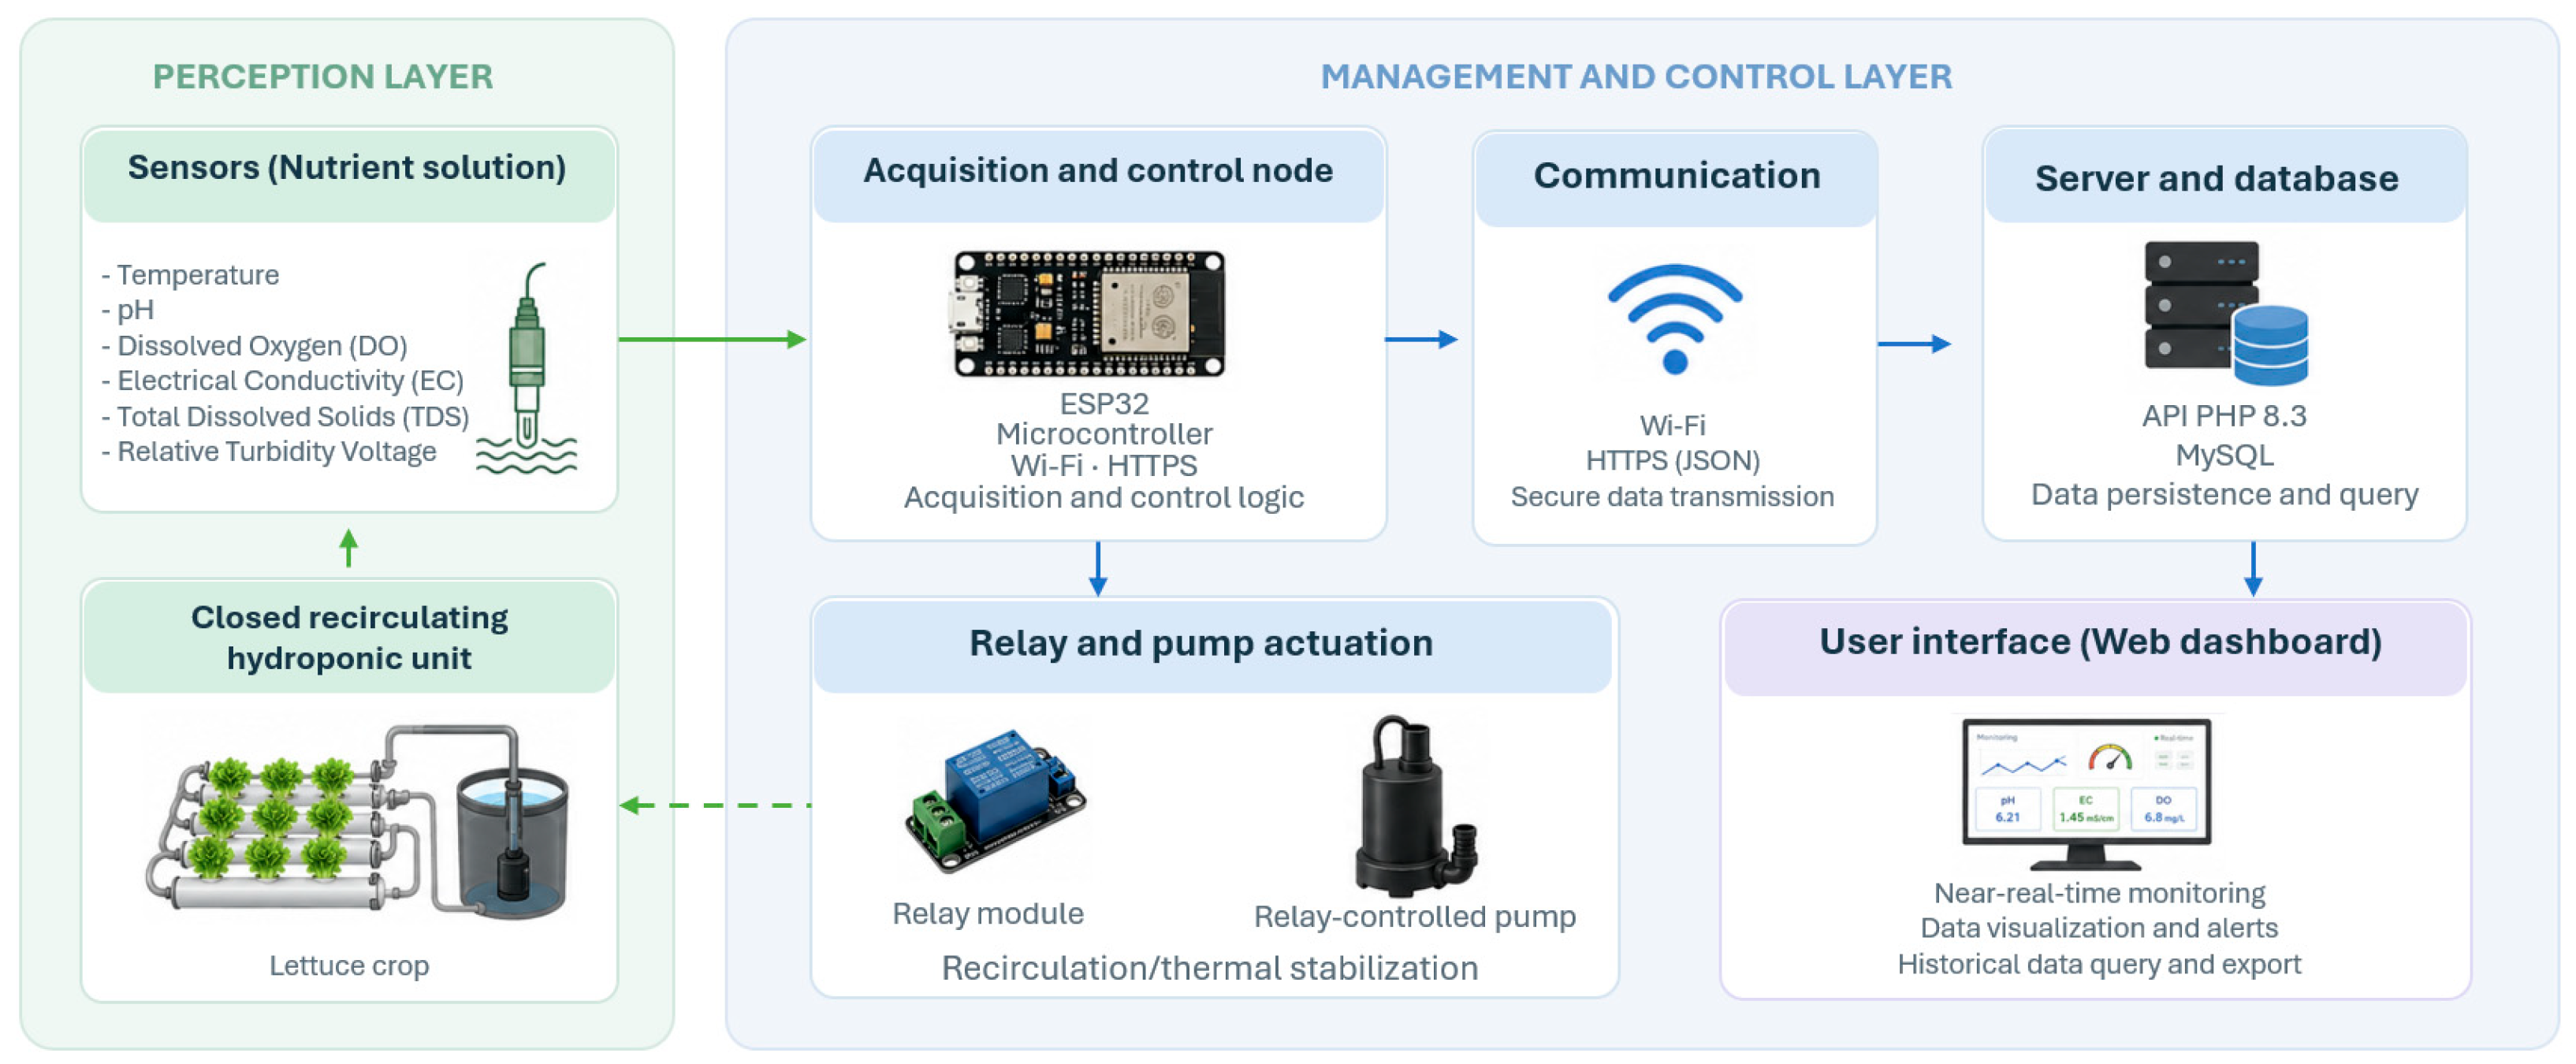
The monitoring and control system architecture (
Figure 1) was designed to acquire, transmit, store, and use critical nutrient solution variables from a closed-loop recirculating hydroponic system for lettuce cultivation installed under open-field outdoor conditions. Data acquisition and visualization were performed in near real time through the IoT-based platform.
The system was structured in four functional layers: a sensing and acquisition layer, composed of an ESP32 microcontroller and sensors for nutrient solution temperature, pH, total dissolved solids (TDS), turbidity, dissolved oxygen, and electrical conductivity; a communication layer, responsible for data transmission via Wi-Fi connectivity and HTTPS protocol; a persistence and processing layer, implemented on a remote server with Hypertext Preprocessor (PHP) v.8.3 and a MySQL database (phpMyAdmin v.5.2.1); and a visualization and operation layer, composed of a web application for monitoring variables and tracking the status of the actuators. Based on the recorded readings, the system executed a sensor-triggered ON/OFF control logic based on predefined operating thresholds to automatically activate or deactivate the recirculation/cooling system when temperature or dissolved oxygen deviated from the established ranges for the crop.
Figure 1 summarizes the overall architecture for acquisition, communication, storage, visualization, and control feedback.
2.2. Design and Construction of the Physical Model
The experimental system was configured using two commercially available closed-loop recirculating hydroponic units with eight 4-inch polyvinyl chloride (PVC) growing channels [
28], each measuring 1.76 m × 1.60 m × 1.05 m (length × width × height). The units were described as closed-loop recirculating because the nutrient solution was pumped from the reservoir through the PVC growing channels and returned to the same tank.
Each unit had a nominal capacity of up to 120 leafy vegetable plants per hydroponic unit, distributed across eight PVC growing channels. The planting arrangement included 80 mm and 53 mm holes distributed longitudinally with an approximate spacing of 20 cm. Each unit incorporated a 100 L tank and a Hidropónika WB-D307 submersible water pump for nutrient solution recirculation. The pump operates at 220 V alternating current (VAC), 60 Hz, with a maximum power of 90 W, a maximum flow rate of 4000 L h
−1 at 0 m, 420 L h
−1 at 3 m, and a maximum head of 3.5 m [
29].
Each 100 L tank was initially filled with water and prepared using a commercial A-B-C nutrient solution formulated for leafy vegetables. Following the manufacturer’s recommendation, the nutrient solution was prepared by adding 5 mL L
−1 of solution A, 2 mL L
−1 of solution B, and 2 mL L
−1 of solution C. Thus, the initial 100 L preparation required 500 mL of solution A, 200 mL of solution B, and 200 mL of solution C. According to the supplier’s technical information, the A-B-C formulation provides macronutrients such as N, P, K, Ca, S, and Mg, as well as micronutrients including Fe, Mn, B, Zn, Cu, Mo, and Cl [
30]. During the experimental period, water level was manually monitored, and a total of approximately 150 L of water was added as replenishment to compensate for losses associated with evaporation and crop transpiration.
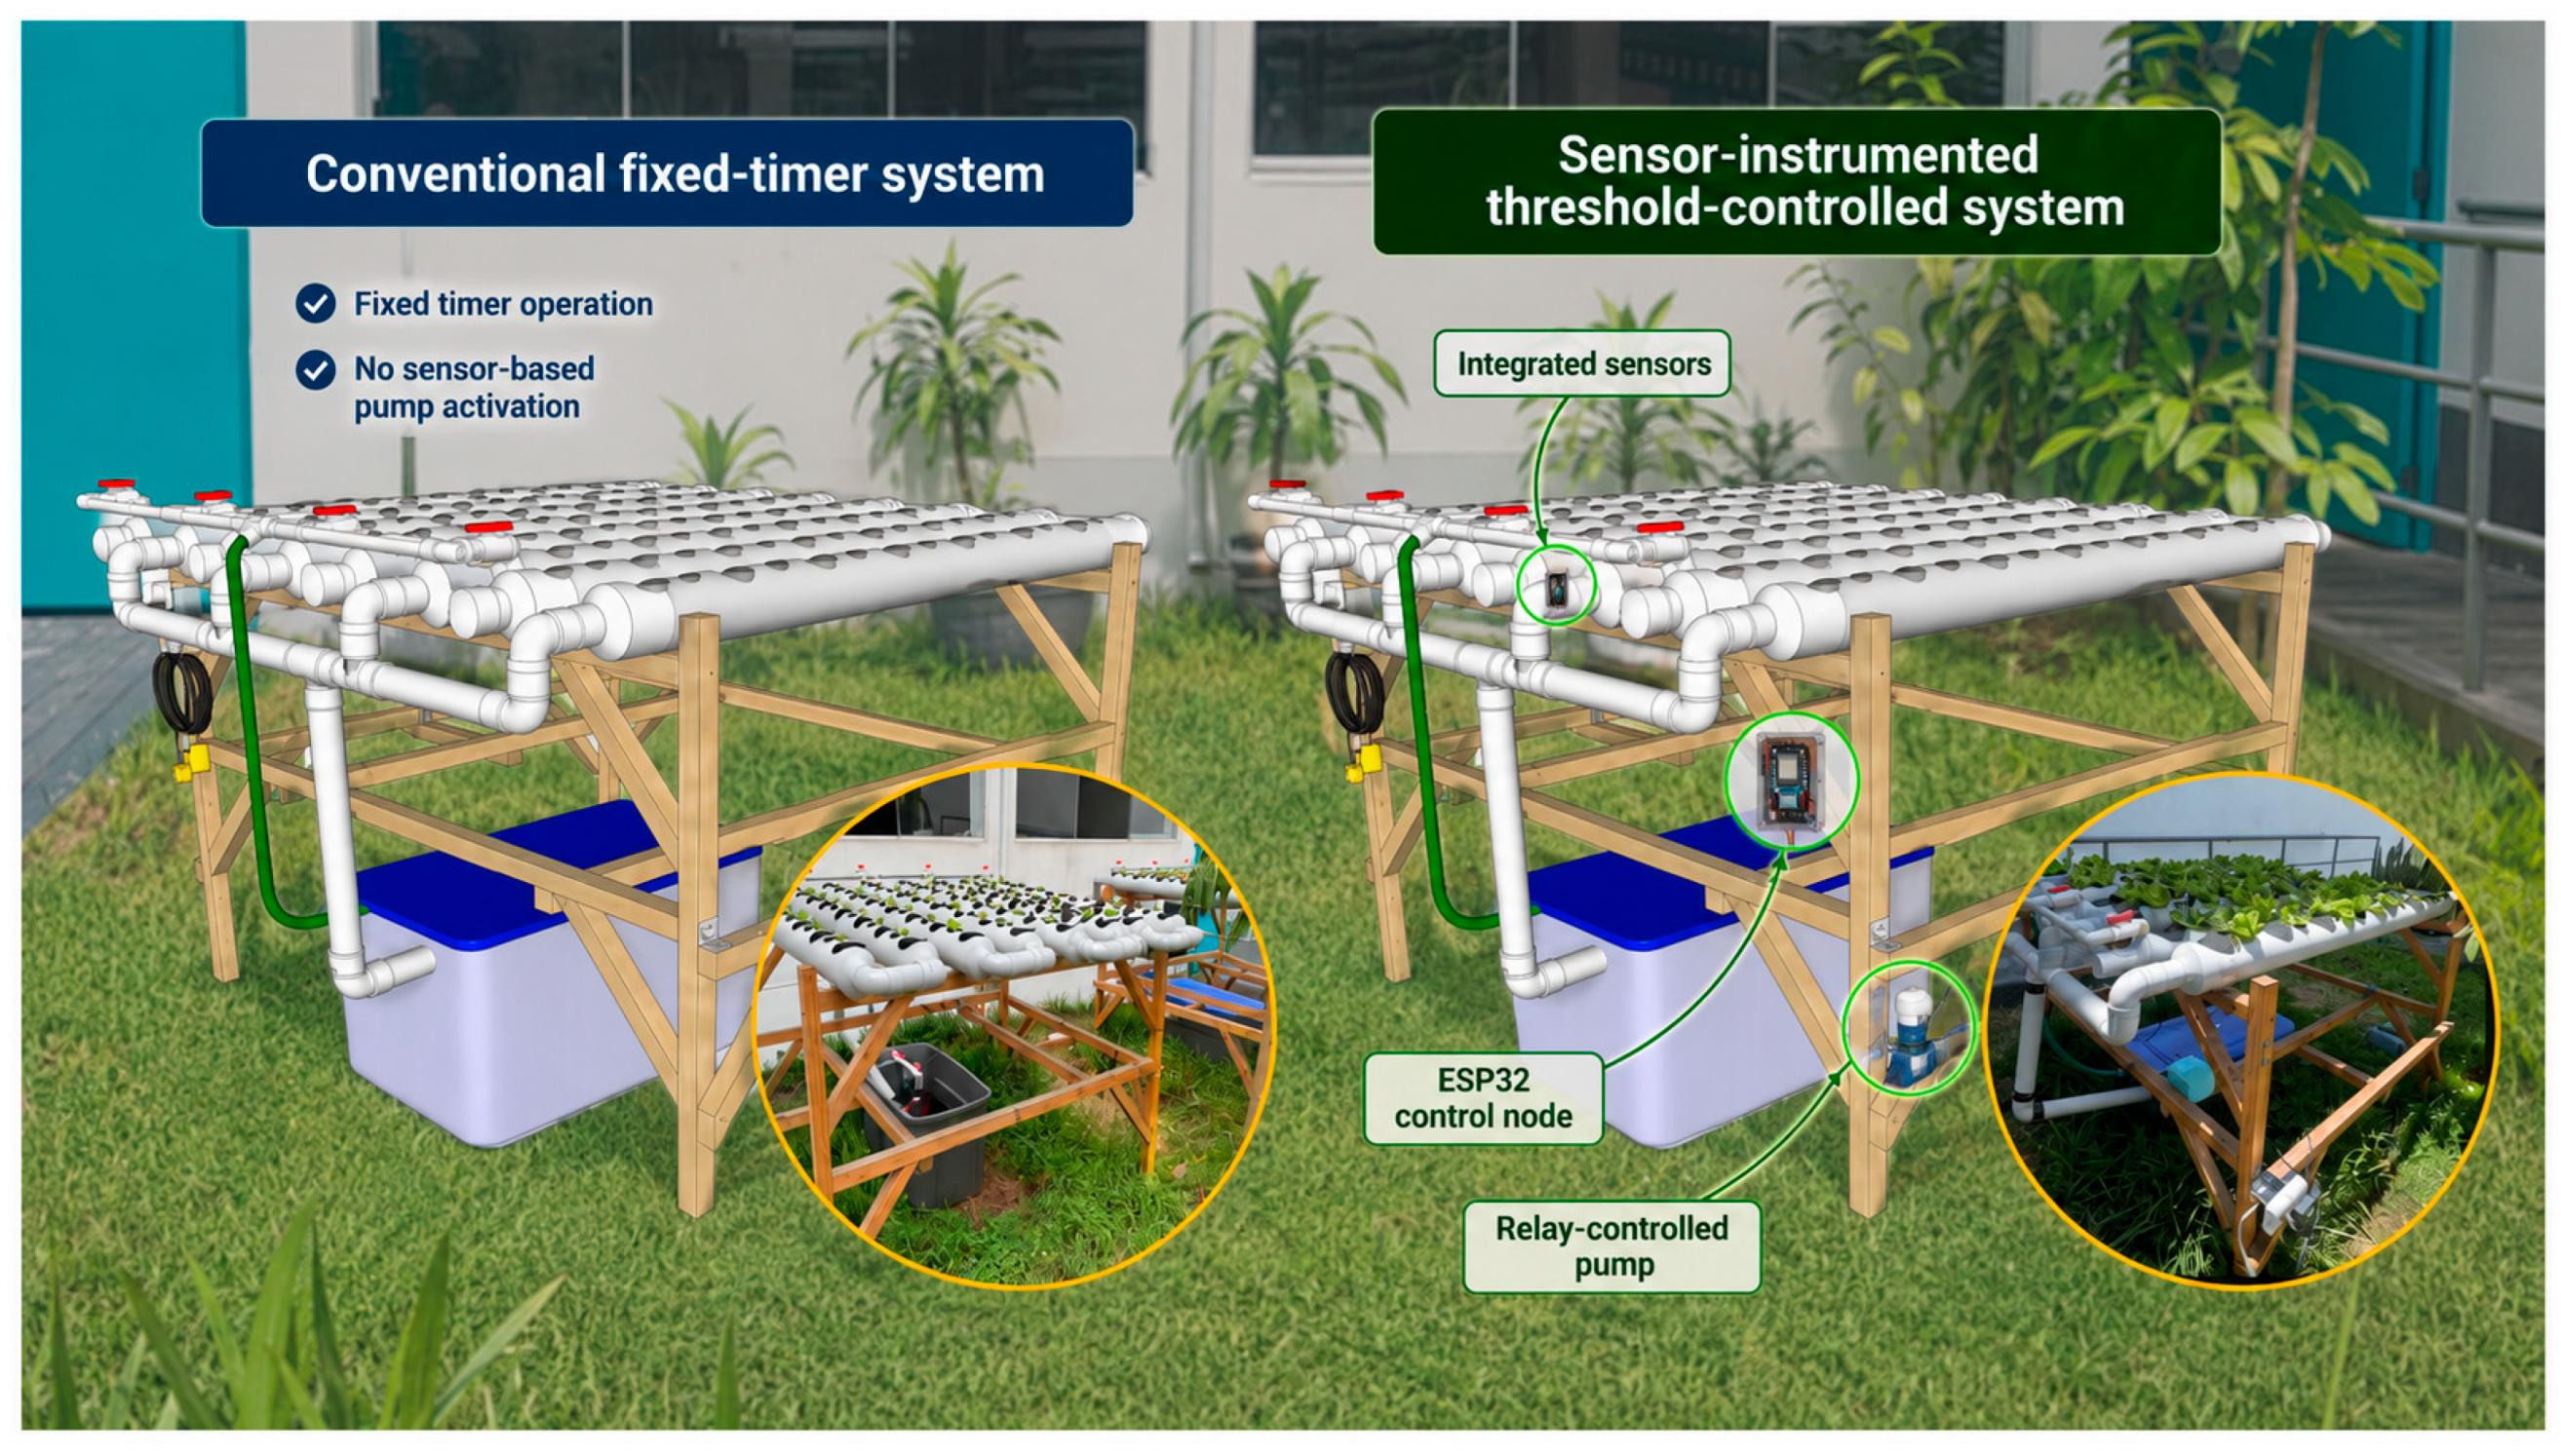
For comparative purposes, two experimental configurations were considered (
Figure 2): a conventional closed-loop recirculating hydroponic unit with PVC growing channels (left), used as a reference treatment and operated by fixed timing, and a sensor-instrumented closed-loop recirculating hydroponic unit with PVC growing channels, oriented towards continuous monitoring and threshold-based recirculation control of critical variables in near real time. In the conventional system, the recirculation pump was operated according to a fixed daily schedule from 08:00 to 18:00 h. During this period, the pump was activated for 15 min at the beginning of each hour and then remained off for the following 45 min. Therefore, the pump operated from 08:00 to 08:15, 09:00 to 09:15, 10:00 to 10:15, and so on until 17:00 to 17:15, resulting in 10 activation cycles per day and a total daily recirculation time of 150 min. This fixed schedule was maintained throughout the experimental period and was not modified according to nutrient solution temperature, DO, pH, EC, TDS, turbidity, or environmental conditions. In contrast, the instrumented system (right) activated the pump according to the threshold-based ON/OFF logic described in
Section 2.5. This arrangement allowed for a direct comparison between two pump operation strategies applied to the same closed recirculating hydroponic configuration: a conventional fixed-timer schedule and a sensor-triggered threshold-based ON/OFF strategy.
The experimental monitoring period extended from 21 January–13 February 2026, corresponding to the initial development and establishment phase of the lettuce crop under open-field summer conditions in Lima, Peru. During this period, the IoT-instrumented system recorded nutrient solution and operational variables at approximately 8 s intervals, while the conventional system followed the fixed-timer recirculation schedule described below.
To characterize the external environmental conditions during the experimental period, complementary daily meteorological data were obtained from the NASA POWER database for the geographical coordinates of the experimental site in Lima, Peru [
31,
32]. The selected variables included air temperature at 2 m, relative humidity at 2 m, and all-sky surface shortwave solar radiation. Vapor pressure deficit (VPD) was calculated from air temperature and relative humidity using the saturation vapor pressure approach. These data were used only to contextualize the open-field thermal stress conditions and to support the interpretation of nutrient solution temperature peaks.
2.3. Hardware Integration
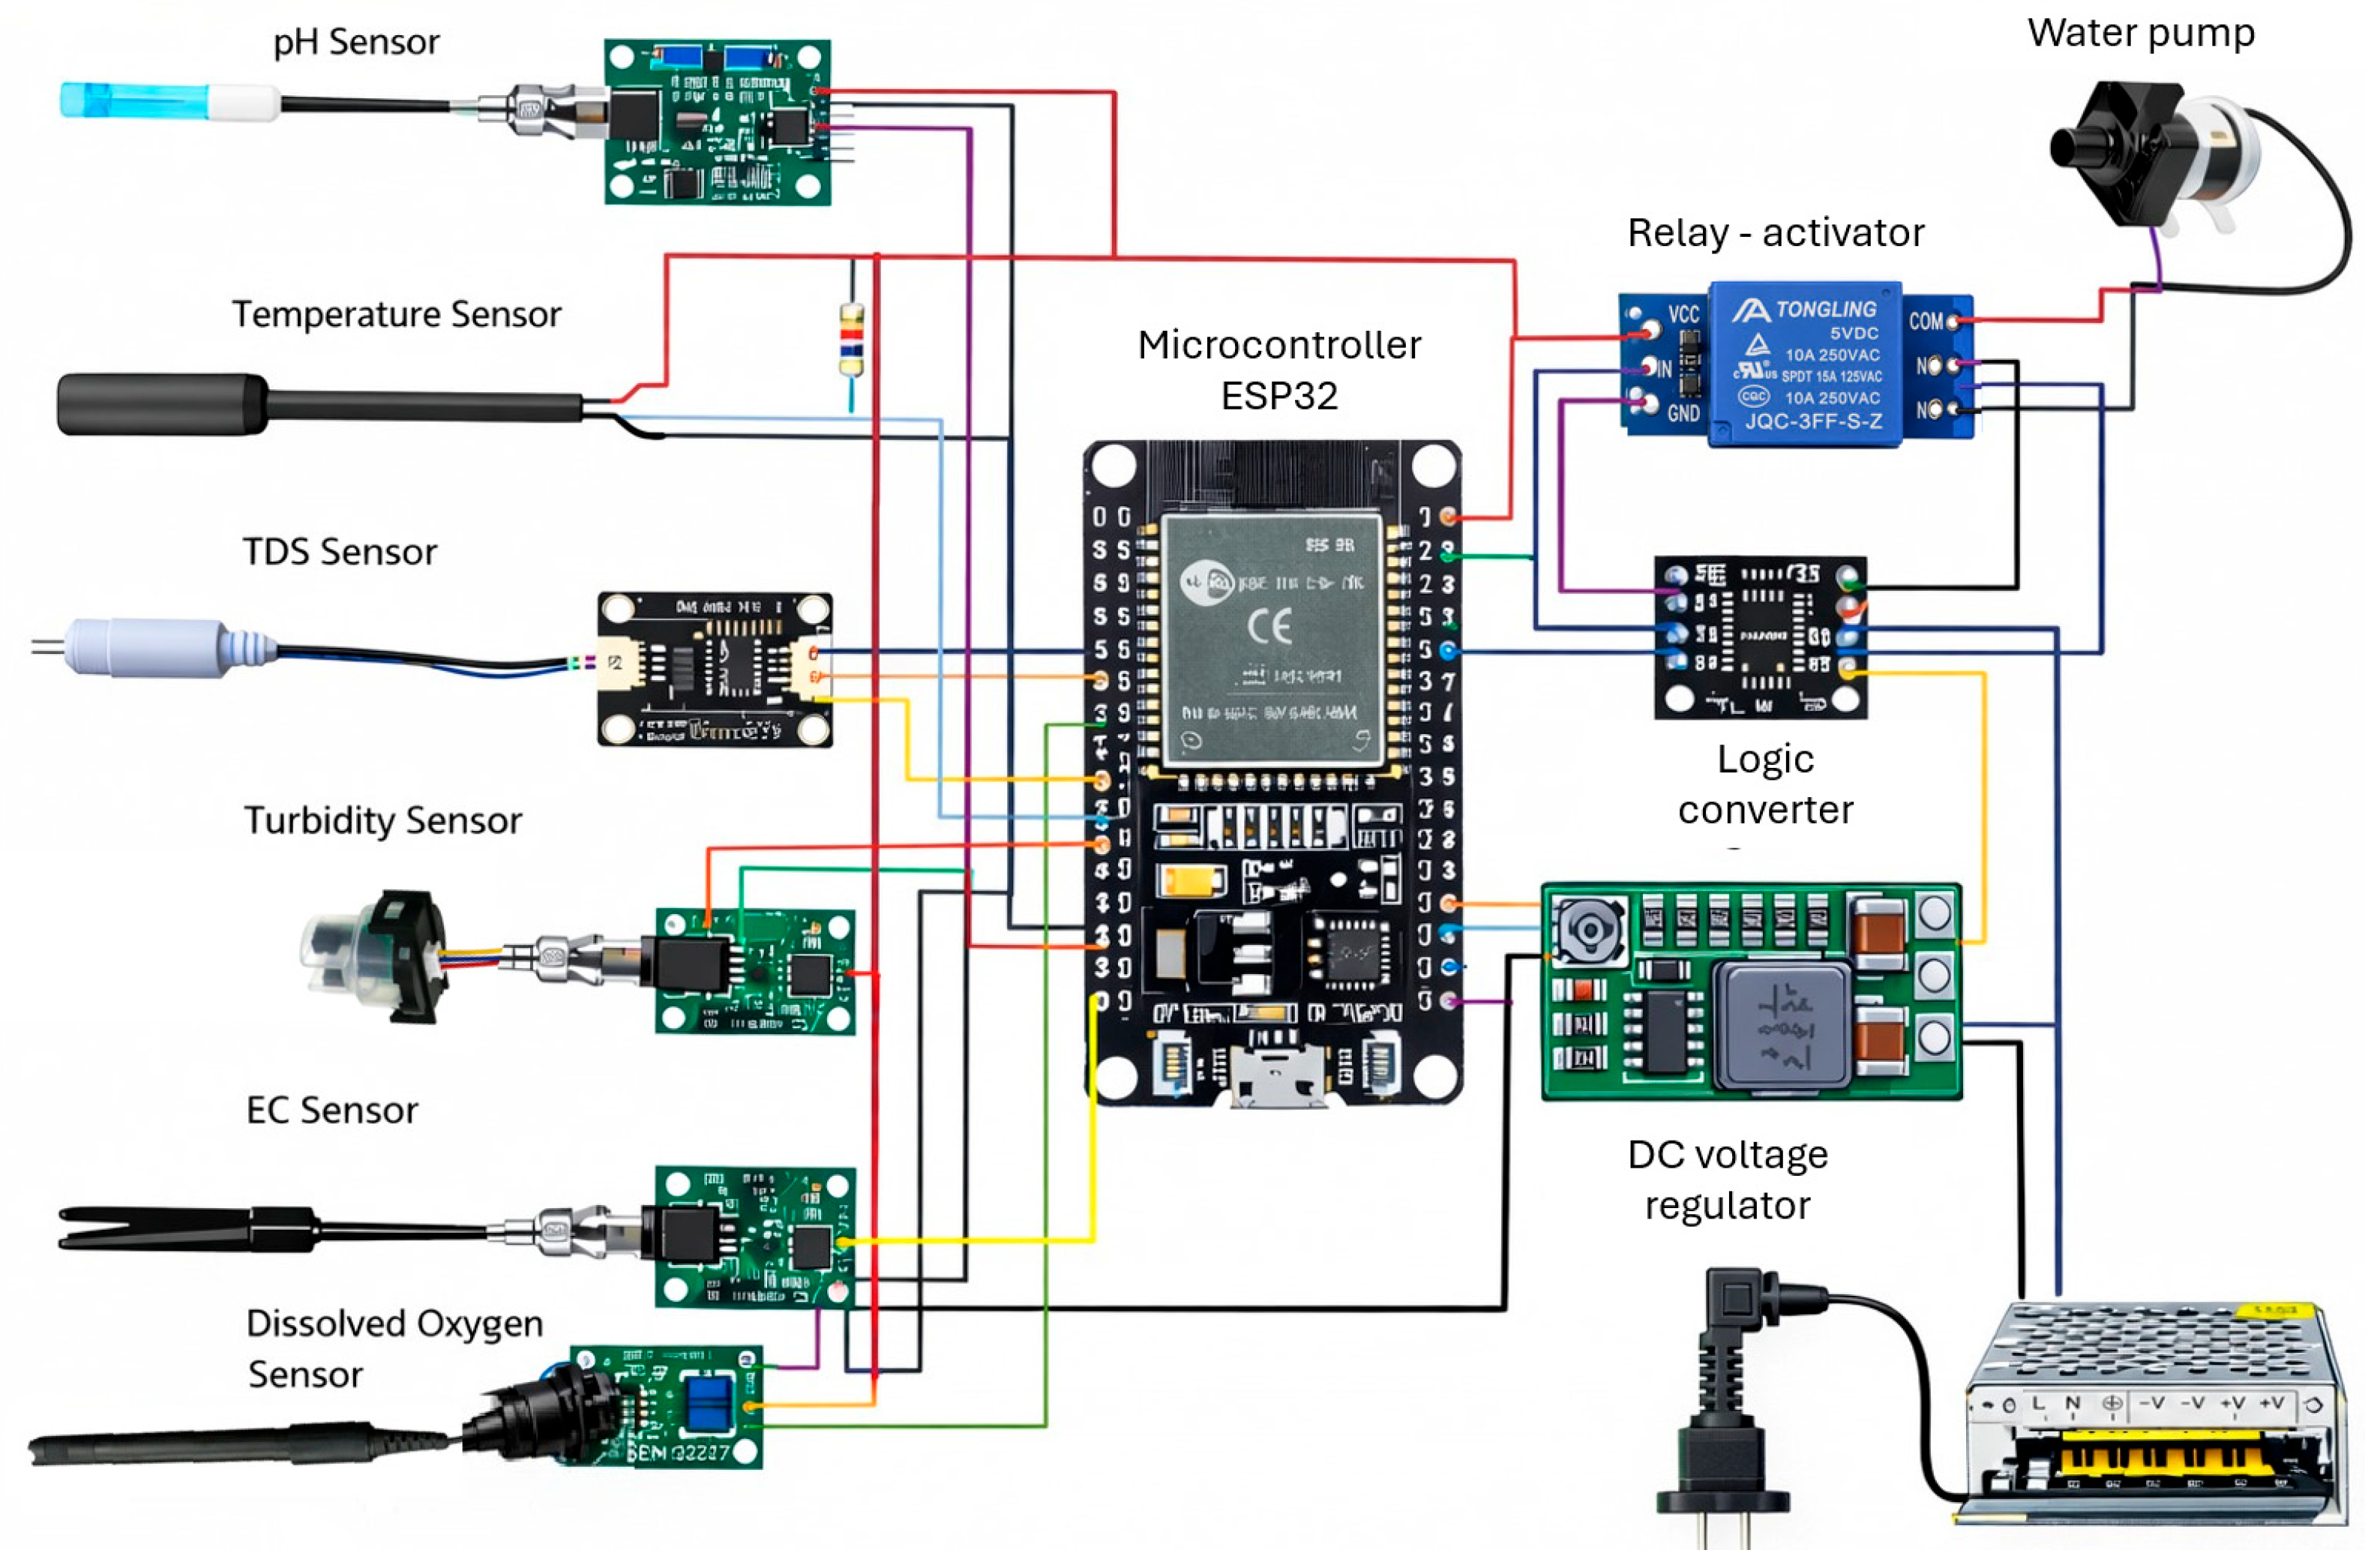
The instrumented unit used an ESP32 as the acquisition and control node. Around this board, the circuit integrated the sensors for temperature, pH, TDS, turbidity, electrical conductivity, and dissolved oxygen, using both analog and digital inputs, as shown in
Figure 3. A relay module handled pump actuation, while a logic-level converter and a DC voltage regulator were included to ensure signal compatibility and stable power conditioning. This hardware configuration supported sensor acquisition and relay-based pump actuation according to the operating logic described in
Section 2.5.
2.3.1. Microcontroller
The ESP-WROOM-32 DevKit V1 was used as the acquisition and control node of the instrumented hydroponic unit. In this implementation, the ESP32 read the analog signals from the pH, TDS, turbidity, DO, and EC modules and the digital signal from the DS18B20 temperature probe. The firmware converted the sensor readings into the variables transmitted to the web server, evaluated the temperature and DO thresholds, and generated the digital output used to activate the relay-controlled recirculation pump. The same node serialized the readings in JSON format and transmitted them via Wi-Fi/HTTPS to the PHP–MySQL server at approximately 8 s intervals.
2.3.2. Sensors
The data acquisition system was integrated with six sensors designed to monitor critical variables in the nutrient solution and root zone: temperature, total dissolved solids (TDS), turbidity, dissolved oxygen (DO), pH, and electrical conductivity (EC). A waterproof DS18B20 digital probe measured the nutrient solution temperature. For the remaining physicochemical variables, the system used five DFRobot Gravity analog modules: pH, total dissolved solids, dissolved oxygen, electrical conductivity, and relative turbidity voltage. This sensor set covered the thermal, ionic, and water-quality signals required to monitor solution stability and support the threshold-based control logic programmed in the microcontroller.
Table 1 presents the models and main technical specifications of each sensor.
The prototype used a K = 10 conductivity probe (
Table 1), a sensor whose nominal range is better suited to solutions with relatively high conductivity. It was incorporated because it was available for the prototype and offered sufficient robustness for continuous immersion in the recirculating nutrient solution. Even so, lettuce nutrient solutions commonly fall below the optimal working range of this probe. For that reason, EC values were treated as operational trend signals, not as high-precision measurements for nutrient dosing. A low-range probe, such as a K = 1 conductivity sensor, would be more appropriate for future versions of the system.
2.3.3. Sensor Calibration and Validation
Prior to integrating the system into the instrumented hydroponic unit, the sensors underwent calibration and functional verification, following the logic implemented in the ESP32 firmware and the manufacturer’s recommendations. The pH sensor was calibrated using reference buffer solutions, according to the calibration procedure of the library used in the system. The TDS sensor was configured with thermal compensation using the temperature measured by the DS18B20, in accordance with the manufacturer’s guidelines, to improve the stability of the dissolved solids estimate. The dissolved oxygen sensor was operated with a calibration scheme based on oxygen saturation and temperature compensation, suitable for measurements in nutrient solutions. For electrical conductivity, the analog signal conversion was defined using adjustment parameters in the firmware, referencing the calibration procedure with a standard solution recommended by the manufacturer. The turbidity sensor was treated as an analog voltage signal, used as a relative indicator of changes in solution clarity, since a local conversion curve to Nephelometric Turbidity Units (NTU) was not implemented. Finally, before deployment, the DS18B20 temperature probe was verified by comparing its readings with those of a reference digital thermometer immersed in water. Both sensors were placed in the same water container, and the readings were compared after thermal stabilization.
During the experimental period, no formal mid-term recalibration procedure was applied to the pH and EC probes. Sensor calibration was performed before deployment, and the pH and EC measurements were subsequently recorded continuously as operational monitoring variables throughout the cultivation period. Because the probes remained immersed in the nutrient solution during the experiment, these measurements were treated as continuous field-monitoring records rather than laboratory-grade calibrated measurements.
2.3.4. Physical Implementation of the Instrumented Module
The instrumented electronic module was installed in the sensor-instrumented unit described in
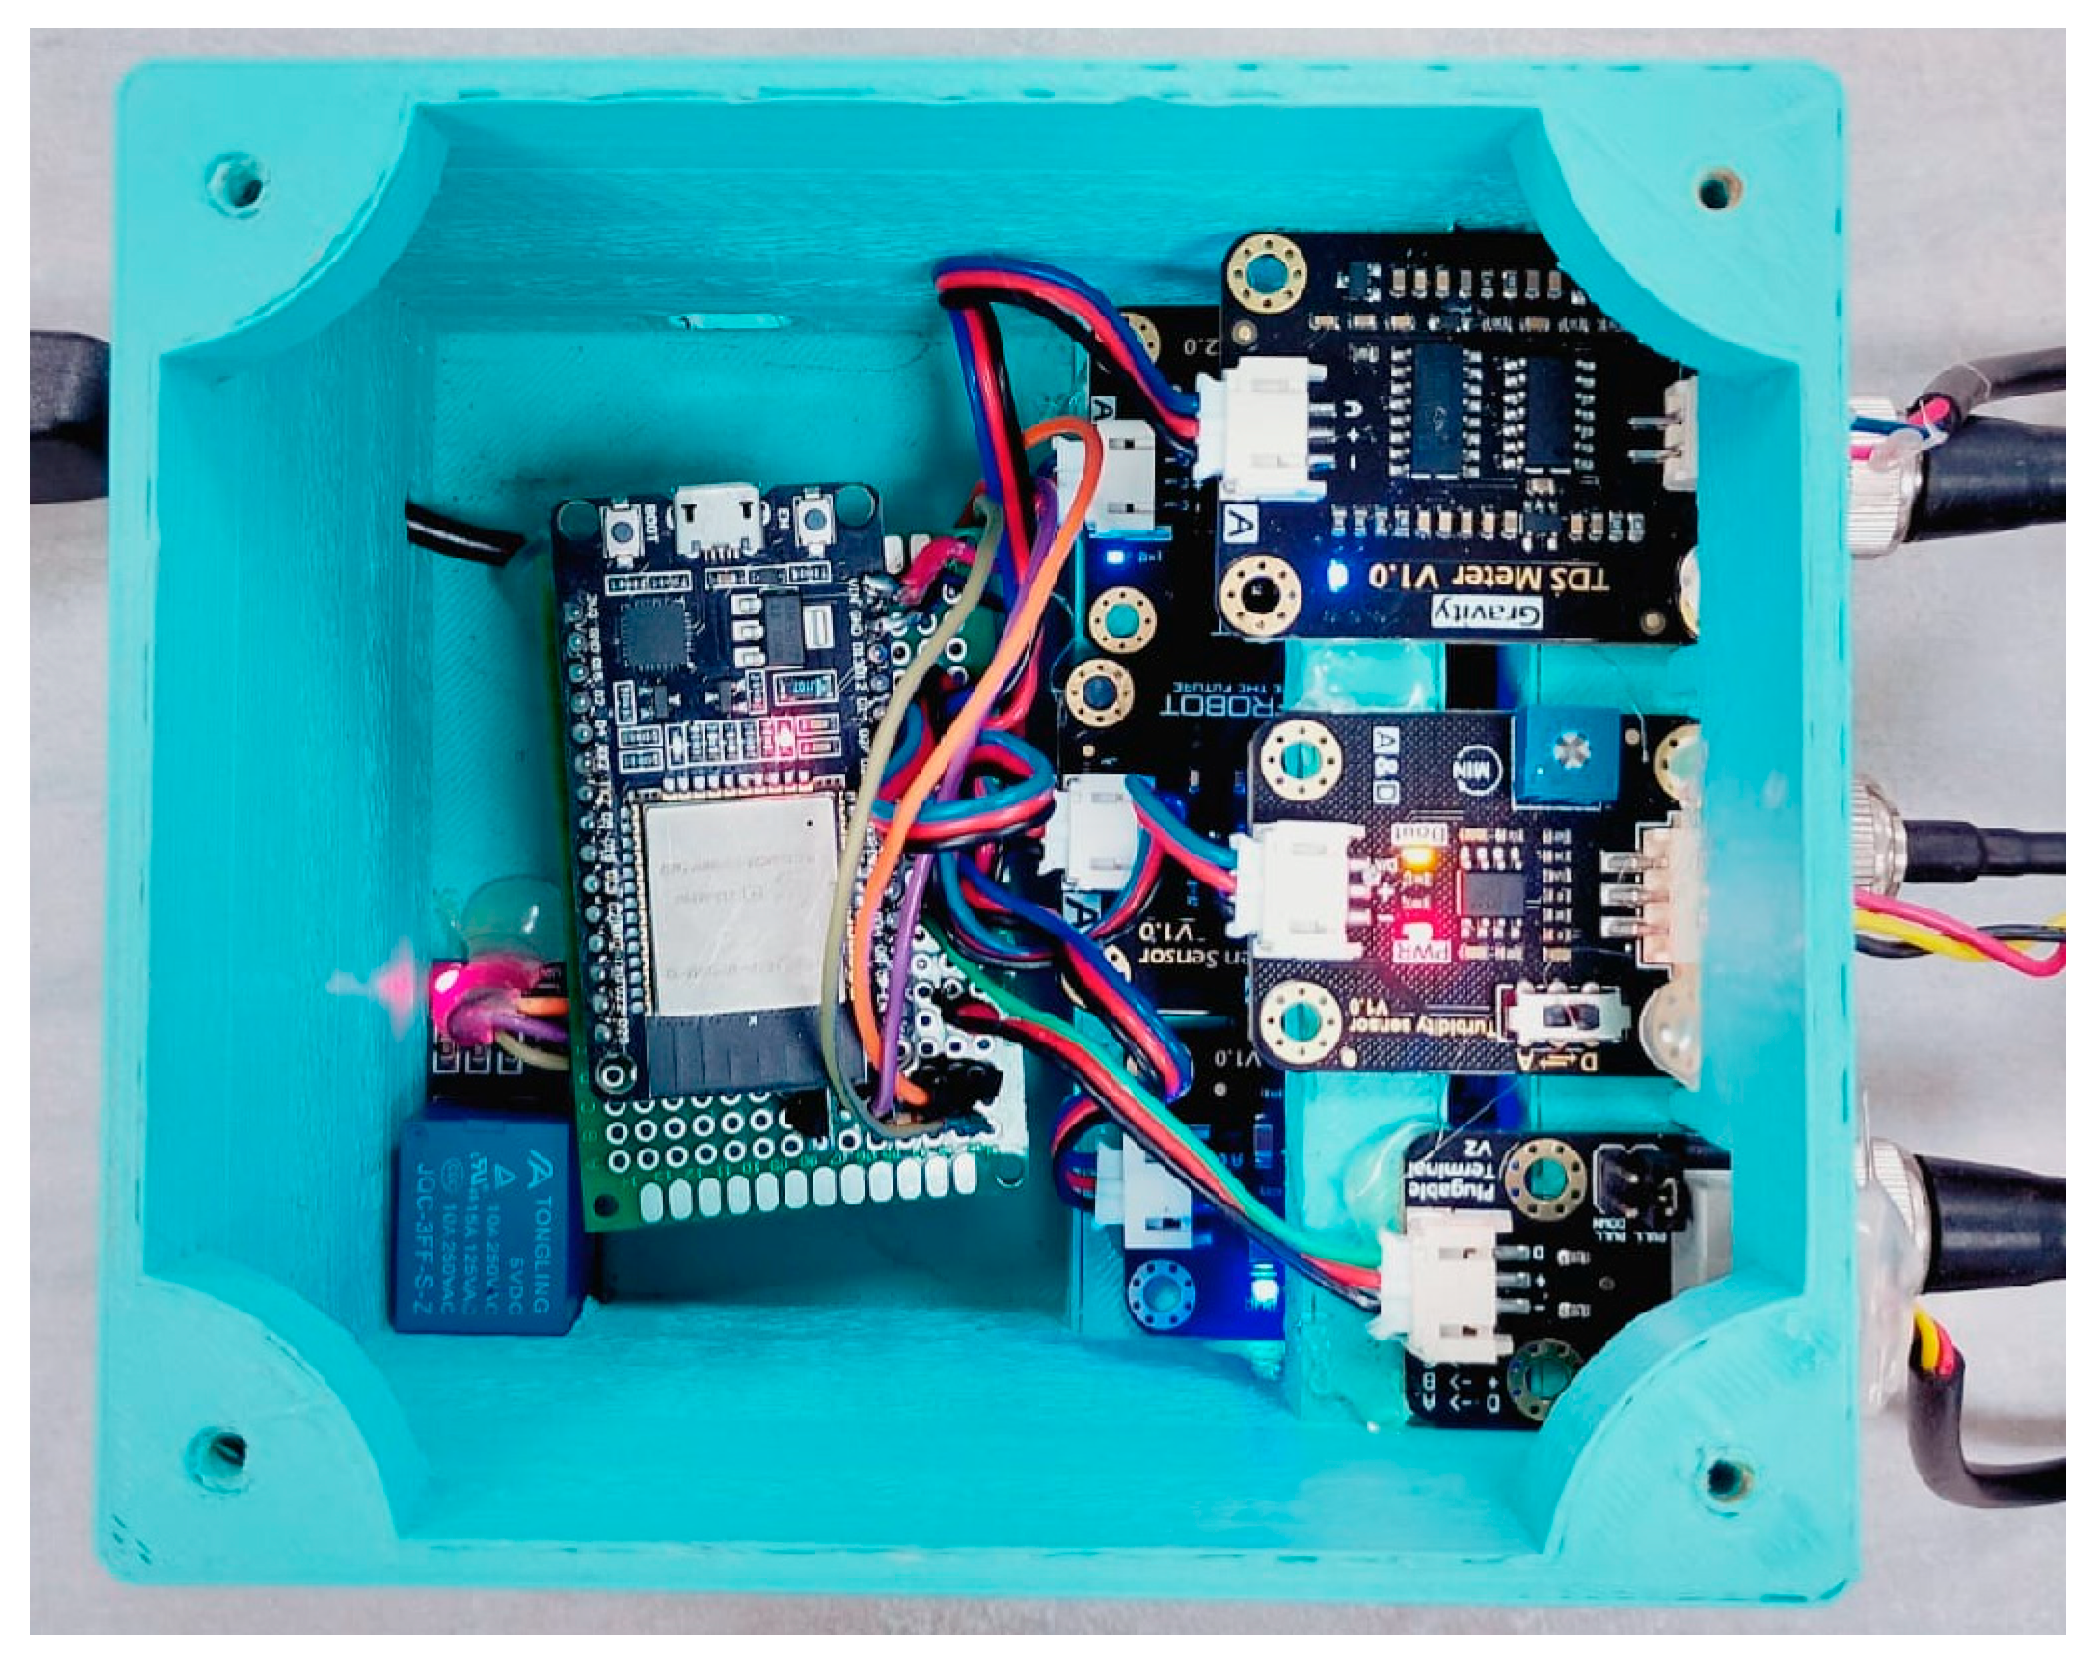
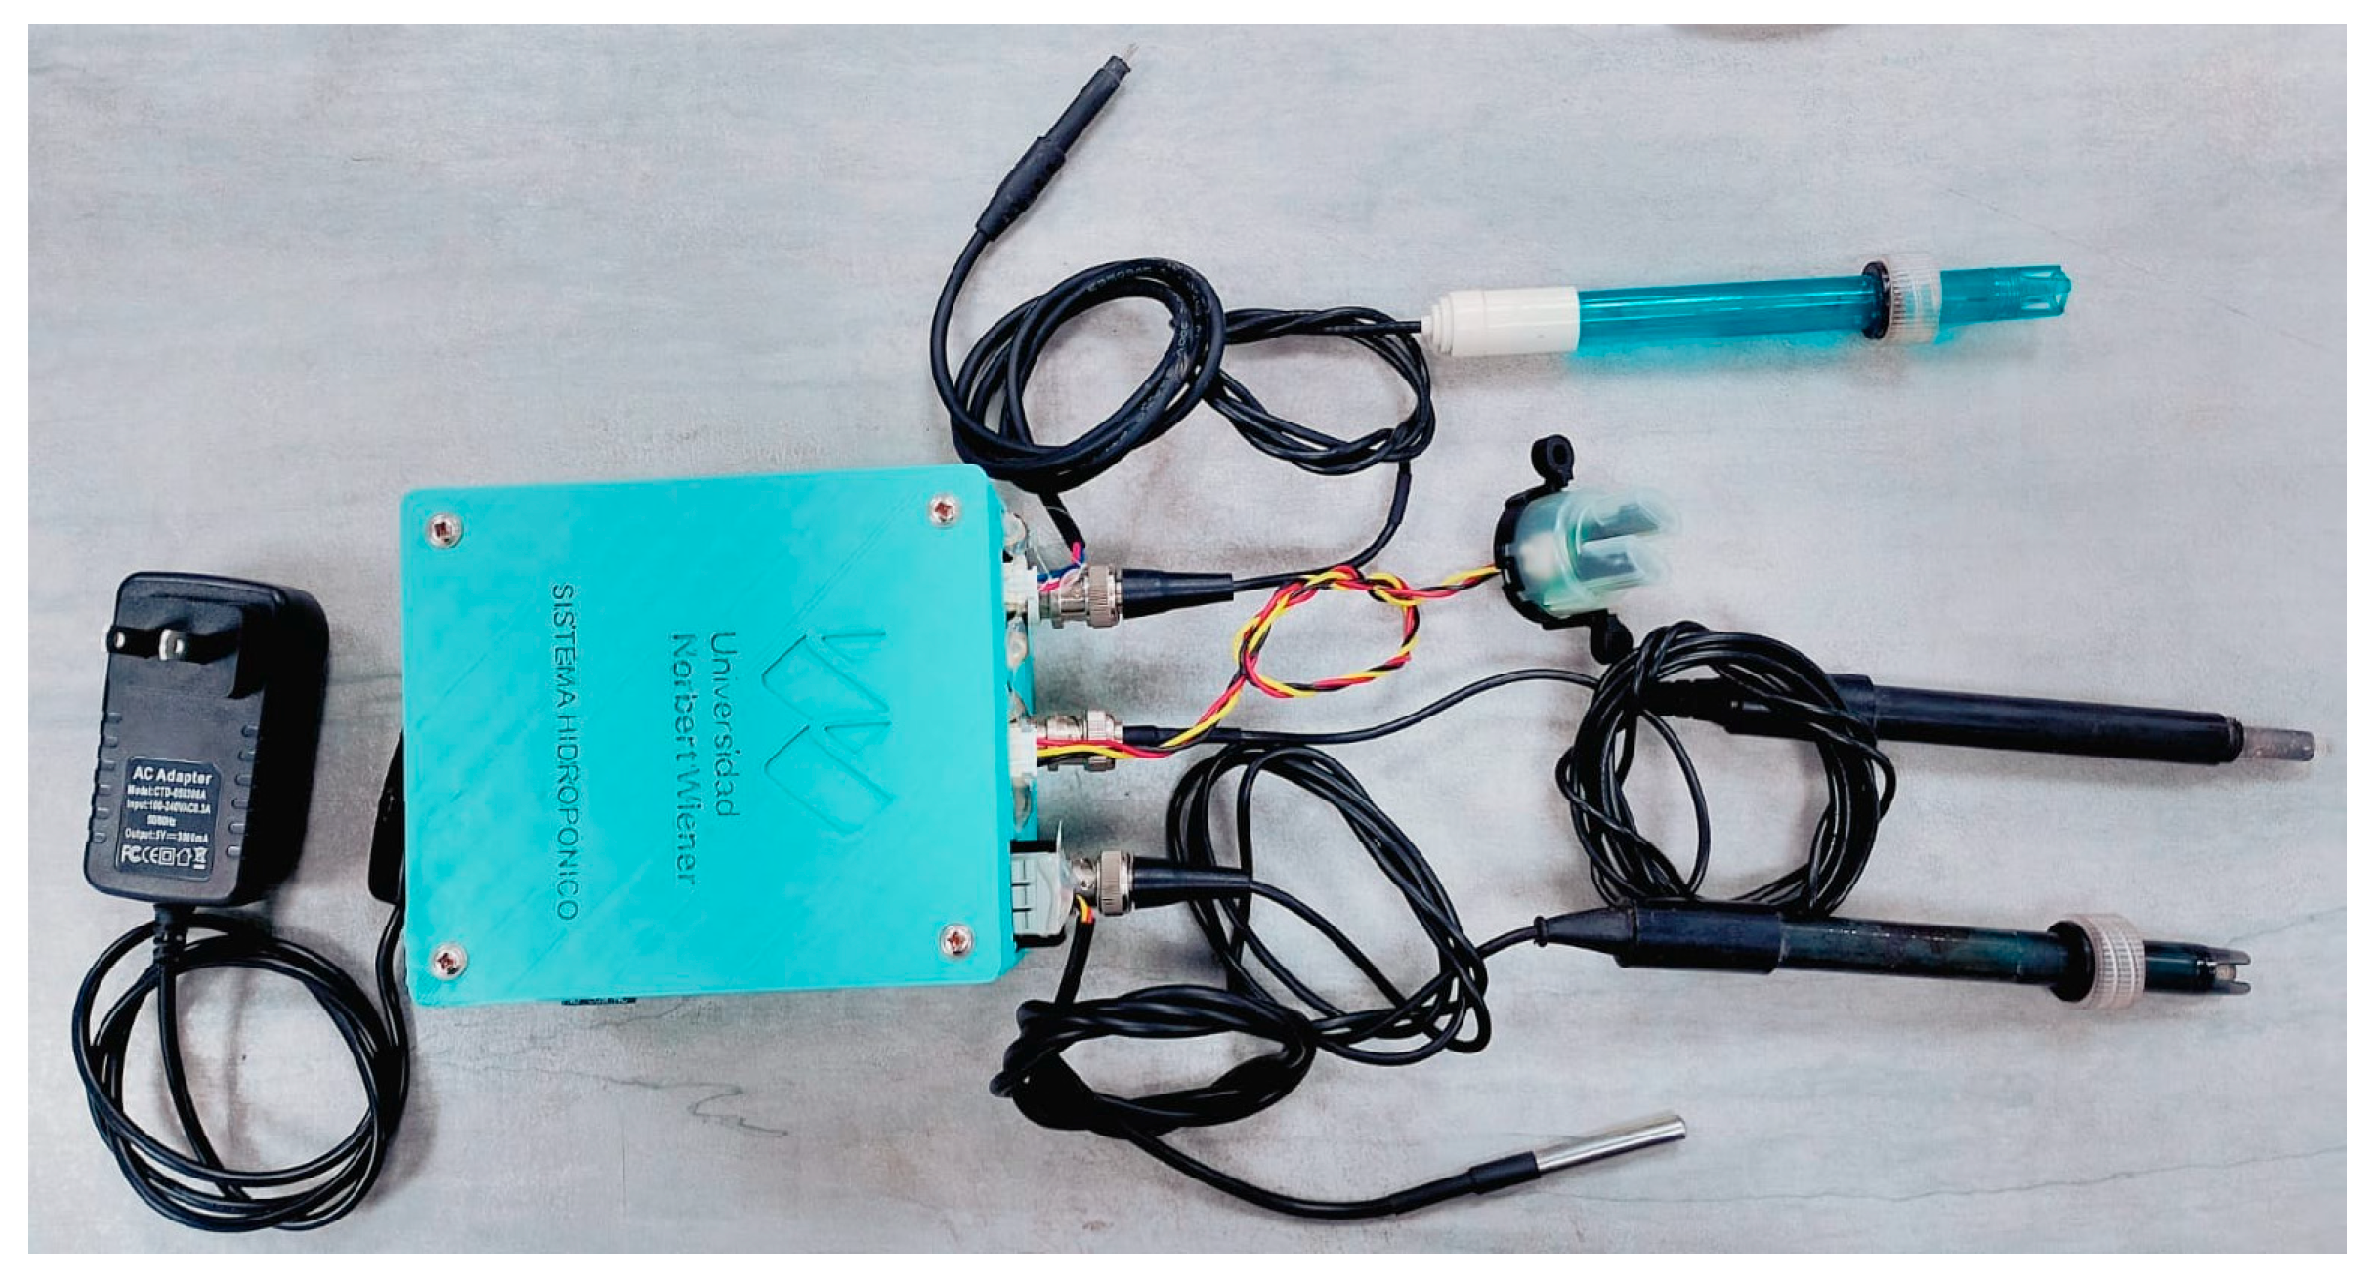
Section 2.2. The module was placed near the hydroponic structure to allow connection with the nutrient solution probes, power supply, relay module, and pump actuation circuit. The electronic module of the automated system was integrated into a 3D-printed enclosure designed to provide portability, mechanical protection, and cable management. Inside, the ESP32 microcontroller, the relay module, and the conditioning boards associated with the sensors for temperature, pH, dissolved oxygen, electrical conductivity, turbidity, and total dissolved solids were housed (
Figure 4).
This design allowed the main acquisition, processing and actuation components to be housed in a single cabinet, which helped protect the electronic components from moisture, water splashes and unintentional handling by external users, given that the environment where the hydroponic systems are installed is visited by multiple people, including students, teachers and administrators. The sensor connections were placed on the side of the cabinet, making it easy to remove, calibrate, maintain, or replace each sensor when necessary (
Figure 5).
Overall, this configuration resulted in a compact, modular electronics module that supported stable sensor connections and facilitated port access for maintenance or replacement. This was particularly useful for experimental operation, as it allowed electronic organization components and sensor interfaces to remain protected while still being accessible when adjustments were required.
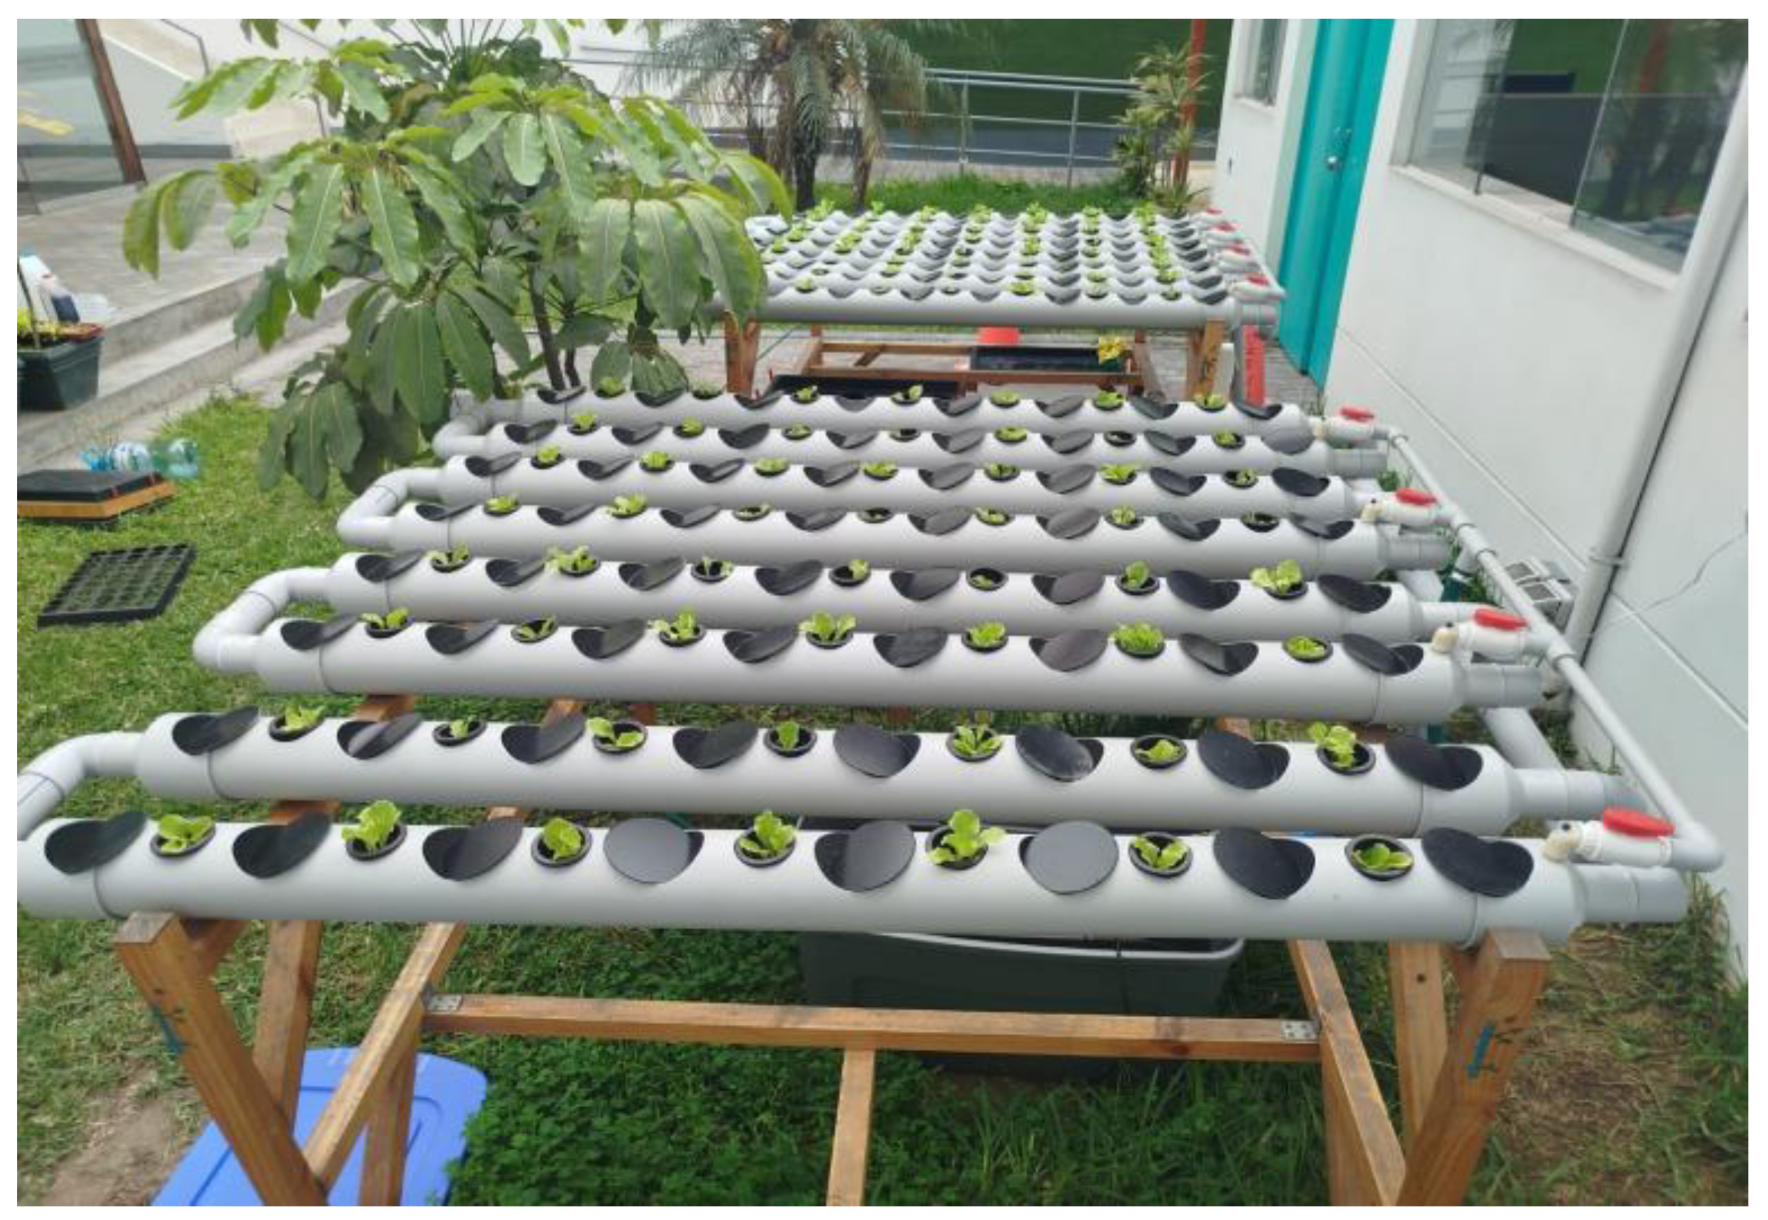
Figure 6 shows the two closed-loop recirculating hydroponic units during the seedling transplanting stage, 15 days after sowing.
2.4. Software Design
The software system was designed as a modular architecture for the acquisition, transmission, storage, and visualization of data in near real-time. The architecture comprised three functional levels: an ESP32-based IoT node for periodic sensor reading and pump-status recording; a web server for receiving, validating, and storing data; and a browser-based interface for remote monitoring of the lettuce crop.
The acquisition node recorded temperature, pH, total dissolved solids, relative turbidity voltage, dissolved oxygen, electrical conductivity, and pump status. These observations were serialized in JavaScript Object Notation (JSON) format and transmitted from the ESP32 to the server via Wi-Fi using HTTPS POST requests to a custom web Application Programming Interface (API). On the server side, the received data were validated and stored in a MySQL relational database through a web application developed using Hypertext Preprocessor (PHP).
The acquisition interval was approximately 8 s, not a strictly deterministic period, because each cycle included sequential sensor reading, variable conversion, JSON serialization, Wi-Fi transmission, and server response time. In each cycle, the ESP32 transmitted all monitored variables as a single timestamped JSON record. No interpolation, smoothing, or reconstruction of incomplete transmissions was applied; therefore, the analyses were based only on successfully stored records.
2.4.1. Web Monitoring Interface
The web interface was developed as a browser-based monitoring panel to display the main hydroponic variables in near real-time. It was implemented using PHP for the basic page structure, HTML5 for arranging the display elements, Cascading Style Sheets (CSS) for responsive design, and JavaScript for dynamic data updates. The graphical representation of the variables was supported by the Chart.js library, allowing the creation of time series for temperature, pH, turbidity, dissolved oxygen, electrical conductivity, TDS, and pump status.
The dashboard was automatically updated every 3 s through periodic queries to the server. The retrieved records were organized chronologically and displayed as graphs and tables, allowing the research team to observe the evolution of the monitored variables and verify the operational status of the system without manual intervention.
2.4.2. Application Programming Interface (API) and Data Persistence
Data management was handled through a custom web API connected to a MySQL database, without relying on external cloud services. This choice gave the research team direct control over how the information was stored, checked, and organized during the experiment. Measurements sent by the IoT node were received by an insertion service, which verified the data structure before saving each record in the database. A separate query service retrieved stored records for visualization, allowing the information to be filtered by device or limited to a specific number of recent observations. By separating data reception, storage, and visualization, the system made the data flow easier to follow and improved the reliability of the monitoring process.
2.5. Threshold-Based ON/OFF Operating Logic
This section describes the operating logic implemented only in the IoT-instrumented hydroponic system. The conventional reference system did not use sensor feedback for pump activation and followed the fixed timer-based schedule described in
Section 2.2, with 15 min of pump operation at the beginning of each hour from 08:00 to 18:00 h.
The system’s operating procedure was based on continuous monitoring and a threshold-based ON/OFF decision scheme, with an approximate acquisition frequency of 8 s. In each cycle, the microcontroller acquired the variables of temperature, pH, TDS, turbidity, DO, and EC, and compared the control variables with predefined operating ranges. The main variable for pump activation was the nutrient solution temperature, with the normal operating range established between 20.0 °C and 25.2 °C. When the temperature fell below or rose above this range, the pump was automatically activated to promote solution recirculation and contribute to the system’s thermal stabilization. As a supplementary condition, dissolved oxygen was included as a secondary activation variable, so that the pump also remains on when the value drops below 6.5 mg/L, allowing it to be deactivated only when the temperature returns to the target range and the dissolved oxygen again reaches values equal to or greater than 6.8 mg/L.
Although a simple hysteresis band was implemented for dissolved oxygen, no temperature-specific hysteresis, debounce routine, or minimum relay switching interval was included in the current prototype. Thus, short-cycling near the temperature threshold remains a potential engineering limitation, although no evident rapid switching was observed during the experimental period. In contrast, variables such as pH, EC, TDS, and turbidity are considered primarily as monitoring and alert indicators for the monitoring system, since their deviations are not corrected solely through recirculation.
3. Results and Discussion
3.1. Performance of the Near-Real-Time Monitoring System
The proposed monitoring device collected near-real-time data on the physicochemical conditions of the nutrient solution and the system’s operational status at approximately 8 s intervals. The analyzed dataset comprises a total of 241,797 records between 21 January 2026, 09:00:00 and 13 February 2026, 17:01:22. From a descriptive perspective (
Table 2), the nutrient solution temperature had a mean value of 24.13 °C with a standard deviation of 3.71 °C, ranging from 21.10 °C to 40.19 °C.
The nutrient solution showed marked thermal variability during the monitoring period. As reported in
Section 2.2, the complementary meteorological records indicated a mean air temperature of 19.55 °C, with values ranging from 16.20 °C to 24.93 °C. Relative humidity remained high, with an average of 81.60% and a range of 75.80–87.15%, while the vapor pressure deficit (VPD) averaged 0.42 kPa, varying between 0.27 and 0.56 kPa. These conditions characterized the experiment as a warm and humid open-field summer trial. Even so, the nutrient solution reached a maximum temperature of 40.19 °C, well above the recorded air temperature. Such a difference suggests that the thermal peaks observed in the recirculating solution were not driven only by ambient air temperature. Direct and indirect solar radiation on the exposed PVC channels and reservoir, combined with the limited passive thermal buffering capacity of the hydroponic structure, likely contributed to heat accumulation in the nutrient solution.
As summarized in
Table 2, pH, TDS, EC, DO, and relative turbidity voltage showed relatively stable behavior during most of the monitoring period, whereas nutrient solution temperature exhibited the highest variability, reaching a maximum of 40.19 °C. The pump state average indicated that the system remained active for approximately 28.5% of the recorded time.
Because the monitoring system recorded observations at approximately 8 s intervals, consecutive measurements were expected to exhibit temporal autocorrelation. Therefore, the descriptive statistics reported in
Table 2 should be interpreted as summaries of high-frequency local fluctuations in the monitored signals rather than as estimates derived from independent observations. No inferential variance analysis was performed on the raw 8 s data; the standard deviation is reported only as a descriptive indicator of short-term variability during the monitoring period.
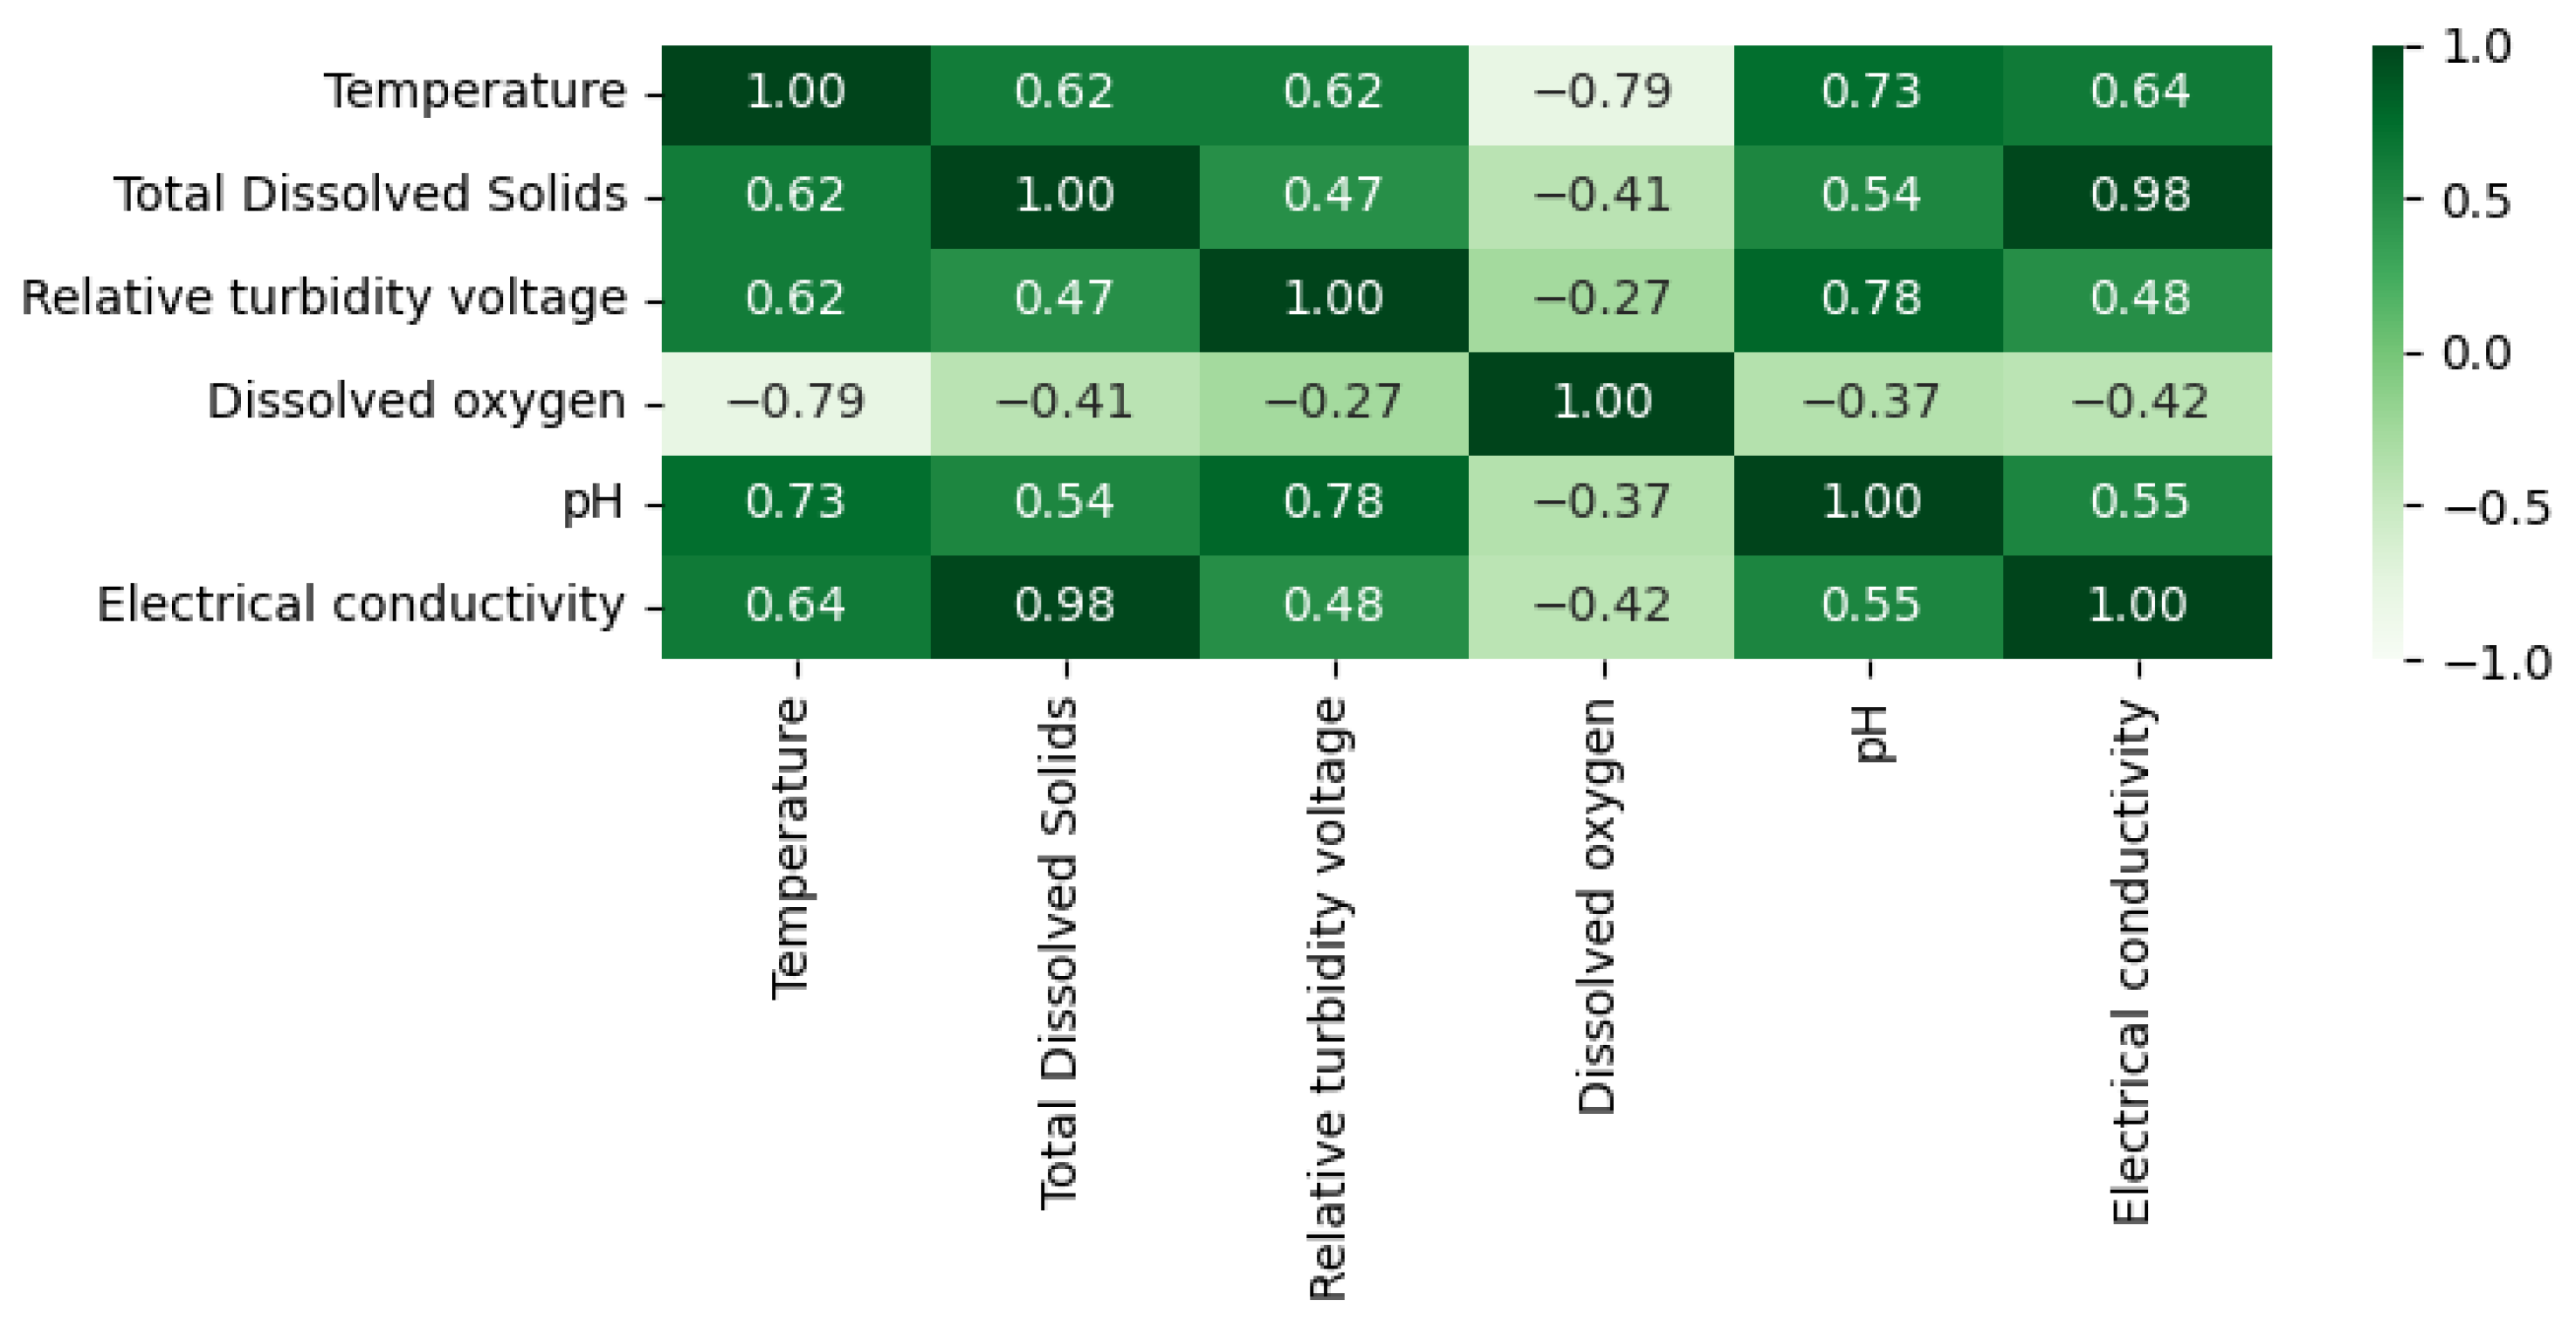
The correlation matrix (
Figure 7) allowed for the identification of relevant associations between the monitored variables, highlighting primarily the very high positive correlation between total dissolved solids (TDS) and electrical conductivity (r = 0.98). This result is consistent with the fact that both variables represent, from complementary perspectives, the ionic concentration of the nutrient solution. This strong relationship reinforces the internal consistency of the dataset and the combined usefulness of both indicators for monitoring the nutritional status of the system. Likewise, a high positive correlation was observed between relative turbidity voltage and pH (r = 0.78), as well as a moderate positive correlation between relative turbidity voltage and TDS (r = 0.47) and between relative turbidity voltage and electrical conductivity (r = 0.48). This suggests that variations in the physical quality of the solution can be accompanied by simultaneous changes in its chemical properties, although this does not necessarily imply direct causality. In contrast, temperature showed moderate to high positive correlations with pH (r = 0.73), TDS (r = 0.62), relative turbidity voltage (r = 0.62), and electrical conductivity (r = 0.64), demonstrating a general association between increased temperature and increases in several system parameters. The strongest negative relationship was observed between temperature and dissolved oxygen (r = −0.79), while dissolved oxygen also showed negative correlations with TDS (r = −0.41), pH (r = −0.37), and electrical conductivity (r = −0.42). This behavior is consistent with the decrease in oxygen solubility in water as temperature increases and with the combined interaction of the medium’s physicochemical variables.
3.2. Comparative Visual Evaluation of the Crop
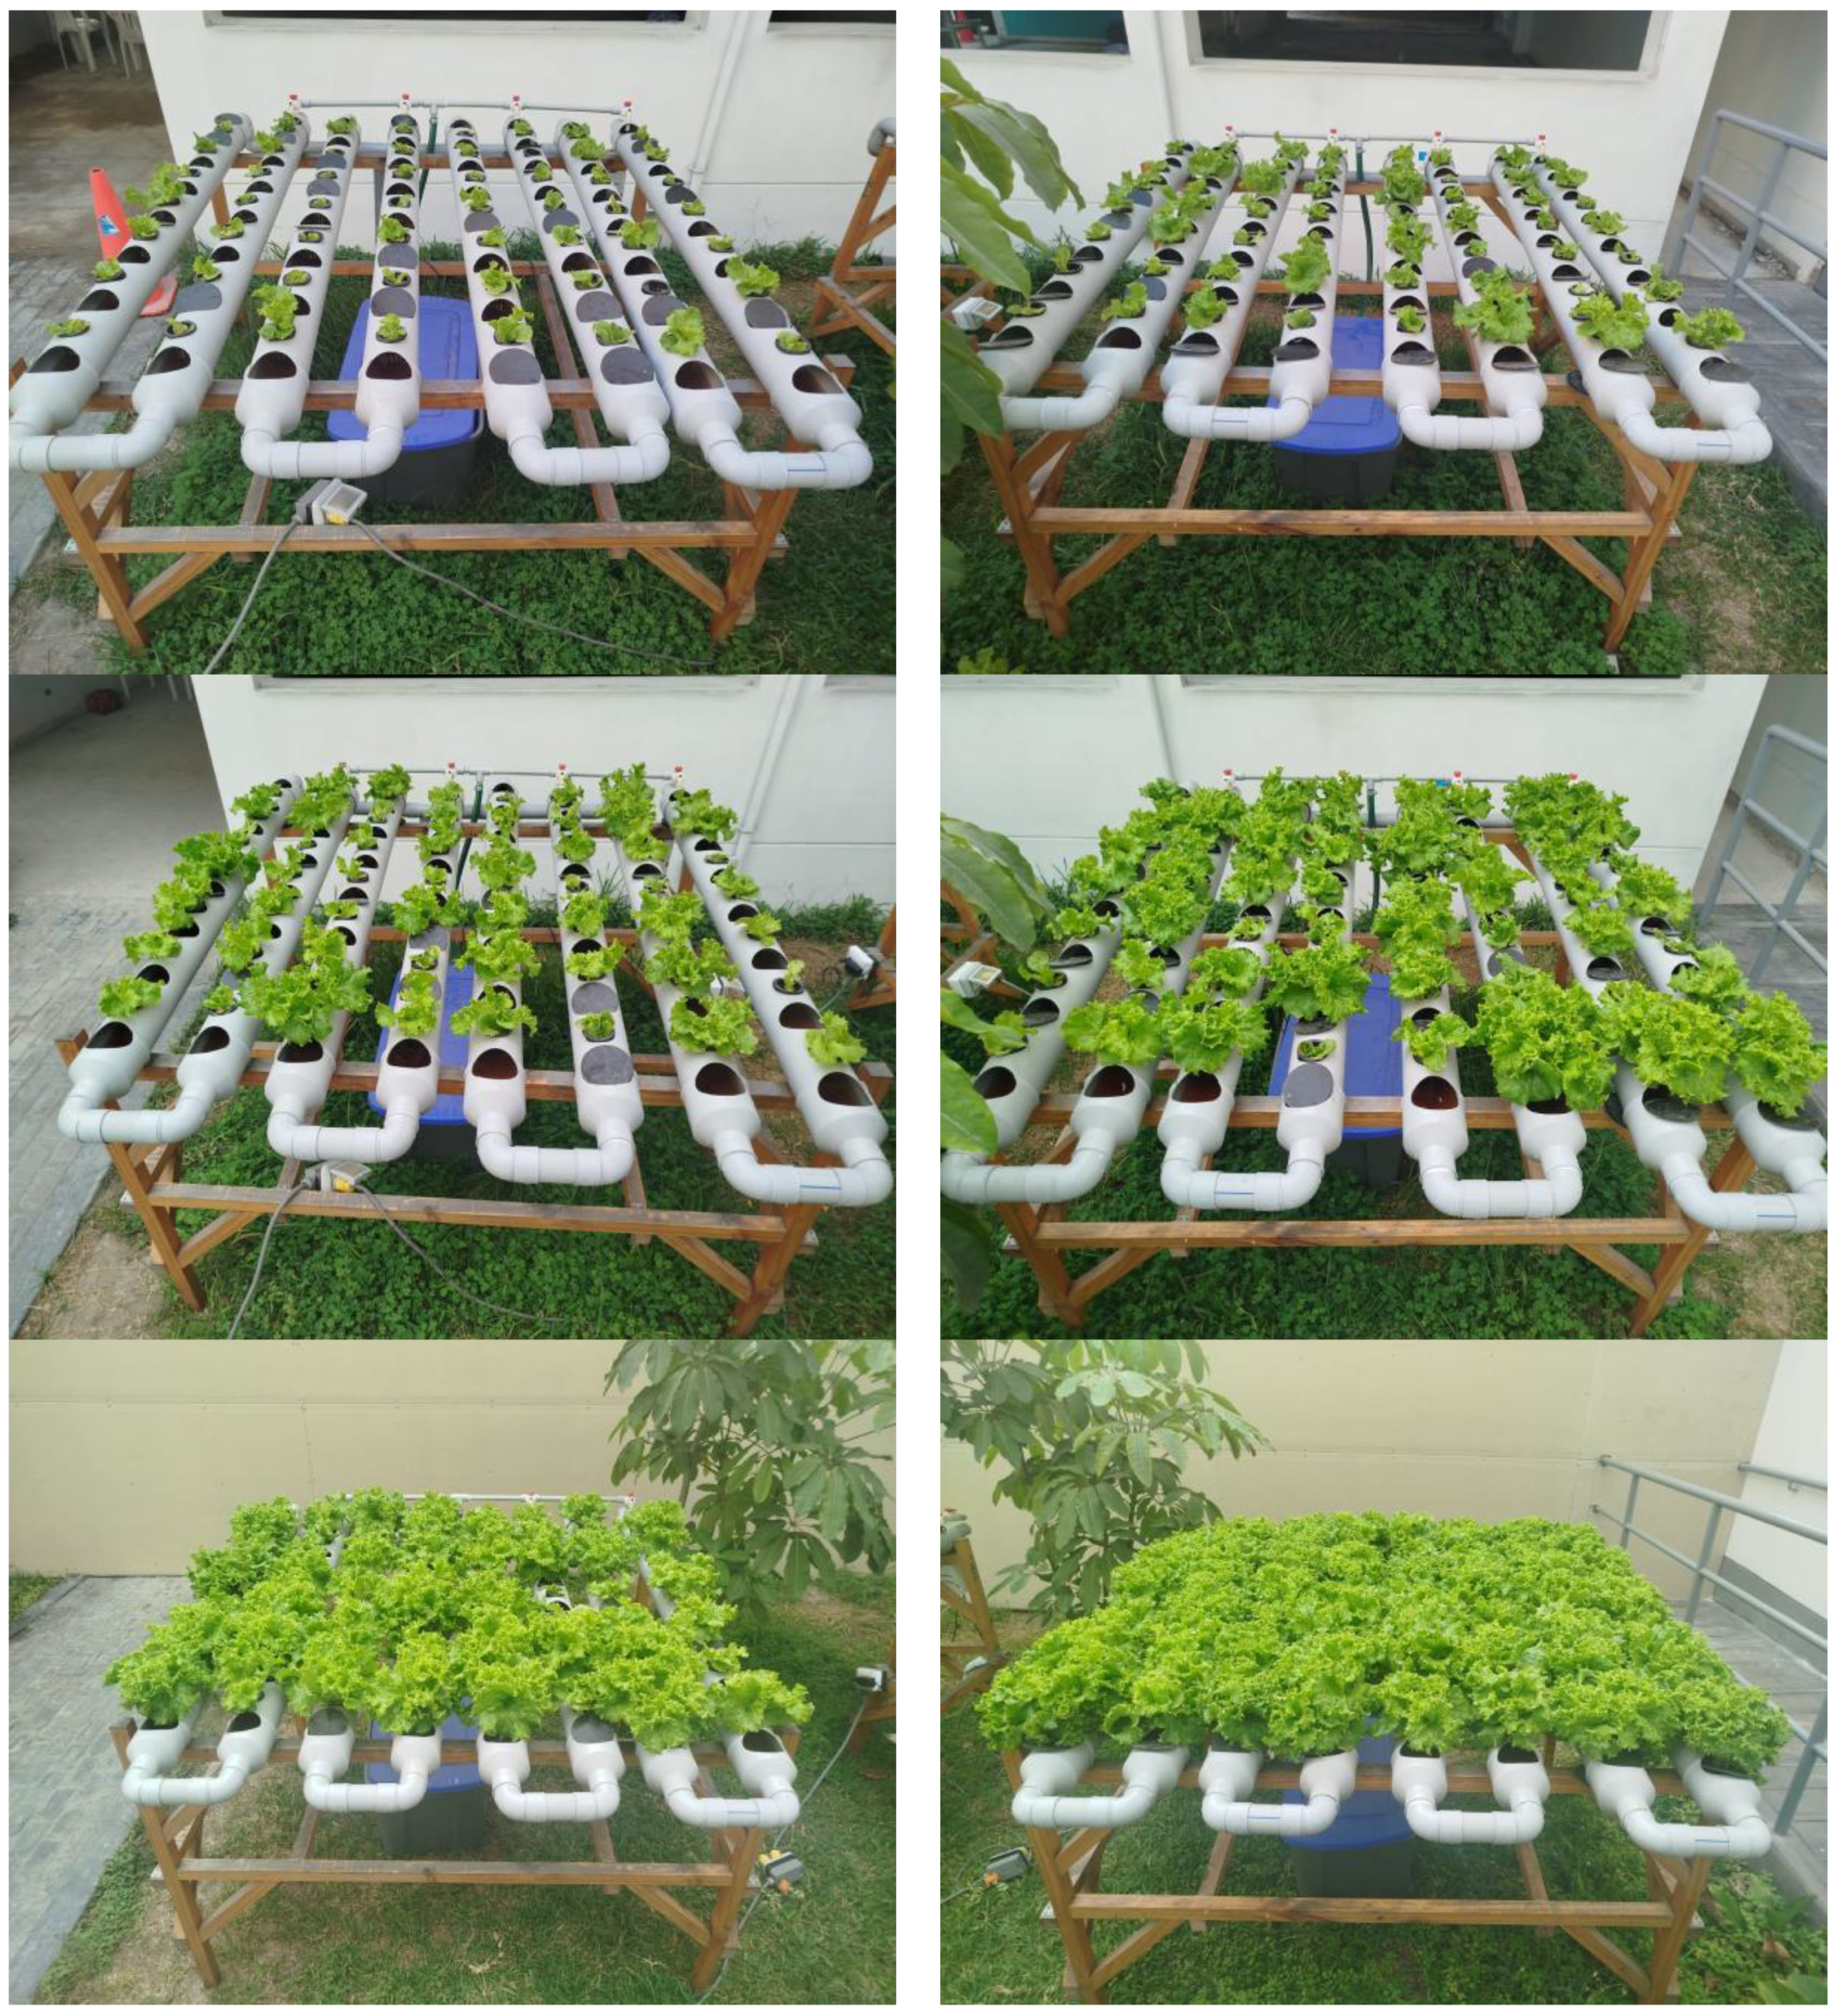
The comparative evaluation of the crop was carried out by monitoring lettuce growth in the two closed-loop recirculating hydroponic units with PVC growing channels: the conventional fixed-timer unit, located in the left column, and the sensor-instrumented threshold-controlled unit, located in the right column (
Figure 8). It should be noted that the visual comparison was based on the photographic records available from the monitored stages. Side-view images of the valve/inlet side were not systematically recorded during the experiment; therefore, the visual evaluation was limited to the documented views shown in
Figure 8. The first row corresponds to the state of the crop 7 days after transplanting, the second row shows the evolution at 15 days, and the third row presents the final condition of the crop on the harvest date, 13 February.
From a qualitative perspective, the photographic sequence shows a progressive development of the leaf area in both treatments; however, in the intermediate and final stages, greater canopy uniformity and a more homogeneous occupation of the growing space are observed in the instrumented system. This visual trend is consistent with the operational behavior and in relation to the data obtained. During this period, the nutrient solution exhibited average values of 24.13 °C for temperature, 6.03 for pH, 933.29 ppm for TDS, 1866.56 µS/cm for EC, 6.74 mg/L for DO, and 0.272 V for relative turbidity voltage, indicating overall stability in the physicochemical variables, although with intense thermal episodes associated with peak environmental load hours, reaching maximums of up to 40.19 °C.
The phased analysis complements this evaluation. During the first 7 days, the automated system maintained an average temperature of 24.51 °C, a pH of 6.03, a TDS of 934.39 ppm, an electrical conductivity of 1868.76 µS/cm, and a dissolved oxygen of 6.72 mg/L, while the pump remained active 29.39% of the time, reflecting an initial phase with a higher demand for regulation. In the interval corresponding to days 8–15, the average temperature was 24.35 °C, the pH was 6.03, the TDS was 934.40 ppm, the electrical conductivity was 1868.80 µS/cm, and the dissolved oxygen was 6.72 mg/L, with pump activation at 26.62%, suggesting a reduction in operational intervention as the crop establishment progressed. Finally, in the final stage, between day 16 and harvest, the average temperature dropped to 23.60 °C, the pH remained at 6.04, the TDS at 931.30 ppm, the electrical conductivity at 1862.57 µS/cm and the dissolved oxygen at 6.78 mg/L.
Across the three stages, pH remained within the 5.8–6.5 range in 100% of observations, while dissolved oxygen remained above 6 mg/L in 99.39%, 97.72%, and 100% of the first, second, and final stages, respectively. These results indicate stable operational conditions in the instrumented unit under high thermal variability. However, the visual evidence should not be interpreted as conclusive agronomic superiority, since direct response variables such as fresh biomass, plant diameter, number of leaves, and final yield were not measured in both treatments.
The conventional treatment was configured as a practical fixed-timer reference, with hourly 15 min pump activation cycles between 08:00 and 18:00 h. Therefore, the comparison evaluates the operational behavior of the proposed sensor-triggered threshold strategy against a predefined daytime recirculation schedule rather than against a continuously operating or optimized closed-loop control system.
3.3. Discussion and Methodological Scope
The results indicate that the sensor-instrumented system provided stable operational monitoring of the nutrient solution under open-field summer conditions, particularly for pH, EC, TDS, DO, and relative turbidity voltage. The negative association between temperature and DO is consistent with the expected reduction in oxygen solubility as water temperature increases, while the strong relationship between TDS and EC reflects their common dependence on ionic concentration in the nutrient solution. These findings support the usefulness of low-cost IoT architectures for tracking hydroponic physicochemical dynamics under variable environmental conditions.
These findings agree with previous research [
8,
15], which emphasized that the composition of the nutrient solution and root thermal management are determinants in lettuce cultivation. This is because temperature fluctuations directly affect oxygenation and root metabolism. In the present study, the observed negative correlation between nutrient solution temperature and dissolved oxygen (r = −0.79) was consistent with the reduction in oxygen solubility with increasing water temperature, especially under open-field summer conditions where the PVC channels and reservoir were exposed to external heat loads. Furthermore, the strong association between TDS and EC (r = 0.98) was consistent with their common dependence on the ionic concentration of the nutrient solution, as also reported in studies addressing nutrient dynamics in hydroponic lettuce systems [
9]. From a technological perspective, the stable acquisition of pH, temperature, EC, TDS, DO and relative turbidity voltage was also consistent with previous IoT-based hydroponic monitoring approaches using ESP32 platforms and low-cost sensors [
10,
13].
The observed temporal variability of the nutrient solution temperature can be explained by the exposure of the PVC channels and reservoir to outdoor summer conditions, where solar radiation and ambient heat loads can accelerate heat transfer to the recirculating solution. This thermal behavior is relevant because increasing water temperature reduces oxygen solubility and can affect root respiration and nutrient uptake. Accordingly, the negative correlation between temperature and dissolved oxygen observed in this study is consistent with the expected physicochemical relationship between water temperature and oxygen availability. Likewise, the strong positive association between TDS and EC reflects their shared dependence on the ionic concentration of the nutrient solution, supporting the internal consistency of the monitoring records. The stability of pH, together with the relatively stable EC and TDS values, suggests that the system maintained suitable operational conditions during most of the monitoring period, although these results should be interpreted as operational monitoring evidence rather than as complete agronomic validation.
Nevertheless, the contribution of the proposed system should be interpreted primarily at the operational and technological level. The visual differences observed between the conventional and sensor-instrumented systems suggest improved canopy uniformity in the instrumented treatment; however, the absence of direct agronomic measurements such as fresh weight, dry matter content, Leaf Area Index (LAI), and final yield prevents a conclusive claim of productive superiority. Therefore, the present study provides evidence of technical feasibility and operational stability, while future trials should integrate quantitative crop response variables and a more complete agronomic validation.
4. Conclusions
The implementation of the IoT-based monitoring and threshold-controlled recirculation system proved to be a viable technical solution for managing lettuce crops grown in closed-loop recirculating hydroponic systems under uncontrolled environmental conditions. By integrating the ESP32 microcontroller and a modular software architecture, it was possible to monitor critical nutrient solution variables, such as temperature and DO, and to activate recirculation when predefined thresholds were exceeded. The sensor-triggered ON/OFF threshold strategy allowed for condition-dependent operation of the recirculation system, in contrast to the conventional reference system operated under a fixed daytime schedule of 15 min ON and 45 min OFF every hour from 08:00 to 18:00 h. Furthermore, the visual sequence of the crop suggests greater canopy uniformity in the instrumented treatment compared to the conventional one, supporting the potential of IoT-based monitoring and threshold-controlled recirculation to stabilize the root microenvironment and improve system performance.
However, the main limitation of the study is that the agronomic comparison relies primarily on visual evidence and monitoring variables, without yet incorporating direct indicators of crop response, such as fresh weight, dry matter content, leaf area index (LAI), plant diameter, number of leaves, or final yield. Furthermore, the results correspond to a single species, a specific warm period, and a localized experimental environment, which limits their generalizability. Turbidity was monitored only through the sensor’s analog voltage output, without local calibration against standard NTU solutions. Another limitation is that no formal mid-term recalibration of the pH and EC probes was conducted during the experiment. Prolonged immersion in nutrient solution may have introduced drift due to scaling or biofouling.
Future work should include incorporating quantitative agronomic variables, expanding the validation to multiple cycles and seasons, and evaluating more advanced control strategies, such as adaptive PID, fuzzy control, or model-based control, capable of dynamically adjusting control parameters according to crop stage, energy use, water consumption, and environmental disturbances. The current threshold-based control logic did not include a temperature-specific hysteresis band or minimum relay switching interval. Although the dissolved oxygen condition included a simple hysteresis band, future implementations should include debounce logic and minimum ON/OFF times to prevent short-cycling and extend relay and pump lifetime.



 ,
,