


Abstract
Automated and objective grading of cocoa (Theobroma cacao L.) fermentation remains a major challenge because the conventional cut test relies on subjective visual inspection and is difficult to scale. In this study, we develop and evaluate a deep learning pipeline for classifying cocoa bean fermentation levels from expert-annotated cut-test images acquired under controlled conditions, enabling the systematic evaluation and comparison of multiple convolutional and transformer-based architectures under consistent preprocessing, training, and evaluation protocols. The dataset comprises 4347 segmented cocoa bean images distributed across four severely imbalanced classes, namely fermented, under-fermented, slaty, and violet. Representative architectures, including EfficientNet-B0, MobileNetV3-Large, ConvNeXt-XLarge, ViT-Base, and ViT-Large, are benchmarked to analyze the effects of class imbalance, RGB versus HSV color representation, training duration, and label-space formulation. The results show that severe class imbalance strongly degrades performance in direct four-class classification. A hierarchical binary-to-multiclass strategy significantly improves balanced recognition by separating fermented from unfermented beans prior to subclass discrimination, increasing macro-F1 scores from approximately 80–83% to 89–91%. Among the evaluated models, ViT-Base emerges as the most stable architecture across experimental settings and offers the best balance between classification performance, training stability, and computational cost. Although larger models achieve slightly higher peak performance under balanced conditions, ViT-Base provides more consistent results under realistic constraints. The proposed framework enables near-real-time inference on segmented single-bean images and supports objective, reproducible, and scalable fermentation assessment. These findings demonstrate that performance in cocoa fermentation grading is determined not only by model capacity, but also by imbalance-aware label-space design and evaluation protocols aligned with real-world cut-test conditions.
1. Introduction
Cocoa (Theobroma cacao L.) fermentation is the most critical post-harvest stage for defining the bean’s organoleptic quality and commercial value. During this complex biochemical process, the degradation of polyphenols and the synthesis of essential aroma precursors transform the bitter, astringent raw seeds into high-quality cocoa beans characterized by balanced flavor profiles and distinctive internal coloration [1,2]. Consequently, the precise characterization of fermentation degrees is not merely a technical requirement but a fundamental pillar for quality assurance, price determination, and global standardization across the cocoa supply chain.
Fermentation is commonly assessed using the cut test (ISO 2451) and, in Colombia, NTC 1252 [3,4]. This method relies on the visual inspection of the internal bean cross-section to assign fermentation categories based on color transitions—such as violet or slaty to brown—and to identify visible defects like mold or insect damage. However, despite its widespread adoption, the cut test presents significant limitations documented in the literature; it is inherently subjective and labor-intensive, as it relies on the visual perception of trained personnel, leading to inter-evaluator variability and inconsistent results [5]. Furthermore, the procedure is not fully quantitative and cannot be easily scaled to meet industrial throughput demands. While alternative approaches such as the Fermentation Index (FI) provide quantitative precision through spectrophotometric measurements, they require destructive sample preparation and specialized laboratory equipment, making them impractical for routine field applications [6].
Recent advances in computer vision and machine learning have emerged as robust alternatives to overcome the limitations of conventional cocoa bean quality assessment methods. The integration of deep computer vision systems (DCVS) with machine learning techniques has significantly improved the automated classification of agricultural products, enabling more accurate and consistent evaluation of cocoa beans by jointly exploiting color, texture, and morphological features extracted from RGB images; images that are often imperceptible to the human eye or difficult to quantify manually. In particular, state-of-the-art deep learning models have demonstrated superior performance in discriminating cocoa bean varieties and quality grades, while also enhancing model interpretability through visualization techniques such as Gradient-weighted Class Activation Mapping (Grad-CAM). These developments highlight the potential of deep learning-based approaches to provide objective, reproducible, and scalable quality assessment frameworks suitable for routine industrial and research-oriented quality control applications.
1.1. Background: Cocoa in Colombia and Traditional Fermentation Assessment Methods
Colombia ranks as the eleventh-largest cocoa producer worldwide and fifth in the Americas, with 80% of its 73,000-ton annual production (2024) classified as fine and flavor cocoa, distinguished by fruity, floral, and spicy sensory profiles [7]. Fermentation is a critical post-harvest stage where flavor and aroma precursors develop through biochemical reactions that induce physical changes (swelling, fissuring, color transitions) and reduce bitterness and astringency [8,9]. Fermentation quality is commonly assessed through chemical and physical analyses; chemical methods include spectrometric techniques that measure the degradation of phenolic compounds, particularly the condensation of anthocyanins, as well as the evaluation of the Fermentation Index (FI) based on absorbance ratios [10]. In Colombia, physical-visual assessment follows the Colombian Technical Standard NTC 1252 [4], which establishes qualitative and quantitative descriptors: well-fermented, incipiently fermented, violet, unfermented (slaty), moldy, and insect-damaged beans. The evaluation involves a transverse cut-test in which the characteristics of the internal beans are visually examined, and the percentage of fermentation is calculated as the proportion of well-fermented beans per 100 samples assessed.
1.2. Technological Advances in Cocoa Fermentation Assessment
Recent technological advances in cocoa quality assessment can be organized into three main methodological streams: (i) conventional RGB computer vision with handcrafted descriptors, (ii) deep-learning computer vision [11], especially convolutional neural networks (CNNs), and (iii) spectral or hyperspectral imaging approaches [12,13]. This progression reflects a broader transition in post-harvest cocoa research from manual, subjective inspection toward automated and more reproducible systems. A recent review of machine-learning applications in cacao post-harvest management likewise shows that ANN, CNN, and SVM-based methods dominate the literature, with fermentation assessment emerging as one of the key application areas for AI-based quality control.
The first stream includes RGB image analysis with engineered color and texture descriptors, which demonstrated that cut-test evaluation can be partially automated without specialized spectral instrumentation. A representative study by Oliveira et al. [13] classified 1800 cocoa beans into four fermentation grades using image-derived handcrafted features and random decision forests. Their method achieved 0.93 accuracy on an unbalanced dataset and, when tested on a balanced subset, reached 0.92 accuracy, 0.92 precision, and 0.90 recall. These results confirmed the feasibility of computer vision for fermentation grading, but the approach still depended on manually designed descriptors and classical machine-learning models, which may be less flexible when visual variability increases across genotypes, environments, or acquisition conditions [13]. A second and more recent stream is based on deep computer vision systems using CNN backbones, which reduce the need for manual feature engineering and learn discriminative visual patterns directly from images. In this context, the work in [11] compared a traditional computer vision system (SVM and Random Forest) against a deep computer vision system based on ResNet18 and ResNet50 for cocoa-bean classification. Using a dataset of 1239 samples, they reported a best accuracy of 96.82% with ResNet18, outperforming the traditional pipeline. This study is important because it shows the superiority of CNN-based representations over handcrafted-feature approaches; however, its primary objective was cocoa variety classification, not direct fermentation-level grading, and it did not center the analysis on the severe class imbalance that is common in fermentation datasets [11,14].
A third line of work uses spectral and hyperspectral imaging, which provides richer physicochemical information than conventional RGB images. In [15], the authors evaluated fermentation level using non-invasive hyperspectral imaging in the 350–950 nm range and classified 90 dried cocoa beans into slightly fermented, correctly fermented, and highly fermented categories. Their results showed that fermentation level can be estimated from spectral signatures without destructive chemical analysis. Similarly, Ref. [12] analyzed cocoa-bean spectral measurements with machine-learning models and genetic algorithm parameter optimization, showing that spectral information can support robust bean classification, with logistic regression reaching precision values above 83% in their optimized settings. Although these spectral approaches are highly promising, they generally depend on specialized instrumentation and controlled optical conditions, which may limit scalability and low-cost deployment in routine quality control.
Taken together, prior studies establish that cocoa classification can be addressed successfully with both RGB-based computer vision and spectral sensing, but they also reveal important limitations. First, many fermentation-oriented studies are based on relatively small datasets or controlled laboratory acquisitions, which may restrict generalization. Second, although some previous work has compared balanced and unbalanced settings, class imbalance has rarely been treated as a central experimental factor, even though real cocoa fermentation datasets are typically dominated by the fermented class. Third, prior CNN-based studies generally evaluate one or two architectures, rather than systematically comparing lightweight and large-capacity models under the same preprocessing and training protocol. To synthesize this systematic analysis and clarify the methodological differences among previous approaches, representative cocoa bean classification studies are summarized later in Section 4 (Discussion), including differences in imaging modality, classification task, dataset characteristics, best-performing model, and reported performance metrics. In addition, although recent imbalance-aware Graph Neural Network (GNN) approaches have been predominantly developed in the context of fraud detection, they provide valuable insight into how relational modeling can explicitly address data imbalance through graph construction, targeted subgraph sampling, and selective downsampling of majority nodes. Given that these studies fall outside the cocoa fermentation domain, they are not included in the comparative table; however, their strategies are highly relevant for understanding how machine-learning models can mitigate class imbalance in scenarios characterized by limited and skewed datasets [16].
Based on the background and literature reviewed above, the following paragraphs identify the research gap addressed in this work and summarize its scope, objectives, and main contributions.
Despite these advances, an important research gap remains in cocoa fermentation assessment. Existing studies have shown that cocoa-bean classification can be addressed using RGB-based computer vision, CNN-based approaches, and spectral or hyperspectral sensing; however, limited attention has been given to how modern deep learning architectures behave under realistic cut-test conditions, where severe class imbalance is intrinsic to the data and can substantially affect the recognition of minority fermentation categories. In addition, the combined influence of input color representation and label-space formulation has not been systematically examined in this application domain. In this context, the present study does not aim to introduce a novel architecture, but rather to provide a rigorous experimental framework for cocoa fermentation grading by evaluating representative modern CNN and transformer-based models, analyzing the effect of class imbalance and RGB versus HSV representations, and assessing a hierarchical binary-to-multiclass strategy.
In this work, we investigate the application of deep learning models for cocoa bean (Theobroma cacao L.) classification in Colombia using cut-test images, benchmarking representative convolutional and transformer-based architectures (ConvNeXt, EfficientNet, MobileNetV3, and ViT) for cocoa fermentation classification. We evaluate model accuracy and deployment trade-offs under realistic constraints, and we quantify the impact of class imbalance, color representation, training budget, and hierarchical label-space design.
The findings of this study demonstrate the significant potential of deep learning and computer vision techniques for automated cocoa fermentation assessment. The proposed approach provides a rapid, objective, and reproducible alternative to conventional manual inspection methods, reducing subjectivity and inter-evaluator variability, and supporting scalable implementation in quality-control workflows.
2. Materials and Methods
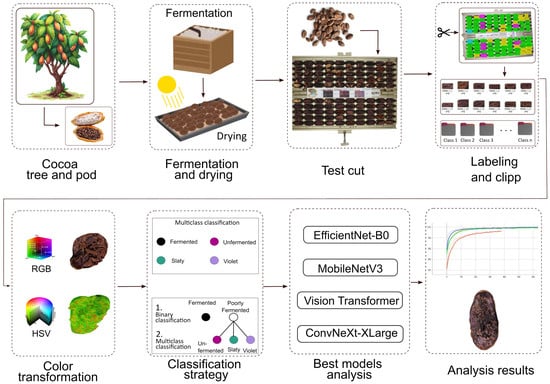
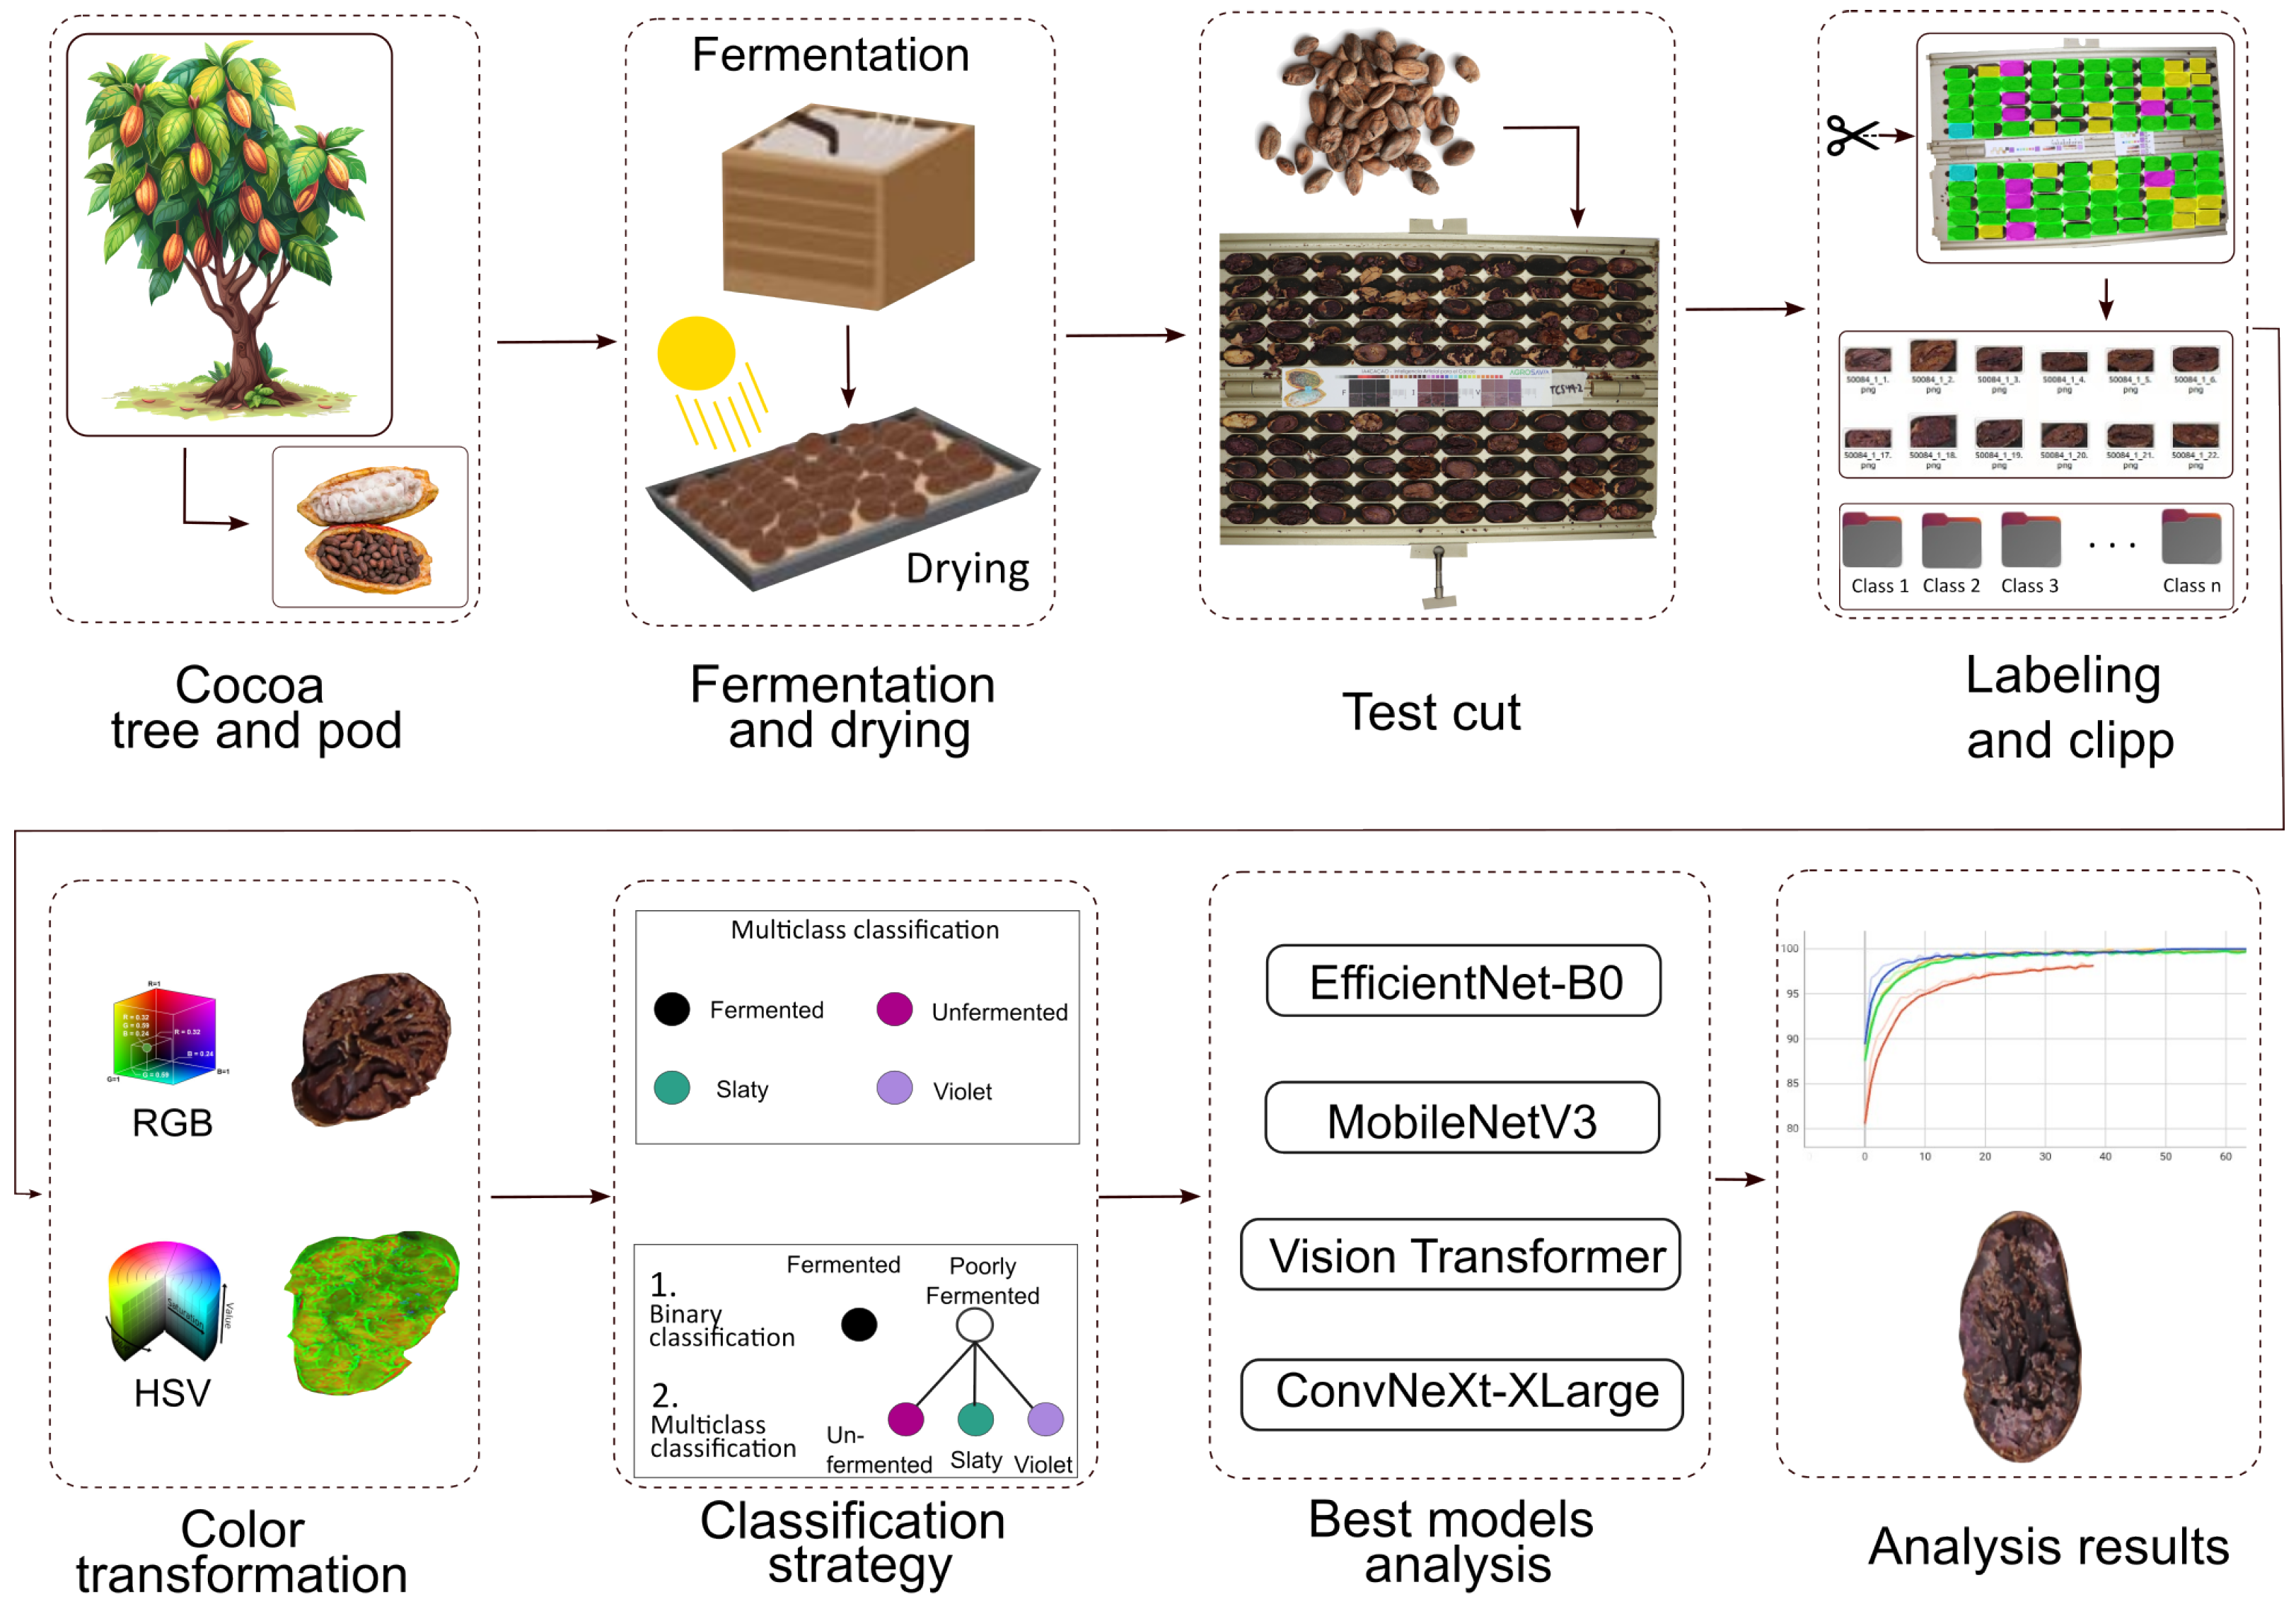
The proposed methodology follows an eight-stage pipeline (Figure 1) applied after fermentation and drying, covering sampling and cut testing, controlled image acquisition, expert annotation, dataset construction, and model training and inference. A random sample of beans was subjected to the cut test, and a computer vision pipeline was then used to automatically predict the fermentation level from the resulting cut-test images using deep learning models.
Figure 1.
Schematic workflow of the proposed cocoa fermentation classification system. The pipeline comprises eight sequential stages: Cocoa tree and pod selection; post-harvest fermentation and drying; the physical test cut to reveal internal bean coloration; labeling and clipping to generate the image dataset; generation of input variations using different color spaces (RGB and HSV) and class hierarchies; evaluation of diverse AI models (e.g., ConvNeXt, ViT); best model analysis for performance benchmarking; and final analysis results classifying beans as fermented or unfermented.
In the conventional physical and visual method, the quality of fermentation is assessed by an expert through visual inspection of the cut beans (see Section 1.1). In contrast, the proposed method begins with the acquisition of digital images of cocoa beans cut with a guillotine. The acquired images were annotated by domain experts using the Computer Vision Annotation Tool (CVAT) web platform (version 2.3), an interactive platform for labeling images and videos in computer vision applications. The resulting XML annotation files contain image identifiers, class labels, and spatial coordinates for each individual bean. Based on this information, custom Python scripts were developed to extract individual beans from the images and organize them into class-specific directories, thereby constructing the final dataset (see Section 2.1).
To assess the influence of color representation on model performance, the data set was processed in both RGB and HSV color spaces. Deep learning models were evaluated using two classification strategies: (i) multiclass classification, comprising four classes: fermented, under-fermented (insufficiently fermented), violet and slaty (slate), following NTC 1252 descriptors, and (ii) binary classification, in which beans were categorized as fermented or poorly fermented, with the latter grouping insufficiently fermented, violet and slaty. The binary classification strategy was implemented as a preliminary stage, followed by multiclass classification of the samples identified as unfermented. This hierarchical strategy was motivated by the severe class imbalance, with the fermented class representing 79.48% of the dataset, which can bias direct four-class training and distort macro-averaged performance.
Finally, a comparative performance analysis was conducted to identify the most suitable model to accurately discriminate between the levels of cocoa bean fermentation.
2.1. Sample Cocoa Bean Collection and Dataset
The research was carried out at La Suiza Research Center—AGROSAVIA (Corporación Colombiana de Investigación Agropecuaria), located in Rionegro, Santander. In the analytical chemistry laboratory, images were captured of fermented and dried cocoa beans belonging to different genotypes and genotype mixtures from commercial samples and some research trials, in order to obtain heterogeneous samples and real processes to obtain a greater volume of information. To capture the images, the cocoa beans were cut crosswise in accordance with NTC 1252, 2021, using a Magra No. 14 guillotine (Teserba GmbH, Rüti, Switzerland) to cut 50 beans. The guillotine is then opened and placed in a photography cubicle where the RGB image is acquired with a Canon EOS Rebel T7i DSLR camera (Canon Inc., Tokyo, Japan), equipped with a EF-S 18–135 mm IS STM lens. Following this process, a physical-visual inspection is carried out by an expert who, using the CVAT labeling tool, labels each cross-section of the grain. Thus, the original acquisition unit corresponds to tray-level cut-test images captured under controlled conditions.
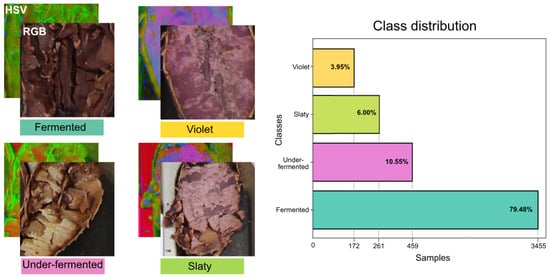
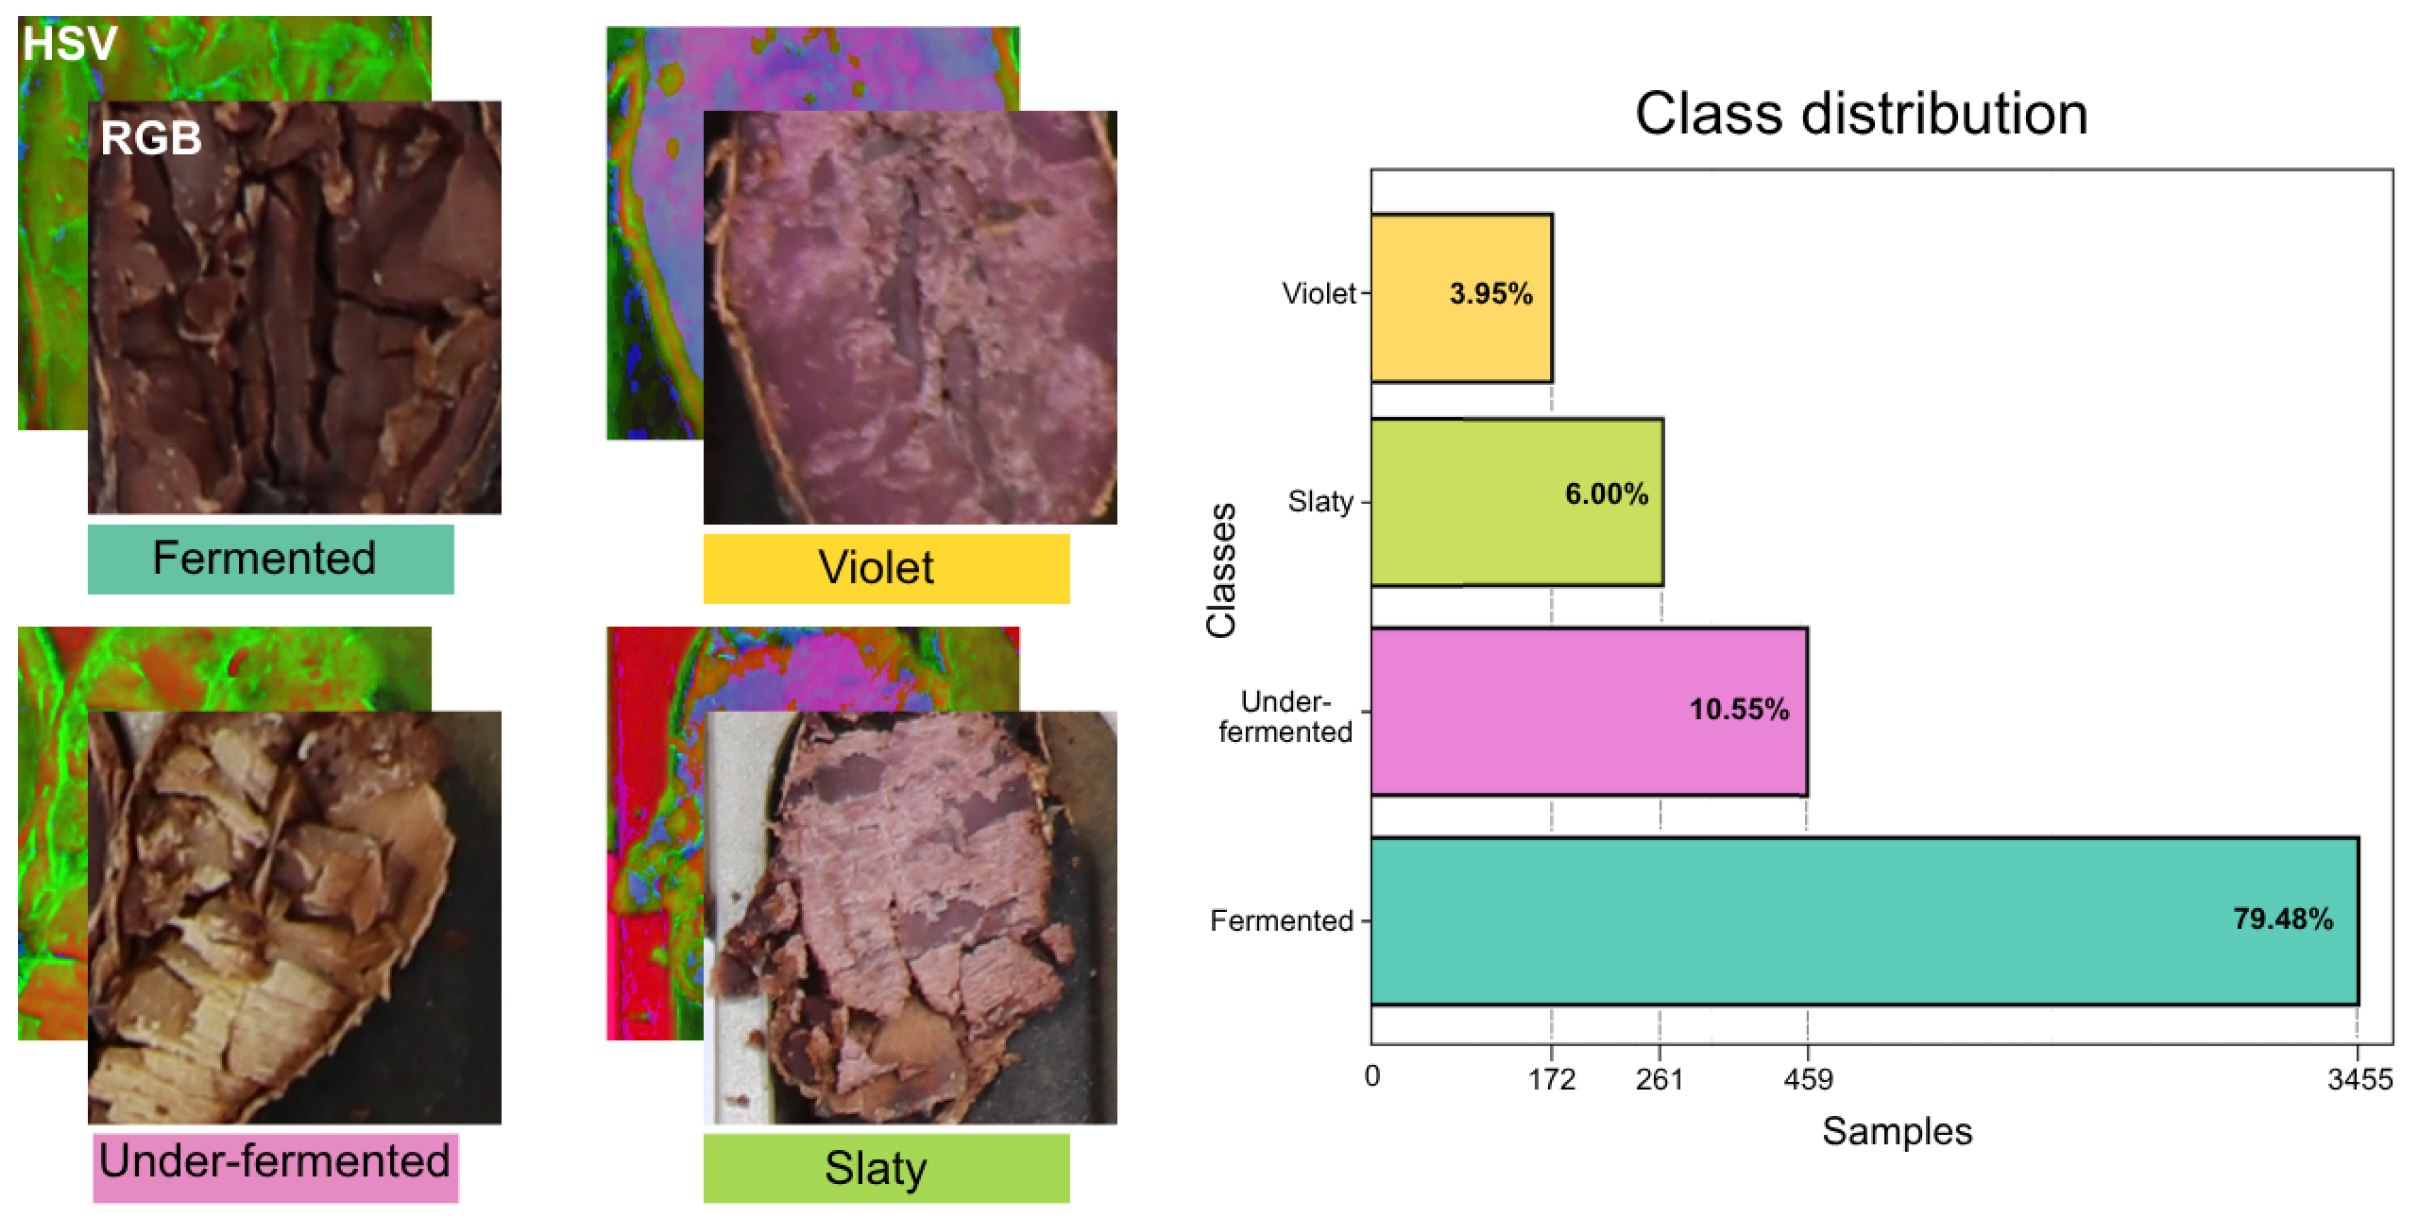
To train different models, a database was created with RGB and HSV images. It contains 4347 segmented cocoa bean images across four classes: fermented (n = 3455; ), under-fermented (n = 459; ), slaty (n = 261; ), and violet (n = 172; ). As shown in Figure 2, the distribution is strongly imbalanced, which motivates the use of macro-averaged metrics and imbalance-aware evaluation. Although images were acquired in RGB, we also evaluated HSV (Hue, Saturation, Value) as a potential way to decouple chromatic components (hue/saturation) from intensity (value) while preserving fermentation-related color cues that are central to cut-test grading.
Figure 2.
Visual representation of cocoa bean classes and data distribution. The left panels display representative samples for the four categories (Fermented, Under-fermented, Slaty, and Violet), illustrating the contrast between the HSV (top-left diagonal) and RGB (bottom-right diagonal) color spaces. The right panel presents the class distribution bar chart, number of samples per category plotted on a logarithmic scale to visualize the imbalance.
To obtain a more robust estimate of model performance, all experiments were conducted using stratified K-fold cross-validation. The full labelled collection, organized in ImageFolder format with one sub-directory per class, was partitioned into five folds using scikit-learn’s StratifiedKFold. This strategy preserved approximately the same class proportions in the training and validation subsets of each fold, which was particularly important given the strong class imbalance observed in the dataset. Fold generation was performed with shuffle = True and a fixed random_state tied to the seed hyperparameter, ensuring reproducible fold assignments across runs.
For each fold , the model was trained using the samples assigned to the training subset and evaluated on the corresponding disjoint validation subset. The reported metrics correspond to the cross-validation performance aggregated across the five validation folds. For cross-validation, no additional on-the-fly data augmentation was applied within the folds. Instead, the folds were generated from the corresponding fixed dataset configuration used in each experiment. In the imbalanced configuration, images were used as originally available, without augmentation. In the balanced configuration, minority classes had been previously augmented using only geometric transformations until reaching the same number of samples as the majority fermented class. Validation samples in each fold were processed only through deterministic resizing, cropping, and normalization steps defined by the corresponding model ImageProcessor v. 2.9.0.
2.2. Deep Learning Models for Fermentation Estimation in Cocoa
In this section, we focus on the analysis and training of deep learning models for the classification of fermented cocoa beans (cut-test images) in Colombia. During the exploratory phase, a broader set of pretrained backbones was evaluated, including ResNet-18, ResNet-18 with dropout, DenseNet-121, VGG-16, VGG-19, Swin-Large, EVA-Giant, MaxViT-XLarge, and additional size variants of ViT and ConvNeXt. From this initial pool, five architectures were retained for the final benchmark—EfficientNet-B0, MobileNetV3-Large, ConvNeXt-XLarge, ViT-Base, and ViT-Large—because they jointly cover the most informative axes of comparison for this task: convolutional versus transformer inductive biases, lightweight versus high-capacity regimes, and a balanced trade-off between accuracy and computational cost. The remaining architectures were discarded either because they were dominated in performance by the retained models within the same family, or because their computational footprint was disproportionate to the marginal accuracy gain observed on this dataset.
All five retained architectures were fine-tuned end-to-end from pretrained ImageNet weights; none were used as fixed feature extractors and no backbone layers were frozen. For each model, the original classification head was replaced by a new layer adapted to the target number of fermentation classes, and both the pretrained backbone and the newly initialized head were jointly optimized using AdamW, implemented in the PyTorch 2.10.0 software framework, with weight-decay regularization applied selectively to non-bias and non-normalization parameters. The architectural characteristics of each retained backbone are described in the following subsections.
The evaluated models represent state-of-the-art image classification architectures spanning convolutional neural networks (CNNs) and transformer-based vision models, each characterized by distinct design principles, computational requirements, and representational capabilities.
2.2.1. EfficientNet-B0
EfficientNet is a convolutional neural network based on a compound scaling strategy that jointly optimizes network depth, width, and input resolution. This architecture achieves a favorable balance between accuracy and computational efficiency, making it particularly suitable for resource-constrained environments. Its lightweight design enables robust feature extraction with relatively low parameter counts and FLOPs, which is advantageous for agricultural computer vision applications requiring scalability and deployment on edge devices [17].
2.2.2. MobileNetV3-Large
MobileNet is explicitly optimized for mobile and embedded systems. It incorporates depthwise separable convolutions, squeeze-and-excitation (SE) blocks, and neural architecture search (NAS)-driven design choices. While its representational capacity is lower than that of larger CNNs or transformer-based models, MobileNetV3-Large offers low latency and reduced memory footprint, making it appropriate for real-time inference scenarios, albeit with potential trade-offs in classification accuracy for visually complex classes [18].
2.2.3. Vision Transformer (ViT)
ViT-Base and ViT-Large models depart from convolutional inductive biases by representing images as sequences of fixed-size patches processed through self-attention mechanisms. ViT-Base provides a moderate parameterization, whereas ViT-Large significantly increases model depth and width, enabling the learning of more expressive global representations. These models excel in capturing long-range dependencies and global contextual information, which can be beneficial for distinguishing subtle visual patterns in cocoa bean fermentation stages. However, their performance is highly dependent on large-scale training data and substantial computational resources, and they typically exhibit higher inference costs compared to CNN-based architectures [19].
2.2.4. ConvNeXt-XLarge
ConvNeXt represents a modernized convolutional architecture that integrates design elements inspired by vision transformers, such as large kernel sizes, inverted bottlenecks, and simplified normalization schemes while preserving the hierarchical feature extraction of CNNs. ConvNeXt-XLarge offers competitive performance with transformer-based models while maintaining convolutional efficiency, making it well suited for high-accuracy classification tasks in structured visual domains. Nevertheless, its large parameter count implies increased training time and hardware requirements [20].
2.2.5. Summary of Architectural Trade-Offs
In summary, EfficientNet-B0 and MobileNetV3-Large prioritize computational efficiency and deployment feasibility, whereas ViT-Large and ConvNeXt-XLarge emphasize representational power and classification accuracy at the expense of higher computational cost. ViT-Base offers a compromise between these extremes.
Specifically, in agricultural computer vision contexts, model selection involves balancing classification accuracy, robustness to environmental variability, data availability, and deployment constraints. EfficientNet-B0 and MobileNetV3-Large are well suited for scalable and resource-limited agricultural systems, whereas ViT-Large and ConvNeXt-XLarge provide superior representational power for complex visual discrimination tasks when sufficient computational resources and training data are available. ViT-Base offers an intermediate solution.
The selection of the optimal model thus depends on the specific trade-offs between accuracy, computational complexity, dataset size, and deployment constraints inherent to the cocoa bean fermentation classification task, which will be analyzed in Section 3.
2.2.6. Evaluation Metrics
The performance of the models was quantitatively evaluated using a confusion matrix, from which standard performance metrics were derived. Let , , , and denote the number of true positives, true negatives, false positives, and false negatives, respectively. We report accuracy and macro-averaged precision, recall, and F1-score. Macro-F1 is computed as the unweighted mean of class-wise F1 values so that minority classes contribute equally under severe imbalance, providing a more informative assessment than accuracy alone. Accuracy measures the overall proportion of correctly classified instances and is defined as:
Precision quantifies the proportion of correctly predicted positive instances among all predicted positives, reflecting the model’s reliability in identifying relevant objects:
Recall, also referred to as sensitivity, measures the model’s ability to correctly identify all actual positive instances:
Finally, the F1-score corresponds to the harmonic mean of precision and recall, providing a balanced evaluation metric that is particularly suitable for imbalanced datasets:
3. Results
This section details the results of several experiments. We evaluated five pretrained backbones spanning CNNs and vision transformers (EfficientNet-B0, MobileNetV3-Large, ConvNeXt-XLarge, ViT-Base, and ViT-Large). The models were trained on a workstation equipped with an NVIDIA RTX 4500 GPU, 128 GB of RAM and 24 GB of VRAM. All experiments were implemented in Python within a standard managed environment. Finally, experiment tracking and performance visualization were conducted using the Weights & Biases (WandB) platform.
3.1. Data Collection and Preprocessing
As described in the cross-validation protocol in Section 2.1, all experiments were evaluated using stratified five-fold cross-validation to preserve minority-class prevalence and reduce sensitivity to a single train–validation partition.
Two distinct input representations were generated for model training and evaluation: RGB images and HSV color space images. This dual-input strategy was designed to analyze the robustness and stability of the evaluated architectures with respect to color space variations, particularly given the relevance of color features in assessing cocoa bean fermentation. Images were acquired from the cutting tray containing 100 cut cocoa beans; each bean was individually cropped and stored in the corresponding folder for labeling. The pipeline ensured that images were handled in RGB; in the HSV experiments, RGB images were converted to HSV. For each architecture, images were resized and cropped to the spatial resolution defined by the model’s ImageProcessor (224 × 224 in our experiments). Pixel values were normalized using the mean and standard deviation from that processor; we did not apply explicit brightness or contrast enhancement, and this normalization was applied uniformly to all samples, independently of class label. Models were trained for up to 100 epochs with a batch size of 32 using AdamW. Data augmentation depended on the dataset configuration evaluated in each experiment. For experiments using the original imbalanced dataset, no data augmentation was applied; images were used as originally available after cropping, resizing, and normalization. For experiments using the balanced dataset, only the minority classes were augmented until each class reached the same number of samples as the majority fermented class. This balancing process used only geometric transformations, namely random resized cropping, horizontal flipping with probability 0.5, vertical flipping with probability 0.2, random rotation within ±15°, random translation of up to 10% of the image dimensions along both axes, and random perspective distortion with distortion scale 0.2 applied with probability 0.5. No brightness, contrast, color, histogram, MixUp, CutMix, SMOTE, or other synthetic feature-space augmentation was used. During stratified cross-validation, no additional on-the-fly augmentation was applied within the folds; the folds were generated from the corresponding fixed imbalanced or previously balanced dataset configuration.
The fine-tuning configuration was kept consistent across all architectures and folds. Optimization was performed with AdamW using grouped weight decay, with a coefficient of 0.01 applied to non-bias parameters and 0 applied to biases and normalization-layer weights. The initial learning rate was set to for ConvNeXt-XLarge, ViT-Base, ViT-Large, and EfficientNet-B0, and to for MobileNetV3-Large, following a cosine decay schedule over the full training horizon and without linear warmup. All pretrained backbones were fine-tuned end-to-end with no layers frozen, and the classification head was adapted to the four-class fermentation label space. For each fold, the weights selected for evaluation and reporting corresponded to the checkpoint that achieved the lowest average validation loss on the corresponding validation partition. Validation loss was computed as the standard multiclass cross-entropy (softmax negative log-likelihood) between the model predictions and the integer class labels, averaged over validation mini-batches. Randomness was controlled by fixing a global random seed and by setting the random-state of the stratified cross-validation splitter, ensuring full reproducibility of both data partitions and training trajectories.
To evaluate the performance of the different models, we carried out four controlled experiments: (i) assessing the effect of progressively reducing the size of the predominant fermented class while keeping the minority classes unchanged, in order to quantify the influence of class-ratio configuration on macro-F1 performance; (ii) ablation of the input color space, contrasting RGB and HSV representations; (iii) training sensitivity across epochs using the RGB dataset, based on the results of the color-space ablation experiment; and (iv) formulation of the label space, comparing a hierarchical binary-to-multiclass strategy with a direct four-class configuration, motivated by the predominance of the fermented class in the dataset.
3.2. Experiment 1: Comparative Analysis by Dataset Size
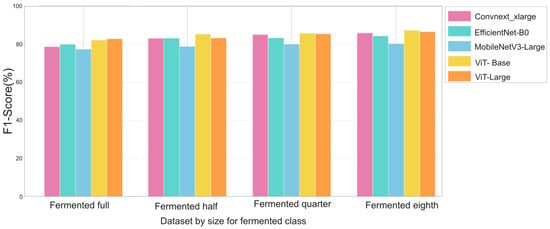
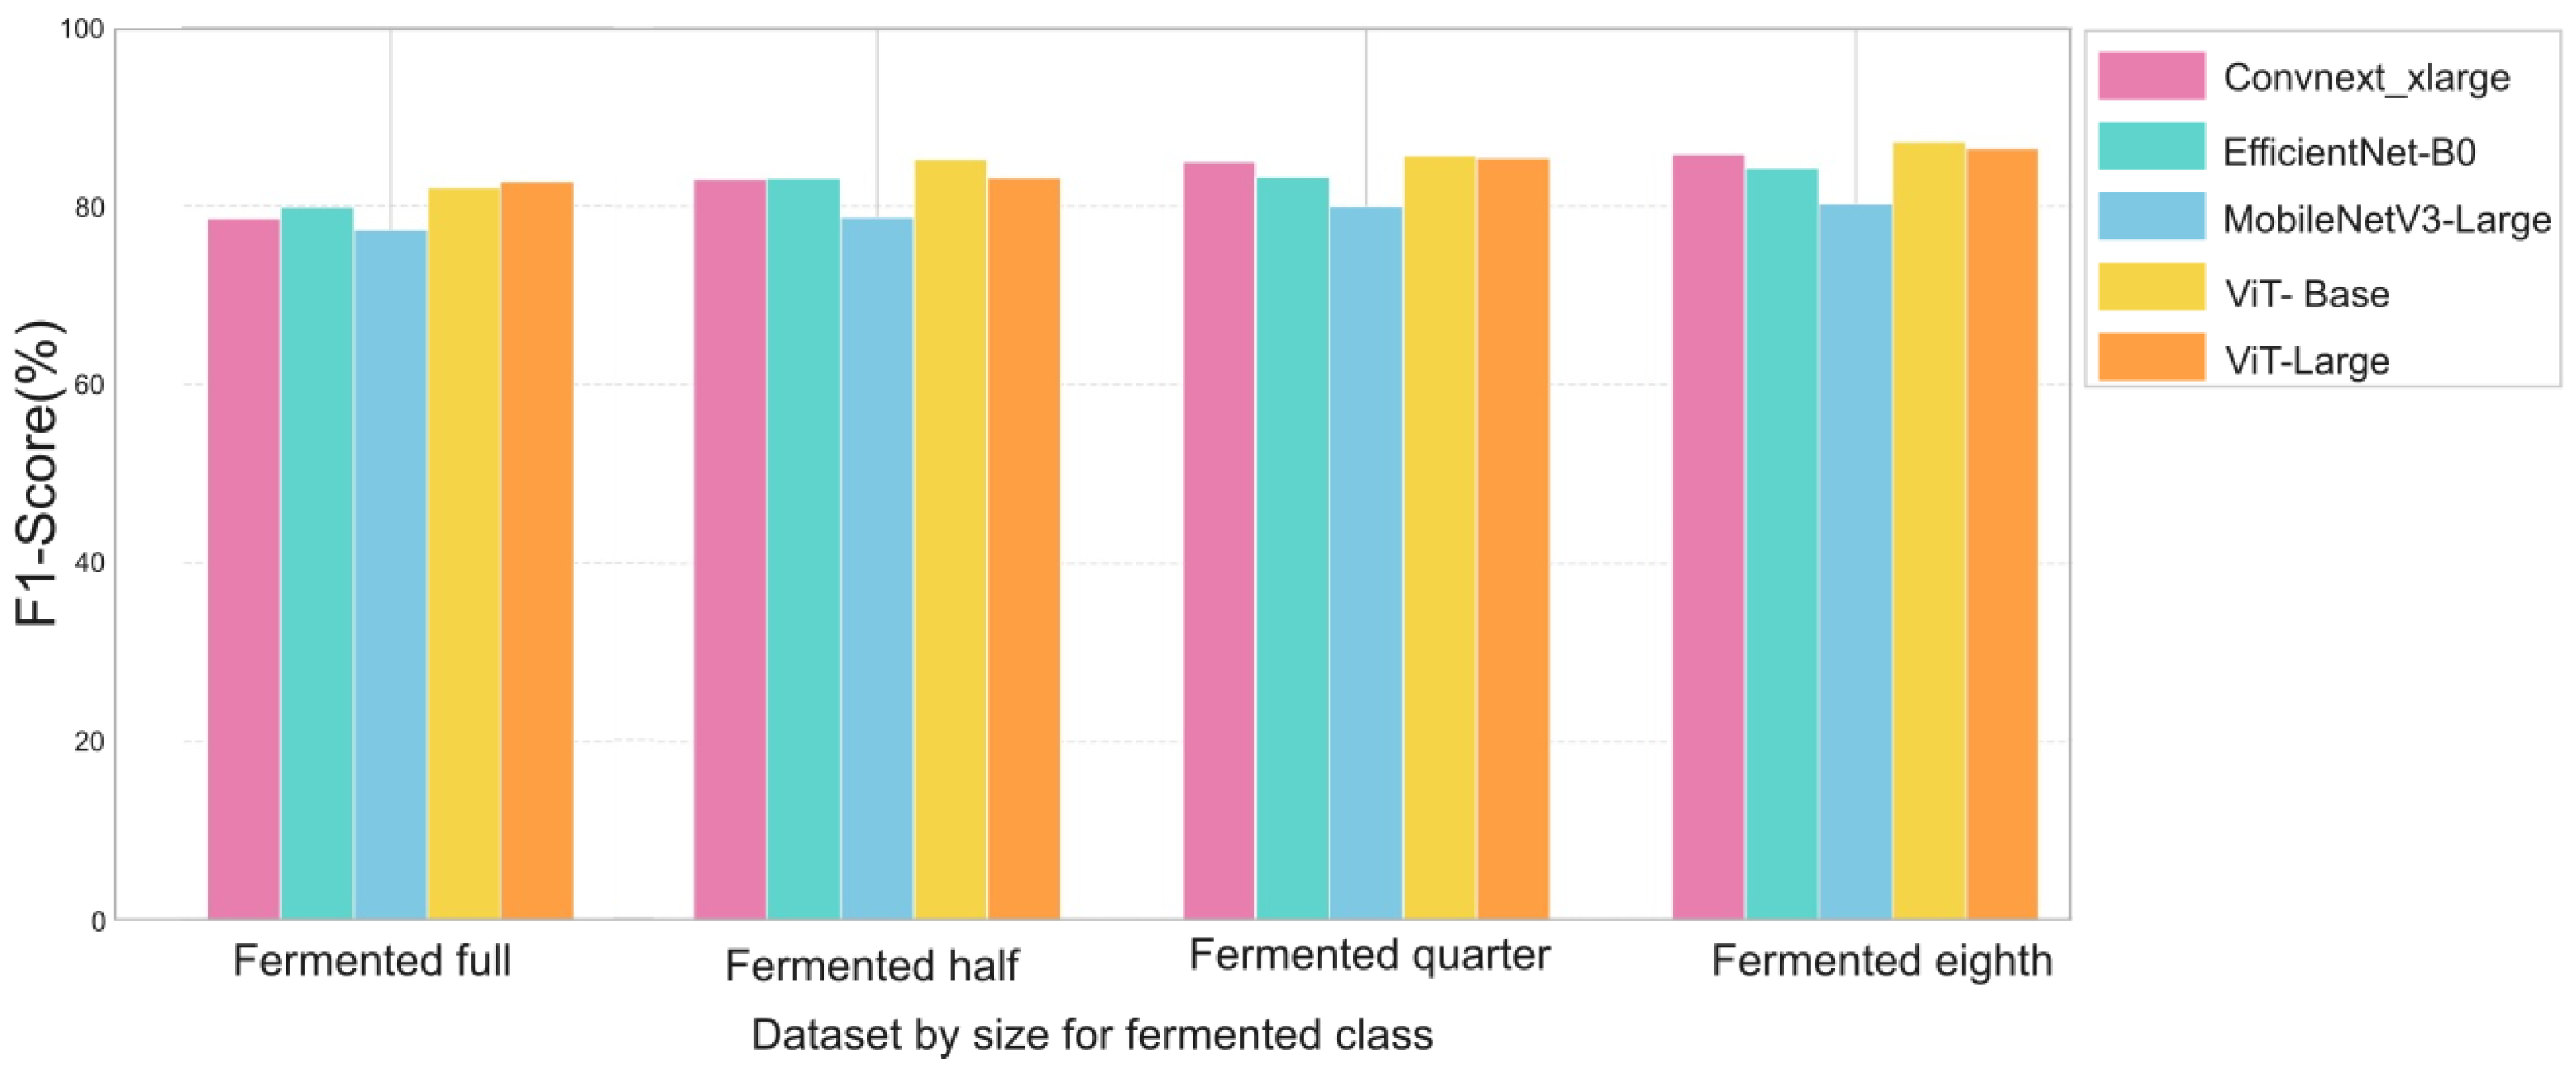
In this experiment, we assessed the effect of modifying the size of the predominant fermented class on the macro F1-score of the evaluated architectures. Since the original dataset was strongly dominated by the fermented category (n = 3455), four configurations were generated by retaining the full fermented subset or progressively sampling one half, one quarter, and one eighth of this class. The corresponding fermented-class sizes were 3455, 1727, 863, and 431 samples, respectively. The minority classes were kept unchanged across these configurations, and no data augmentation was applied in this experiment. This design was intended to isolate the effect of progressively reducing the prevalence of the majority fermented class on macro-F1 performance. The results for ConvNeXt-XLarge, EfficientNet-B0, MobileNetV3-Large, ViT-Base, and ViT-Large are summarized in Figure 3.
Figure 3.
F1-score comparison of deep learning models for cocoa fermentation-level classification using RGB images under different dataset-size configurations of the fermented class. The evaluated configurations correspond to the full fermented class, half of the fermented class, one quarter of the fermented class, and one eighth of the fermented class. Bars report the macro F1-score (%) for ConvNeXt-XLarge, EfficientNet-B0, MobileNetV3-Large, ViT-Base, and ViT-Large.
In the full fermented-class configuration, the evaluated models achieved macro F1-scores ranging from approximately 77% to 83%. MobileNetV3-Large showed the lowest performance, close to 77%, whereas ViT-Large and ViT-Base obtained the highest values, approximately 83% and 82%, respectively. EfficientNet-B0 and ConvNeXt-XLarge showed intermediate performance, with F1-scores close to 80% and 79%. These results indicate that, under the original class distribution, all architectures were affected to some extent by the predominance of the fermented class, although the impact varied according to model capacity and architectural design.
When the fermented class was reduced to one half of its original size, most architectures showed improved macro F1-scores. ConvNeXt-XLarge and EfficientNet-B0 reached approximately 83%, while ViT-Base achieved the best performance in this configuration, close to 85%. ViT-Large remained competitive, with an F1-score of approximately 83%, whereas MobileNetV3-Large exhibited a smaller gain, reaching approximately 79%. This suggests that a moderate adjustment of the class ratio can already reduce the bias toward the majority class and improve balanced recognition across fermentation categories.
The highest F1-scores were generally observed in the quarter and eighth configurations. In the quarter setting, ConvNeXt-XLarge, ViT-Base, and ViT-Large reached values close to or above 85%, while EfficientNet-B0 and MobileNetV3-Large obtained approximately 83% and 80%, respectively. The eighth configuration yielded the best overall results: ViT-Base achieved the highest macro F1-score, approximately 87%, followed by ViT-Large and ConvNeXt-XLarge, both close to 86%. EfficientNet-B0 also improved to approximately 84%, whereas MobileNetV3-Large remained the lowest-performing model, with an F1-score close to 80%.
Overall, the results demonstrate that macro F1-score was strongly conditioned by the class-ratio configuration. The original predominance of the fermented class limited balanced recognition of minority fermentation categories, whereas less skewed configurations improved model sensitivity across classes. This effect was architecture-dependent: ViT-Base achieved the highest and most stable performance, particularly in the fermented-eighth setting, followed closely by ViT-Large and ConvNeXt-XLarge. By contrast, MobileNetV3-Large showed only limited gains, suggesting that lightweight models may be less effective for fine-grained fermentation-level discrimination. These findings highlight the importance of class-imbalance mitigation and identify the fermented-eighth configuration as the most favorable setting among those evaluated.
3.3. Experiment 2: Ablation of the Input Color Space, Contrasting RGB and HSV Representations
To assess the effect of input color representation on cocoa fermentation-level classification, we compared RGB and HSV inputs while keeping the training protocol, model architectures, hyperparameters, and stratified five-fold cross-validation scheme unchanged. For each backbone, performance was reported as the average F1-score across the validation folds under two dataset conditions: the original imbalanced class distribution, for which no data augmentation was applied, and a balanced configuration, in which the minority classes were previously augmented using only geometric transformations until reaching the same number of samples as the majority fermented class. This design allowed us to isolate the contribution of the color space from the effect of class imbalance.
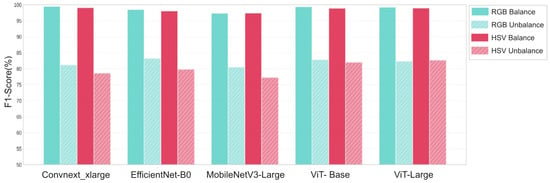
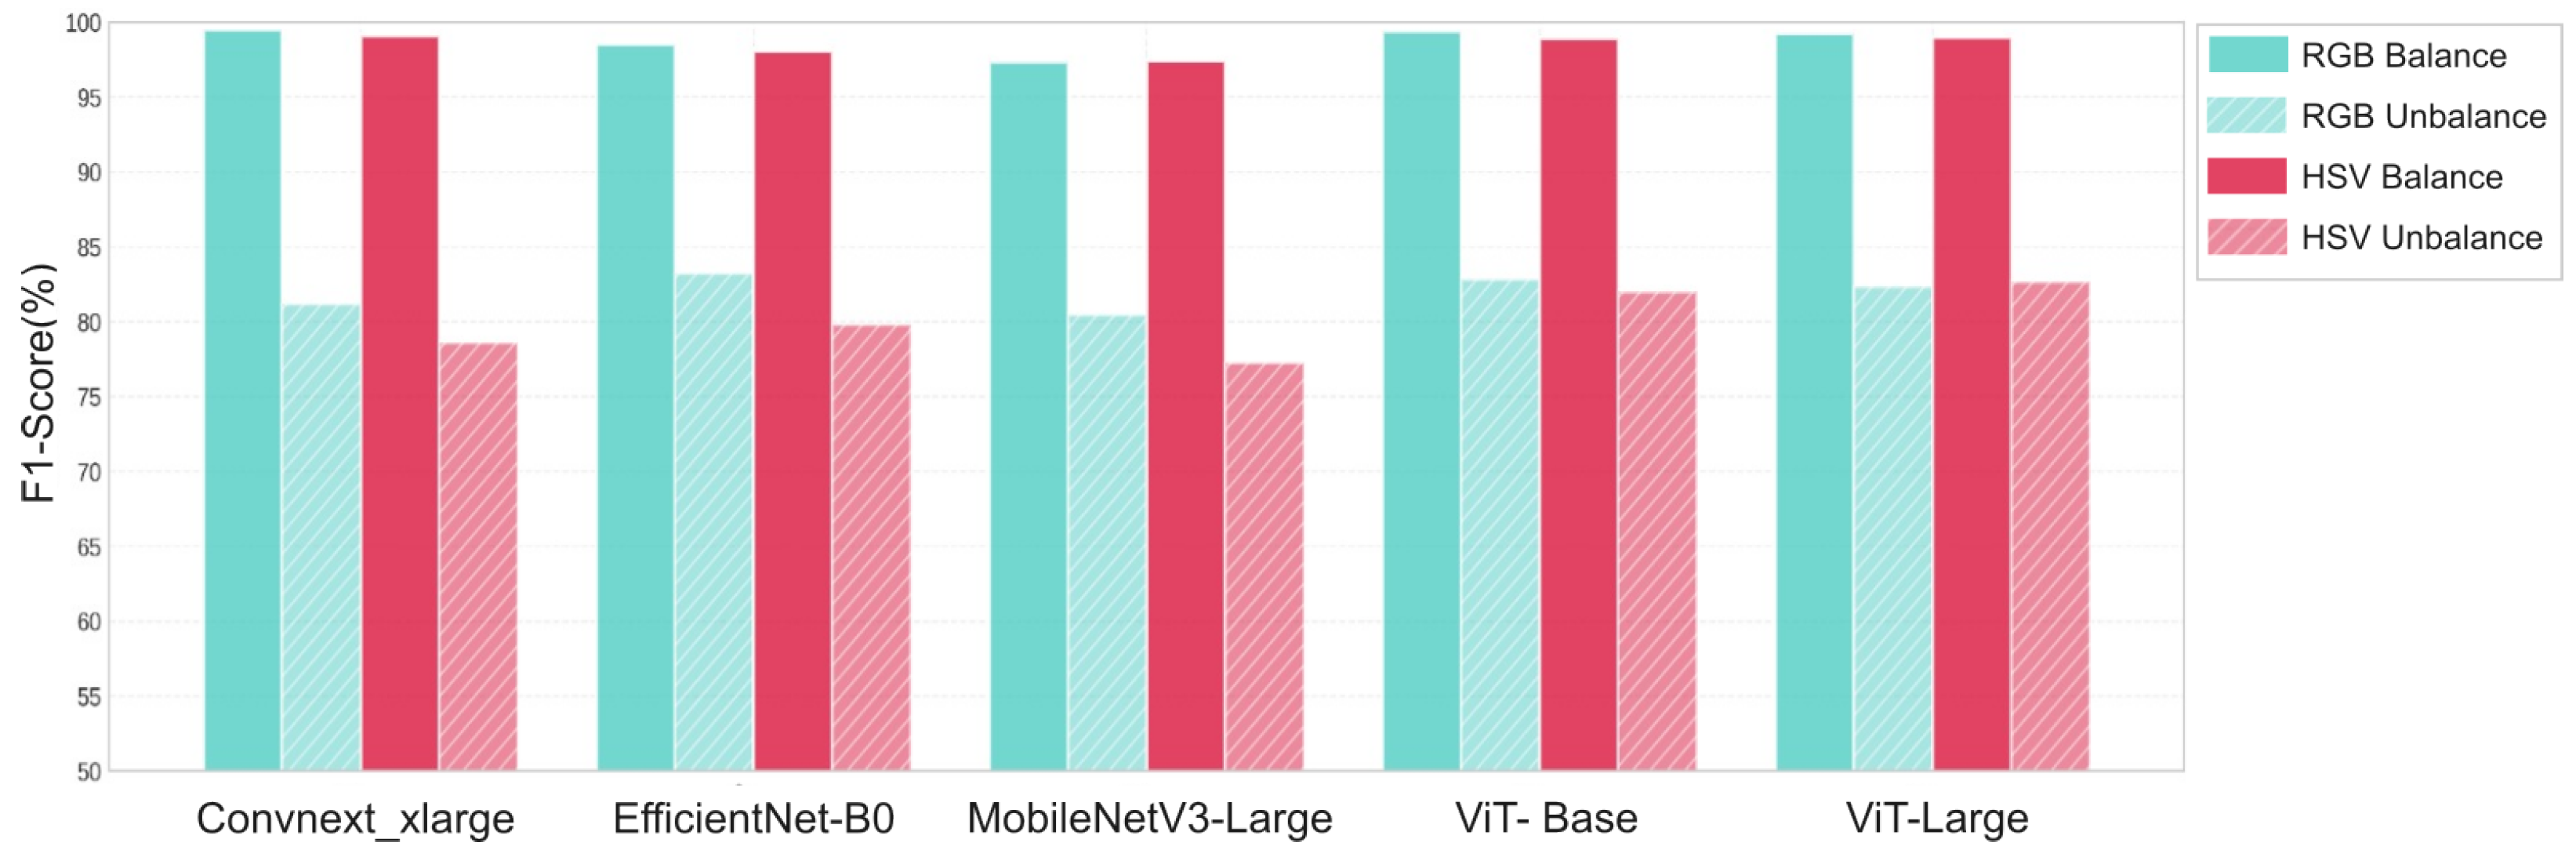
Figure 4 shows that class balancing had a substantially larger effect on F1-score than the choice between RGB and HSV. Under the balanced configuration, all architectures achieved very high F1-scores, generally close to or above 97%, independently of the color representation. In this setting, RGB produced slightly higher or comparable F1-scores than HSV for most models. ConvNeXt-XLarge reached approximately 99.4% with RGB and 99.0% with HSV, EfficientNet-B0 achieved approximately 98.4% with RGB and 97.8% with HSV, and MobileNetV3-Large obtained nearly equivalent performance in both color spaces, around 97.2%. Similarly, the transformer-based models remained close to ceiling performance, with ViT-Base reaching approximately 99.3% in RGB and 98.8% in HSV, and ViT-Large reaching approximately 99.1% in RGB and 98.8% in HSV.
Figure 4.
Cross-validation F1-score comparison for the input color-space ablation. RGB and HSV representations were evaluated across ConvNeXt-XLarge, EfficientNet-B0, MobileNetV3-Large, ViT-Base, and ViT-Large under balanced and imbalanced dataset configurations. Bars report the average F1-score (%) across validation folds.
In the imbalanced configuration, the F1-scores were markedly lower for all models, confirming the strong impact of the original class distribution on balanced recognition performance. In this scenario, RGB also tended to outperform HSV or remain very close to it. EfficientNet-B0 showed one of the clearest differences, with RGB reaching approximately 83.1%, compared with approximately 79.7% for HSV. ConvNeXt-XLarge followed a similar pattern, with approximately 81.2% for RGB and 78.5% for HSV, while MobileNetV3-Large reached approximately 80.5% with RGB and 77.2% with HSV. For the transformer-based models, the difference between color spaces was smaller: ViT-Base obtained approximately 82.8% with RGB and 82.0% with HSV, whereas ViT-Large showed comparable performance, with approximately 82.3% in RGB and 82.7% in HSV.
Overall, these results indicate that HSV did not provide a systematic advantage over RGB in the cross-validation evaluation. Instead, RGB was slightly more effective or comparable across most architectural backbones and dataset conditions. The main determinant of performance was class balancing, which enabled the models to approach near-ceiling performance under the balanced configuration. Therefore, for this dataset and acquisition protocol, RGB was selected as the input representation for the epoch-wise sensitivity analysis in Experiment 3, whereas HSV remains a viable alternative but does not substantially improve cross-validated F1-score.
3.4. Experiment 3: Training Sensitivity Across Epochs
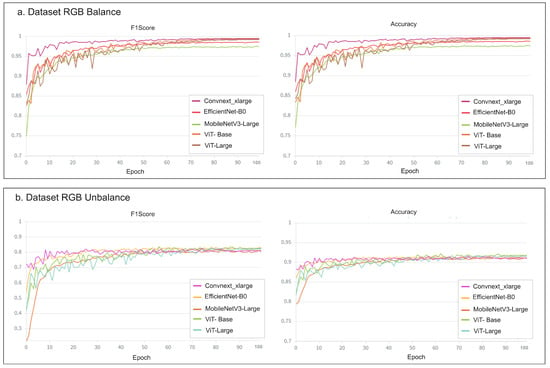
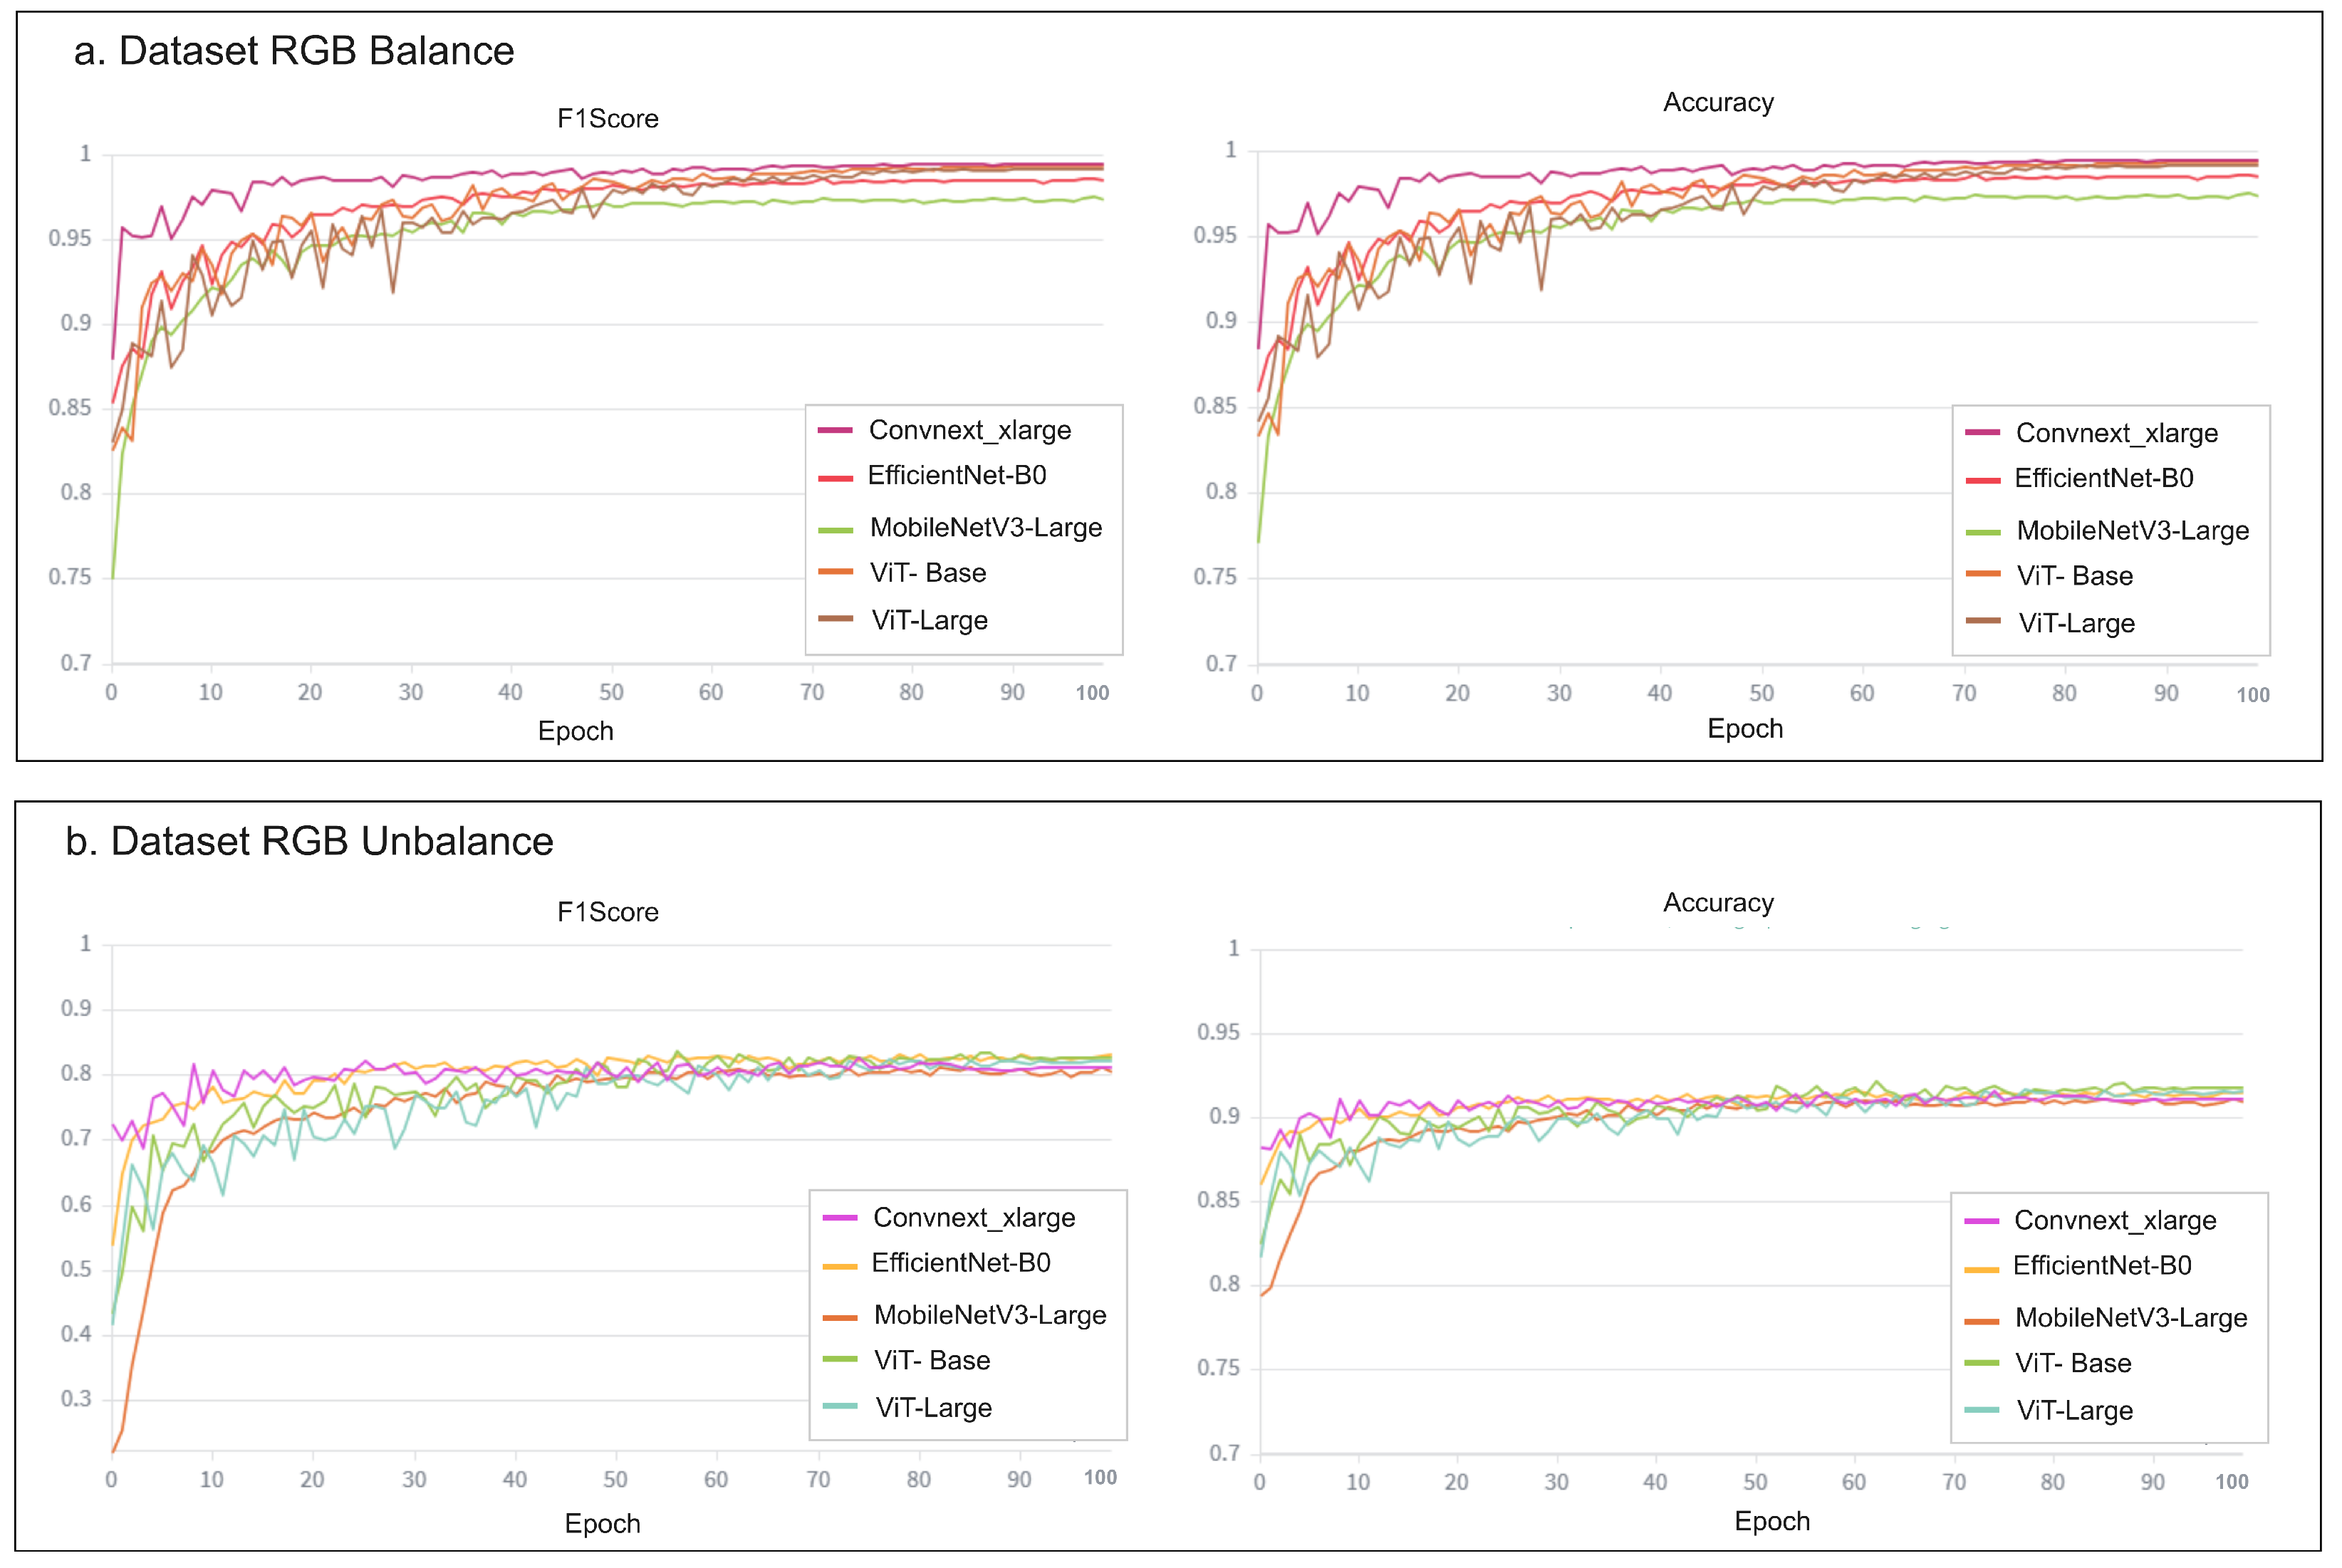
To evaluate the sensitivity of model performance to training duration, F1-score and accuracy were monitored over 100 training epochs using the RGB dataset. This configuration was selected based on the color-space ablation results reported in Section 3.3, where RGB achieved slightly higher or comparable cross-validated F1-scores than HSV for most architectures. Thus, the epoch-wise analysis focused on the effects of training duration and class distribution without introducing additional variability associated with color-space transformations. Figure 5 shows the learning curves for ConvNeXt-XLarge, EfficientNet-B0, MobileNetV3-Large, ViT-Base, and ViT-Large under balanced and unbalanced RGB configurations, averaged across the stratified cross-validation folds. Under the balanced RGB configuration, generated by geometrically augmenting minority classes to match the number of samples in the fermented class, all architectures showed rapid convergence during the first training epochs. Accuracy and macro F1-score increased sharply within the first 10–20 epochs, indicating that RGB images contained sufficient discriminatory information to distinguish cocoa bean fermentation levels under controlled acquisition conditions. ConvNeXt-XLarge and the ViT-based models exhibited the most stable trajectories and approached near-ceiling performance, whereas EfficientNet-B0 also showed competitive convergence with lower computational demand. MobileNetV3-Large was the fastest model but produced comparatively lower F1-score trajectories, suggesting that its reduced representational capacity may limit fine-grained discrimination among visually similar fermentation classes. After approximately 50–60 epochs, most models reached a stable performance plateau, and additional training up to 100 epochs produced only marginal gains.
Figure 5.
Epoch-wise sensitivity analysis of F1-score and accuracy over 100 training epochs using RGB images. Learning curves are shown for ConvNeXt-XLarge, EfficientNet-B0, MobileNetV3-Large, ViT-Base, and ViT-Large under balanced and unbalanced RGB dataset configurations. (a) The balanced setting enables rapid convergence and near-ceiling performance, whereas (b) the unbalanced setting maintains lower F1-score values despite high accuracy, highlighting the effect of class imbalance on minority-class recognition.
In the unbalanced RGB configuration, where images were used without data augmentation, the learning curves showed a different behavior. Although accuracy remained relatively high, macro F1-score saturated at lower values, approximately in the 0.78–0.83 range. This discrepancy reflects the influence of the predominant fermented class and confirms that accuracy alone is not sufficient to evaluate model performance under severe class imbalance. More importantly, none of the architectures eliminated this performance gap after the full 100-epoch training horizon, indicating that the main limitation was not training duration but the reduced representation of minority classes such as under-fermented, violet, and slaty beans.
The computational cost associated with each architecture is summarized in Table 1, which reports cumulative wall-clock training time across the five cross-validation folds and the corresponding average time per fold. Under the unbalanced configuration, MobileNetV3-Large and EfficientNet-B0 were the most efficient models, requiring 2 h 19 min and 2 h 30 min across five folds, respectively. ViT-Base required 3 h 13 min, whereas ViT-Large and ConvNeXt-XLarge required substantially longer times, with 8 h 04 min and 9 h 33 min, respectively. Under the balanced configuration, training time increased for all models: MobileNetV3-Large required 6 h 05 min, EfficientNet-B0 6 h 56 min, ViT-Base 9 h 10 min, ViT-Large 24 h 44 min, and ConvNeXt-XLarge 29 h 15 min across the five folds. These results highlight a clear trade-off between predictive performance and computational cost. ConvNeXt-XLarge and ViT-Large provide high representational capacity but require the highest training times. ViT-Base offers a more favorable balance between performance and computational demand, while EfficientNet-B0 represents a competitive alternative for scenarios where computational efficiency is prioritized. MobileNetV3-Large remains attractive for low-resource applications due to its short training time, although its lower F1-score trajectories suggest limitations for distinguishing subtle visual differences among fermentation categories.
Table 1.
Trainable parameters and wall-clock training time per backbone, reported as cumulative time across the five stratified cross-validation folds and as mean time per fold, under both unbalanced and balanced configurations.
Overall, the 100-epoch sensitivity analysis demonstrates that, when class balancing is applied, the evaluated models reach stable performance with a moderate training budget. Extending training does not compensate for the negative effect of class imbalance; therefore, robust cocoa fermentation classification should prioritize imbalance-aware strategies rather than simply increasing the number of epochs. In this study, imbalance was analyzed through controlled class-ratio configurations and a hierarchical binary-to-multiclass strategy, while geometric augmentation was used only to construct the balanced dataset configuration. Other alternatives, such as class-weighted loss or focal loss, remain potential directions for future work.
While training dynamics are useful for understanding optimization behavior, performance on the held-out validation folds is the primary criterion for model comparison because it provides a more reliable estimate of generalization under the cross-validation protocol. The cross-validation F1-scores reported in Figure 3 and Figure 4 indicate that ViT-Base, ViT-Large, ConvNeXt-XLarge, and EfficientNet-B0 achieved competitive performance depending on the data configuration. Among them, ViT-Base showed the most consistent behavior across experimental settings and offered a favorable compromise between predictive performance and computational cost.
3.5. Experiment 4: Binary Strategy vs. Multiclass
Due to the strong class imbalance in the dataset, which is dominated by the fermented category, we evaluated whether a hierarchical binary strategy could improve macro F1-score compared with a conventional single-step four-class classification scheme. The hierarchical strategy decomposes the task into two complementary stages: first, a binary classifier separates fermented from unfermented beans; second, a three-class classifier discriminates among the unfermented subclasses, namely under-fermented, violet, and slaty beans. Table 2 reports the macro F1-score obtained for each model in the binary stage, the unfermented three-class stage, the average score of the hierarchical strategy, and the direct four-class multiclass formulation.
Table 2.
Comparison between the hierarchical binary-to-multiclass strategy and the direct multiclass strategy using macro F1-score. The binary strategy includes a first-stage fermented-versus-unfermented classifier and a second-stage three-class classifier for the unfermented subclasses. The average binary strategy corresponds to the mean macro F1-score of both stages. Values are reported as mean ± standard deviation of the macro F1-score across the five stratified cross-validation folds.
The binary stage achieved relatively consistent macro F1-scores across architectures, ranging from 86.29% for ViT-Large to 87.68% for ConvNeXt-XLarge. EfficientNet-B0, MobileNetV3-Large, and ViT-Base obtained similar values, with F1-scores of 87.56%, 87.35%, and 87.51%, respectively. These results indicate that the fermented-versus-unfermented separation is a relatively stable task across model families, although it is not trivial and does not reach perfect discrimination. Therefore, this first stage contributes to reducing the complexity of the original problem but still preserves a measurable classification error.
In contrast, the second stage, focused on the discrimination of the three unfermented subclasses, achieved higher macro F1-scores for all architectures. ViT-Base obtained the best performance in this stage, reaching 94.40%, followed by ConvNeXt-XLarge with 94.02%, EfficientNet-B0 with 93.89%, ViT-Large with 93.22%, and MobileNetV3-Large with 92.54%. This behavior suggests that, once the dominant fermented class is removed from the decision space, the models can more effectively focus on the visual differences among minority fermentation categories. The high performance of the second stage also indicates that the under-fermented, violet, and slaty classes contain discriminative visual patterns that can be learned more effectively when they are not competing directly with the majority fermented class.
When both stages were summarized through the average hierarchical score, ViT-Base achieved the highest macro F1-score, with 90.95%, followed closely by ConvNeXt-XLarge and EfficientNet-B0, with 90.85% and 90.73%, respectively. MobileNetV3-Large reached 89.94%, while ViT-Large obtained 89.76%. In comparison, the direct four-class multiclass strategy produced lower macro F1-scores, ranging from 80.46% for MobileNetV3-Large to 83.24% for EfficientNet-B0. ViT-Base and ViT-Large achieved 82.84% and 82.35%, respectively, whereas ConvNeXt-XLarge reached 81.20%.
Overall, the hierarchical binary strategy outperformed the direct multiclass formulation for all evaluated architectures. This improvement can be explained by the reduction of direct competition between the predominant fermented class and the minority unfermented subclasses, allowing the second classifier to focus on finer visual differences among under-fermented, violet, and slaty beans. Unlike the direct four-class strategy, where all categories compete simultaneously under a strongly imbalanced distribution, the hierarchical approach provides a more structured decision process and improves balanced recognition across fermentation categories. These results confirm that label-space formulation is a relevant factor in cocoa fermentation classification and that the hierarchical binary-to-multiclass strategy is a suitable approach for mitigating the impact of class imbalance in this dataset.
Considering the complete set of RGB-based experiments, the strongest model depended on the evaluation setting. Under the balanced RGB configuration, ConvNeXt-XLarge achieved the highest macro F1-score, followed closely by ViT-Base. Under the original unbalanced RGB configuration, EfficientNet-B0 obtained the highest macro F1-score, followed by ViT-Base. In the hierarchical binary-to-multiclass strategy, ViT-Base achieved the best average macro F1-score, reaching 90.95%, followed by ConvNeXt-XLarge with 90.85%. Therefore, ViT-Base was the most consistent model across experimental settings, whereas ConvNeXt-XLarge and EfficientNet-B0 were strongest under specific balanced and unbalanced RGB configurations, respectively.
To provide a more detailed statistical validation and to extend the macro-F1 analysis reported in Table 2. Table 3 includes additional confusion-matrix-derived metrics that are particularly relevant under severe class imbalance, namely macro-precision, macro-recall, macro-specificity, macro-F1, and accuracy. This analysis compares the hierarchical binary strategy against the direct four-class multiclass formulation using the full imbalanced RGB dataset, with all values reported as mean ± standard deviation across the five stratified cross-validation folds.
Table 3.
Average binary strategy versus direct four-class classification with uncertainty. Macro-averaged precision, recall, specificity, and F1-score (mean ± standard deviation) comparing the hierarchical average binary strategy and the direct four-class classification using the full imbalanced RGB dataset.
The results in Table 3 further confirm the robustness of the hierarchical strategy. Compared with direct four-class classification, the hierarchical approach achieved higher macro-F1 and macro-recall values with generally moderate standard deviations across models. This behavior is consistent with the strong predominance of the fermented class in the dataset, since the direct multiclass formulation is more sensitive to fold-to-fold variation in minority classes such as under-fermented, violet, and slaty. In contrast, the hierarchical strategy reduces the direct competition between the predominant fermented class and the minority unfermented subclasses, leading to more stable and balanced performance estimates.
3.6. Framework for Inference Classification Task Using Different Models
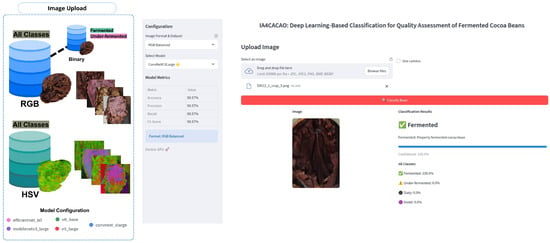
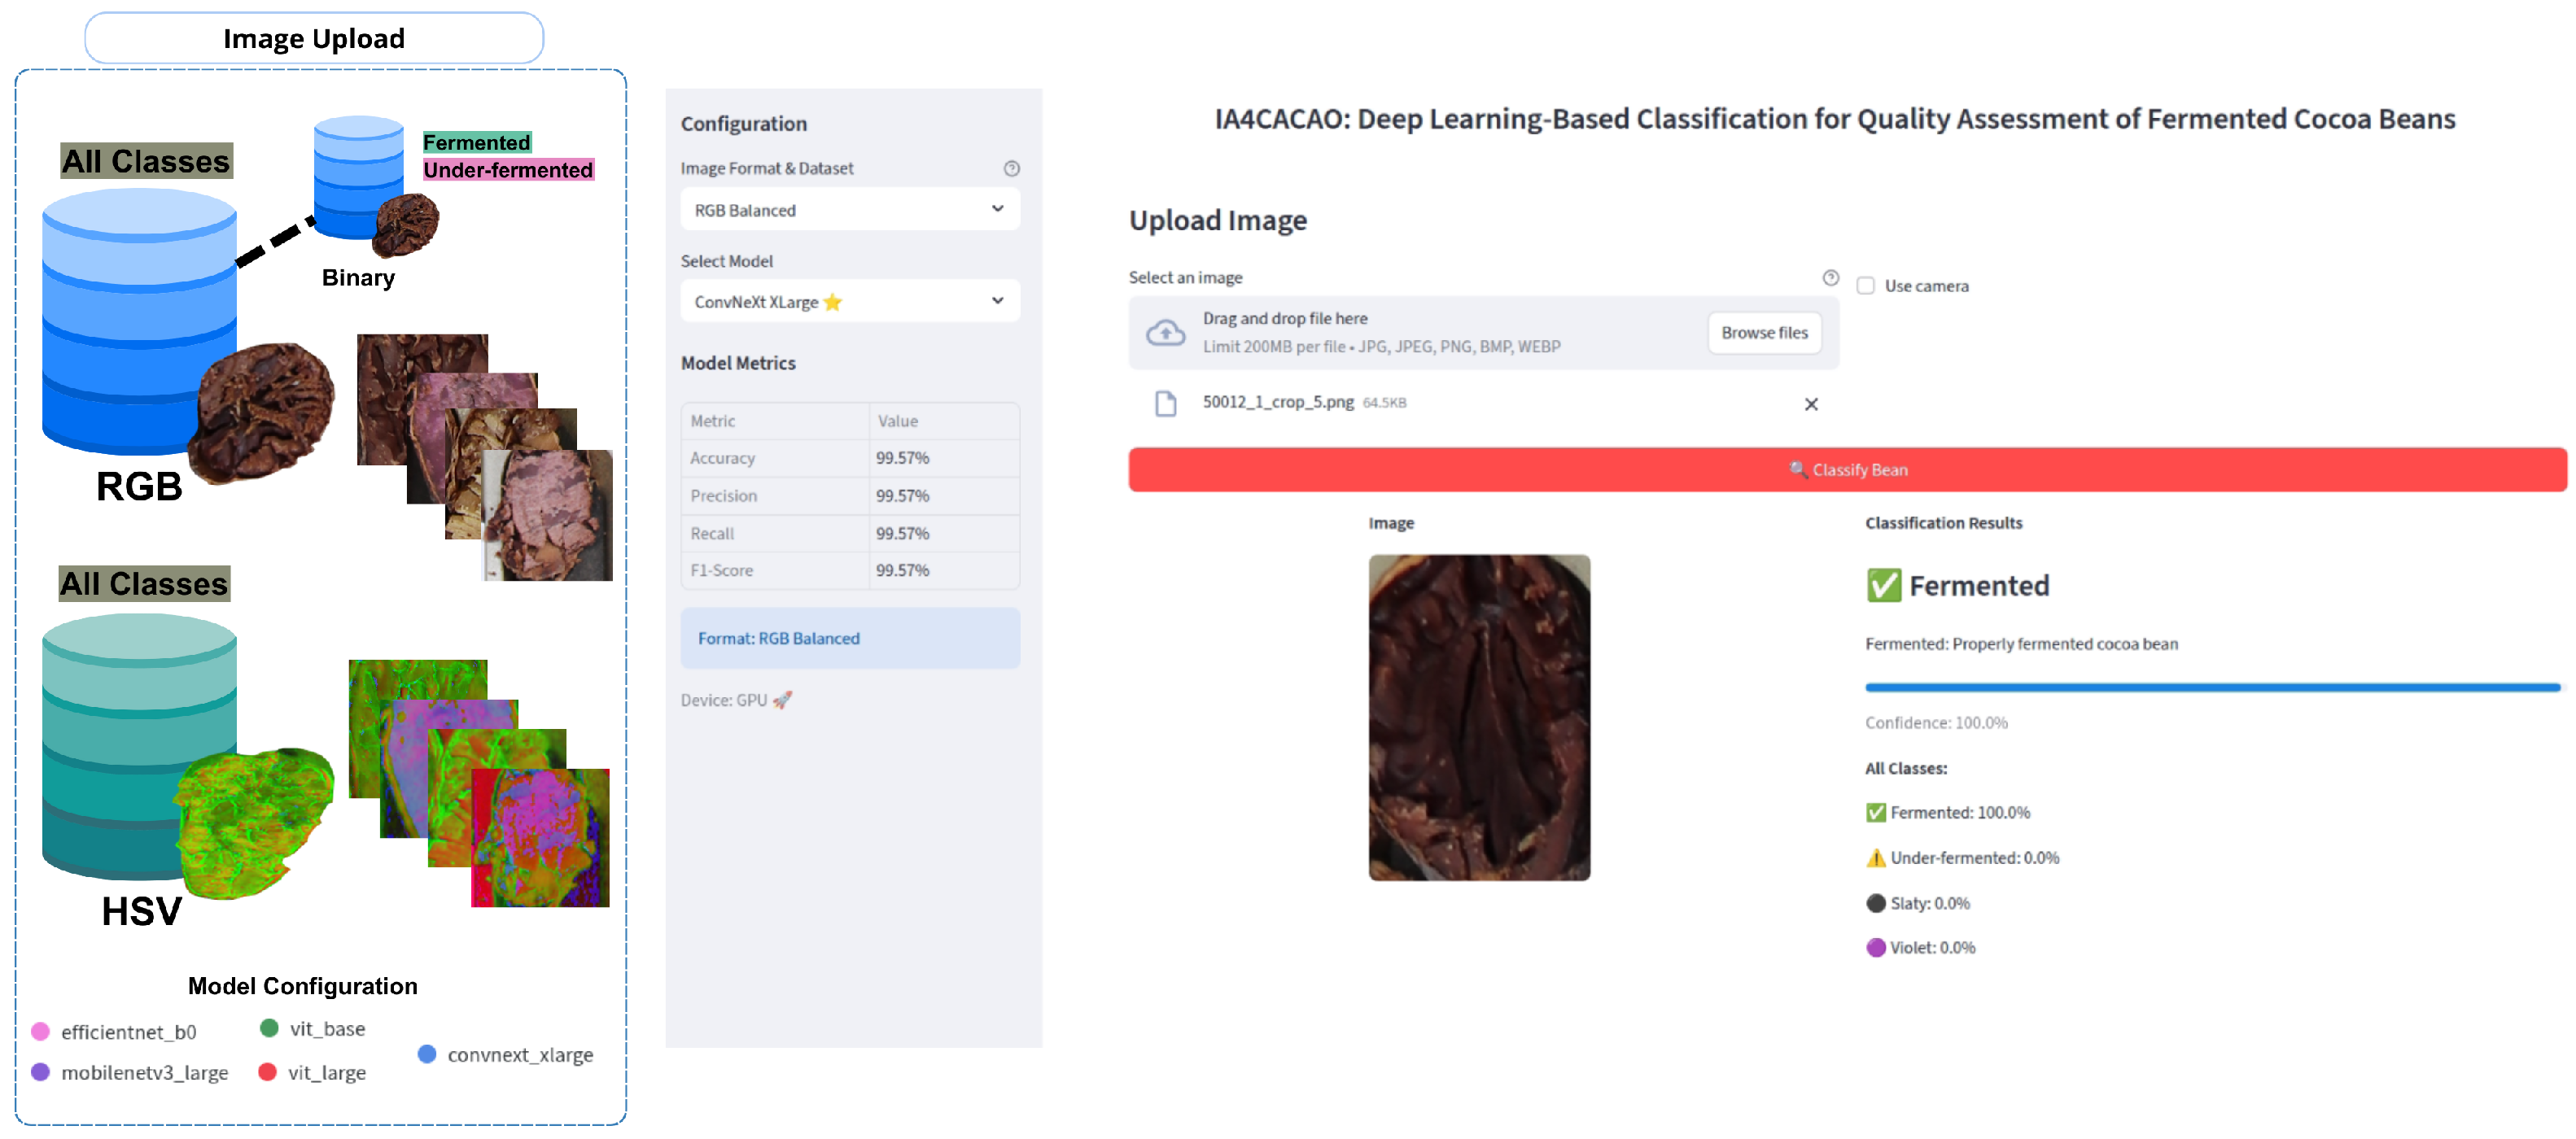
Based on the experimental results obtained, an inference framework was developed for the objective evaluation of cocoa quality in Colombia, as illustrated in Figure 6. This interface integrates the evaluated high-performance architectures, such as ConvNeXt-XLarge and Vision Transformer (ViT), allowing the processing of images from the cut test in RGB and HSV color spaces. It should be noted that inference is performed on segmented single-bean images rather than directly on raw tray images. Accordingly, tray-level image acquisition is used during dataset generation, whereas the deployed classification stage in the framework is performed at the individual bean level. The system provides multiple model configurations, including binary classification models for separating fermented from unfermented beans, and multi-class models for detailed quality assessment. Following the descriptors of the NTC 1252 standard, the interface quantifies the level of fermentation by accurately identifying the states of: fermented, under-fermented, violet, and slaty. This tool transforms the findings of laboratory experiments into a functional system capable of mitigating human subjectivity, providing reliable real-time metrics for decision-making in the post-harvest chain. From a deployment perspective, the proposed framework is compatible with edge and mobile scenarios, particularly when compact backbones or reduced-capacity model variants are used, making real-time or near-real-time inference feasible in resource-constrained environments.
Figure 6.
Cocoa bean loading and classification interface. The left panel illustrates processing in RGB and HSV color spaces for various model architectures. The right panel shows the real-time analysis tool, where the image is loaded, classification is performed (e.g., ConvNeXt-XLarge), and confidence metrics and results are displayed by category.
3.7. Software Stack and Implementation Environment
The development and execution of the proposed deep learning framework were conducted in a standardized Python 3.10 environment to ensure reproducibility and computational efficiency. The core architecture was built using PyTorch 2.10.0 as the primary deep learning backend, together with the timm and Hugging Face Transformers libraries for high-level integration of convolutional and transformer-based architectures.
Data manipulation and preprocessing tasks were handled using NumPy, providing the numerical foundation for managing multidimensional arrays and color-space representations (RGB and HSV). Additionally, the Weights & Biases (WandB) platform was used for real-time tracking of metrics such as loss, accuracy, and macro F1-score during training runs configured with up to 100 epochs. These logs were used to generate the RGB epoch-wise sensitivity curves reported in Experiment 3.
4. Discussion
Overall, our findings indicate that deep learning can improve the objectivity and scalability of classification for quality assessment of fermented cocoa beans from cut-test images. However, system reliability remains strongly dependent on dataset characteristics, particularly class balance, data diversity, and the availability of sufficiently large databases that capture real-world production variability. Future work should therefore prioritize end-to-end automation by integrating robust bean detection and segmentation with fermentation classification, supported by expanded multi-site datasets and interpretable decision-support tools to facilitate adoption in both industrial and farm-level quality control.
The marginal advantage of RGB over HSV has a direct practical implication: the chromatic information required for fermentation-level discrimination is fully accessible in standard RGB images without additional preprocessing. From a deployment standpoint, this is relevant because RGB can be captured with off-the-shelf cameras as in this study while HSV conversion introduces a preprocessing dependency that must be consistently enforced across devices and lighting conditions. Although HSV theoretically offers greater robustness under variable illumination by decoupling chromaticity from intensity, this advantage did not materialize under the controlled acquisition protocol used here; whether it would emerge under uncontrolled field conditions remains an open question for future work. The dataset-size experiment showed that macro F1-score was sensitive to the prevalence of the fermented class. Reducing the dominance of this category improved balanced recognition, particularly for ViT-Base, ViT-Large, and ConvNeXt-XLarge, whereas MobileNetV3-Large showed only modest gains. These findings indicate that class-ratio control is important for reducing majority-class bias and improving sensitivity to minority fermentation categories.
In terms of training dynamics, the evaluated architectures reached a stable performance regime after approximately 50 to 60 epochs, particularly under the balanced configuration. Extending training up to 100 epochs yields only marginal gains and does not mitigate the negative impact of class imbalance in the unbalanced RGB setting. Finally, the hierarchical binary-to-multiclass strategy further alleviated imbalance effects by decomposing the original four-class problem into two more structured decision stages. The first stage provided a stable fermented-versus-unfermented separation, whereas the second stage achieved higher macro F1-scores when discriminating among under-fermented, violet, and slaty beans. This suggests that removing the dominant fermented class from the second decision space improves the separability of minority subclasses and leads to more balanced performance than direct four-class training.
Beyond cocoa fermentation, computer vision and AI have been widely applied to agricultural commodities to detect defects, estimate ripeness, and automate quality classification using subtle spatial and chromatic [11,13]. Vision Transformers have also shown strong performance in agricultural image analysis by capturing global context and fine-grained visual patterns, which can improve robustness under heterogeneous acquisition conditions [21]. Nevertheless, real-world deployment remains challenging due to domain shifts between controlled and operational environments, sensitivity to illumination and background variation, and the need for large, diverse, and well-balanced datasets. These limitations are particularly relevant for cocoa fermentation grading, where minority classes are underrepresented and visual differences among categories can be subtle. Table 4 summarizes representative studies in cocoa bean classification and contextualizes the performance of the proposed approach relative to prior work.
Table 4.
Comparative overview of representative cocoa bean classification studies. Reported values correspond to validation/test performance for the best configuration of each work. Acc = accuracy; F1 = macro F1-score when reported. For our study, F1 corresponds to the average macro F1-score of the hierarchical binary-to-multiclass strategy.
The comparative results in Table 4 should be interpreted with caution because the reported performance values are not directly comparable across studies. The evaluated works differ in imaging modality, task definition, number of classes, dataset size, class distribution, and validation protocol. For example, the highest F1-score reported in the table corresponds to the RGB-CNN study based on ResNet-18, which achieved an F1-score of 0.970; however, that work addressed cocoa variety classification rather than direct fermentation-level grading. Therefore, this result should not be interpreted as directly superior for the specific problem addressed in the present study.
Within this context, ViT-Base was selected as the representative model for our study in Table 4 because it showed the most consistent behavior across the evaluated experiments. Although ConvNeXt-XLarge achieved the highest macro F1-score under the balanced RGB configuration, ViT-Base remained among the top-performing models in the dataset-size experiment, the RGB/HSV ablation, the epoch-wise sensitivity analysis, and the hierarchical binary-to-multiclass strategy. Moreover, ViT-Base achieved the highest average macro F1-score in the hierarchical strategy, reaching 0.910, while requiring substantially less training time than ConvNeXt-XLarge and ViT-Large. Thus, the value reported for our study in Table 4 should be understood as a representative and imbalance-aware performance estimate rather than as a direct one-to-one comparison with studies based on different datasets, tasks, or evaluation protocols.
5. Conclusions
The implementation of deep learning models enables the automation and standardization of cocoa fermentation assessment in Colombia, mitigating the subjectivity inherent in the conventional cut test. The results show that high-capacity architectures such as ConvNeXt-XLarge and transformer-based models provide strong discrimination across fermentation categories. Among the evaluated architectures, ViT-Base offered the most consistent balance between predictive performance and computational cost. The dataset-size experiment showed that reducing the dominance of the fermented class improved macro F1-score across most architectures, with the best performance obtained in the fermented-eighth configuration. Under this setting, ViT-Base achieved the highest F1-score, followed by ViT-Large and ConvNeXt-XLarge, confirming that class-ratio control is essential for improving minority-class recognition in cocoa fermentation classification.
The RGB–HSV ablation indicated that HSV did not provide a systematic advantage over RGB, with RGB achieving slightly higher or comparable cross-validated F1-scores in most configurations. The epoch-wise analysis over 100 training epochs showed that most architectures reached stable performance after approximately 50–60 epochs, whereas additional training provided only marginal improvements. In the unbalanced setting, increasing training duration did not compensate for the reduced representation of minority classes, confirming that imbalance-aware strategies are more relevant than simply extending the number of epochs. In addition, the hierarchical binary-to-multiclass strategy consistently outperformed direct four-class classification, with average hierarchical macro F1-scores close to 90–91%, compared with approximately 80–83% for the direct multiclass formulation.
It should nonetheless be emphasized that direct four-class training remains constrained by the original class imbalance. As shown in Table 2, ViT-Base and ViT-Large achieved macro F1-scores of 82.84% and 82.35%, respectively, under the direct multiclass formulation, whereas their hierarchical averages increased to 90.95% and 89.76%. This improvement indicates that the hierarchical binary-to-multiclass strategy provides a more balanced decision structure by reducing the direct competition between the predominant fermented class and the minority unfermented subclasses. Therefore, operational deployment should incorporate imbalance-aware mechanisms together with per-class monitoring. Based on the present results, hierarchical inference and explicit class-ratio control are particularly relevant. Additional strategies, such as class-weighted loss or focal loss, should be evaluated in future work under operational datasets.
Beyond model benchmarking, this study delivers a functional inference tool aligned with NTC 1252 descriptors that supports rapid, objective, and reproducible diagnostics for the cocoa value chain. By enabling consistent grading outputs and confidence reporting in real time, the system reduces dependence on highly trained human evaluators, improves process repeatability, and facilitates scalable quality control in laboratory and operational settings. In practical terms, this tool provides a direct pathway to embed AI-assisted inspection into routine post-harvest workflows, supporting faster feedback to processors and producers, strengthening standardization, and improving traceability of quality decisions across batches. In Colombian cacaoculture, these technologies are especially relevant because commercial value is strongly driven by post-harvest quality attributes (fermentation and defects) and assessment is often performed under heterogeneous conditions across smallholder-based supply chains. Deployable computer-vision/AI solutions implemented as edge-capable decision-support systems in collection centers, cooperatives, and processing plants could enable objective lot segregation, reduce inter-operator variability, and support auditable quality-based payment schemes consistent with NTC 1252. By standardizing classification outputs across regions and seasons, and provided that imbalance-aware mechanisms are incorporated to handle the skewed class distributions typical of real-world batches, such systems could reduce transaction frictions, improve buyer confidence, and strengthen the credibility and competitiveness of Colombian fine and flavor cocoa in export-oriented markets.
Author Contributions
Conceptualization, D.A.Z. and C.A.V.; Methodology, A.C.V., R.S.A.C. and C.A.V.; Software, R.S.A.C.; Validation, A.C.V., D.A.Z., L.G.R.S. and C.A.V.; Formal analysis, A.C.V. and C.A.V.; Investigation, A.C.V. and R.S.A.C.; Resources, G.A.E.-B.; Data curation, R.S.A.C.; Writing—review & editing, A.C.V., D.A.Z. and G.A.E.-B.; Supervision, C.A.V.; Funding acquisition, A.C.V. All authors have read and agreed to the published version of the manuscript.
Funding
This research was funded by Minciencias under Grant 934, “Clasificación y detección de cambios en cultivos agrícolas usando imágenes satelitales ópticas y de radar como herramienta de apoyo para Agrosavia en los centros de investigación La Suiza, de Rionegro Santander y Norte de Santander, Centro de Investigación Nataima, Tolima y el distrito de conservación de suelos del Centro de Investigación Tibaitatá”. The APC was funded by Minciencias.
Institutional Review Board Statement
Not applicable.
Informed Consent Statement
Not applicable.
Data Availability Statement
The data presented in this study are available on request from the corresponding author.
Conflicts of Interest
All authors are employees of AGROSAVIA (La Corporación Colombiana de Investigación Agropecuaria). AGROSAVIA had involvement in the study through the following contributions: experimental design; provision of cocoa grain samples; facilitation of laboratory infrastructure and facilities required for performing the cocoa bean cut-test method; and expert labeling and classification of samples carried out by AGROSAVIA personnel. AGROSAVIA is a public, scientific, and technical non-profit research institution dedicated to agricultural research and innovation in Colombia. The authors declare that these institutional contributions do not constitute a commercial or financial conflict of interest.
References
- Ali, M.A.; Abdel-Hameed, I.M.; Rabie, H.A. Effect of drying, storage, microorganisms and fermentation on the quality of cocoa beans in Indonesia: A review. Zagazig J. Agric. Res. 2024, 51, 2023–2042. [Google Scholar] [CrossRef] [Scilit]
- Quelal-Vásconez, M.A.; Lerma-García, M.J.; Pérez-Esteve, É.; Talens, P.; Barat, J.M. Roadmap of cocoa quality and authenticity control in the industry: A review of conventional and alternative methods. Compr. Rev. Food Sci. Food Saf. 2020, 19, 448–478. [Google Scholar] [CrossRef] [Scilit] [PubMed]
- ISO 2451:2017; Cocoa Beans—Specification. International Organization for Standardization: Geneva, Switzerland, 2017.
- NTC 1252:2021; Cocoa Beans. ICONTEC: Bogotá, Colombia, 2021.
- León-Roque, N.; Abderrahim, M.; Nuñez-Alejos, L.; Arribas, S.M.; Condezo-Hoyos, L. Prediction of fermentation index of cocoa beans (Theobroma cacao L.) based on color measurement and artificial neural networks. Talanta 2016, 161, 31–39. [Google Scholar] [CrossRef] [Scilit] [PubMed]
- Jati, M.; Jinap, S.; Jamilah, B.; Nazamid, S. Effects of incubation and polyphenol oxidase enrichment on colour, fermentation index, procyanidins and astringency of unfermented and partly fermented cocoa beans. Int. J. Food Sci. Technol. 2003, 38, 285–295. [Google Scholar] [CrossRef] [Scilit]
- Buitrago Torres, J.B.; Muñoz Torres, C.A. Procesos Agroindustriales Innovadores a Partir del Cacao (Theobroma cacao L.) Cosechado en el Departamento del Tolima para su Producción y Comercialización por Parte de las Asociaciones Cacaoteras de la Región; Proyecto Aplicado, Universidad Nacional Abierta y a Distancia (UNAD): Ibagué, Colombia, 2025; Available online: https://repository.unad.edu.co/handle/10596/70841 (accessed on 1 May 2026).
- Castro-Alayo, E.M.; Idrogo-Vásquez, G.; Siche, R.; Cardenas-Toro, F.P. Formation of aromatic compounds precursors during fermentation of Criollo and Forastero cocoa. Heliyon 2019, 5, e01157. [Google Scholar] [CrossRef] [Scilit] [PubMed]
- Utrilla-Vázquez, M.; Rodríguez-Campos, J.; Avendaño-Arazate, C.H.; Gschaedler, A.; Lugo-Cervantes, E. Analysis of volatile compounds of five varieties of Maya cocoa during fermentation and drying processes by Venn diagram and PCA. Food Res. Int. 2020, 129, 108834. [Google Scholar] [CrossRef] [Scilit] [PubMed]
- López-Hernández, M.P.; Criollo-Nuñez, J. Cambios fisicoquímicos en la fermentación y secado de materiales de cacao en Colombia. Cienc. En. Desarro. 2022, 13, 25–34. [Google Scholar] [CrossRef] [Scilit]
- Lopes, J.F.; Costa, V.G.T.; Barbin, D.F.; Cruz-Tirado, L.J.P.; Baeten, V.; Barbon, S., Jr. Deep computer vision system for cocoa classification. Multimed. Tools Appl. 2022, 81, 41059–41077. [Google Scholar] [CrossRef] [Scilit]
- Ayikpa, K.J.; Gouton, P.; Mamadou, D.; Ballo, A.B. Classification of Cocoa Beans by Analyzing Spectral Measurements Using Machine Learning and Genetic Algorithm. J. Imaging 2024, 10, 19. [Google Scholar] [CrossRef] [Scilit] [PubMed]
- Oliveira, M.M.; Cerqueira, B.V.; Barbon, S., Jr.; Barbin, D.F. Classification of fermented cocoa beans (cut test) using computer vision. J. Food Compos. Anal. 2021, 97, 103771. [Google Scholar] [CrossRef] [Scilit]
- He, K.; Zhang, X.; Ren, S.; Sun, J. Deep Residual Learning for Image Recognition. In Proceedings of the IEEE Conference on Computer Vision and Pattern Recognition (CVPR), Las Vegas, NV, USA, 27–30 June 2016; pp. 770–778. [Google Scholar] [CrossRef] [Scilit]
- Sánchez, K.; Bacca, J.; Arévalo-Sánchez, L.; Arguello, H.; Castillo, S. Classification of Cocoa Beans Based on their Level of Fermentation using Spectral Information. TecnoLógicas 2021, 24, e1654. [Google Scholar] [CrossRef] [Scilit]
- Chen, Y.; Zhu, F.; Zheng, Z.; Ma, J.; Zhou, B. Guardnet: An imbalance-aware graph neural network for fraud detection. Data Min. Knowl. Discov. 2026, 40, 14. [Google Scholar] [CrossRef] [Scilit]
- Atila, Ü.; Uçar, M.; Akyol, K.; Uçar, E. Plant leaf disease classification using EfficientNet deep learning model. Ecol. Inform. 2021, 61, 101182. [Google Scholar] [CrossRef] [Scilit]
- Howard, A.; Sandler, M.; Chu, G.; Chen, L.-C.; Chen, B.; Tan, M.; Wang, W.; Zhu, Y.; Pang, R.; Vasudevan, V.; et al. Searching for MobileNetV3. In Proceedings of the IEEE/CVF International Conference on Computer Vision (ICCV), Seoul, Republic of Korea, 27 October–2 November 2019; pp. 1314–1324. [Google Scholar] [CrossRef] [Scilit]
- Wang, Y.; Deng, Y.; Zheng, Y.; Chattopadhyay, P.; Wang, L. Vision Transformers for Image Classification: A Comparative Survey. Technologies 2025, 13, 32. [Google Scholar] [CrossRef] [Scilit]
- Liu, Z.; Mao, H.; Wu, C.-Y.; Feichtenhofer, C.; Darrell, T.; Xie, S. A ConvNet for the 2020s. In Proceedings of the IEEE/CVF Conference on Computer Vision and Pattern Recognition (CVPR), New Orleans, LA, USA, 18–24 June 2022; pp. 11966–11976. [Google Scholar] [CrossRef] [Scilit]
- Barman, U.; Sarma, P.; Rahman, M.; Deka, V.; Lahkar, S.; Sharma, V.; Saikia, M.J. ViT-SmartAgri: Vision Transformer and Smartphone-Based Plant Disease Detection for Smart Agriculture. Agronomy 2024, 14, 327. [Google Scholar] [CrossRef] [Scilit]

Disclaimer/Publisher’s Note: The statements, opinions and data contained in all publications are solely those of the individual author(s) and contributor(s) and not of MDPI and/or the editor(s). MDPI and/or the editor(s) disclaim responsibility for any injury to people or property resulting from any ideas, methods, instructions or products referred to in the content. |
© 2026 by the authors. Licensee MDPI, Basel, Switzerland. This article is an open access article distributed under the terms and conditions of the Creative Commons Attribution (CC BY) license.