


Abstract
Objectives: Multispectral imaging and spectrophotometry are widely used to estimate plant physiological characteristics, yet the literature remains fragmented across sensors, indices, and analytical approaches. Methods: This systematic review followed PRISMA 2020 and was preregistered in OSF (Open Science Framework). Web of Science, Scopus, Google Scholar, and Consensus were searched up to January 2025 for peer-reviewed studies and selected gray literature studies focused on plant physiological trait estimation using multispectral or spectrophotometric methods. From 256 identified records, 96 studies met the eligibility criteria. Methodological quality was assessed across five domains, and results were synthesized narratively owing to high heterogeneity. Results: A total of 96 studies met the eligibility criteria. Among these, multispectral sensors were the most commonly used (40.7%), followed by UAV-mounted platforms (25.9%), while hyperspectral sensors accounted for 18.5% of the studies. The most frequently used vegetation index was NDVI, reported in 87% of the studies, mainly for estimating vigor, biomass, and canopy structure. Discussion: Although multispectral indices reliably capture key agronomic traits, cross-study comparability is currently hampered by significant methodological variability and a lack of consistent validation protocols. Conclusions: Multispectral imaging and spectrophotometry are effective tools for estimating plant physiological traits, but greater standardization is needed across studies. Owing to the limited number of studies on Stenocereus spp., the review was expanded to plants in general; the shortage of reports addressing Stenocereus spp. highlights the need for future research in these species.
1. Introduction
Physiological and morphological traits derived from vegetation indices (VIs) [1] and spectral signatures have become fundamental tools in precision agriculture and ecology because they allow noninvasive assessment of physiological, biochemical, and structural attributes in plants. Since the initial development of NDVI from satellite observations acquired by the ERTS mission and subsequent platforms, vegetation indices and other spectral reflectance metrics have been widely applied to estimate biomass, leaf area index, pigment concentrations, and plant vigor across multiple ecosystems [2,3,4,5]. In parallel, advances in the understanding of leaf optical properties and the interaction between electromagnetic radiation and plant tissues have provided more robust mechanistic foundations for interpreting these indices [2,6].
Vegetation indices derived from multispectral and hyperspectral imagery and, in certain cases, from RGB imagery processed with machine learning approaches have been used to estimate the quantities of chlorophyll [7,8], carotenoids, and other pigments. These indices have also been employed to evaluate water stress [9,10], photochemical performance, and tolerance to adverse environmental conditions [11]. Recent studies have compared the performance of NDVI, NDRE, EVI, SAVI, and red- or red-edge-based variants for discriminating chlorophyll variability and nutritional or hydric status in crops [12,13,14]. Alongside these developments, the increasing availability of sensors mounted on unmanned aerial vehicles and proximal platforms has supported the creation of workflows for radiometric calibration, geometric correction, and characterization of spectral responses under field conditions [15,16].
Beyond the canopy scale, spectral signatures acquired through contact spectrophotometry or spectroradiometry have been applied to estimate chlorophyll, anthocyanin, and carotenoid concentrations in leaves, together with additional physiological traits related to photosynthesis and senescence, through nondestructive methods [17,18,19]. These techniques rely on reflectance transformations that yield pigment-specific or water-related indices and have proven useful for monitoring responses to biotic and abiotic stress in numerous cultivated and wild species [20,21]. The integration of high-spectral-resolution point measurements with multispectral or hyperspectral imagery has linked physiological processes at the leaf level with spatial patterns of vigor and productivity at the plot, landscape, and regional scales [22,23].
In addition, the analysis of vegetation index time series from satellite missions has made it possible to extract phenological indicators such as the beginning and end of the growing season and to quantify vegetation responses to climatic variability and global change [24,25]. Nevertheless, these products remain susceptible to optical noise, atmospheric variability, cloud contamination, and soil background effects, all of which introduce uncertainty into the estimation of physiological traits across spatial and temporal gradients [26]. Consequently, ongoing discussions have examined the sensitivity of traditional vegetation indices, the stability of their responses under different canopy conditions and illumination regimes, and the feasibility of transferring models across sensors and observation scales [27,28].
Despite the expansion of research in this field, the available evidence remains fragmented with respect to species, sensor configurations, selected indices, and data processing methodologies. This fragmentation is particularly evident in arid and semiarid ecosystems and in ecologically relevant groups such as cacti, whose morphophysiological characteristics and succulent tissues impose specific challenges for interpreting reflectance [29,30]. Few studies have systematically examined which physiological traits have been estimated through vegetation indices and spectral signatures or how these estimates have been validated against invasive or laboratory-based measurements.
In this context, the objective of this systematic review was to synthesize the evidence regarding the extraction of physiological traits in plants using multispectral, hyperspectral, and spectrophotometric analyses [31]. The review aimed to identify which physiological and structural properties have been estimated, which vegetation indices and spectral metrics have been applied, and which methodological approaches have predominated in their calculation and validation. Through this synthesis, the study sought to identify methodological trends, knowledge gaps, and opportunities to improve the characterization of physiological status and plant phenotypes, with particular attention to species from desert environments, such as Stenocereus spp.
Unlike previous reviews, which focused primarily on remote sensing technologies or specific crops, this review integrates multispectral imaging, hyperspectral analysis, and spectrophotometry specifically from the perspective of physiological trait extraction. In addition, this review places particular emphasis on methodological approaches; validation strategies; and the applicability of these techniques to species from arid and semiarid habitats, including cacti such as Stenocereus spp., which remain underrepresented in the literature. By combining methodological analysis with physiological interpretation, this review aims to identify not only commonly used indices and sensors but also methodological gaps and research opportunities for species adapted to dry environments. The research question was formulated according to the PICO framework as follows: which physiological traits have been identified in plants through multispectral, hyperspectral, or spectrophotometric methods, and which methodologies have been used for their estimation?
Figure 1 illustrates the conceptual scope of this review, from the acquisition of plant spectral reflectance using different sensors to spectral processing and vegetation index calculation, which enable the estimation of plant physiological traits and their applications in agriculture, ecological monitoring, and the study of species from arid environments such as Stenocereus spp.
Figure 1.
Conceptual framework of the systematic review.
2. Materials and Methods
2.1. Protocol Registration, Data, and Supplementary Materials
The protocol for this systematic review was preregistered in the Open Science Framework (OSF) under the title “Physiological Feature Extraction in Plants through Multispectral Analysis and Spectrophotometry: A Systematic Review with Applications to Stenocereus spp.” and is accessible at https://osf.io/h95ju/overview, accessed on 14 January 2026. All materials generated or used throughout the review, including the preregistered protocol, the complete search strategies, the data extraction forms, the screening logs, the methodological documentation, and the datasets produced during synthesis, are openly available in the same repository. The overarching aim of the review was to synthesize scientific evidence on the extraction of plant physiological traits using multispectral analysis, spectrophotometry and vegetation index computation [32].
2.2. Search Strategy
The literature search was conducted up to January 2025, and studies published in English and Spanish were considered. Four primary sources were examined: Web of Science, Scopus, Google Scholar, and the AI-assisted search engine Consensus. Only articles in English and Spanish were included. The search queries were constructed from four main components: (1) spectral data type, (2) platform or sensor, (3) biophysical parameters and (4) application in monitoring or phenotyping. The complete search strategies used in this review are presented below according to the PRISMA 2020 recommendations. Exact query strings were adapted to the syntax of each database. These complete strategies are also archived in the OSF repository [32]. The search terms were as follows:
- Consensus: hyperspectral multispectral remote sensing sensors plant water content chlorophyll LAI phenotyping UAV
- Web of Science and Scopus: TITLE-ABS-KEY ((hyperspectral OR multispectral OR “spectral reflectance” OR “spectral signature”) AND (sensor* OR camera* OR UAV OR UAS OR drone OR “remote sensing”) AND (“biophysical parameter*” OR “plant water content” OR “water stress” OR chlorophyll OR nitrogen OR biomass OR LAI OR vigor) AND (phenotyping OR “high-throughput phenotyping” OR monitoring OR estimation))
- Google Scholar (broad search): (hyperspectral OR multispectral OR “spectral reflectance” OR “spectral signature”) AND (sensor OR camera OR UAV OR drone OR “remote sensing”) AND (“plant water content” OR “water stress” OR chlorophyll OR nitrogen OR biomass OR LAI OR vigor) AND (phenotyping OR monitoring OR estimation)
The information was obtained from peer-reviewed journal articles, academic book chapters, and conference proceedings that met the inclusion criteria. In addition to peer-reviewed sources, selected gray literature (including technical reports and ATBDs) was incorporated when it provided essential methodological specifications for estimating spectral features.
2.3. Inclusion and Exclusion Criteria
Studies were included when they used multispectral or hyperspectral imagery, spectral measurements obtained through spectrophotometry or spectroradiometry, or vegetation indices. Additionally, studies were required to evaluate physiological or biochemical plant traits, the acquisition and analysis of spectral signatures, or remote sensing applications focused on vegetation. The review considered vascular plants from diverse biomes, including crops, wild species, and cacti belonging to the genus Stenocereus.
Studies were excluded when full text access was not available, when conference abstracts lacked sufficient methodological detail, when identifiers could not be verified, when analyses did not involve plants, or when records were duplicates or lacked the minimum information required for extraction.
2.4. Study Selection Process
Reference management and duplicate removal were performed in Zotero. The selection process was completed in Covidence [33] in two stages, which consisted of title and abstract screening followed by full text review. The screening and data extraction process involved two independent reviewers. Disagreements during the screening and extraction stages were resolved through discussion and consensus. When a consensus could not be reached, a third reviewer was consulted. Although formal inter-rater agreement statistics were not calculated, the use of independent screening and consensus review helped ensure consistency in study selection and data extraction. The procedure was documented according to the PRISMA 2020 guidelines [34].
Both experimental and observational studies were included in this review, provided that they involved multispectral, hyperspectral, or spectrophotometric data used to estimate plant physiological features. The search was limited to publications in English and Spanish because these languages covered the vast majority of relevant literature identified in preliminary searches and were accessible to the review team for accurate methodological evaluation and data extraction.
To structure the narrative synthesis, all included studies were grouped into five thematic domains commonly used in multispectral and spectrophotometric research: (1) vegetation indices and biophysical parameters, which encompassed the development, modification and comparison of spectral indices and their use for estimating physiological traits such as chlorophyll, carotenoids, anthocyanins, water content, and stress conditions; (2) remote sensing sensors, cameras and acquisition platforms, including studies on multispectral/hyperspectral sensor design, radiometric and geometric calibration, and data collection using UAVs, proximal sensors and satellite imagery; (3) image processing and computational methods, covering segmentation approaches, feature extraction, machine learning and deep learning models, clustering methods, and data fusion techniques; (4) plant phenotyping and precision agriculture, which integrated applications focused on crop monitoring, high-throughput phenotyping, nutrient and irrigation management, yield estimation, and weed detection; and (5) ecological and environmental applications, including vegetation monitoring, habitat assessment, biodiversity studies and analyses of environmental stressors. This classification framework was defined a priori and used consistently during data extraction to ensure comparability across studies despite methodological heterogeneity.
2.5. Assessment of Methodological Quality
The methodological quality of the included studies was assessed using an adapted evaluation framework based on commonly used criteria in observational remote sensing research. The assessment consisted of five domains: (1) clarity of research objectives, (2) methodological adequacy, (3) data quality and completeness, (4) reporting transparency and (5) potential sources of bias. This framework was designed to capture the internal rigor of multispectral and spectrophotometric studies, even in the absence of a standardized risk-of-bias tool for this type of research.
2.5.1. Assessment Criteria
The assessment criteria were as follows:
- Objectives (OBJ): Clarity and specificity of the research questions, including whether the study articulates measurable outcomes related to vegetation indices, physiological traits, or spectral variables.
- Methodology (METH): Appropriateness and transparency of the experimental or observational design, including calibration, spectral acquisition procedures, preprocessing, and analytical methods.
- Data Quality (DATA): Completeness of reported datasets, availability of sample sizes, number of replicates, acquisition conditions, and handling of missing or uncertain values.
- Reporting (REP): Transparency in reporting key methodological steps, including sensor specifications, wavelength ranges, environmental conditions, and statistical procedures.
- Risk of Bias (BIAS): Potential sources of bias related to study design, including sampling bias, spectral variability not controlled, overfitting, and lack of validation.
2.5.2. Scoring Procedure
Each domain was rated dichotomously (1 = meets criterion; 0 = insufficient or unclear), resulting in a score ranging from 0 to 5. A total quality rating was derived as follows:
- High quality: 4–5 points
- Medium quality: 2–3 points
- Low quality: 0–1 points
In some cases, an intermediate score of 0.5 was assigned when the study partially met the criterion but did not provide sufficient detail to fully satisfy the requirement. This approach allowed a more nuanced assessment of methodological quality while maintaining consistency across evaluators.
Two reviewers independently assessed all 96 studies. Disagreements were resolved through discussion, with a third reviewer being consulted when necessary. The results are summarized in Table 1, and full assessments are provided in Table A1.
Table 1.
Partial classification table of the methodological quality of the included studies.
2.6. Risk-of-Bias Assessment
Risk of bias was assessed using an adapted ROBINS-I framework tailored to multispectral and spectrophotometric vegetation studies. Five methodological domains were evaluated: (1) sample selection, (2) spectral acquisition, (3) measurement and calibration, (4) analytical methods, and (5) reporting quality. Each domain was classified as low, moderate, high, or unclear risk (see Table 2).
Table 2.
Risk-of-bias assessment using the adapted ROBINS-I tool for spectral and vegetation index studies.
Sample selection bias considered whether sampling captured sufficient biological and phenological variability and whether objective selection criteria were used. Spectral acquisition bias evaluated control of illumination, solar geometry, sensor viewing angle, and environmental conditions. Measurement and calibration bias assessed the use of traceable reflectance panels, radiometric or atmospheric corrections, and reporting of spectral range and resolution. Analytical bias included the appropriateness of vegetation index selection and the use of robust validation schemes (e.g., k-fold, LOO, or external validation) to prevent overfitting. Reporting bias examined the completeness of metadata, calibration information, acquisition parameters, and uncertainty metrics, as well as potential selective reporting.
This adapted framework ensured consistent evaluation across studies and improved comparability of methodologies. Detailed assessments of all included studies are provided in Table A1.
2.7. Synthesis of Results
Because of the high heterogeneity observed among sensors, protocols, and reported spectral metrics, no meta-analysis was conducted. A qualitative synthesis was performed, and the results were organized narratively according to spectral acquisition techniques, types of vegetation indices applied, physiological traits estimated, and applications in species from arid ecosystems with emphasis on Stenocereus spp. Comparative tables generated for the synthesis were made available in OSF. In addition to the qualitative narrative synthesis, a descriptive quantitative summary was created to report the frequency of sensor types, vegetation indices, and physiological variables across the included studies.
2.8. Protocol Amendments Statement
A minor amendment was introduced during the execution of the review to address the scarcity of available studies specifically focused on Stenocereus spp. While the original protocol targeted this genus as the primary population of interest, the search results revealed an insufficient number of eligible publications to support a meaningful synthesis. To preserve methodological rigor and maintain the structure prespecified in the protocol, the scope of the population was expanded to include studies on plants in general that employed multispectral or hyperspectral analysis and spectrophotometry for physiological trait extraction. This modification did not alter the inclusion and exclusion criteria, the search methodology, the screening procedures, or the data extraction workflow; instead, it ensured that the review remained analytically viable while adhering to the same methodological framework established in the preregistered protocol.
All other components of the protocol, including eligibility criteria based on spectral techniques, study design, extraction of physiological or structural traits, and PRISMA-based screening and documentation procedures, remain unchanged. The amendment was limited to broadening the taxonomic scope of the population (P) within the PICO structure. This adjustment is fully documented here for transparency and consistency with PRISMA 2020 guidance. The preregistered protocol and search documentation remain publicly available in the OSF repository.
2.9. Ethical Considerations and AI Declaration
This study did not involve human or animals subjects and did not require ethical approval. No generative artificial intelligence tools were used for data extraction, analysis, or translation. Their use was limited to translation support and did not influence the scientific content. The Consensus tool was used as the information search engine.
3. Results
3.1. Study Selection Process
The selection process was conducted in accordance with the PRISMA 2020 guidelines. The initial search identified 256 records retrieved from Web of Science, Scopus, Google Scholar, and Consensus. All records were managed in Zotero, where 40 duplicates and 57 documents with incomplete metadata were removed, resulting in 159 potentially eligible studies. The refined database was then imported into Covidence for systematic screening. Two independent reviewers examined the 159 titles and abstracts; 63 studies were excluded for not meeting the inclusion criteria, and eight additional records were removed because the DOIs could not be retrieved. A total of 96 studies were ultimately incorporated into the qualitative synthesis. The detailed flow of the selection process is presented in Figure 2.
Figure 2.
PRISMA flow diagram.
The search identified a total of 256 records: 23 (9%) from Web of Science, 52 (20%) from Scopus, 134 (52%) from Google Scholar, and 47 (18%) from Consensus (Figure 3).
Figure 3.
Records identified per database before screening: Web of Science (23, 9%), Scopus (52, 20%), Google Scholar (134, 52%), and Consensus (47, 18%), for a total of 256 records.
A total of 159 full-text records were assessed for eligibility, and several were excluded because they did not meet the predefined criteria. The reasons for exclusion included lack of multispectral or spectrophotometric analysis, failure to apply vegetation indices and spectral reflectance data to plants, absence of physiological trait extraction, a focus on taxonomic classification without optical methods, or insufficient methodological detail. Table 3 and Table 4 summarize the full-text studies that were excluded and the specific reasons for their exclusion.
Table 3.
Full-text articles excluded from the review with reasons.
Table 4.
Explanation of exclusion reason codes used in Table 3.
3.2. General Characteristics of the Included Studies
The ninety-six studies covered a broad range of spectral applications and plant types. Most investigations focused on agricultural crops such as maize, wheat, rice, and grapevine, while others included forest species, wild vegetation, and cacti typical of arid ecosystems. Of the 96 studies included in the review, 88 were classified in the analysis, as these were directly related to vegetation indices, spectral signatures, remote sensing, plant stress, and phenotyping. The remaining eight studies were excluded from this classification because they primarily focused on machine learning approaches, sensor development, segmentation methods, or image restoration. The physiological variables evaluated across the studies are summarized in Figure 4.
Figure 4.
Distribution of physiological variables assessed in the 88 included studies. The proportion of studies classified under the “Others” category reflects the wide range of physiological, structural, and phenological traits evaluated using spectral methods.
In terms of sensor usage, multispectral systems were the most frequently used, representing 40.7 percent of all studies, followed by sensors mounted on unmanned aerial vehicles, which accounted for 25.9 percent. Hyperspectral instrumentation appeared in 18.5 percent of the studies, reflecting the growing interest in high-spectral-resolution sensors for physiological characterization. Proximal spectrophotometry presented a lower proportion of use, corresponding to 7.4 percent, and was primarily employed as a reference method for validating optical measurements. Satellite sensors and RGB cameras each represented 3.7 percent, since most experimental designs required spatial resolutions higher than those typically provided by orbital or standard RGB imagery.
Regarding the physiological variables assessed, a large proportion of studies fell within a category that did not specify a single physiological trait or combined heterogeneous indicators, which accounted for 79.54 percent of all records. Among the explicit parameters reported, chlorophyll content represented 7.955% and stress analysis represented 7.955%. Water content was evaluated in 3.49 percent of the studies, and secondary pigments in 1.136 percent. Table 5 summarizes the distribution of physiological variables documented.
Table 5.
Physiological variables examined in the included studies.
The category labeled as “Others” in Figure 4 and Table 5 includes studies that do not focus on a single physiological variable, but rather address multiple physiological traits simultaneously or focus on structural, phenological, or classification-related variables derived from spectral data. These include biomass estimation, leaf area index, canopy cover, plant vigor, disease detection, nutrient status, and general vegetation condition assessments. Because many studies combined several indices and physiological indicators, they could not be assigned to a single specific physiological category.
This large proportion reflects not a methodological inconsistency but rather the inherently integrative nature of spectral analysis in plant science. Multispectral and spectrophotometric approaches often capture complex physiological and structural interactions simultaneously, making strict categorization difficult. Therefore, the “Others” category highlights the interdisciplinary application of these techniques and suggests that the field is evolving toward multi-variable and holistic plant assessment frameworks rather than isolated physiological measurements. However, this also indicates a lack of standardized reporting and categorization across studies, which may limit comparability and reproducibility.
3.3. Methodologies Reported in the Studies
The studies employed diverse procedures for spectral acquisition and processing. Radiometric calibration with white panels or internal references was common, together with geometric correction and orthomosaic generation in studies using unmanned aerial vehicles. The calculation of vegetation indices was frequently adopted as the primary approach for estimating physiological traits. Statistical and machine learning methods, including linear regression models, partial least squares regression, Random Forest, support vector machines, and, in recent studies, convolutional neural networks, were used to predict physiological variables.
Although the predominant approach was noninvasive, several studies compared spectral measurements with destructive laboratory techniques such as chlorophyll extraction, gravimetric water content determination, or SPAD measurements. These comparisons demonstrated consistent correlations between the two approaches.
Risk-of-bias evaluation showed that most studies exhibited low to moderate risk in the sampling and measurement domains but a high prevalence of incomplete reporting, particularly regarding acquisition metadata, calibration procedures and validation datasets. Analytical bias was common in studies relying solely on single-date measurements or lacking external validation. Reporting bias was identified in studies that omitted environmental conditions, number of samples, or sensor specifications. Overall, the distribution of risk of bias suggests that the robustness of multispectral trait estimation may be affected by incomplete methodological transparency.
3.4. Vegetation Indices Identified
The distribution of sensor types showed that multispectral systems were the most frequently used, representing 40.7% of the included studies, followed by UAV-based platforms (25.9%) and hyperspectral sensors (18.5%). Proximal spectrophotometry accounted for 7.4% of the studies, while satellite and RGB systems each represented 3.7%.
Regarding vegetation indices, NDVI was the most frequently reported index, appearing in approximately 87% of the studies, mainly for estimating vegetation vigor, biomass, and canopy structure. Other commonly used indices included NDRE, GNDVI, PRI, and MCARI, particularly for chlorophyll estimation and stress detection. An extended list of vegetation indices is provided in the Supplementary Materials.
3.5. Assessment of Methodological Quality
Most of the included studies were classified as high quality because they presented clearly defined objectives, replicable methodologies, and adequate statistical analyses. A smaller subset were classified as medium quality owing to partial methodological descriptions or the absence of uncertainty reporting. Only a few studies were classified as low quality, mainly owing to insufficient methodological detail or lack of validation through field measurements. Table 1 presents a summary of the quality assessment.
3.6. General Synthesis of Findings
Across the studies analyzed, noninvasive reflectance-based methods demonstrated a strong capacity to estimate multiple physiological properties and achieve strong correlations with destructive measurements. Vegetation indices that employed the red-edge and near-infrared bands were the most robust for chlorophyll and vigor estimation. SWIR-based indices showed greater sensitivity to water content. Multivariate models and machine learning approaches yielded substantial improvements in predictive accuracy compared with single indices. Despite these advances, only limited evidence was found for applications in cacti and desert species such as Stenocereus spp., indicating the need for further research in these groups.
3.7. Risk-of-Bias Assessment
The risk of bias for each included study was evaluated using an adapted version of the ROBINS-I framework tailored to multispectral and spectrophotometric vegetation research. Five methodological domains were assessed: (1) sample selection bias, (2) spectral acquisition bias, (3) measurement and calibration bias, (4) analytical bias, and (5) reporting bias. Each domain was rated as low, moderate, high, or unclear risk according to predefined operational criteria.
Sample selection bias was evaluated by examining the adequacy of the sample size, the objectivity of selection criteria, and the representativeness of biological and phenological variability. Spectral acquisition bias was assessed on the basis of illumination stability, sensor viewing geometry, environmental conditions, and the repeatability of the acquisition protocol. Measurement and calibration bias was evaluated by verifying the use of traceable reflectance panels, the application of radiometric corrections, and the reporting of spectral range and bandwidth. Analytical bias was assessed by reviewing the use of appropriate vegetation indices, the presence of overfitting signals, and the robustness of validation procedures (such as k-fold, leave-one-out, or independent test sets). Reporting bias was evaluated by determining whether metadata, acquisition settings, calibration parameters, uncertainty metrics, and less favorable results were fully disclosed.
A global risk-of-bias rating was assigned to each study following a hierarchical rule: studies with exclusively low risk ratings or at most one moderate rating were classified as low global risk; studies with multiple moderate ratings but no high ratings were classified as moderate global risk; any study with high risk in at least one domain was considered high global risk; and studies lacking sufficient methodological detail in two or more domains were classified as unclear risk. Overall, most studies were judged to have a low to moderate risk of bias, with the highest concerns in the acquisition and calibration domains Table 6.
Table 6.
Partial risk-of-bias assessment of selected studies using the adapted ROBINS-I tool.
3.8. Assessment of Reporting Bias
3.8.1. Methods
In accordance with the PRISMA 2020 guidelines and considering the qualitative nature of this review, potential reporting biases were evaluated through a methodological approach focused on the transparency, completeness, and availability of information across the included studies. Each article was examined to determine whether preregistered protocols, Supplementary Materials, or accessible spectral datasets were provided, enabling comparison between planned and reported outcomes. Backward and forward citation tracking was also conducted to identify relevant studies that may not have been retrieved by database searches alone, thereby reducing the likelihood of missing records due to publication visibility or selective dissemination. Gray literature repositories were screened to assess the presence of non-peer-reviewed or unpublished work that could indicate systematic reporting patterns. Because the high methodological heterogeneity precluded any form of meta-analysis—including variability in sensors, spectral preprocessing, vegetation indices, and physiological traits—statistical assessments such as funnel plots or asymmetry tests were not applicable. Consequently, the evaluation of reporting bias relied on a qualitative appraisal of the extent to which studies documented their methodological procedures, spectral processing workflows, and principal findings.
3.8.2. Results
The overall assessment indicated a moderate risk of reporting bias among the included studies. Although most publications provided general methodological descriptions, only a limited number offered complete protocols, comprehensive Supplementary Files, or access to raw spectral data, which restricts the ability to detect omitted outcomes or divergences between intended and reported analyses. Several studies presented only summarized vegetation index values or physiological metrics without detailing critical steps such as radiometric calibration, exclusion criteria for spectral signatures, or preprocessing decisions, which can impair reproducibility and hinder meaningful comparison. Moreover, some publications did not include full spectral reflectance curves or contextual information regarding intraspecific variability or environmental conditions, factors that may influence which results are ultimately reported. Citation tracking did not reveal clear evidence of unpublished negative findings; however, the predominance of studies reporting significant associations suggests that publication bias cannot be fully excluded. These observations are consistent with previously recognized limitations in reflectance-based and optical trait extraction studies and are further addressed in the Limitations section to contextualize their potential influence on the narrative synthesis.
3.9. Certainty of Evidence
3.9.1. Methods
The certainty of the evidence was considered in alignment with PRISMA 2020 recommendations, although a formal GRADE assessment was not applicable owing to the substantial methodological heterogeneity observed across studies. Variability in sensors, spectral resolutions, vegetation indices, physiological traits, data acquisition protocols, and preprocessing procedures prevented the definition of comparable outcomes or effect measures. Instead, overall confidence in the body of evidence was examined qualitatively by assessing the methodological rigor, transparency, and reproducibility of each study, as well as the consistency of findings across different sensor types and spectral approaches. Particular attention was given to the clarity of spectral calibration procedures, documentation of environmental conditions, sample sizes, and reporting of spectral variability, as these elements directly influence the interpretability and reliability of optical plant trait assessments.
3.9.2. Results
The qualitative appraisal indicated a moderate level of certainty across the evidence base. Several studies demonstrated robust methodological design, detailed spectral workflows, and consistent associations between multispectral or hyperspectral features and physiological traits. However, confidence was limited in other cases by incomplete reporting of calibration steps, insufficient description of spectral processing, small sample sizes, or the absence of raw reflectance data. The diversity of instruments and protocols further contributed to reduced comparability across studies, restricting the ability to draw high-certainty conclusions for specific vegetation indices or trait-extraction methods. Nevertheless, recurring patterns, such as the sensitivity of pigment-related indices, the reliability of red-edge variables, and the utility of non-destructive spectral signatures for stress detection, supported a moderate confidence rating within the scope of this narrative synthesis. These considerations are reflected in the Discussion and Limitations sections, where the interpretive implications of these constraints are addressed in detail.
4. Theoretical Framework
4.1. Invasive and Noninvasive Methods
Traditional physiological measurements relied on destructive techniques such as chemical pigment extraction. Although precise, these methods are labor intensive and unsuitable for repeated measurements [41,111,112]. Noninvasive reflectance-based techniques have replaced them owing to their ability to quantify multiple parameters without damaging plant tissue, operate at a field scale, detect early stress, and correlate reflectance with physiological variables [113,114]. A simplified comparison is shown in Figure 5.
Figure 5.
General comparison between invasive and noninvasive techniques for physiological measurements.
4.2. Fundamentals of Spectral Analysis in Plants
Spectral analysis is based on the interaction between electromagnetic radiation and plant tissues [115]. When light reaches a leaf, part of the energy is absorbed, reflected, and transmitted. This response depends on pigment composition, internal scattering, and water content [116,117]. As shown in Figure 6, absorption is mainly driven by photosynthetic pigments, reflectance by mesophyll structure, and transmittance by leaf thickness and water distribution [75,118].
Figure 6.
Spectral interaction between radiation and a leaf, showing absorption, reflectance, and transmittance.
Spectral reflectance is defined mathematically as
where is the reflected radiance and is the incident radiance [105,119]. Vegetation reflectance is distributed across three main spectral regions: the visible range (400–700 nm), dominated by chlorophyll absorption; the near-infrared region (700–1100 nm), characterized by high reflectance due to internal scattering; and the shortwave infrared region (1300–2500 nm), influenced by leaf water content [120,121,122].
4.3. Spectral Signatures
A spectral signature represents reflectance as a function of wavelength and is associated with pigment concentration, leaf anatomy, and water status [123]. These signatures are acquired using spectrophotometers, spectrometers or spectroradiometers with dark-reference calibration, a standardized white panel, and controlled integration times [124]. Because they detect variations related to stress, nutrient deficiency, or senescence, spectral signatures are fundamental for phenotyping and precision agriculture [35,125].
A typical spectral signature of a healthy leaf is shown in Figure 7.
Figure 7.
Typical reflectance curve of a healthy leaf across the visible, near-infrared (NIR), and shortwave infrared (SWIR) regions.
4.4. Multispectral Imaging
Multispectral imaging captures spatial and spectral information in discrete wavelength bands, typically across the visible, red-edge, and near-infrared regions [36]. These data can be acquired from UAVs, ground platforms, or satellites [42,126]. The general workflow is shown in Figure 8.
Figure 8.
General workflow for multispectral analysis, including acquisition, geometric correction, orthomosaic generation, index calculation and temporal-spatial analysis [127].
This workflow includes radiometric calibration to convert digital numbers into reflectance, geometric correction and orthomosaic generation for spatial alignment, segmentation to isolate vegetation, and vegetation index calculation to infer physiological attributes [128,129,130]. These noninvasive measurements enable repeated monitoring of plant health, pigment concentration, water content, senescence, and stress responses across spatial and temporal scales [38].
4.5. Vegetation Indices
Vegetation indices are mathematical combinations of reflectance at specific wavelengths designed to enhance physiological or structural vegetation attributes. Table 7 summarizes the main indices used in the literature.
Table 7.
Vegetation indices and their corresponding equations.
Vegetation indices transform spectral signals into quantitative indicators of physiological status [105,143]. These indices are widely used in remote sensing to monitor vegetation condition and physiological dynamics.
4.6. Remote Sensing
Remote sensing refers to the acquisition and interpretation of electromagnetic radiation reflected or emitted by vegetation without physical contact, enabling plant observation across spatial and temporal scales [40,144]. Spectral information captured from leaves to landscapes encodes patterns related to pigments, water content, structure and phenology, supporting biodiversity assessment and functional trait characterization.
Environmental conditions influence vegetation index behavior. Illumination geometry, atmospheric variability, soil background, and sensor calibration can modify index values, making radiometric calibration and standardized acquisition protocols essential when estimating chlorophyll dynamics or stress responses [11,108]. Remote sensing can also detect physiological changes before visible symptoms appear, particularly using red-edge indices that are sensitive to chlorophyll variation and senescence [145,146]. The integration of multispectral and hyperspectral data from satellites, aircraft, or UAVs enables trait estimation and stress detection in agricultural and natural ecosystems, particularly in arid regions where species such as Stenocereus spp. exhibit distinct optical features [25,147].
4.7. Spectral Processing and Analysis
Segmentation and vegetation isolation are essential for extracting physiological traits from multispectral images [148]. After radiometric calibration and band selection, algorithms distinguish vegetation from soil or shadows using color space transformations (RGB, HSV, HSL, Lab), spectral index thresholding such as NDVI, or clustering methods such as K-means and Gaussian Mixture Models. Object-based image analysis (OBIA) approaches are commonly applied to high-resolution orthomosaics [37,149,150].
Segmented data are incorporated into predictive models such as partial least squares regression, Random Forest, support vector machines, and deep learning architectures (including convolutional neural networks and U-Net) [151]. These methods enable reproducible estimation of physiological, structural, and phenological attributes. Table 8 summarizes the main segmentation and classification methods identified.
Table 8.
Comparison of classification and segmentation methods in multispectral plant imaging.
5. Discussion
The findings of this systematic review indicate that vegetation indices (VIs) and spectral signatures remain core tools for the non-destructive estimation of physiological and structural properties in plants. Among the 96 included studies, NDVI was used in 87% of cases, whereas red-edge-based indices (NDRE, MCARI, TCARI) and pigment-related indices (ARI, CRI) appeared less frequently. This predominance is consistent with foundational work on the biophysical interpretation of vegetation indices [12,131] and reflects the continued relevance of the NIR and red-edge bands for monitoring chlorophyll content, canopy vigor, and early stress responses [156,157].
Sensor usage patterns were consistent with recent technological trends. Multispectral sensors represented 40.7% of the included studies, whereas hyperspectral systems accounted for 18.5%. The widespread use of multispectral UAV-based platforms reflects ongoing improvements in radiometric calibration protocols and sensor characterization [130]. In contrast, proximal spectrophotometry appeared in only 7.4% of studies, confirming its role primarily as a reference standard for validating reflectance captured by UAV- or satellite-based sensors [123,158].
Regarding the physiological variables evaluated, chlorophyll content (8%) and stress-related indicators (8%) were the most frequently reported, whereas water content (3.4%) and secondary pigments (1.1%) appeared less commonly. This pattern is consistent with the established sensitivity of the red-edge and NIR regions to photosynthetic activity and stress [107]. The large proportion of studies classified as “other” 79.5% reveals substantial thematic diversity and suggests that many publications did not explicitly define a physiological variable or addressed parameters outside classical physiological categories.
Methodologically, segmentation and spectral processing strategies varied widely. NDVI-based thresholding, K-means clustering, and machine learning classifiers (Random Forest, SVM) remained the most common approaches for vegetation extraction [25,159]. Recent studies employing deep learning demonstrated notable improvements in pixel-level segmentation and trait prediction, particularly in complex scenes [75]. However, these approaches require large labeled datasets and extensive computational resources, which may limit their adoption in settings with constrained infrastructure.
A significant gap identified in this review concerns vegetation from arid and semi-arid ecosystems. Only a small subset of studies focused on cacti or xerophytic species, despite their ecological importance. Research on Stenocereus spp. remains especially scarce. This gap is consistent with recent work indicating that the optical properties of cacti differ substantially from those of mesophytic plants owing to distinctive epidermal, structural, and water-storage traits [109]. Consequently, model generalization across ecosystems remains limited.
Variability in acquisition protocols, spectral calibration methods, and preprocessing workflows continues to be a major barrier to reproducibility. Several studies failed to report essential details such as illumination conditions, panel reflectance specifications, sensor configuration, or UAV flight parameters. These shortcomings have been previously highlighted as critical limitations in spectral and multispectral studies [160]. Establishing standardized guidelines for spectral acquisition, radiometric calibration, and segmentation workflows would substantially improve comparability across studies.
Furthermore, beyond the frequency of use, a comparison across studies revealed that vegetation indices based on the red-edge and near-infrared regions showed greater consistency for chlorophyll and vigor estimation, while indices incorporating shortwave infrared bands were more sensitive to plant water content. NDVI was the most widely used index; however, several studies reported saturation effects in dense vegetation and limited sensitivity to early stress conditions. In contrast, indices such as NDRE, PRI, and MCARI demonstrated improved sensitivity to physiological changes, particularly under stress conditions.
In addition, regarding sensor types, UAV-mounted multispectral cameras were the most commonly used owing to their balance between spatial resolution and operational flexibility, although their performance strongly depended on radiometric calibration and illumination conditions. Proximal spectrophotometry and hyperspectral sensors provided higher spectral resolution and more precise physiological information but were limited by cost, data volume, and operational complexity. Across studies, one of the main limitations identified was the lack of standardized calibration protocols, which limited the transferability of models between different sensors and environmental conditions.
From a modeling perspective, machine learning methods demonstrated strong predictive capacity for estimating physiological traits from spectral data, particularly when combining multiple vegetation indices and spectral bands. These approaches allow modeling of nonlinear relationships and can improve estimation accuracy compared with traditional regression methods. However, several studies reported risks associated with overfitting, limited sample sizes, and lack of independent validation datasets, which may reduce model transferability across different environmental conditions, species, or sensors. Therefore, while machine learning represents a powerful tool for spectral analysis, its application requires careful validation and transparent reporting of training and testing procedures.
Finally, beyond the individual results of each study, the evaluation of methodological quality and risk of bias provides important context for interpreting the reliability of the reported findings. It is important to distinguish between methodological quality assessment and risk-of-bias evaluation. Methodological quality refers to the overall rigor of the study design, data acquisition procedures, and reporting transparency, whereas risk of bias refers to potential systematic errors that may affect the validity of the results, such as sampling bias, calibration limitations, overfitting, or incomplete methodological reporting. In this review, methodological quality and risk of bias were evaluated separately to provide a more comprehensive assessment of the internal rigor, reliability, and limitations of the included studies.
The large proportion of studies classified under the “Others” category suggests that spectral methods are often used to estimate multiple physiological or structural traits simultaneously rather than focusing on a single physiological parameter. This reflects the interdisciplinary nature of spectral analysis, which integrates physiological, structural, and phenological information, but it also indicates a lack of standardization in the definition and classification of physiological variables across studies.
From a practical standpoint, the widespread use of NDVI across the reviewed studies, despite its known limitations such as saturation in dense vegetation and sensitivity to soil background effects, indicates that NDVI remains a widely accepted general indicator of vegetation vigor owing to its simplicity, low data requirements, and compatibility with multiple sensors. However, several studies reported improved sensitivity when using red-edge-based or SWIR-based indices, suggesting that more specialized indices may provide more accurate estimation of specific physiological traits such as chlorophyll content or water status.
Limitations
This review was conducted under a preregistered protocol in OSF and followed the PRISMA 2020 guidelines. Several limitations should nevertheless be acknowledged. Methodological heterogeneity across studies prevented quantitative comparisons and the development of a meta-analysis. Variability in sensor types, spectral bands, radiometric calibration procedures, acquisition platforms, segmentation techniques, and validation metrics restricted the ability to evaluate methodological quality consistently.
Incomplete reporting of essential procedural details such as illumination conditions, reference panels, integration times, segmentation thresholds, or model performance criteria further limited reproducibility. Restricting the search to studies in English and Spanish may have excluded relevant work published in other languages. Potential publication bias is also possible because studies with negative or inconclusive findings are less frequently reported.
6. Conclusions
This systematic review synthesized evidence from 96 studies that employed multispectral, hyperspectral, and spectrophotometric techniques to estimate physiological and structural traits in plants. The findings indicate that these optical methods have been consistently used to quantify chlorophyll and other pigments, water status, biomass, leaf area, and general indicators of stress, reflecting their broad applicability across species and acquisition platforms.
In relation to the PICO question guiding this review, the included studies showed the following: (1) the physiological traits most frequently assessed through spectral analysis involve photosynthetic and pigment-related variables, water content, and biophysical canopy properties; and (2) the methodologies most commonly applied include vegetation index calculation, radiometric and geometric calibration, leaf-level spectrophotometry, UAV-based multispectral imaging, and computational techniques for feature extraction.
Owing to the substantial heterogeneity observed in sensor configurations, acquisition conditions, index formulations, and validation procedures, no quantitative meta-analysis was feasible. Methodological quality was generally moderate, although incomplete reporting of calibration protocols, sampling conditions, and validation steps was frequent, limiting the comparability of results.
Overall, multispectral and spectrophotometric methods represent reliable tools for extracting key physiological information in plants; however, methodological variability and gaps in reporting constrain the generalization of results. Increasing standardization in acquisition and validation practices, along with broader coverage of underrepresented taxa, would enhance the robustness and comparability of future research in this field.
Future research should prioritize the standardization of spectral acquisition protocols, including calibration procedures, illumination control, sensor configuration, and spectral preprocessing methods, to improve comparability and reproducibility across studies. Additional research is particularly needed in arid and semiarid species, especially in cacti such as Stenocereus spp., where physiological trait estimation using spectral data remains limited. The development of transferable models across sensors and environmental conditions will be essential for practical applications in precision agriculture, irrigation management, early stress detection, and ecological monitoring in dryland ecosystems.
Supplementary Materials
The following supporting information can be downloaded at: https://www.mdpi.com/article/10.3390/agriengineering8050162/s1, PRISMA 2020 Checklist [34].
Author Contributions
Conceptualization, R.J.P.-C. and J.U.M.-M.; methodology, R.J.P.-C. and C.A.R.-R.; validation, R.J.P.-C.; formal analysis, R.J.P.-C.; investigation, R.J.P.-C.; data curation, R.J.P.-C.; writing—original draft preparation, R.J.P.-C.; writing—review and editing, J.U.M.-M., C.A.R.-R., J.M.E.-A., R.S.-A., and A.B.-G.; visualization, R.J.P.-C.; supervision, J.U.M.-M. and C.A.R.-R.; project administration, J.U.M.-M. All authors have read and agreed to the published version of the manuscript.
Funding
This research received no external funding.
Institutional Review Board Statement
Not applicable. This study is a systematic review of previously published literature and did not involve experiments with human participants or animals.
Informed Consent Statement
Not applicable. The study did not involve human participants.
Data Availability Statement
The data generated and analyzed during this study are available in the Open Science Framework (OSF) repository: https://osf.io/h95ju/overview (accessed on 14 January 2026).
Acknowledgments
The authors acknowledge the support of their respective institutions, including the Universidad Autónoma de Zacatecas, Universidad de Guanajuato, and Universidad Politécnica de Guanajuato. R.J. Pérez-Chimal gratefully acknowledges the academic support and scholarship provided by the SECIHTI CVU 290119 program, which contributed to the development and completion of this research.
Conflicts of Interest
The authors declare no conflicts of interest. The authors alone are responsible for the content and writing of this article.
Abbreviations
The following abbreviations are used in this manuscript:
| NDVI | Normalized Difference Vegetation Index |
| PRI | Photochemical Reflectance Index |
| CARI | Chlorophyll Absorption Ratio Index |
| SR | Simple Ratio |
| GRVI | Green–Red Vegetation Index |
| ARI | Anthocyanin Reflectance Index |
| CRI | Carotenoid Reflectance Index |
| SWIR | Short-Wave Infrared |
| VNIR | Visible and Near-Infrared |
| UAV | Unmanned Aerial Vehicle |
| ROI | Region of Interest |
| PICO | Population, Intervention, Comparison, Outcome |
| OSF | Open Science Framework |
| PRISMA | Preferred Reporting Items for Systematic Reviews and Meta-Analyses |
Appendix A
Table A1.
Methodological quality classification of all included studies.
Appendix B
Table A2.
Characteristics of the studies included in the systematic review.
Appendix C
Table A3.
Risk-of-bias assessment of the included studies using the adapted ROBINS-I tool.
Table A4.
PRISMA 2020 checklist for this systematic review.
References
- Zhuang, S.; Wang, P.; Jiang, B. Vegetation extraction in the field using multi-level features. Biosyst. Eng. 2020, 197, 352–366. [Google Scholar] [CrossRef] [Scilit]
- Jacquemoud, S.; Ustin, S.L. Leaf Optical Properties; Cambridge University Press: Cambridge, UK, 2019. [Google Scholar] [CrossRef] [Scilit]
- Liu, C.; Pinto, F.; Cossani, C.M.; Sukumaran, S.; Reynolds, M.P. Spectral reflectance indices as proxies for yield potential and heat stress tolerance in spring wheat: Heritability estimates and marker-trait associations. Front. Agric. Sci. Eng. 2019, 6, 296. [Google Scholar] [CrossRef] [Scilit]
- Adiri, Z.; Lhissou, R.; Harti, A.; Jellouli, A.; Chakouri, M. Recent advances in the use of public domain satellite imagery for mineral exploration: A review of Landsat-8 and Sentinel-2 applications. Ore Geol. Rev. 2020, 117, 103332. [Google Scholar] [CrossRef] [Scilit]
- Li, Y.; Chen, H.; Song, B.W.; Zhang, H. Vegetation pixels extraction based on red-band enhanced normalized difference vegetation index. In Proceedings of the Remote Sensing and GIS for Hydrology and Water Resources, Chengdu, China, 20–23 May 2016; Volume 10033. [Google Scholar] [CrossRef] [Scilit]
- Wong, C. Plant optics: Underlying mechanisms in remotely sensed signals for phenotyping applications. AoB Plants 2023, 15, plad039. [Google Scholar] [CrossRef] [Scilit] [PubMed]
- Zarco-Tejada, P.J.; Miller, J.R.; Morales, A.; Berjón, A.; Agüera, J. Hyperspectral indices and model simulation for chlorophyll estimation in open-canopy tree crops. Remote Sens. Environ. 2004, 90, 463–476. [Google Scholar] [CrossRef] [Scilit]
- Pôcas, I.; Rodrigues, A.; Gonçalves, S.; Costa, P.; Gonçalves, I.; Pereira, L.S.; Cunha, M. Predicting grapevine water status based on hyperspectral reflectance vegetation indices. Remote Sens. 2015, 7, 16460–16479. [Google Scholar] [CrossRef] [Scilit]
- Prey, L.; Hu, Y.; Schmidhalter, U. High-throughput field phenotyping traits of grain yield formation and nitrogen use efficiency: Optimizing the selection of vegetation indices and growth stages. Front. Plant Sci. 2020, 10, 1640. [Google Scholar] [CrossRef] [Scilit]
- Cao, Q.; Yang, G.; Wang, F.; Chen, L.; Xu, B.; Zhao, C.; Duan, D.; Jiang, P.; Xu, Z.T.; Yang, H. Discrimination of tea plant variety using in-situ multispectral imaging system and multi-feature analysis. Comput. Electron. Agric. 2022, 202, 107360. [Google Scholar] [CrossRef] [Scilit]
- Haque, A.; Reza, N.; Ali, M.; Karim, R.; Ahmed, S.; Lee, K.D.; Khang, Y.H.; Chung, S.O. Effects of environmental conditions on vegetation indices from multispectral images: A review. Korean J. Remote Sens. 2024, 40, 319–341. [Google Scholar]
- Jackson, R.D.; Huete, A.R. Interpreting vegetation indices. Prev. Vet. Med. 1991, 11, 185–200. [Google Scholar] [CrossRef] [Scilit]
- Boiarskii, B. Comparison of NDVI and NDRE indices to detect differences in vegetation and chlorophyll content. J. Mech. Contin. Math. Sci. 2019, 4, 20–29. [Google Scholar] [CrossRef] [Scilit]
- Voitik, A.; Kravchenko, V.; Pushka, O.; Kutkovetska, T.; Shchur, T.; Kocira, S. Comparison of NDVI, NDRE, MSAVI and NDSI indices for early diagnosis of crop problems. Agric. Eng. 2023, 27, 47–57. [Google Scholar] [CrossRef] [Scilit]
- Morales, A.; Guerra, R.; Horstrand, P.; Diaz, M.; Jimenez, A.; Melian, J.; Lopez, S.; Lopez, J.F. A multispectral camera development: From the prototype assembly until its use in a UAV system. Sensors 2020, 20, 6129. [Google Scholar] [CrossRef] [Scilit] [PubMed]
- Laveglia, S.; Altieri, G.; Genovese, F.; Matera, A.; Scarano, L.; Di Renzo, G. Development of a short-range multispectral camera calibration method for geometric image correction and health assessment of baby crops in greenhouses. Appl. Sci. 2025, 15, 2893. [Google Scholar] [CrossRef] [Scilit]
- Gitelson, A.A.; Merzlyak, M.N.; Zur, Y.; Stark, R.; Gritz, U. Non-destructive and remote sensing techniques for estimation of vegetation status. Pap. Nat. Resour. 2001, 273, 205–210. [Google Scholar]
- Falcioni, R.; Moriwaki, T.; Pattaro, M.; Furlanetto, R.H.; Nanni, M.R.; Antunes, W.C. High resolution leaf spectral signature as a tool for foliar pigment estimation displaying potential for species differentiation. J. Plant Physiol. 2020, 249, 153161. [Google Scholar] [CrossRef] [Scilit]
- Hurtado, E.; González-Vallejos, F.; Roper, C.; Bastías, E.; Mazuela, P. Propuesta para la determinación del contenido de clorofila en hojas de tomate. Idesia (Arica) 2017, 35, 129–130. [Google Scholar] [CrossRef] [Scilit]
- Estrada, F.; Flexas, J.; Araus, J.; Mora-Poblete, F.; Gonzalez-Talice, J.; Castillo, D.; Matus, I.; Méndez-Espinoza, A.; Garriga, M.; Araya-Riquelme, C.; et al. Exploring plant responses to abiotic stress by contrasting spectral signature changes. Front. Plant Sci. 2023, 13, 1026323. [Google Scholar] [CrossRef] [Scilit]
- Swoczyna, T.; Kalaji, H.M.; Bussotti, F.; Mojski, J.; Pollastrini, M. Environmental stress – What can we learn from chlorophyll a fluorescence analysis in woody plants? A review. Front. Plant Sci. 2022, 13, 1048582. [Google Scholar] [CrossRef] [Scilit]
- Liew, O.; Chong, P.; Li, B.; Asundi, A. Signature optical cues: Emerging technologies for monitoring plant health. Sensors 2008, 8, 3205–3239. [Google Scholar] [CrossRef] [Scilit]
- Kothari, S.; Schweiger, A.K. Plant spectra as integrative measures of plant phenotypes. J. Ecol. 2022, 110, 2536–2554. [Google Scholar] [CrossRef] [Scilit]
- Xue, J.; Su, B. Significant remote sensing vegetation indices: A review of developments and applications. J. Sens. 2017, 2017, 1353691. [Google Scholar] [CrossRef] [Scilit]
- Song, Y.; Peng, G.; Sun, D.; Xie, X. Active contours driven by Gaussian function and adaptive-scale local correntropy-based K-means clustering for fast image segmentation. Signal Process. 2020, 174, 107625. [Google Scholar] [CrossRef] [Scilit]
- Hernanda, R.A.P.; Lee, J.; Lee, H. Spectroscopy imaging techniques as in vivo analytical tools to detect plant traits. Appl. Sci. 2023, 13, 10420. [Google Scholar] [CrossRef] [Scilit]
- Mamaghani, B.; Salvaggio, C. Multispectral Sensor Calibration and Characterization for sUAS Remote Sensing. Sensors 2019, 19, 4453. [Google Scholar] [CrossRef] [Scilit] [PubMed]
- Cimtay, Y.; Özbay, B.; Yilmaz, G.; Bozdemir, E. A new vegetation index in short-wave infrared region of electromagnetic spectrum. IEEE Access 2021, 9, 148535–148545. [Google Scholar] [CrossRef] [Scilit]
- Roy, P.S. Spectral reflectance characteristics of vegetation and their use in estimating productive potential. Proc. Indian Acad. Sci.—Plant Sci. 1989, 99, 59–81. [Google Scholar] [CrossRef] [Scilit]
- Váczi, P.; Barták, M. Multispectral aerial monitoring of a patchy vegetation oasis composed of different vegetation classes: UAV-based study exploiting spectral reflectance indices. Czech Polar Rep. 2022, 12, 107–124. [Google Scholar] [CrossRef] [Scilit]
- Vuletić, J.; Car, M.; Orsag, M. Close-range multispectral imaging with Multispectral-Depth (MS-D) system. Biosyst. Eng. 2023, 227, 188–201. [Google Scholar] [CrossRef] [Scilit]
- Pérez-Chimal, R.J. Physiological Feature Extraction in Plants Through Multispectral Analysis and Spectrophotometry: A Systematic Review with Applications to Stenocereus spp. Open Science Framework (OSF). 2026. Available online: https://osf.io/h95ju (accessed on 14 January 2026).
- Innovation, V.H. Covidence Systematic Review Platform; Veritas Health Innovation Ltd.: Melbourne, Australia, 2023. [Google Scholar]
- Page, M.J.; McKenzie, J.E.; Bossuyt, P.M.; Boutron, I.; Hoffmann, T.C.; Mulrow, C.D.; Shamseer, L.; Tetzlaff, J.M.; Akl, E.A.; Brennan, S.E.; et al. The PRISMA 2020 statement: An updated guideline for reporting systematic reviews. BMJ 2021, 372, n71. [Google Scholar] [CrossRef] [Scilit]
- Acevedo-Correa, C.; Goez, M.; Torres-Madronero, M.; Rondon, T. Low-cost clamp for the measurement of vegetation spectral signatures. HardwareX 2024, 19, e00557. [Google Scholar] [CrossRef] [Scilit]
- Alparone, L.; Arienzo, A.; Garzelli, A. Spatial Resolution Enhancement of Vegetation Indexes via Fusion of Hyperspectral and Multispectral Satellite Data. Remote Sens. 2024, 16, 875. [Google Scholar] [CrossRef] [Scilit]
- Balasundaram, A.; Sharma, A.; Kumaravelan, S.; Shaik, A.; Kavitha, M. An improved normalized difference vegetation index (NDVI) estimation using grounded DINO and Segment Anything Model for plant health classification. IEEE Access 2024, 12, 75907–75919. [Google Scholar] [CrossRef] [Scilit]
- Burns, B.W.; Green, V.S.; Hashem, A.A.; Massey, J.H.; Shew, A.M.; Adviento-Borbe, M.A.A.; Milad, M. Determining nitrogen deficiencies for maize using various remote sensing indices. Precis. Agric. 2022, 23, 791–811. [Google Scholar] [CrossRef] [Scilit]
- Cárdenas, J.X.I.; Guisñan, P.A.B.; Orozco, A.P.F. Análisis de patrones de características de especies andinas de las reservas Chimborazo y Sangay utilizando el método k-means clustering. ConcienciaDigital 2020, 3, 224–236. [Google Scholar] [CrossRef] [Scilit]
- Cavender-Bares, J.; Gamon, J.A.; Townsend, P.A. Remote Sensing of Plant Biodiversity; Springer Nature: Berlin/Heidelberg, Germany, 2020. [Google Scholar]
- Chen, Y.R.; Chao, K.; Kim, M.S. Machine vision technology for agricultural applications. Comput. Electron. Agric. 2002, 36, 173–191. [Google Scholar] [CrossRef] [Scilit]
- Chen, Z.; Chen, H.; Dai, Q.; Wang, Y.; Hu, X. Estimation of soil moisture during different growth stages of summer maize under various water conditions using UAV multispectral data and machine learning. Agronomy 2024, 14, 2008. [Google Scholar] [CrossRef] [Scilit]
- Tiznado-Hernández, M.E.; Ojeda-Contreras, A.J.; Sánchez-Estrada, A.; Moreno-Velázquez, D.; Mercado-Ruiz, J.N. A model to predict the developmental stage of Stenocereus thurberi from pulp and skin colour. Bradleya 2004, 22, 77–84. [Google Scholar] [CrossRef] [Scilit]
- Ding, Y.; Wu, X.; Yu, H.; Jiang, Y.; Liu, Z.; Dou, X. A new method for measuring vegetation indices based on passive light source. Comput. Electron. Agric. 2021, 187, 106238. [Google Scholar] [CrossRef] [Scilit]
- Ain, A.; Gogoi, M.; Chutia, D. A new spectral index for vegetation extraction using satellite data. J. Appl. Nat. Sci. 2025, 17, 205. [Google Scholar] [CrossRef] [Scilit]
- Jin, H.; Eklundh, L. A physically based vegetation index for improved monitoring of plant phenology. Remote Sens. Environ. 2014, 152, 512–525. [Google Scholar] [CrossRef] [Scilit]
- Shah, S.H.; Angel, Y.; Houborg, R.; Ali, S.; McCabe, M.F. A random forest machine learning approach for the retrieval of leaf chlorophyll content in wheat. Remote Sens. 2019, 11, 920. [Google Scholar] [CrossRef] [Scilit]
- Luo, Y.; Wang, X.; Liao, Y.; Fu, Q.; Shu, C.; Wu, Y.; He, Y. A review of homography estimation: Advances and challenges. Electronics 2023, 12, 4977. [Google Scholar] [CrossRef] [Scilit]
- Zeng, L.; Wardlow, B.D.; Xiang, D.; Hu, S.; Li, D. A review of vegetation phenological metrics extraction using multispectral satellite data. Remote Sens. Environ. 2020, 237, 111511. [Google Scholar] [CrossRef] [Scilit]
- Huang, W.; Fei, X.; Yang, W.; Wang, Z.; Gao, Y.; Yan, H. A study on the classification of coastal wetland vegetation based on the Suaeda salsa index and its phenological characteristics. Ecol. Indic. 2025, 170, 113021. [Google Scholar] [CrossRef] [Scilit]
- Hernandez, M.T.; Contreras, A.O.; Estrada, A.S.; Velazquez, D.M.; Ruiz, J.M. A tool to predict fruiting in terms of number of days after anthesis based on fruit skin and pulp colour of pitaya (Stenocereus thurberi (Engelm.) Buxb.). J. Appl. Hortic. 2002, 4, 3–6. [Google Scholar] [CrossRef] [Scilit]
- Camps-Valls, G.; Campos-Taberner, M.; Moreno-Martínez, Á.; Walther, S.; Duveiller, G.; Cescatti, A.; Running, S.W. A unified vegetation index for quantifying the terrestrial biosphere. Sci. Adv. 2021, 7, eabc7447. [Google Scholar] [CrossRef] [Scilit] [PubMed]
- Beltrán-Orozco, M.C.; Oliva-Coba, T.G.; Gallardo-Velázquez, T.; Osorio-Revilla, G. Ácido ascórbico, contenido fenólico, y capacidad antioxidante de las variedades roja, cereza, amarilla y blanca del fruto del cactus de la pitaya (Stenocereus stellatus Riccobono). Agrociencia 2009, 43, 153–162. [Google Scholar]
- Santos Valle, S.; Kienzle, J. Agriculture 4.0—Agricultural Robotics and Automated Equipment for Sustainable Crop Production; Integrated Crop Management; FAO: Rome, Italy, 2020; Volume 24. [Google Scholar]
- Hariharan, J.; Ampatzidis, Y.; Abdulridha, J.; Batuman, O. An AI-based spectral data analysis process for recognizing unique plant biomarkers and disease features. Comput. Electron. Agric. 2023, 204, 107574. [Google Scholar] [CrossRef] [Scilit]
- Grasso, V.; Holthof, J.; Jose, J. An automatic unmixing approach to detect tissue chromophores from multispectral photoacoustic imaging. Sensors 2020, 20, 3235. [Google Scholar] [CrossRef] [Scilit]
- Roman-Gonzalez, A.; Vargas-Cuentas, N.I. Análisis de imágenes hiperespectrales. Rev. Ing. & Desarro. 2013, 9, 14–17. [Google Scholar]
- Szigarski, C.; Jagdhuber, T.; Baur, M.; Thiel, C.; Parrens, M.; Wigneron, J.P.; Entekhabi, D. Analysis of the radar vegetation index and potential improvements. Remote Sens. 2018, 10, 1776. [Google Scholar] [CrossRef] [Scilit]
- Mazis, A.; Choudhury, S.D.; Morgan, P.B.; Stoerger, V.; Hiller, J.; Ge, Y.; Awada, T. Application of high-throughput plant phenotyping for assessing biophysical traits and drought response in two oak species under controlled environment. For. Ecol. Manag. 2020, 465, 118101. [Google Scholar] [CrossRef] [Scilit]
- Apraez, L.S.C.; Pino, A.F.S.; Ossa, A.; Vasquez, C.I.; Solarte, J.D.; Cabrera, E.V.R.; Ruiz, S.E. Application of spectral imaging and vegetation index in Latin American coffee production: A systematic mapping. Land Degrad. Dev. 2025, 36, 337–349. [Google Scholar] [CrossRef] [Scilit]
- Shanmugapriya, P.; Rathika, S.; Ramesh, T.; Janaki, P. Applications of remote sensing in agriculture: A review. Int. J. Curr. Microbiol. Appl. Sci. 2019, 8, 2270–2283. [Google Scholar] [CrossRef] [Scilit]
- Dmitriev, P.A.; Kozlovsky, B.L.; Dmitrieva, A.A. Assessing the phenological state of evergreen conifers using hyperspectral imaging time series. Remote Sens. Appl. Soc. Environ. 2024, 36, 101342. [Google Scholar] [CrossRef] [Scilit]
- Kyratzis, A.C.; Skarlatos, D.P.; Menexes, G.C.; Vamvakousis, V.F.; Katsiotis, A. Assessment of vegetation indices derived by UAV imagery for durum wheat phenotyping under a water-limited and heat-stressed Mediterranean environment. Front. Plant Sci. 2017, 8, 1114. [Google Scholar] [CrossRef] [Scilit]
- Sahin, H.M.; Grieve, B.; Yin, H. Automatic multispectral image classification of plant virus from leaf samples. In Proceedings of the International Conference on Intelligent Data Engineering and Automated Learning; Springer: Cham, Switzerland, 2020; pp. 374–384. [Google Scholar] [CrossRef] [Scilit]
- Valencia Díaz, S. Estudio Cuantitativo de la Vegetación Perenne Asociada al Pitayo (Stenocereus queretaroensis (Web.) Buxb.) en la Cuenca de Sayula, Jalisco. Bachelor’s Thesis, Universidad de Guadalajara, Jalisco, Mexico, 1995. Available online: http://repositorio.cucba.udg.mx:8080/xmlui/handle/123456789/2755 (accessed on 1 February 2026).
- Villavicencio, G.E.E.; Arredondo, G.A.; Carranza, P.M.A.; Mares, A.O.; Comparan, S.S.; González, C.A. Cactáceas ornamentales del desierto Chihuahuense que se distribuyen en Coahuila, San Luis Potosí y Nuevo León, México; Libro Técnico No. 02; Instituto Nacional de Investigaciones Forestales, Agrícolas y Pecuarias (INIFAP), INIFAP Campo Experimental Saltillo: Saltillo, Coahuila, Mexico, 2010; 345p, ISBN 978-607-425-473-0. [Google Scholar]
- Lenk, S.; Chaerle, L.; Pfündel, E.E.; Langsdorf, G.; Hagenbeek, D.; Lichtenthaler, H.K.; Buschmann, C. Multispectral fluorescence and reflectance imaging at the leaf level and its possible applications. J. Exp. Bot. 2007, 58, 807–814. [Google Scholar] [CrossRef] [Scilit] [PubMed]
- Phattanajindakij, N.; Wannaboon, C. Classification of cactus disease based on infrared wavelength image processing. In Proceedings of the International Conference on Business and Industrial Research (ICBIR); IEEE: New York, NY, USA, 2022; pp. 364–367. [Google Scholar] [CrossRef] [Scilit]
- Mishra, P.; Asaari, M.S.M.; Herrero-Langreo, A.; Lohumi, S.; Diezma, B.; Scheunders, P. Close range hyperspectral imaging of plants: A review. Biosyst. Eng. 2017, 164, 49–67. [Google Scholar] [CrossRef] [Scilit]
- Mishra, P.; Lohumi, S.; Khan, H.A.; Nordon, A. Close-range hyperspectral imaging of whole plants for digital phenotyping: Recent applications and illumination correction approaches. Comput. Electron. Agric. 2020, 178, 105780. [Google Scholar] [CrossRef] [Scilit]
- Wan, L.; Li, Y.; Cen, H.; Zhu, J.; Yin, W.; Wu, W.; He, Y. Combining UAV-based vegetation indices and image classification to estimate flower number in oilseed rape. Remote Sens. 2018, 10, 1484. [Google Scholar] [CrossRef] [Scilit]
- Cao, X.; Yue, T.; Lin, X.; Lin, S.; Yuan, X.; Dai, Q.; Brady, D.J. Computational snapshot multispectral cameras: Toward dynamic capture of the spectral world. IEEE Signal Process. Mag. 2016, 33, 95–108. [Google Scholar] [CrossRef] [Scilit]
- Tian, H.; Wang, T.; Liu, Y.; Qiao, X.; Li, Y. Computer vision technology in agricultural automation—A review. Inf. Process. Agric. 2020, 7, 1–19. [Google Scholar] [CrossRef] [Scilit]
- Rosales-Bustamante, E.P.; Luna-Morales, C.D.C.; Cruz-León, A. Clasificación y selección tradicional de pitaya (Stenocereus pruinosus (Otto) Buxb.) en Tianguistengo, Oaxaca y variación morfológica de cultivares. Rev. Chapingo Ser. Hortic. 2009, 15, 75–82. [Google Scholar] [CrossRef] [Scilit]
- Ulku, I.; Akagündüz, E.; Ghamisi, P. Deep semantic segmentation of trees using multispectral images. IEEE J. Sel. Top. Appl. Earth Obs. Remote Sens. 2022, 15, 7589–7604. [Google Scholar] [CrossRef] [Scilit]
- Zhang, J.; Cong, S.; Zhang, G.; Ma, Y.; Zhang, Y.; Huang, J. Detecting pest-infested forest damage through multispectral satellite imagery and improved UNet++. Sensors 2022, 22, 7440. [Google Scholar] [CrossRef] [Scilit]
- Arnal Barbedo, J.G. Digital image processing techniques for detecting, quantifying and classifying plant diseases. SpringerPlus 2013, 2, 660. [Google Scholar] [CrossRef] [Scilit]
- Cruz-Cardenas, G.; Torres-Vazquez, E.; Ochoa-Estrada, S.; Silva-Garcia, J.T.; Cadena-Rodriguez, Y.J.; Flores-Magallon, R. Ecological niche and potential distribution of Stenocereus queretaroensis Weber in the Chapala subbasin, Mexico. Egypt. J. Bot. 2025, 65, 141–150. [Google Scholar] [CrossRef] [Scilit]
- Orozco, A.; Gardea, A.A.; Rascón-Chu, A.; Sánchez, A. Effect of salinity on seed germination, growth and metabolic activity of pitaya seedlings [Stenocereus thurberi (Engelm.) Buxb.]. J. Prof. Assoc. Cactus Dev. 2017, 19, 67–78. [Google Scholar] [CrossRef] [Scilit]
- Samarina, L.; Malyukova, L.; Koninskaya, N.; Malyarovskaya, V.; Ryndin, A.; Tong, W.; Khlestkina, E. Efficient vegetation indices for phenotyping of abiotic stress tolerance in tea plant (Camellia sinensis (L.) Kuntze). Heliyon 2024, 10, e35522. [Google Scholar] [CrossRef] [Scilit] [PubMed]
- Moghimi, A.; Yang, C.; Marchetto, P.M. Ensemble feature selection for plant phenotyping: A journey from hyperspectral to multispectral imaging. IEEE Access 2018, 6, 56870–56884. [Google Scholar] [CrossRef] [Scilit]
- Qiao, L.; Zhao, R.; Tang, W.; An, L.; Sun, H.; Li, M.; Liu, G. Estimating maize LAI by exploring deep features of vegetation index map from UAV multispectral images. Field Crops Res. 2022, 289, 108739. [Google Scholar] [CrossRef] [Scilit]
- Marcial-Pablo, M.D.J.; Gonzalez-Sanchez, A.; Jimenez-Jimenez, S.I.; Ontiveros-Capurata, R.E.; Ojeda-Bustamante, W. Estimation of vegetation fraction using RGB and multispectral images from UAV. Int. J. Remote Sens. 2019, 40, 420–438. [Google Scholar] [CrossRef] [Scilit]
- Duarte-Carvajalino, J.M.; Silva-Arero, E.A.; Góez-Vinasco, G.A.; Torres-Delgado, L.M.; Ocampo-Paez, O.D.; Castaño-Marín, A.M. Estimation of water stress in potato plants using hyperspectral imagery and machine learning algorithms. Horticulturae 2021, 7, 176. [Google Scholar] [CrossRef] [Scilit]
- Campos-Rojas, E.; Pinedo-Espinoza, J.M.; Campos-Montiel, R.G.; Hernández-Fuentes, A.D. Evaluación de plantas de pitaya (Stenocereus spp) de poblaciones naturales de Monte Escobedo, Zacatecas. Rev. Chapingo Ser. Hortic. 2011, 17, 173–182. [Google Scholar] [CrossRef] [Scilit]
- Ballester, C.; Zarco-Tejada, P.J.; Nicolás, E.; Alarcón, J.J.; Fereres, E.; Intrigliolo, D.S.; Gonzalez-Dugo, V.J.P.A. Evaluating the performance of xanthophyll, chlorophyll and structure-sensitive spectral indices to detect water stress in five fruit tree species. Precis. Agric. 2018, 19, 178–193. [Google Scholar] [CrossRef] [Scilit]
- Pesaresi, S.; Mancini, A.; Quattrini, G.; Casavecchia, S. Evaluation and selection of multi-spectral indices to classify vegetation using multivariate functional principal component analysis. Remote Sens. 2024, 16, 1224. [Google Scholar] [CrossRef] [Scilit]
- Glenn, D.M.; Tabb, A. Evaluation of five methods to measure normalized difference vegetation index (NDVI) in apple and citrus. Int. J. Fruit Sci. 2019, 19, 191–210. [Google Scholar] [CrossRef] [Scilit]
- Gahukar, R.T. Evaluation of plant-derived products against pests and diseases of medicinal plants: A review. Crop Prot. 2012, 42, 202–209. [Google Scholar] [CrossRef] [Scilit]
- Perry, C.R., Jr.; Lautenschlager, L.F. Functional equivalence of spectral vegetation indices. Remote Sens. Environ. 1984, 14, 169–182. [Google Scholar] [CrossRef] [Scilit]
- Zhang, Y.; Yang, W.; Sun, Y.; Chang, C.; Yu, J.; Zhang, W. Fusion of multispectral aerial imagery and vegetation indices for machine learning-based ground classification. Remote Sens. 2021, 13, 1411. [Google Scholar] [CrossRef] [Scilit]
- Tilly, N.; Aasen, H.; Bareth, G. Fusion of plant height and vegetation indices for the estimation of barley biomass. Remote Sens. 2015, 7, 11449–11480. [Google Scholar] [CrossRef] [Scilit]
- Xie, P.; Du, R.; Ma, Z.; Cen, H. Generating 3D multispectral point clouds of plants with fusion of snapshot spectral and RGB-D images. Plant Phenomics 2023, 5, 0040. [Google Scholar] [CrossRef] [Scilit] [PubMed]
- Kim, D.M.; Zhang, H.; Zhou, H.; Du, T.; Wu, Q.; Mockler, T.C.; Berezin, M.Y. Highly sensitive image-derived indices of water-stressed plants using hyperspectral imaging in SWIR and histogram analysis. Sci. Rep. 2015, 5, 15919. [Google Scholar] [CrossRef] [Scilit]
- Teodoro, P.E.; Teodoro, L.P.; Baio, F.H.; Silva Junior, C.A.; Santana, D.C.; Bhering, L.L. High-throughput phenotyping in maize and soybean genotypes using vegetation indices and computational intelligence. Plant Methods 2024, 20, 164. [Google Scholar] [CrossRef] [Scilit] [PubMed]
- Borana, S.L.; Yadav, S.K.; Parihar, S.K. Hyperspectral data analysis for arid vegetation species: Smart & sustainable growth. In Proceedings of the International Conference on Computing, Communication, and Intelligent Systems (ICCCIS); IEEE: New York, NY, USA, 2019; pp. 495–500. [Google Scholar] [CrossRef] [Scilit]
- Park, B.; Lu, R. Hyperspectral Imaging Technology in Food and Agriculture; Springer: New York, NY, USA, 2015. [Google Scholar] [CrossRef] [Scilit]
- Danilov, R.; Kremneva, O.; Pachkin, A. Identification of the spectral patterns of cultivated plants and weeds: Hyperspectral vegetation indices. Agronomy 2023, 13, 859. [Google Scholar] [CrossRef] [Scilit]
- Camargo, A.; Smith, J.S. Image pattern classification for the identification of disease causing agents in plants. Comput. Electron. Agric. 2009, 66, 121–125. [Google Scholar] [CrossRef] [Scilit]
- Pujari, J.D.; Yakkundimath, R.; Byadgi, A.S. Image processing based detection of fungal diseases in plants. Procedia Comput. Sci. 2015, 46, 1802–1808. [Google Scholar] [CrossRef] [Scilit]
- Pei, S.; Dai, Y.; Bai, Z.; Li, Z.; Zhang, F.; Yin, F.; Fan, J. Improved estimation of canopy water status in cotton using vegetation indices along with textural information from UAV-based multispectral images. Comput. Electron. Agric. 2024, 224, 109176. [Google Scholar] [CrossRef] [Scilit]
- Sun, Y.; Wang, B.; Zhang, Z. Improving leaf area index estimation with chlorophyll insensitive multispectral red-edge vegetation indices. IEEE J. Sel. Top. Appl. Earth Obs. Remote Sens. 2023, 16, 3568–3582. [Google Scholar] [CrossRef] [Scilit]
- Luo, Y.; Wang, X.; Wu, Y.; Shu, C. Infrared and visible image homography estimation using multiscale GAN. Electronics 2023, 12, 788. [Google Scholar] [CrossRef] [Scilit]
- Silva, C.M.; Mezzomo, H.C.; Ribeiro, J.P.O.; Signorini, V.S.; Lima, G.W.; Vieira, E.F.T.; Nardino, M. Insights on multi-spectral vegetation indices derived from UAV-based high-throughput phenotyping for indirect selection in tropical wheat breeding. Euphytica 2024, 220, 35. [Google Scholar] [CrossRef] [Scilit]
- Li, J.; Xiao, Z.; Sun, R.; Song, J. A method to estimate leaf area index from VIIRS surface reflectance using deep transfer learning. Isprs J. Photogramm. Remote Sens. 2023, 202, 512–527. [Google Scholar] [CrossRef] [Scilit]
- Qi, J.; Chehbouni, A.; Huete, A.R.; Kerr, Y.H.; Sorooshian, S. A modified soil adjusted vegetation index. Remote Sens. Environ. 1994, 48, 119–126. [Google Scholar] [CrossRef] [Scilit]
- Gamon, J.A.; Peñuelas, J.; Field, C.B. A narrow-waveband spectral index that tracks diurnal changes in photosynthetic efficiency. Remote Sens. Environ. 1992, 41, 35–44. [Google Scholar] [CrossRef] [Scilit]
- Rabab, S.; Breen, E.; Gebremedhin, A.; Shi, F.; Badenhorst, P.; Chen, Y.P.P.; Daetwyler, H. A new method for extracting individual plant bio-characteristics from high-resolution digital images. Remote Sens. 2021, 13, 1212. [Google Scholar] [CrossRef] [Scilit]
- Hartfield, K.; Gillan, J.K.; Norton, C.L.; Conley, C.; van Leeuwen, W.J. A novel spectral index to identify cacti in the sonoran desert at multiple scales using multi-sensor hyperspectral data acquisitions. Land 2022, 11, 786. [Google Scholar] [CrossRef] [Scilit]
- Huete, A.R. A soil-adjusted vegetation index (SAVI). Remote Sens. Environ. 1988, 25, 295–309. [Google Scholar] [CrossRef] [Scilit]
- Goebel, M.; Iwaszczuk, D. Spectral analysis of images of plants under stress using a close-range camera. ISPRS Arch. 2023, XLVIII-1/W3, 63–70. [Google Scholar] [CrossRef] [Scilit]
- Kandpal, K.C.; Kumar, A. Migrating from invasive to noninvasive techniques for enhanced leaf chlorophyll content estimation efficiency. Crit. Rev. Anal. Chem. 2023, 54, 2583–2598. [Google Scholar] [CrossRef] [Scilit]
- Xu, Y.; Li, X.; Du, H.; Mao, F.; Zhou, G.; Huang, Z.; Fan, W.; Chen, Q.; Ni, C.; Guo, K.Z. Improving extraction phenology accuracy using SIF coupled with the vegetation index and mapping the spatiotemporal pattern of bamboo forest phenology. Remote Sens. Environ. 2023, 293, 113785. [Google Scholar] [CrossRef] [Scilit]
- Houborg, R.; Soegaard, H.; Boegh, E. Combining vegetation index and model inversion methods for the extraction of key vegetation biophysical parameters using Terra and Aqua MODIS reflectance data. Remote Sens. Environ. 2007, 106, 39–58. [Google Scholar] [CrossRef] [Scilit]
- Jacquemoud, S.; Ustin, S.L. Modeling leaf optical properties. Photobiol. Sci. Online 2008, 7, 736–737. [Google Scholar]
- Khan, M.S.; Yadav, P.; Semwal, M.; Prasad, N.; Verma, R.K.; Kumar, D. Predicting canopy chlorophyll concentration in citronella crop using machine learning algorithms and spectral vegetation indices derived from UAV multispectral imagery. Ind. Crops Prod. 2024, 219, 119147. [Google Scholar] [CrossRef] [Scilit]
- Fontal, B. El Espectro Electromagnético y sus Aplicaciones; Escuela Venezolana para la Enseñanza de la Química; Universidad de Los Andes: Mérida, Venezuela, 2005. [Google Scholar]
- Meza, K.; Ruales, B.; Maiguashca, J.; Rivadeneira, J.L. Caracterización espectral de estrés hídrico en el cultivo de pepino dulce (Solanum muricatum). Geoespacial 2020, 17, 14–24. [Google Scholar]
- Daughtry, C.S.T. Estimating corn leaf chlorophyll concentration from leaf and canopy reflectance. Remote Sens. Environ. 2000, 74, 229–239. [Google Scholar] [CrossRef] [Scilit]
- Khan, Z.; Rahimi-Eichi, V.; Haefele, S.; Garnett, T.; Miklavcic, S. Estimation of vegetation indices for high-throughput phenotyping of wheat using aerial imaging. Plant Methods 2018, 14, 20. [Google Scholar] [CrossRef] [Scilit]
- Di Gennaro, S.F.; Rizza, F.; Badeck, F.W.; Berton, A.; Delbono, S.; Gioli, B.; Toscano, P.; Zaldei, A.; Matese, A. UAV-based high-throughput phenotyping to discriminate barley vigour with visible and near-infrared vegetation indices. Int. J. Remote Sens. 2018, 39, 5330–5344. [Google Scholar] [CrossRef] [Scilit]
- Rivera-Romero, C.A.; Palacios-Hernández, E.R.; Trejo-Durán, M.; Rodríguez-Liñán, M.D.C.; Olivera-Reyna, R.; Morales-Saldaña, J.A. Visible and near-infrared spectroscopy for detection of powdery mildew in Cucurbita pepo L. leaves. J. Appl. Remote Sens. 2020, 14, 044515. [Google Scholar] [CrossRef] [Scilit]
- Gitelson, A.A.; Zur, Y.; Chivkunova, O.B.; Merzlyak, M.N. Assessing carotenoid content in plant leaves with reflectance spectroscopy. Photochem. Photobiol. 2002, 73, 272–281. [Google Scholar] [CrossRef] [Scilit]
- Gante Diaz, S.A.; Lozano Hernández, Y.; Maldonado Trinidad, M.A.; Flores Colunga, G.R.; Villegas Piña, D. Integración de una cámara multiespectral y aprendizaje automático para clasificación de manzanas. Ing. Investig. Tecnol. 2022, 23, 1–13. [Google Scholar] [CrossRef] [Scilit]
- Xu, R.; Li, C.; Paterson, A. Multispectral imaging and unmanned aerial systems for cotton plant phenotyping. PLoS ONE 2019, 14, e0205083. [Google Scholar] [CrossRef] [Scilit]
- Marcial-Pablo, M.; Ontiveros-Capurata, R.; Jiménez-Jiménez, S.I.; Ojeda-Bustamante, W. Maize crop coefficient estimation based on spectral vegetation indices and vegetation cover fraction derived from UAV-based multispectral images. Agronomy 2021, 11, 668. [Google Scholar] [CrossRef] [Scilit]
- Meivel, S.; Maheswari, S. Monitoring of potato crops based on multispectral image feature extraction with vegetation indices. Multidimens. Syst. Signal Process. 2022, 33, 683–709. [Google Scholar] [CrossRef] [Scilit]
- Powney, E.P. Cálculo del número de puntos GPS para la corrección geométrica y generación de una ortoimagen de alta resolución en áreas de baja y mediana pendiente. Master’s Thesis, Universidad San Francisco de Quito, Colegio de Posgrados, Quito, Ecuador, 2012. [Google Scholar]
- Widiono, S.; Noersasongko, E.; Purwanto; Soeleman, M. Segmentation of stacked leaf images for enhanced visual monitoring using Gaussian mixture models (GMM) algorithms. In Proceedings of the 2023 6th International Seminar on Research of Information Technology and Intelligent Systems (ISRITI), Batam, Indonesia, 11 December 2023; pp. 59–64. [Google Scholar] [CrossRef] [Scilit]
- Guo, Y.; Senthilnath, J.; Wu, W.; Zhang, X.; Zeng, Z.; Huang, H. Radiometric calibration for multispectral camera of different imaging conditions mounted on a UAV platform. Sustainability 2019, 11, 978. [Google Scholar] [CrossRef] [Scilit]
- Rouse, W.; Haas, R.H. Monitoring vegetation systems in the Great Plains with ERTS. In Proceedings of the Third ERTS-1 Symposium. NASA Goddard Space Flight Center, Washington, DC, USA, 10–14 December 1974; Volume 1, pp. 309–317. [Google Scholar]
- Huete, A.; Didan, K.; van Leeuwen, W.; Jacobson, A.; Solano, R.; Laing, T. MODIS Vegetation Index (MOD13) Algorithm Theoretical Basis Document (ATBD); Technical report; NASA: Washington, DC, USA, 1999. [Google Scholar]
- Gitelson, A.A.; Kaufman, Y.J.; Merzlyak, M.N. Use of a green channel in remote sensing of global vegetation from EOS-MODIS. Remote Sens. Environ. 1996, 58, 289–298. [Google Scholar] [CrossRef] [Scilit]
- Zhou, X.; Huang, W.; Kong, W.; Ye, H.; Dong, Y.; Casa, R. Assessment of leaf carotenoids content with a new carotenoid index: Development and validation on experimental and model data. Int. J. Appl. Earth Obs. Geoinf. 2017, 57, 24–35. [Google Scholar] [CrossRef] [Scilit]
- Haberland, J.; Waller, P. Coincident detection of crop water stress, nitrogen status and canopy density using ground-based multispectral data. In Proceedings of the Fifth International Conference on Precision Agriculture, Bloomington, MN, USA, 16–19 July 2000; p. 1619. [Google Scholar]
- Gamon, J.A.; Serrano, L.; Surfus, J.S. The photochemical reflectance index: An optical indicator of photosynthetic radiation use efficiency across species, functional types, and nutrient levels. Oecologia 1997, 112, 492–501. [Google Scholar] [CrossRef] [Scilit]
- Moon, S.; Daughtry, C.S.T.; Chappelle, E.W.; McMurtrey, J.E.; Walthall, C.L. The use of high spectral resolution bands for estimating absorbed photosynthetically active radiation (APAR). In Proceedings of the 6th International Symposium on Physical Measurements and Signatures in Remote Sensing, Val d’Isère, France, 17–21 January 1994; pp. 299–306. [Google Scholar]
- Zhang, Y.; Han, W.; Niu, X.; Li, G. Maize crop coefficient estimated from UAV-measured multispectral vegetation indices. Sensors 2019, 19, 5250. [Google Scholar] [CrossRef] [Scilit]
- Yang, Z.; Willis, P.; Mueller, R. Impact of Band-Ratio Enhanced AWIFS Image to Crop Classification Accuracy. In Proceedings of the Pecora 17: The Future of Land Imaging… Going Operational, Denver, CO, USA, 18–20 November 2008. [Google Scholar]
- Roberts, D.A.; Roth, K.L.; Wetherley, E.B.; Meerdink, S.K.; Perroy, R.L. Hyperspectral vegetation indices. In Hyperspectral Indices and Image Classifications for Agriculture and Vegetation; CRC press: Boca Raton, FL, USA, 2018; pp. 3–26. [Google Scholar]
- Guavita-Vargas, J.; Avellaneda-Torres, L.M.; Solarte, M.E.; Melgarejo, L.M. Carotenoides, clorofilas y pectinas durante la maduración de variedades de guayaba (Psidium guajava L.) de Santander, Colombia. Rev. Colomb. Cienc. Hortic. 2018, 12, 379–389. [Google Scholar] [CrossRef] [Scilit]
- Ma, S.; Zhou, Y.; Gowda, P.H.; Dong, J.; Zhang, G.; Kakani, V.G.; Wagle, P.; Chen, L.; Flynn, K.C.; Jiang, W. Application of the water-related spectral reflectance indices: A review. Ecol. Indic. 2019, 98, 68–79. [Google Scholar] [CrossRef] [Scilit]
- Transon, J.; d’Andrimont, R.; Maugnard, A.; Defourny, P. Survey of hyperspectral Earth observation applications from space in the Sentinel-2 context. Remote Sens. 2018, 10, 157. [Google Scholar] [CrossRef] [Scilit]
- Devyatkin, D. Estimation of vegetation indices with random kernel forests. IEEE Access 2023, 11, 29500–29509. [Google Scholar] [CrossRef] [Scilit]
- Soto, G.E.; Pérez-Hernández, C.G.; Hahn, I.J.; Rodewald, A.D.; Vergara, P.M. Tree senescence as a direct measure of habitat quality: Linking red-edge vegetation indices to space use by Magellanic woodpeckers. Remote Sens. Environ. 2017, 193, 1–10. [Google Scholar] [CrossRef] [Scilit]
- Okwuashi, O.; Ndehedehe, C. Deep support vector machine for hyperspectral image classification. Pattern Recognit. 2020, 103, 107298. [Google Scholar] [CrossRef] [Scilit]
- Li, Y.; Min, S.; Song, B.; Yang, H.; Wang, B.; Wu, Y. Multisource high-resolution remote sensing image vegetation extraction with comprehensive multifeature perception. Remote Sens. 2024, 16, 712. [Google Scholar] [CrossRef] [Scilit]
- Lowe, B.; Kulkarni, A. Multispectral image analysis using random forest. Int. J. Soft Comput. 2015, 6, 1–14. [Google Scholar] [CrossRef] [Scilit]
- Coates, A.; Ng, A. Learning feature representations with k-means. In Neural Networks: Tricks of the Trade; Springer: Berlin/Heidelberg, Germany, 2012; pp. 561–580. [Google Scholar] [CrossRef] [Scilit]
- Shi, M.; Feng, L. Plug-and-play prior based on Gaussian mixture model learning for image restoration in sensor network. IEEE Access 2018, 6, 78113–78122. [Google Scholar] [CrossRef] [Scilit]
- Mohanta, A.; Kiran, S.; Malhi, R.; Prajapati, P.; Oza, K.; Rajput, S.; Shitole, S.; Srivastava, P. Harnessing spectral libraries from AVIRIS-NG data for precise PFT classification: A deep learning approach. Plant Cell Environ. 2025, Early View. [Google Scholar] [CrossRef] [Scilit] [PubMed]
- Zaman, A.; Roy, K.; Olt, J. Normalized Difference Vegetation Index prediction for blueberry plant health from RGB images: A clustering and deep learning approach. AgriEngineering 2024, 6, 4831–4850. [Google Scholar] [CrossRef] [Scilit]
- Méndez, A.; Rodríguez, R.; Pavlov, S.; Echeverría, F. Redes neuronales artificiales para estimar el contenido de nitrógeno en plantas leguminosas. Rev. Latinoam. Papa 2015, 36, 85–92. [Google Scholar]
- Silva, G.I.N.D.; Jardim, A.M.D.R.F.; Santos, W.M.D.; Bezerra, A.C.; Alba, E.; Silva, M.V.D.; Silva, J.L.B.D.; Souza, L.S.B.D.; Marinho, G.T.B.; Montenegro, A.A.D.A.; et al. Estimation of biophysical parameters of forage cactus under different agricultural systems through vegetation indices and machine learning using RGB images acquired with unmanned aerial vehicles. Agriculture 2024, 14, 2166. [Google Scholar] [CrossRef] [Scilit]
- Hinojosa-Espinoza, S.; Gallardo-Salazar, J.; Hinojosa-Espinoza, F.; Meléndez-Soto, A. Evaluación de parámetros de segmentación en OBIA para la clasificación de coberturas del suelo a partir de imágenes VANT. Rev. Teledetec. 2021, 57, 89–103. [Google Scholar] [CrossRef] [Scilit]
- Gai, J.; Wang, J.; Xie, S.; Wang, Z.; Xiang, L. Spectroscopic determination of chlorophyll content in sugarcane leaves for drought stress detection. Precis. Agric. 2024, 25, 543–569. [Google Scholar] [CrossRef] [Scilit]
- Delalieux, S.; Zarco-Tejada, P.J.; Tits, L.; Bello, M.A.J.; Intrigliolo, D.S.; Somers, B. Unmixing-Based Fusion of Hyperspatial and Hyperspectral Airborne Imagery for Early Detection of Vegetation Stress. IEEE J. Sel. Top. Appl. Earth Obs. Remote Sens. 2014, 7, 2571–2582. [Google Scholar] [CrossRef] [Scilit]
- Gitelson, A.A.; Chivkunova, O.B.; Merzlyak, M.N. Nondestructive estimation of anthocyanins and chlorophylls in anthocyanic leaves. Am. J. Bot. 2009, 96, 1861–1868. [Google Scholar] [CrossRef] [Scilit] [PubMed]
- Guerrero, J.M.; Pajares, G.; Montalvo, M.; Romeo, J.; Guijarro, M. Support vector machines for crop/weeds identification in maize fields. Expert Syst. Appl. 2012, 39, 11149–11155. [Google Scholar] [CrossRef] [Scilit]
- Huete, A.; Didan, K.; Miura, T.; Rodriguez, E.P.; Gao, X.; Ferreira, L.G. Overview of the radiometric and biophysical performance of the MODIS vegetation indices. Remote Sens. Environ. 2002, 83, 195–213. [Google Scholar] [CrossRef] [Scilit]
- Wang, Q.; Moreno-Martínez, Á.; Muñoz-Marí, J.; Campos-Taberner, M.; Camps-Valls, G. Estimation of vegetation traits with kernel NDVI. ISPRS J. Photogramm. Remote Sens. 2023, 196, 161–173. [Google Scholar] [CrossRef] [Scilit]
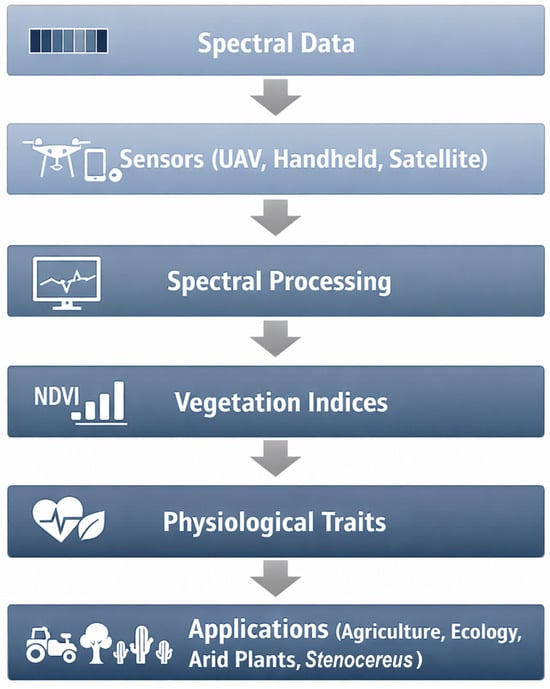
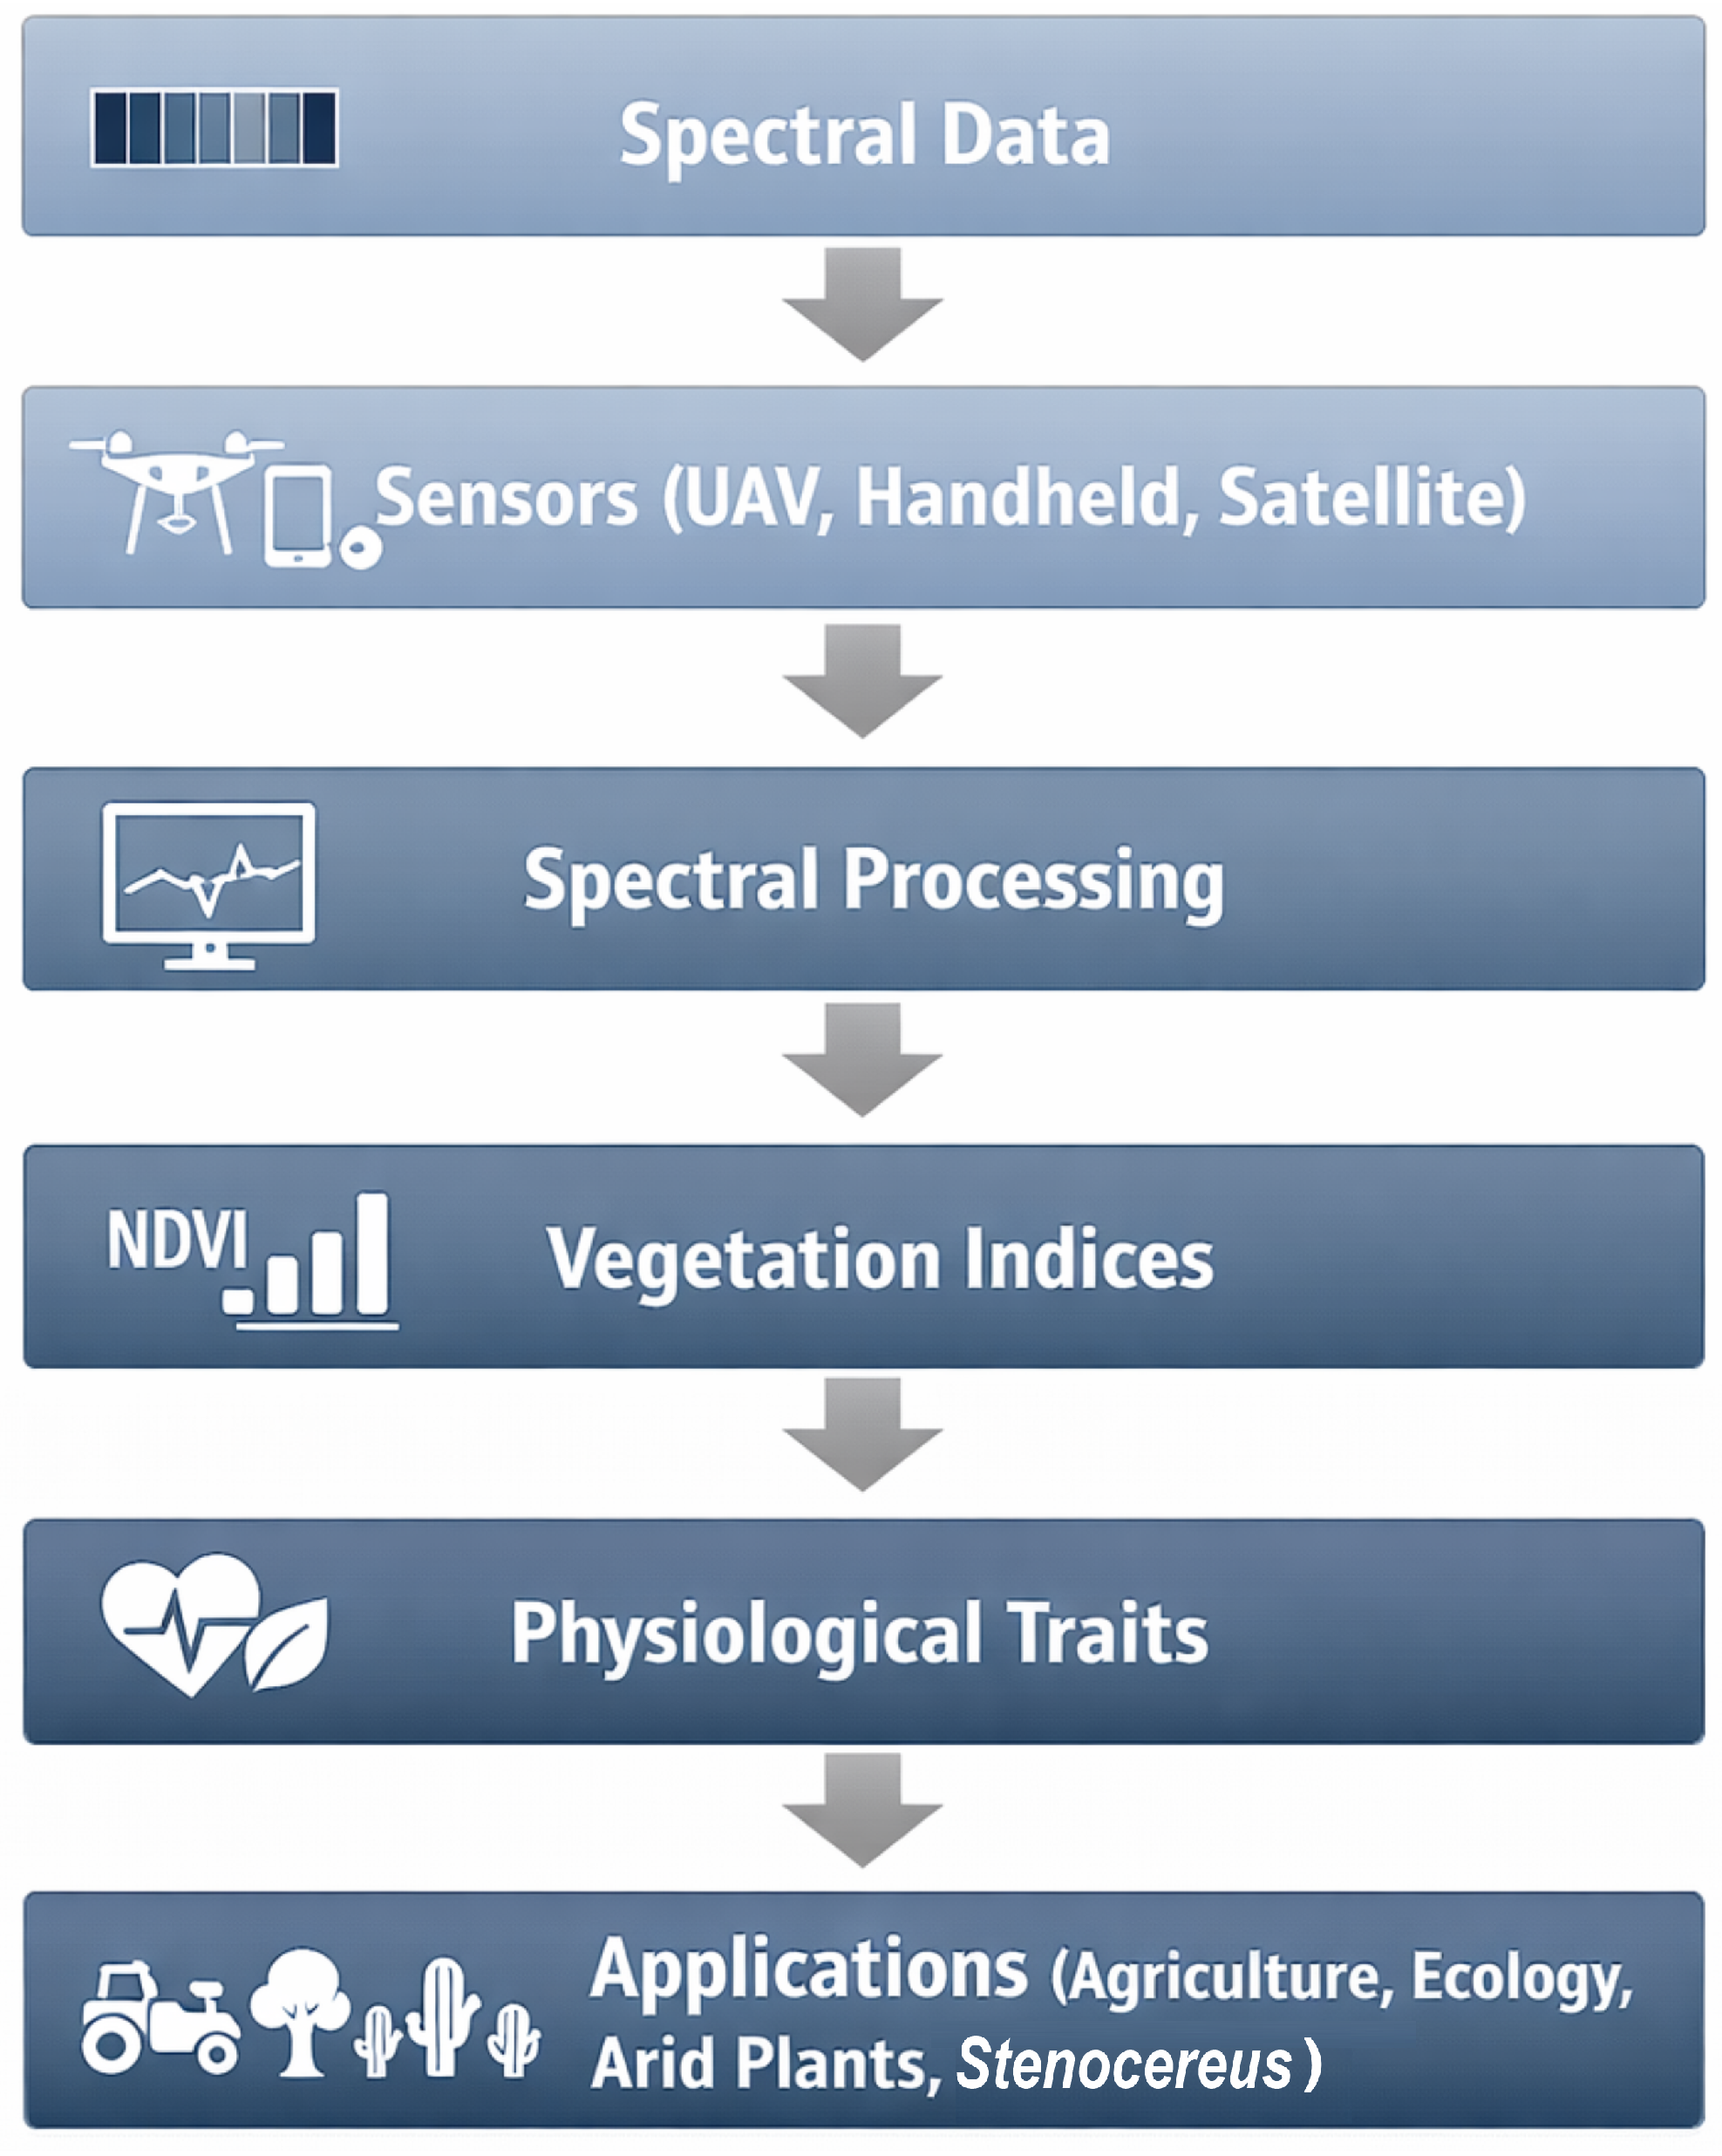
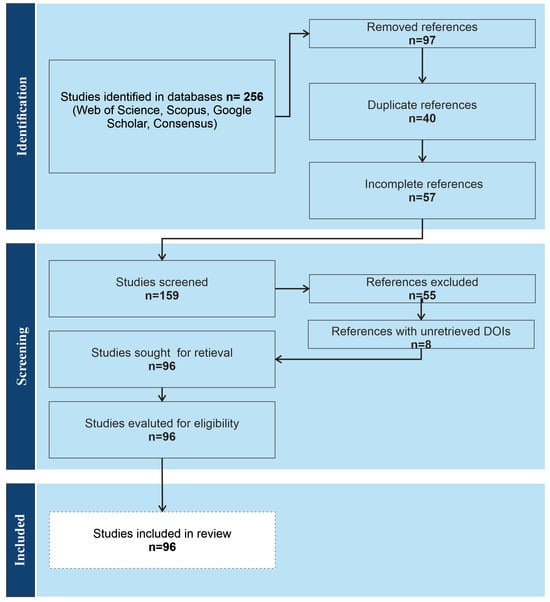
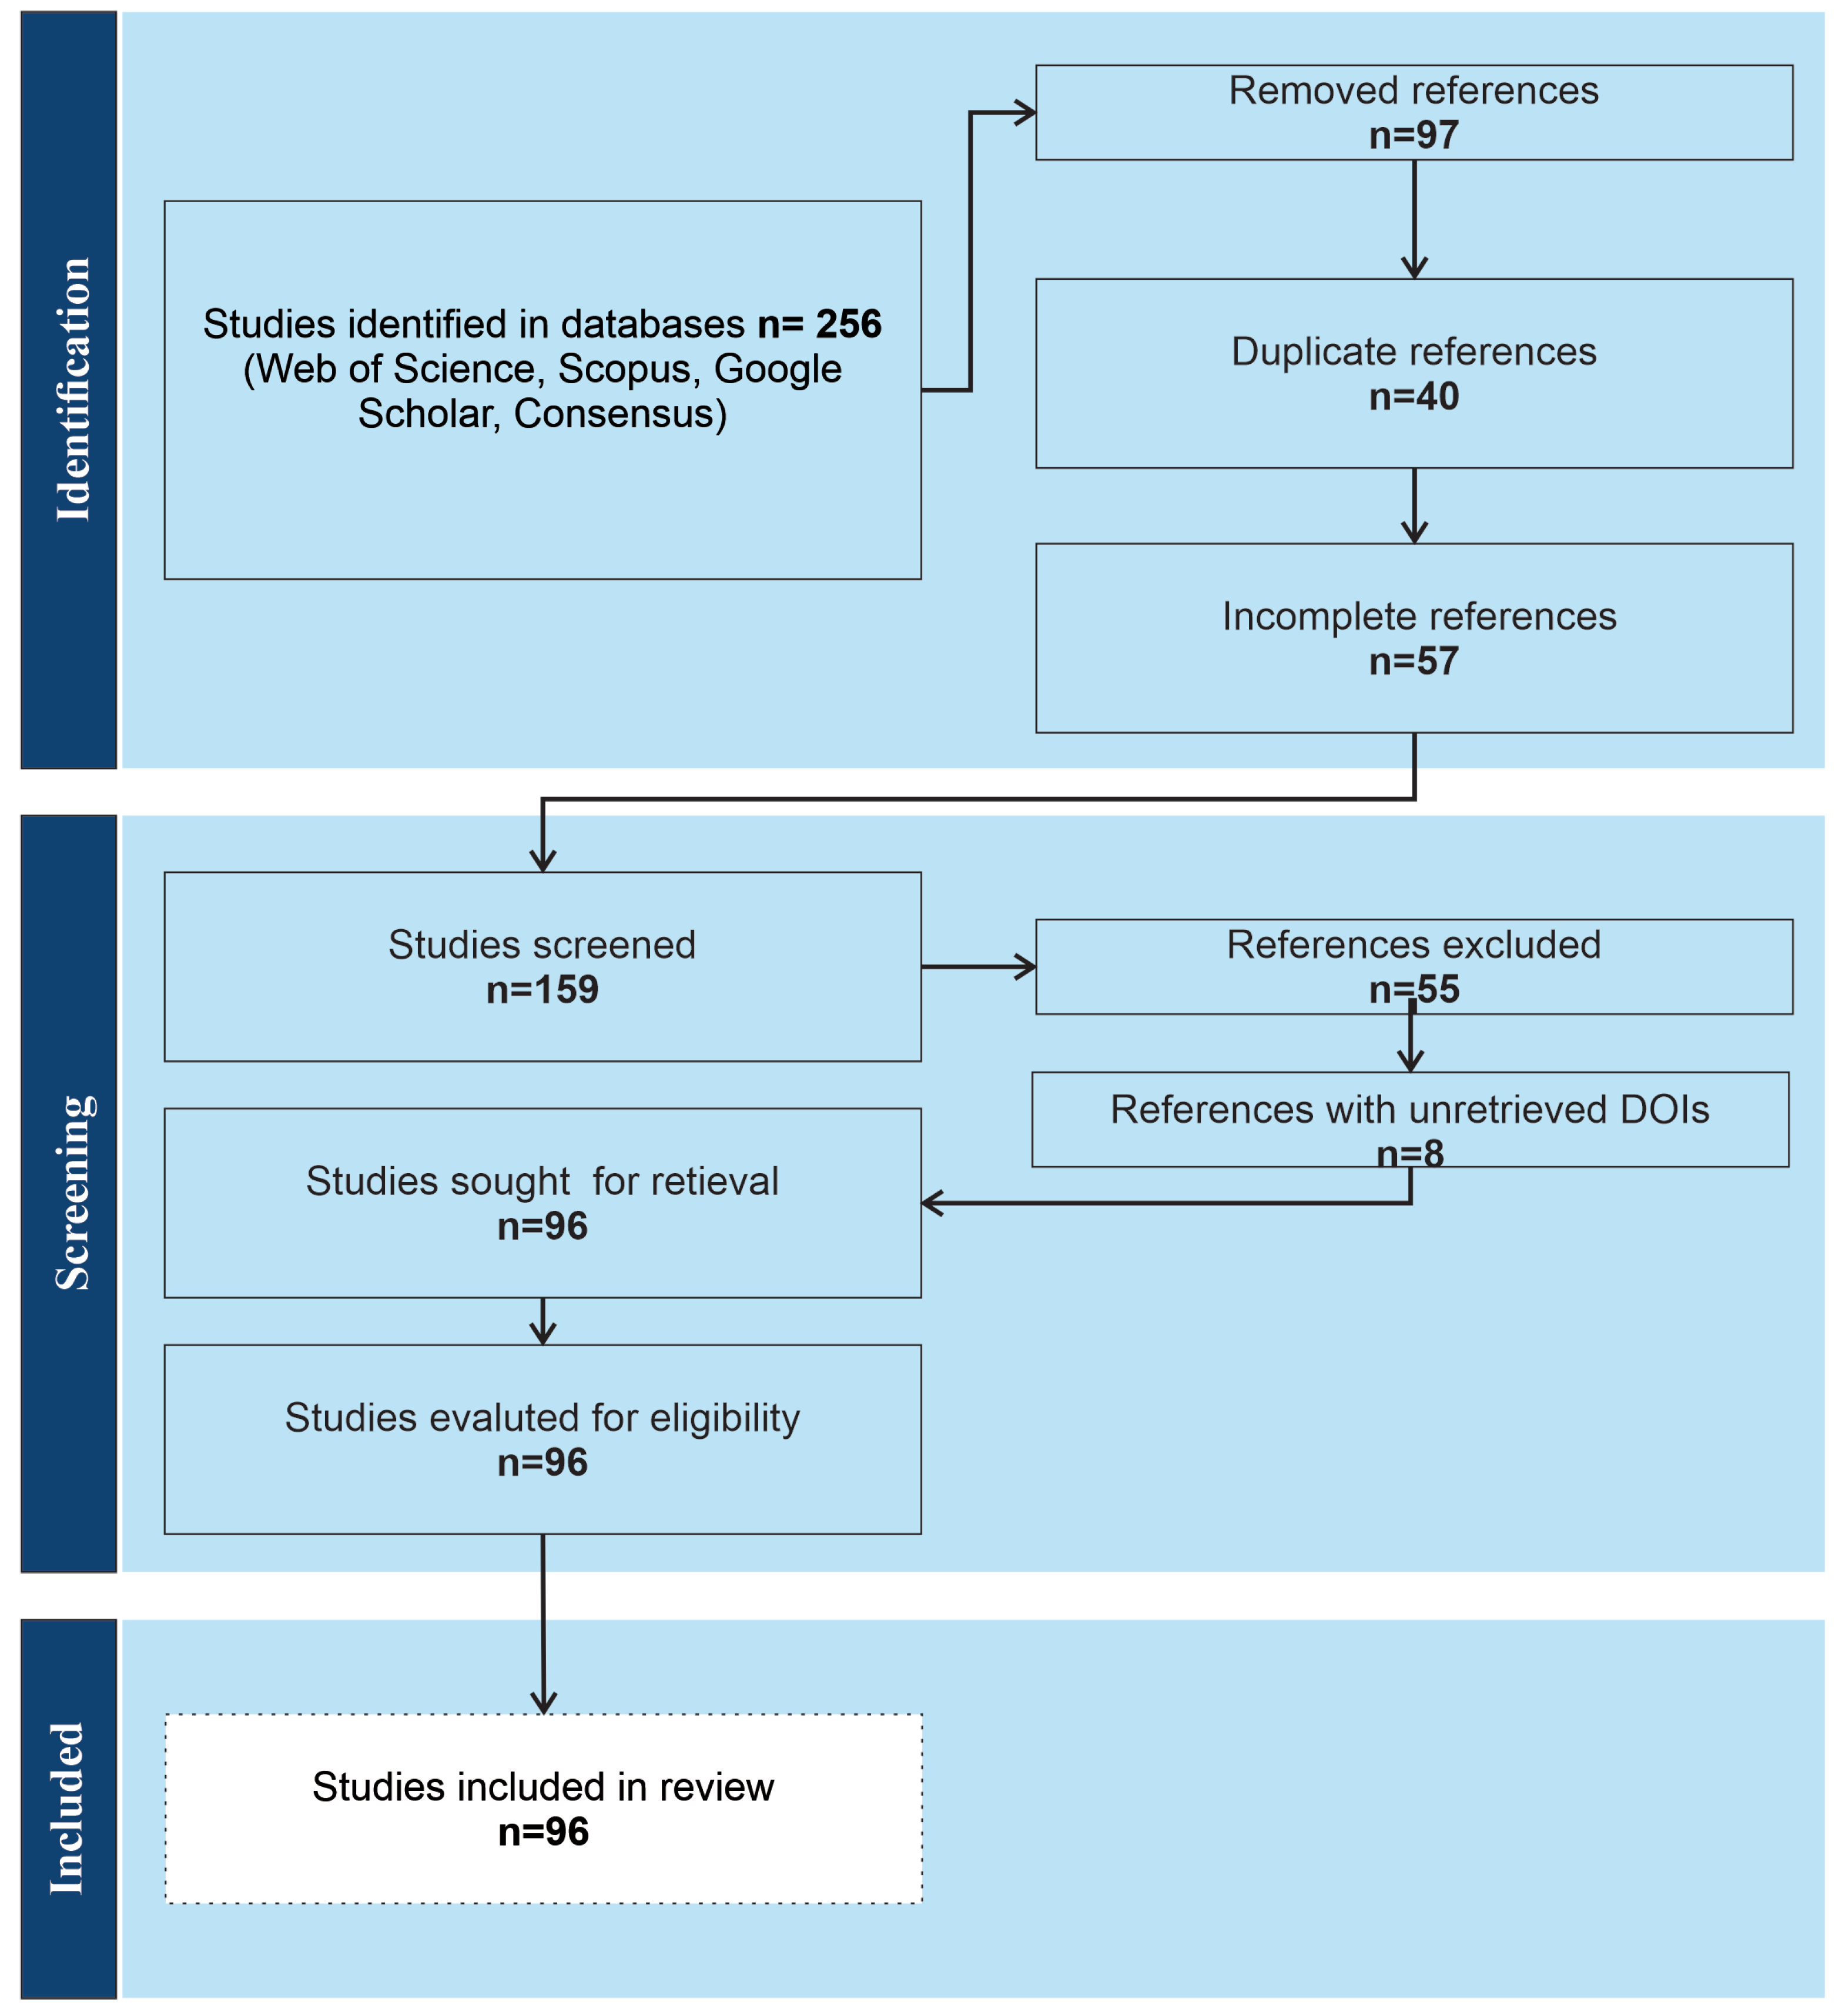
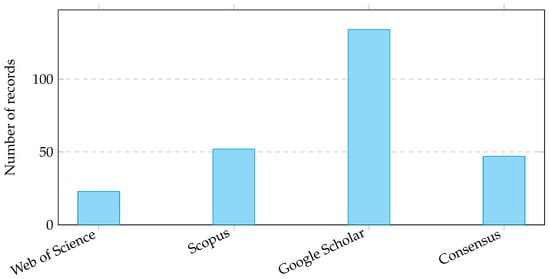
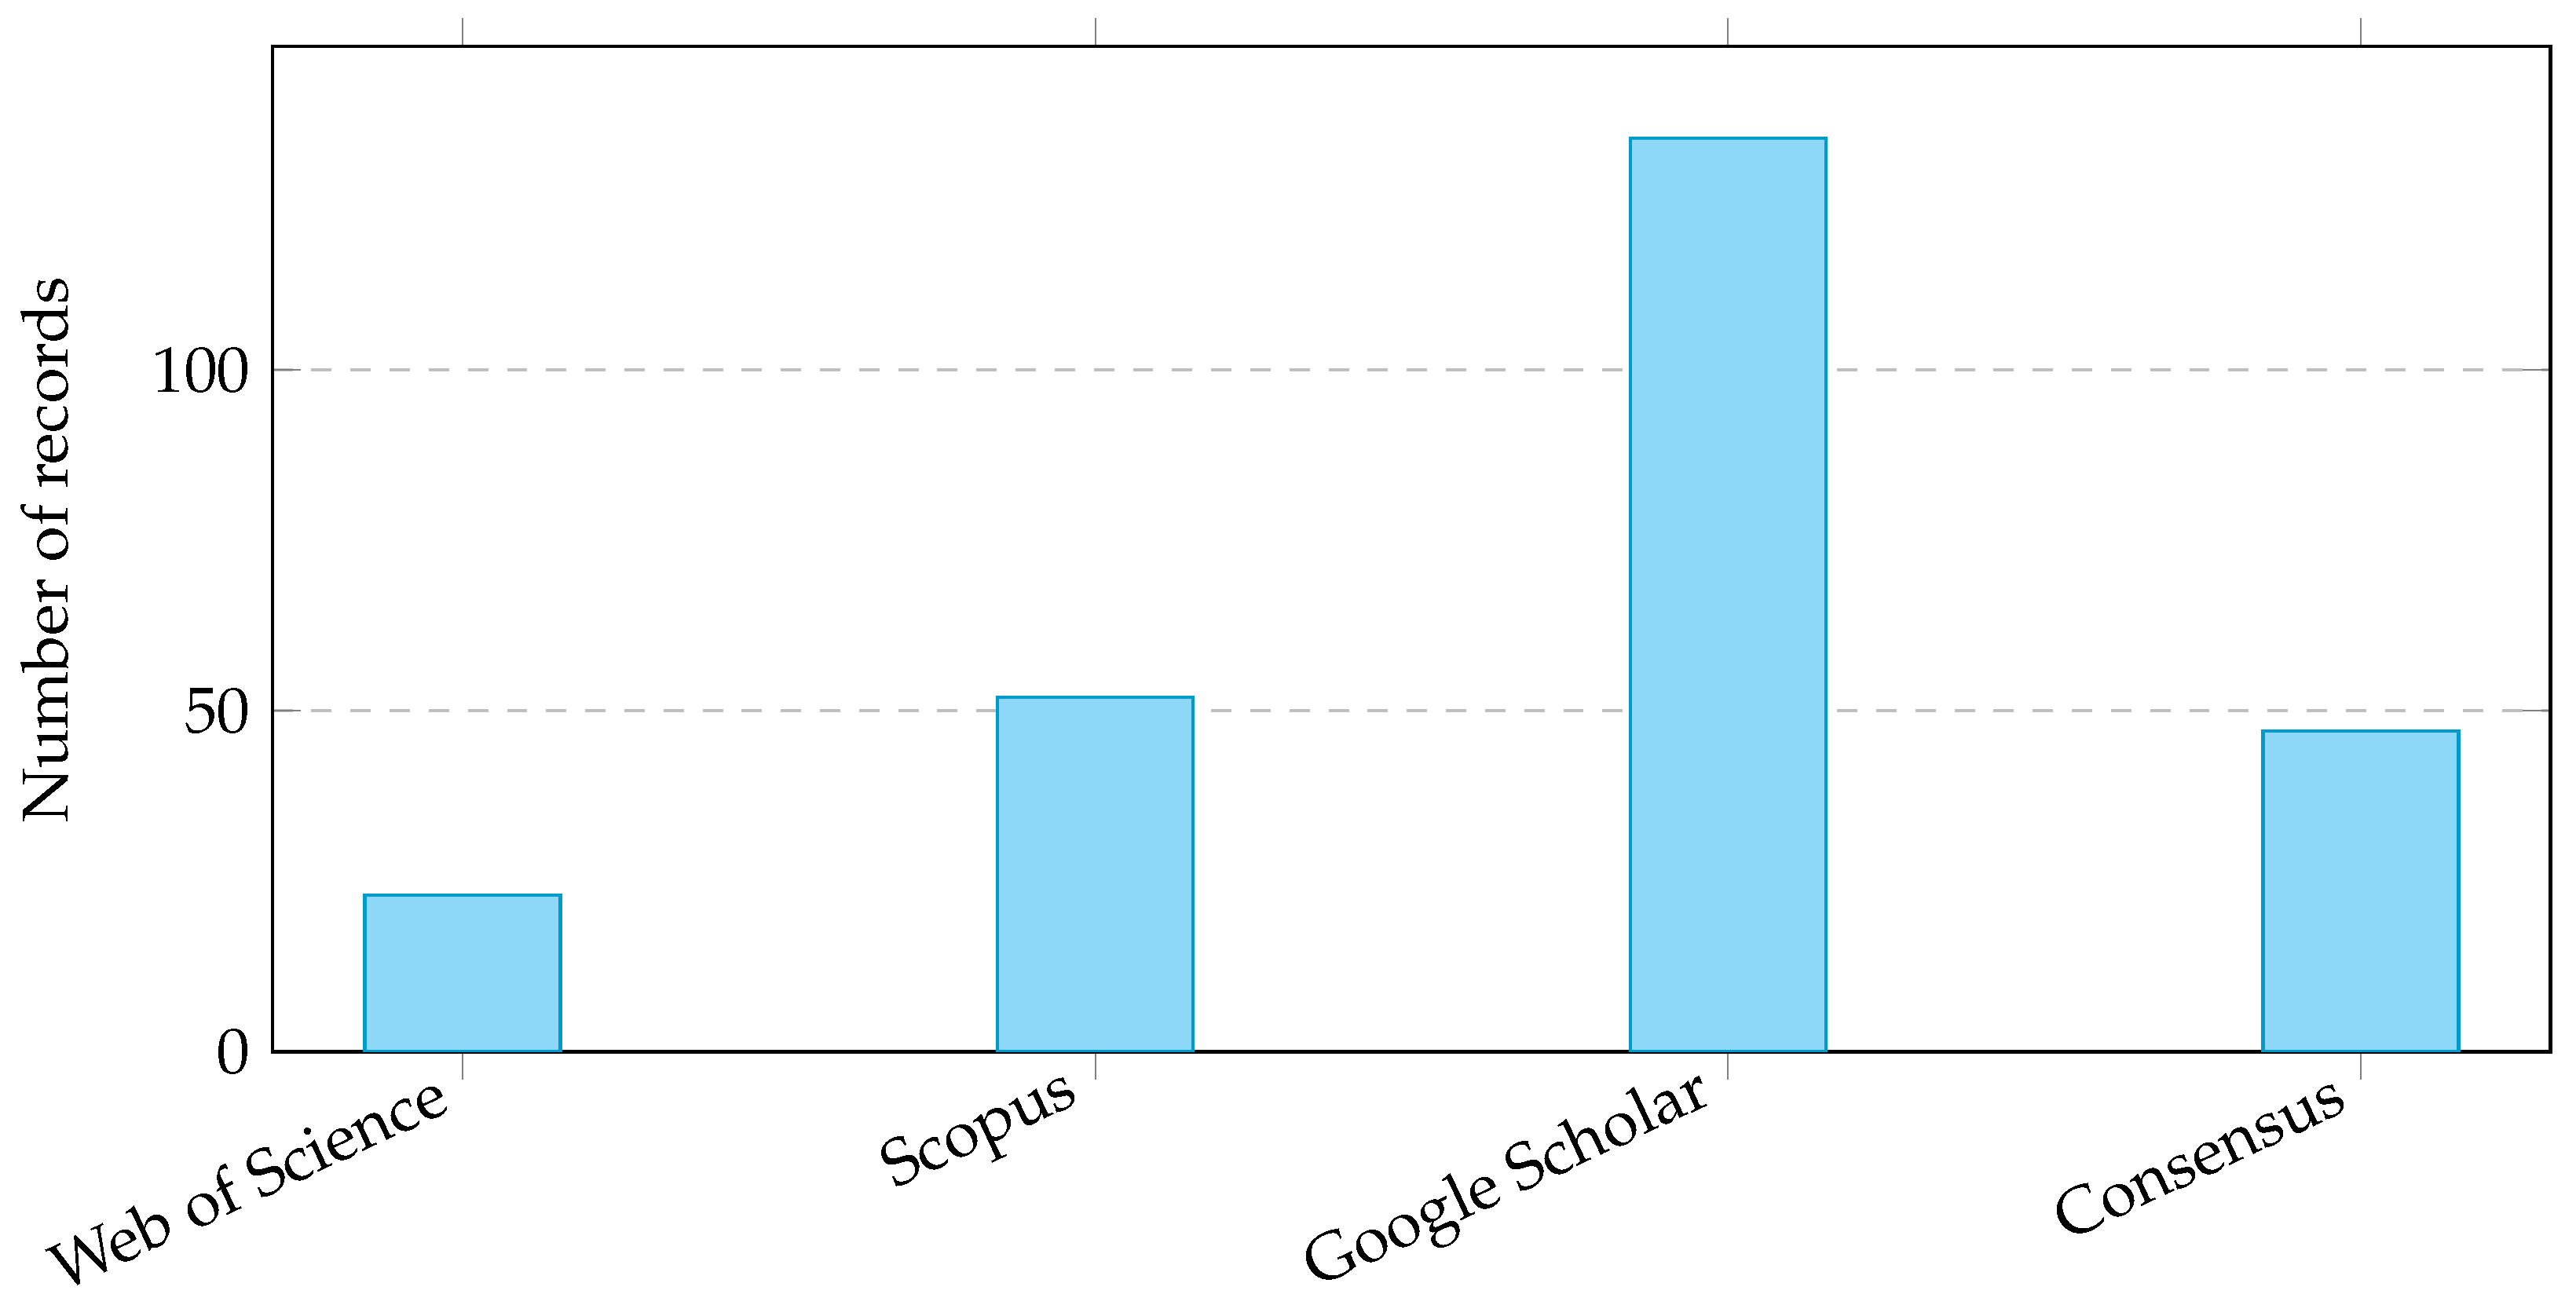
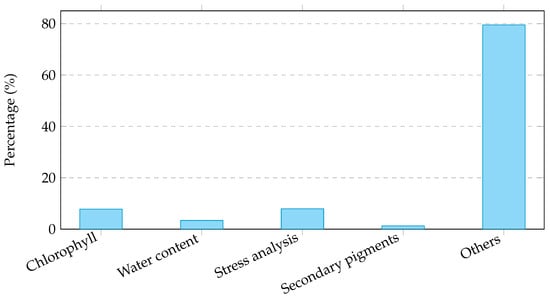
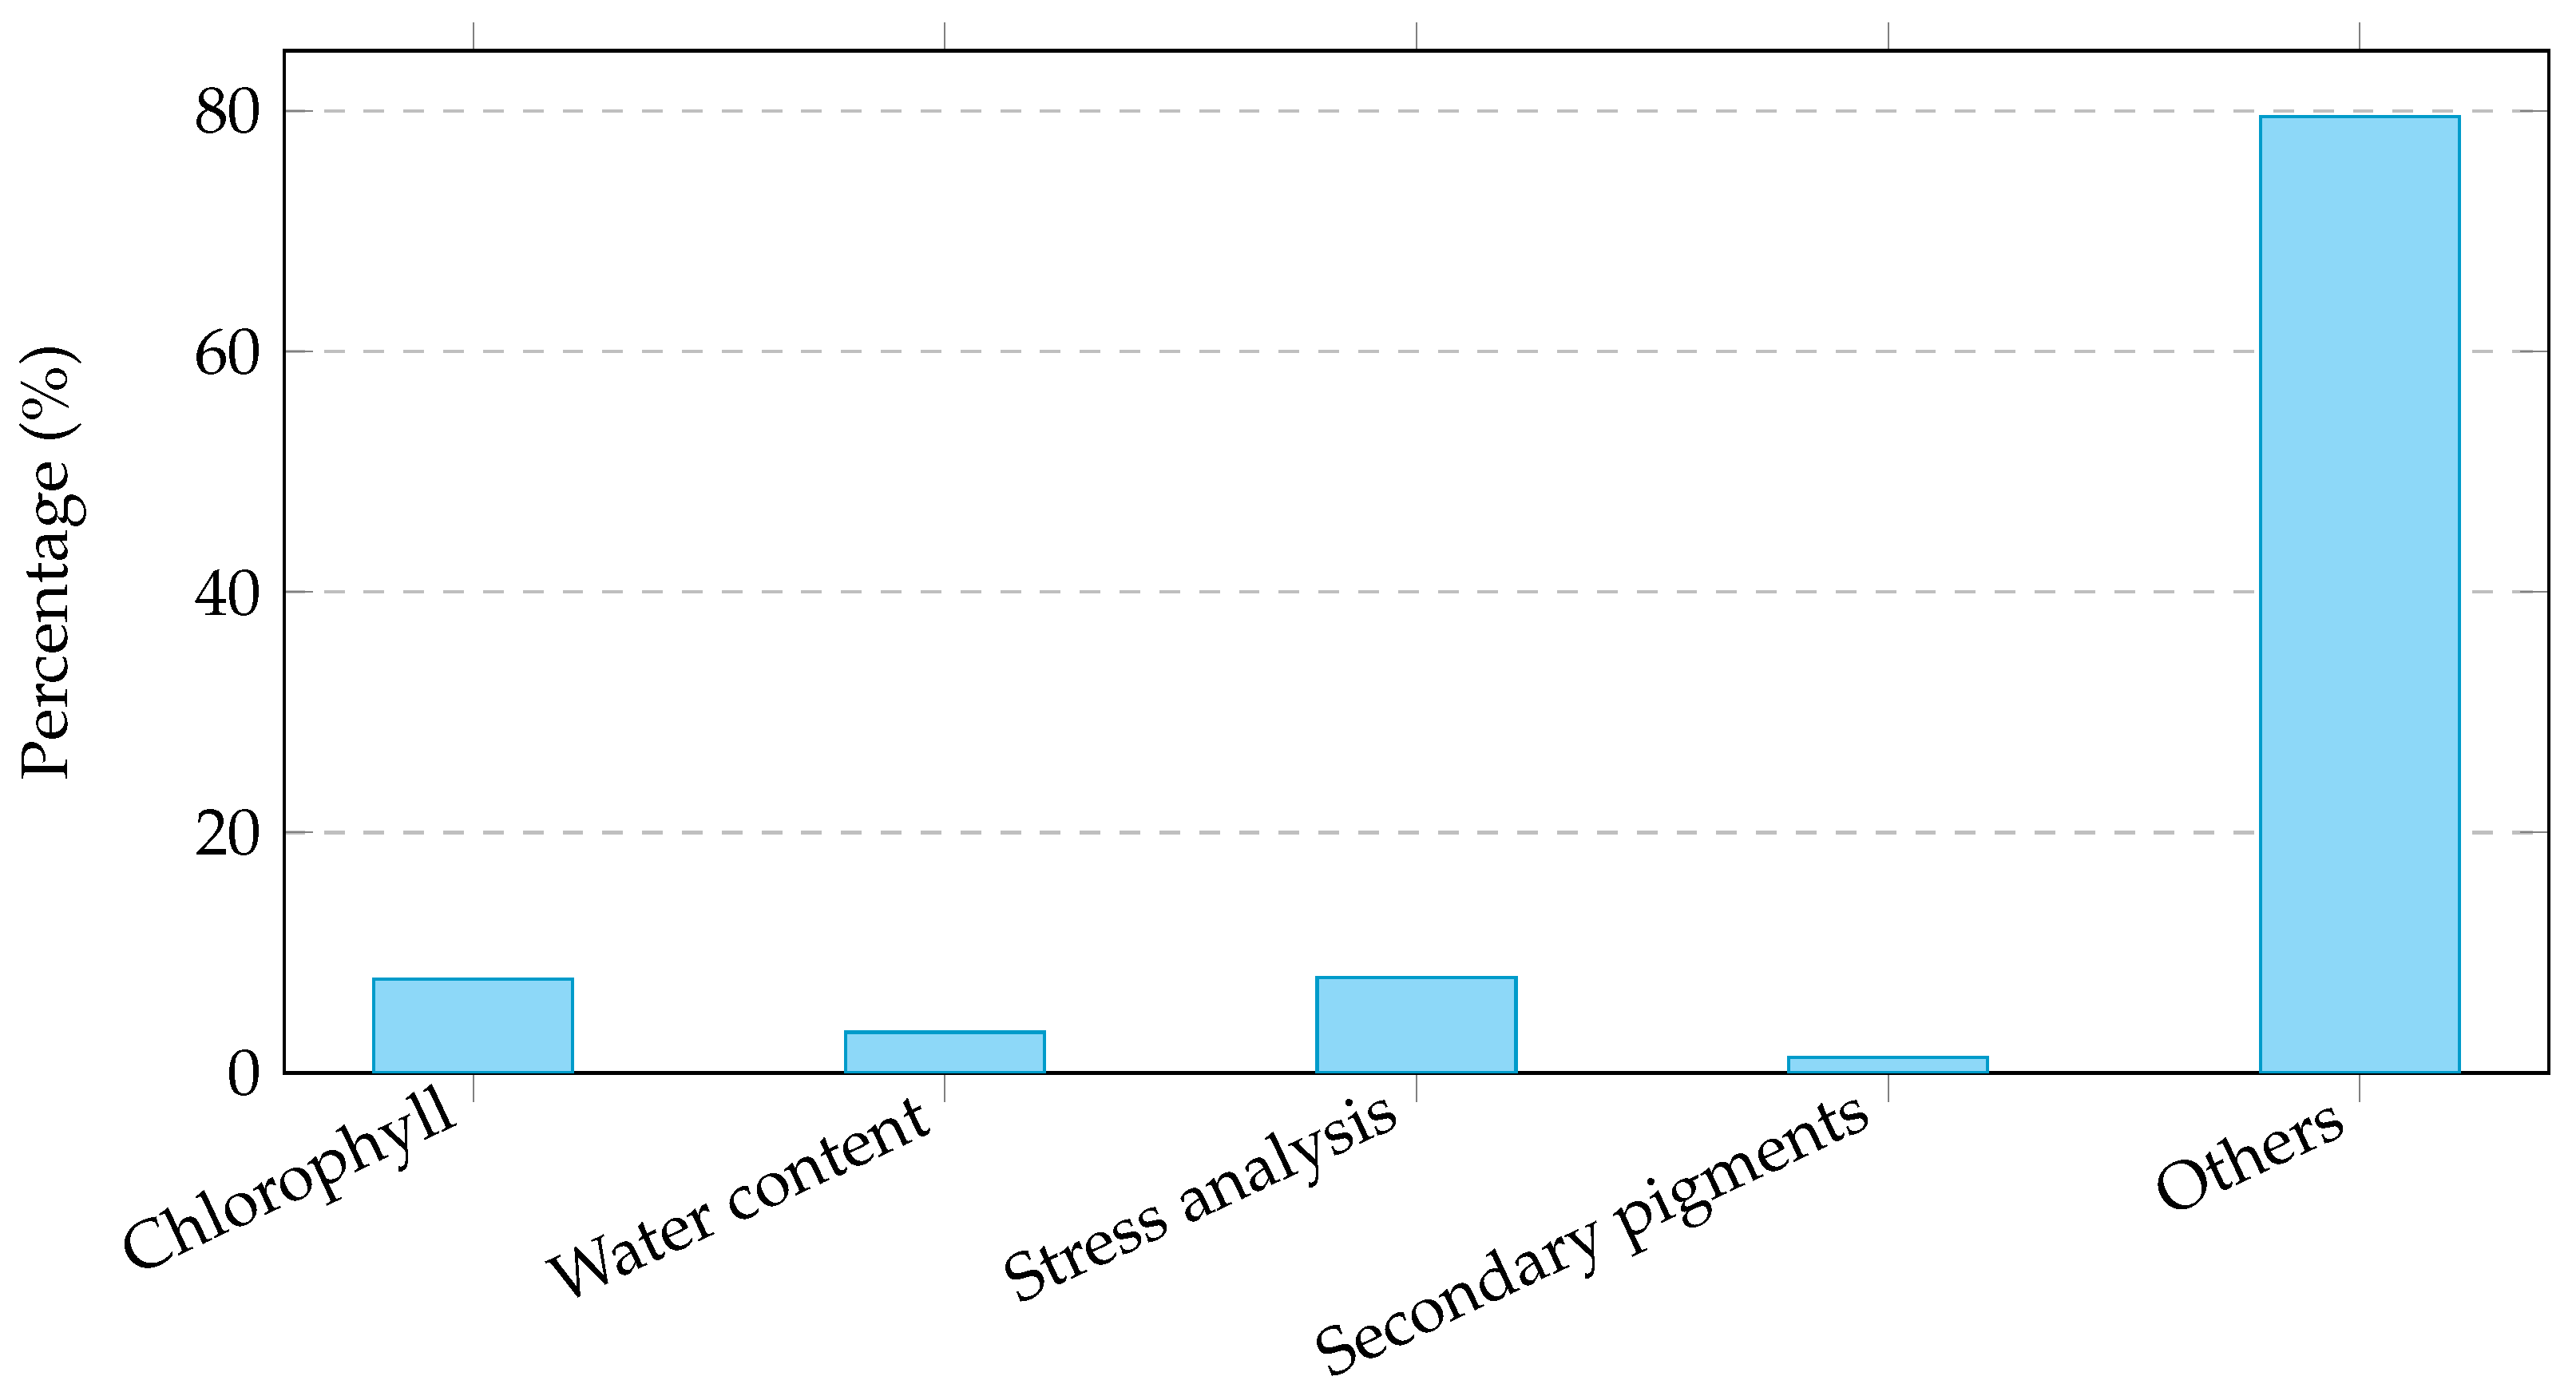
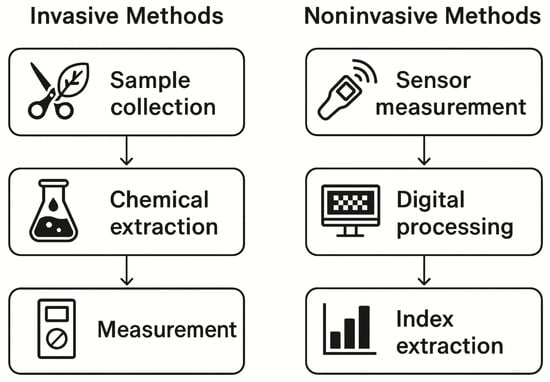
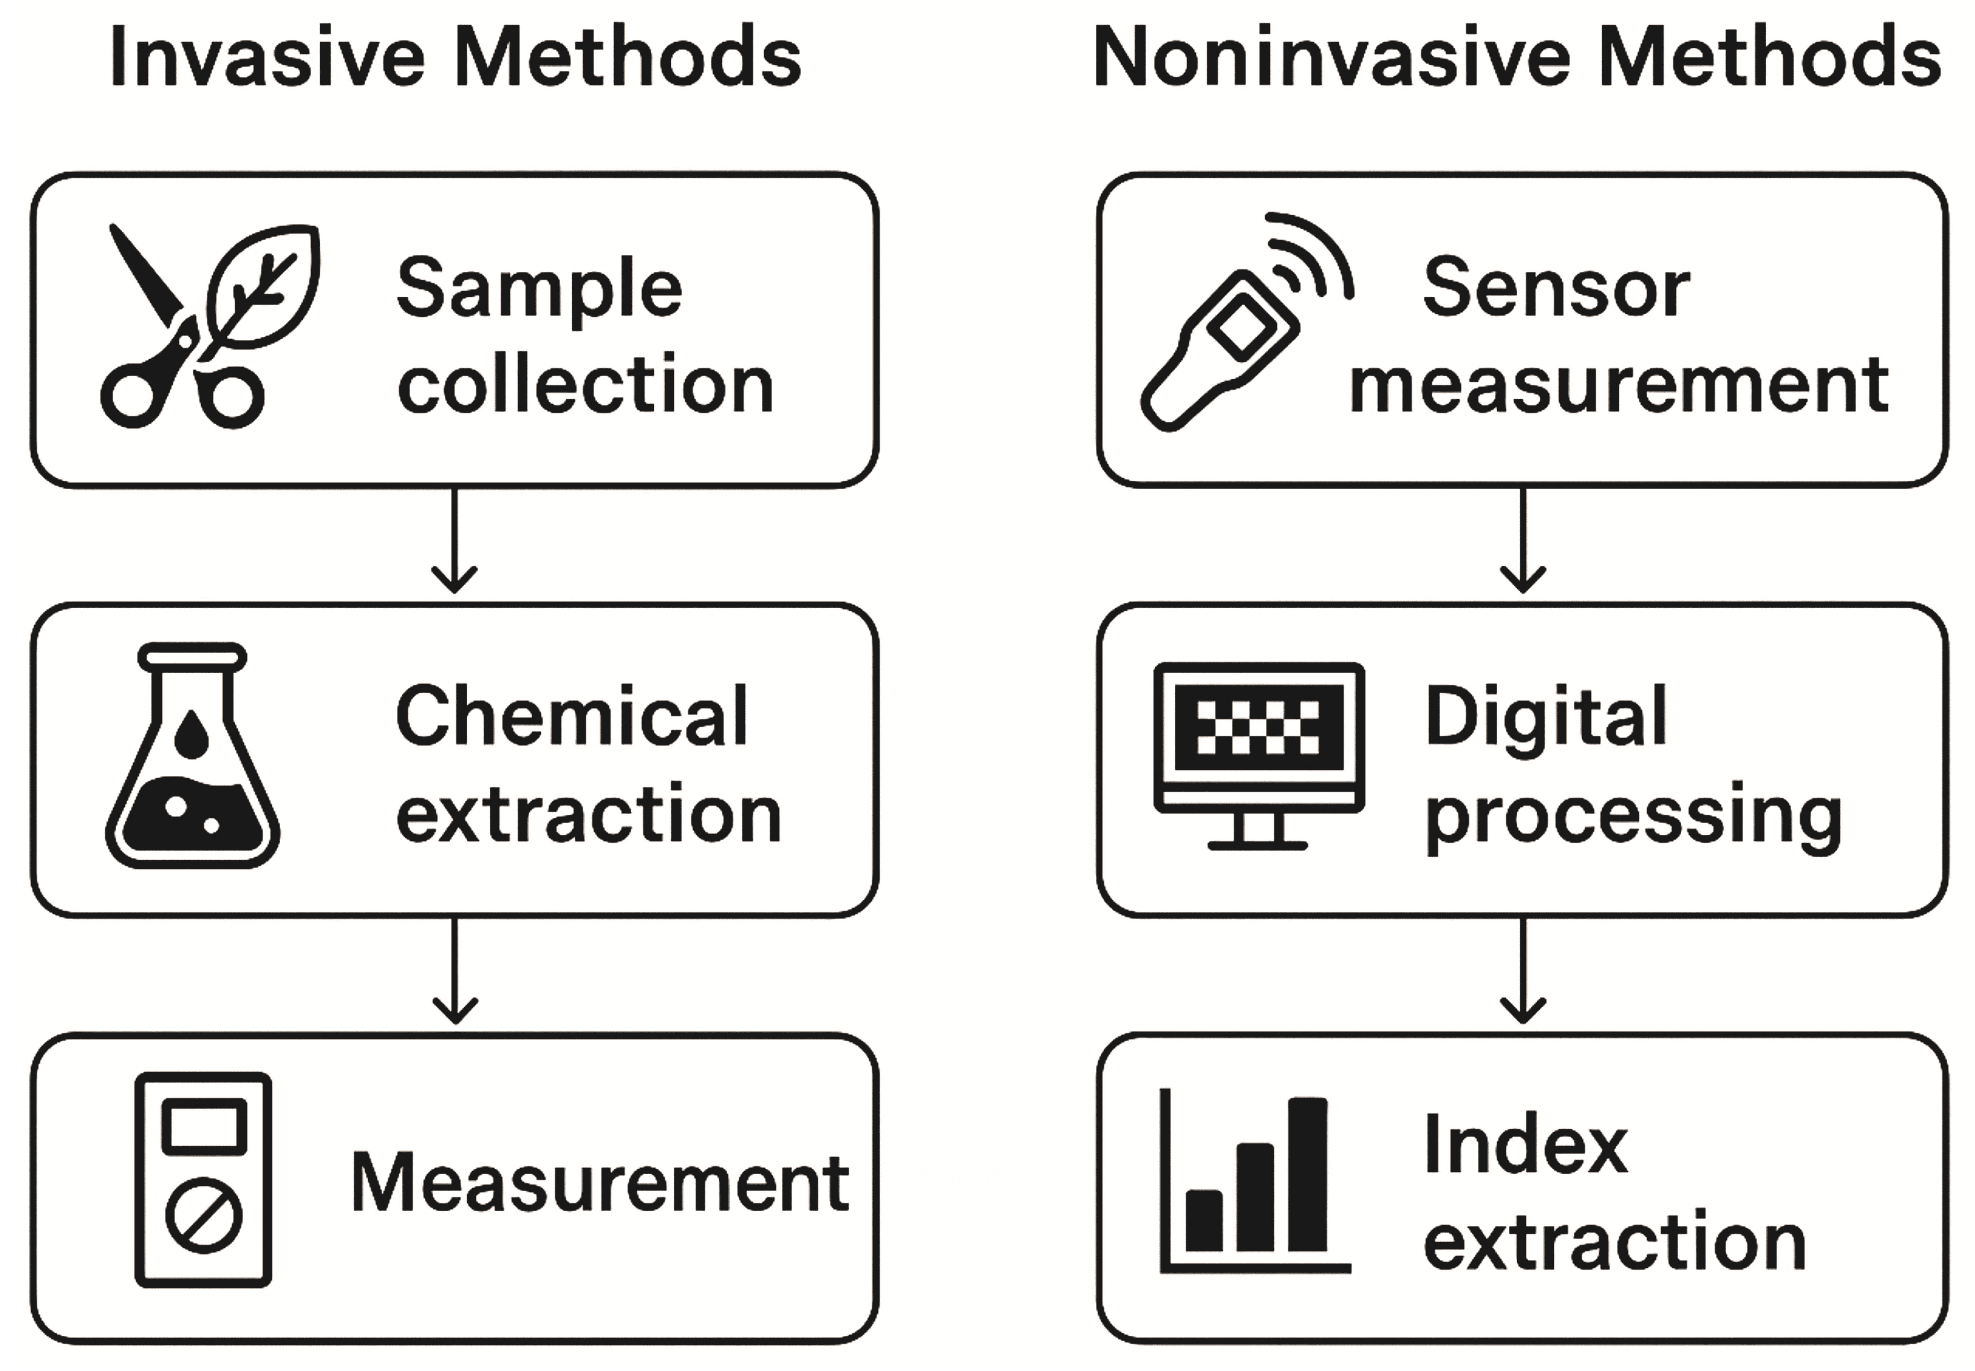
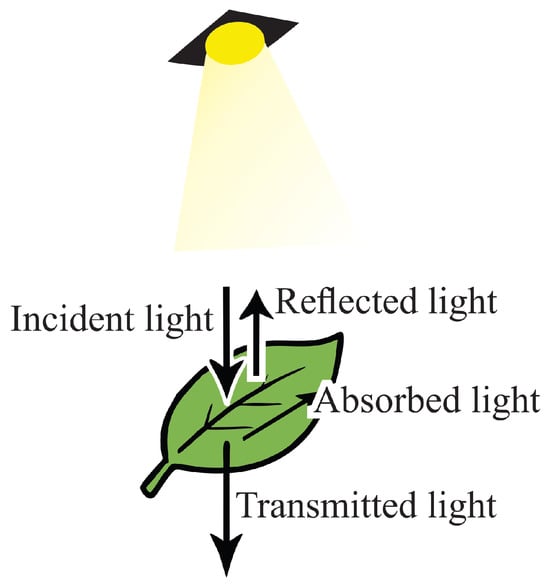
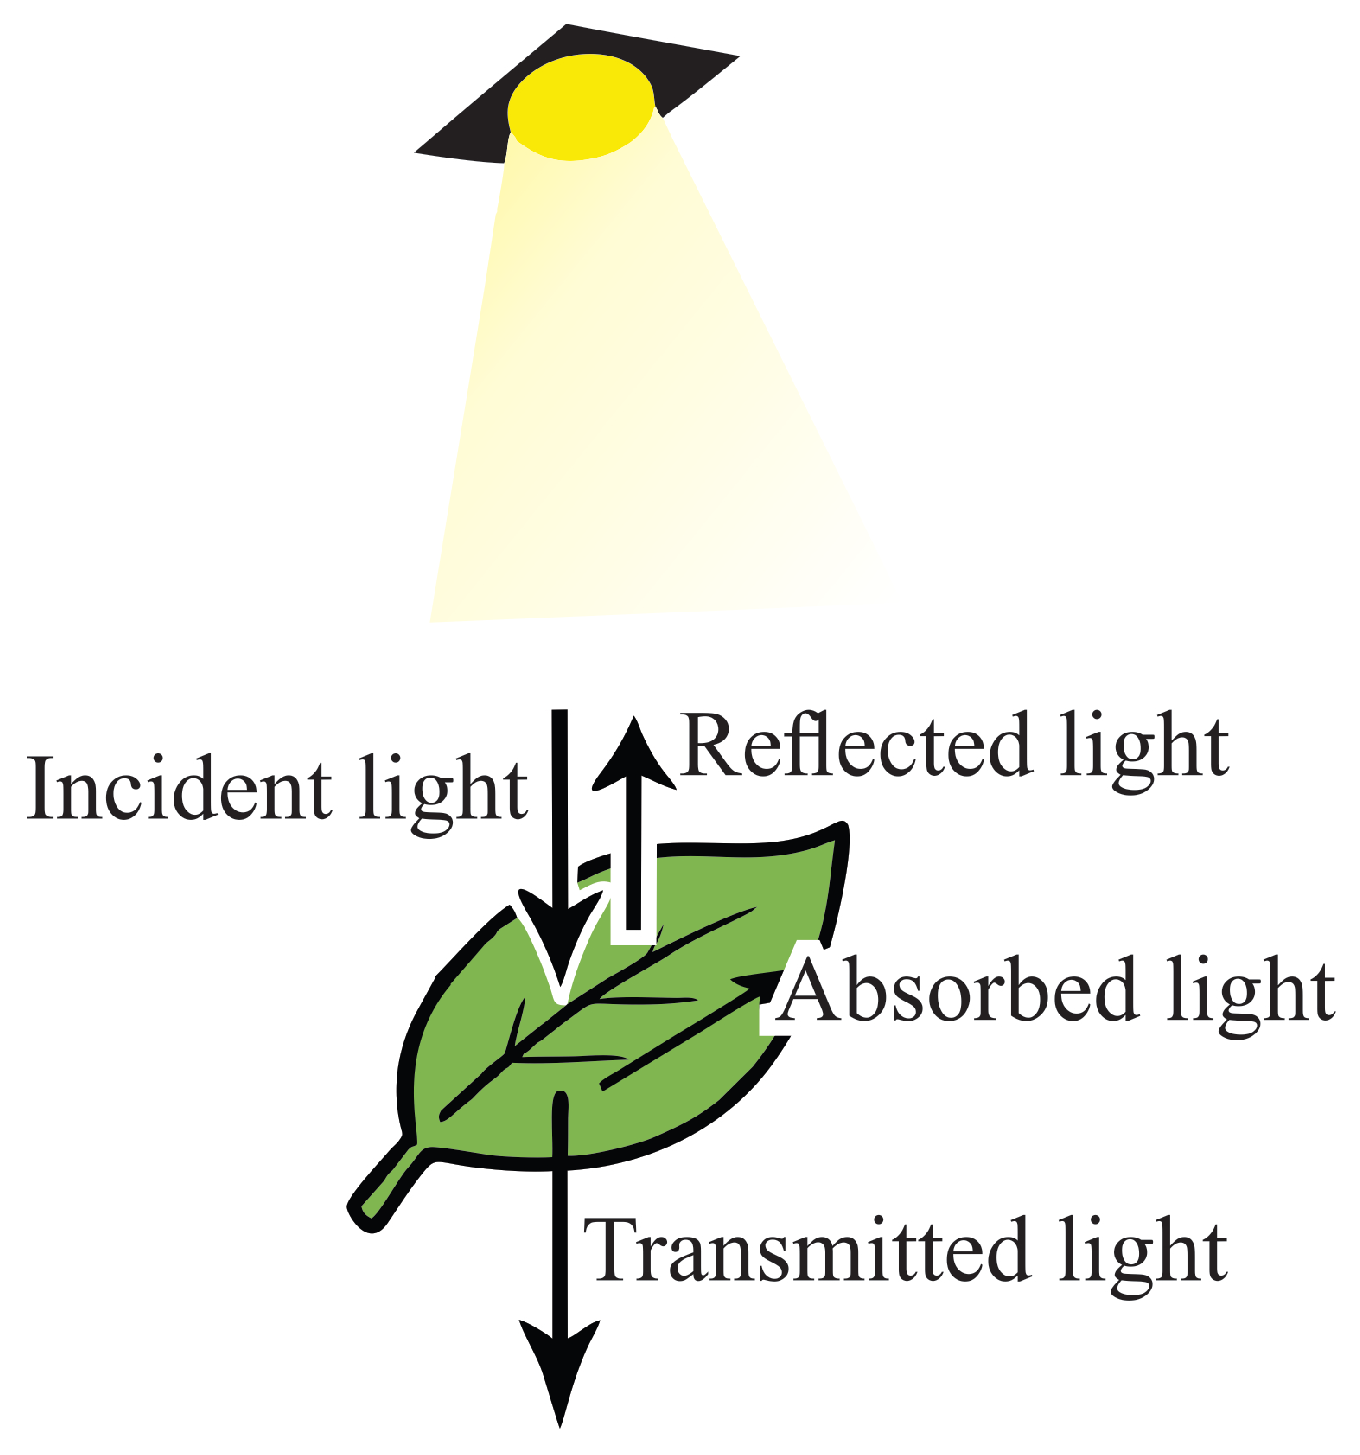
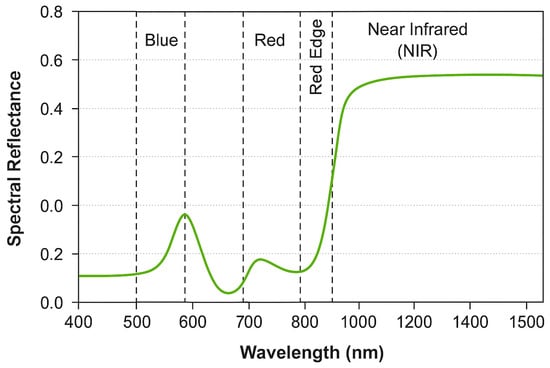
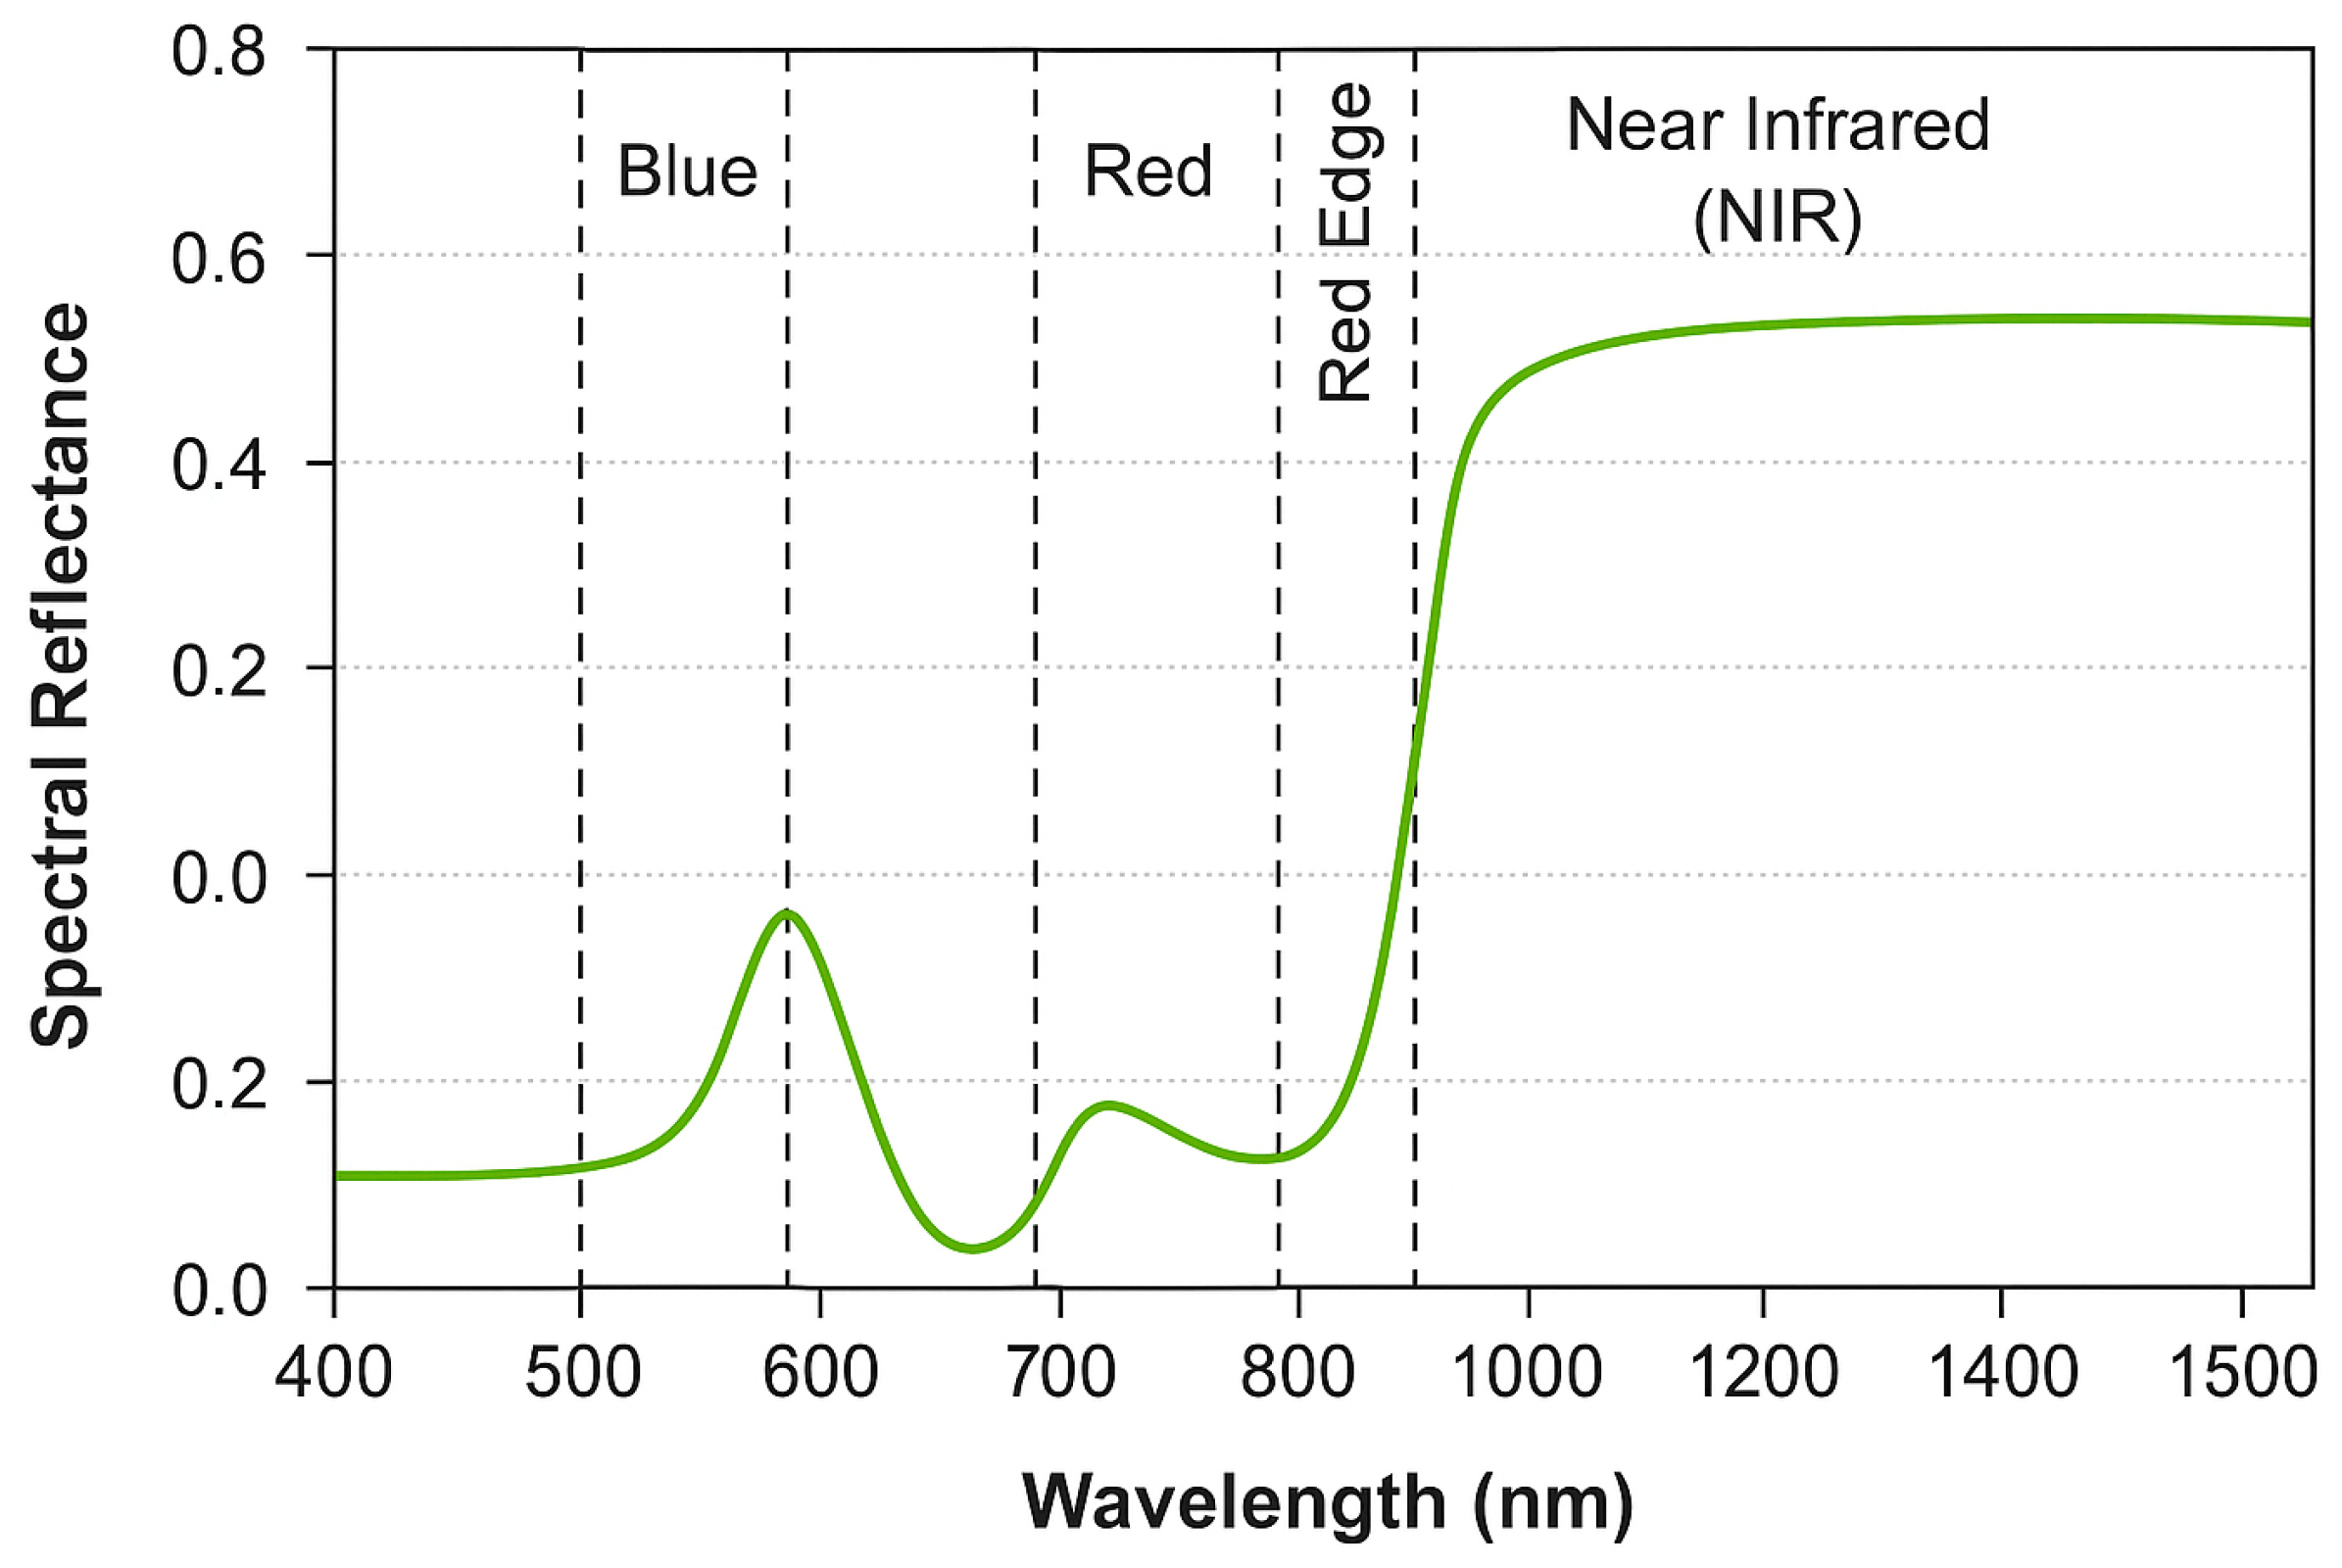
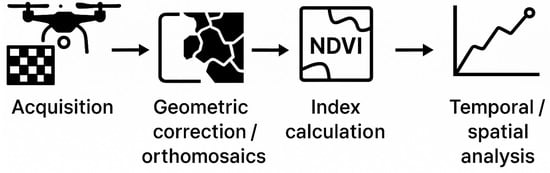
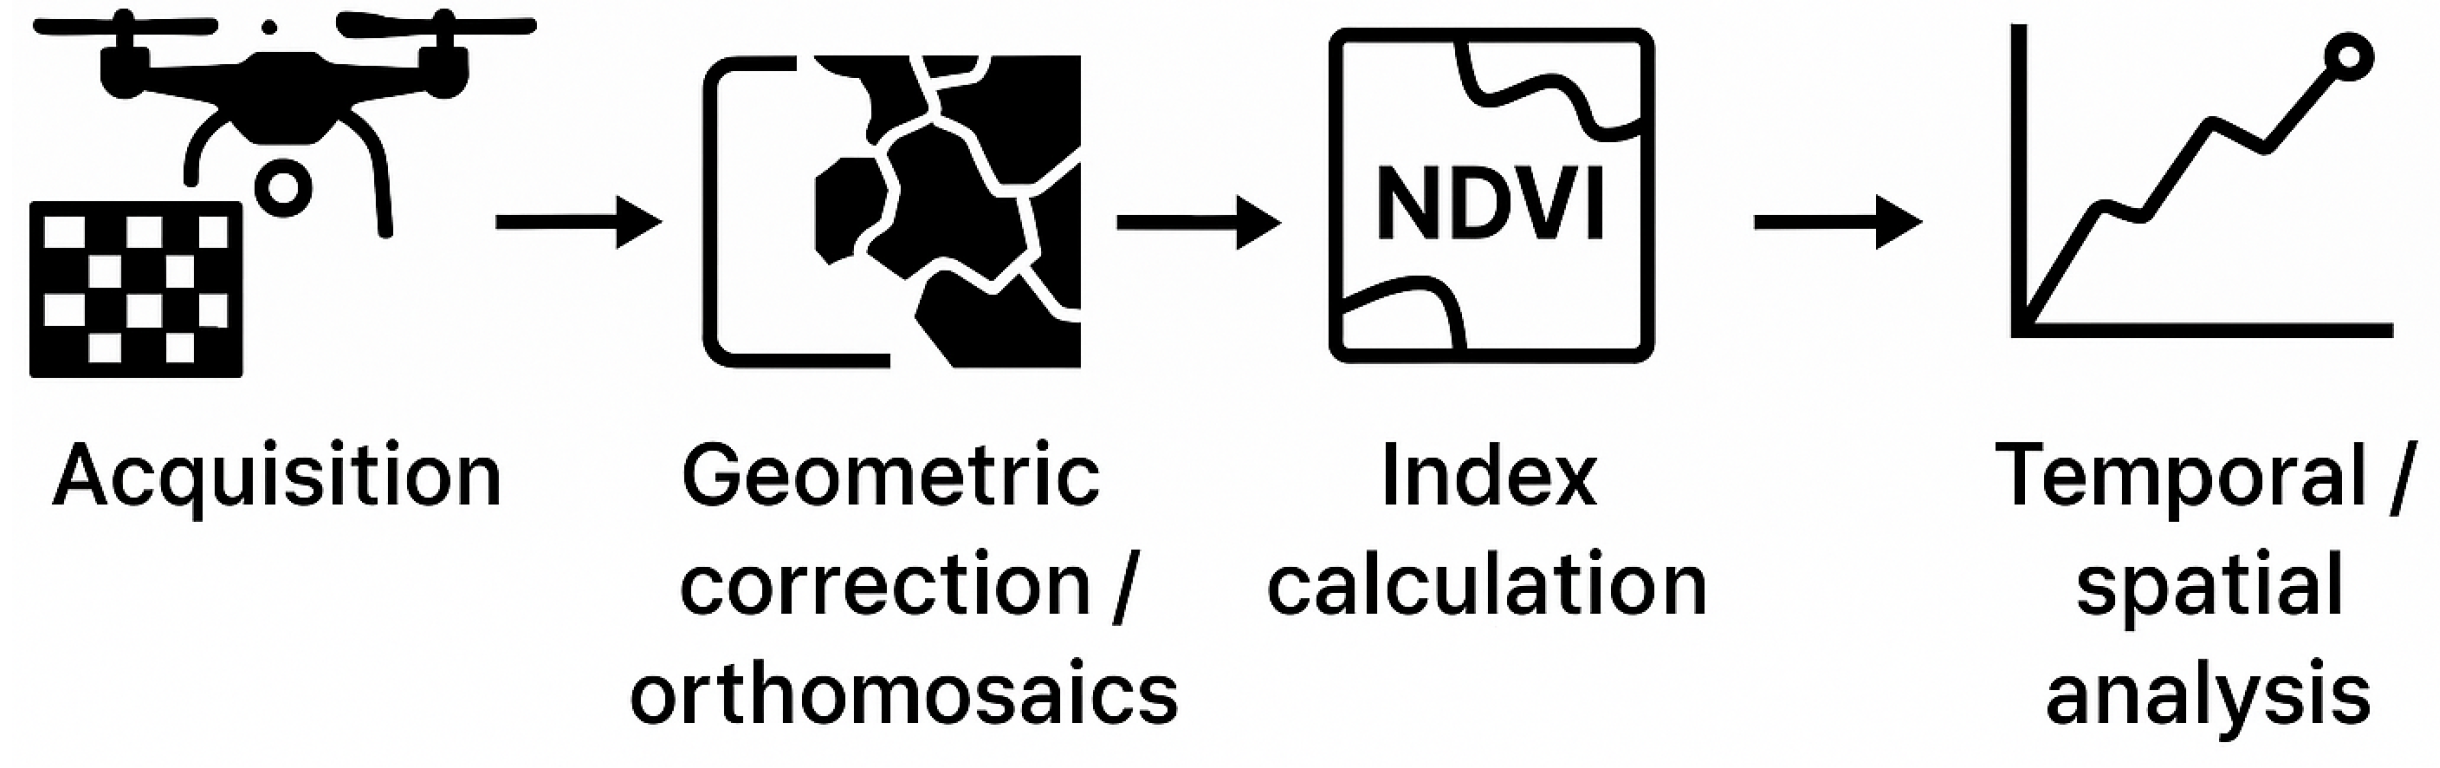

Disclaimer/Publisher’s Note: The statements, opinions and data contained in all publications are solely those of the individual author(s) and contributor(s) and not of MDPI and/or the editor(s). MDPI and/or the editor(s) disclaim responsibility for any injury to people or property resulting from any ideas, methods, instructions or products referred to in the content. |
© 2026 by the authors. Licensee MDPI, Basel, Switzerland. This article is an open access article distributed under the terms and conditions of the Creative Commons Attribution (CC BY) license.