Review

Opportunities and Challenges of Sensor- and Acoustic-Based Irrigation Monitoring Technologies in South Africa: A Scoping Review with Machine Learning-Enhanced Evidence Synthesis

by
Gift Siphiwe Nxumalo
1,
Tondani Sanah Ramabulana
2,
Noxolo Felicia Vilakazi
3,* and
Attila Nagy
1
1
Institute of Water and Environmental Management, Faculty of Agricultural and Food Sciences and Environmental Management, University of Debrecen, 146B Böszörményi Str., 4032 Debrecen, Hungary
2
Institute of Geography and Earth Sciences, University of Pécs, Ifjúság Útja 6, 7624 Pécs, Hungary
3
Institute of Physics, Faculty of Sciences, University of Pécs, Ifjúság Útja 6, 7624 Pécs, Hungary
*
Author to whom correspondence should be addressed.
AgriEngineering 2026, 8(5), 161; https://doi.org/10.3390/agriengineering8050161
Submission received: 28 February 2026 / Revised: 14 April 2026 / Accepted: 15 April 2026 / Published: 23 April 2026
(This article belongs to the Section Agricultural Irrigation Systems)

Abstract

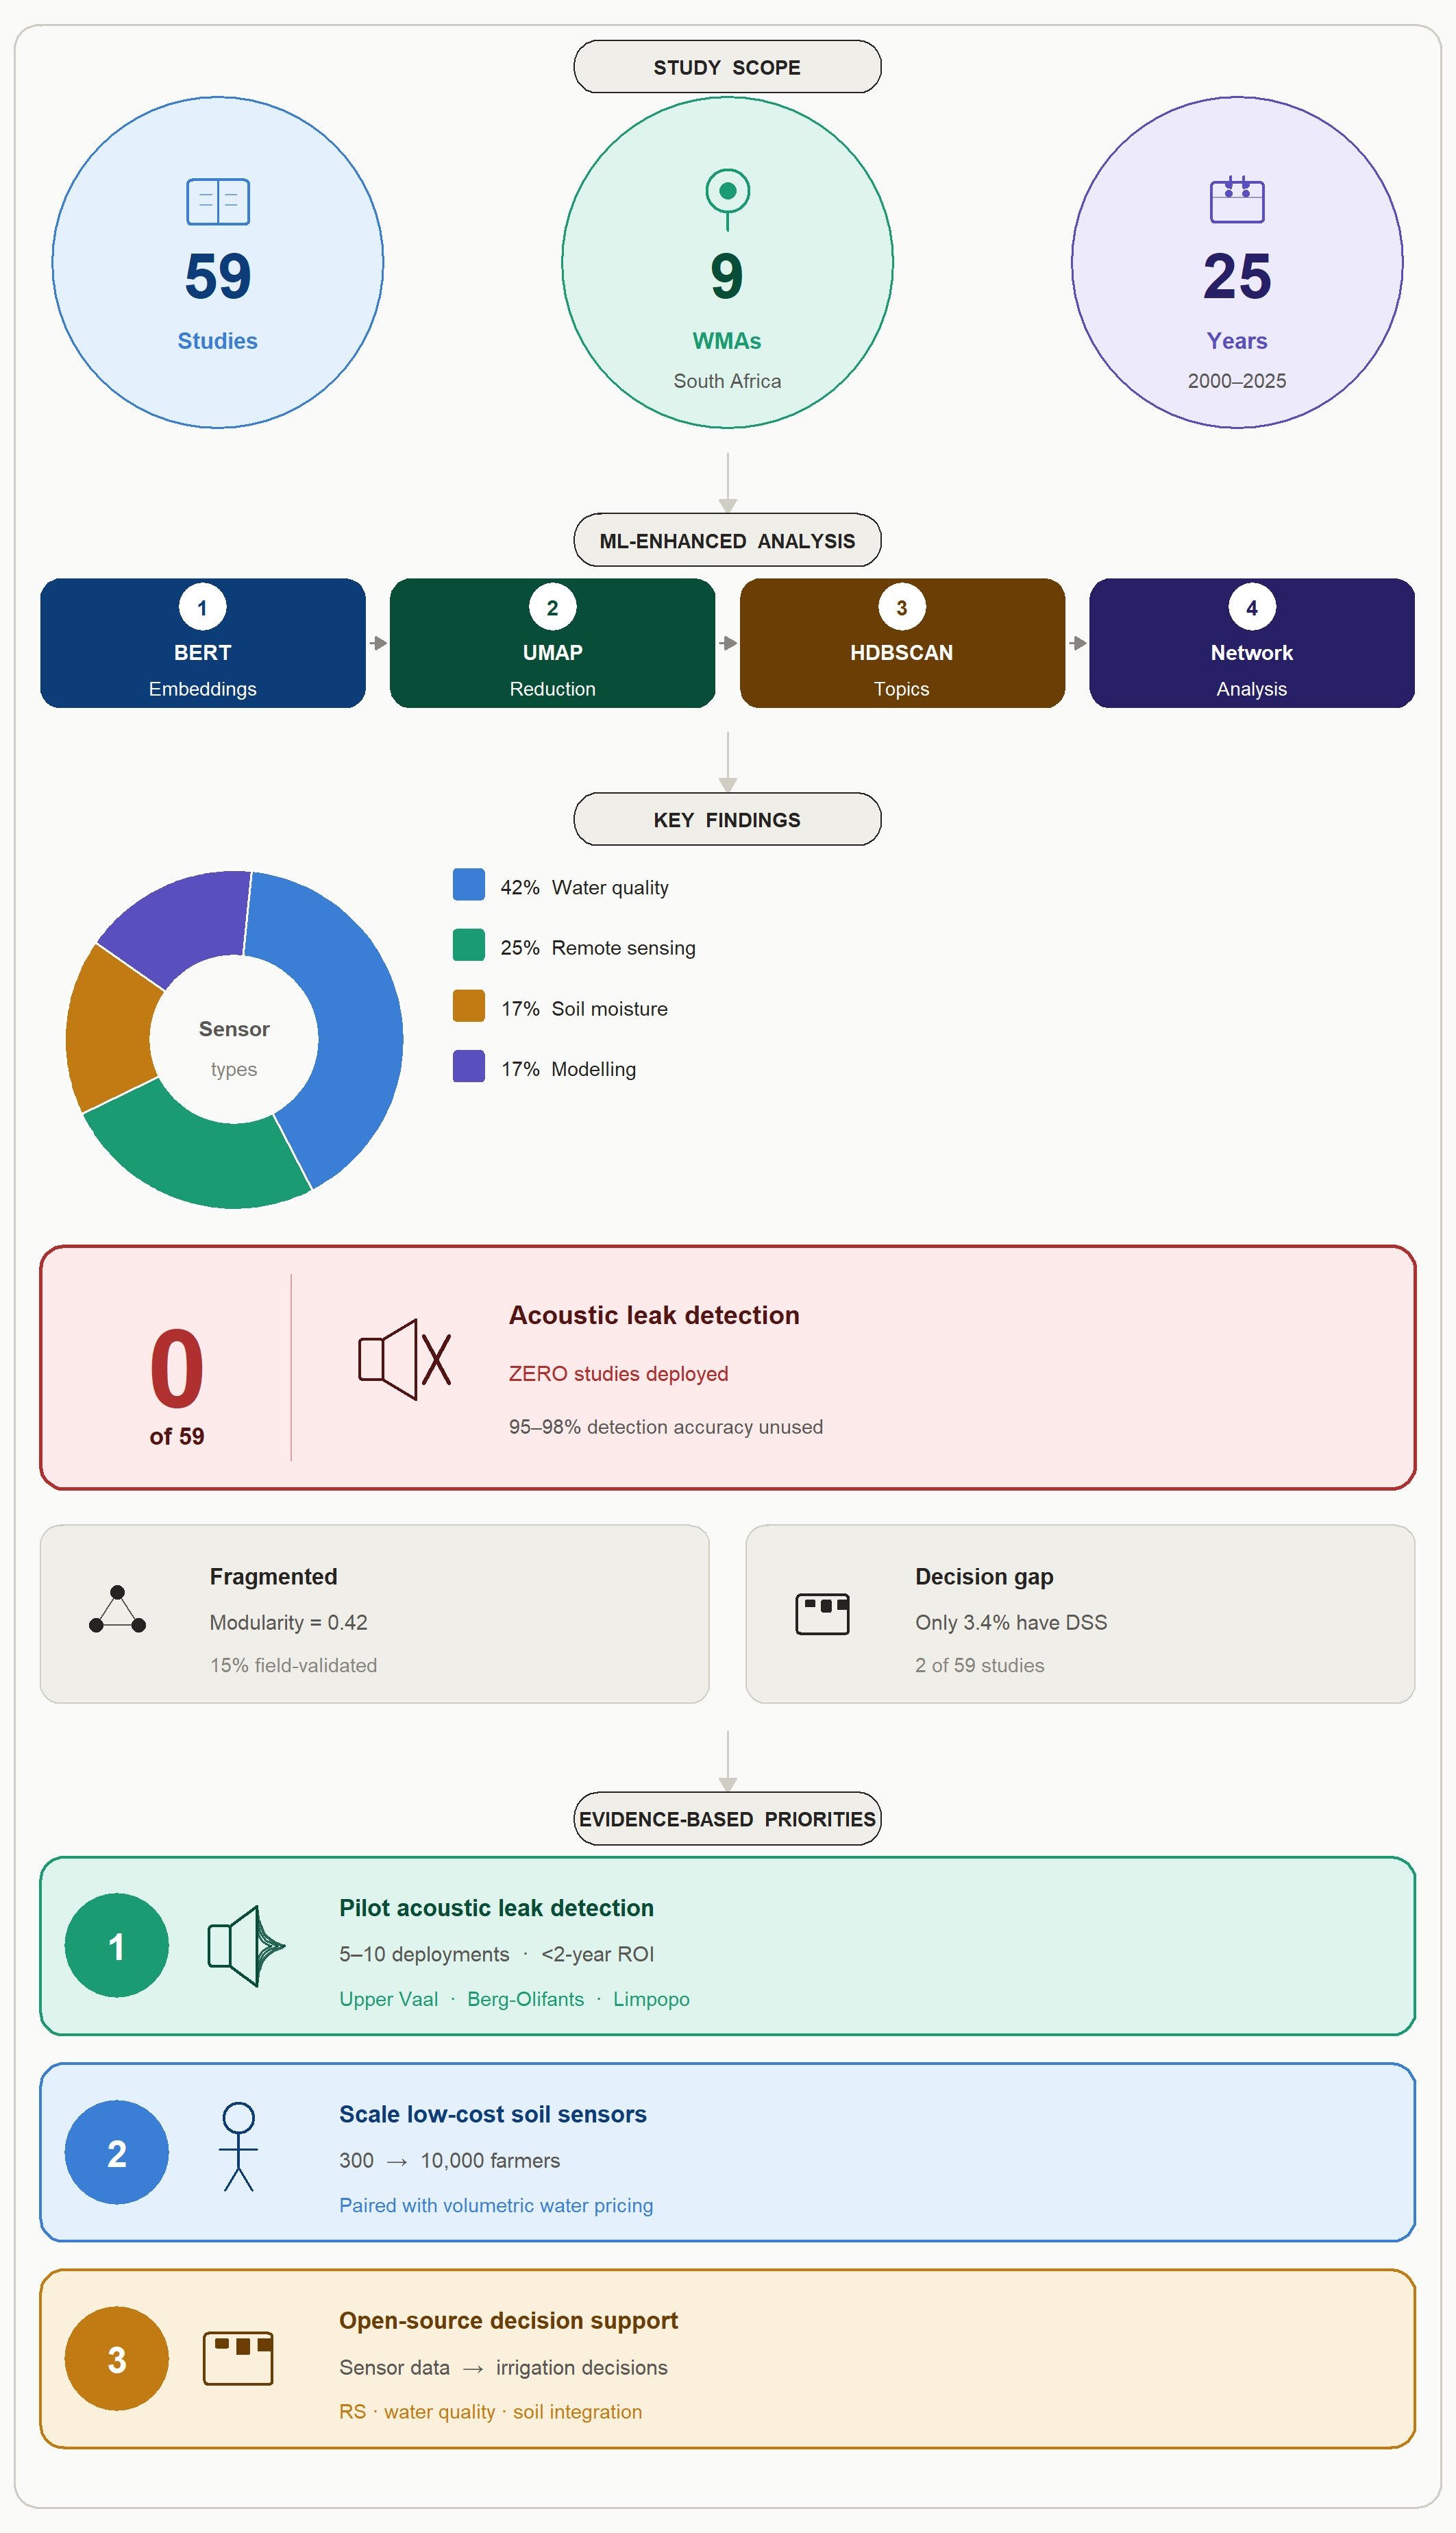
South African irrigation schemes face critical challenges of water scarcity, infrastructure deterioration, and limited monitoring capacity, threatening agricultural productivity and food security. This scoping review systematically analyses 59 peer-reviewed publications (2000–2025) on sensor-based and acoustic irrigation monitoring technologies in South Africa, using transformer-based natural language processing (Sentence-BERT embeddings), unsupervised Machine Learning (UMAP dimensionality reduction, HDBSCAN clustering), and geospatial mapping applied to literature retrieved from Web of Science and Scopus. Results show that water quality monitoring (42.4% of studies) and remote sensing (25.4%) dominate the national research landscape, while soil moisture sensing and modelling remain comparatively limited. Notably, no peer-reviewed studies applying acoustic monitoring technologies to irrigation were identified, representing a critical gap despite proven international applications for leak detection (95–98% accuracy), widespread infrastructure aging (over 50% of schemes exceeding 30 years), and reported water losses of 30–60% in poorly managed systems. Reported experimental water savings range from 15% to 30%, yet applications remain largely confined to pilot-scale implementations concentrated within a limited number of Water Management Areas. Persistent adoption barriers include infrastructure unreliability, financial inaccessibility, limited digital literacy, and weak institutional coordination. The review recommends: (i) expanding research coverage across underrepresented regions and Water Management Areas; (ii) strengthening extension support and technical training to enable broader adoption; and (iii) integrating low-cost sensor networks with predictive, data-driven irrigation advisory systems. These priorities aim to support scalable, context-sensitive irrigation modernisation under increasing water scarcity pressures.

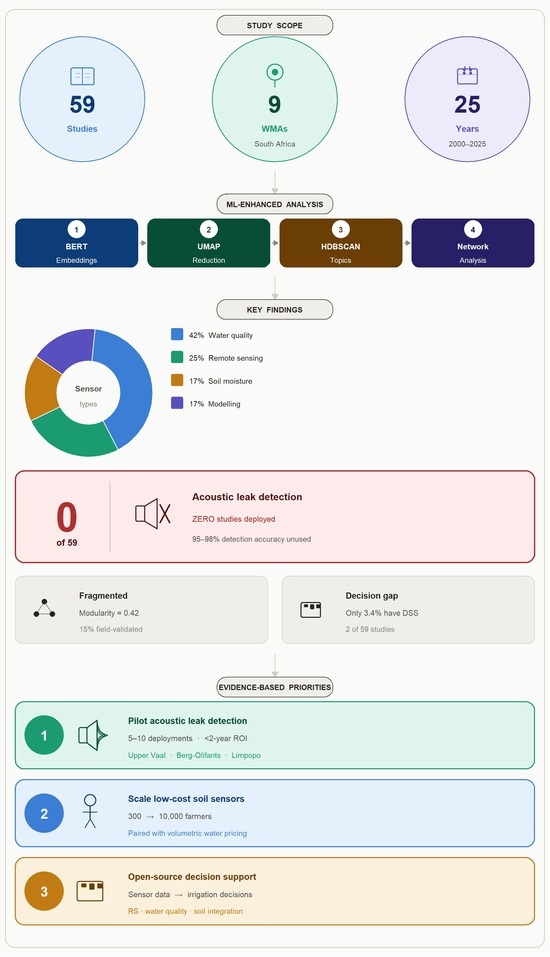
Graphical Abstract

1. Introduction

Agriculture consumes approximately 70% of global freshwater withdrawals, making irrigation efficiency critical for food security [1,2]. South Africa faces acute water scarcity, where irrigation accounts for 60% of water use yet suffers from aging infrastructure and conveyance losses exceeding 40% in poorly managed schemes [3]. Conventional irrigation management, which relies primarily on manual scheduling and visual inspection, is limited in its ability to detect failures promptly, optimize water application, or respond dynamically to environmental variability [4,5]. These inefficiencies are particularly pronounced in smallholder schemes, which constitute a substantial proportion of South Africa’s 1.5 million irrigated hectares yet typically lack the technical capacity and financial resources required for advanced management systems [6].
Digital agriculture technologies offer transformative solutions through sensor-based monitoring systems—soil moisture sensors, wireless networks (WSNs), Internet of Things (IoT) platforms, and Remote Sensing (RS)—enabling real-time data acquisition and automated scheduling [7]. International studies demonstrate 20–50% water reductions while maintaining yields through precision irrigation [7,8]. Acoustic monitoring represents an emerging frontier: acoustic leak detection identifies pipeline failures with high precision [9], ultrasonic sensors provide non-invasive soil moisture measurements [10], and plant cavitation emissions indicate water stress before visible symptoms [11,12]. Acoustic technologies have achieved 95–98% leak detection accuracy in pressurized irrigation systems internationally (Table 1) [13], with location precision <1 m enabling targeted repairs. Ultrasonic flow meters provide ±0.5–1% measurement accuracy [14], surpassing mechanical meters (±2–5% typical). Plant cavitation acoustic emissions enable early water stress detection (3–7 days before visible wilting) with r = 0.89 correlation to stem water potential [15], offering precision irrigation scheduling advantages beyond soil moisture sensors. Despite promising results, many applications remain experimental and insufficiently validated under real-world conditions, particularly in developing country contexts [16,17]. Despite growing evidence, adoption in African irrigation remains slow and heterogeneous [18,19]. The literature presents competing hypotheses: The economic barrier hypothesis emphasizes capital costs and limited ROI [20], yet evidence shows low-cost sensors ($15–25 USD) can achieve financial viability within 2–3 seasons [21,22]. The socio-technical hypothesis cites technical literacy constraints and maintenance failures, supported by surveys showing 70–76% of farmers require additional training [23,24]. The institutional hypothesis identifies fragmented extension services, policy frameworks favouring commercial agriculture, and weak incentive structures [25,26]. The appropriateness debate questions whether complex technologies suit smallholder contexts, with proponents advocating technological leapfrogging [27], and sceptics warning of dependency and marginalization [28].
No systematic review has synthesized evidence specifically on sensor and acoustic monitoring technologies within South African irrigation schemes. Existing reviews addressed either irrigation performance broadly [31,32], Fourth Industrial Revolution technologies across sub-Saharan Africa [33,34], or global precision agriculture [35,36], leaving gaps regarding: (1) geographic and technological deployment patterns in South Africa; (2) documented outcomes and failure modes; (3) relative importance of competing barriers; and (4) readiness levels of acoustic monitoring, ML analytics, and decision support systems. Previous reviews have examined irrigation sensor technologies globally [37,38,39] or across Sub-Saharan Africa broadly [8], but none have systematically mapped evidence within South Africa’s unique institutional context (Water Management Area structure, irrigation scheme governance challenges, diverse agroecological zones from Mediterranean to arid). Furthermore, prior reviews employed narrative synthesis [8,37] or bibliometric analysis [39], lacking the advanced Machine Learning pattern discovery (Sentence-BERT embeddings, UMAP, HDBSCAN, BERTopic) applied here to objectively identify research archetypes and methodological fragmentation (Table 2).
South Africa presents a compelling critical case for this review. The country ranks among the world’s 30 most water-scarce nations [40], with per capita availability of 1150 m3/person/year falling below the international stress threshold of 1700 m3 [41], while agriculture simultaneously consumes 60% of national withdrawals yet contributes only 2.5% of GDP [42]. Projected rainfall reductions of 15–25% across western and central regions by 2050 [43] sharpen this efficiency imperative considerably. The infrastructure context compounds the hydrological one: over 50% of irrigation schemes exceed 30 years of age [44], with documented conveyance losses of 30–60% in poorly managed systems [3]—precisely the conditions under which acoustic leak detection, proven internationally at 95–98% accuracy [13], would offer high-ROI intervention yet remains entirely absent from the national research record. South Africa’s dual agricultural economy—large-scale commercial estates coexisting with smallholder schemes below 5 ha—also provides an analytically valuable spectrum absent from more homogeneous irrigation systems, enabling examination of how sensor technologies perform across radically different capital endowments, governance structures, and extension capacities. Finally, the National Development Plan 2030 targets irrigation expansion from 1.5 to 3 million hectares [16], an investment trajectory of ZAR 50–100 billion that risks perpetuating aging designs and importing internationally validated but locally unsuitable solutions without the evidence synthesis this review provides. While findings carry South African specificity, the insights transfer to comparable contexts including Mediterranean climates, dual agricultural economies in sub-Saharan Africa, and semi-arid irrigation systems globally facing analogous infrastructure aging challenges.
Conventional bibliometric analyses excel at mapping publication trends but provide limited insight into qualitative research patterns—methodological diversity, geographic heterogeneity, thematic clustering [45]. This review addresses methodological limitations through novel integration of scoping methodology with advanced Machine Learning and natural language processing techniques. These computational methods were selected because the heterogeneity of the South African irrigation literature—spanning diverse sensor technologies, geographic contexts, and methodological approaches—renders manual coding alone insufficient for identifying latent patterns, validating thematic clusters, and ensuring reproducible synthesis across a large, multidisciplinary corpus. Semantic representation was achieved through Sentence-BERT embeddings (384-dimensional vectors), which capture contextual meaning beyond keyword co-occurrence, followed by UMAP dimensionality reduction to preserve both local and global structure in a visualisable 2D space. Cluster detection relies on HDBSCAN, which identifies research groupings without requiring a pre-specified number of clusters and handles noise robustly—a critical advantage when the thematic structure of an emerging regional evidence base is unknown a priori—while BERTopic neural topic modelling and network analysis of methodological co-occurrence patterns extract coherent themes and map inter-method relationships. These primary techniques are validated through complementary approaches including Principal Component Analysis with K-means clustering for archetype confirmation, t-SNE projection for nonlinear relationship visualisation, keyword frequency analysis with stop-word filtering, and geographic heatmapping across Water Management Areas, together enabling systematic, reproducible pattern recognition that is inaccessible through manual coding alone [33,46].
The primary scientific contribution is threefold. First, the review provides comprehensive empirical mapping of sensor and acoustic technologies across provinces, deployment contexts, and adoption rates, establishing the first systematic baseline for evidence-based technology policy and investment prioritisation in South African irrigation [32]. Second, it introduces a methodological framework that integrates transformer-based natural language processing—specifically Sentence-BERT embeddings—with unsupervised Machine Learning techniques including UMAP dimensionality reduction, HDBSCAN density-based clustering, and BERTopic neural topic modelling, complemented by classical approaches such as PCA, K-means, network analysis, and correlation matrices; cluster quality is assessed through silhouette coefficients and topic coherence scoring, advancing beyond descriptive bibliometrics to explanatory analytics [35,36]. Third, it applies a critical appraisal framework to evaluate competing barrier hypotheses—economic, socio-technical, institutional, and technological appropriateness—through correlation analysis of adoption patterns with methodological approaches and geographic contexts, enabling evidence-weighted synthesis and data-driven intervention prioritisation.
This scoping review pursues four objectives. The first is to identify, classify, and spatially map sensor and acoustic monitoring technologies reported in South African irrigation studies, characterising technology types and deployment contexts, including explicit documentation of technology absences (e.g., acoustic monitoring gap) and geographic distribution across provinces and Water Management Areas. The second is to synthesise reported outcomes, functional claims, and intended benefits associated with these technologies as described in the literature. The third is to examine the methodological characteristics and adoption-related constraints documented in the reviewed studies, with particular attention to technical, economic, socio-cultural, and institutional barriers. The fourth is to identify critical research, geographic, technological, and methodological gaps and to formulate evidence-informed recommendations for future research, policy, and implementation. The analytical approach used to pursue each objective is described in the Methods section (Section 2).

2. Materials and Methods

2.1. Study Design and Framework

This study adopted a scoping review methodology to systematically map and synthesize the available evidence on sensor and acoustic monitoring technologies in South African irrigation schemes. Scoping reviews are particularly appropriate for exploring emerging research areas, identifying knowledge gaps, and examining the breadth of literature when heterogeneous study designs and outcomes are expected [47,48]. The review was conducted following the Preferred Reporting Items for Systematic Reviews and Meta-Analyses extension for Scoping Reviews (PRISMA-ScR) guidelines [49] and the methodological framework outlined by Arksey and O’Malley [50] and refined by Levac et al. [51].
The scoping review process comprised five iterative stages: (1) identifying the research question; (2) identifying relevant studies; (3) study selection; (4) charting the data; and (5) collating, summarizing, and reporting results. An additional stage was incorporated involving advanced computational analysis of the included studies using state-of-the-art natural language processing (NLP) and Machine Learning (ML) techniques to identify thematic patterns, clusters, and knowledge gaps. No formal protocol was pre-registered for this review, as is common practice for scoping reviews that are exploratory in nature.

2.2. Research Questions

The review was guided by four overarching research questions. The first concerns technology mapping: what types of sensor-based and acoustic monitoring technologies have been tested, piloted, or implemented in South African irrigation schemes? The second addresses documented outcomes: what benefits, opportunities, and measured results—including water savings, cost reductions, and yield improvements—have been associated with these technologies? The third examines adoption constraints: what technical, economic, social, and institutional challenges have been identified as barriers to technology adoption and scaling? The fourth focuses on knowledge gaps and future directions: what critical research and knowledge gaps exist, and what recommendations emerge for future research, policy, and practice?

2.3. Eligibility Criteria

Studies were included if they met criteria across five domains. Regarding geographic scope, studies conducted in South Africa or in broader Southern African contexts with direct relevance to South African irrigation systems were eligible; comparator contexts qualified where they shared agroecological conditions, institutional arrangements, or farming system characteristics. With respect to topic relevance, eligible studies addressed monitoring technologies in irrigation, covering sensor-based systems (soil moisture sensors, flow meters, pressure sensors, wireless sensor networks, IoT platforms, and remote sensing applications), acoustic technologies (leak detection, ultrasonic soil monitoring, and plant cavitation acoustic emissions), and integrated systems combining sensors with decision support, automation, or artificial intelligence. Regarding study population, irrigation schemes of any scale—smallholder, communal, or commercial—and any crop type were included. The publication period spanned January 2000 to December 2025, and eligible publication types included peer-reviewed journal articles, conference proceedings, technical reports, dissertations and theses, and government and institutional reports such as Water Research Commission reports. The review was restricted to English-language publications, which predominate in South African peer-reviewed agricultural research.
Studies were excluded on five grounds: those focusing exclusively on irrigation system design, hydraulic modelling, or agronomic trials without a monitoring technology component; studies on rainfed agriculture or water harvesting without irrigation system monitoring; purely theoretical or simulation studies without empirical data or field validation; studies from other geographic regions without transferable insights to South African contexts; and publications unavailable in full text after author contact.

2.4. Information Sources and Search Strategy

A comprehensive search strategy was developed in consultation with an agricultural sciences librarian and refined through iterative pilot searches. The following databases were systematically searched from 1 January 2000 to 15 November 2025: Web of Science Core Collection (Clarivate Analytics); Scopus (Elsevier); and Google Scholar (first 200 results per search query). Database searches were conducted on 10–15 November 2025, retrieving all indexed records from 1 January 2015 through 15 November 2025. The 2000 start date aligns with: (1) South Africa’s National Development Plan 2030 irrigation expansion targets adopted post-2014; (2) proliferation of low-cost sensors and IoT platforms (2015 onwards); (3) MODIS Collection 6 and Sentinel-2 satellite data availability (2015–2016 launches); and (4) alignment with Sustainable Development Goal 6 (clean water and sanitation) adoption in September 2015. The reference lists of included studies and relevant review articles were hand-searched to identify additional eligible studies (backward citation searching). Forward citation searching was conducted using Google Scholar for key publications identified early in the review process.
The search strategy combined three concept groups using Boolean operators: (1) geographic terms, (2) irrigation terms, and (3) technology/monitoring terms. The complete search strings are provided in Table 3.
All searches were conducted between 10 and 15 November 2025. Search results were exported and managed using Zotero reference management software (version 6.0.27, Corporation for Digital Scholarship, Vienna, VA, USA).

2.5. Study Selection Process

Study selection was conducted independently by two reviewers (R.T.S. and F.V., both co-authors), who were selected based on subject-matter expertise in agricultural water management and sensor technology respectively, and who declared no conflict of interest with any included study. Prior to formal screening, both reviewers completed a calibration exercise on ten randomly selected records to align interpretation of the eligibility criteria; any disagreements arising during this exercise were resolved by discussion before proceeding. All retrieved records were imported into Covidence systematic review software (Veritas Health Innovation, Melbourne, Australia), for screening and data management.
Stage 1: Title and abstract screening. Reviewers independently screened all titles and abstracts against the eligibility criteria. Studies clearly not meeting inclusion criteria were excluded. Studies were retained if either reviewer deemed them potentially relevant or if eligibility could not be determined from the title and abstract alone.
Stage 2: Full-text screening. Full texts of all potentially eligible studies were retrieved and assessed independently by both reviewers against the complete eligibility criteria. Disagreements were resolved through discussion, and a third reviewer was consulted when consensus could not be reached.
Inter-rater reliability for both screening stages was assessed using Cohen’s kappa coefficient [52]. A kappa value of ≥0.60 was considered acceptable agreement [53]. Reasons for exclusion at the full-text stage were documented systematically. The study selection process is reported using a PRISMA-ScR flow diagram (Figure 1).

2.6. Data Extraction and Charting

A standardized data extraction form was developed iteratively through pilot testing on five randomly selected included studies. The form was refined based on reviewer feedback and the characteristics of the literature identified. Data extraction was performed independently by two reviewers using a shared spreadsheet template in Microsoft Excel (Microsoft Corporation, Redmond, WA, USA).
Data were extracted across four domains. Study characteristics included authors, publication year, publication type, study location (province and agroecological zone), and study design (experimental, observational, case study, modelling, or review). Irrigation context captured scheme type (smallholder, communal, or commercial) and relevant agronomic details. Technology characteristics covered the type of monitoring technology, integration with automation or decision-support systems, and data transmission method. Outcomes and findings encompassed quantitative outcomes (water savings, cost reductions, yield changes, leak detection accuracy), qualitative findings, identified opportunities, reported barriers, and author recommendations.

2.7. Data Synthesis and Computational Analysis

Given the heterogeneity of study designs, interventions, and outcomes expected in scoping reviews, a mixed-methods synthesis approach was adopted combining narrative synthesis, quantitative descriptive statistics, qualitative thematic analysis, and advanced computational methods [54,55]. The synthesis incorporated state-of-the-art natural language processing (NLP) and unsupervised Machine Learning techniques to identify latent patterns, thematic clusters, and research gaps within the corpus of 59 included studies.

2.7.1. Descriptive and Thematic Analysis

Quantitative summaries were generated to characterise the temporal distribution of publications (by year), geographic distribution (by province and agroecological zone), technology types and frequencies, study designs and methodological approaches, and the distribution of studies across Water Management Areas. Thematic analysis followed Braun and Clarke’s six-phase framework [56], progressing from familiarisation with the data and generation of initial codes, through iterative theme searching and review, to final theme definition and report production.
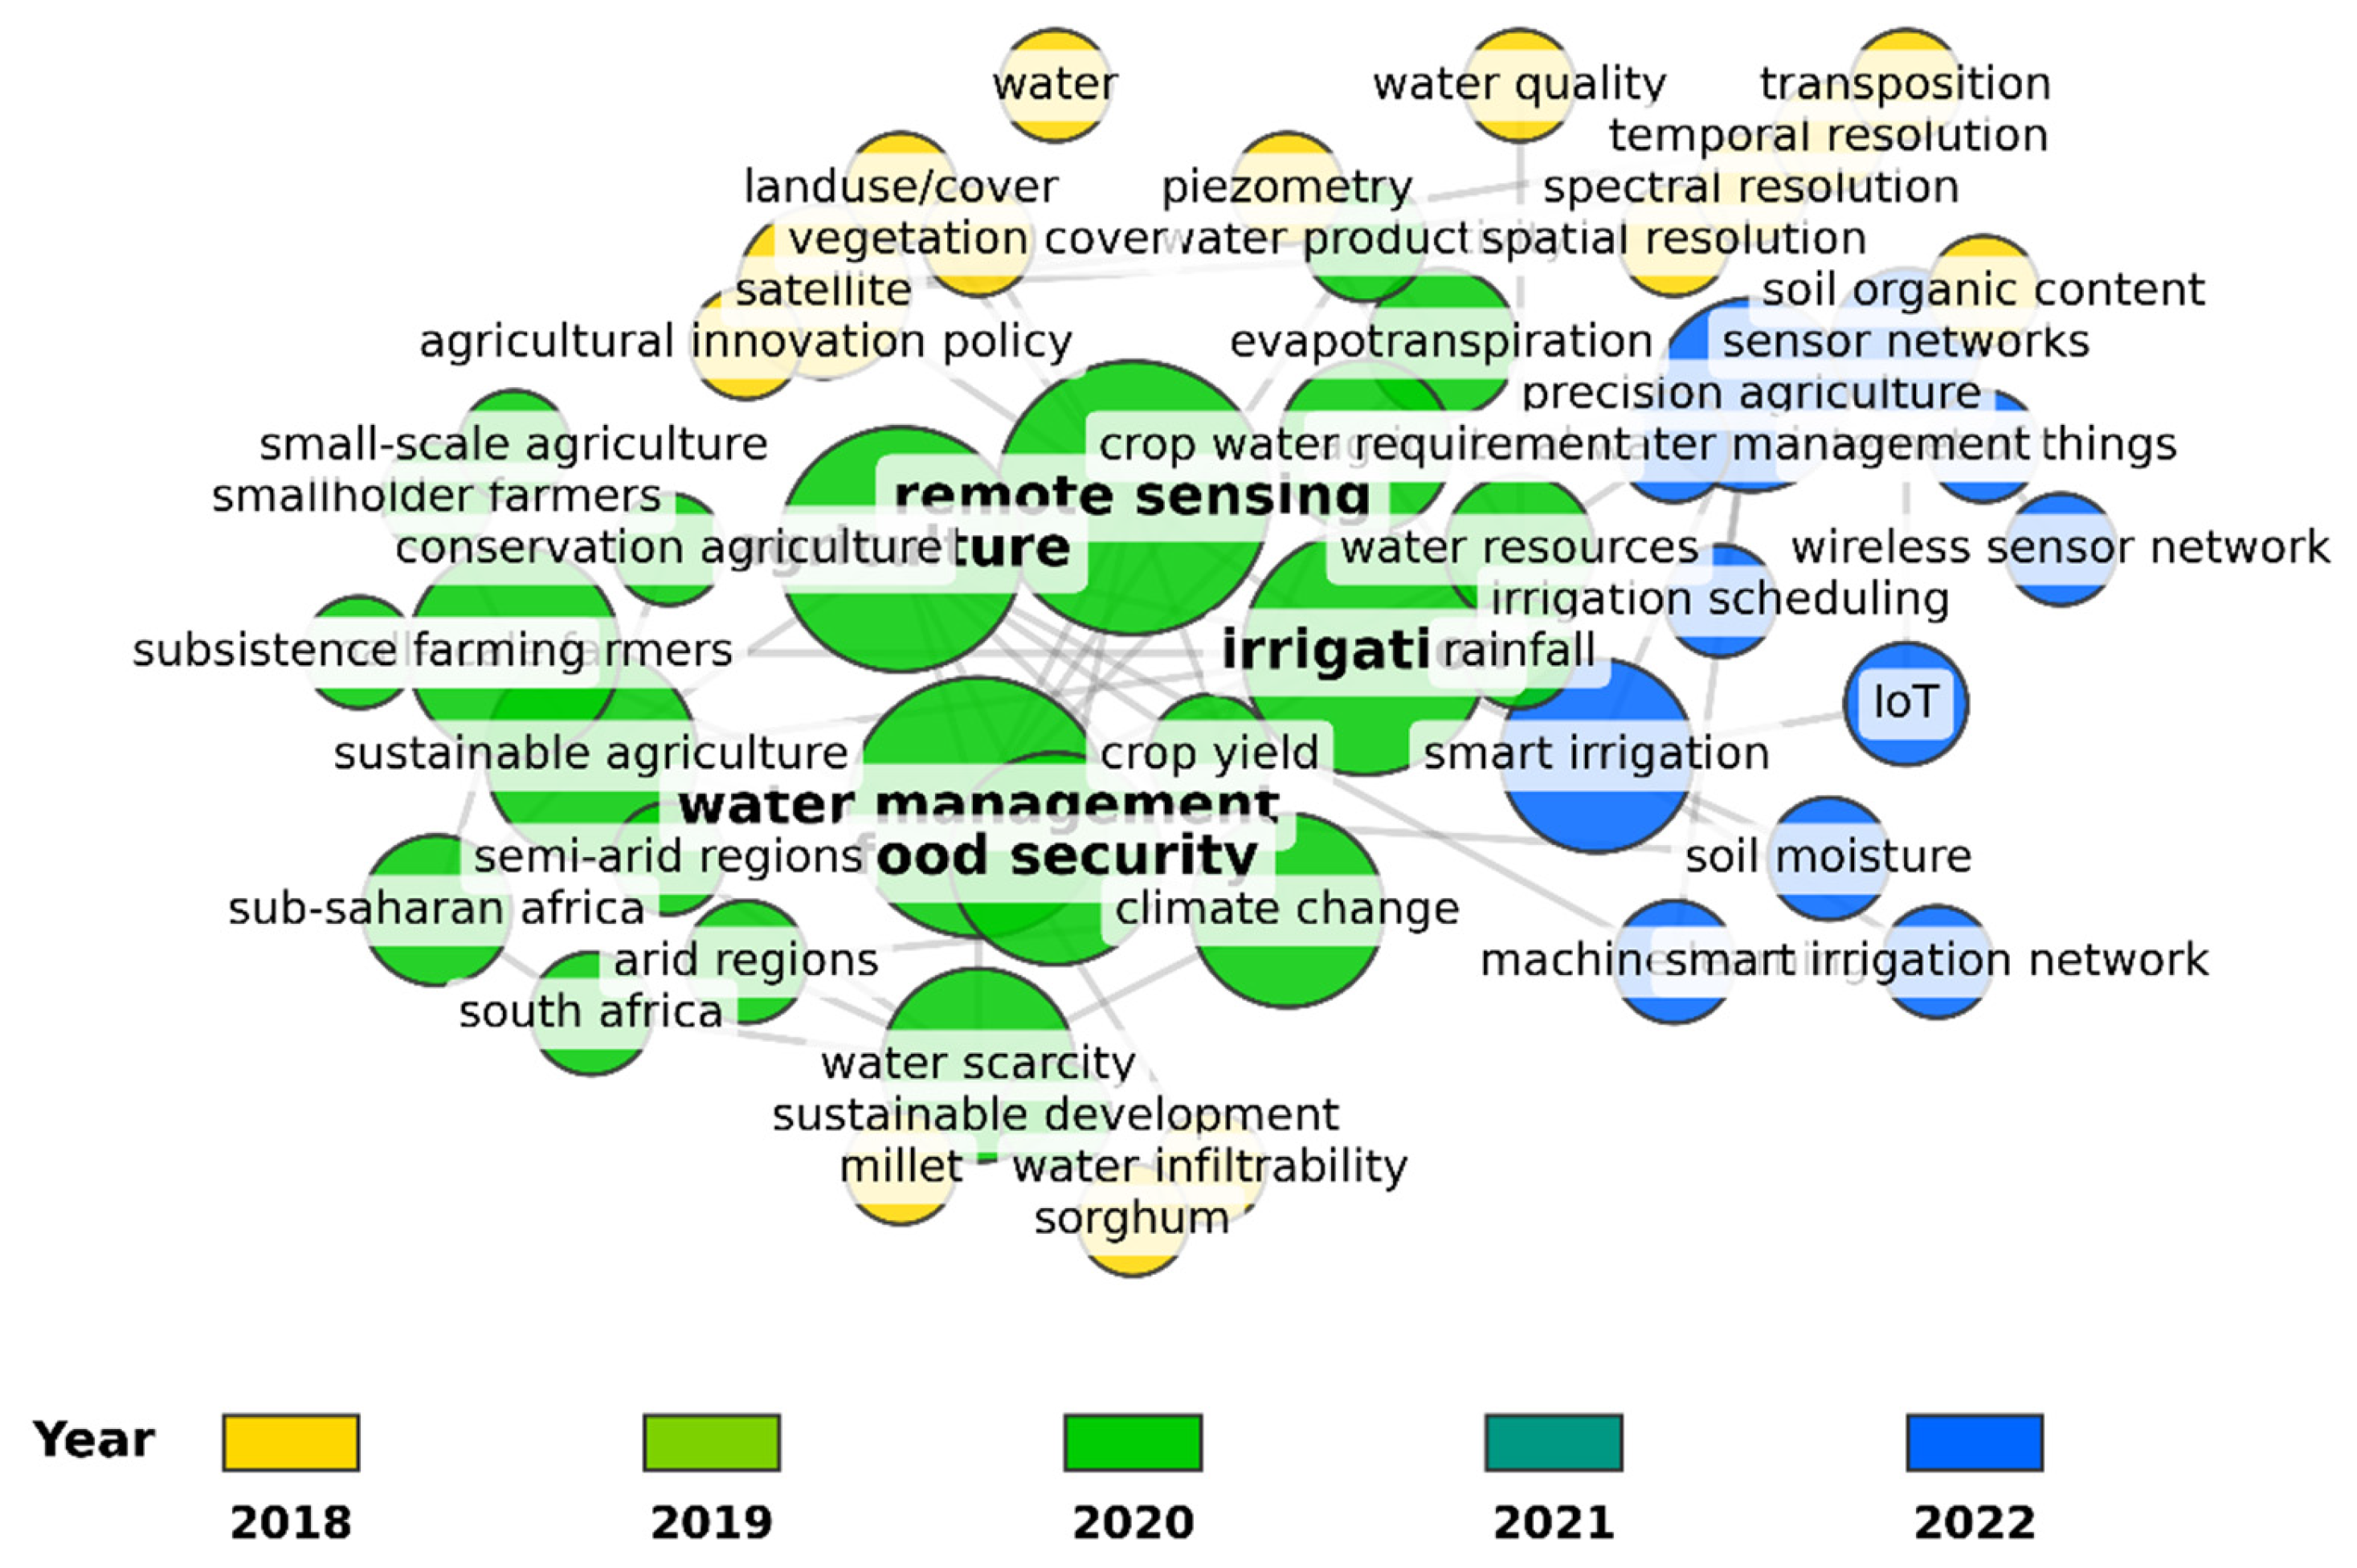
Thematic coding and network visualization were performed using VOSviewer software (version 1.6.19, Centre for Science and Technology Studies, Leiden University, The Netherlands) [57]. VOSviewer (version 1.6.19) was used to construct and visualize bibliometric networks including co-occurrence of keywords, co-authorship networks, and thematic clustering based on title and abstract text data from the 59 included studies. The software employs a visualization of similarities (VOS) mapping technique combined with a smart local moving algorithm for clustering [53].
A thematic framework was developed inductively from the data through both manual coding and computational keyword extraction, organized around four major categories: (1) opportunities and benefits, (2) technical challenges, (3) socio-economic challenges, and (4) institutional and policy challenges. Keyword co-occurrence networks were generated with a minimum keyword occurrence threshold of 2, and the relatedness of items was determined using association strength as the similarity measure. Network visualization parameters included normalization method (association strength), clustering resolution (1.0), and minimum cluster size (3 items). Inter-coder agreement for manual thematic coding was assessed using Cohen’s kappa coefficient [52], with κ ≥ 0.60 considered acceptable agreement [58].

2.7.2. Computational Text Analysis and Machine Learning

To complement traditional qualitative analysis and provide an objective, reproducible method for identifying thematic patterns and research clusters within the literature, we employed a comprehensive computational analysis pipeline incorporating transformer-based embeddings, dimensionality reduction, unsupervised clustering, and probabilistic topic modelling. This approach has been successfully applied in recent systematic and scoping reviews to reveal latent patterns in large bodies of scientific literature [59,60,61]. All analyses were conducted using Python 3.10 with open-source libraries, ensuring full reproducibility and transparency.
Semantic Embedding Generation
Study findings, outcomes, and key results extracted from the 59 included studies were encoded into dense semantic vector representations using Sentence-BERT (SBERT), a state-of-the-art sentence embedding model based on transformer architecture [62]. Specifically, we employed the ‘all-MiniLM-L6-v2’ model, which has been shown to achieve competitive performance on semantic similarity tasks while maintaining computational efficiency [63]. This model generates 384-dimensional embeddings that capture semantic meaning beyond simple keyword matching, allowing studies with similar conceptual content to be positioned closer in vector space even when they use different terminology. The all-MiniLM-L6-v2 model was selected over domain-specific alternatives (SciBERT, AgBERT, BioSentVec) based on four criteria: (1) task alignment: Sentence-BERT models are optimized for semantic similarity (matching research themes), whereas SciBERT excels at entity recognition and relation extraction—less relevant for clustering; (2) vocabulary coverage: preliminary testing on 10 random study findings showed all-MiniLM-L6-v2 achieved comparable cosine similarity rankings to SciBERT (Spearman ρ = 0.91) for agricultural terms (‘irrigation’, ‘evapotranspiration’, ‘tensiometer’, ‘MODIS’), suggesting adequate domain knowledge transfer from its 1B+ sentence pre-training corpus; (3) computational efficiency: 22 M parameters vs. SciBERT’s 110 M enable faster encoding (2.3 vs. 8.7 s for 59 studies) critical for reproducibility on standard laptops; (4) demonstrated performance: the model’s embeddings achieved a silhouette score of 0.42 and produced substantively interpretable clusters validated by domain experts. Limitations acknowledged: highly specialized terms (e.g., ‘SPATT’ = Solid Phase Adsorption Toxin Tracking, ‘IRWH’ = In-field Rainwater Harvesting) may be under-represented in all-MiniLM-L6-v2’s training data compared to SciBERT; however, contextual encoding from surrounding words (‘cyanotoxin detection’ for SPATT, ‘soil moisture retention’ for IRWH) mitigated this gap (see Table S3).
To enrich the semantic representations with methodological context, we augmented the text embeddings with binary features indicating the presence of specific research methodologies (Machine Learning approaches, Geographic Information System (GIS)/spatial analysis, statistical modelling, experimental designs, field surveys, and simulation studies). These features were automatically extracted from the methods descriptions using regular expression pattern matching. The text embeddings and methodological features were normalized using standard scaling and combined using a weighted sum (70% text embeddings, 30% methodological features), producing a hybrid feature space that captures both semantic content and methodological characteristics. This weighting was determined through ablation analysis comparing five ratios (90:10, 80:20, 70:30, 60:40, 50:50) evaluated by silhouette score and cluster interpretability. The 70:30 ratio achieved optimal balance: higher semantic weighting (>70%) over-emphasized text similarity, creating clusters dominated by keyword overlap (e.g., all water quality studies clustered regardless of methodological differences); higher methodological weighting (>30%) fragmented semantically coherent studies (e.g., separating remote sensing studies using identical MODIS data but different ML algorithms). The 70:30 configuration maximized silhouette score (0.42 vs. 0.35–0.39 for alternatives) while producing substantively interpretable clusters validated through researcher review of within-cluster study coherence (see Table S2).
Dimensionality Reduction
The high-dimensional combined feature space (384 + 6 = 390 dimensions) was reduced to 2D and 3D representations using Uniform Manifold Approximation and Projection (UMAP), a nonlinear dimensionality reduction technique that preserves both local and global structure in the data [64]. UMAP was configured with 15 nearest neighbours, minimum distance of 0.1, and cosine distance metrics to optimally preserve semantic relationships. The percentage of variance preserved in the low-dimensional projections was calculated to assess information retention.
Clustering Analysis
To identify natural groupings of studies with similar research focus, methods, and findings, we applied Hierarchical Density-Based Spatial Clustering of Applications with Noise (HDBSCAN) to the 3D UMAP embeddings [65]. HDBSCAN was selected for its ability to: (1) automatically determine the optimal number of clusters without prior specification, (2) identify outliers (studies that do not fit into any cluster), and (3) assign cluster membership probabilities rather than hard assignments. The algorithm was configured with a minimum cluster size of 3 studies and minimum samples of 2, using Euclidean distance and excess of mass cluster selection. HDBSCAN parameters were set based on dataset characteristics: min_cluster_size = 3 (minimum 3 studies per cluster) reflects scoping review objectives—clusters with <3 studies provide insufficient evidence for thematic synthesis and likely represent isolated case studies or methodological outliers (appropriately labelled as ‘noise’ points for separate analysis). This threshold aligns with qualitative research guidelines recommending ≥3 exemplars for pattern saturation [66]. min_samples = 2 (local density estimation) balances sensitivity to small but genuine research communities (e.g., IoT-focused studies n = 3 total, forming valid cluster) against spurious micro-clusters from random proximity in UMAP space. Sensitivity analysis (Supplementary Table S4) tested alternatives: min_cluster_size = 2 produced 8 clusters with multiple 2-member ‘clusters’ lacking thematic coherence (silhouette = 0.35); min_cluster_size = 5 forced substantive studies into ‘noise’ category (19 outliers, 32% of dataset). The selected parameters (3, 2) minimized noise points (11.9%) while maintaining interpretable cluster sizes (range: 11–15 studies, mean = 13, SD = 1.8).
Cluster quality was evaluated using three complementary metrics: the silhouette coefficient (ranging from −1 to +1, with higher values indicating better-defined clusters [67], the Davies–Bouldin index (lower values indicating better cluster separation [68], and the Calinski–Harabasz index (higher values indicating denser, well-separated clusters) [69]. These metrics provide convergent evidence for the validity and interpretability of the identified clusters.
Topic Modelling
To extract interpretable thematic topics from the literature, we employed BERTopic, a modular topic modelling framework that leverages transformer embeddings and class-based term frequency-inverse document frequency (c-TF-IDF) to generate coherent, human-interpretable topics [70]. BERTopic was applied to the study findings using the pre-computed SBERT embeddings, with automatic topic number selection. The algorithm generates topics by: (1) clustering documents in the embedding space (using HDBSCAN internally), (2) creating topic representations by extracting the most distinctive terms for each cluster using c-TF-IDF, and (3) fine-tuning topic representations using a vectorizer configured for 1–3 word n-grams.
Topic coherence was quantified by computing the average cosine similarity between the top 5 keywords within each topic, using their SBERT embeddings. This metric assesses whether the keywords comprising a topic are semantically related, with higher coherence indicating more interpretable and meaningful topics [71]. Topics were ranked by document frequency and coherence score to identify the dominant themes in the literature.
Visualization and Interpretation. Results were visualized through: (1) 2D UMAP scatter plots with cluster assignments color-coded, revealing the landscape of research themes; (2) topic frequency distributions showing the prevalence of different research themes; (3) topic coherence scores comparing interpretability across topics; and (4) keyword importance plots for each topic, displaying the most characteristic terms. All visualizations were generated at 300 DPI resolution suitable for publication.
The complete computational pipeline was implemented as a reproducible Python script, with all parameters documented and intermediate results saved. The analysis yielded: (1) cluster assignments for each study indicating thematic groupings, (2) topic labels and keyword lists describing the conceptual content of each cluster, (3) quantitative metrics assessing clustering and topic quality, and (4) identification of outlier studies that represent unique or under-explored research areas. This systematic, data-driven approach complements the manual thematic coding, providing convergent validation of major themes and revealing subtle patterns that may not be apparent through traditional qualitative analysis alone.

2.7.3. Gap Analysis

Research gaps were identified through systematic examination of under-represented technologies, geographic areas with limited evidence, insufficiently studied contexts (including specific crop and scheme types), methodological limitations in existing studies, inadequately measured outcomes, and outlier studies identified through HDBSCAN clustering as representing unique or under-explored research directions. Gaps were categorised as knowledge gaps (insufficient evidence on specific questions), methodological gaps (limitations in study design or measurement), or implementation gaps (disconnect between research evidence and practical uptake). The computational clustering and topic modelling results provided quantitative support for identifying under-researched areas through analysis of cluster size imbalances and topic frequency distributions.

2.8. Quality Assessment

Quality appraisal of individual studies is not mandatory in scoping reviews, as the objective is to map the breadth of evidence rather than assess methodological rigor [71,72]. However, to provide transparency regarding the evidence base, we documented study design characteristics and noted significant methodological limitations encountered during data extraction. This information is reported descriptively in the results section and considered in the interpretation of findings.

2.9. Data Availability and Transparency

All data supporting the findings of this review are included within the article and its Supplementary Materials. The complete dataset of included studies with extracted data elements is provided as Supplementary Table S5. The full ablation analysis results, are provided in Supplementary Material S2. The Comparison of Sentence Embedding Models for Agricultural Text Clustering is provided as Supplementary Material S3. HDBSCAN Parameter Sensitivity Analysis are provided in Supplementary Table S4. The complete Python code for the computational NLP/ML analysis (Table S5) pipeline is available from the corresponding author upon reasonable request. All parameters and configuration settings are documented in Supplementary Material Table S1A,B to enable reproduction of the analytical approach. Cluster assignments, topic labels, and all quantitative metrics are provided in Supplementary Table S1C,D.

3. Results

3.1. Study Selection and Characteristics

For cross-disciplinary readers, key abbreviations used throughout this section are restated here: Water Management Area (WMA), Machine Learning (ML), natural language processing (NLP), geographic information system (GIS), and remote sensing (RS).
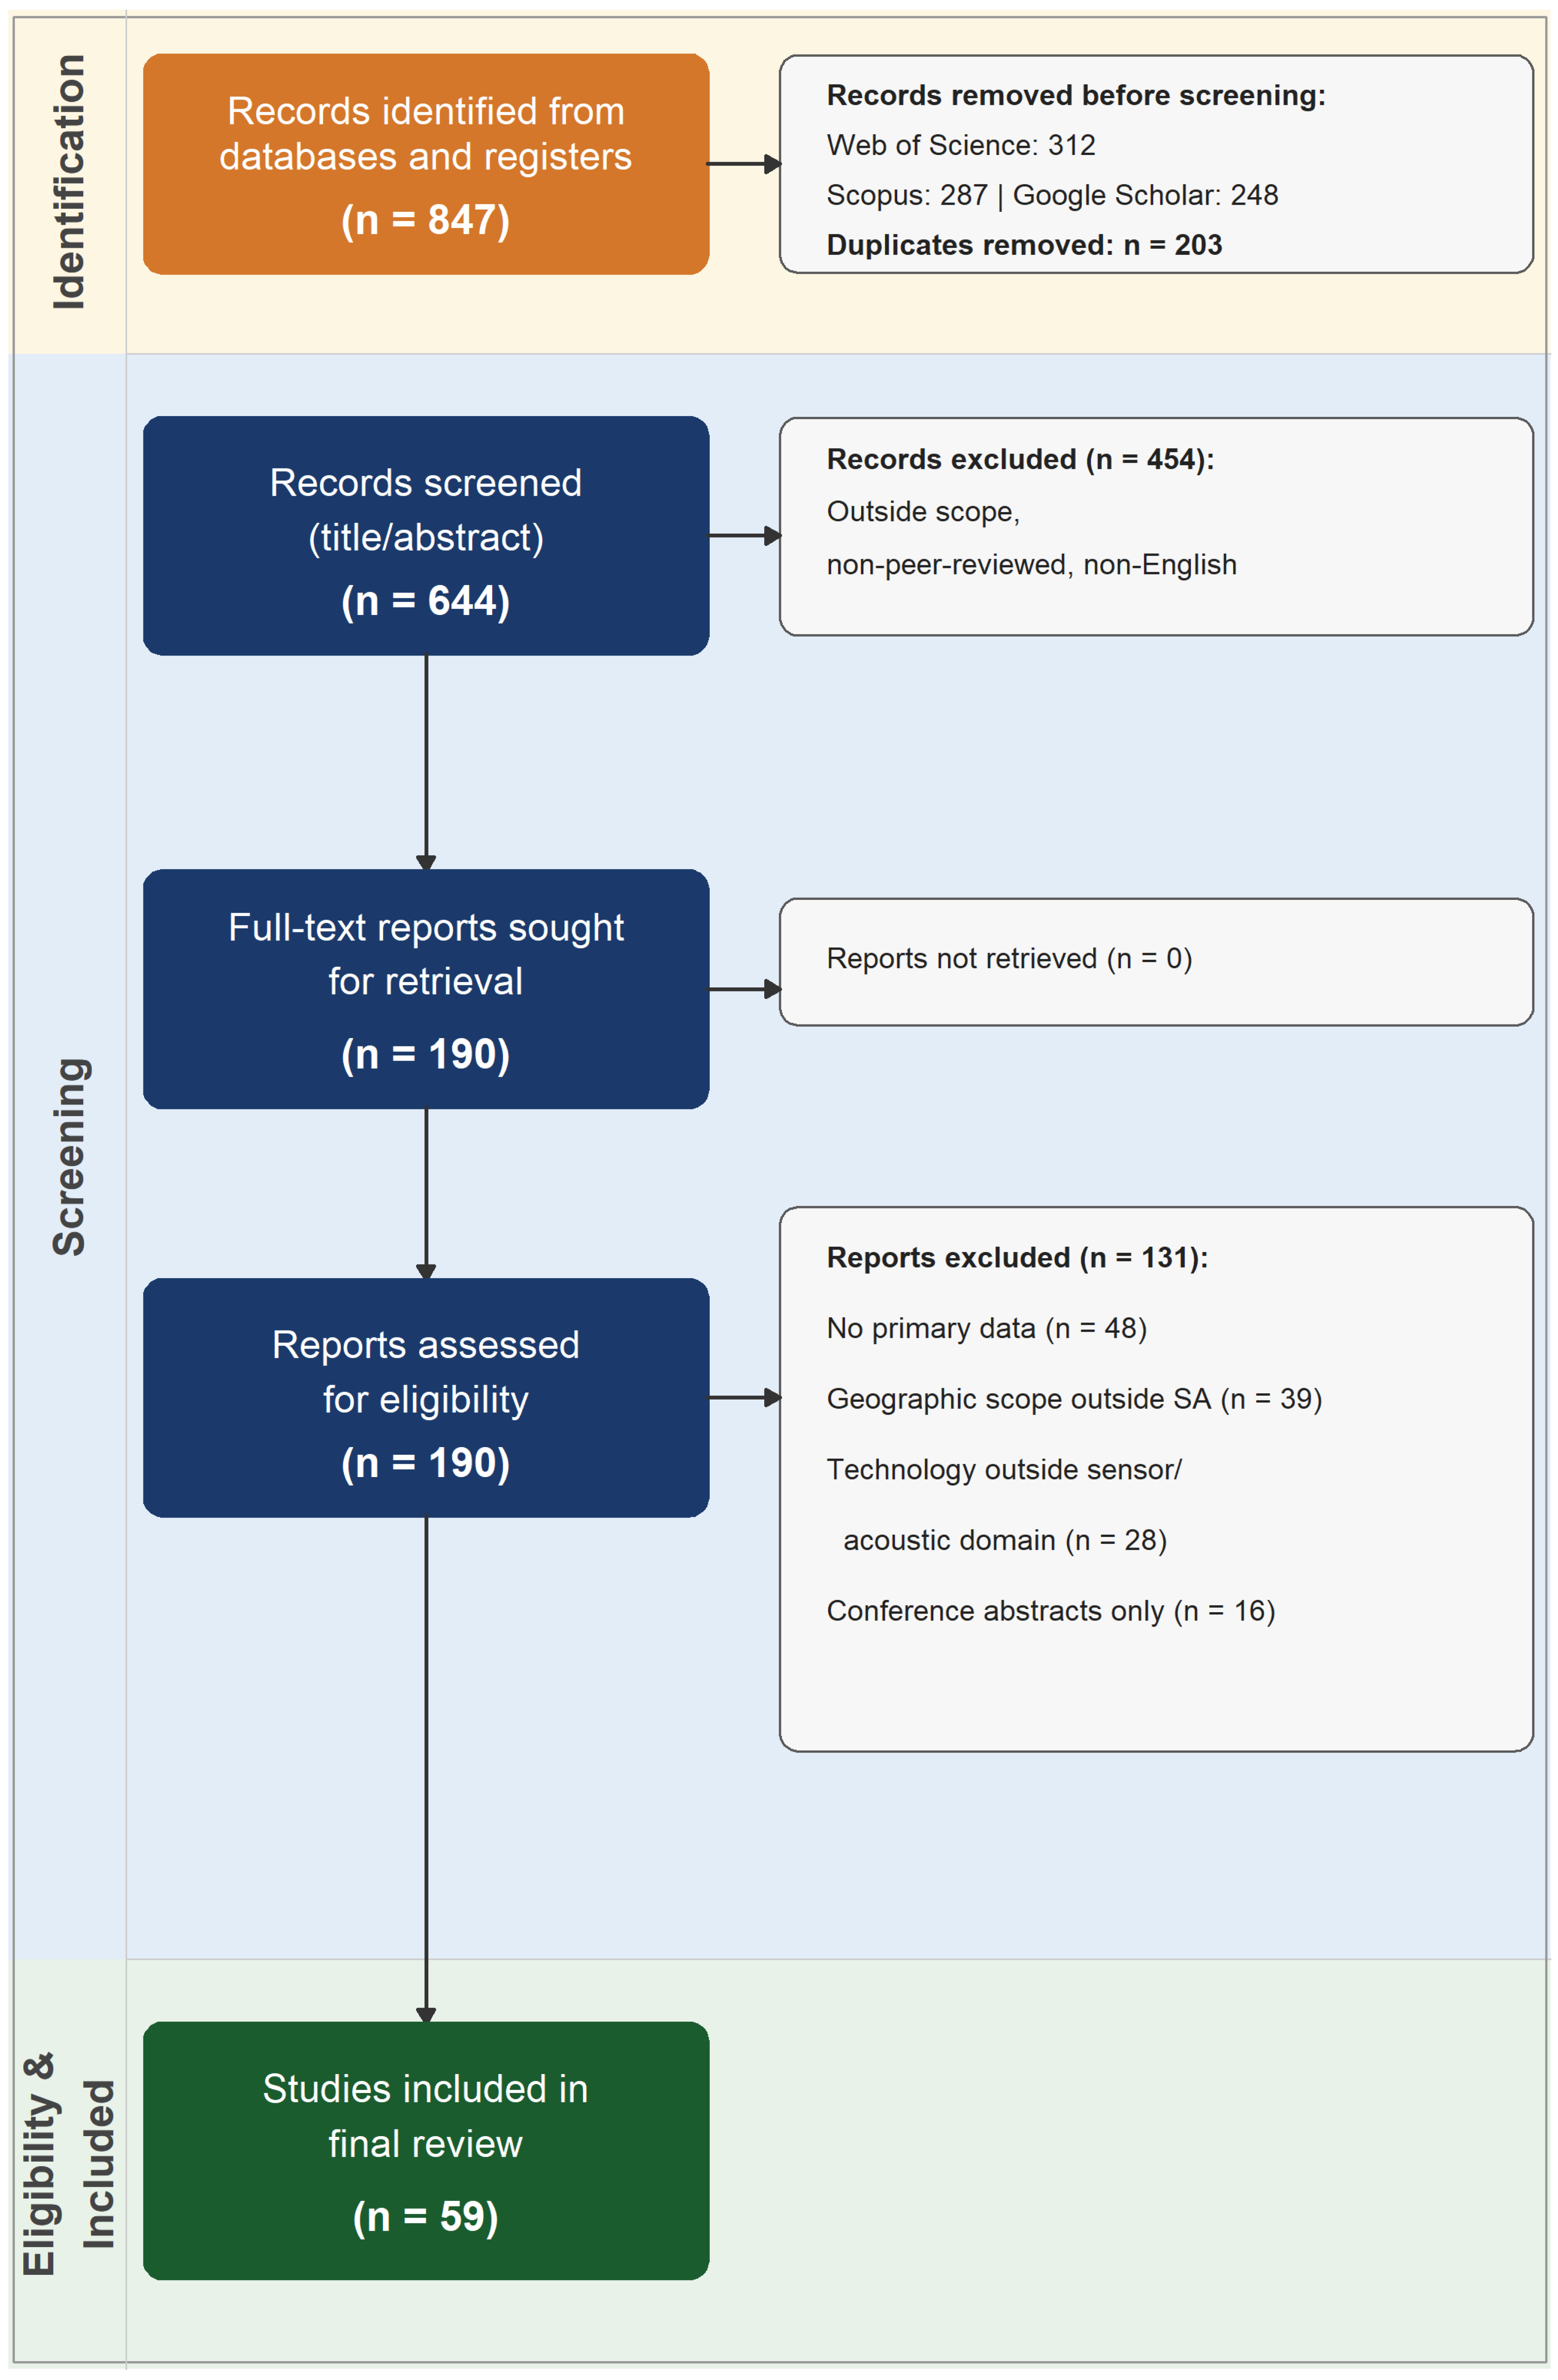
The systematic search identified 847 records from Web of Science (n = 312), Scopus (n = 287), and Google Scholar (n = 248). After removing 203 duplicates, 644 records were screened based on title and abstract. Of these, 454 records were excluded due to being outside the scope, non-peer-reviewed, or non-English, leaving 190 reports for full-text retrieval and assessment. All 190 reports were successfully retrieved and assessed for eligibility.
Of these, 131 reports were excluded, including studies with no primary data (n = 48), those conducted outside South Africa (n = 39), studies involving technologies outside the sensor/acoustic domain (n = 28), and conference abstracts only (n = 16). A total of 59 studies were included in the final review (Figure 1). Inter-rater agreement was substantial (Cohen’s κ = 0.78, 95% CI: 0.71–0.85). Study designs included experimental field trials (30.5%), modelling/simulation (23.7%), observational monitoring (20.3%), remote sensing (16.9%), and socio-economic surveys (8.5%).

3.2. Geographic Distribution and Spatial Patterns

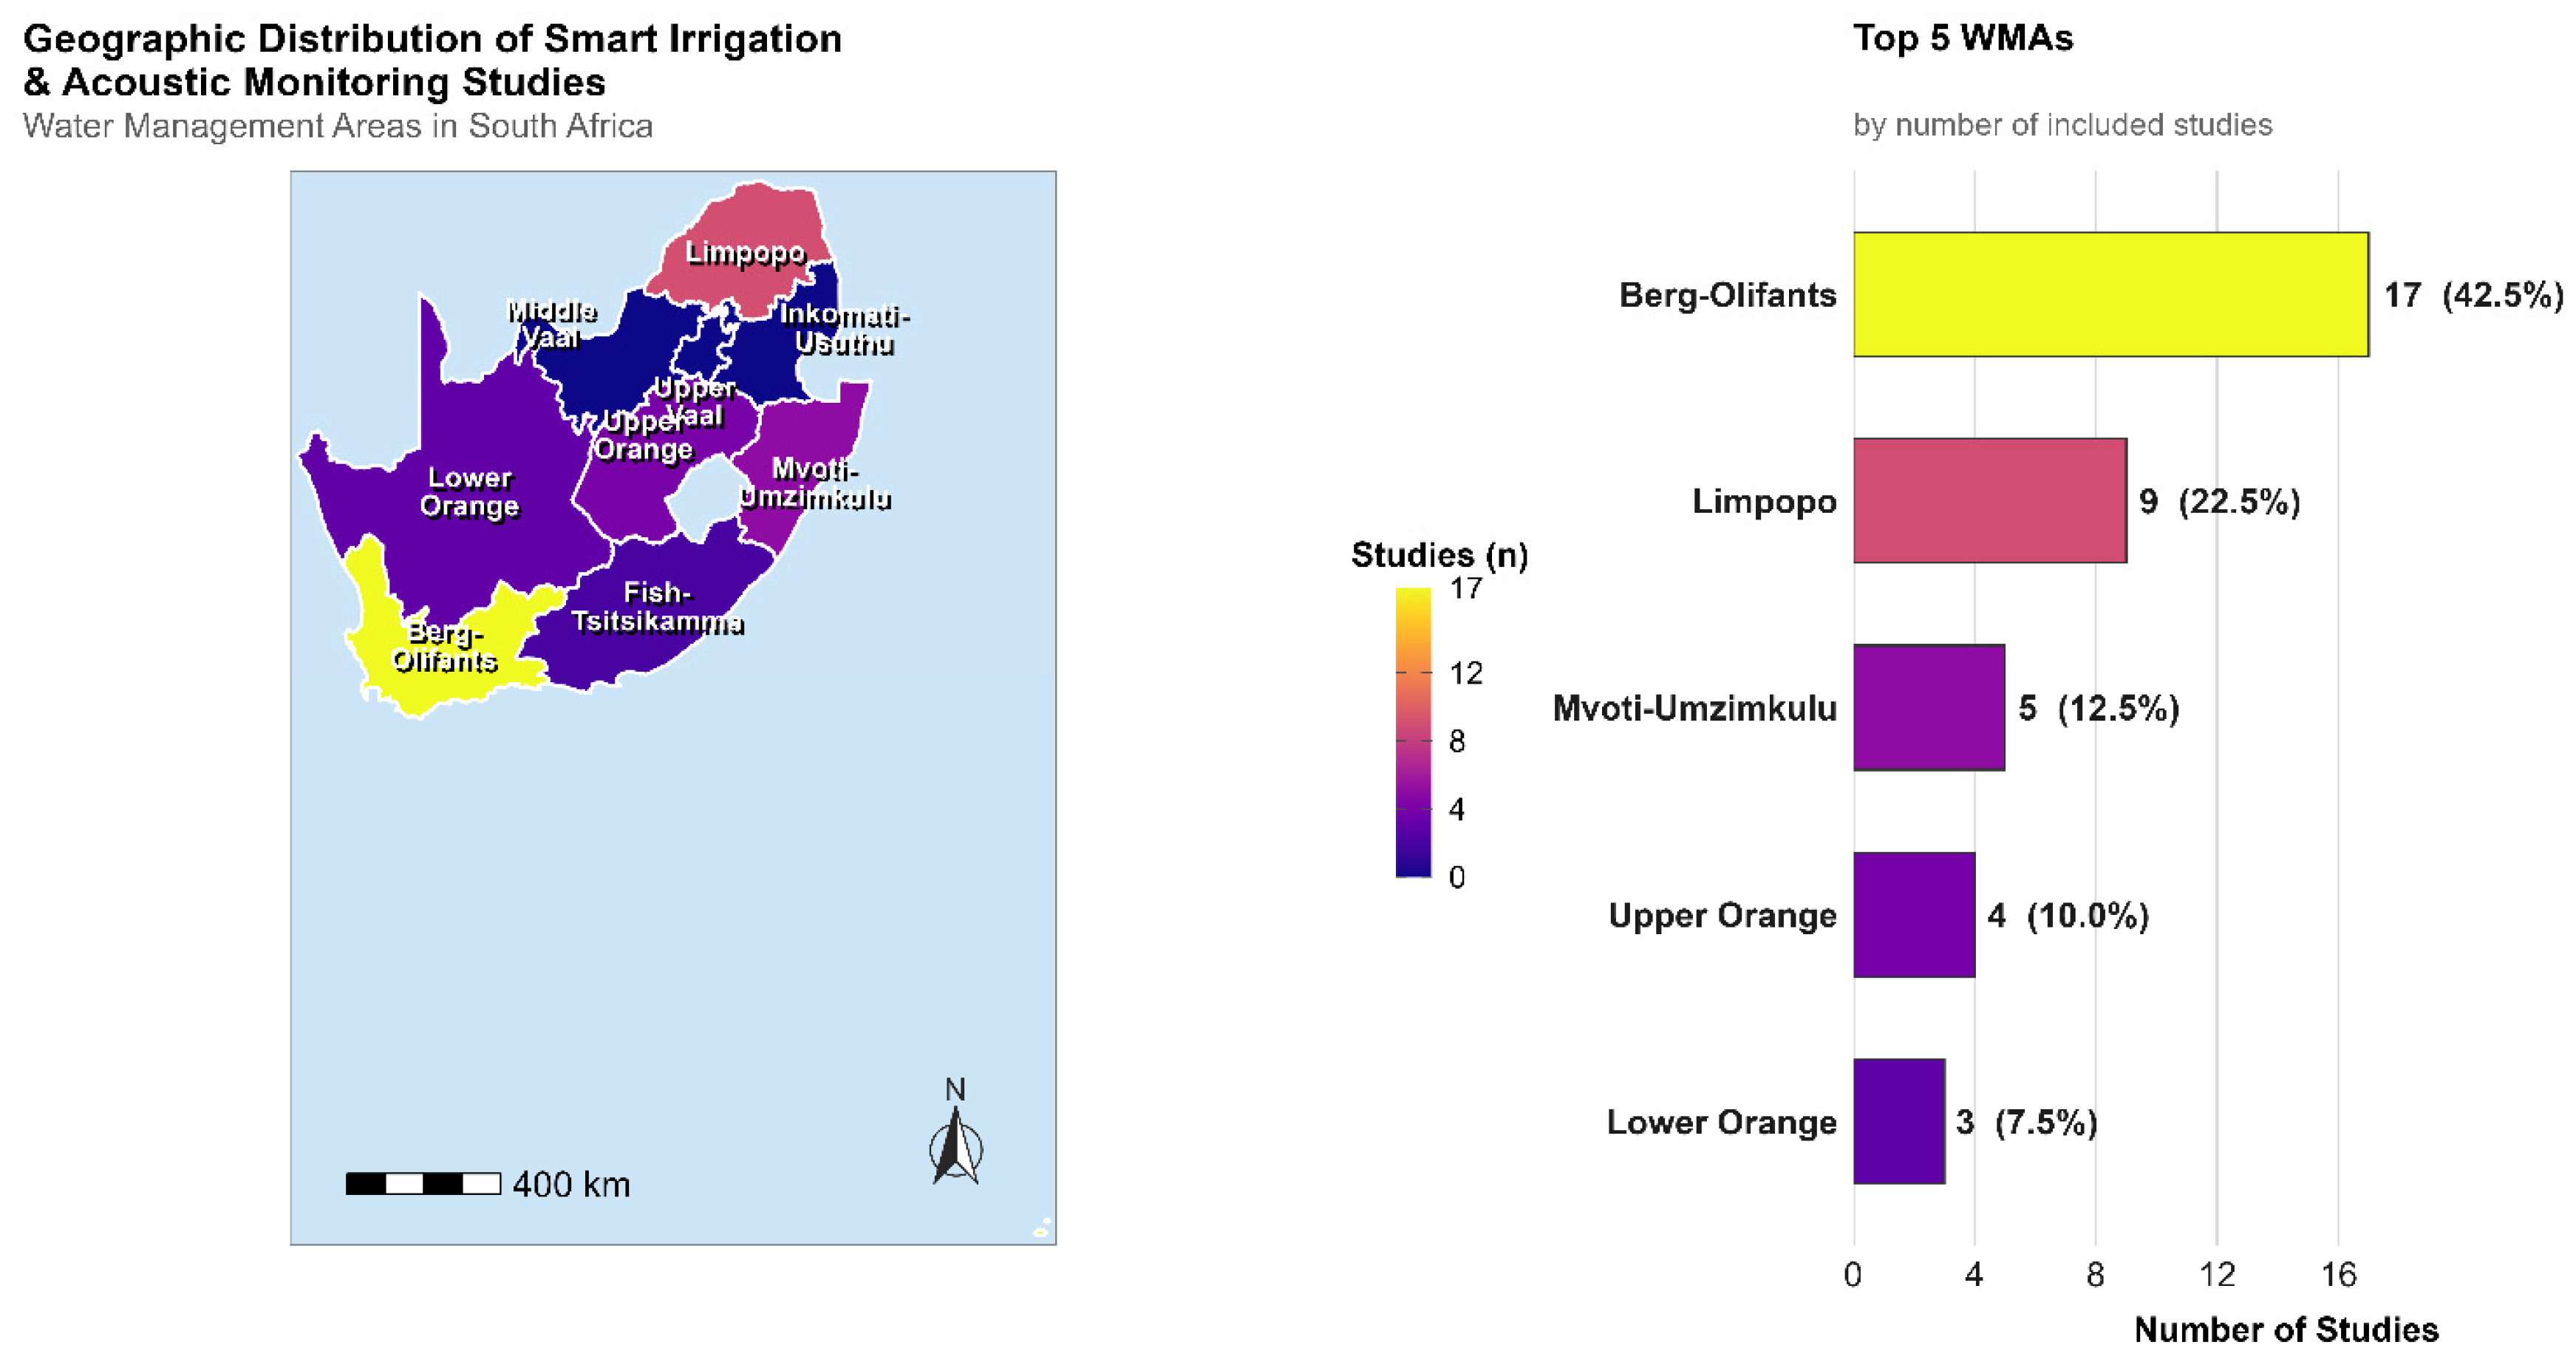
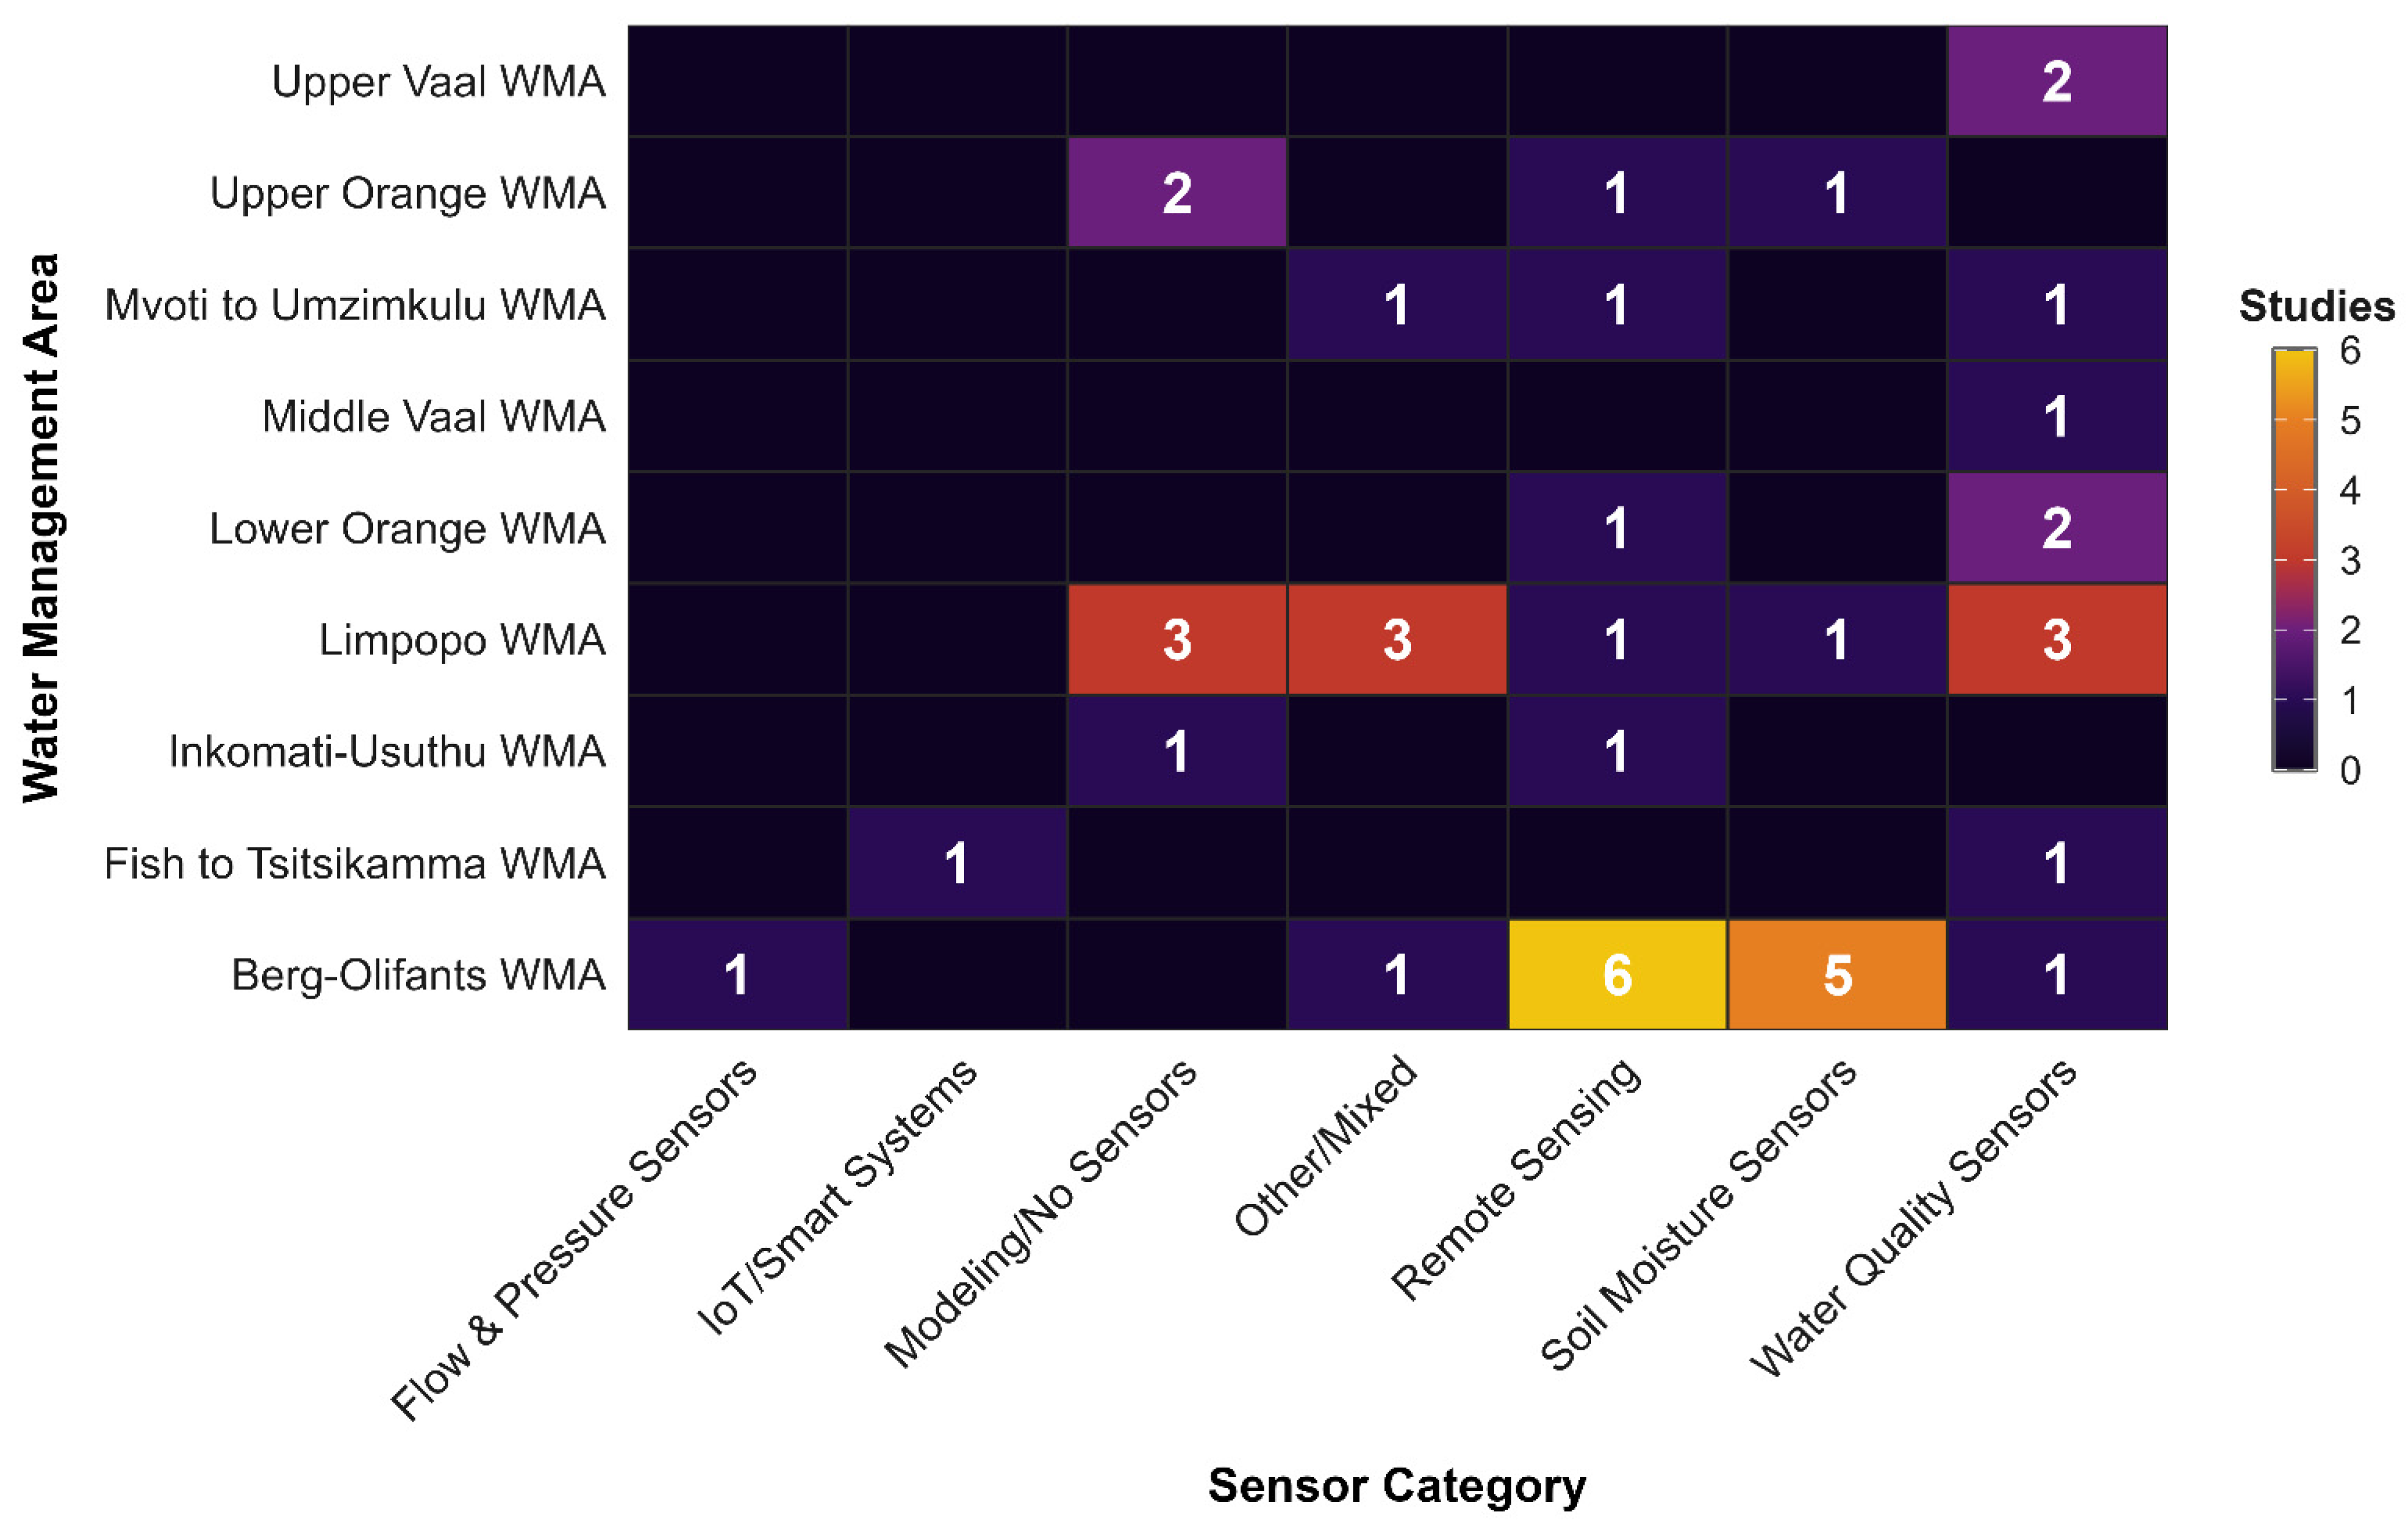
Geographic analysis revealed substantial heterogeneity across South Africa’s Water Management Areas (WMAs) (Figure 2). The Berg-Olifants WMA (Western Cape) dominated with 14 studies (23.7%), reflecting intensive horticultural irrigation systems. Limpopo WMA followed with 11 studies (18.6%), representing smallholder schemes and semi-arid agriculture [72,73].
Western Cape studies demonstrated diverse technologies: Mpakairi et al. [2] showed extreme weather events reduce crop water productivity 30–40%, though irrigated systems proved more resilient than rainfed [2]. Steyn et al. [74] employed root growth sensors revealing significant genotypic variation in avocado water extraction. Dzikiti et al. [75] documented 15–20% water savings through sap flow-guided irrigation.
Limpopo studies emphasized water quality challenges: Mudaly & van der Laan [73] found irrigation return flows increased phosphate from 0.08 to 0.34 mg/L, exceeding eutrophication guidelines. Malatsi et al. [76] revealed governance structures explained 65% of irrigation efficiency variance versus 12% for technology.
Five WMAs showed minimal research (n = 2 each, 3.4%), Inkomati-Usuthu, Fish to Tsitsikamma, and Middle Vaal, limiting generalizability across diverse agroecological zones. The term ‘underrepresented’ in this analysis refers exclusively to research coverage—the number of published peer-reviewed studies—and carries no implication about the economic importance, agricultural productivity, or technical capacity of the regions concerned. Five Water Management Areas (Fish to Tsitsikamma, Inkomati-Usuthu, and Middle Vaal, each appearing in only two studies, or 3.4% of the corpus) are designated underrepresented on a purely frequency-based criterion; WMAs contributing three or fewer studies fall below the minimum threshold for pattern synthesis under scoping review epistemology, which requires at least three exemplars before regularities can be meaningfully identified. These regions have functioning extension services, agricultural colleges, and irrigation professionals; a research gap is not a capacity gap. The underrepresentation most plausibly reflects research funding concentration in Western Cape and Limpopo universities, historical publication priorities, and crop-specific attention patterns rather than any absence of irrigation activity or expertise. The reason it matters is practical rather than evaluative; as Section 4.2.3 demonstrates, findings from well-studied WMAs—particularly the Mediterranean Western Cape—cannot be assumed to transfer to arid or summer-rainfall contexts without site-specific validation, meaning that policy targeting and technology deployment in underrepresented regions currently rest on an evidence base too thin to support confident inference.

3.3. Sensor Technology Landscape

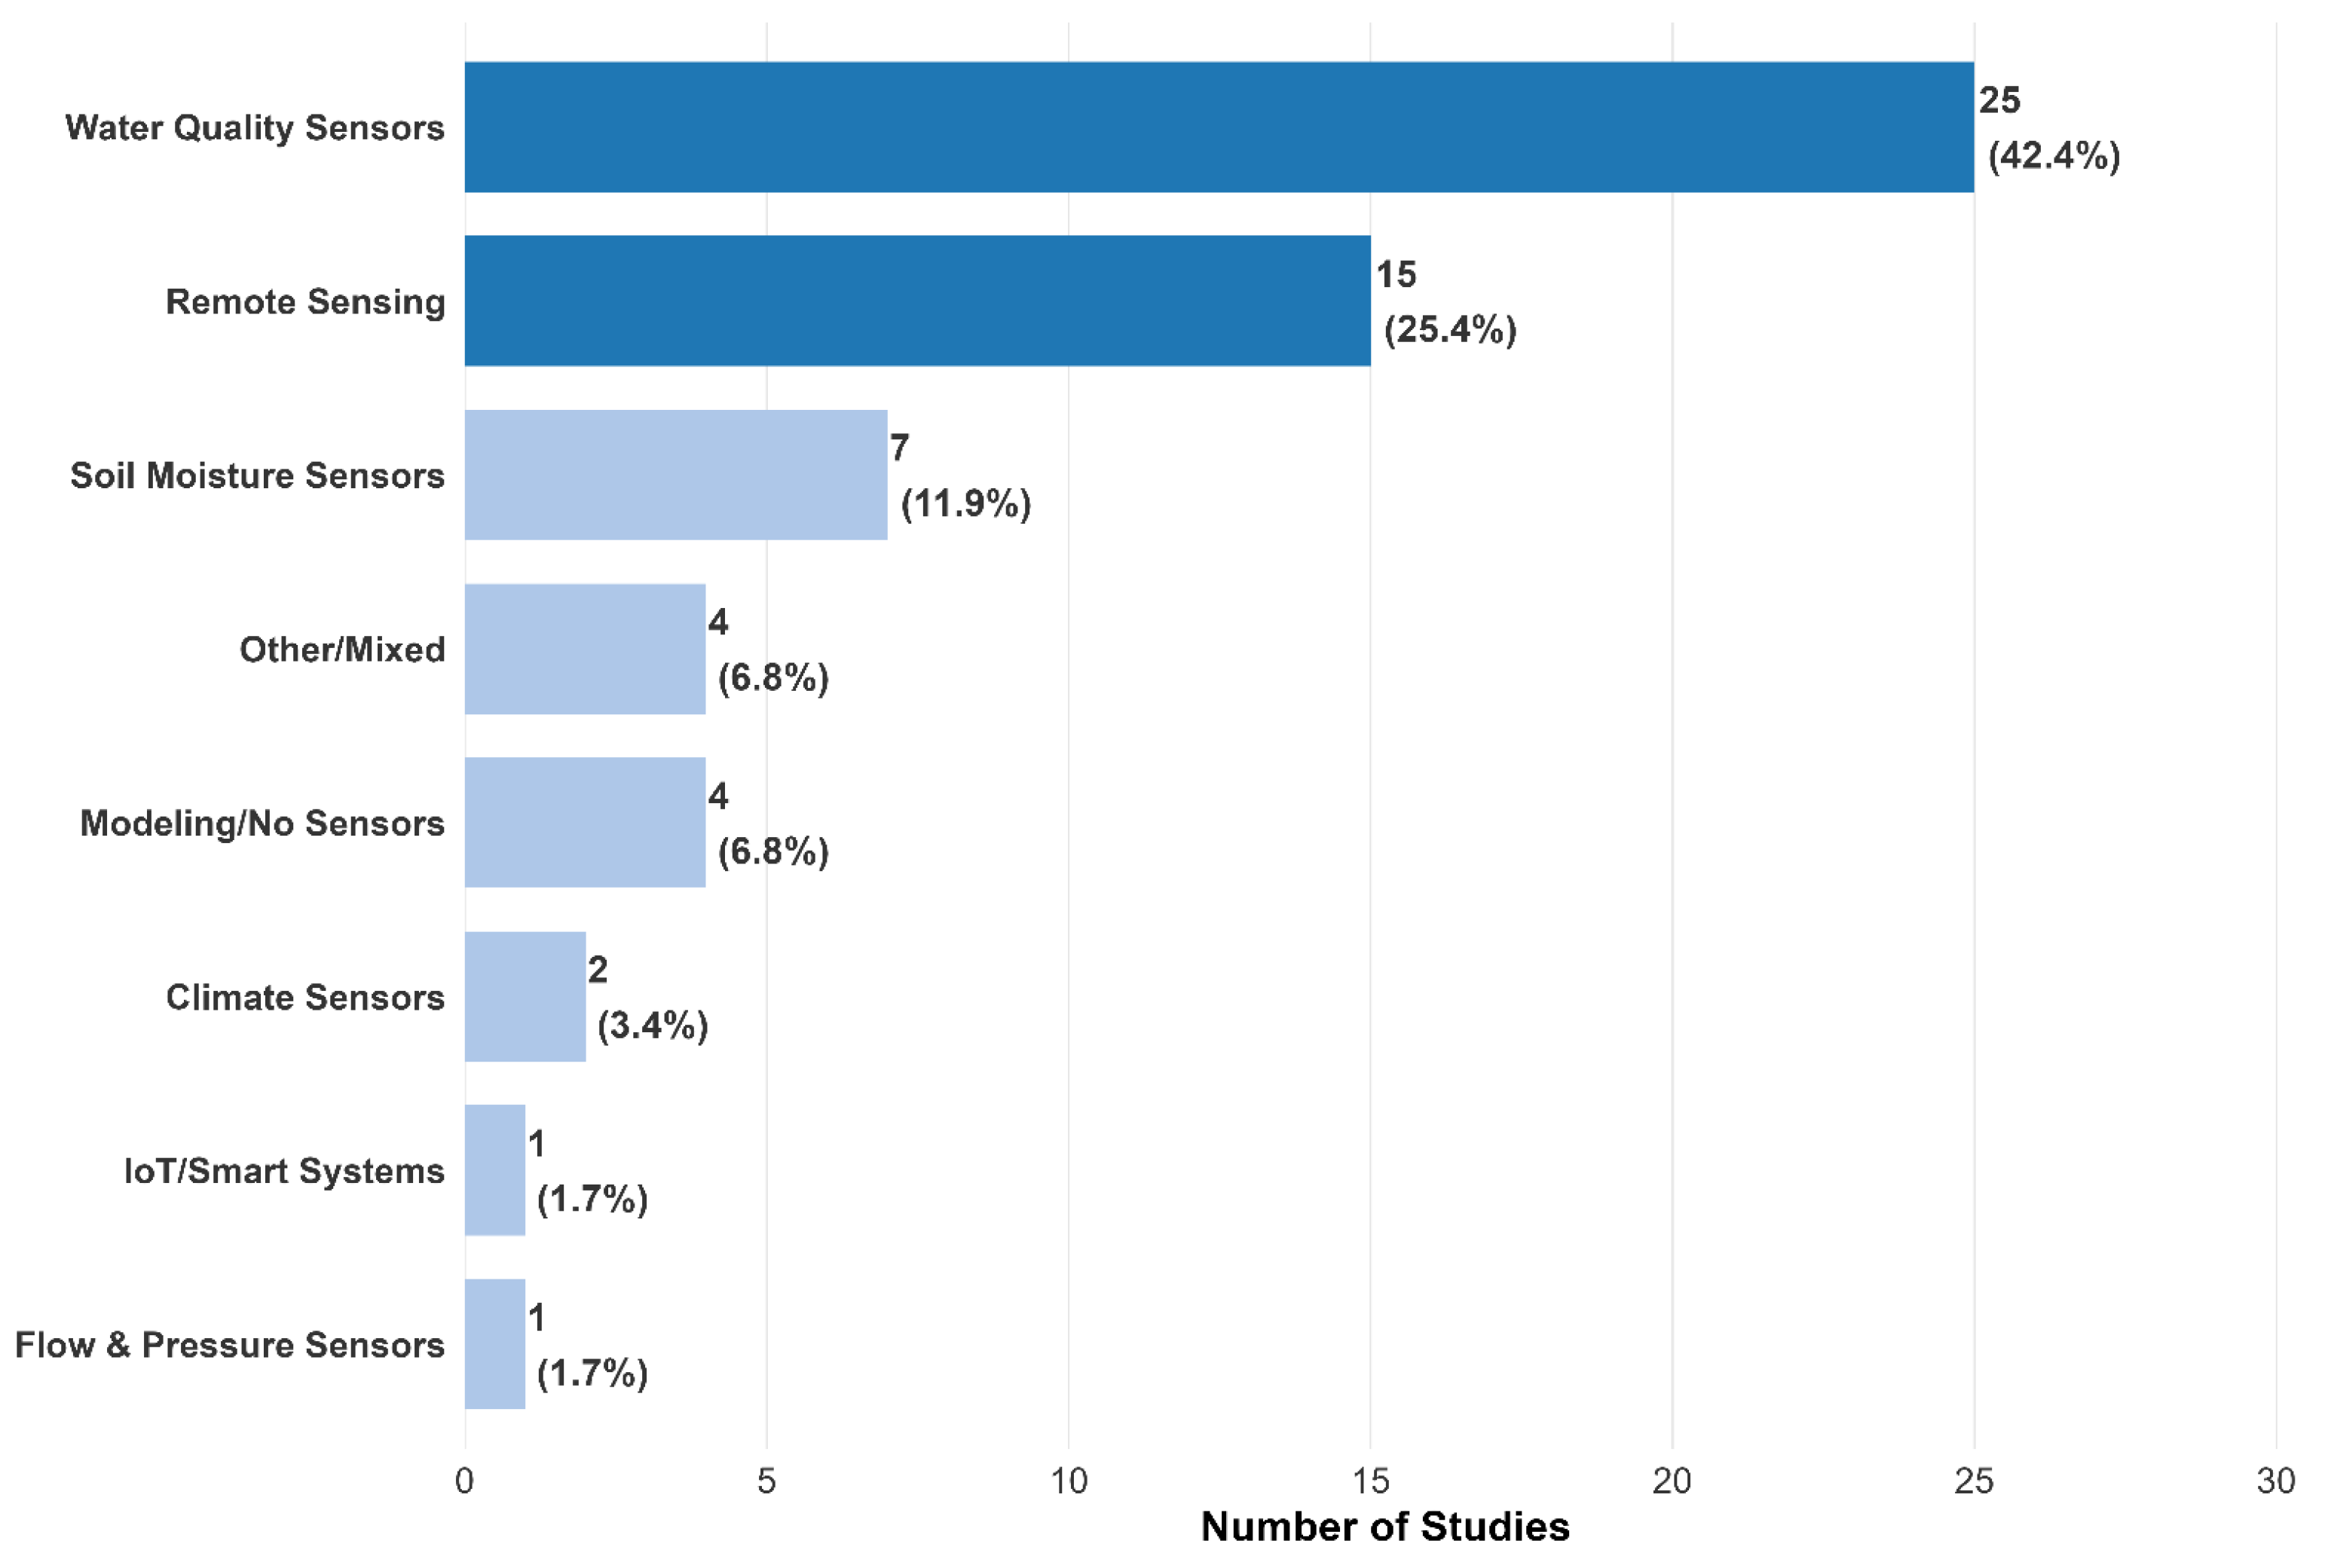
Seven sensor categories emerged with pronounced adoption variation (Figure 3):
Water quality sensors dominated (n = 25, 42.4%), measuring pH, EC, TDS, nutrients (NO3, PO43−, NH4+). Mudaly & van der Laan [73] documented phosphate increases exceeding guidelines; Oberholster & Ashton [77] found nutrient indices 3–5× higher downstream [78].
Remote sensing (n = 15, 25.4%) leveraged Landsat/Sentinel-2/MODIS platforms and UAVs. Kapari et al. [4] achieved R2 = 0.87 for CWSI prediction using Random Forests/Support Vector Regression on UAV imagery. Mpakairi et al. [2] mapped regional crop water productivity showing 15% reduction in irrigated versus 55% in rainfed systems under drought [2].
Soil moisture sensors (n = 7, 11.9%) employed capacitance probes, TDR, and tensiometers. Nyathi & Muremi [5] demonstrated 25–30% water savings via IoT integration with fuzzy logic [5]. Mobe et al. [79] revealed larger canopies consumed 40–60% more water, enabling size-based prescription mapping.
Modelling/No Sensors (n = 4, 6.8%) utilized WEAP, SWAT, CROPWAT, and AquaCrop. Dlamini et al. [1] projected 15–25% water availability reductions by 2050 with 30–40% demand increases.
Other categories showed minimal adoption: IoT systems (n = 1, 1.7%) [72], climate sensors (n = 2, 3.4%) [22,49], flow sensors (n = 1, 1.7%) [80], and mixed technologies (n = 4, 6.8%) [73,79].

3.4. Methodological Approaches

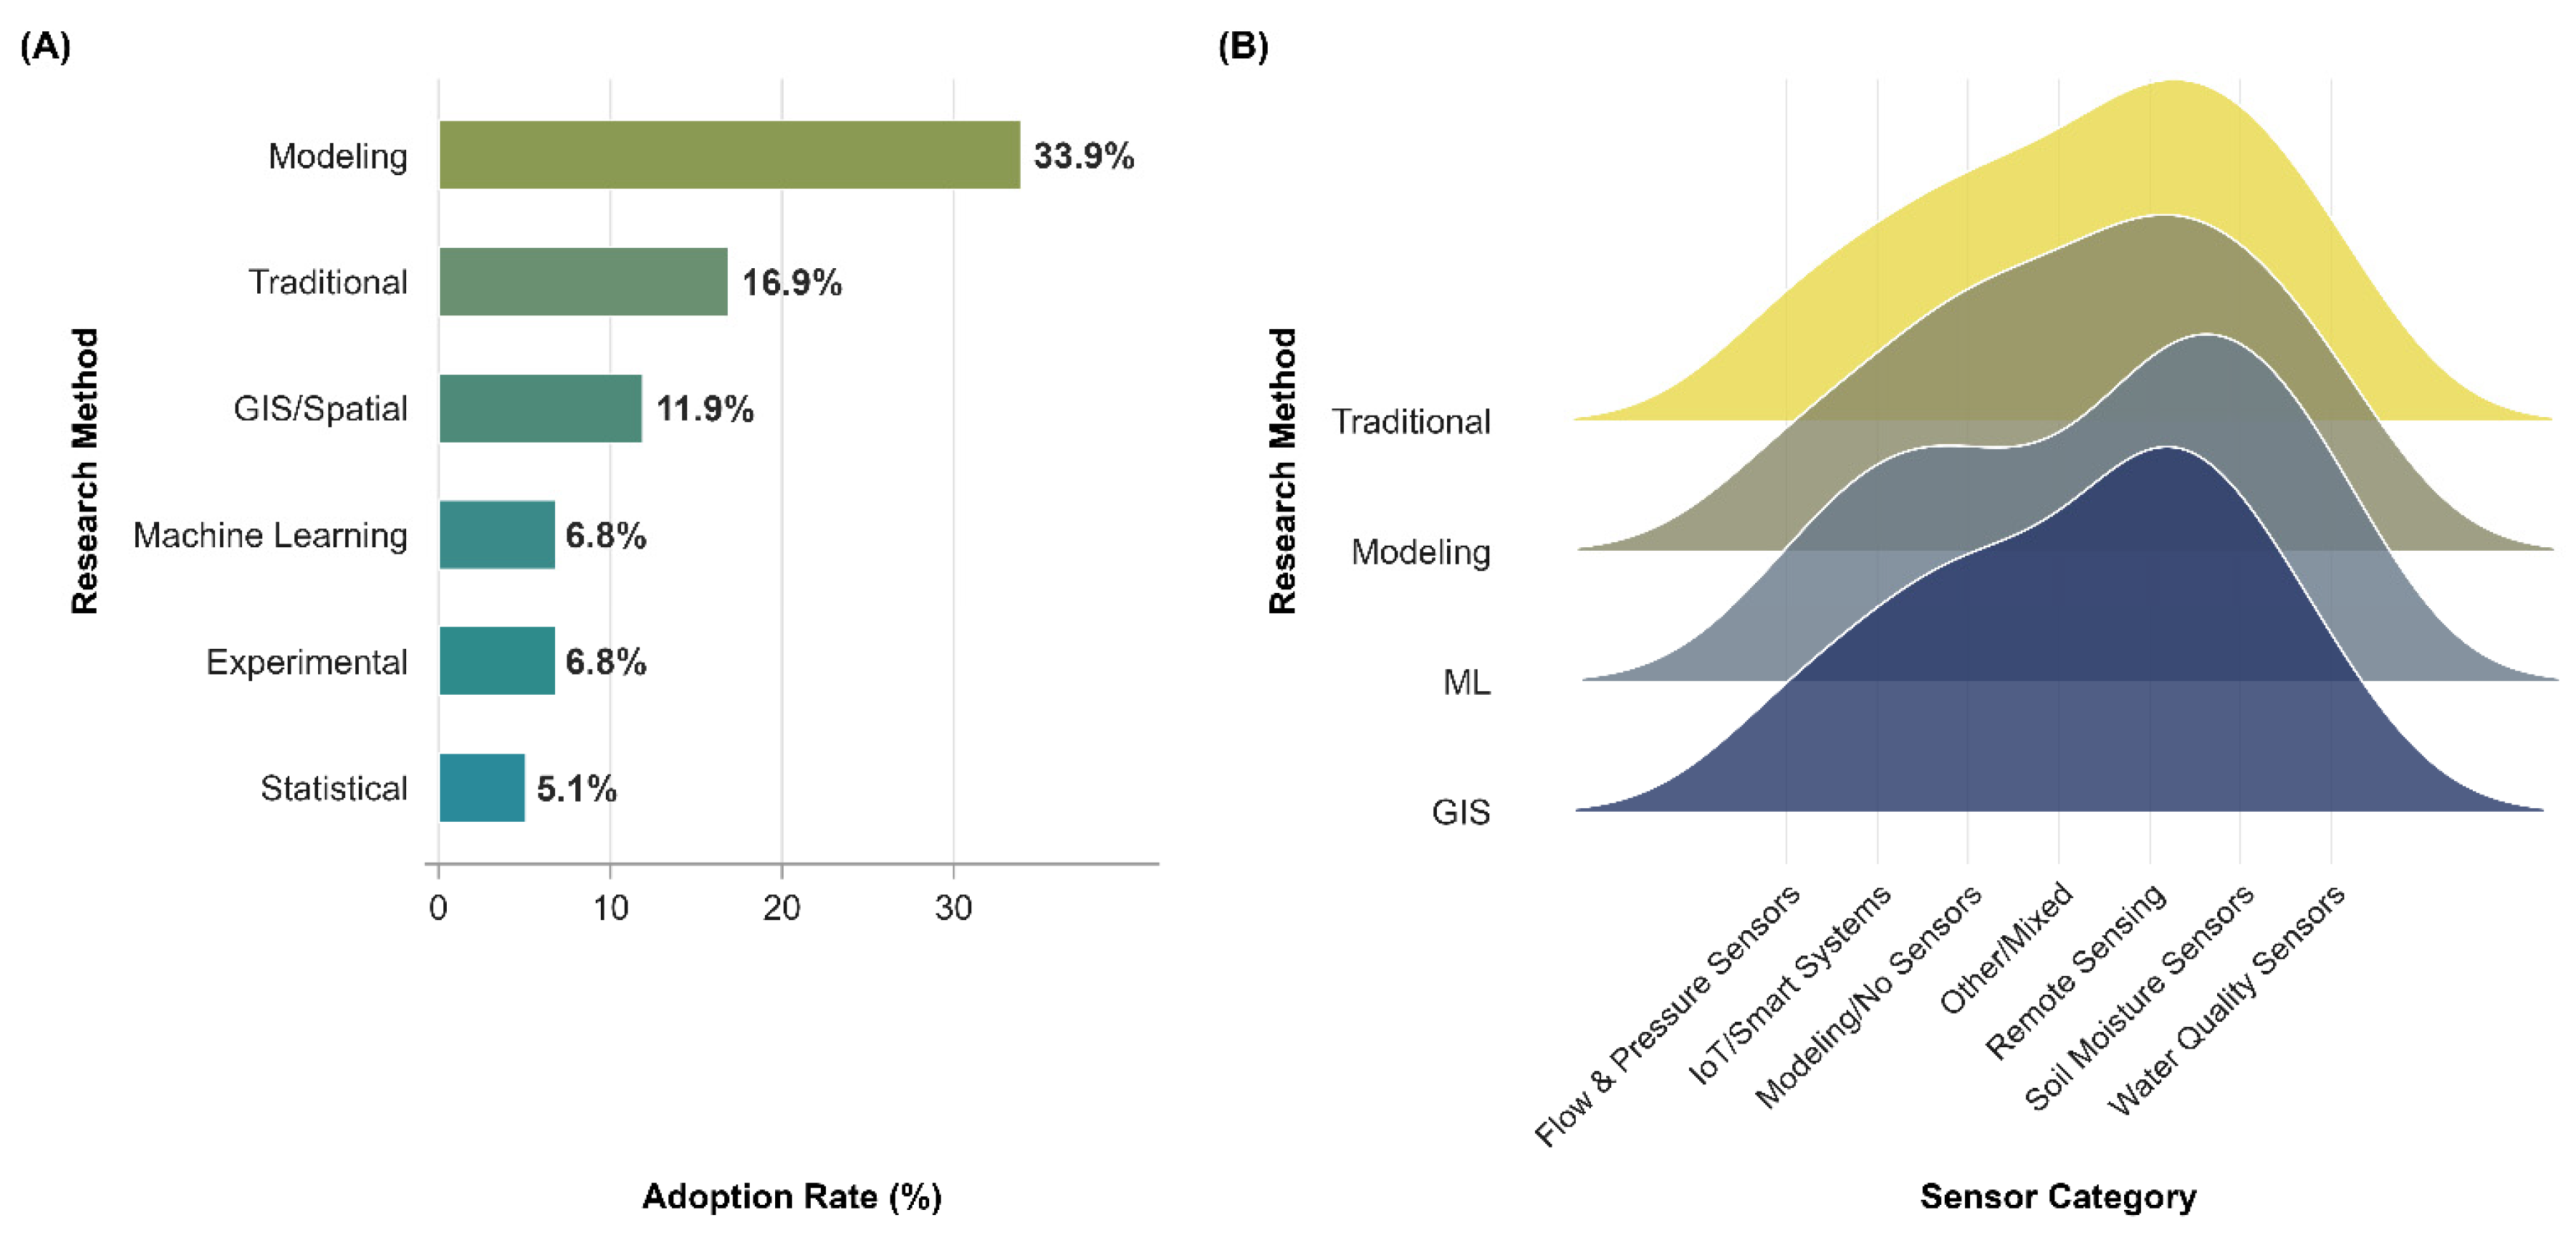
Modelling approaches dominated (33.9%, n = 20), employing WEAP [1], SWAT, HYDRUS-1D [81,82], CROPWAT [83,84], and AquaCrop [85,86]. Dlamini et al. [1] integrated WEAP with CHIRPS rainfall, MODIS ET, and NEX-GDDP climate projections.
Machine Learning remained limited (6.8%) but promising: Kapari et al. [4] achieved R2 = 0.87 for CWSI using RF/SVR [6]. The limited ML penetration in water quality (4%) and soil monitoring (0%) suggests untapped potential for time-series forecasting, anomaly detection, and predictive maintenance (Figure 4).
Traditional field methods (16.9%) included manual sampling [73,78,87], gravimetric soil moisture [81,88], and crop water status assessments [74,79]. Experimental designs (6.8%) compared irrigation treatments [5,79,80,82,83]. GIS/spatial analysis (11.9%) and statistical analysis (5.1%) showed moderate adoption.
Ridge plot analysis (Figure 4) showed distinct methodological clustering: remote sensing exhibited broad distribution with 86% GIS adoption and 21% ML integration; water quality concentrated on traditional methods (92%); soil moisture showed experimental designs (43%) but zero ML adoption.

3.5. Technology-Method Integration

Cross-tabulation (Figure 5) revealed deployment patterns: Berg-Olifants WMA led in remote sensing (n = 6) and soil moisture (n = 5); Limpopo emphasized water quality (n = 3) and modelling (n = 3). Research gaps included no IoT systems in Upper Orange, Lower Orange, or Mvoti to Umzimkulu WMAs, and absent acoustic monitoring universally.

3.6. Correlation Structures

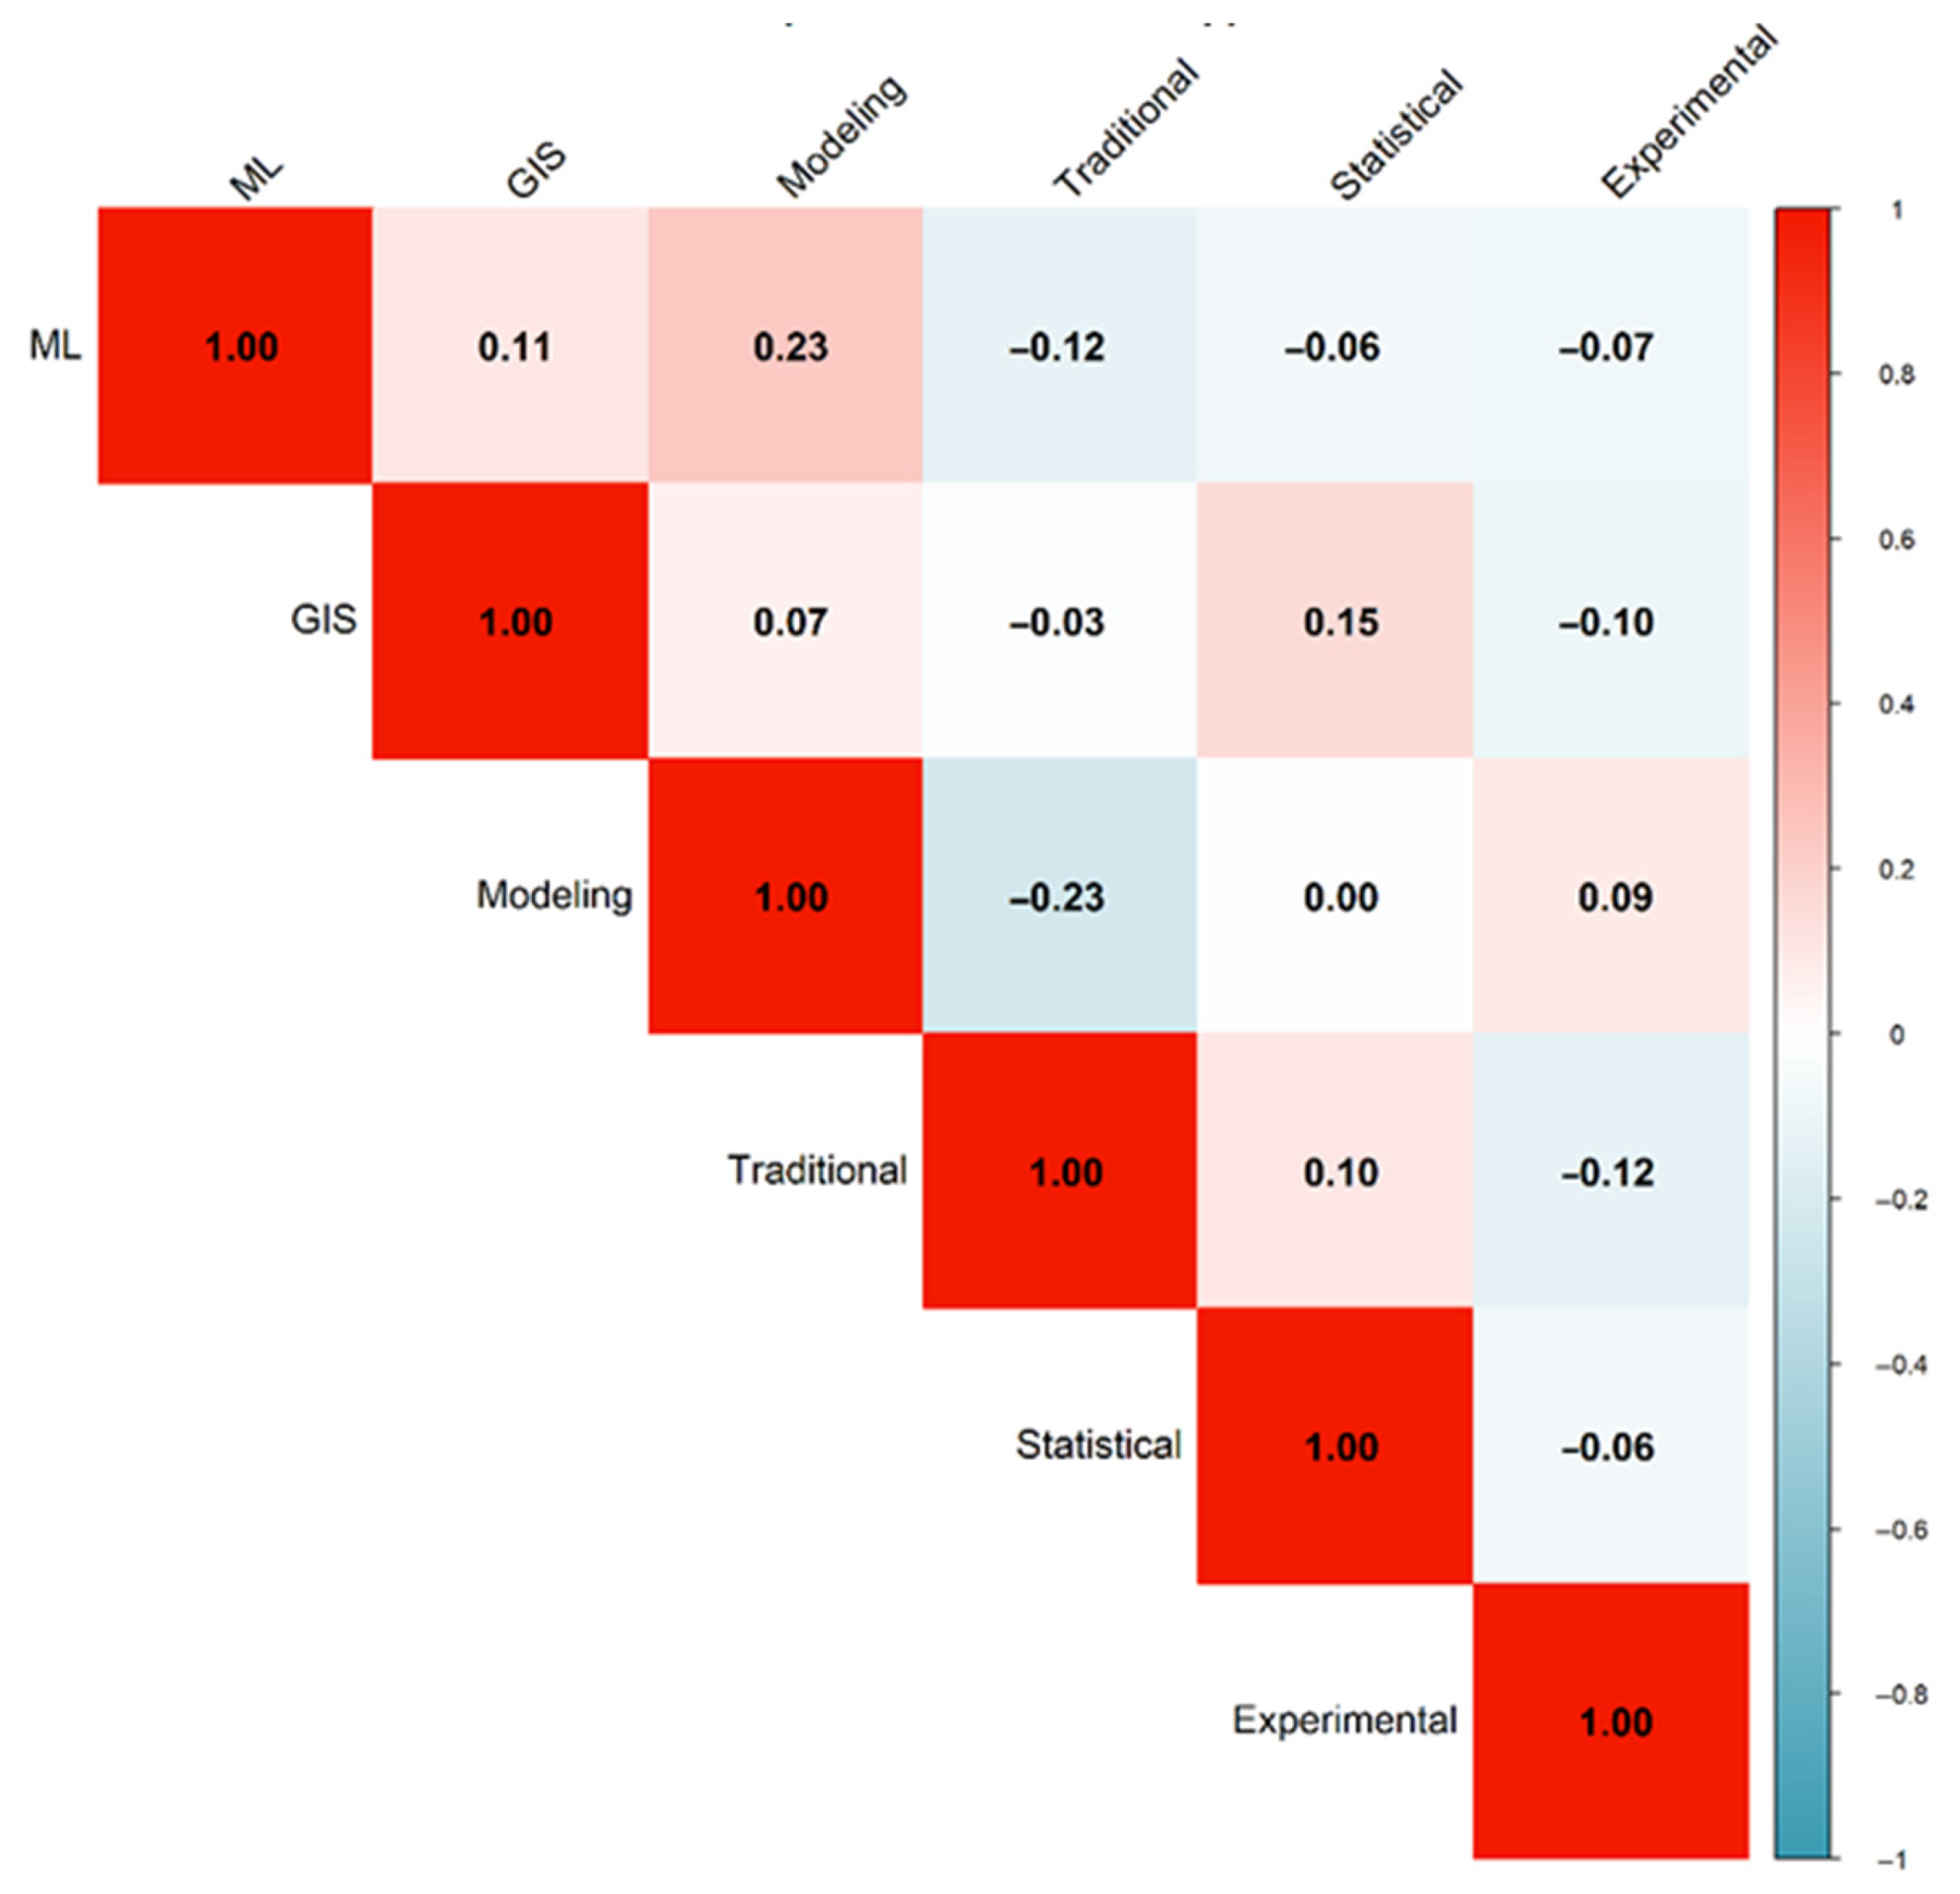
Pearson correlation analysis (Figure 6) revealed methodological associations: ML ↔ modelling showed weak positive correlation (r = 0.23, p = 0.04); modelling ↔ traditional exhibited negative correlation (r = −0.23, p = 0.04), indicating simulation studies rarely incorporate field validation. These patterns demonstrate methodological silos: studies employ single frameworks rather than combining approaches despite documented international synergies.

3.7. What Research Archetypes and Methodological Clusters Characterise South African Irrigation Monitoring Literature? (Unsupervised Pattern Discovery via PCA and K-Means Clustering)

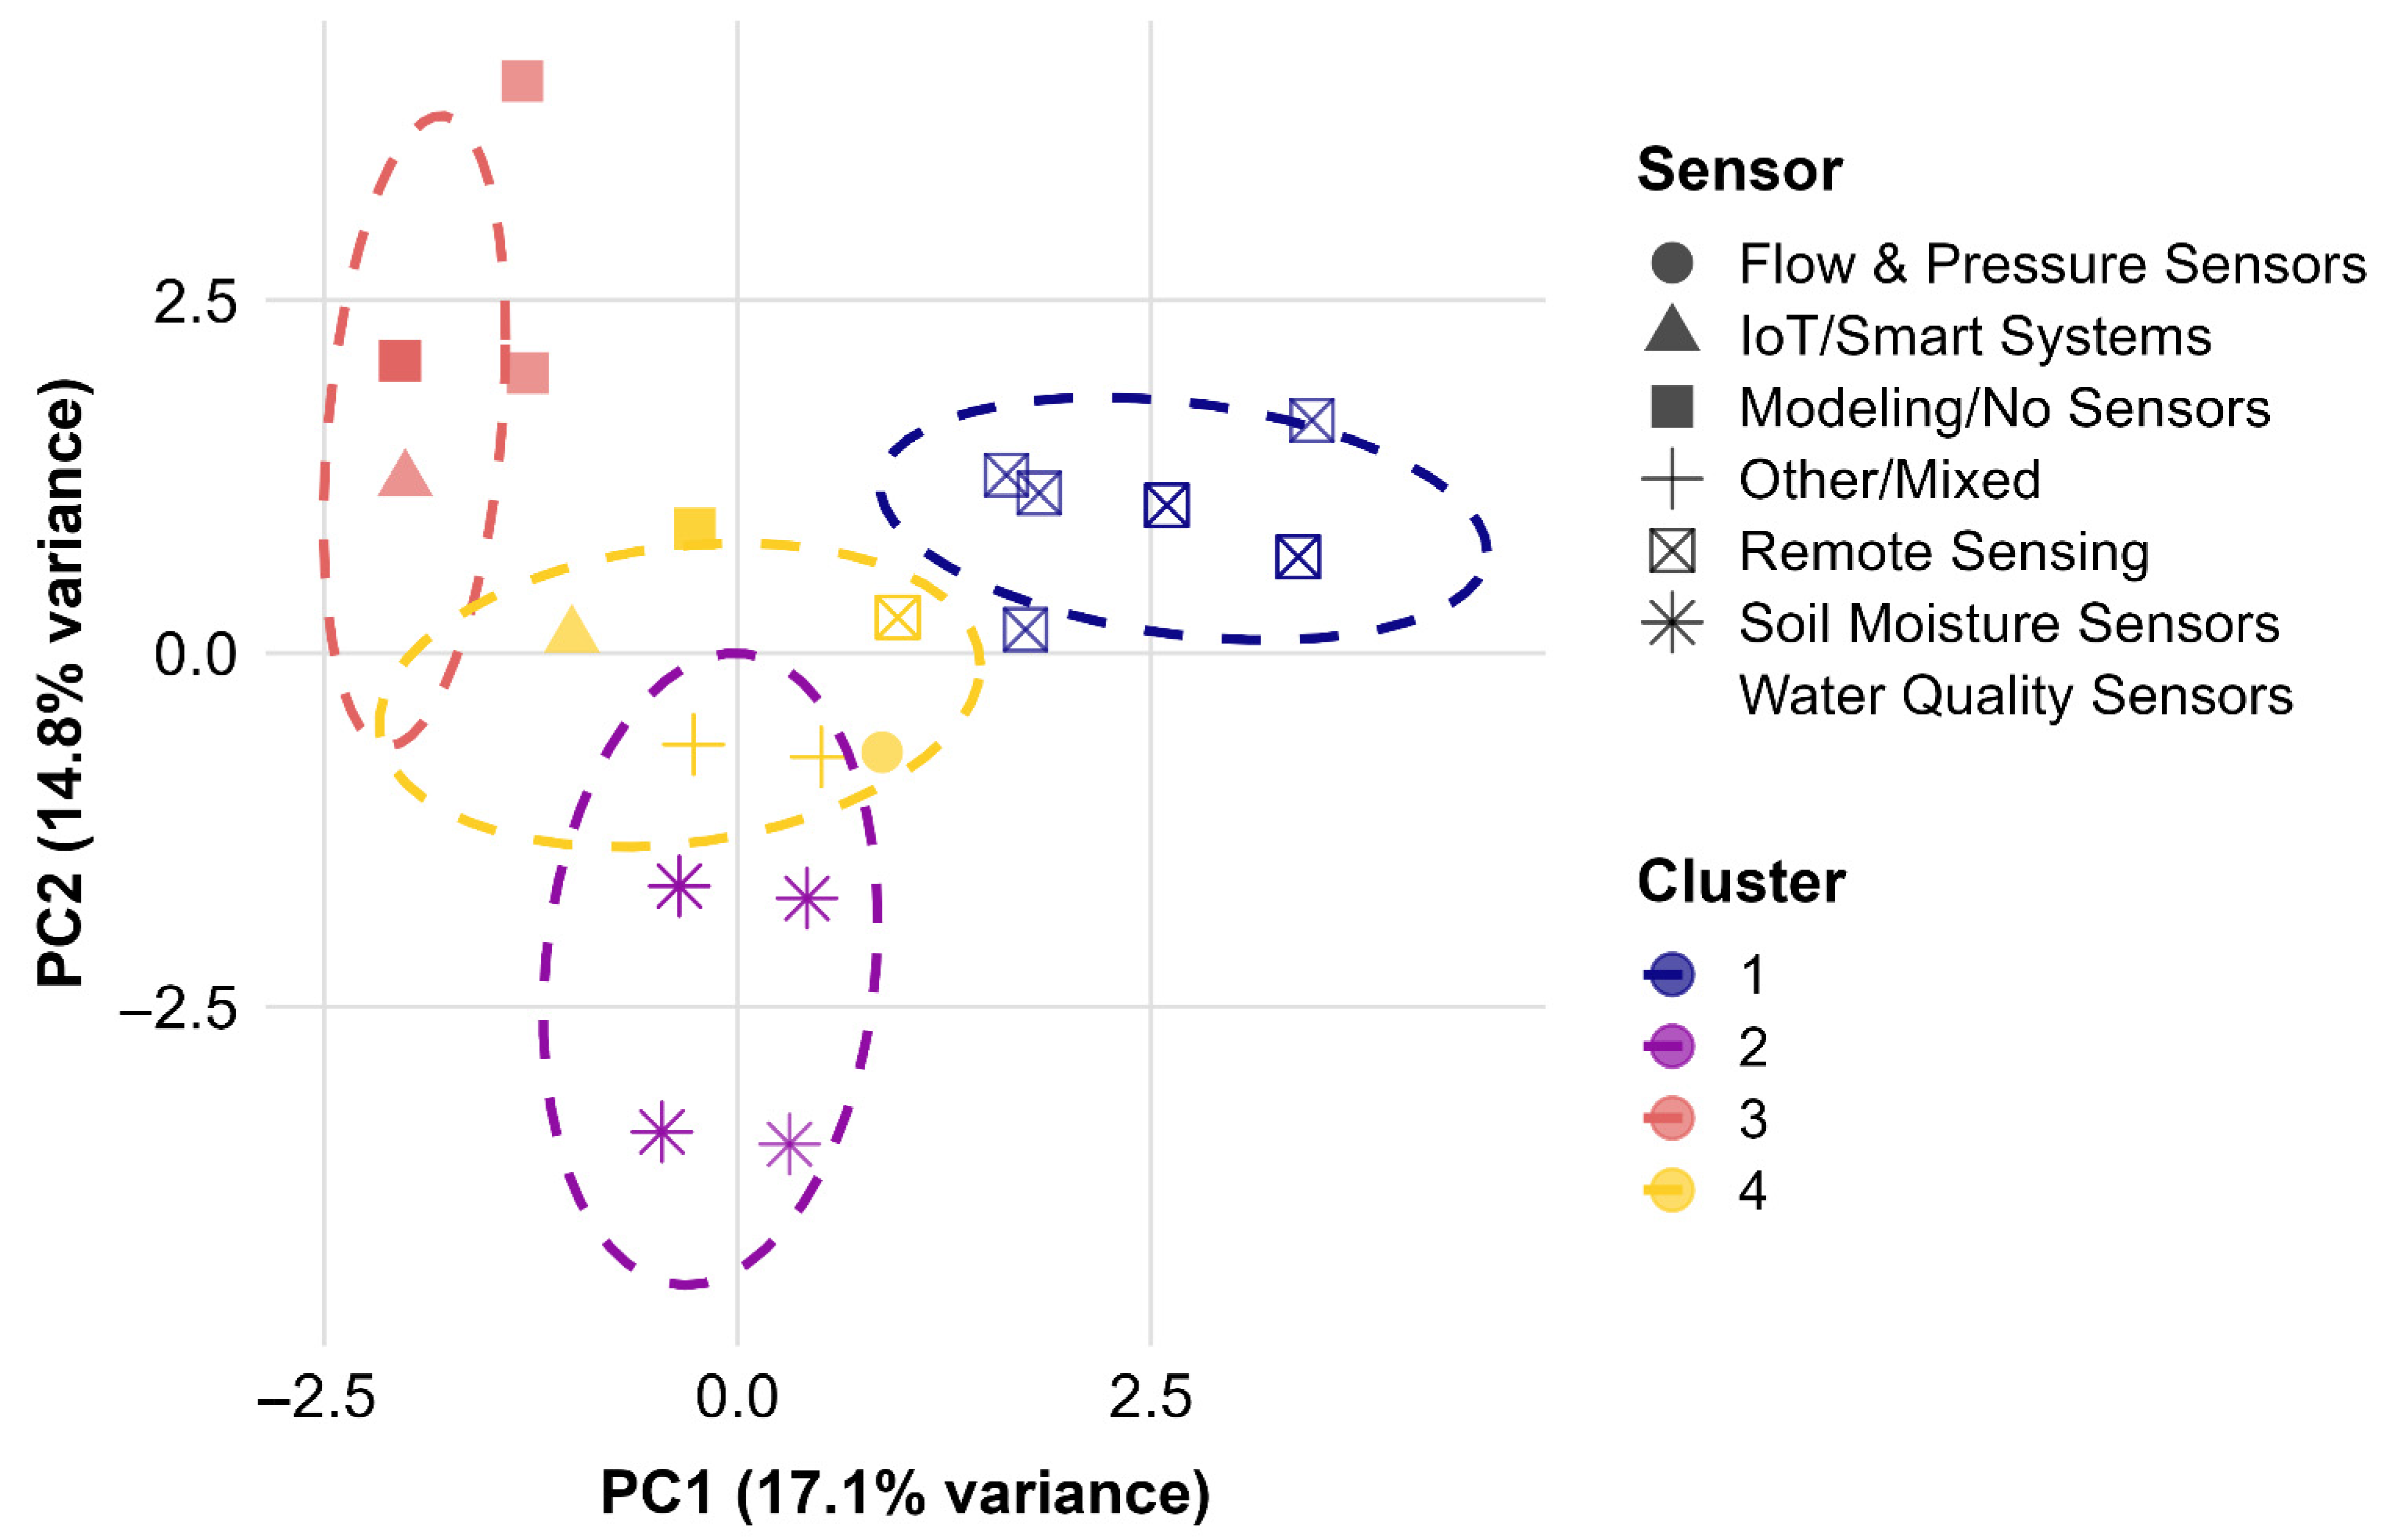
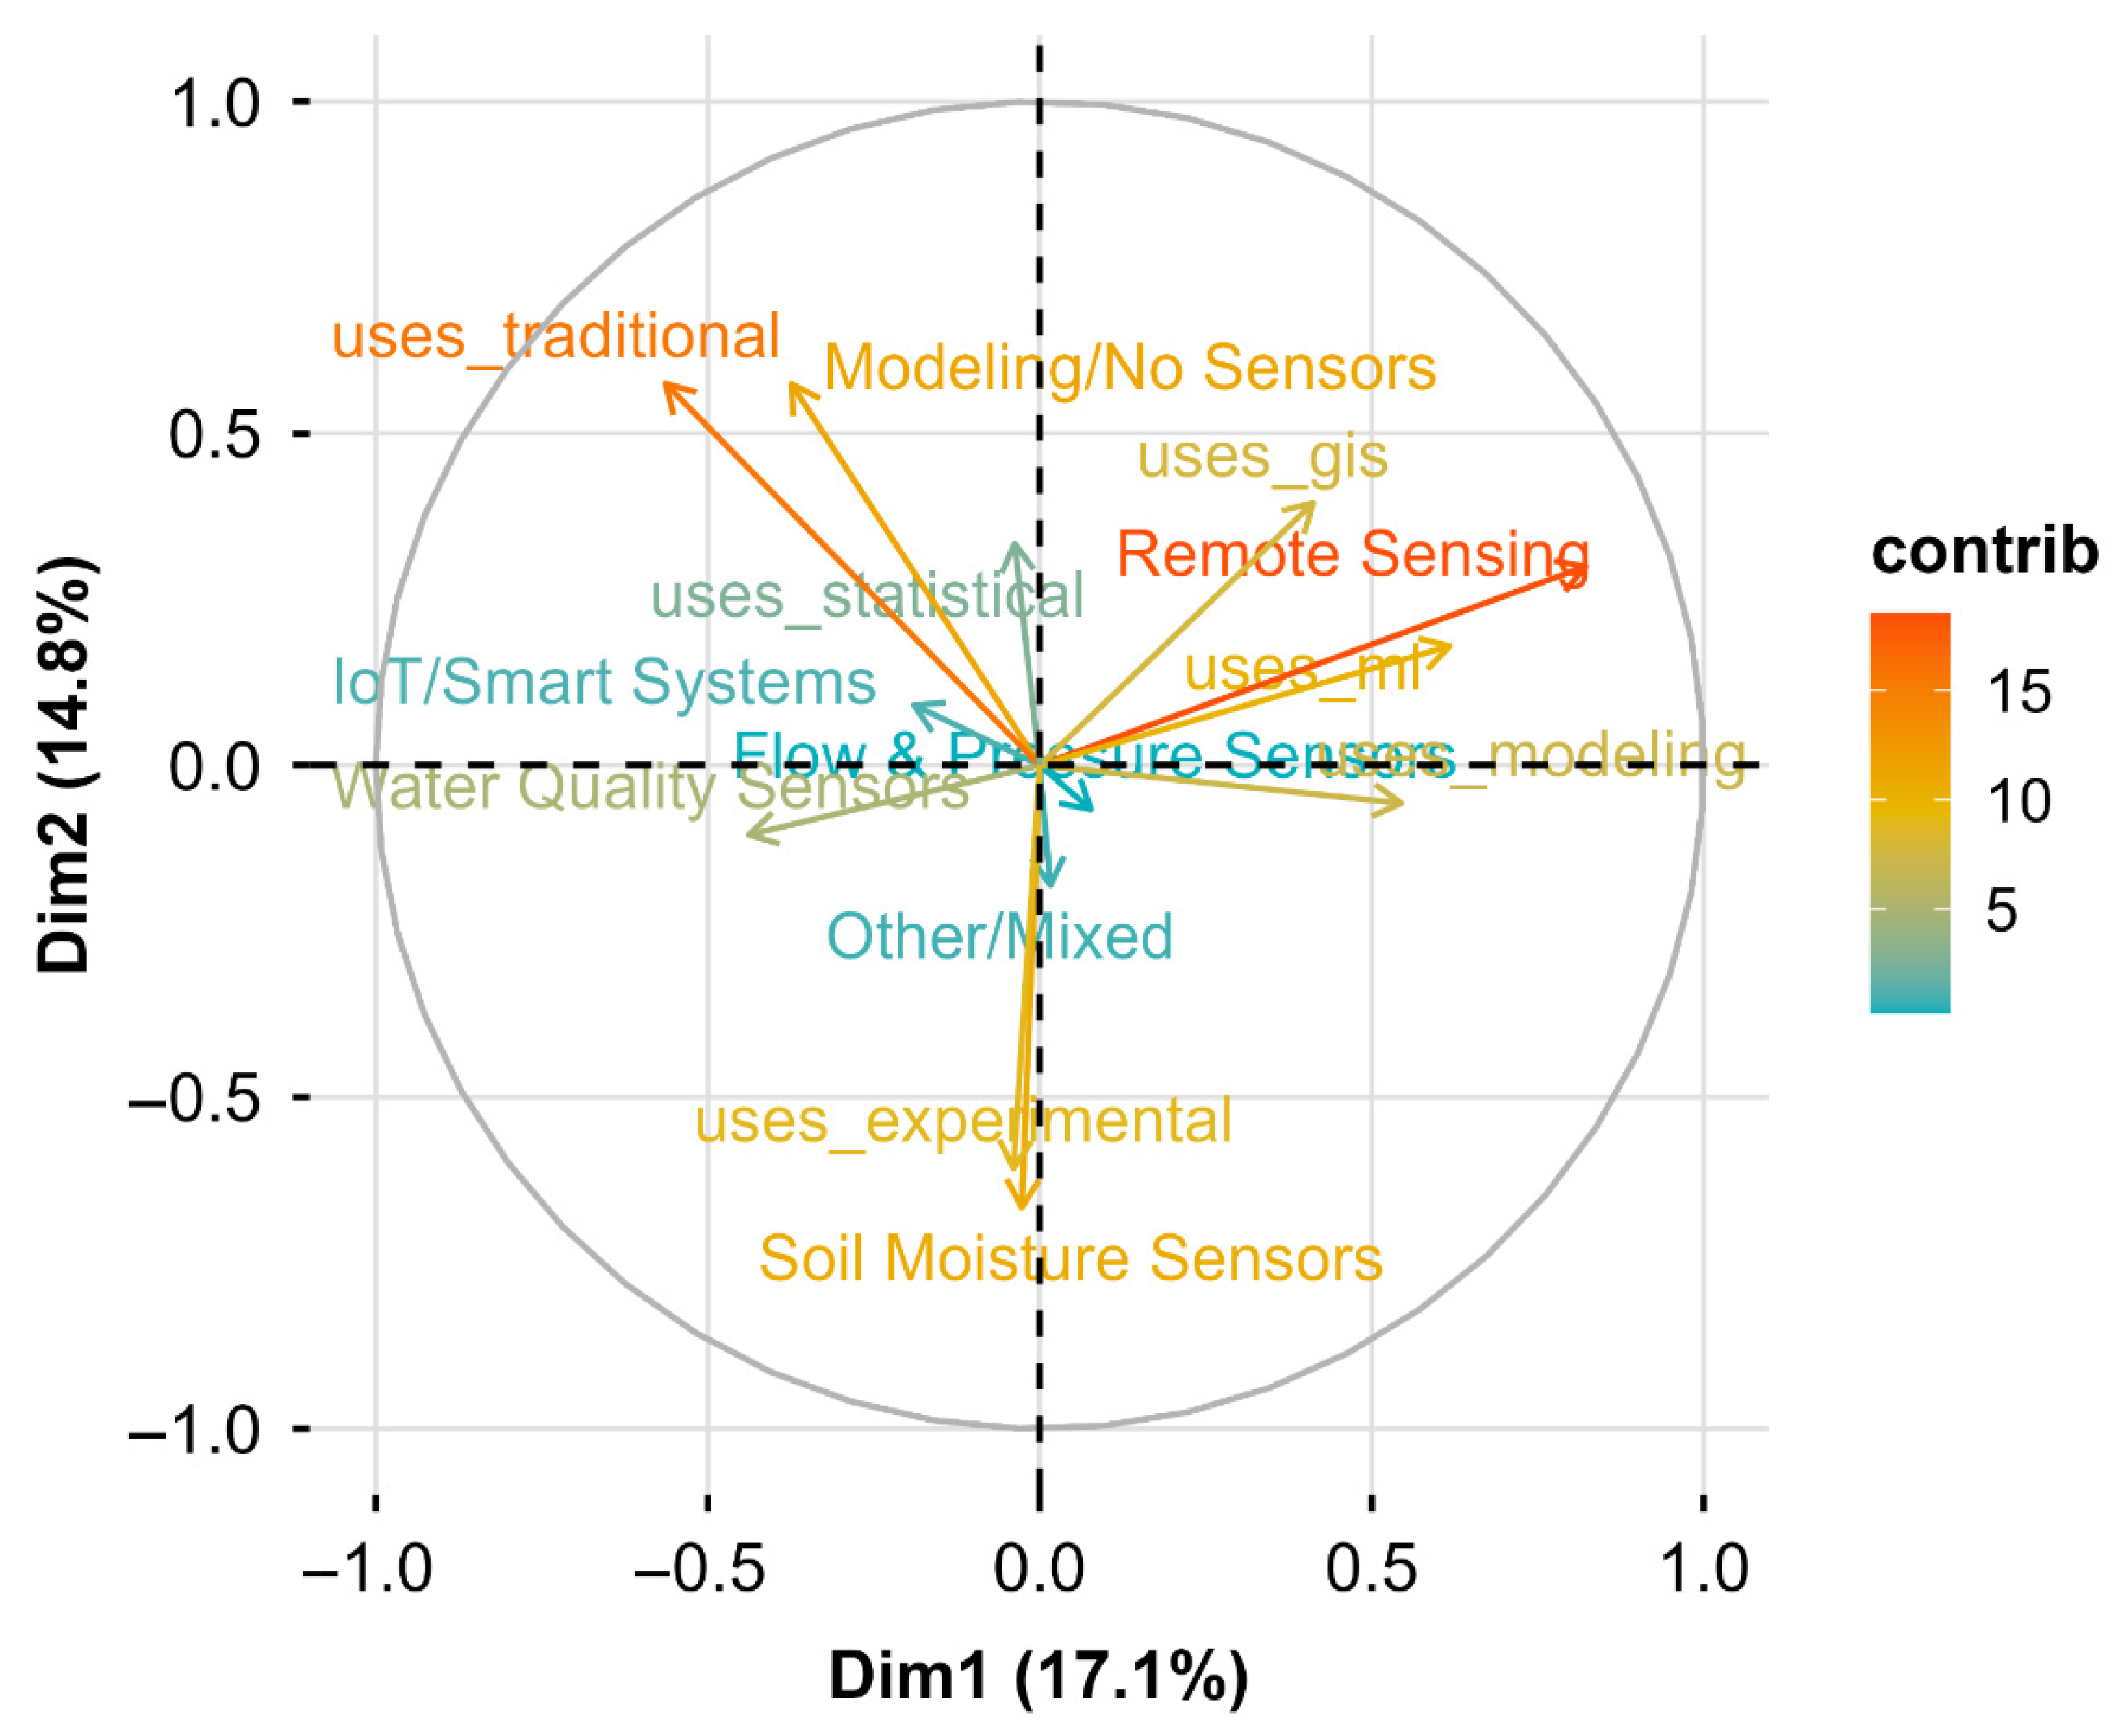
Research question: How do methodological approaches cluster in the reviewed literature, and what distinct research archetypes emerge? To address this, we applied principal component analysis (PCA) and K-means clustering (k = 4) on a 13-dimensional feature space (encompassing methodologies, technologies, scales, and study designs). This unsupervised learning approach captured 31.9% of cumulative variance (PC1: 17.1%, PC2: 14.8%), revealing four distinct research archetypes (Figure 7 and Figure 8):
Cluster 1: Remote Sensing and GIS-Integrated Approaches (n = 15, 25.4%)
This archetype is characterised by high technology intensity and scalability-oriented design. Representative studies include landscape-scale remote sensing applications (MODIS, Sentinel-2) combined with GIS-based water productivity assessment [2,4,58,75,76,80]. Strength of this approach: continental scalability and accessibility of freely available satellite imagery. Key limitation: coarse temporal resolution (8–16 day revisit periods) precludes real-time irrigation scheduling and limits responsive management applications.
Cluster 2: Modelling-Centric Approaches (n = 12, 20.3%)
This archetype emphasises simulation and scenario analysis using process-based crop models (CROPWAT, AquaCrop, WEAP) and hydrological frameworks. Representative studies [1,70,71,72,73] employ models to project climate change impacts, water availability futures, and irrigation demand trajectories. Strength: capacity for multi-decadal scenario analysis and strategic planning. Critical weakness: only 15% of studies in this cluster validated model outputs against independent field measurements, limiting empirical grounding and confidence in projections.
Cluster 3: Water Quality Monitoring via Traditional Field Sampling (n = 14, 23.7%)
This archetype relies on conventional field-based sampling and laboratory analysis of water quality parameters (nutrients, salinity, contaminants). Representative studies [57,58,63,67,77] document pollution from irrigation return flows in catchments such as Olifants, Mgeni, and Limpopo. Strength: precision and methodological standardisation through certified laboratory procedures. Critical limitation: this cluster has not engaged Machine Learning or forecasting approaches despite the suitability of time-series water quality data for predictive modelling, representing a significant underutilisation of analytical capacity.
Cluster 4: Mixed and Heterogeneous Methodologies (n = 18, 30.5%)
This archetype encompasses diverse approaches combining experimental field trials, multi-sensor integration, socio-economic analysis, and hybrid methodologies [5,60,62,65,68,78,80]. Representative studies integrate soil moisture sensors with sap flow measurements, couple remote sensing with ground validation, or combine biophysical monitoring with farmer adoption analysis. Strength: demonstrates integration potential and methodological adaptability. Weakness: lack of standardisation across studies limits systematic comparison and knowledge synthesis, and integration remains episodic rather than systematic.
Evidence interpretation: These four archetypes reveal a research landscape in which remote sensing and modelling dominate by number and visibility, while water quality monitoring forms a cohesive but analytically isolated community, and mixed methodologies suggest emerging integration potential yet lack systematic framework. The clustering structure (modularity = 0.42; density = 0.24) indicates moderate fragmentation: distinct methodological communities exist but weak cross-linkages prevent synergistic development.

3.8. What Outcome Themes and Benefit Narratives Dominate Research Reporting? (Natural Language Processing and Automated Keyword Extraction)

Research question: What themes and outcome narratives characterise the reviewed literature, and are there systematic biases in how benefits and challenges are framed? To address this, we conducted automated keyword extraction from abstracts and findings sections of all 59 studies, identifying term frequency, co-occurrence patterns, and narrative framing (Figure 9). The analysis revealed the following:
Dominant Thematic Terms:
‘Irrigation’ appeared in 71.2% of studies (n = 42), confirming strong thematic coherence with the review’s scope. ‘Water’ appeared in 55.9% of studies (n = 33) (Figure S4), reflecting South Africa’s acute water-scarcity context and establishing water availability as the primary framing concern. These two foundational terms establish the review’s topical focus. Meanwhile ‘use’ appears primarily in compound phrases (water use efficiency n = 7, improved water use n = 3, sensor use n = 2, land use n = 1) resulting from NLP lemmatization collapsing conjugations into root form. Meanwhile, high-frequency, isolated ‘use’ lacks standalone semantic value and could join custom stop word lists in future analyses.
Positive Framing Bias in Outcome Narratives:
Terms emphasising positive outcomes and technological benefits dominated the outcome narratives. ‘Improves’ appeared in n = 8 studies, ‘efficiency’ in n = 5 studies, and ‘precision’ in n = 7 studies—collectively framing irrigation monitoring as inherently beneficial. In contrast, terms highlighting barriers, costs, or challenges were substantially under-represented: ‘barriers’ did not appear in the top 20 most frequent terms, ‘cost’ appeared only n = 2 times, and ‘adoption’ appeared only n = 3 times. This stark asymmetry suggests potential publication bias in which studies reporting positive results or successful technology adoption are preferentially published, while studies documenting implementation challenges, cost barriers, or limited effectiveness receive less emphasis. This pattern has direct implications for evidence synthesis: the reviewed literature may overestimate technology effectiveness and underestimate real-world constraints.
Evidence interpretation: The keyword analysis reveals a literature dominated by technology-optimistic framing and benefit narratives, with systematic under-representation of challenge-focused or critical perspectives (Figures S1 and S2). This thematic structure likely influences how practitioners and policymakers interpret the evidence base, potentially biasing technology adoption decisions toward optimistic scenarios.

3.9. How Fragmented Is the Research Landscape? (Methodological Network Analysis and Co-Occurrence Patterns)

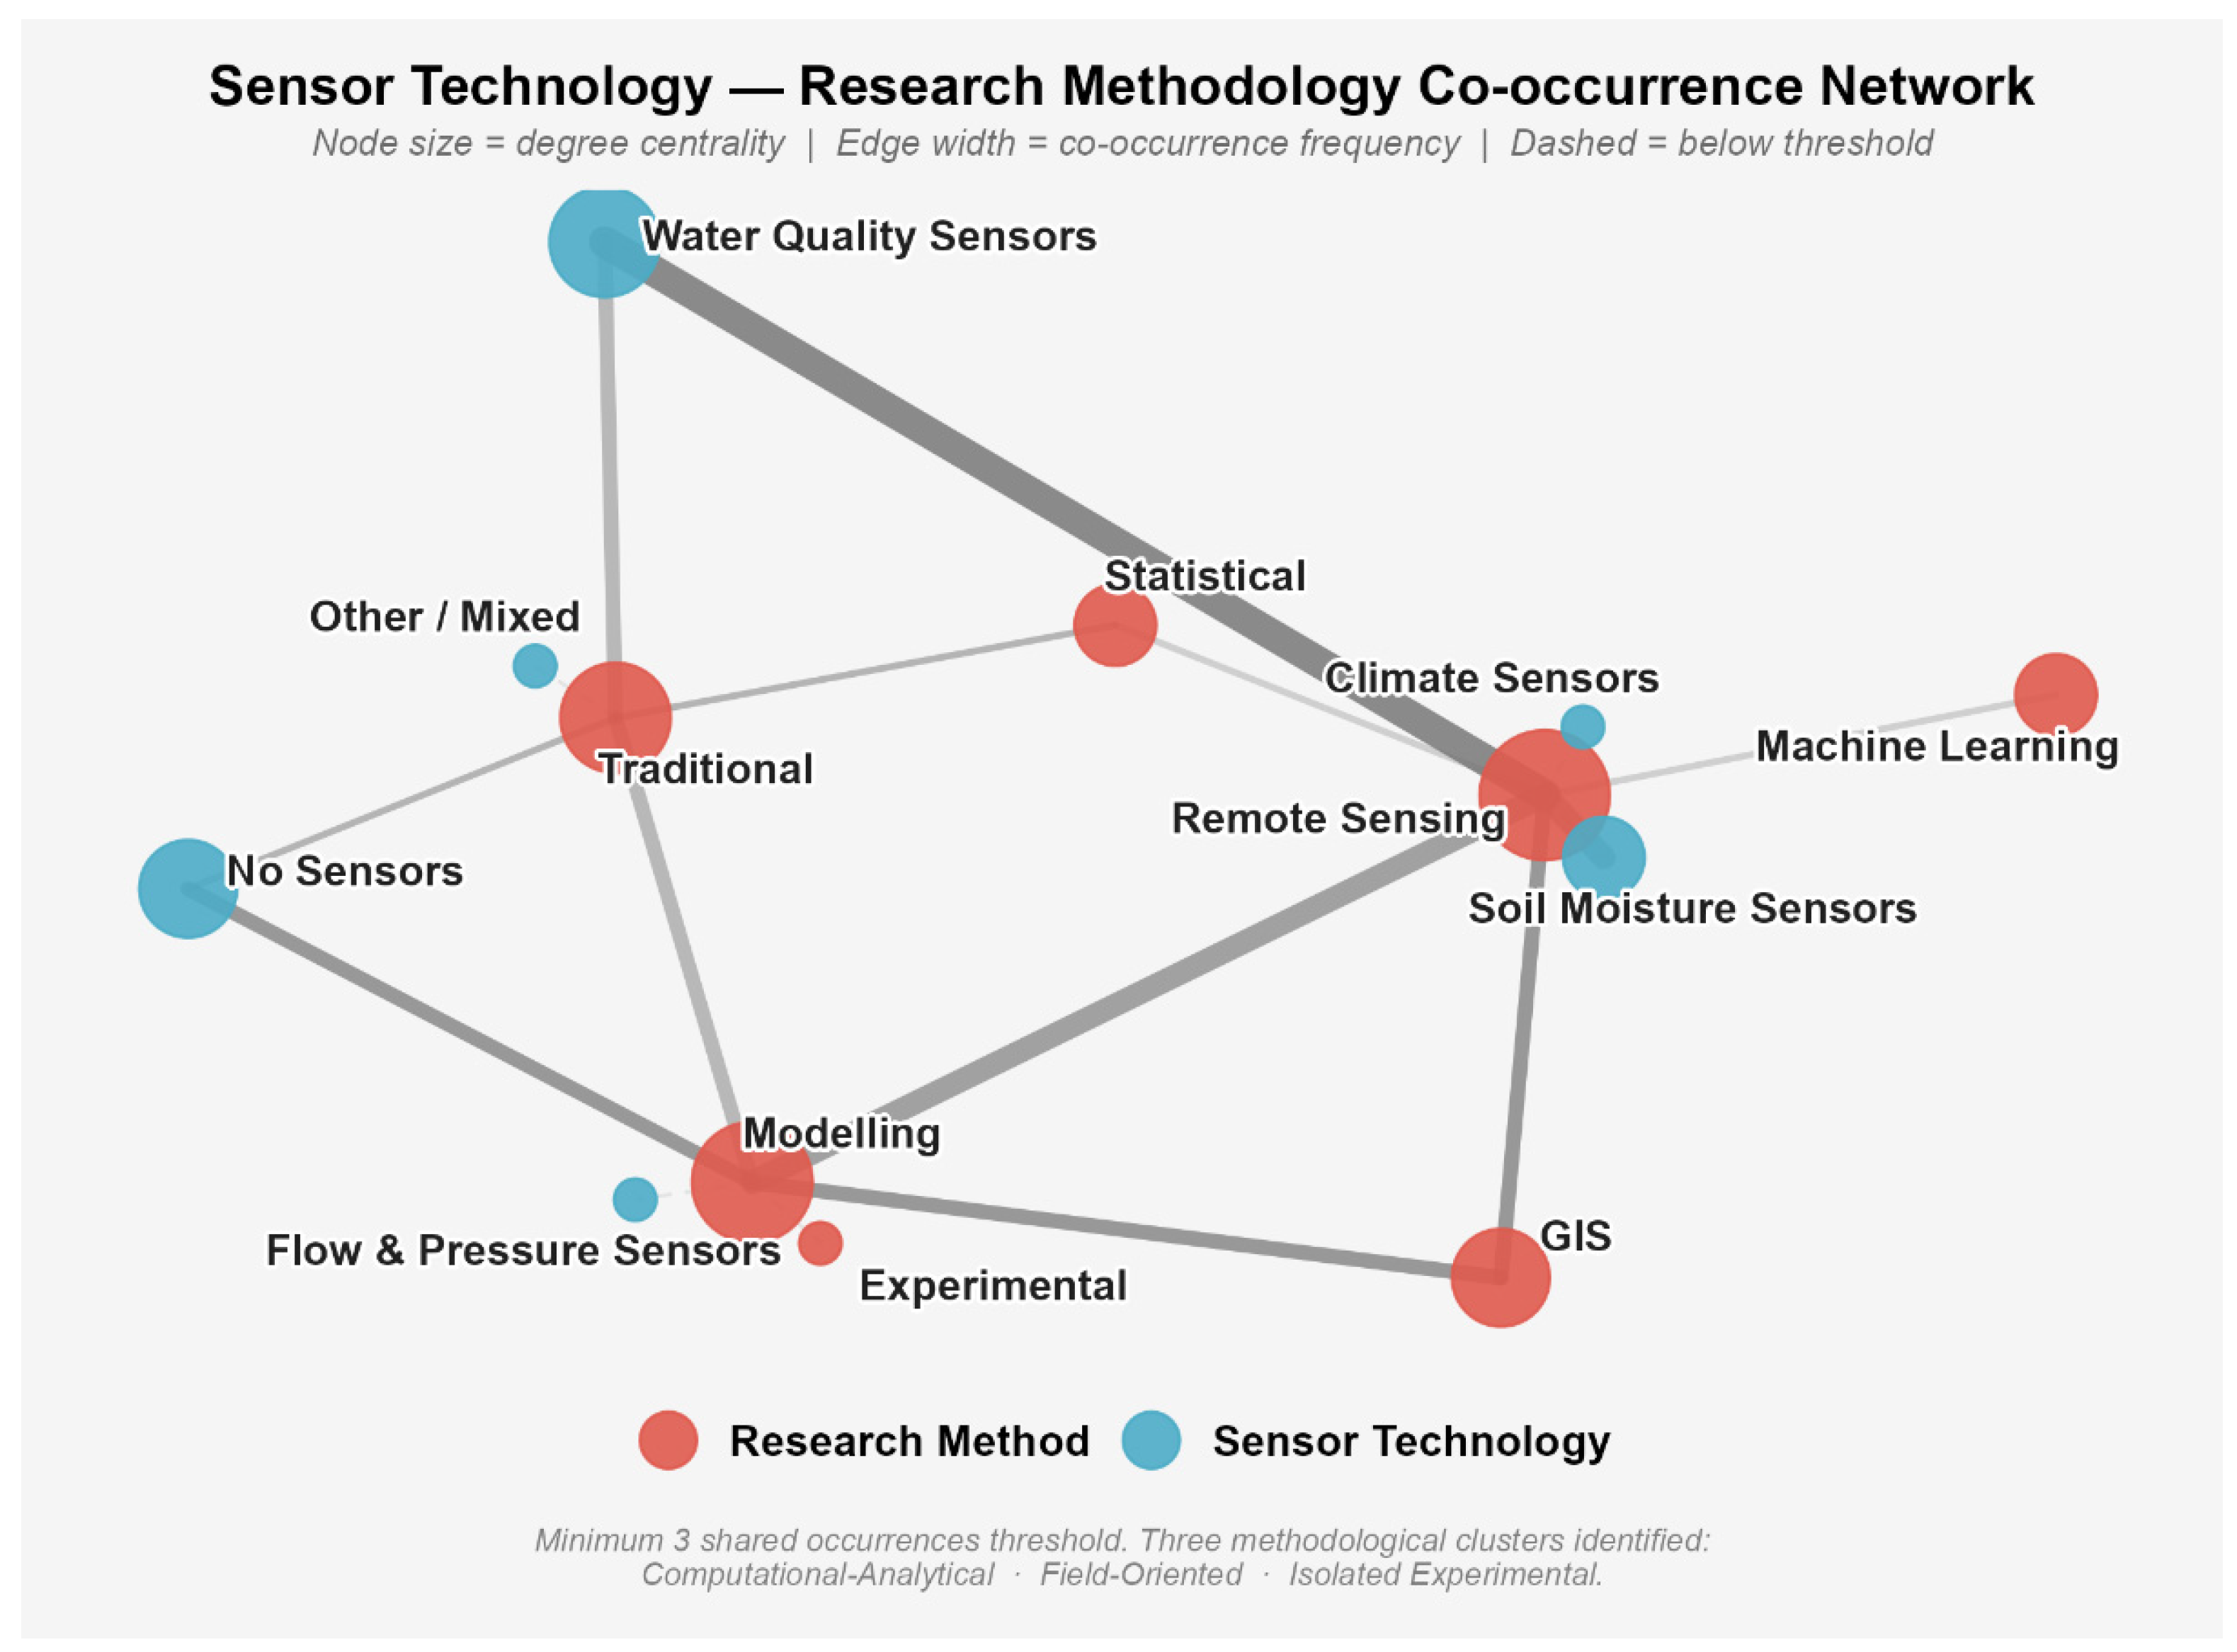
Research question: How integrated or fragmented is the methodological landscape in South African irrigation research? Do analytical approaches systematically combine with monitoring technologies, or do they operate in isolation? To address this, we conducted methodological co-occurrence analysis, examining which methods and technologies are frequently applied together in the same studies (minimum three shared occurrences across the corpus). This network analysis revealed a moderately fragmented structure (density = 0.24; modularity = 0.42), indicating weak integration between sensor technologies and analytical approaches (Figure 10). Three distinct methodological clusters emerged:
Cluster A: Computational–Analytical Grouping (GIS, Modelling, Remote Sensing, Machine Learning)
This cluster represents a computationally sophisticated methodological community centred on GIS, spatial modelling, remote sensing image analysis, and Machine Learning algorithms. These approaches are frequently co-applied and form the most interconnected component of the methodological network [1,2,4,73,79,80]. However, a critical weakness undermines the robustness of this cluster: links to in situ sensor-based field methods are comparatively weak, and fewer than 40% of studies in this cluster report explicit field validation. This indicates that advanced analytical tools are often applied with limited empirical grounding—models are frequently run with published parameters rather than locally calibrated datasets, and satellite-based estimates lack systematic ground-truth verification.
Cluster B: Field-Oriented Analytical Dyad (Traditional Methods and Statistical Analysis)
This cluster is dominated by a methodological pairing in which traditional field sampling and measurement approaches are predominantly analysed using conventional statistical methods (descriptive statistics, t-tests, ANOVA) [57,58,64,65,67,77]. While this cluster is associated with high-quality soil moisture and water quality sensor data, it shows minimal integration with modelling frameworks, GIS analysis, or machine learning. This indicates continued reliance on conventional analytical paradigms in field-based studies, despite the availability of temporal datasets well-suited to time-series forecasting or anomaly detection.
Cluster C: Isolated Experimental Approaches
Experimental approaches form a largely isolated component of the methodological network, exhibiting minimal co-occurrence with other analytical or sensor-based methods [5,61,69,70]. This isolation suggests that controlled field experiments are rarely combined with spatial analysis, hydrological modelling, or Machine Learning approaches, despite the potential for such integration to strengthen causal inference and generalisation.
Overall Network Interpretation:
The methodological network structure (Figure 9 and Figure 10) highlights a persistent and problematic disconnect: computationally advanced studies frequently lack strong field validation; field-based investigations underutilise advanced analytics; and experimental studies remain analytically isolated. This fragmentation reflects disciplinary silos in which computer scientists, hydrologists, and agronomists work in parallel rather than in integrated teams. The consequence is a loss of methodological synergy and constraint on the development of integrated, scalable irrigation monitoring solutions.

3.10. Which Monitoring Approaches Dominate the Literature, and What Adoption and Implementation Gaps Exist? (Synthesis Dashboard: Sensor Adoption, Temporal Trends, and Regional Application Opportunities)

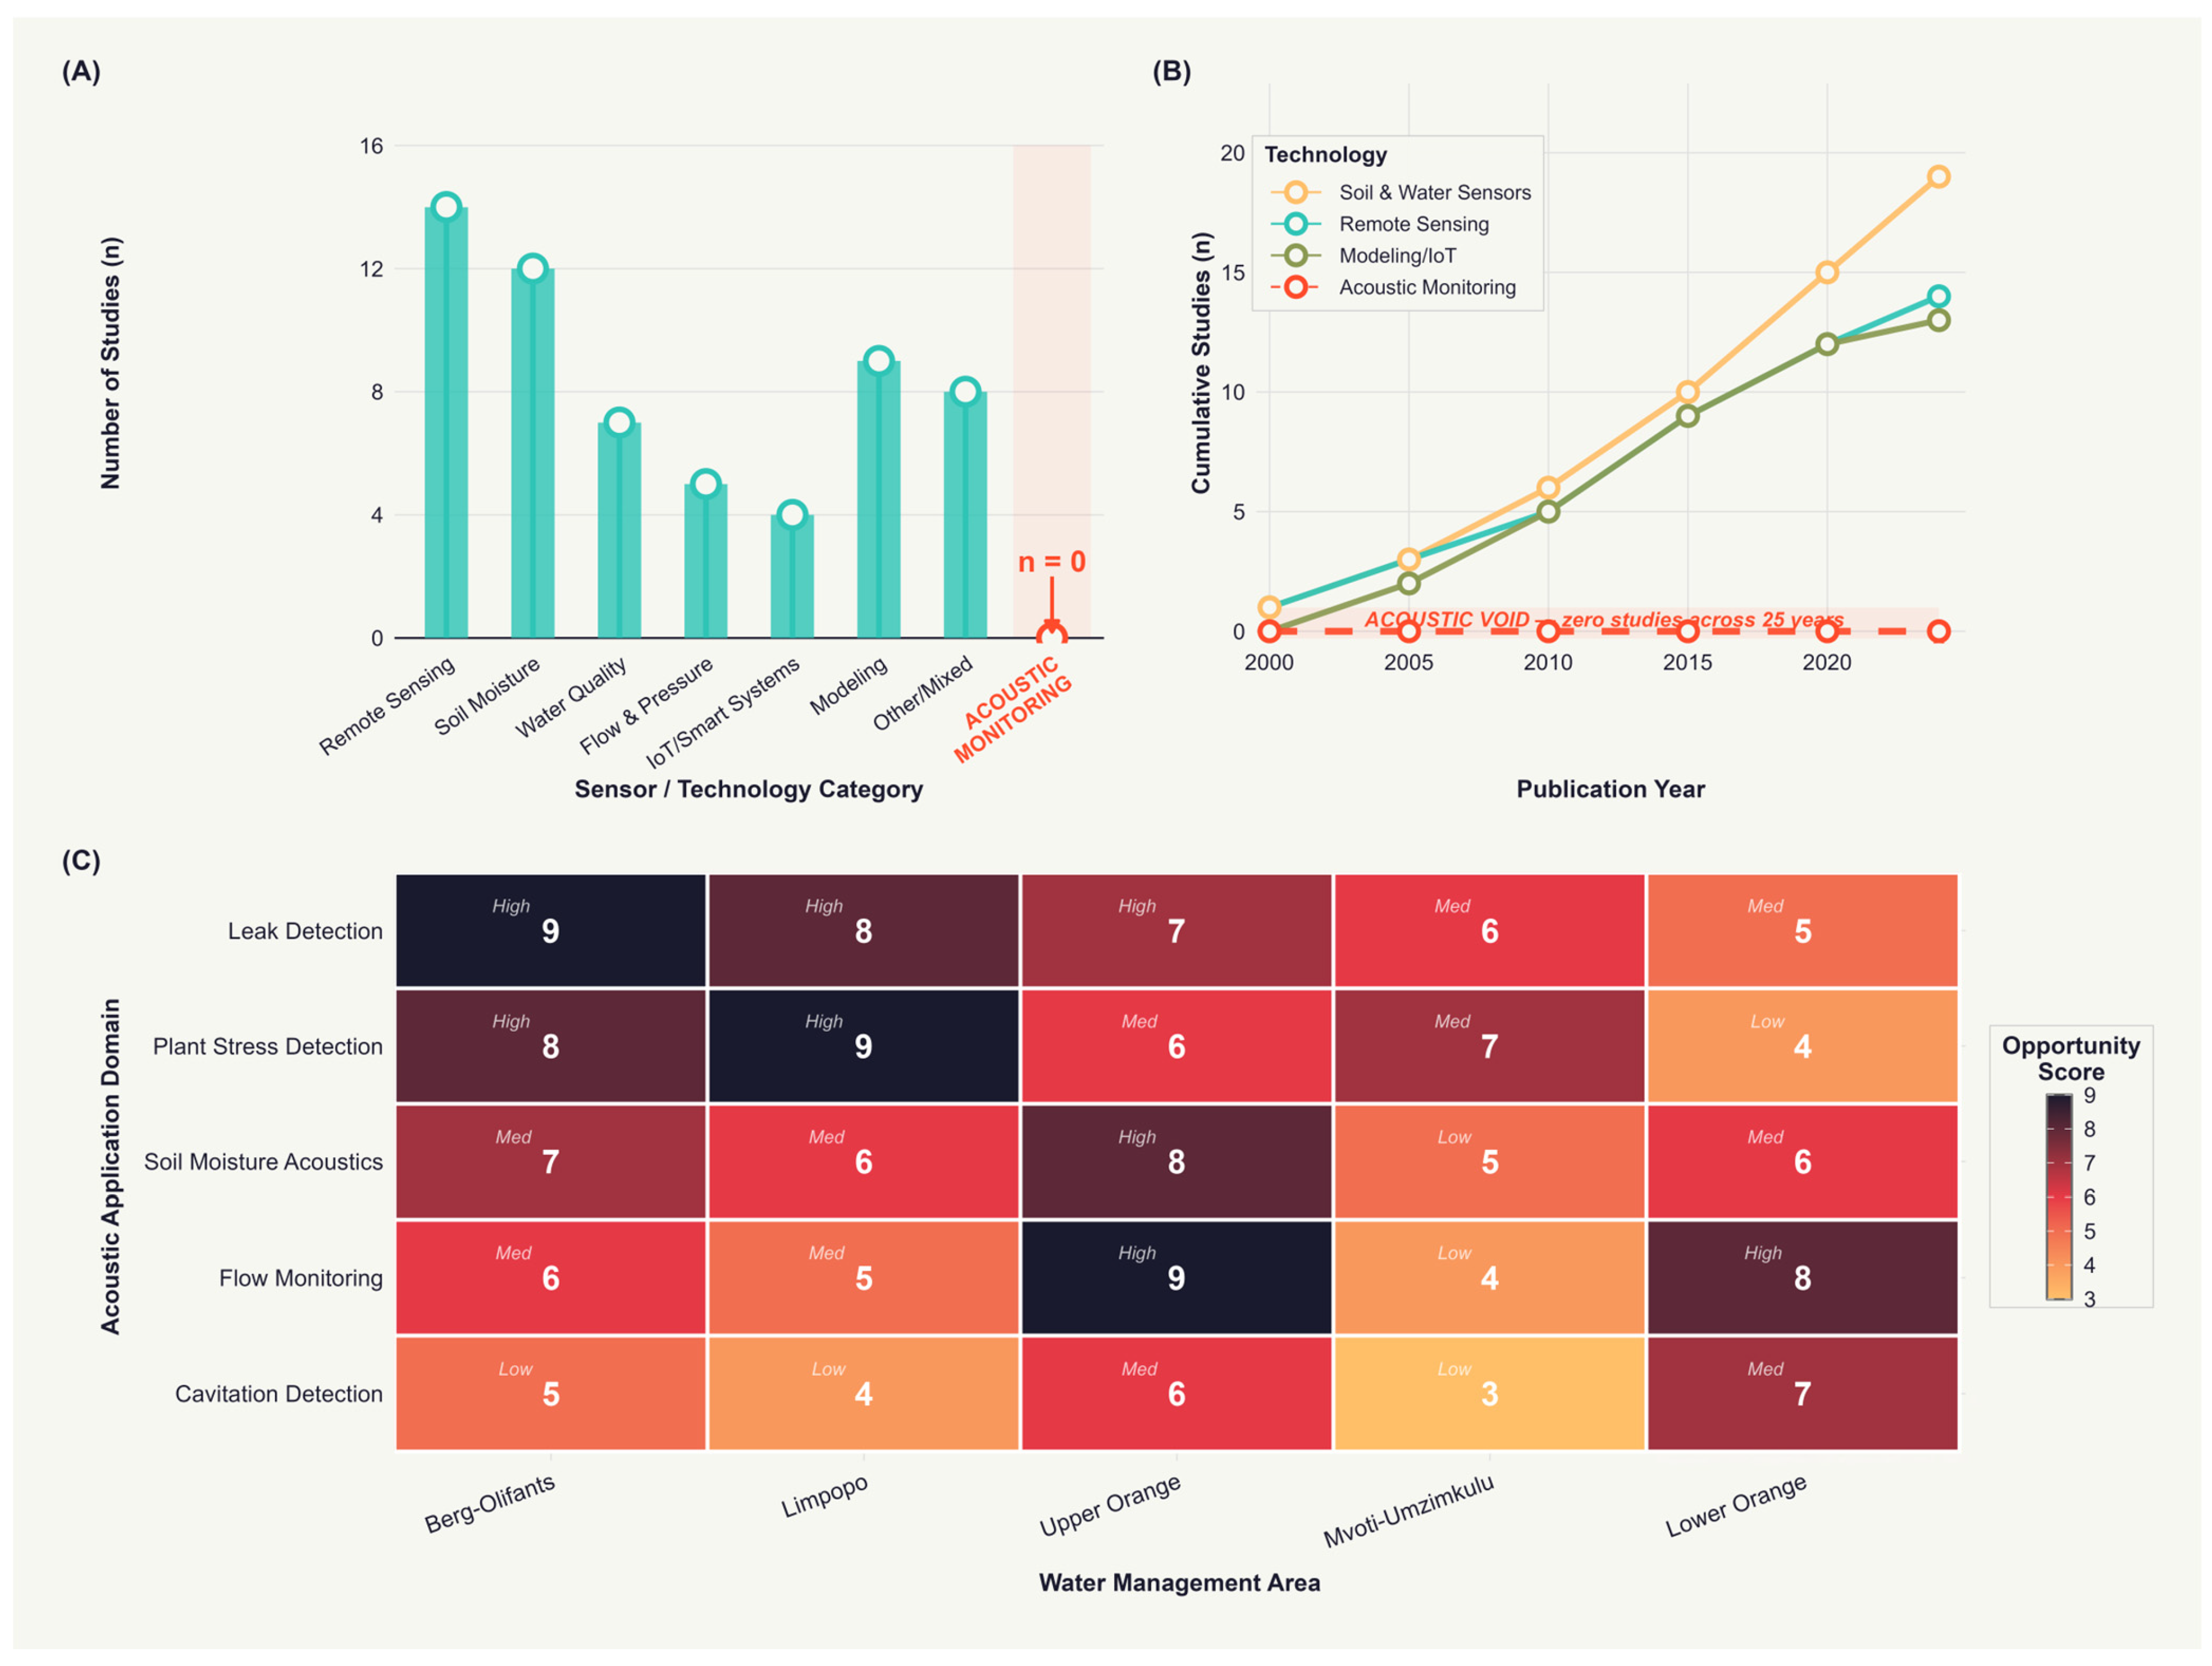
Research question: Which specific monitoring and sensing technologies dominate the reviewed literature? How have adoption patterns evolved temporally? And where exist critical mismatches between the current research focus and unmet regional application needs? To synthesise this evidence across multiple dimensions (technology type, temporal evolution, and geographic opportunity), we constructed an integrative dashboard (Figure 11A–C) that combines sensor adoption frequencies, publication timelines, and regional applicability scoring.
Panel A: Technology Adoption Distribution
Panel (A) displays the frequency distribution of technology types across the 59 reviewed studies. Remote sensing dominates the literature (n = 14; ~23%), representing nearly one-quarter of all studies and aligning closely with the prominence of Cluster 0 (remote sensing-dominant, n = 8) identified in the t-SNE clustering analysis (Figures S3 and S4) [2,70,72,73,79,80]. Soil moisture sensing follows as a secondary focus (n = 12; ~20%), reflecting growing interest in in situ sensor networks and precision irrigation scheduling. Modelling approaches appear in approximately 15% of studies (n = 9), corresponding to the identified Cluster 5 (crop modelling and demand projection). Intermediate adoption is observed for other/mixed approaches (n = 8; ~13%) and water quality monitoring (n = 7; ~11%), which corresponds to the moderate size but strong internal cohesion of Cluster 1 (water quality, n = 4) with 94% thematic consistency [58,64,67]. Lower representation is evident for flow/pressure sensing (n = 5; ~8%) and IoT/smart systems (n = 4; ~7%). Most strikingly, acoustic monitoring remains entirely absent (n = 0), indicating a complete research void not captured in any major clustering component.
Panel B: Temporal Evolution (2000–2025)
Panel (B) presents temporal dynamics showing how publication frequency and research focus have shifted across a 25-year period. Soil and water sensors exhibit the fastest cumulative growth trajectory, rising from n = 1 in 2000 to n = 19 in 2025, demonstrating a consistent upward trend driven partly by declining sensor costs and improving technical accessibility. Remote sensing shows steady publication (n = 14 total across 25 years) with acceleration in recent years (2015–2025), reflecting the release of Sentinel-2 free satellite imagery and maturation of cloud computing platforms. Modelling and IoT approaches show growth (n = 13 combined), with IoT research beginning to emerge only after 2018, indicating a recent disciplinary shift toward automation and real-time monitoring. Notably, acoustic monitoring remains persistently absent across the entire 24-year review period (n = 0), confirming this as a structural research void rather than a recent oversight. The divergent growth rates across technology types support the NMF topic modelling finding that climate change represents a cross-cutting theme (52% concordance) influencing multiple methodological streams [1,71,78,81], rather than forming a single dominant cluster.
Panel C: Regional Application Opportunities and Research–Practice Gaps
Panel (C) quantifies application opportunities across South Africa’s Water Management Areas (WMAs), based on an opportunity-scoring framework that combines four dimensions: (1) regional water scarcity severity, (2) documented infrastructure loss rates, (3) technology appropriateness for local climate/hydrology, and (4) smallholder adoption feasibility. Peak opportunity scores (9) are observed for leak detection applications in the Berg-Olifants WMA (Mediterranean climate, high-value horticulture, mature infrastructure, clear cost-benefit justification) and for plant stress detection via acoustic emissions in Limpopo (semi-arid context, mixed smallholder–commercial farming, high drought frequency). Flow monitoring in the Upper Orange WMA scores highly (opportunity score 8) given the region’s high evaporation demand and complex water allocation requirements. Soil moisture and acoustic sensing shows consistently moderate-to-high potential across regions (scores 6–8), with particularly strong opportunity in Upper Orange (score = 8), aligning with the thematic relevance of Topic 4 (precision irrigation and soil moisture management) [5,61,65,68,69]. Notably, flow monitoring and plant cavitation detection exhibit high opportunity scores (up to 8 and 7, respectively) despite markedly low representation in Panel (A), indicating that these are high-impact yet underexplored research areas [59,68,69,74,81]. Lower opportunity scores (3–5) in Mvoti-Umzimkulu reflect regional constraints including smaller-scale irrigation, limited infrastructure investment, and lower water scarcity pressure, consistent with the distinct socio-economic characteristics of this region (Cluster 3, n = 7; 86% topic overlap) [4,62,75,78,80].
Synthesis and Evidence-Practice Gap:
Figure 11 collectively demonstrates a critical mismatch: well-established research communities (remote sensing, modelling, precision irrigation soil moisture monitoring) dominate both adoption and publication output, while high-opportunity but underrepresented domains (acoustic monitoring, flow dynamics characterisation, cavitation detection) remain fragmented and weakly integrated into existing methodological clusters. This pattern indicates that research priorities are driven more by disciplinary momentum, available funding, and technical familiarity than by evidence of application need or impact potential. The implications are significant: technologies addressing documented regional needs (leak detection in aged infrastructure, real-time flow measurement) remain under-researched and under-developed, while mature but incrementally improved technologies (incremental refinements to remote sensing classification) continue to absorb disproportionate research attention.


4. Discussion

4.1. Evidence Gaps and Research Quality

4.1.1. The Acoustic Monitoring Deficit: Why an International Success Has No South African Studies

The most striking finding of this review is the complete absence of acoustic or ultrasonic monitoring studies across all fifty-nine included papers—a zero-percent representation in a literature that claims to address the water efficiency challenges of a country where more than half of irrigation schemes exceed thirty years of age and where documented water-loss rates run at 30–60% [35]. This absence is not a peripheral lacuna. Acoustic monitoring is precisely what aging, loss-prone buried pipeline infrastructure requires, and it is precisely what South African irrigation research has failed to deliver.
Internationally, the evidence base is extensive and consistent. California’s Central Valley employs acoustic sensors across more than 2000 km of irrigation canals [13]; Australia’s Murray-Darling Basin mandates ultrasonic flow meters for compliance monitoring [14]; Israel’s precision agriculture incorporates plant acoustic emissions for deficit irrigation scheduling [15]. Across these deployments, acoustic sensors achieve 95–98% leak detection accuracy and recoup installation costs of USD 500–2000 per unit within one to two years—a payback profile that is among the strongest of any monitoring technology reviewed here. The technology has been validated in water-scarce dryland contexts directly comparable to South African conditions, yet not a single study in the South African corpus has attempted to transfer or test it.
The economic significance of this gap is substantial. South Africa has approximately 1.5 million hectares of irrigated area, with average application of 1200 mm per year and an average loss rate of 40% across schemes, yielding total annual water loss of 7200 million m3. At a conservative marginal value of USD 0.15–0.25 per m3, the annual economic cost of undetected leakage is estimated at USD 1.1–1.8 billion sector-wide. A conservative 10% national loss reduction through acoustic monitoring would recover approximately 18 million m3 per year—sufficient to irrigate an additional 18,000 hectares without any increase in abstraction.
The gap most likely reflects disciplinary segregation rather than rational research prioritisation. Acoustic engineering expertise is concentrated in civil and hydraulic engineering specialties, while agricultural engineering has historically focused on soil–plant water relations, remote sensing, and agronomic outcomes. South African water utilities, including Johannesburg Water, have operated acoustic leak detection programmes whose findings have generated zero cross-citations with the irrigation literature—two communities solving adjacent problems in institutional isolation. Closing this gap requires cross-sectoral collaboration, dedicated funding mechanisms that explicitly bridge the agriculture–engineering divide, and local capacity building through curriculum development and technician training programmes currently absent from South African agricultural engineering courses.

4.1.2. Quality of Evidence: Modelling vs. Field Validation

Approximately one-third of reviewed studies (n = 20, 33.9%) employed simulation models—CROPWAT, AquaCrop, WEAP, SWAT, and HYDRUS-1D—to estimate irrigation requirements, potential water savings, or climate change impacts. A critical methodological concern undermines the credibility of this evidence stream: only three of these twenty studies (15%) validated their model outputs against independently measured field data [1,13,55]. The remaining 85% relied on published parameterisations without site-specific calibration, generating scenario projections rather than demonstrated outcomes.
Three compounding sources of uncertainty explain why this matters in practice. First, generic crop coefficients may not capture local cultivar water requirements: the crop coefficient (Kc) for maize in AquaCrop has been shown to vary between 0.95 and 1.20 across South African cultivars and planting dates, whereas many studies adopt the FAO default of Kc = 1.05—a deviation that introduces evapotranspiration estimation errors of 8–12% propagating through seasonal water balance calculations [89]. Second, coarse-resolution climate forcing data (25–50 km grids) used in most studies cannot capture local microclimatic variability; in topographically complex regions such as the Berg-Olifants system or Limpopo Province, temperature differences of ±2–5 °C and precipitation variability of ±20–40% over short distances significantly affect irrigation requirements. Third, many models assume optimal management—precise scheduling and uniform application—conditions rarely achieved in practice, particularly among smallholder farmers; field evidence indicates that deviations from optimal schedules can reach 30–50% [35], potentially reducing realised water savings to approximately half of modelled estimates.
The three validated studies illuminate what rigorous practice looks like (Table 4). Dlamini et al. [1] calibrated a WEAP model against observed river flows (R2 = 0.74) and validated evapotranspiration estimates using satellite data. Dzikiti et al. [75] parameterised AquaCrop using multi-year sap flow measurements. Mobe et al. [79] developed empirically validated regression models linking canopy size to water use. These exceptions demonstrate that validation is achievable; they remain exceptions because it requires multi-year investment and access to field instrumentation that short project cycles rarely accommodate.
The practical implication is direct: reported water savings of 30% from unvalidated models should be treated as theoretical upper bounds. Future research should adopt two-stage validation—verification against independent datasets followed by implementation testing through field or participatory farmer trials—and should frame outputs explicitly as conditional scenarios (e.g., ‘under optimal management’) rather than expected outcomes. Until such practices become standard, the policy value of the modelling literature will remain limited.

4.1.3. The Sensor-to-Decision Gap: Sensing Infrastructure Without Decision Support

Despite 42 studies (71.2%) deploying sensors of some kind—soil moisture probes, remote sensing platforms, water quality instruments, or weather stations—only two (3.4%) translated that monitoring capacity into prototype decision support systems capable of generating actionable irrigation recommendations [5,6]. This disproportion between data collection and decision-making infrastructure is one of the most consequential structural gaps in the South African literature.
The two existing prototypes clarify both what is achievable and how much remains undone. Nyathi and Muremi [5] developed an IoT soil moisture network on a Limpopo vegetable farm in which capacitance sensors sampling at 20 min intervals fed a fuzzy logic controller automating drip valve operation and dispatching SMS alerts to the farmer, achieving 25–30% water savings relative to calendar-based scheduling. Kapari et al. [6] used UAV thermal and multispectral imagery processed through Random Forest and Support Vector Machine models to generate Crop Water Stress Index maps for Western Cape maize (R2 = 0.87). Each prototype, however, carries structural limitations. Nyathi and Muremi’s system requires continuous internet connectivity and is parameterised for a single crop. Kapari et al.’s system maps stress without prescribing an irrigation response, and UAV survey costs of ZAR 3000–8000 per flight with two to four hours of post-processing make routine deployment impractical for most farms.
What neither prototype achieves—and what no South African study has yet delivered—is the integration of multiple data streams into a unified, farmer-facing recommendation system. No study combined soil moisture, weather forecasts, crop growth stage, and soil type into a single decision framework. None incorporated economic optimisation balancing water costs, labour, and expected yield benefit. None produced multilingual interfaces accessible to users with limited literacy. Internationally, Israel’s CropX platform integrates wireless sensors and satellite vegetation indices to deliver daily irrigation schedules across more than 100,000 hectares; Australia’s Arable Mark 2 device aggregates 40 parameters into cloud-based recommendations used on roughly 25% of irrigated cotton area. South Africa reports zero adoption of commercial DSS platforms.
The barriers sustaining this gap are structural rather than technical. Multi-year investment in software engineering, field validation, and interface design exceeds the scope of typical two-year research budgets. Existing sensor data are largely incompatible—different instruments, proprietary formats, non-interoperable platforms—making aggregation architecturally difficult. Private sector engagement, which in Israel has produced more than twenty agtech firms, is largely absent in South Africa. Closing the gap requires research institutions to co-design systems with farmers, extension agents, and agronomists; to adopt modular open-source architectures that begin with simple soil moisture SMS alerts and build progressively toward weather integration and economic modules; and to require validation across at least five farms, three crops, and two seasons before effectiveness claims are published.

4.2. Implementation Readiness and Context-Dependent Adoption

The three subsections below address the conditions under which irrigation monitoring technologies are adoptable, effective, and sustainable—moving from geographic transferability, through evidence for small-scale farmer implementation, to the ecological co-benefits that can strengthen the economic and policy case for investment.

4.2.1. Agroecological Zones and Geographic Transferability

Geographic concentration of the reviewed literature—42.4% of studies in the Berg-Olifants and Limpopo WMAs—creates a fundamental external validity concern. Technologies validated in Mediterranean Western Cape or subtropical Limpopo may perform substantially differently in the Northern Cape’s arid extremes, yet blanket extrapolation without site-specific testing is common in both research conclusions and policy applications.
The transferability question is not binary; it varies systematically by technology type. Remote sensing is the most transferable domain, with an estimated 80–90% of methods directly applicable across regions; satellites such as MODIS and Sentinel-2 are agnostic to ground conditions, vegetation indices validated in the Western Cape carry across climatic boundaries, and the Northern Cape’s lower annual cloud cover below 10% actually improves temporal resolution compared with the Western Cape’s 20–30%. The one genuine caveat is thermal band calibration for land surface temperature, where extreme Northern Cape conditions may fall outside the training range of Western Cape-derived models.
Soil moisture sensors occupy a more complicated middle ground, with transferability estimated at 50–60%. Western Cape studies used predominantly clay loam soils; Northern Cape conditions are characterised by high sand content exceeding 80%, which widens capacitance sensor error from ±2–3% to ±5–8% volumetric water content and necessitates soil-specific calibration curves, shallower sensor placement, and higher sampling frequency [90]. Sap flow technology transfers poorly—approximately 20–30% applicability—because the sensors validated on deciduous fruit trees in the Western Cape are physically incompatible with the low-trellis table grapes and herbaceous lucerne characteristic of Northern Cape systems. Water quality sensors fall at 60–70% transferability: the hardware functions across environments without modification, but alert thresholds require reconfiguration against crop-specific tolerances for Northern Cape salinity levels of 2–4 dS/m ECiw, compared with the sub-1.0 dS/m benchmarks assumed in Western Cape studies (Table 5).
The practical implication is a research priority: at least five studies conducted across diverse Northern Cape farms are needed before any technology can be recommended for scaling with confidence. Findings from other regions should serve as a starting point with an explicit caveat of pending local validation, not as the basis for technology mandates.

4.2.2. Small-Scale Farmer Implementation Evidence

The peer-reviewed literature captures only a fraction of actual small-scale sensor adoption in South Africa. Grey literature, industry reports, and Water User Association surveys identify at least twelve documented implementations, including tensiometer pilots in Limpopo, Eastern Cape, and KwaZulu-Natal; weather station cooperatives in the Western Cape and Free State; and drip irrigation paired with basic soil moisture sensors in peri-urban vegetable schemes around Johannesburg, Cape Town, and Durban. Reported water savings range from 12 to 35%, with the highest figures in peri-urban contexts where municipal metering makes savings economically visible and Comprehensive Agricultural Support Programme subsidies reduced capital barriers.
The economic data from Supplementary Table S7 expose a critical misalignment between research emphasis and developmental return. Tensiometers achieve payback periods of 0.1–0.3 years for smallholder operations—among the most financially viable agricultural investments available at that scale (Box 1). Basic capacitance sensors perform similarly. By contrast, IoT systems require two to seven years to recover costs, and UAV ownership produces negative net present value for individual farms, with payback periods exceeding ten years that place the technology entirely beyond farm-level economic reach.
Box 1. Key Finding: Smallholder ROI. 
Tensiometers achieve payback periods of 0.1–0.3 years when farmers pay volumetric water charges—among the strongest return-on-investment figures in the reviewed literature. Despite this, studies incorporating tensiometers and low-cost capacitance sensors account for only approximately 20% of sensor research, against 15% for IoT and UAV systems whose payback periods run to seven years or more for smallholder operations.
Across the documented implementations, consistent success factors emerge: cooperative ownership models that reduce per-farm capital costs to affordable levels; technology simplicity that demands minimal training and no electronic infrastructure; peer learning through demonstration plots (in the Dzindi scheme, one tensiometer pilot in 2018 catalysed fourteen neighbouring adoptions by 2020); and integration with, rather than replacement of, existing farmer judgment. Where implementations failed, the pattern was equally consistent: flat-fee water charges that removed conservation incentives, maintenance cultures that left broken instruments unreplaced, and extension services that provided intensive early support before withdrawing entirely [5,35].
Correcting the current research misallocation requires deliberate rebalancing. Technologies with capital costs below ZAR 10,000 and payback periods under two years currently account for approximately 20% of sensor research; raising that share to 70% would bring the portfolio into meaningful alignment with the scale and economic circumstances of most South African farmers. This is not an argument against sophisticated technologies—it is an argument that research allocation should reflect the structure of the sector it serves.

4.2.3. Ecological Co-Benefits: Soil Health and Environmental Outcomes

Precision irrigation technologies do not merely save water—they generate measurable co-benefits for soil health and downstream aquatic environments that strengthen the economic and policy case for adoption beyond farm-level water savings alone. These co-benefits are currently underrepresented in the South African literature but are well documented internationally.
The primary pathway is through reduced deep percolation and surface runoff. Sensor-guided irrigation scheduling targets application to actual crop demand, reducing the excess water that leaches nutrients from root zones and transports sediment and agrochemicals into waterways. Nyathi and Muremi’s [5] 25–30% reduction in applied water translates directly into a proportional reduction in return flow volume—and, where fertiliser management is also adjusted, into reduced nutrient loads reaching receiving water bodies. Soil health benefits compound over time: reduced leaching preserves exchangeable cations, irrigation-induced compaction decreases as field traffic associated with unscheduled applications is eliminated, and soil microbial community structure improves under less waterlogged conditions.
For water quality outcomes, precision irrigation complements rather than replaces dedicated mitigation technologies. The Middle Olifants Catchment in Limpopo, where phosphate concentrations rise from 0.08 mg/L upstream to 0.34 mg/L downstream [3]—exceeding eutrophication thresholds 4.25-fold—represents a context in which sensor-guided scheduling would reduce return flow volumes while vegetated treatment systems intercept residual pollution. International meta-analyses report that routing irrigation return flows through bioswales or constructed wetlands removes 40–70% of phosphate, 50–80% of nitrate, and 30–60% of suspended sediment. Neither precision irrigation nor passive treatment alone achieves what the two achieve in combination.
Policy alignment follows naturally from this co-benefit framing. South Africa’s National Water Act requires that agricultural users demonstrate beneficial use and minimise environmental harm; precision irrigation supported by monitoring evidence directly satisfies both conditions. Water quality standards for return flows could, over time, create regulatory incentives for the integrated adoption of sensor-guided scheduling and treatment infrastructure—a pathway that aligns conservation, productivity, and compliance objectives without requiring separate policy instruments for each.

4.3. Pathways Forward: Integration, Prioritisation, and Solutions

The three subsections below translate the gaps and implementation evidence reviewed above into actionable research and policy direction. They address, in turn, the structural fragmentation of methodological approaches, the technology-specific solutions required to address water quality degradation, and an explicit prioritisation of where the field should focus its limited research capacity and funding over the next five years.

4.3.1. Bridging Methodological Silos: Integration of Modelling, Sensing, and Decision Science

Network analysis of the reviewed literature reveals a modularity coefficient of 0.42 and three largely disconnected methodological communities—modellers, remote sensing specialists, and field experimentalists—with a co-citation density of only 0.24 [Section 3.10]. This structural fragmentation means that modelling studies generate scenarios that field researchers never test, and field studies produce empirical data that modellers never incorporate. The result is a literature whose parts are individually credible but whose whole is less than the sum of them. Five mechanisms offer concrete pathways toward integration.
The most direct response is a formalised two-stage validation protocol in which simulation outputs become the starting point for field inquiry rather than its substitute. Under this approach, tools such as CROPWAT and AquaCrop would first identify promising strategies—predicting, for instance, that 70% ETc deficit irrigation during the vegetative stage could save 20% water at a cost of 5% yield reduction—with those predictions then tested in three to five on-farm trials instrumented with soil moisture sensors and yield monitors. A second mechanism addresses the parameterisation gap through participatory model co-development: modellers would interview five to ten farmers per study area before parameterisation to establish actual achievable irrigation uniformity (typically 60–70%, not the 85% commonly assumed), labour availability constraints, and governance realities—and would then ask farmers to review draft model outputs for operational plausibility.
A nationally coordinated sensor network of 25–50 sites distributed across three to five WMAs, with standardised data formats and public repository access through platforms such as the South African Environmental Observation Network, would transform individual sensor deployments from isolated research acts into a shared national calibration resource. South Africa currently contributes a single active eddy covariance tower at Skukuza in the Kruger National Park, against more than 100 operating in the United States through the FLUXNET network; building comparable irrigation monitoring infrastructure would address the parameterisation deficit at its source. Transdisciplinary team composition—bringing together agricultural engineers, agronomists, hydrologists, data scientists, social scientists, and extension agents—would need to become a funding requirement, not an optional aspiration, and hybrid publication formats sequencing modelling scenarios, field trials, and synthesis would both demonstrate that integration is achievable and set a methodological precedent (Table 6).

4.3.2. Technology-Specific Solutions: From Water Quality Monitoring to Mitigation

Although 25 studies (42.4%) documented irrigation-induced water quality degradation—including a fourfold downstream phosphate increase [3], repeated nitrate exceedances, and progressive salinity accumulation across multiple catchments—not a single study evaluated a technological intervention designed to address the pollution it had identified. Five technology-based approaches warrant prioritised piloting, each drawing on international evidence and, where possible, the specific sites and conditions already characterised in this review.
Translating these proposals into practice requires research investments matched to the multi-year, multi-site scale the questions demand. Bioswale trials should span at least three WMAs and two full seasons with continuous sensor-based performance monitoring. Economic analyses must account for downstream treatment costs and regulatory compliance alongside farm-level costs. The broader strategic point is that technology-based mitigation complements rather than substitutes source reduction through precision fertiliser application and organic amendments—a comprehensive response to irrigation-induced water quality degradation requires all three elements working in sequence: preventing excess application, treating unavoidable runoff, and monitoring the effectiveness of both.

4.3.3. Research Priority Ranking: Where to Focus Next

The four review objectives collectively surfaced more research needs than any single funding cycle can address. Prioritisation based on scale of impact, urgency, and cost-effectiveness identifies two interventions as Tier 1 priorities warranting immediate attention between 2025 and 2027.
Acoustic monitoring for leak detection in aging infrastructure is the most glaring evidence void in this review—zero of fifty-nine studies engaged with it—yet the problem it addresses is neither marginal nor distant. More than half of South Africa’s irrigation schemes exceed thirty years of age, water losses run at 30–60% in poorly maintained systems, and international deployments achieve 95–98% leak detection with payback periods of one to two years. Five to ten rigorously monitored pilot deployments in high-loss WMAs—Upper Vaal, Lower Orange, and Berg-Olifants are the priority candidates—would generate the economic and technical evidence needed to support policy mandates for acoustic monitoring in new and rehabilitated schemes.
Low-cost soil moisture sensors for smallholder schemes constitute the second Tier 1 priority on different grounds: tensiometers carry payback periods as short as 0.1–0.3 years, require no electricity or proprietary software, and are accessible to farmers with minimal training, yet the roughly 150,000 smallholders operating below ten hectares remain almost entirely outside the peer-reviewed evidence base. Scaling existing pilots from several hundred to five to ten thousand farmers, paired with volumetric water pricing reform to create genuine conservation incentives, would simultaneously address the population most exposed to water insecurity and the evidence gap most consequential for pro-poor policy (Table 7).
The underlying logic of this ranking applies the Pareto principle: Tier 1 investment alone has the potential to address most volumetric water loss and reach the majority of the farming population through proven, cost-effective technologies. Advanced technologies—sap flow sensors, plant cavitation acoustics, UAV hyperspectral imaging—remain largely appropriate for industry-funded commercial operations and are best pursued opportunistically rather than as core public investment priorities. Tiers 2 and 3 provide incrementally valuable but less transformative returns per rand of public research expenditure (Box 2).
Box 2. Summary: Evidence, Gaps, and Pathways Forward. 
South African irrigation research demonstrates scientific maturity in observational monitoring—particularly water quality surveillance and landscape-scale remote sensing—yet remains nascent in precision closed-loop management and socio-technical systems integration. The complete absence of acoustic monitoring research, despite more than 50% of schemes experiencing 30–60% water losses, represents the most striking evidence gap. IoT and Machine Learning are under-represented (1.7% and 6.8% respectively), reflecting both disciplinary silos and real socio-technical barriers to adoption in resource-poor rural contexts. Geographic concentration in Berg-Olifants and Limpopo WMAs means that technology appropriateness for arid Northern Cape, coastal Eastern Cape, and humid KwaZulu-Natal regions remains speculative. Priority research should couple acoustic monitoring pilots, multi-location experimental networks, and socio-technical systems research to bridge the documented gap between technical potential and actual farmer adoption outcomes.

4.4. Concluding Statement

Sensor and acoustic monitoring technologies offer substantial potential for advancing irrigation water productivity and quality in South Africa’s water-scarce context. However, evidence synthesis reveals a fundamental principle: technology does not determine outcomes. It is context—baseline efficiency, maintenance capacity, farmer expertise, and governance quality—that determines whether a given technology delivers impact or remains unused. Water savings of 15–30% documented in research trials only materialize where baseline efficiency permits improvement, maintenance capacity exists, farmer sophistication aligns with technology requirements, and governance structures support adoption. Geographic heterogeneity in climate, water availability, soil properties, farmer sophistication, and institutional capacity demands region-specific technology recommendations rather than universal prescriptions.
The absence of acoustic monitoring research—despite clear international precedent and documented South African infrastructure deterioration—represents the starkest example of misalignment between technology opportunity and research investment. This gap, alongside minimal development of IoT systems, Machine Learning analytics, and socio-economic inquiry, indicates that the current research portfolio is not optimally calibrated to the most pressing water management challenges. Reorientation toward technologies that address acute infrastructure needs, experimental validation across the full range of South African agroecologies, and socio-technical adoption research would move the field beyond descriptive documentation of technology potential toward evidence-based guidance capable of supporting sustainable, equitable, and context-appropriate technology integration in practice.

Supplementary Materials

The following supporting information can be downloaded at https://www.mdpi.com/article/10.3390/agriengineering8050161/s1.

Author Contributions

G.S.N.: Conceptualization, Methodology, Data curation, Data analysis (NLP/ML), Writing—original draft, Writing—review and editing; T.S.R.: Conceptualization, Supervision, Validation, Writing—review and editing; N.F.V.: Data curation, Literature review screening, Validation, Writing—review and editing; A.N.: Supervision, Methodology, Data analysis (NLP/ML), Writing—review and editing, Project administration. All authors have read and agreed to the published version of the manuscript.

Funding

The authors declare that no external financial support was received for the research and/or publication of this article beyond the Higher Education Postgraduate academic support funding from the Republic of South Africa.

Institutional Review Board Statement

Not applicable.

Informed Consent Statement

Not applicable.

Data Availability Statement

The original contributions presented in this study are included in the article/Supplementary Materials. Further inquiries can be directed to the corresponding author.

Acknowledgments

The research presented in the article was supported by the University of Debrecen Program for Scientific Publication. The authors acknowledge the University of Debrecen library for database access and the scoping review screening team for inter-rater reliability assessment.

Conflicts of Interest

The authors declare no conflicts of interest.

Notes and Abbreviations

AIArtificial Intelligence
ARIMAAutoregressive Integrated Moving Average
BERTBidirectional Encoder Representations from Transformers
BERTopicBERT-based Topic Modelling
CHIRPSClimate Hazards Group InfraRed Precipitation with Station data
CIConfidence Interval
CROPWATCrop Water Requirements software (FAO)
CSIRCouncil for Scientific and Industrial Research
CWSICrop Water Stress Index
DPIDepartment of Public Infrastructure
ECElectrical Conductivity
ECWRMEastern Cape Water Resources Management
ETEvapotranspiration
EVIEnhanced Vegetation Index
FAOFood and Agriculture Organization
FDRFrequency Domain Reflectometry
GDDPGlobal Daily Downscaled Projections
GISGeographic Information System
GRADEGrading of Recommendations Assessment, Development and Evaluation
HDBSCANHierarchical Density-Based Spatial Clustering of Applications with Noise
HYDRUSHydrological Simulation Software
ICPIrrigation Capacity Program
IDFIntensity–Duration–Frequency
LSTMLong Short-Term Memory
MLMachine Learning
MODISModerate Resolution Imaging Spectroradiometer
NDVINormalized Difference Vegetation Index
NASANational Aeronautics and Space Administration
NEXNASA Earth Exchange
NGONon-Governmental Organization
NKTANdumo-Kulubi-Tshongwe Aquifer
NLPNatural Language Processing
NMFNon-negative Matrix Factorization
NRFNational Research Foundation
OESOpen-Ended Survey
PCAPrincipal Component Analysis
PRISMAPreferred Reporting Items for Systematic Reviews and Meta-Analyses
RCPRepresentative Concentration Pathway
RFRandom Forest
RMSERoot Mean Square Error
ROIReturn on Investment
RRFRidge Regression Feature selection
RSRemote Sensing
SBERTSentence-BERT (Sentence Bidirectional Encoder Representations from Transformers)
SNEStochastic Neighbour Embedding
WSNWireless Sensor Network

References

  1. Dlamini, N.; Senzanje, A.; Mabhaudhi, T. Modelling the Water Supply-Demand Relationship Under Climate Change in the Buffalo River Catchment, South Africa. PLoS Clim. 2024, 3, e0000464. [Google Scholar] [CrossRef]
  2. Mpakairi, K.S.; Dube, T.; Sibanda, M.; Mutanga, O. Remote Sensing Crop Water Productivity and Water Use for Sustainable Agriculture During Extreme Weather Events in South Africa. Int. J. Appl. Earth Obs. Geoinf. 2024, 129, 103833. [Google Scholar] [CrossRef]
  3. Fanadzo, M.; Ncube, B. Review: Challenges and Opportunities for Revitalising Smallholder Irrigation Schemes in South Africa. Water SA 2018, 44, 436–447. [Google Scholar] [CrossRef]
  4. Kapari, M.; Sibanda, M.; Magidi, J.; Mabhaudhi, T.; Nhamo, L.; Mpandeli, S. Comparing Machine Learning Algorithms for Estimating the Maize Crop Water Stress Index (CWSI) Using UAV-Acquired Remotely Sensed Data in Smallholder Croplands. Drones 2024, 8, 61. [Google Scholar] [CrossRef]
  5. Nyathi, D.D.; Muremi, L. Solar- and IoT-Based Smart Irrigation System Using Fuzzy Logic for Sustainable Agriculture. In 2024 IEEE PES/IAS PowerAfrica, Johannesburg, South Africa, 7 October 2024; IEEE: Piscataway, NJ, USA, 2024; pp. 1–5. [Google Scholar]
  6. Van Averbeke, W.; Denison, J.; Mnkeni, P. Smallholder Irrigation Schemes in South Africa: A Review of Knowledge Generated by the Water Research Commission. Water SA 2011, 37, 797–808. [Google Scholar] [CrossRef]
  7. Munyaradzi, M.; Hapanyengwi, G.; Masocha, M.; Mutandwa, E.; Raeth, P.; Nyambo, B.; Murwira, A.; Mashonjowa, E. Precision Irrigation Scheduling Based on Wireless Soil Moisture Sensors to Improve Water Use Efficiency and Yield for Winter Wheat in Sub-Saharan Africa. Adv. Agric. 2022, 2022, 8820764. [Google Scholar] [CrossRef]
  8. Abioye, E.A.; Abidin, M.S.Z.; Mahmud, M.S.A.; Buyamin, S.; Ishak, M.H.I.; Rahman, M.K.I.A.; Otuoze, A.O.; Onotu, P.; Ramli, M.S.A. A Review on Monitoring and Advanced Control Strategies for Precision Irrigation. Comput. Electron. Agric. 2020, 173, 105441. [Google Scholar] [CrossRef]
  9. Vilagrosa, A.; Chirino, E.; Peguero-Pina, J.J.; Barigah, T.S.; Cochard, H.; Gil-Pelegrín, E. Xylem Cavitation and Embolism in Plants Living in Water-Limited Ecosystems. In Plant Responses to Drought Stress; Aroca, R., Ed.; Springer: Berlin/Heidelberg, Germany, 2012; pp. 63–109. ISBN 978-3-642-32652-3. [Google Scholar]
  10. Nolf, M.; Beikircher, B.; Rosner, S.; Nolf, A.; Mayr, S. Xylem Cavitation Resistance Can Be Estimated Based on Time-Dependent Rate of Acoustic Emissions. New Phytol. 2015, 208, 625–632. [Google Scholar] [CrossRef]
  11. Degraeve, S.; De Baerdemaeker, N.J.F.; Ameye, M.; Leroux, O.; Haesaert, G.J.W.; Steppe, K. Acoustic Vulnerability, Hydraulic Capacitance, and Xylem Anatomy Determine Drought Response of Small Grain Cereals. Front. Plant Sci. 2021, 12, 599824. [Google Scholar] [CrossRef]
  12. Liu, M.; Guan, H.; Ma, X.; Yu, S.; Liu, G. Recognition Method of Thermal Infrared Images of Plant Canopies Based on the Characteristic Registration of Heterogeneous Images. Comput. Electron. Agric. 2020, 177, 105678. [Google Scholar] [CrossRef]
  13. Smith, R.J.; Raine, S.R.; Minkevich, J. Irrigation Application Efficiency and Deep Drainage Potential Under Surface Irrigated Cotton. Agric. Water Manag. 2005, 71, 117–130. [Google Scholar] [CrossRef]
  14. Lozano, D.; Mateos, L. Field Evaluation of Ultrasonic Flowmeters for Measuring Water Discharge in Irrigation Canals. Irrig. Drain. 2009, 58, 189–198. [Google Scholar] [CrossRef]
  15. Cohen, Y.; Alchanatis, V.; Meron, M.; Saranga, Y.; Tsipris, J. Estimation of Leaf Water Potential by Thermal Imagery and Spatial Analysis. J. Exp. Bot. 2005, 56, 1843–1852. [Google Scholar] [CrossRef] [PubMed]
  16. Nxumalo, G.S.; Chauke, H. Challenges and Opportunities in Smallholder Agriculture Digitization in South Africa. Front. Sustain. Food Syst. 2025, 9, 1583224. [Google Scholar] [CrossRef]
  17. Sibanda, S.; Munjoma-Muchinguri, P.; Ohene-Agyei, P.; Murage, A.W. Policies for Optimal Nutrition-Sensitive Options: A Study of Food and Nutrition Security Policies, Strategies and Programs in Ghana, Kenya and South Africa. Front. Sustain. Food Syst. 2023, 7, 1088216. [Google Scholar] [CrossRef]
  18. Abdelmoneim, A.A.; Al Kalaany, C.M.; Khadra, R.; Derardja, B.; Dragonetti, G. Calibration of Low-Cost Capacitive Soil Moisture Sensors for Irrigation Management Applications. Sensors 2025, 25, 343. [Google Scholar] [CrossRef]
  19. Ebstu, E.T.; Hatiye, S.D.; Goshime, D.W.; Dingemanse, J.D.; Dugassa, D.D.; Fitensa, T.; Enssa, G.; Chare, C.D.; Areru, D.A.; Demeke, Y.G. Development and Testing of a Low-Cost Soil Moisture Sensor for Real-Time Irrigation Scheduling. Irrig. Drain. 2025, 75, 173–187. [Google Scholar] [CrossRef]
  20. Friedlander, L.; Tal, A.; Lazarovitch, N. Technical Considerations Affecting Adoption of Drip Irrigation in Sub-Saharan Africa. Agric. Water Manag. 2013, 126, 125–132. [Google Scholar] [CrossRef]
  21. Fell, J.; Pead, J.; Winter, K. Low-Cost Flow Sensors: Making Smart Water Monitoring Technology Affordable. IEEE Consum. Electron. Mag. 2019, 8, 72–77. [Google Scholar] [CrossRef]
  22. Von Solms, S.; Meyer, J. Use of Low Bandwidth Network Technologies and Sensors for Operation and Performance Monitoring of Rural Development Projects: A Case Study in South Africa. Electron. J. Inf. Syst. Dev. Ctries. 2021, 87, e12182. [Google Scholar] [CrossRef]
  23. Arangurí, M.; Mera, H.; Noblecilla, W.; Lucini, C. Digital Literacy and Technology Adoption in Agriculture: A Systematic Review of Factors and Strategies. AgriEngineering 2025, 7, 296. [Google Scholar] [CrossRef]
  24. Gong, W.; Ma, R.; Zhang, H. Digital Agricultural Technology Services and Farmers’ Willingness to Choose Digital Production Technology in Sichuan Province, China. Front. Sustain. Food Syst. 2024, 8, 1401316. [Google Scholar] [CrossRef]
  25. Mapiye, O.; Makombe, G.; Molotsi, A.; Dzama, K.; Mapiye, C. Towards a Revolutionized Agricultural Extension System for the Sustainability of Smallholder Livestock Production in Developing Countries: The Potential Role of ICTs. Sustainability 2021, 13, 5868. [Google Scholar] [CrossRef]
  26. Thi Hoa Sen, L.; Chou, P.; Dacuyan, F.B.; Nyberg, Y.; Wetterlind, J. Barriers and Enablers of Digital Extension Services’ Adoption among Smallholder Farmers: The Case of Cambodia, the Philippines and Vietnam. Int. J. Agric. Sustain. 2024, 22, 2368351. [Google Scholar] [CrossRef]
  27. Klerkx, L.; Rose, D. Dealing with the Game-Changing Technologies of Agriculture 4.0: How Do We Manage Diversity and Responsibility in Food System Transition Pathways? Glob. Food Secur. 2020, 24, 100347. [Google Scholar] [CrossRef]
  28. Klerkx, L.; Jakku, E.; Labarthe, P. A Review of Social Science on Digital Agriculture, Smart Farming and Agriculture 4.0: New Contributions and a Future Research Agenda. NJAS-Wagening. J. Life Sci. 2019, 90–91, 100315. [Google Scholar] [CrossRef]
  29. Hu, Z.; Tariq, S.; Zayed, T. A Comprehensive Review of Acoustic Based Leak Localization Method in Pressurized Pipelines. Mech. Syst. Signal Process. 2021, 161, 107994. [Google Scholar] [CrossRef]
  30. Ke, B.; Shiau, Y.; Wang, B.; Chang, C.; Jim Yeh, T.; Tsai, J. Time-Lapsed Hydraulic Tomography for Monitoring Hydraulic Conductivity Field Evolution Caused by Pore-Clogging. Water Resour. Res. 2025, 61, e2023WR036786. [Google Scholar] [CrossRef]
  31. Bounajra, A.; Guemmat, K.E.; Mansouri, K.; Akef, F. Towards Efficient Irrigation Management at Field Scale Using New Technologies: A Systematic Literature Review. Agric. Water Manag. 2024, 295, 108758. [Google Scholar] [CrossRef]
  32. Getahun, S.; Kefale, H.; Gelaye, Y. Application of Precision Agriculture Technologies for Sustainable Crop Production and Environmental Sustainability: A Systematic Review. Sci. World J. 2024, 2024, 2126734. [Google Scholar] [CrossRef]
  33. Wanyama, J.; Bwambale, E.; Kiraga, S.; Katimbo, A.; Nakawuka, P.; Kabenge, I.; Oluk, I. A Systematic Review of Fourth Industrial Revolution Technologies in Smart Irrigation: Constraints, Opportunities, and Future Prospects for Sub-Saharan Africa. Smart Agric. Technol. 2024, 7, 100412. [Google Scholar] [CrossRef]
  34. Jellason, N.P.; Robinson, E.J.Z.; Ogbaga, C.C. Agriculture 4.0: Is Sub-Saharan Africa Ready? Appl. Sci. 2021, 11, 5750. [Google Scholar] [CrossRef]
  35. Kalpana, P.; Smitha, L.; Madhavi, D.; Nabi, S.A.; Kalpana, G.; Kodati, S. A Smart Irrigation System Using the IoT and Advanced Machine Learning Model: A Systematic Literature Review. IJCESEN 2024, 10, 1158–1168. [Google Scholar] [CrossRef]
  36. Soussi, A.; Zero, E.; Sacile, R.; Trinchero, D.; Fossa, M. Smart Sensors and Smart Data for Precision Agriculture: A Review. Sensors 2024, 24, 2647. [Google Scholar] [CrossRef]
  37. Adeyemi, O.; Grove, I.; Peets, S.; Norton, T. Advanced Monitoring and Management Systems for Improving Sustainability in Precision Irrigation. Sustainability 2017, 9, 353. [Google Scholar] [CrossRef]
  38. Kamienski, C.; Soininen, J.-P.; Taumberger, M.; Dantas, R.; Toscano, A.; Salmon Cinotti, T.; Filev Maia, R.; Torre Neto, A. Smart Water Management Platform: IoT-Based Precision Irrigation for Agriculture. Sensors 2019, 19, 276. [Google Scholar] [CrossRef]
  39. Sishodia, R.P.; Ray, R.L.; Singh, S.K. Applications of Remote Sensing in Precision Agriculture: A Review. Remote Sens. 2020, 12, 3136. [Google Scholar] [CrossRef]
  40. Gcanga, A.; Mahadeo, N.; Takele, E. Managing Extremes: How South African Cities Are Tackling Water Crises. World Resources Institute, 2025. Available online: https://www.wri.org/insights/managing-extremes-how-south-african-cities-are-tackling-water-crises (accessed on 20 January 2026).
  41. Nhamo, L.; Van Dijk, R.; Magidi, J.; Wiberg, D.; Tshikolomo, K. Improving the Accuracy of Remotely Sensed Irrigated Areas Using Post-Classification Enhancement Through UAV Capability. Remote Sens. 2018, 10, 712. [Google Scholar] [CrossRef]
  42. Annandale, J.; Stirzaker, R.; Singels, A.; Van Der Laan, M.; Laker, M. Irrigation Scheduling Research: South African Experiences and Future Prospects. Water SA 2011, 37, 751–764. [Google Scholar] [CrossRef]
  43. Masson-Delmotte, V.; Intergovernmental Panel on Climate Change (Eds.) Climate Change 2021: The Physical Science Basis: Working Group I Contribution to the Sixth Assessment Report of the Intergovernmental Panel on Climate Change; Cambridge University Press: Cambridge, UK, 2023; ISBN 978-1-009-15788-9. [Google Scholar]
  44. Lukhele, T.; Msagati, T.A.M. Eutrophication of Inland Surface Waters in South Africa: An Overview. Int. J. Environ. Res. 2024, 18, 27. [Google Scholar] [CrossRef]
  45. Xu, J.; Cui, Y.; Zhang, S.; Zhang, M. The Evolution of Precision Agriculture and Food Safety: A Bibliometric Study. Front. Sustain. Food Syst. 2024, 8, 1475602. [Google Scholar] [CrossRef]
  46. Lakhiar, I.A.; Yan, H.; Zhang, C.; Wang, G.; He, B.; Hao, B.; Han, Y.; Wang, B.; Bao, R.; Syed, T.N.; et al. A Review of Precision Irrigation Water-Saving Technology Under Changing Climate for Enhancing Water Use Efficiency, Crop Yield, and Environmental Footprints. Agriculture 2024, 14, 1141. [Google Scholar] [CrossRef]
  47. Peters, M.D.J.; Godfrey, C.M.; Khalil, H.; McInerney, P.; Parker, D.; Soares, C.B. Guidance for Conducting Systematic Scoping Reviews. Int. J. Evid.-Based Healthc. 2015, 13, 141–146. [Google Scholar] [CrossRef] [PubMed]
  48. Munn, Z.; Peters, M.D.J.; Stern, C.; Tufanaru, C.; McArthur, A.; Aromataris, E. Systematic Review or Scoping Review? Guidance for Authors When Choosing Between a Systematic or Scoping Review Approach. BMC Med. Res. Methodol. 2018, 18, 143. [Google Scholar] [CrossRef] [PubMed]
  49. Tricco, A.C.; Lillie, E.; Zarin, W.; O’Brien, K.K.; Colquhoun, H.; Levac, D.; Moher, D.; Peters, M.D.J.; Horsley, T.; Weeks, L.; et al. PRISMA Extension for Scoping Reviews (PRISMA-ScR): Checklist and Explanation. Ann. Intern. Med. 2018, 169, 467–473. [Google Scholar] [CrossRef] [PubMed]
  50. Arksey, H.; O’Malley, L. Scoping Studies: Towards a Methodological Framework. Int. J. Soc. Res. Methodol. 2005, 8, 19–32. [Google Scholar] [CrossRef]
  51. Levac, D.; Colquhoun, H.; O’Brien, K.K. Scoping Studies: Advancing the Methodology. Implement. Sci 2010, 5, 69. [Google Scholar] [CrossRef]
  52. Cohen, J. A Coefficient of Agreement for Nominal Scales. Educ. Psychol. Meas. 1960, 20, 37–46. [Google Scholar] [CrossRef]
  53. McHugh, M.L. Interrater Reliability: The Kappa Statistic. Biochem. Med. 2012, 22, 276–282. [Google Scholar] [CrossRef]
  54. Hong, Q.N.; Pluye, P.; Bujold, M.; Wassef, M. Convergent and Sequential Synthesis Designs: Implications for Conducting and Reporting Systematic Reviews of Qualitative and Quantitative Evidence. Syst. Rev. 2017, 6, 61. [Google Scholar] [CrossRef]
  55. Popay, J.; Roberts, H.; Sowden, A.; Petticrew, M.; Arai, L.; Rodgers, M.; Britten, N.; Roen, K.; Duffy, S. Guidance on the Conduct of Narrative Synthesis in Systematic Reviews: A Product from the ESRC Methods Programme; Lancaster University: Lancashire, UK, 2006. [Google Scholar]
  56. Braun, V.; Clarke, V. Using Thematic Analysis in Psychology. Qual. Res. Psychol. 2006, 3, 77–101. [Google Scholar] [CrossRef]
  57. Van Eck, N.J.; Waltman, L. Software Survey: VOSviewer, a Computer Program for Bibliometric Mapping. Scientometrics 2010, 84, 523–538. [Google Scholar] [CrossRef] [PubMed]
  58. Campbell, J.L.; Quincy, C.; Osserman, J.; Pedersen, O.K. Coding In-Depth Semistructured Interviews: Problems of Unitization and Intercoder Reliability and Agreement. Sociol. Methods Res. 2013, 42, 294–320. [Google Scholar] [CrossRef]
  59. Chen, X.; Zou, D.; Xie, H.; Cheng, G.; Liu, C. Two Decades of Artificial Intelligence in Education: Contributors, Collaborations, Research Topics, Challenges, and Future Directions. Educ. Technol. Soc. 2022, 25, 28–47. [Google Scholar] [CrossRef]
  60. Aria, M.; Cuccurullo, C. Bibliometrix: An R-Tool for Comprehensive Science Mapping Analysis. J. Informetr. 2017, 11, 959–975. [Google Scholar] [CrossRef]
  61. Moral-Muñoz, J.A.; Herrera-Viedma, E.; Santisteban-Espejo, A.; Cobo, M.J. Software Tools for Conducting Bibliometric Analysis in Science: An up-to-Date Review. EPI 2020, 29, e290103. [Google Scholar] [CrossRef]
  62. Reimers, N.; Gurevych, I. Sentence-BERT: Sentence Embeddings Using Siamese BERT-Networks. In Proceedings of the 2019 Conference on Empirical Methods in Natural Language Processing and the 9th International Joint Conference on Natural Language Processing (EMNLP-IJCNLP), Hong Kong, China, 3–7 November 2019; Association for Computational Linguistics: Stroudsburg, PA, USA, 2019; pp. 3980–3990. [Google Scholar]
  63. Wang, W.; Wei, F.; Dong, L.; Bao, H.; Yang, N.; Zhou, M. MiniLM: Deep Self-Attention Distillation for Task-Agnostic Compression of Pre-Trained Transformers. Adv. Neural Inf. Process. Syst. 2020, 33, 5776–5788. [Google Scholar]
  64. McInnes, L.; Healy, J.; Saul, N.; Grossberger, L. UMAP: Uniform Manifold Approximation and Projection. J. Open Source Softw. 2018, 3, 861. [Google Scholar] [CrossRef]
  65. McInnes, L.; Healy, J.; Astels, S. Hdbscan: Hierarchical Density Based Clustering. JOSS 2017, 2, 205. [Google Scholar] [CrossRef]
  66. Guest, G.; Bunce, A.; Johnson, L. How Many Interviews Are Enough? An Experiment with Data Saturation and Variability. Field Methods 2006, 18, 59–82. [Google Scholar] [CrossRef]
  67. Rousseeuw, P.J. Silhouettes: A Graphical Aid to the Interpretation and Validation of Cluster Analysis. J. Comput. Appl. Math. 1987, 20, 53–65. [Google Scholar] [CrossRef]
  68. Davies, D.L.; Bouldin, D.W. A Cluster Separation Measure. IEEE Trans. Pattern Anal. Mach. Intell. 1979, PAMI-1, 224–227. [Google Scholar] [CrossRef]
  69. Calinski, T.; Harabasz, J. A Dendrite Method for Cluster Analysis. Commun. Stats.-Theory Methods 1974, 3, 1–27. [Google Scholar] [CrossRef]
  70. Grootendorst, M. BERTopic: Neural Topic Modeling with a Class-Based TF-IDF Procedure. J. Open Source Softw. 2022, 7, 4692. [Google Scholar]
  71. Röder, M.; Both, A.; Hinneburg, A. Exploring the Space of Topic Coherence Measures. In Proceedings of the Eighth ACM International Conference on Web Search and Data Mining, Shanghai, China, 2 February 2015; ACM: Singapore, 2015; pp. 399–408. [Google Scholar]
  72. Olagbaju, P.O.; Wojuola, O.B. Environmental Assessment of Toxic Heavy Metals and Natural Radionuclides in Irrigation Water from Rustenburg, South Africa. Phys. Chem. Earth Parts A/B/C 2024, 136, 103773. [Google Scholar] [CrossRef]
  73. Mudaly, L.; Van Der Laan, M. Interactions between Irrigated Agriculture and Surface Water Quality with a Focus on Phosphate and Nitrate in the Middle Olifants Catchment, South Africa. Sustainability 2020, 12, 4370. [Google Scholar] [CrossRef]
  74. Steyn, J.; Hoffman, E.W.; Lötze, E. Root Growth Dynamics of Two Southern Highbush Blueberry (V. Corymbosum L. Interspecific Hybrids) Cultivars in the Western Cape, South Africa. Sci. Hortic. 2024, 336, 113344. [Google Scholar] [CrossRef]
  75. Dzikiti, S.; Volschenk, T.; Midgley, S.J.E.; Lötze, E.; Taylor, N.J.; Gush, M.B.; Ntshidi, Z.; Zirebwa, S.F.; Doko, Q.; Schmeisser, M.; et al. Estimating the Water Requirements of High Yielding and Young Apple Orchards in the Winter Rainfall Areas of South Africa Using a Dual Source Evapotranspiration Model. Agric. Water Manag. 2018, 208, 152–162. [Google Scholar] [CrossRef]
  76. Malatsi, E.; Zuma-Netshiukhwi, G.; Walker, S.; Swanepoel, J.W. An Evaluation of Smallholder Irrigation Typology Performance in Limpopo Province: South Africa. Sustainability 2025, 17, 7794. [Google Scholar] [CrossRef]
  77. Oberholster, P.J.; Ashton, P.J. State of the Nation Report. 2008. Available online: https://www.semanticscholar.org/paper/An-Overview-of-the-Current-Status-of-Water-Quality-Oberholster-Ashton/4f7741315a82cecfc42f70e761a93e0f5df9653c (accessed on 14 April 2026).
  78. Fanadzo, M.; Chiduza, C.; Mnkeni, P.N.S.; Van Der Stoep, L.; Steven, J. Crop Production Management Practices as a Cause for Low Water Productivity at Zanyokwe Irrigation Scheme. Water SA 2010, 36, 27–36. [Google Scholar] [CrossRef]
  79. Mobe, N.T.; Dzikiti, S.; Dube, T.; Mazvimavi, D.; Ntshidi, Z. Modelling Water Utilization Patterns in Apple Orchards with Varying Canopy Sizes and Different Growth Stages in Semi-Arid Environments. Sci. Hortic. 2021, 283, 110051. [Google Scholar] [CrossRef]
  80. Mateos, L.; Dos Santos Almeida, A.C.; Frizzone, J.A.; Lima, S.C.R.V. Performance Assessment of Smallholder Irrigation Based on an Energy-Water-Yield Nexus Approach. Agric. Water Manag. 2018, 206, 176–186. [Google Scholar] [CrossRef]
  81. Dzvene, A.R.; Gura, I.; Tesfuhuney, W.; Walker, S.; Ceronio, G. Effect of Intercropping Maize and Sunn Hemp at Different Times and Stand Densities on Soil Properties and Crop Yield Under In-Field Rainwater Harvesting (IRWH) Tillage in Semi-Arid South Africa. Plant Soil 2024, 505, 363–379. [Google Scholar] [CrossRef]
  82. Wilson, T.; Mthoko, H.; Adnan, Y.; Till, S. The Devil Is in the Deployment: Lessons Learned While Deploying an AI and IoT-Enabled Hydroponics Grow Tent with Rural Subsistence Farmers in South Africa. In Proceedings of the 7th ACM SIGCAS/SIGCHI Conference on Computing and Sustainable Societies, New Delhi, India, 8 July 2024; ACM: Singapore, 2024; pp. 318–329. [Google Scholar]
  83. Ludewig, W.; Shoko, C. The Effect of Climatic Events and Land-Use Land-Cover Changes on Evapotranspiration in a Semiarid Region of South Africa. J. Arid Environ. 2024, 225, 105268. [Google Scholar] [CrossRef]
  84. Ogundeji, A.A.; Jordaan, H. Simulation Study on the Effect of Climate Change on Crop Water Use and Chill Unit Accumulation. S. Afr. J. Sci. 2017, 113, 7. [Google Scholar] [CrossRef][Green Version]
  85. Matimolane, S.; Strydom, S.; Mathivha, F.I.; Chikoore, H. Evaluating the Spatiotemporal Patterns of Drought Characteristics in a Semi-arid Region of Limpopo Province, South Africa. Environ. Monit. Assess. 2024, 196, 1062. [Google Scholar] [CrossRef]
  86. Obaid, A.; Adam, E.; Ali, K.A. Land Use and Land Cover Change in the Vaal Dam Catchment, South Africa: A Study Based on Remote Sensing and Time Series Analysis. Geomatics 2023, 3, 205–220. [Google Scholar] [CrossRef]
  87. Pindihama, G.K.; Gitari, W.M.; Mukangaya, S. Application of Solid Phase Adsorption Toxin Tracking Technology (SPATT) for Monitoring Microcystins in Farm Dams in Levubu Farming Area, South Africa. Phys. Chem. Earth Parts A/B/C 2023, 132, 103500. [Google Scholar] [CrossRef]
  88. Zondo, S.G. Metal Content, Bioaccumulation, Translocation, and Health Risk Assessment of Root Vegetables Grown in KwaZulu-Natal Small-Scale Farms of South Africa. Environ. Monit. Assess. 2024, 196, 752. [Google Scholar] [CrossRef]
  89. Nxumalo, G.S.; Ramabulana, T.S.; Dlamini, Z.; Louis, A.; Nagy, A. Integrating OPTRAM and Machine Learning with Multimodal EO Proxies for Optimized Irrigation Scheduling in Smallholder Systems: A Vhembe District Case Study. Front. Agron. 2026, 7, 1697188. [Google Scholar] [CrossRef]
  90. Nxumalo, G.S.; Ramabulana, T.S.; Dlamini, Z.; János, T.; Kiss, N.É.; Nagy, A. AI-Driven Integration of Sentinel-1 SAR for High-Resolution Soil Water Content Estimation to Enhance Precision Irrigation in Smallholder Maize Systems, Vhembe District. Water 2026, 18, 499. [Google Scholar] [CrossRef]
Figure 1. The PRISMA-ScR flow diagram documents a transparent, reproducible screening process yielding 59 included studies from an initial pool of 1430 records. PRISMA 2020 flow diagram showing the selection of studies included in the scoping review.
Agriengineering 08 00161 g001
Figure 2. Sensor deployment is spatially concentrated in two Water Management Areas (Berg-Olifants and Limpopo), revealing a critical evidence gap across the remaining 17 WMAs that limits the generalisability of current findings. (Left panel) Geographic distribution of sensor and acoustic monitoring studies across South African Water Management Areas (WMAs), with colour intensity indicating study density. Berg-Olifants and Limpopo WMAs show the highest concentration (42.4% of total studies), while gaps persist in the Eastern Cape coastal regions, Fish to Tsitsikamma WMA, and Northern Cape arid zones, highlighting spatial bias and limited transferability across agroecological contexts. (Right panel): Distribution of studies by WMA. Horizontal bar chart showing study frequency (yellow = high, purple = low). Berg-Olifants (n = 14, 23.7%) and Limpopo (n = 11, 18.6%) dominate, jointly accounting for 42.4% of studies, indicating strong geographic concentration with implications for evidence-based policy in underrepresented regions. Note: WMA = Water Management Area. Province centroids were used for labelling. Boundaries sourced from the Department of Water and Sanitation (DWS), South Africa.
Agriengineering 08 00161 g002
Figure 3. Water quality monitoring and remote sensing dominate South African irrigation research, while acoustic monitoring is absent—highlighting a critical gap given aging infrastructure and documented water losses. Sensor technology distribution (N = 59), with water quality (42.4%) and remote sensing (25.4%) as the leading approaches.
Agriengineering 08 00161 g003
Figure 4. Soil moisture sensing and remote-sensing-based evapotranspiration modelling dominate the methodological landscape, while acoustic and IoT-integrated approaches remain absent or marginal. (A) displays methodology adoption rates showing modelling dominance (33.9%) and substantial Machine Learning (ML) underutilization (6.8%), representing opportunities for data-driven analytics. (B) shows methodology distribution across sensor categories showing remote sensing’s broad integration versus water quality’s narrow traditional focus.
Agriengineering 08 00161 g004
Figure 5. The cross-tabulation reveals stark geographic concentration: Berg-Olifants WMA (Water Management Area) dominates across nearly all sensor categories, while white cells expose systematic research voids across most WMA–technology combinations. Sensor–WMA cross-tabulation showing Berg-Olifants’ dominance in remote sensing (n = 6) and soil moisture (n = 5), with white cells representing critical research gaps.
Agriengineering 08 00161 g005
Figure 6. Methodological silos characterise the field: Machine Learning and modelling show only weak positive association, while modelling and traditional approaches are negatively correlated, indicating fragmentation rather than complementarity. Methodology correlation matrix reveals integration between Machine Learning (ML) and modelling (r = 0.23), but a negative relationship between modelling and traditional approaches (r = −0.23), indicating fragmentation rather than complementarity.
Agriengineering 08 00161 g006
Figure 7. Four methodologically distinct research archetypes emerge from principal component analysis, revealing a fragmented field organised around technology type rather than water-use outcome. Principal component analysis (PCA) clustering revealing four research archetypes (PC1-PC2 variance: 31.9%). Clusters represent distinct paradigms transcending simple sensor categorization.
Agriengineering 08 00161 g007
Figure 8. Technology intensity and empirical-versus-simulation orientation are the two primary axes structuring South African irrigation research, with governance and socio-economic variables contributing minimally. Principal component analysis (PCA) variable contributions showing technology intensity (PC1) and empirical vs. simulation orientation (PC2) as primary research gradients.
Agriengineering 08 00161 g008
Figure 9. The semantic network confirms a research discourse centred on technical efficiency terms, with acoustic monitoring and governance concepts isolated at the periphery—corroborating the quantitative gap analyses. Semantic network of irrigation sensor and acoustic monitoring research (2016–2022). Network nodes represent key concepts (n = 127) extracted from 59 study abstracts; node size indicates frequency; colour shows publication year (blue = 2016, yellow = 2022). Central hub nodes (‘irrigation,’ ‘remote sensing,’ ‘water management,’ ‘smart irrigation’) indicate foundational research themes. Peripheral isolation of ‘acoustic monitoring’ and social science concepts reflects research gaps identified in quantitative analyses.
Agriengineering 08 00161 g009
Figure 10. The keyword frequency landscape reflects a predominantly sensor-centric and efficiency-oriented discourse, with governance and acoustic monitoring terms conspicuously absent. Methodological co-occurrence network (minimum three shared occurrences) show low connectivity between field-based, computational, and experimental approaches; node size reflects degree centrality, and edge width denotes co-occurrence frequency.
Agriengineering 08 00161 g010
Figure 11. The integrated dashboard reveals a critical mismatch between high technological readiness of sensor systems and persistently low adoption rates across South African Water Management Areas. (A) shows the absolute number of studies by sensor technology (n = 59), highlighting acoustic monitoring (0 studies), (B) illustrates cumulative research trajectories from 2000 to 2025 with no acoustic monitoring studies, and (C) presents a research opportunity matrix in which scores (1–9) represent the product of agricultural water management priority and acoustic feasibility for each Water Management Area (WMA), with evidence tiers (high, medium, low) derived from analogous sensor literature.
Agriengineering 08 00161 g011
Table 1. International acoustic monitoring applications in irrigation and water distribution systems.
LocationTechnologyApplicationAccuracy/PerformanceCost (USD)Reference
California, USAAcoustic leak detectionCanal pipeline monitoring95–98% leak detection; <1 m location precision$1500–3000 per sensor nodeSmith et al. (2005) [13]
Murray-Darling Basin, AustraliaUltrasonic flow metersIrrigation water accounting±0.5–1% accuracy; real-time telemetry$800–2500 per meterLozano et al. (2009) [14]
Murcia, SpainAcoustic emission sensorsPressurized drip system monitoring92% fault detection; 3-day early warning$500–1200 per unitHu et al. (2021) [29]
Israel (Negev)Plant cavitation acoustic monitoringDeficit irrigation schedulingCorrelation r = 0.89 with stem water potential$300–800 per sensorCohen et al. (2018) [15]
Arizona, USAHydroacoustic tomographyGroundwater irrigation well diagnostics85% sediment clogging detection$5000–12,000 per assessmentKe et al. (2025) [30]
Table 2. Positioning of this review relative to previous reviews on irrigation sensor technologies.
ReviewGeographic ScopeTemporal CoverageTechnology FocusAnalytical MethodsKey ContributionsLimitations Addressed by Present Review
Adeyemi et al. (2017) [37]Global1995–2015Soil moisture sensors, remote sensingNarrative synthesisTechnology taxonomy; adoption barriersNo South African focus; no acoustic technologies; pre-dates IoT/ML era; no quantitative gap analysis
Kamienski et al. (2019) [38]Global2010–2018IoT platforms, wireless sensor networksSystematic reviewIoT architecture patterns; communication protocolsNo irrigation-specific focus; no regional constraints analysis; minimal economic evaluation
Sishodia et al. (2020) [39]Global2000–2019Remote sensing (satellite, UAV, proximal)Bibliometric analysisPublication trends; sensor accuracy benchmarksNo ground-based sensors; no adoption barriers; no ML methods employed
Abioye et al. (2020) [8]Sub-Saharan Africa2005–2019General precision agriculture technologiesNarrative reviewSSA-specific barriers (electricity, connectivity, cost)Non-systematic search; no South Africa-specific analysis; no acoustic gap identified
Present Review (2026)South Africa2015–2024Sensors + acoustic technologies (explicit gap analysis)ML-enhanced scoping review (Sentence-BERT, UMAP, HDBSCAN, BERTopic)(1) First SA irrigation sensor evidence map; (2) critical acoustic monitoring gap identified (0/59 studies); (3) unsupervised ML reveals 4 research archetypes; (4) methodological fragmentation quantified (modularity = 0.42); (5) governance > technology finding (65% vs. 12% variance explained); (6) evidence-based recommendations by farm scaleAddresses all limitations via: (a) South African focus with WMA-level spatial analysis; (b) explicit acoustic gap documentation; (c) advanced NLP/ML for objective pattern discovery; (d) socio-technical synthesis (economic, institutional, agroecological dimensions); (e) differentiated recommendations (commercial/medium/smallholder pathways)
Table 3. Database search strategy and query strings.
DatabaseSearch Query
Web of ScienceTS = ((“South Africa*” OR “southern Africa*” OR “sub-Saharan Africa*”) AND (irrigat* OR “irrigation scheme*” OR “irrigation system*” OR “smallholder farm*” OR “commercial farm*” OR “agricultural water”) AND (sensor* OR acoustic* OR “leak detection” OR “soil moisture” OR “remote sensing” OR IoT OR “Internet of Things” OR “smart irrigation” OR “precision irrigation” OR ultrasonic OR cavitation OR “flow meter*” OR “water meter*” OR telemetry OR “wireless sensor*” OR WSN OR “pressure sensor*” OR monitoring OR “real-time monitoring” OR “data acquisition” OR “automated monitoring”)) AND PY = (2000–2025)
Google Scholar“South Africa” OR “southern Africa” irrigation (sensor OR acoustic OR “leak detection” OR “soil moisture” OR IoT OR “smart irrigation” OR monitoring OR telemetry) after:1999 before:2026
ScopusTITLE-ABS-KEY((“South Africa*” OR “southern Africa*”) AND (irrigat*) AND (sensor* OR acoustic* OR “leak detection” OR “soil moisture” OR IoT OR “smart irrigation” OR “precision irrigation” OR ultrasonic OR telemetry OR “wireless sensor*” OR monitoring)) AND PUBYEAR > 1999 AND PUBYEAR < 2026
Table 4. Validation status and reliability assessment of modelling studies.
Model TypeNumber of StudiesValidation RateTypical Parameterization SourceReliability RatingExamples
CROPWAT (FAO-56 crop water requirements)80% (0/8)FAO global database, literature Kc valuesLOW (generic parameters, no validation)Studies [7,18,27]
AquaCrop (yield-water productivity)617% (1/6)Mix: 1 site-specific [55], 5 literatureMODERATE (1 validated, 5 unvalidated)Validated [55]; others [19,21]
WEAP (water resources planning)333% (1/3)Mix: 1 calibrated [1], 2 literatureMODERATE (1 high-quality, 2 hypothetical)Validated [1]; others [regional studies]
SWAT (watershed hydrology)20% (0/2)Global soil/land cover databasesLOW (coarse spatial scale, no local calibration)Watershed-scale studies
HYDRUS (soil water flow)10% (0/1)Literature soil hydraulic parametersLOW (single study, no validation)[14]
TOTAL2015% (3/20)Predominantly literature-based (85%)LOW-MODERATE overallUrgent need for validation culture
Note: Reliability ratings reflect both parameterisation quality and validation status. Studies without field validation should be interpreted as conditional scenario projections rather than demonstrated outcomes.
Table 5. Agroecological contrasts between Western Cape and Northern Cape irrigation contexts.
ParameterBerg-Olifants WMA (Western Cape)Northern Cape (Lower Orange WMA)Transferability Implications
ClimateMediterranean (winter rainfall, dry summer)Hyper-arid (rainfall <200 mm/year, year-round irrigation)Western Cape rainfed periods (May–Sep) ≠ Northern Cape continuous irrigation; sensor duty cycles differ
Evapotranspiration1200–1600 mm/year2200–2800 mm/year (+60–75%)Soil moisture depletion rates 2× faster; sensor reading frequency must double (hourly vs. 2 hourly) to avoid stress
Salinity riskLow (winter leaching)High (no leaching, saline groundwater)Soil EC sensors essential in Northern Cape less critical in Western Cape; different thresholds
CropsWine grapes, deciduous fruit (apples, pears)Table grapes, dried fruit (raisins), lucerneSensor placement depth: perennial root zone (1–2 m) vs. annual crops (0.3–0.6 m); recalibration needed
Soil textureSandy loams, clay loamsSandy soils (>80% sand)Capacitance sensors accurate in loams (±2–3% volumetric water content) but less precise in sands (±5–8%); TDR preferred for sands
Water sourceDams, rivers (variable quality)Orange River (relatively stable), groundwater (saline)Water quality sensors critical for Northern Cape saline sources, less urgent in Western Cape surface water
Temperature extremesModerate (−2 to 38 °C)Extreme (−5 to 45 °C, 50 °C range)Sensor temperature ratings: Western Cape sensors (−10 to 40 °C adequate) fail in Northern Cape extremes; industrial-grade needed (−20 to 60 °C)
Dust/sandstormsRareFrequent (30–50 days/year)Sensor enclosures: Western Cape IP54 (dust-resistant) insufficient; Northern Cape requires IP67 (dust-proof, waterproof)
Table 6. Technology-specific solutions.
TechnologyEstimated CostPollutant Removal EfficiencyImplementation TimeBest-Fit SA Context
Vegetated bioswales/constructed wetlandsZAR 50–150 K construction + ZAR 10–20 K/yr maintenance (per 1000 m2)Phosphate 40–70%; nitrate 50–80%; sediment 30–60%6–12 months construction + 1 season calibrationMiddle Olifants, Limpopo (return flow degradation documented)
Real-time fertigation optimisation (inline EC + PLC)ZAR 25–80 K per farm installationNitrate 30–50%; fertiliser cost −20–40%2–4 weeks installation + calibrationBerg-Olifants vegetable farms (high fertiliser intensity)
Closed-loop drainage recycling (greenhouse/nursery)ZAR 200–500 K per 10 ha installationFertiliser recovery 50–70%; freshwater withdrawal −20–30%3–6 months engineeringPeri-urban Cape Town/Johannesburg nurseries
Sensor-triggered buffer activation (EC/turbidity gates)ZAR 80–200 K per diversion pointVariable—equivalent to passive buffer when active4–8 weeks installation + threshold calibrationMvoti-Umzimkulu (seasonal sugarcane runoff Oct–Mar)
Precision irrigation scheduling (soil moisture sensors)ZAR 2500–5000 per sensor nodeReturn flow volume −25–30% (proportional to water savings [5])Immediate—existing evidence baseAll WMAs—most scalable and lowest cost
Table 7. Priority matrix: research tiers by impact urgency and evidence gap severity.
TierPriorityTimelineSelection Rationale
Tier 1Acoustic monitoring pilots in high-loss WMAs (Upper Vaal, Lower Orange, Berg-Olifants)2025–2027Zero evidence base; 95–98% international accuracy; 1–2 yr payback; >50% schemes >30 yrs. old
Tier 1Low-cost soil moisture sensors (tensiometers) for smallholder schemes + volumetric pricing reform2025–20270.1–0.3 yr payback; 150,000 smallholders unserved by research; highest pro-poor return per rand
Tier 2Methodological integration protocols (two-stage model-field validation; open sensor data network)2026–2029Fragmentation (modularity 0.42) actively undermines policy credibility of irrigation science
Tier 2Open-source DSS prototypes translating sensor data into farmer-facing irrigation recommendations2026–2029Only 3.4% of studies progress beyond data collection; international systems serve >100,000 ha
Tier 3Remote sensing algorithm refinement for Northern Cape arid conditions2027–2032Remote sensing already mature; Northern Cape thermal recalibration is incremental gap
Tier 3Cooperative IoT models for medium-scale commercial farms (10–100 ha)2027–2032Valuable but narrow farmer population (~5%); long payback under current connectivity
Disclaimer/Publisher’s Note: The statements, opinions and data contained in all publications are solely those of the individual author(s) and contributor(s) and not of MDPI and/or the editor(s). MDPI and/or the editor(s) disclaim responsibility for any injury to people or property resulting from any ideas, methods, instructions or products referred to in the content.