


Abstract
Peanut planting presents unique challenges due to the large, fragile, and irregular seed and the sensitivity of seed metering systems to operating conditions. Field experiments were conducted between 2022 and 2025 in Georgia to evaluate how planting speed, row-unit downforce, vacuum setting, and planter platform influence peanut stand establishment, final within-row plant distribution, and yield in single-row planting systems. Trials included speed × downforce evaluations using an electric seed meter and planter-platform × speed × planter-specific vacuum comparisons involving ground-driven, hydraulic-driven, and electric-driven seed meters. Achieved population was determined from post-emergence stand counts, plant distribution was evaluated using emerged-plant position classification relative to theoretical plant spacing, and yield was measured at harvest. Across site years, achieved population patterns were consistently associated with planting speed and vacuum setting, whereas downforce effects were minor and inconsistent within site years. Higher achieved populations were generally obtained at 5 km h−1 and at higher planter-specific vacuum settings, especially for the ground-driven planter. Hydraulic- and electric-driven planter platforms were less sensitive to changes in speed and vacuum and more often maintained acceptable stands at 8 km h−1. Despite large differences in achieved population and plant distribution, peanut yield was often not significantly reduced until stand loss became severe, indicating substantial yield compensation. Spacing uniformity remained poor across all treatments, with skips and long skips common regardless of planter platform. These results indicate that peanut planting performance in current single-row systems is constrained primarily by seed singulation rather than downforce, and that hydraulic- and electric-driven planter platforms improve operational flexibility more consistently than yield.
1. Introduction
Peanut (Arachis hypogaea L.) stand establishment is a critical and time-sensitive step in southeastern U.S. production systems because planting windows can be narrow and emergence variability can create large within-field stand differences [1]. Unlike many other row crops, peanut planting performance is strongly constrained by the physical characteristics of the seed: peanut kernels are large, irregularly shaped, and relatively fragile, which increases the likelihood of skips, doubles, and metering instability during planting [1]. As a result, peanut planting often requires more conservative operating conditions than cotton or corn to maintain acceptable emergence and avoid costly stand loss.
Modern peanut production relies on vacuum planters that meter seed using rotating plates and a controlled pressure differential, where vacuum settings are used to hold seed to the plate until release. In peanut, higher vacuum levels are typically needed than in small-seeded crops because seed mass and geometry make consistent pickup more difficult [1,2]. However, even at high vacuum, peanut singulation can remain poor because seed shape increases the tendency for leakage, incomplete pickup, and irregular release, which may translate into uneven within-row distribution and nonuniform emergence [2,3].
Planting speed is a dominant operational parameter in peanut because increasing speed forces higher seed-plate rotational speed, which can reduce metering accuracy and worsen spacing variability [4,5]. Prior peanut metering studies have shown that seed discharge performance becomes more sensitive as operating speed increases and vacuum control becomes limiting [2,3]. In the available single-row peanut field precursor work, stand establishment often declined as planting speed increased, while downforce effects were smaller and less consistent than speed effects [6,7]. Electric or hydraulic-driven metering systems may offer greater operating flexibility than ground-driven systems because meter speed can be regulated independently of travel speed, potentially reducing sensitivity to speed and vacuum changes [7,8,9].
Yield interpretation is less straightforward than stand interpretation because peanut can partially compensate for moderate stand reductions through branching and pod set [10,11]. As a result, planter-setting recommendations in peanut cannot rely on stand counts alone. They must distinguish conditions that improve final stand from those that consistently affect yield under field conditions.
Technologies that increase planting speed in crops such as corn and cotton (e.g., high-speed seed delivery systems) are generally not considered suitable for peanut because mechanical handling and delivery may increase kernel damage risk [12], leaving seed hoppers and gravity-based delivery systems as the primary field-feasible options [1]. Therefore, improving peanut planting performance is largely a metering-and-setup problem: identifying operating conditions (especially speed and vacuum) and metering systems that maximize achieved population and placement quality while maintaining yield.
Peanut planting performance is further complicated by differences among planter platforms and seed meter drive strategies. In ground-driven meters, seed plate rotational speed is directly coupled to planter travel speed, which can increase sensitivity to speed-induced variability and vacuum limitations. In contrast, hydraulic- and electric-driven meters can regulate seed plate speed independently of ground speed, allowing the meter to better maintain a target delivery rate as planter velocity changes [7]. However, previous field studies do not clearly separate which responses are specific to one planter configuration and which persist across planter platforms, planting speeds, and planter-specific vacuum settings under grower-representative single-row peanut conditions. Accordingly, this study evaluated both speed × downforce responses with an electric meter and planter-platform × speed × planter-specific vacuum responses spanning ground-driven, hydraulic-driven, and electric-driven systems.
1.1. Purpose Statement
The purpose of this study was to quantify how planting speed, row-unit downforce, vacuum setting, and planter platform influence field-level peanut planter performance in single-row production systems. Specifically, we evaluated achieved population, within-row spacing/position quality, and peanut yield across multiple site-years to support science-based planter-setting recommendations.
1.2. Objectives
- 1.
- Quantify the effects of planting speed and downforce on achieved population and yield using an electric seed meter in single-row peanut.
- 2.
- Quantify the effects of planter platform, planting speed, and vacuum setting on achieved population, spacing/position quality, and yield across multiple site-years.
- 3.
- Evaluate whether increasing the vacuum beyond commonly used field settings improves achieved population and spacing outcomes under field conditions.
2. Materials and Methods
2.1. Site Descriptions and Experimental Overview
Peanut planting field trials were conducted between 2022 and 2025 in Georgia to evaluate the effects of planting speed, row-unit downforce, vacuum setting, and planter platform on peanut stand establishment, spacing uniformity, and yield in single-row production systems. Trials were conducted at the Southeast Georgia Research and Education Center (REC) in Midville, GA, at a 2022 field-trial site in Plains, GA, and at a grower-representative research site in Tifton, GA. Soils at the Midville location are predominantly sandy loam, whereas soils at the Tifton site exhibit greater textural variability.
Across all years, trials focused on identifying planter operating conditions that influence achieved populations under practical field conditions. Experimental factors included planting speed, downforce, vacuum level, and planter platform. A summary of site-years, treatments, and measured response variables is provided in Table 1.
Table 1.
Summary of peanut planting field trials conducted from 2022 to 2025, including location, experimental factors, target seeding rate, and measured response variables.
Archived lot-specific germination, vigor, moisture, size class, and certification records were not recoverable consistently across the 2022–2025 peanut site years. A certified seed tag was recoverable for the 2025 Midville lot and identified Georgia-06G seed with 79% germination from an April 2025 test, whereas comparable lot-specific records were not recoverable for 2022–2024 or for the 2025 Tifton lot. Accordingly, seed-quality effects could not be evaluated directly and are treated as a study limitation.
2.2. Speed × Downforce Trials (2022–2023)
Planter and Treatments
Speed × downforce trials were conducted in 2022 and 2023 using a Case IH Early Riser 2000 Series (CNH Industrial America LLC, Racine, WI, USA) four-row planter equipped with Precision Planting vSet electric seed meters (PP), (Precision Planting, Tremont, IL, USA). These trials were designed to evaluate the effects of planting speed and downforce on peanut emergence and yield using an electric-driven metering system.
In 2022, the nominal target planting speeds were 5, 7, and 10 km h−1, whereas in 2023 the nominal target speeds were 5, 8, and 11 km h−1. The 2023 speed setpoints were shifted upward to extend the evaluated operating range rather than to duplicate the 2022 gradient exactly. Accordingly, cross-year interpretation is based on within-year trends relative to the 5 km h−1 baseline rather than on one-to-one comparisons between 7 and 8 km h−1 or between 10 and 11 km h−1. Speeds are therefore reported as nominal target treatment settings. Downforce levels were set to 222 N (low), 556 N (medium), and 889 N (high). Vacuum was held constant at the manufacturer-recommended high setting for peanuts to isolate the effects of speed and downforce.
The target seeding rate for both years was 212,000 seeds ha−1, consistent with University of Georgia recommendations for single-row peanut [1].
2.3. Planter × Speed × Vacuum Trials (2024–2025)
2.3.1. Planters and Metering Systems
Planter × speed × vacuum trials were initiated in 2024 and replicated in 2025 to evaluate how the planter platform interacts with planting speed and vacuum level. Three planters representing different seed meter drive systems were used:
- Monosem NG Plus 4 (MS), (Monosem LLC, Edwardsville, KS, USA) equipped with a ground-driven seed meter and mechanical downforce;
- John Deere MaxEmerge (JD), (Deere and Company, Moline, Illinois, USA) equipped with either a hydraulic-driven or ground-driven seed meter depending on site-year;
- Case IH Early Riser 2000 Series with Precision Planting vSet (PP) equipped with an electric-driven seed meter and hydraulic downforce (DeltaForce).
Planter characteristics are summarized in Table 2. Because these machines also differed in row-unit design, downforce system, and monitor technology, the 2024–2025 comparisons are interpreted as planter-platform comparisons under field conditions rather than as isolated tests of the meter drive system alone.
Table 2.
Characteristics of the planters and seed meter drive systems used in the planter × speed × vacuum trials.
2.3.2. Treatments
Planters were operated at two nominal target planting speeds (5 and 8 km h−1) under three planter-specific nominal vacuum settings (low, medium, and high). These labels do not represent a common physical vacuum intensity across planters; instead, they denote lower, intermediate, and higher field settings selected for each machine based on fan capacity and manufacturer guidance. Vacuum was adjusted during planting using the planter vacuum gauges; continuous sensor-based vacuum logging was not available for these site-years. Absolute setpoints are summarized in Table 3.
Table 3.
Planter-specific nominal vacuum settings used in the planter × speed × vacuum trials.
The target seeding rate was increased to 286,000 seeds ha−1 in these trials to reflect common producer practices when planting at higher speeds, where growers often increase target population to compensate for anticipated stand loss.
2.4. Experimental Design and Plot Layout
Trials were implemented using four-row planting strips extending the length of the field. Adjacent strips represented different treatment combinations (speed × downforce or planter × speed × vacuum). Each strip was subdivided by alleys into four plots, providing four within-treatment plot segments.
Treatments were applied in a systematic strip layout rather than a fully randomized design to avoid repeated passes over the same ground before planting. This choice reduced traffic-related soil disturbance but did not eliminate the possibility that adjacent strips shared spatial soil conditions. Data were collected from rows 2 and 3 of each plot to minimize edge effects. The four plots within each strip are therefore interpreted as spatial subsamples within planter passes rather than as fully independent experimental units. Statistical inference is restricted to treatment comparisons within individual site-years. Cross-year pooling was not used because treatment structures, seeding rates, planter configurations, and spatial-covariate availability differed among years, so pooled inference would have implied a level of design uniformity that the experiments did not have.
2.5. Stand Counts and Achieved Population
The achieved population was estimated from post-emergence stand counts collected on rows 2 and 3 of each plot. Plants were counted within one 4.4 m row section in each data row, corresponding to 1/1000 of an acre at 0.91 m row spacing, so two row sections were evaluated per plot. Counts were converted to plants ha−1 using standard unit conversions. Border rows were not used; only rows 2 and 3 were included to minimize edge effects. For each treatment, achieved population values are reported as means ± standard deviation based on four within-treatment plot segments [1]. For the 2025 planter × speed × vacuum trials, interim stand counts were collected on 27 May and 2 June in Tifton and on 28 May and 4 June in Midville, with final stand-count and spacing assessments collected on 9–10 June in Tifton and 11 June in Midville. Corresponding exact count dates were not consistently recoverable for all earlier archived site years, so the achieved population is interpreted here as a post-emergence final stand assessment rather than as a fixed-day emergence count.
2.6. Plant Spacing and Position Classification
Planter performance was also evaluated using plant spacing and position classification. After full emergence, plant positions were recorded along the same 4.4 m row sections used for stand counts in rows 2 and 3 of each plot, beginning at 0.00 m for each row section, using an engineer’s tape measure. Distances between consecutive emerged plants were then calculated. Because all emerged plants within each section were recorded, the number of measured plant-to-plant intervals varied with the achieved stand. The theoretical plant spacing (TPS) was calculated from the target seeding rate and 0.91 m row spacing as
where R is the target seeding rate (seeds ha−1) and W is row spacing (m), resulting in the expected target distance between adjacent seed positions within the row. Because spacing was measured after emergence rather than at seed drop, this metric reflects final plant distribution and integrates both metering performance and non-emergence; it should not be interpreted as a pure meter-output measurement [10,11].
Each plant-to-plant interval was classified into one of four categories:
- Double: <50% of TPS;
- Perfect: 50–150% of TPS;
- Skip: 150–250% of TPS;
- Long skip: >250% of TPS.
A higher proportion of perfectly spaced plants was interpreted as improved relative spacing performance. Classification thresholds were selected to enable relative comparison among planter configurations and operating conditions rather than to represent agronomic optimum spacing targets, and were chosen to maintain consistency with published planter spacing metrics and peanut spacing analyses [13]. As a sensitivity check, perfect-spacing percentages were recalculated for site-years with raw plant-position data using a narrower 80–120% TPS window. This rerun reduced absolute perfect-spacing percentages but did not change the conclusion that spacing uniformity remained poor across planter platforms and operating conditions. Classification thresholds are summarized in Table 4.
Table 4.
Peanut plant position classification criteria based on theoretical plant spacing (TPS).
2.7. Yield Measurement
At the end of each season, peanut rows were inverted and harvested using a two-row plot harvester. Pods from rows 2 and 3 of each plot were collected, weighed in the field, and used to calculate yield on an area basis.
2.8. Increased Vacuum Evaluation (2025)
In 2025, an additional evaluation was conducted to assess whether increasing the vacuum beyond typical field settings improved peanut singulation and achieved population. For the JD and MS planters, high vacuum levels represented the maximum achievable fan output. For the PP planter, vacuum was increased beyond the standard high setting to 35 in H2O (“very high”) [7]. This “very high” setting was evaluated only in the 2025 increased-vacuum test and is not included in the standard low/medium/high vacuum levels summarized in Table 3.
Prior to field evaluation, singulation performance of the PP vSet meter was assessed on a Precision Planting test stand under laboratory conditions. Field and laboratory results were compared to evaluate whether improved test-stand singulation translated to improved field performance. Because laboratory testing does not reproduce field vibration, seed flow dynamics, and fan load variability, test-stand improvements may not translate directly to field outcomes.
2.9. Statistical Analysis
Statistical analyses were conducted in R version 4.4.1 (R Foundation for Statistical Computing, Vienna, Austria). To match the experimental structure and avoid pooling non-equivalent environments, each site-year was analyzed separately. Thus, the 2022 Midville and 2022 Plains speed × downforce trials were analyzed as separate site-years, and the 2025 Midville and Tifton planter × speed × vacuum trials were also analyzed separately.
For the 2022–2023 speed × downforce trials, the achieved population and yield were analyzed within site-year using
where is planting speed, is downforce, and is the plot-segment replication term corresponding to the four alley-delimited sections within each treatment strip. For the 2024–2025 planter × speed × vacuum trials, achieved population, yield, and perfect spacing were analyzed within site-year using
where is the planter platform, is planting speed, is vacuum setting, and is the same plot-segment replication term. The 2025 increased-vacuum comparison for the Precision Planting planter was analyzed separately by location using
with vacuum settings defined as low, medium, high, and very high. The replication term represents longitudinal field position within the systematic strip layout and should not be interpreted as four fully randomized independent blocks. Perfect-spacing analyses were conducted on replicate-level percentages derived from emerged-plant intervals after excluding the first interval in each measured row, which has no preceding plant and therefore no defined spacing value. Fixed-effect significance was assessed using site-year ANOVA tables, and treatment means were separated using Tukey-adjusted comparisons at . Supplementary Tables S1–S16 report the ANOVA results together with treatment means. Residual normality and heteroscedasticity were screened using Shapiro–Wilk and Breusch–Pagan tests, respectively, and the results are summarized in Supplementary Table S17. Site-years showing possible diagnostic departures were interpreted cautiously, together with treatment means rather than as standalone p-value results.
Planting passes were retained only when the planter completed the intended treatment pass with continuous meter operation. On that basis, one 2025 Tifton Monosem pass (5 km h−1, high vacuum) was excluded post hoc from treatment comparisons because direct field observation at the end of planting showed loss of full ground-drive-wheel contact and associated loss of meter rotation, resulting in an incomplete pass that no longer represented the intended treatment. This exclusion was not pre-specified in a written protocol; it was a post hoc data-quality decision applied to an obvious operational failure observed in the field. No similar drive-wheel-slip failure was documented for the other retained planting passes in the archived analysis set.
Because the experiments were implemented as field-scale strip trials rather than fully randomized small-plot trials, treatment effects were interpreted within site-year and within the spatial limitations of each field. Apparent soil electrical conductivity (ECa) data collected in 2025 were used descriptively to document spatial variability in Tifton; however, ECa was not retained as a model covariate in the present paper because consistent plot-level covariate files were not available across the archived analysis set used for this revision.
3. Results
3.1. Speed × Downforce Trials (2022–2023)
3.1.1. Achieved Population
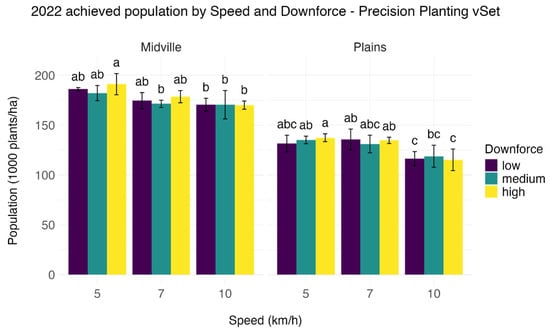
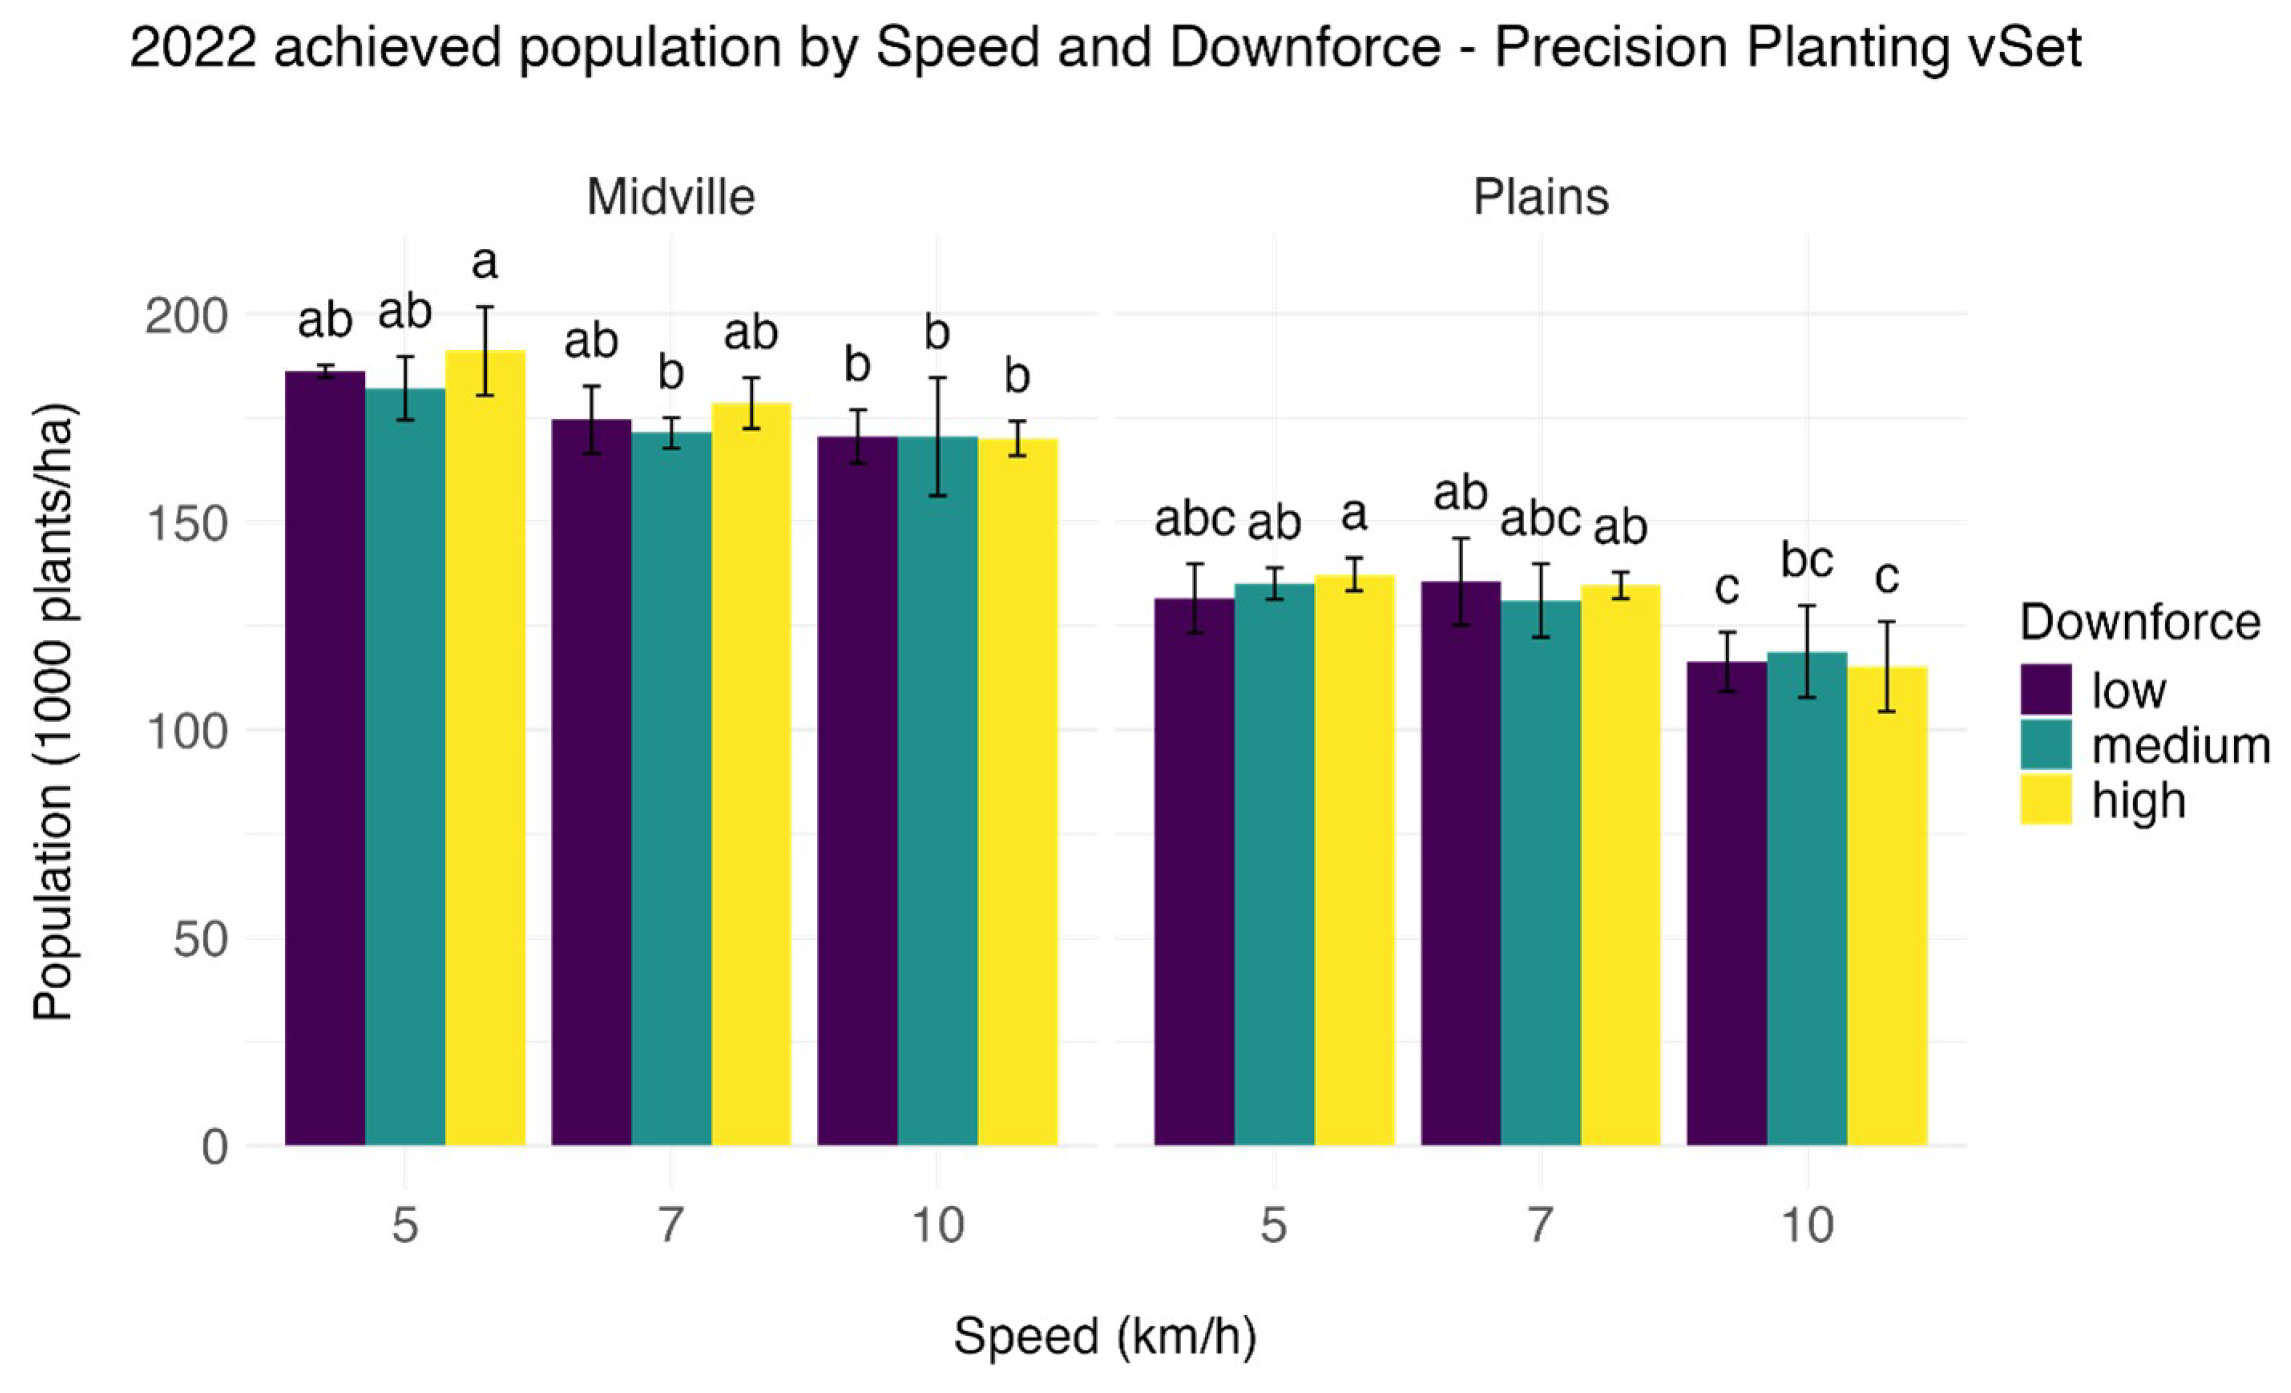
In 2022, peanuts were planted at nominal target speeds of 5, 7, and 10 km h−1 combined with three downforce levels (low, medium, and high) at two locations (Midville and Plains, GA). The achieved population was primarily influenced by planting speed at both Midville and Plains (Supplementary Tables S1 and S2). No downforce main effect or speed × downforce interaction was detected at either location, and the 5 km h−1 treatment produced significantly greater emergence than the 10 km h−1 treatment at both sites (Figure 1).
Figure 1.
Achieved population by planting speed and downforce in 2022 at Midville and Plains, GA. Bars sharing a common letter are not significantly different at based on Tukey-adjusted mean separation. Error bars represent ±1 standard deviation.
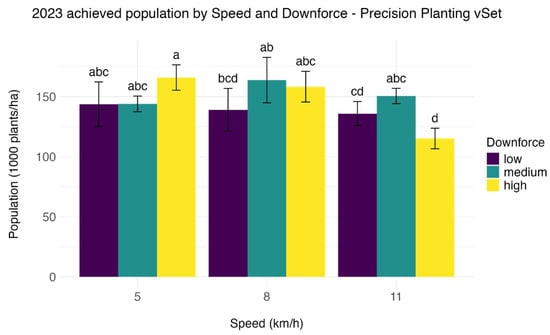
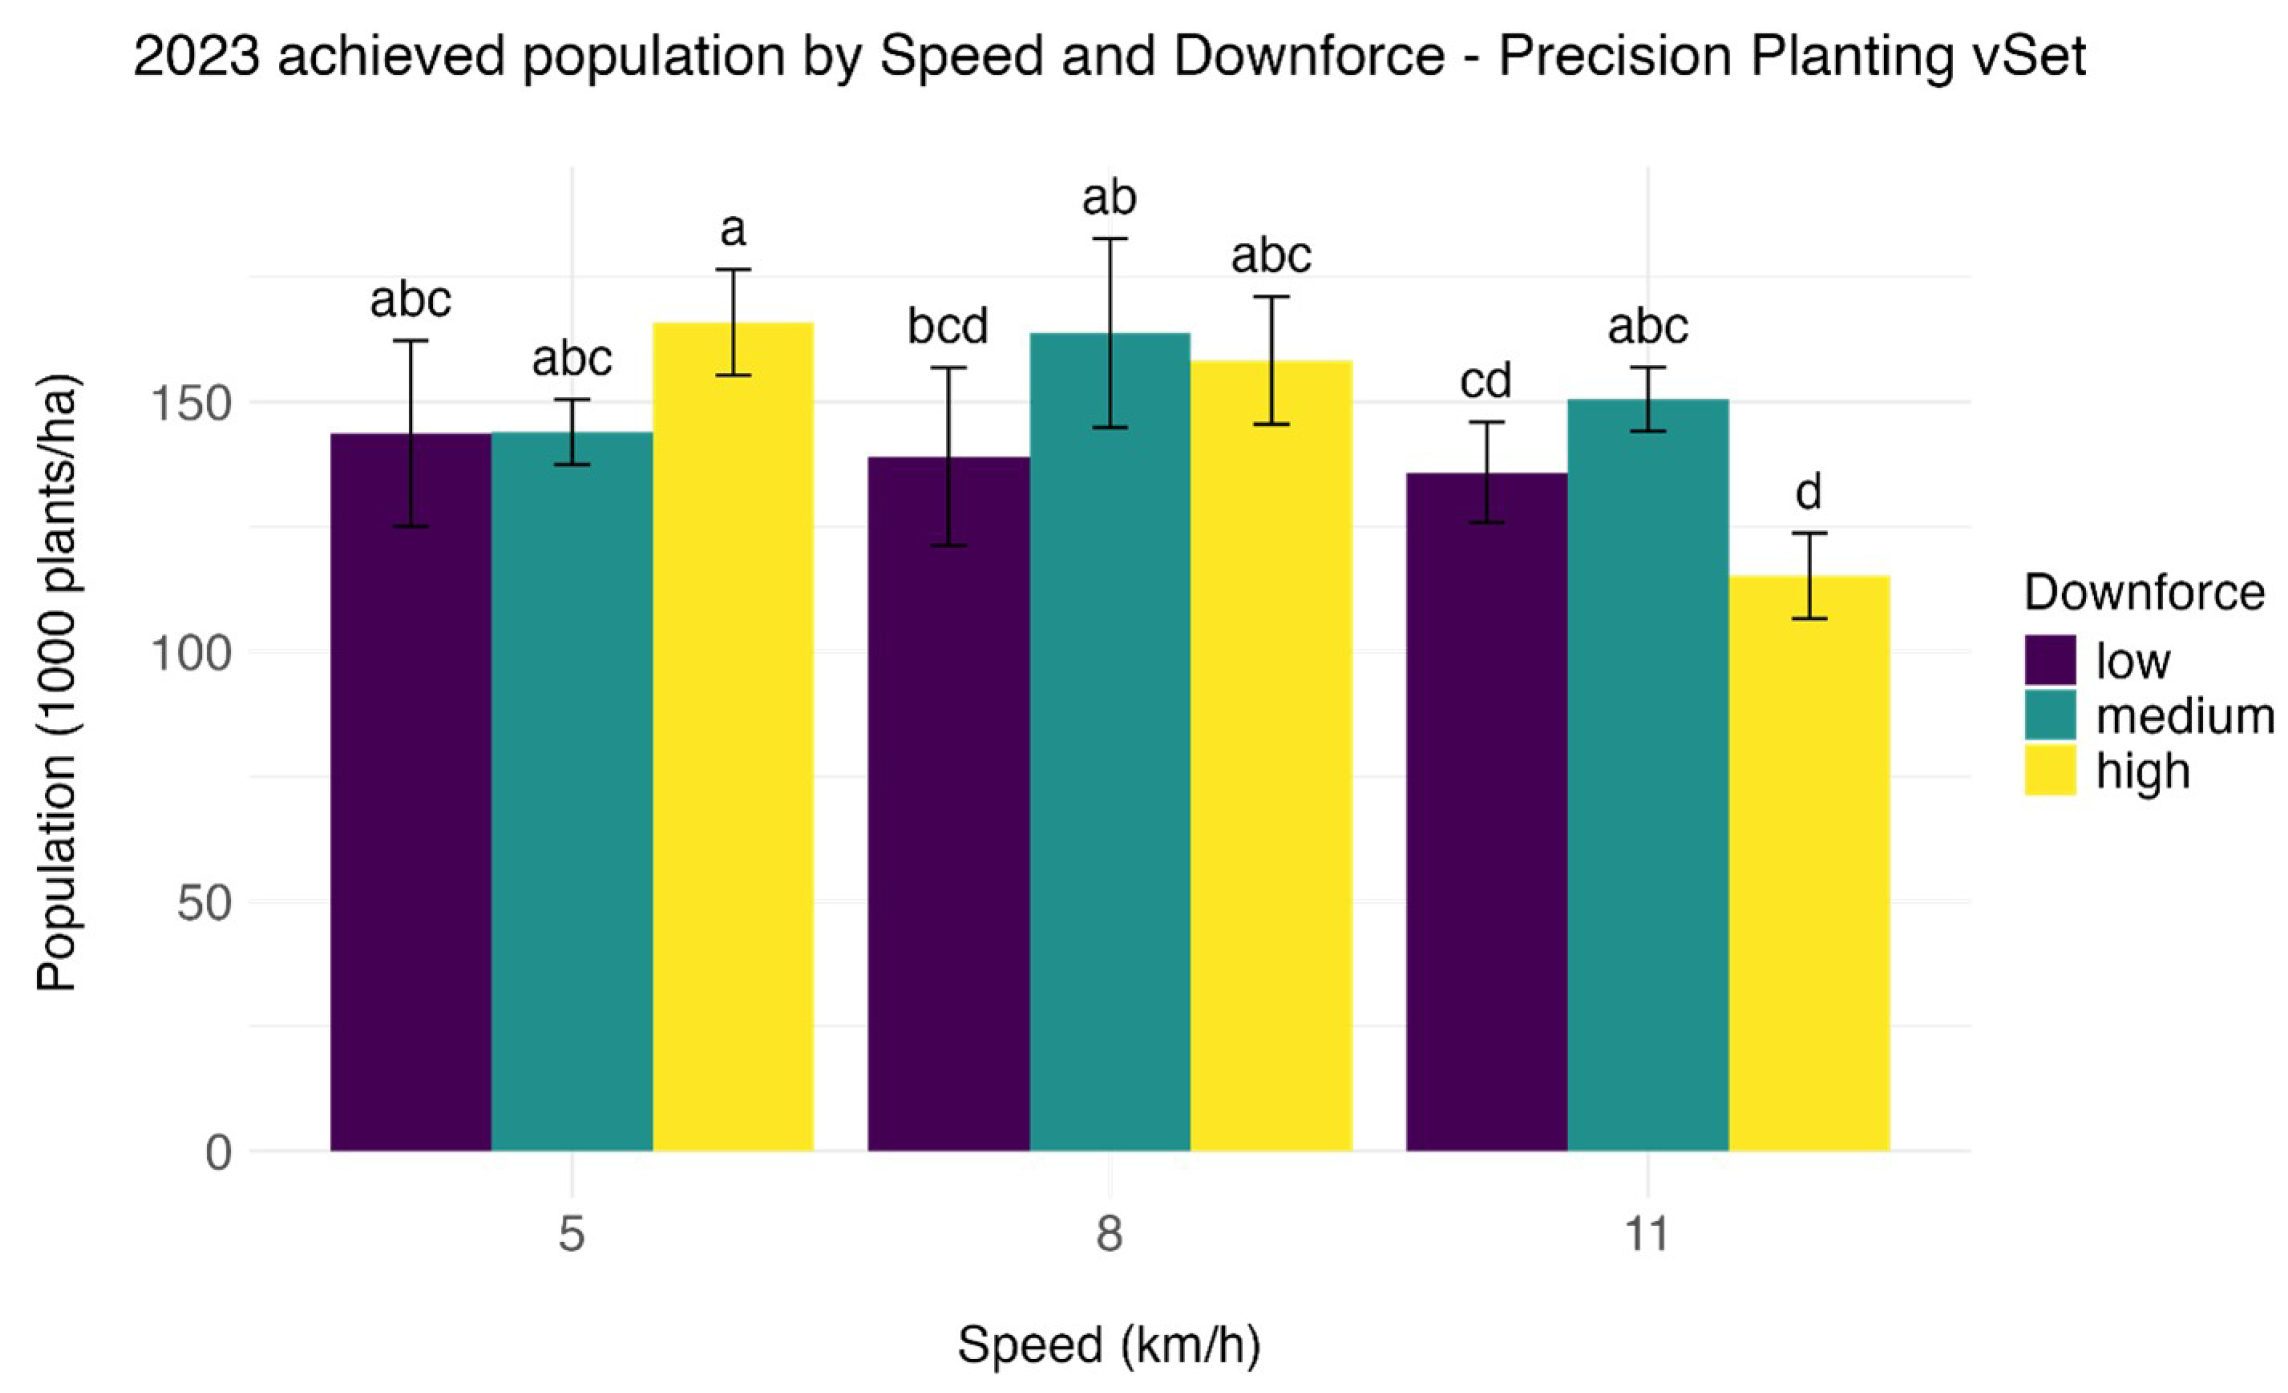
In 2023, peanuts were planted at nominal target speeds of 5, 8, and 11 km h−1 combined with three downforce levels at Midville. Site-year ANOVA showed significant effects of speed, downforce, and the speed × downforce interaction (Supplementary Table S4), so treatment-specific contrasts rather than isolated main effects were emphasized. Within that interaction, high downforce at 11 km h−1 resulted in significantly lower emergence than medium downforce, and the highest achieved population was again obtained at the 5 km h−1 baseline (Figure 2).
Figure 2.
Achieved population by planting speed and downforce in 2023 at Midville, GA. Bars sharing a common letter are not significantly different at = 0.05 based on Tukey-adjusted mean separation. Error bars represent ±1 standard deviation.
3.1.2. Yield
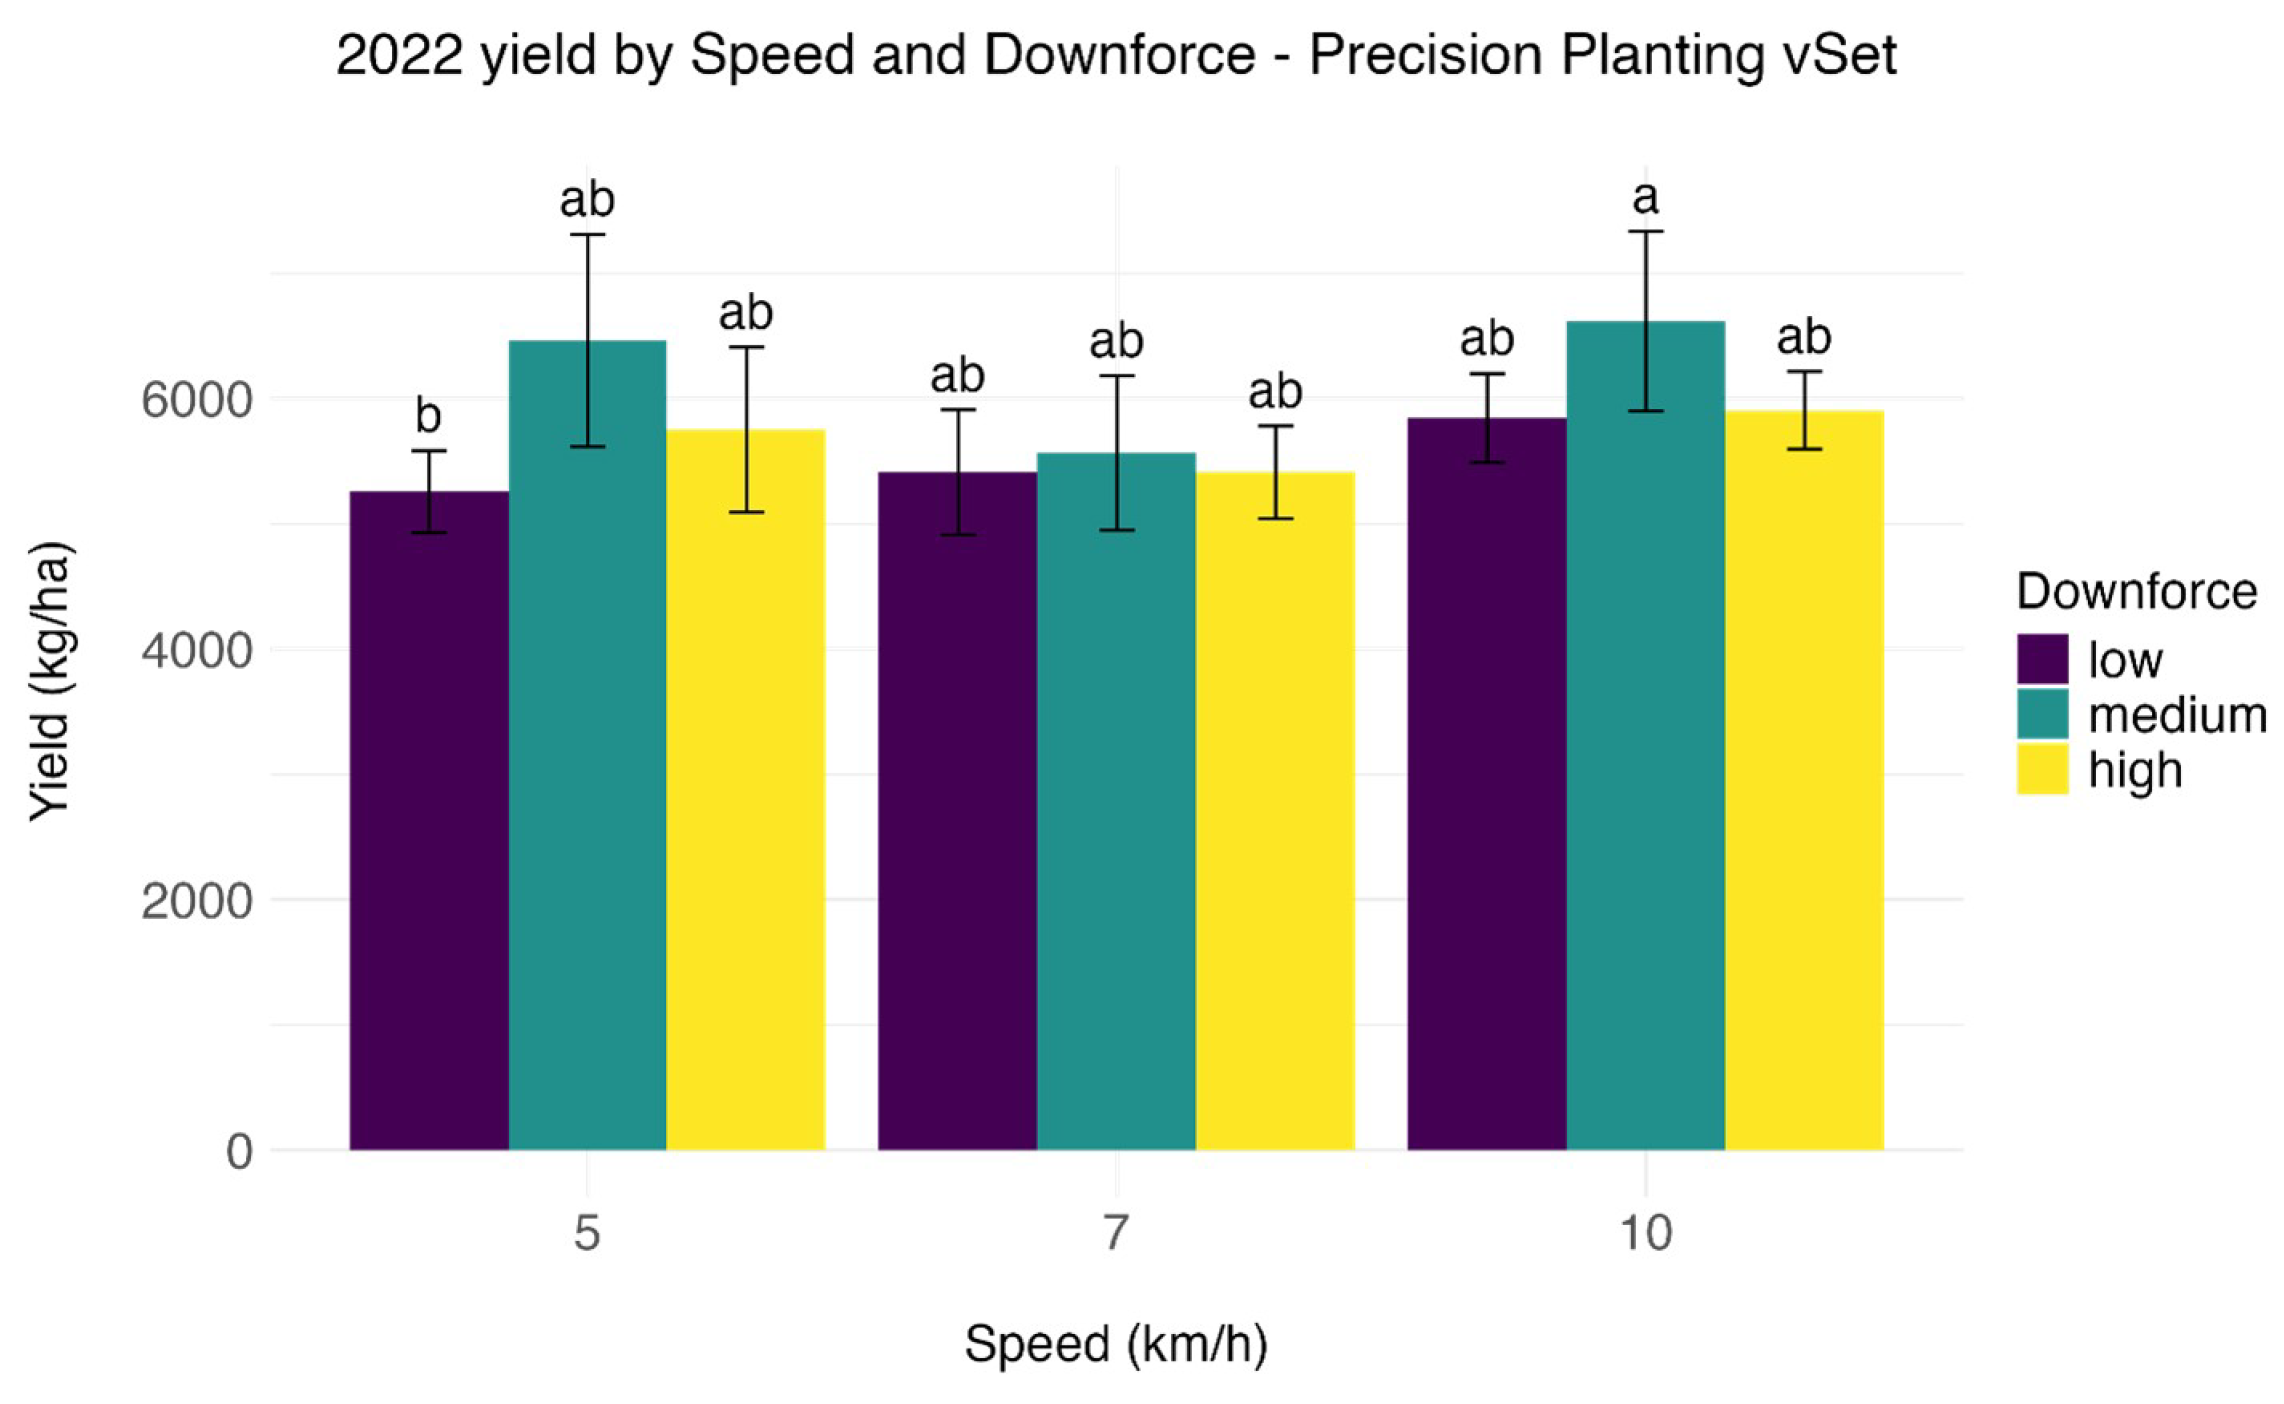
In 2022, no significant differences in yield were detected among most treatments at Midville despite differences in the achieved population. Site-year ANOVA showed speed and downforce main effects but no speed × downforce interaction (Supplementary Table S3), which is consistent with the limited number of pairwise treatment differences. One exception was the 10 km h−1–medium downforce treatment, which produced a significantly greater yield than the 5 km h−1–low downforce treatment, although achieved population did not differ statistically between these treatments (Figure 3). Yield data were not available for the Plains location because the trial was not harvested.
Figure 3.
Yield by planting speed and downforce in 2022 at Midville, GA. Bars sharing a common letter are not significantly different at = 0.05 based on Tukey-adjusted mean separation. Error bars represent ±1 standard deviation.
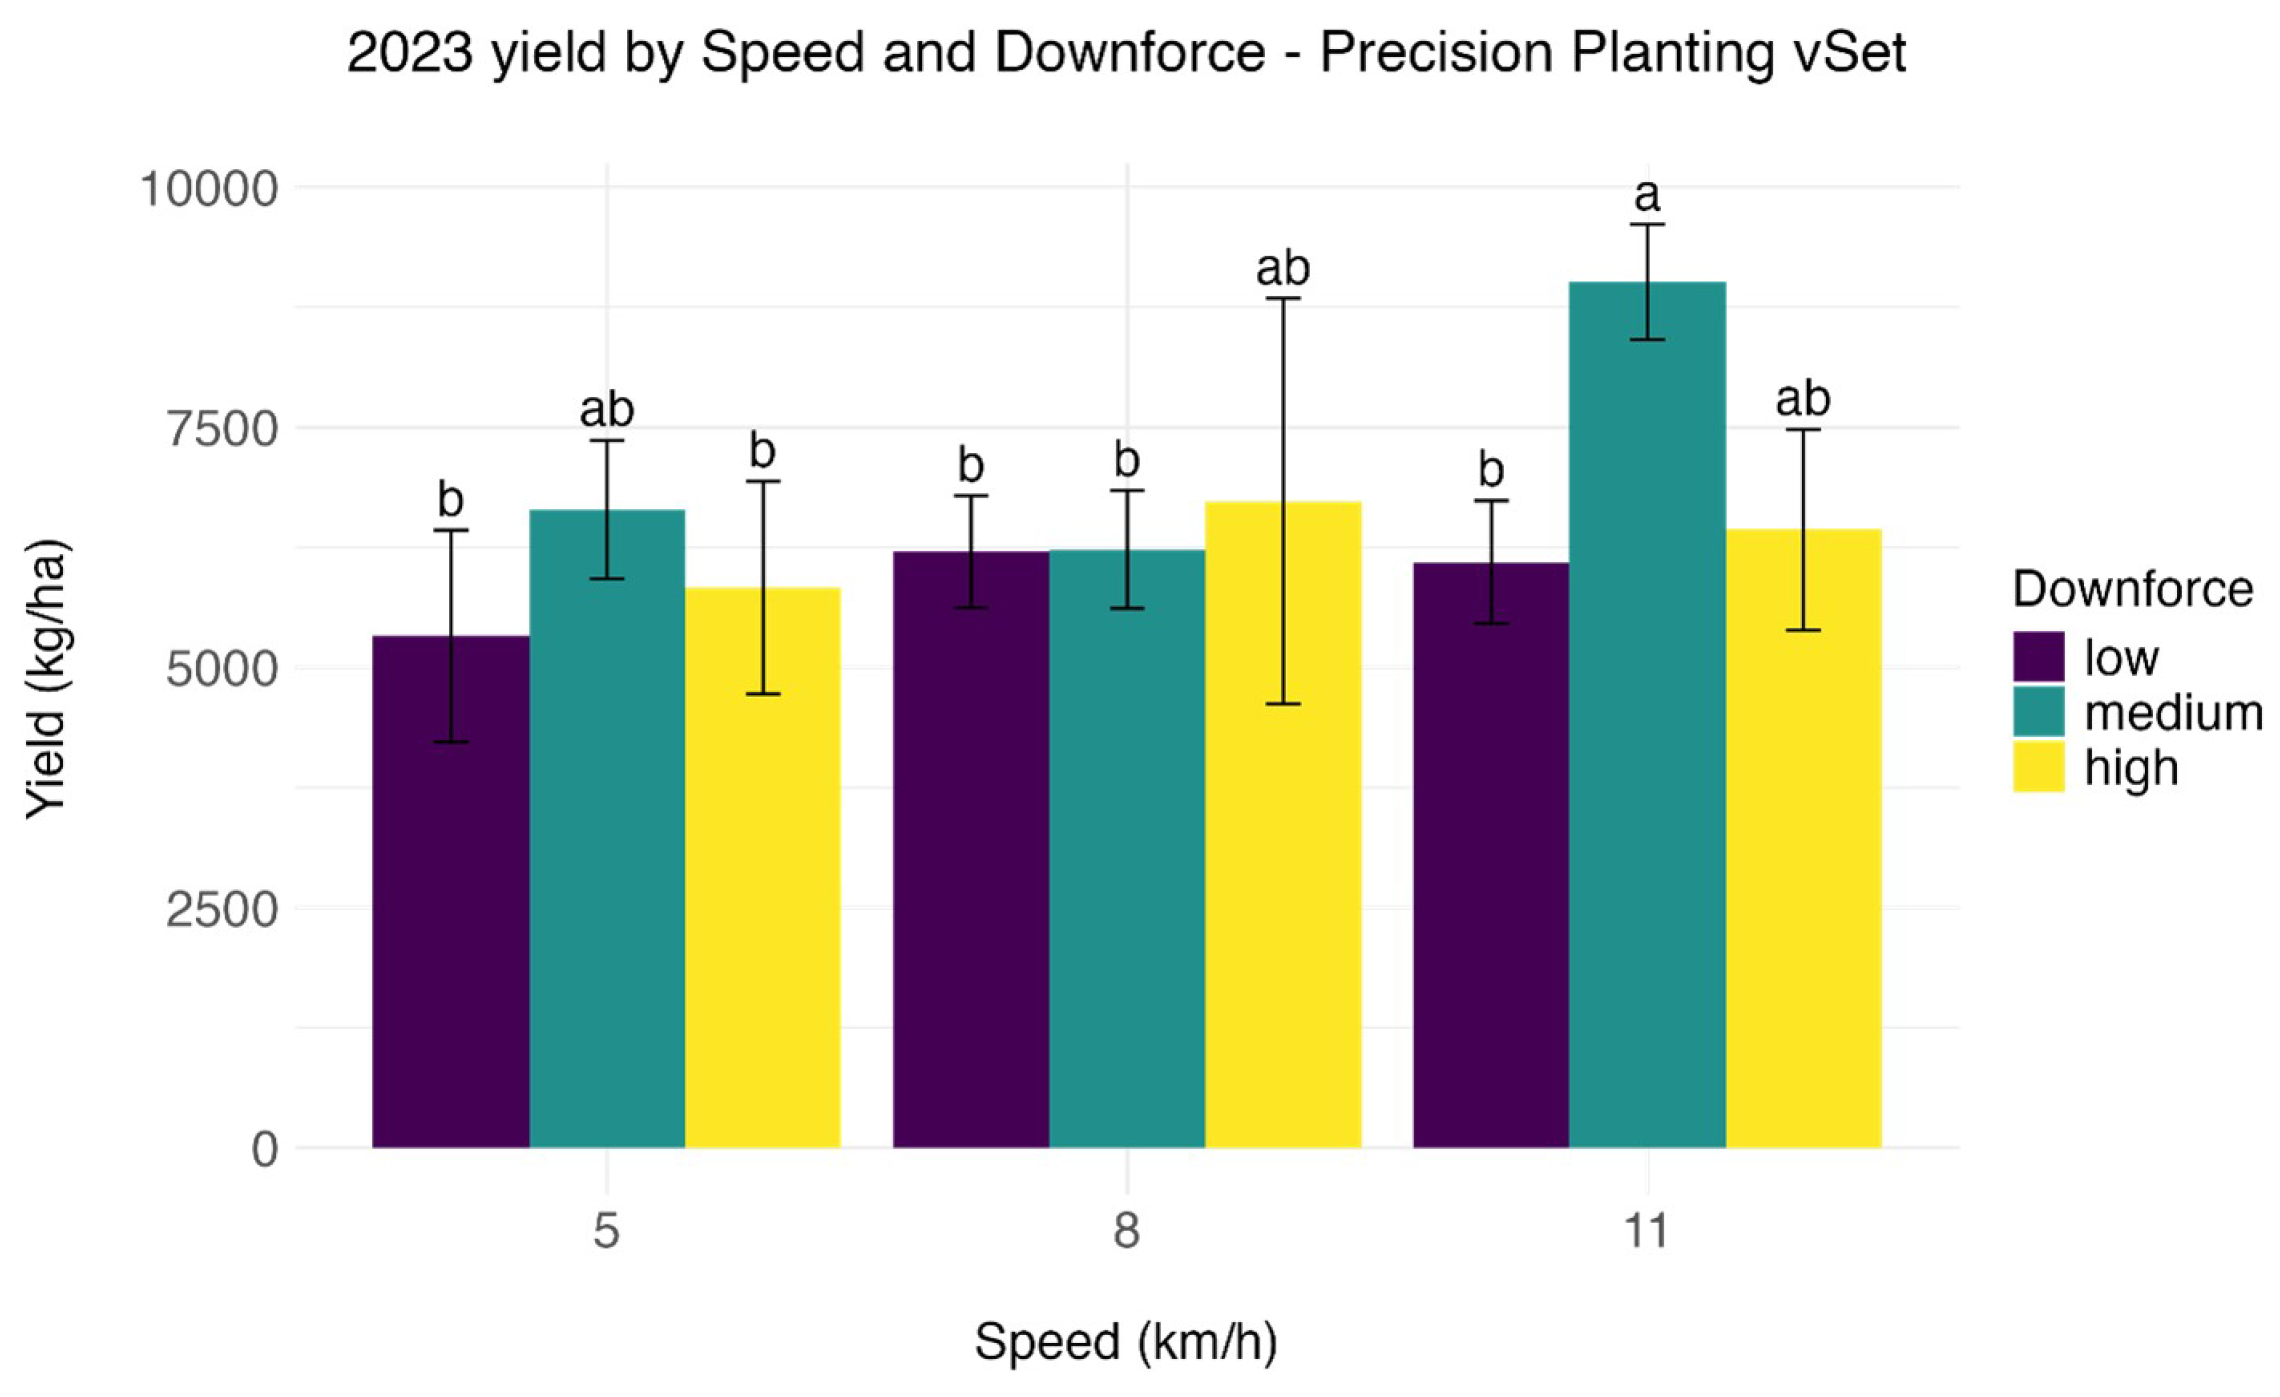
In 2023, yield differed among treatments, and site-year ANOVA showed significant effects of speed, downforce, and the speed × downforce interaction (Supplementary Table S5). The 11 km h−1–medium downforce treatment produced a significantly greater yield than the low and high downforce treatments at the same speed and than other speed–downforce combinations (Figure 4). Achieved population did not differ significantly among these treatments. Because the 11 km h−1–medium downforce treatment was represented by only two yield observations and the 2023 Midville yield model showed a possible residual-normality departure, this contrast should be interpreted cautiously.
Figure 4.
Yield by planting speed and downforce in 2023 at Midville, GA. Bars sharing a common letter are not significantly different at = 0.05 based on Tukey-adjusted mean separation. Error bars represent ±1 standard deviation.
3.2. Planter × Speed × Vacuum Trials (2024–2025)
3.2.1. Achieved Population (2024)
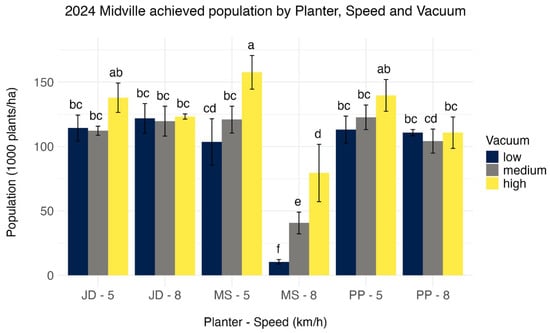
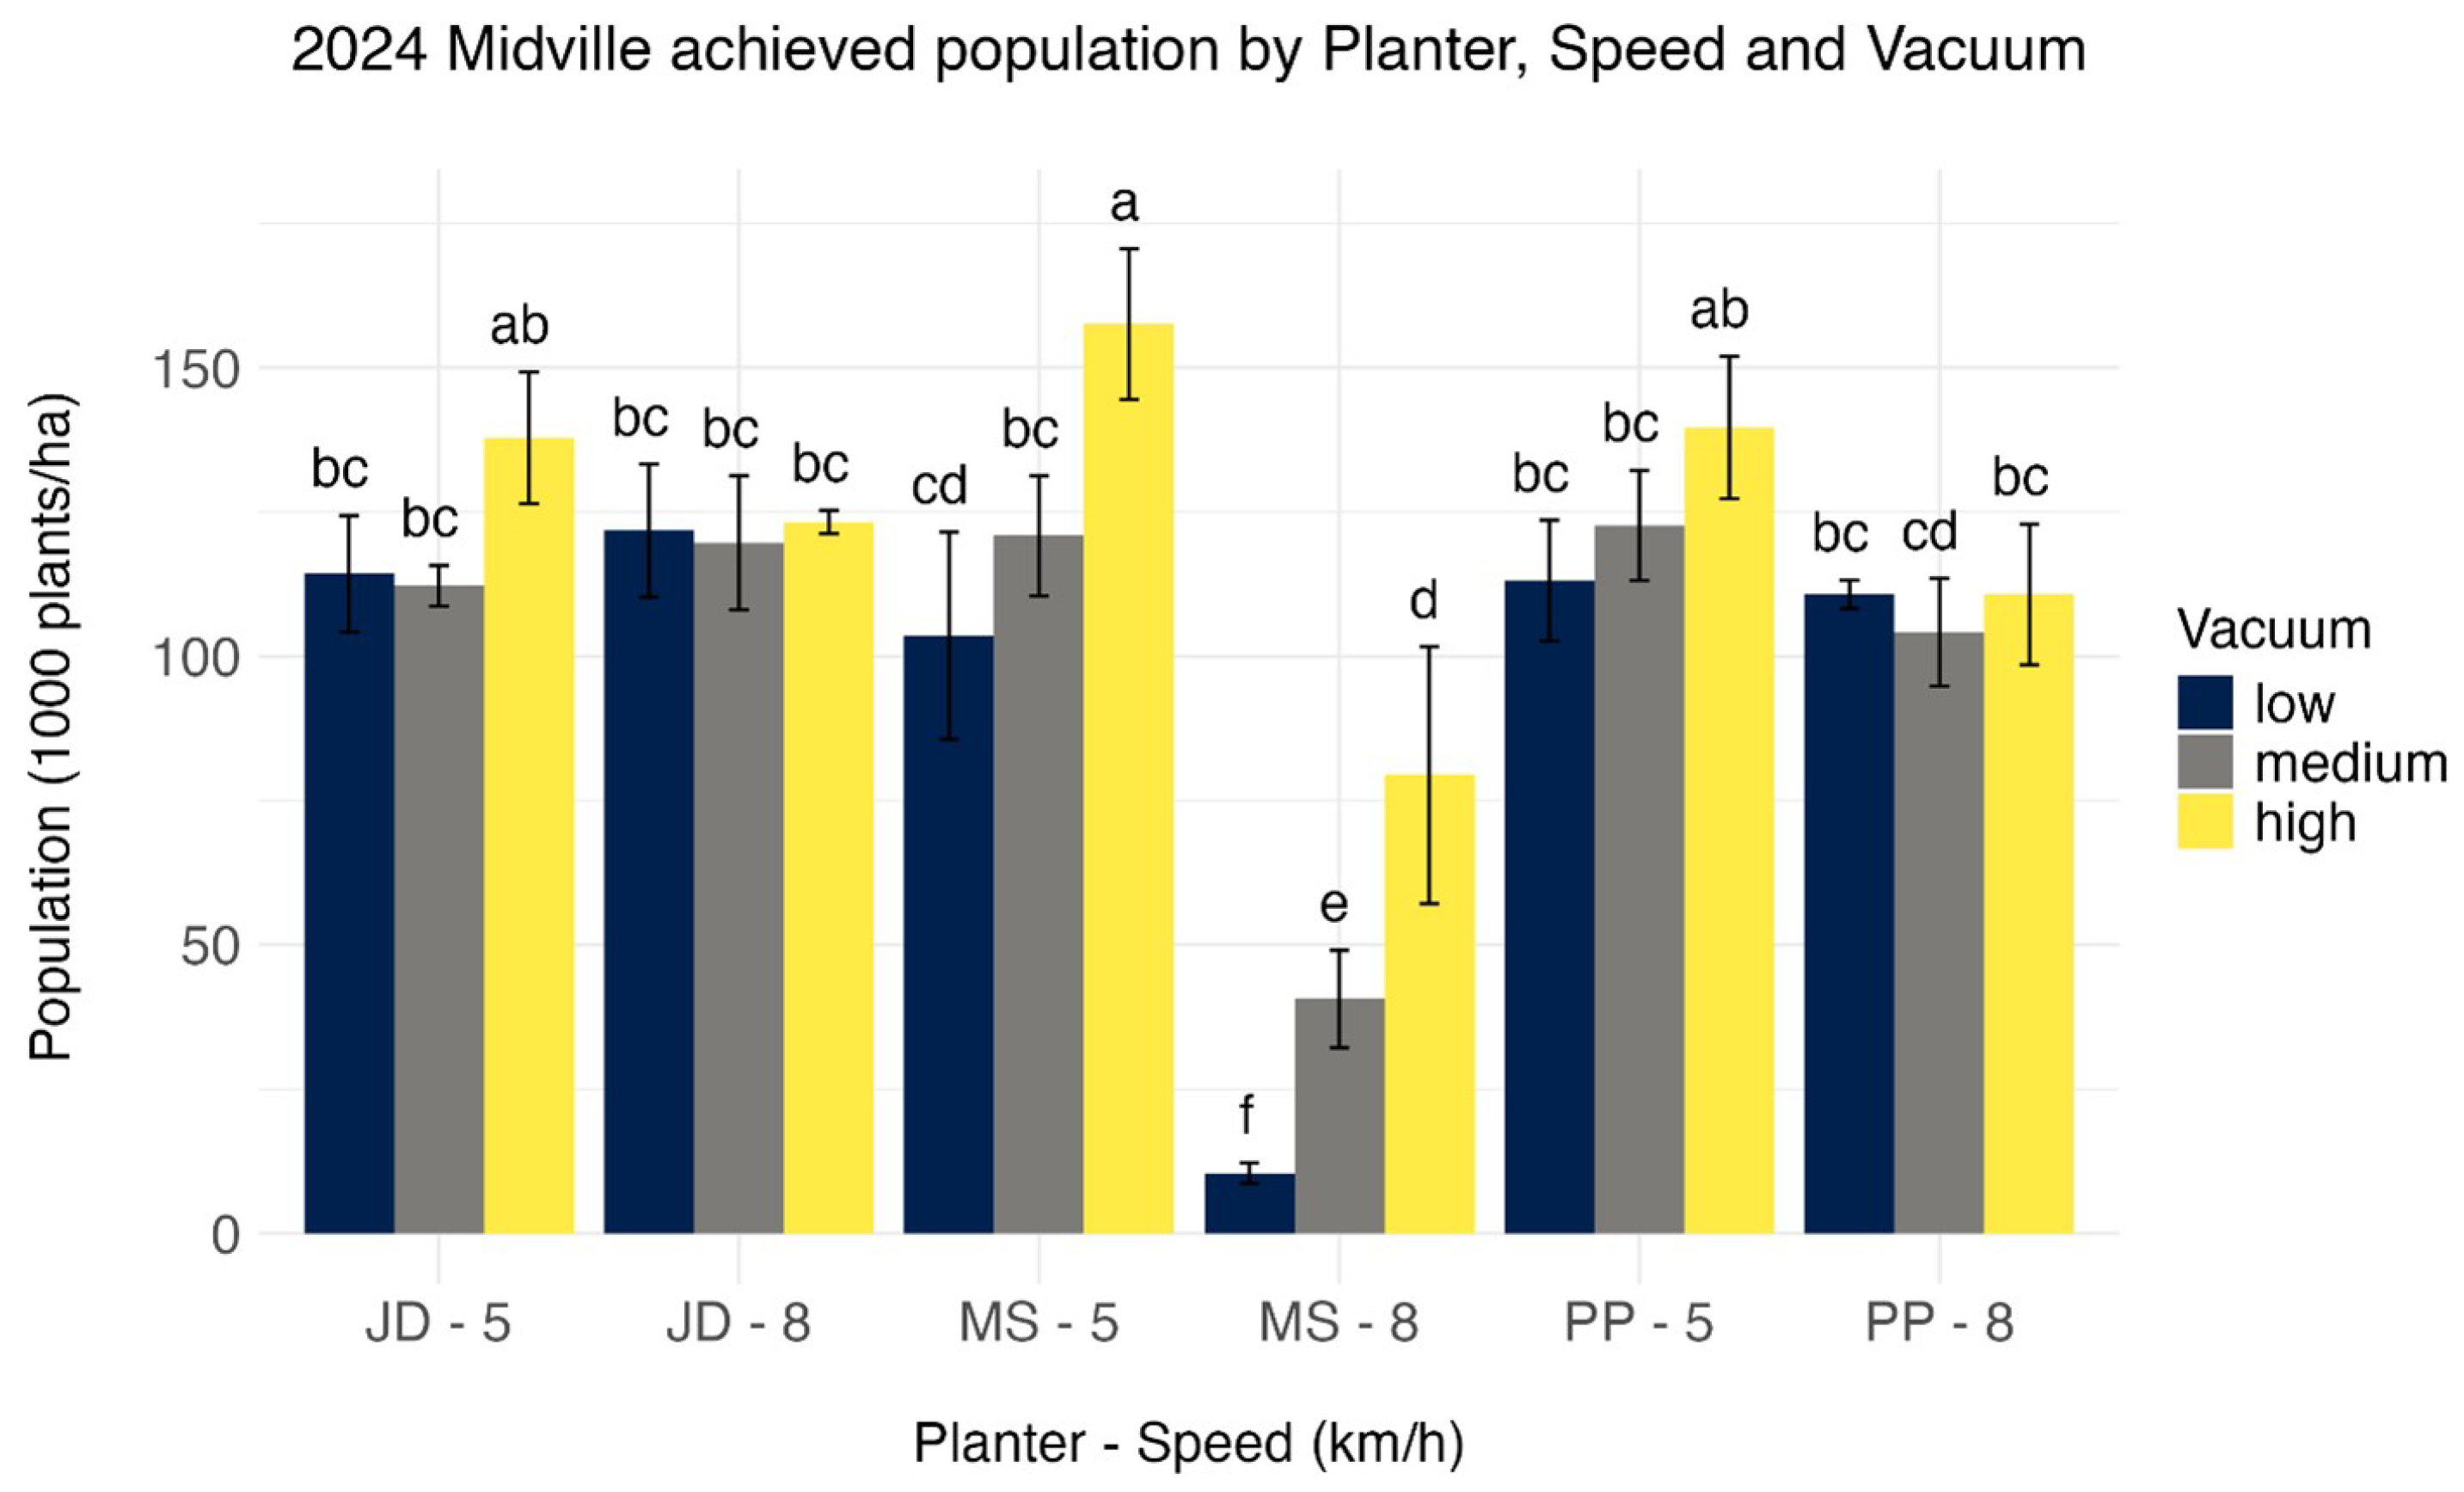
In 2024 at Midville, achieved population showed significant planter, speed, and vacuum main effects together with significant planter × speed and planter × vacuum interactions (Supplementary Table S6). Because responses depended on planter platform, treatment effects were interpreted within the planter. For the Monosem (MS) planter, planting at 5 km h−1 with high vacuum resulted in a significantly greater achieved population than low or medium vacuum. At 8 km h−1, achieved population declined sharply as vacuum decreased. For the John Deere (JD) and Precision Planting (PP) planters, achieved population was numerically higher at 5 km h−1 with high vacuum, although differences among vacuum levels were not statistically significant within those planters. The MS planter operated at 5 km h−1 with high vacuum, producing one of the highest achieved populations across treatments, comparable to the JD and PP planters at 5 km h−1 with high vacuum (Figure 5).
Figure 5.
Achieved population by planter platform, planting speed, and vacuum level in Midville, GA, in 2024. Bars sharing a common letter are not significantly different at based on Tukey-adjusted mean separation. Error bars represent ±1 standard deviation.
3.2.2. Plant Spacing and Position Classification (2024)
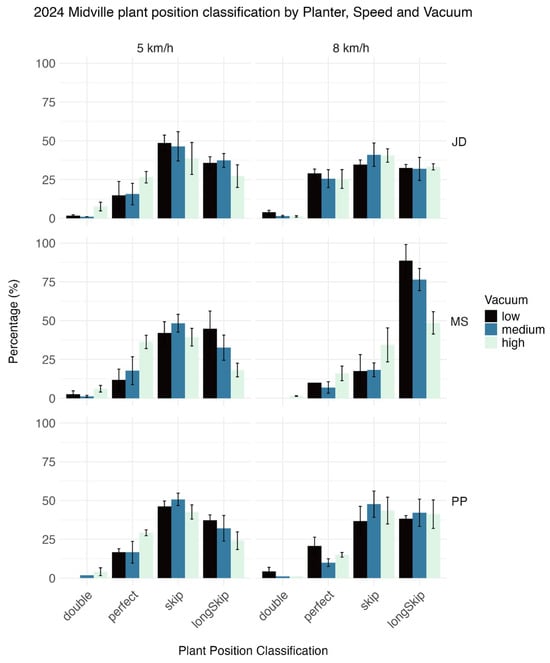
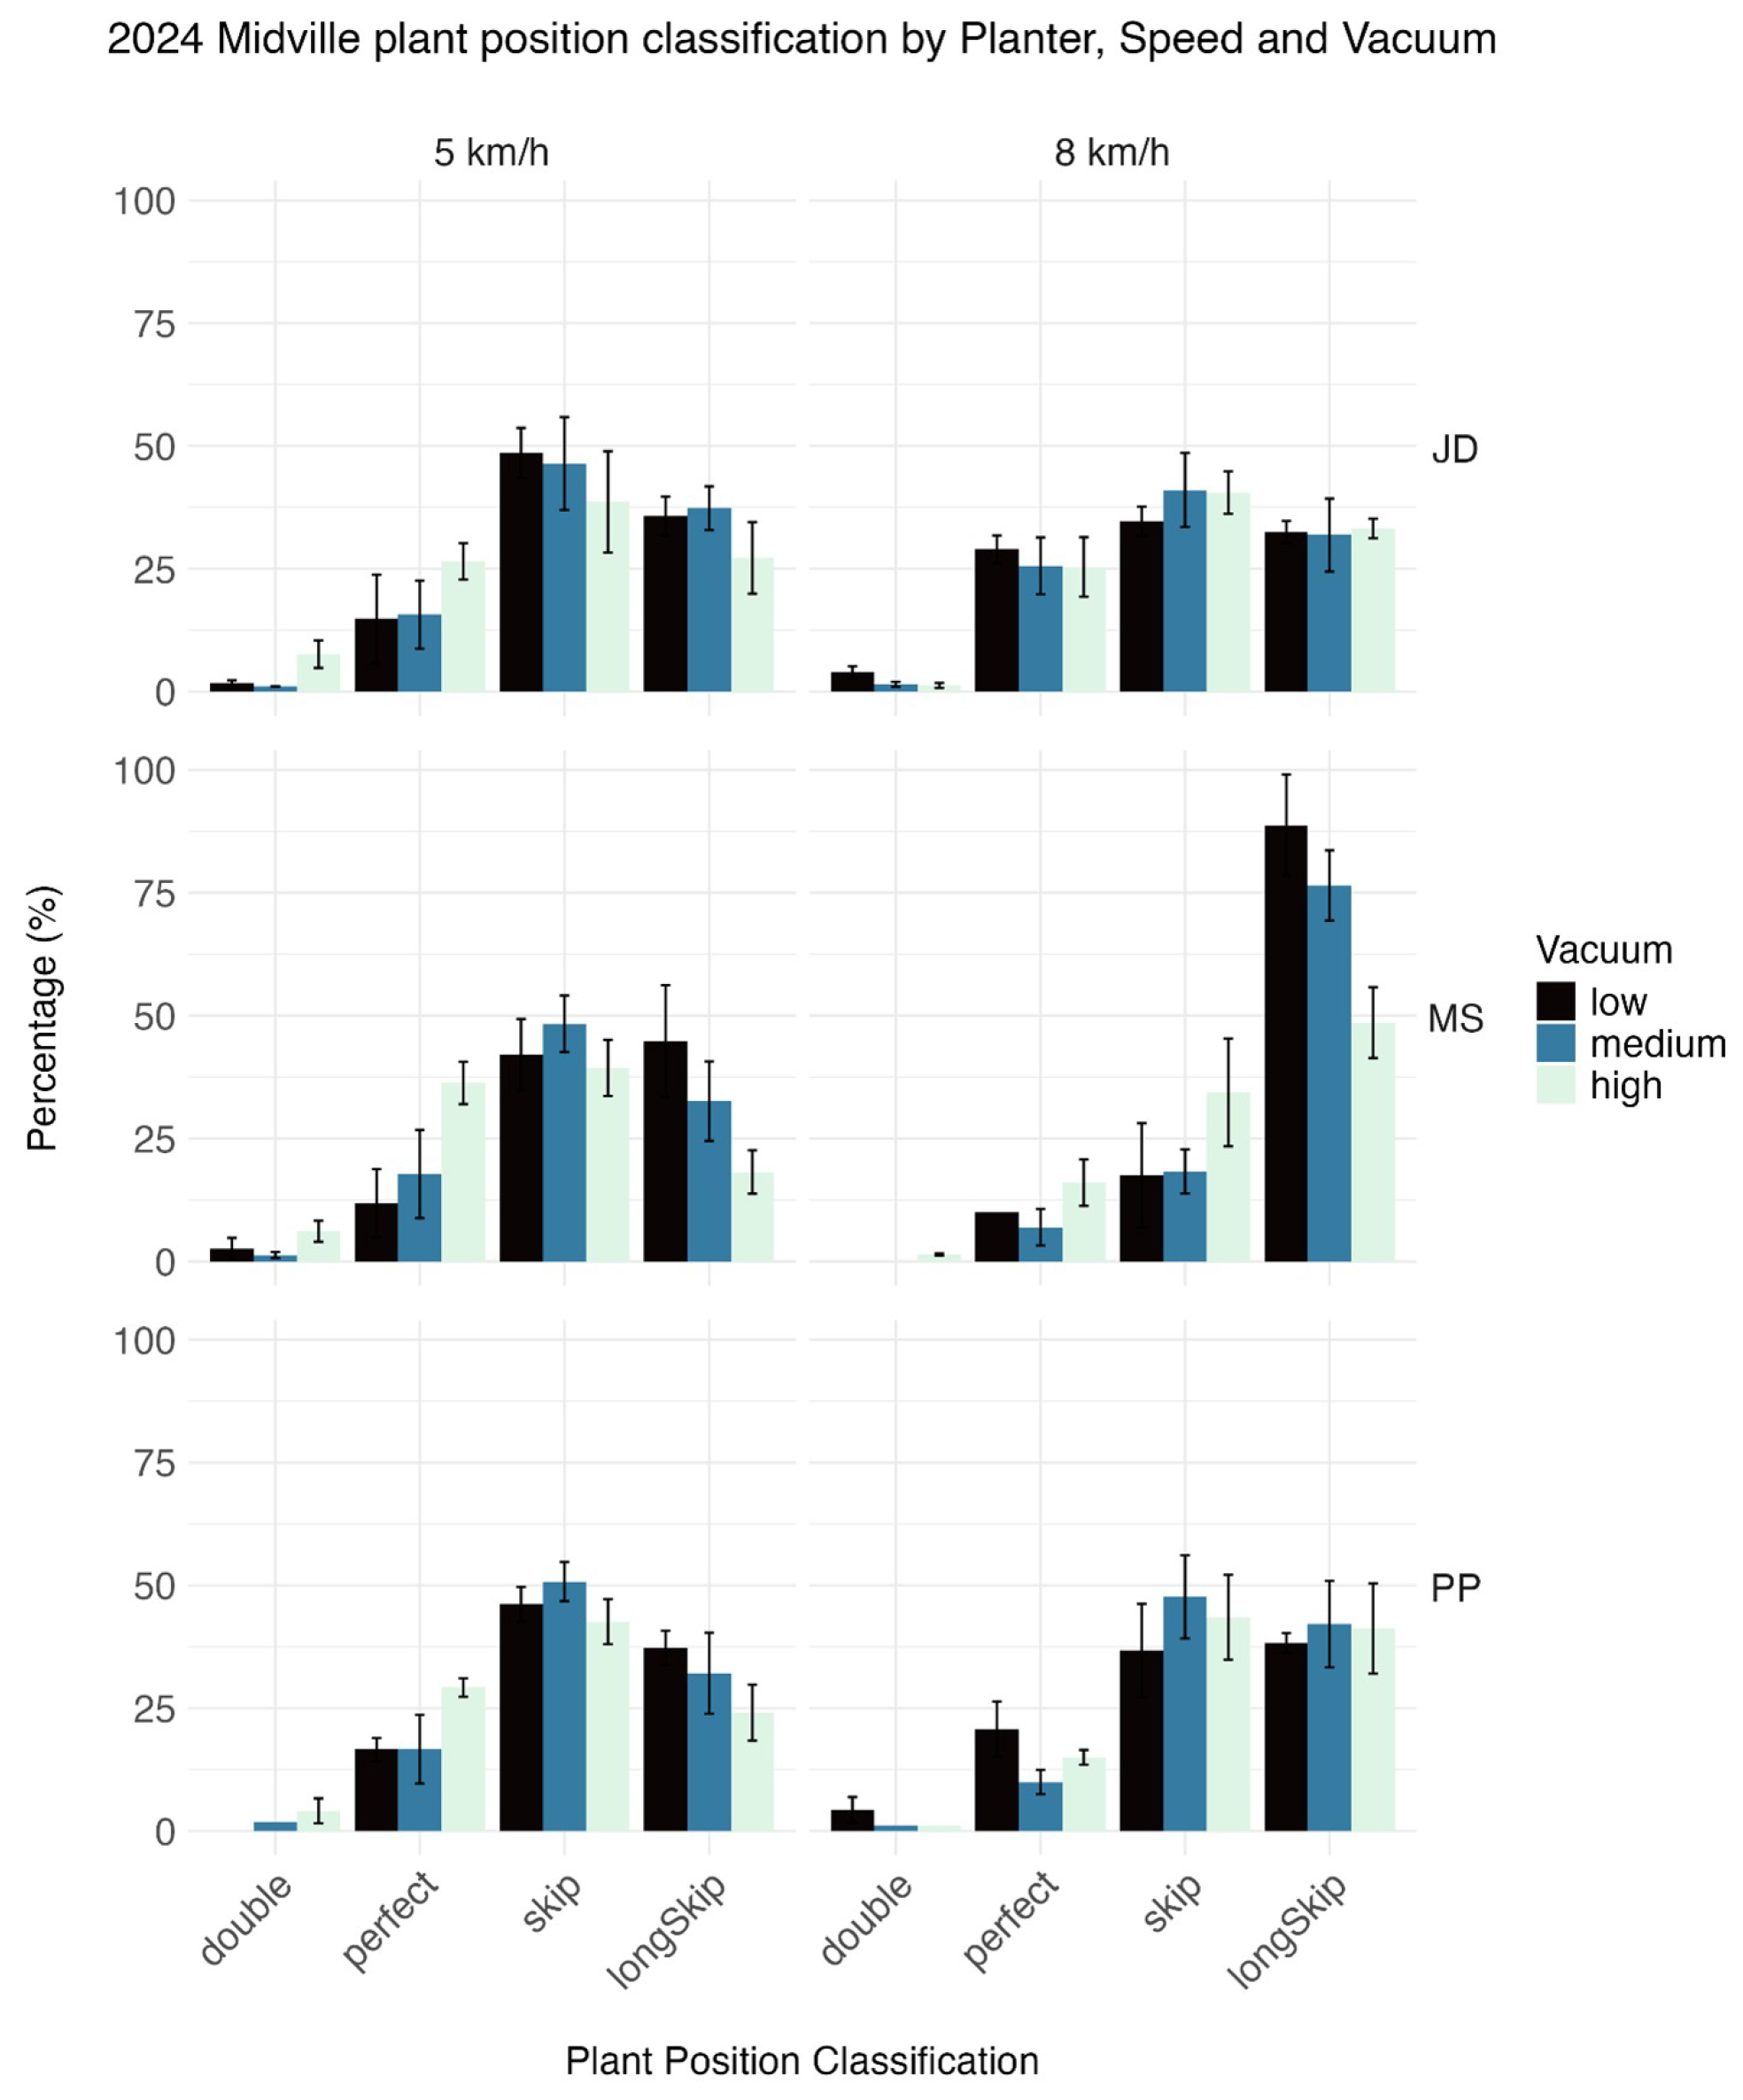
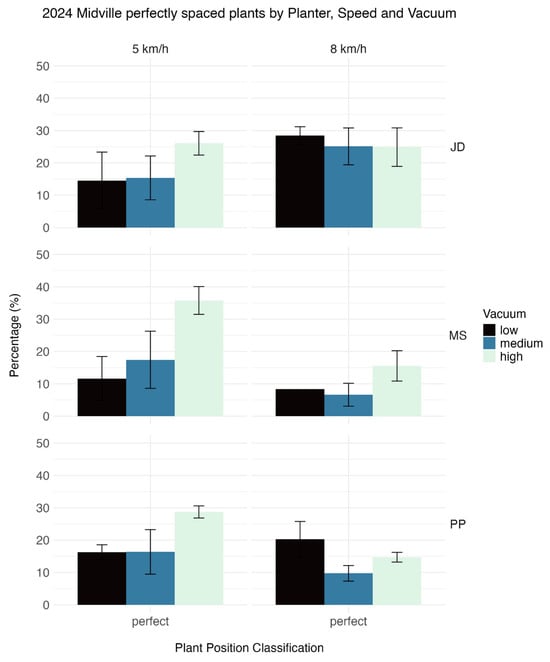
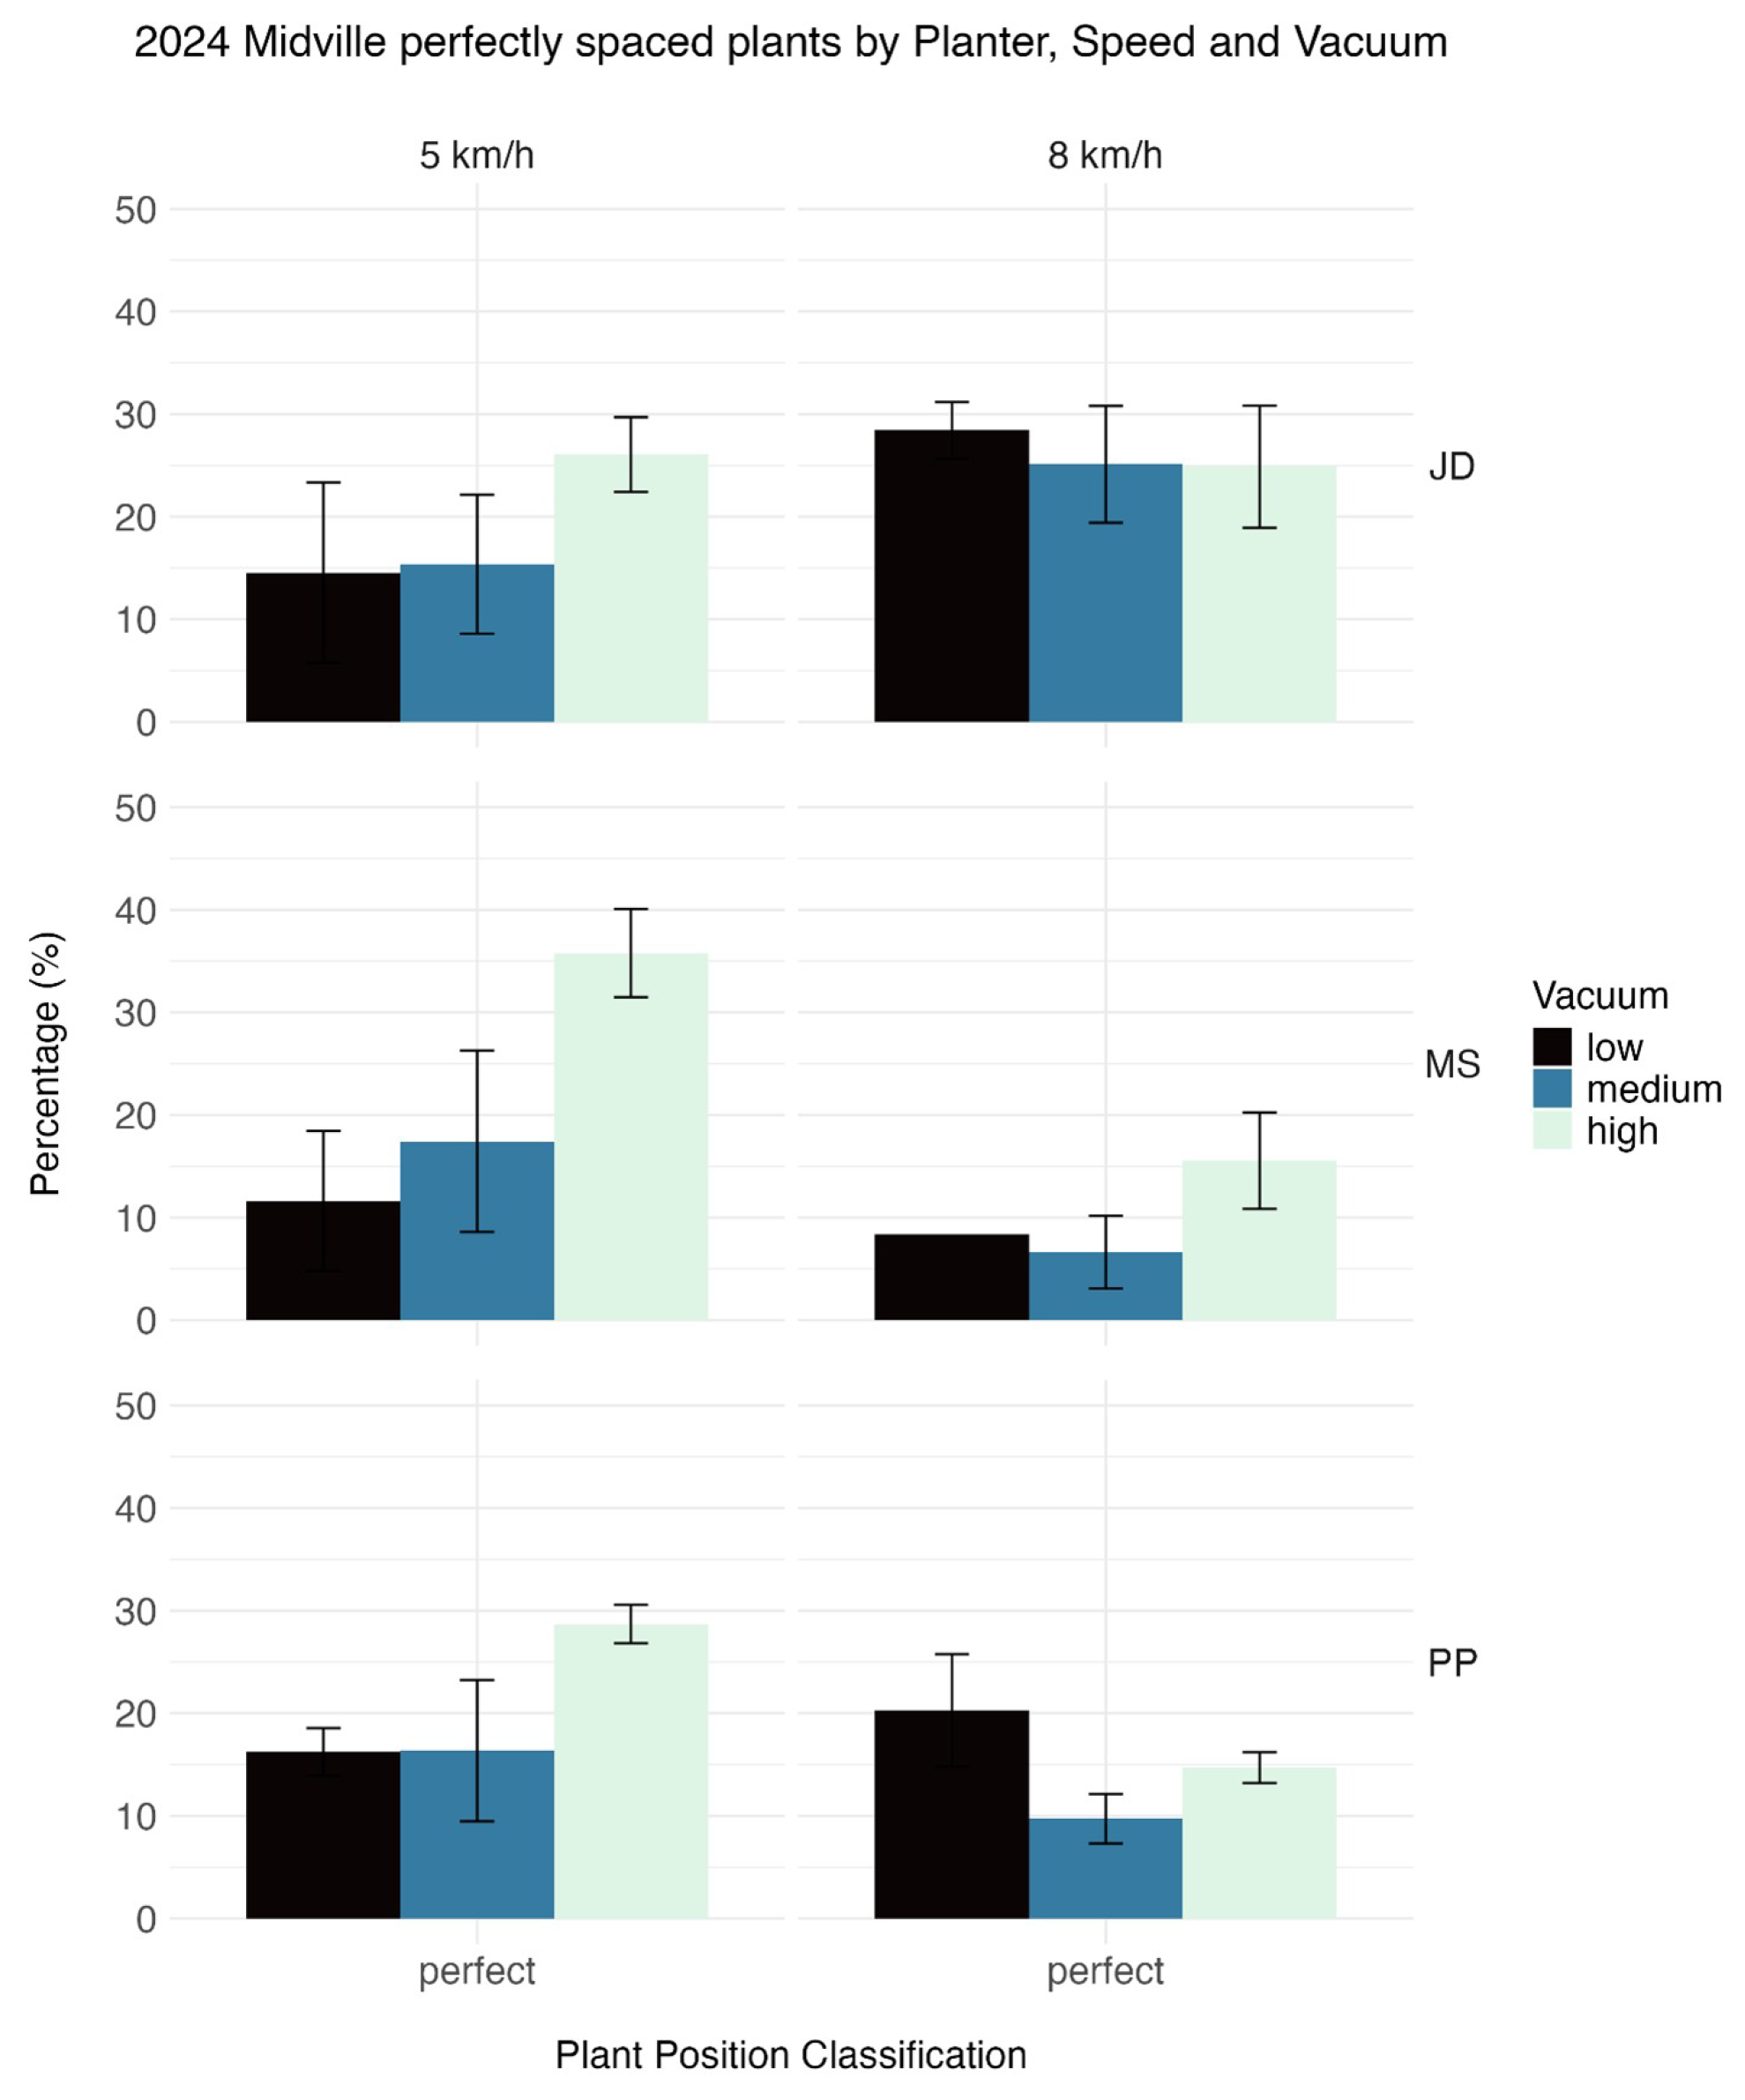
Across all planters and treatments in 2024, plants classified as skips (150–250% TPS) and long skips (>250% TPS) exceeded the proportion of perfectly spaced plants, indicating low spacing accuracy regardless of planter platform. ANOVA for perfect spacing showed significant planter, speed, and vacuum effects and significant planter × speed, planter × vacuum, and speed × vacuum interactions, whereas the three-way interaction was not significant (Supplementary Table S7). At 5 km h−1, the percentage of perfectly spaced plants increased with increasing vacuum level, whereas no consistent vacuum-related trend was observed at 8 km h−1. The MS planter operated at 5 km h−1 with high vacuum and produced the greatest proportion of perfectly spaced plants (Figure 6 and Figure 7).
Figure 6.
Plant position classification by planter platform, planting speed, and vacuum level in Midville, GA, in 2024. Because skips and long skips dominate the stacked distributions, this figure should be interpreted together with Figure 7 and Supplementary Table S7.
Figure 7.
Percentage of perfectly spaced plants by planter platform, planting speed, and vacuum level in Midville, GA, in 2024.
3.2.3. Yield (2024)
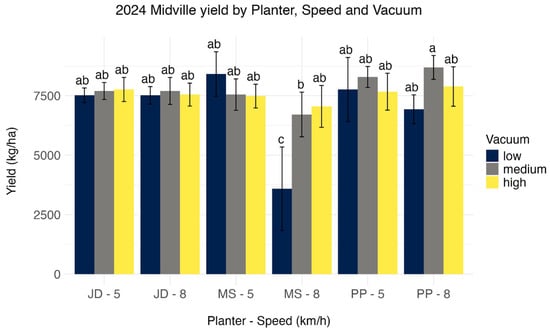
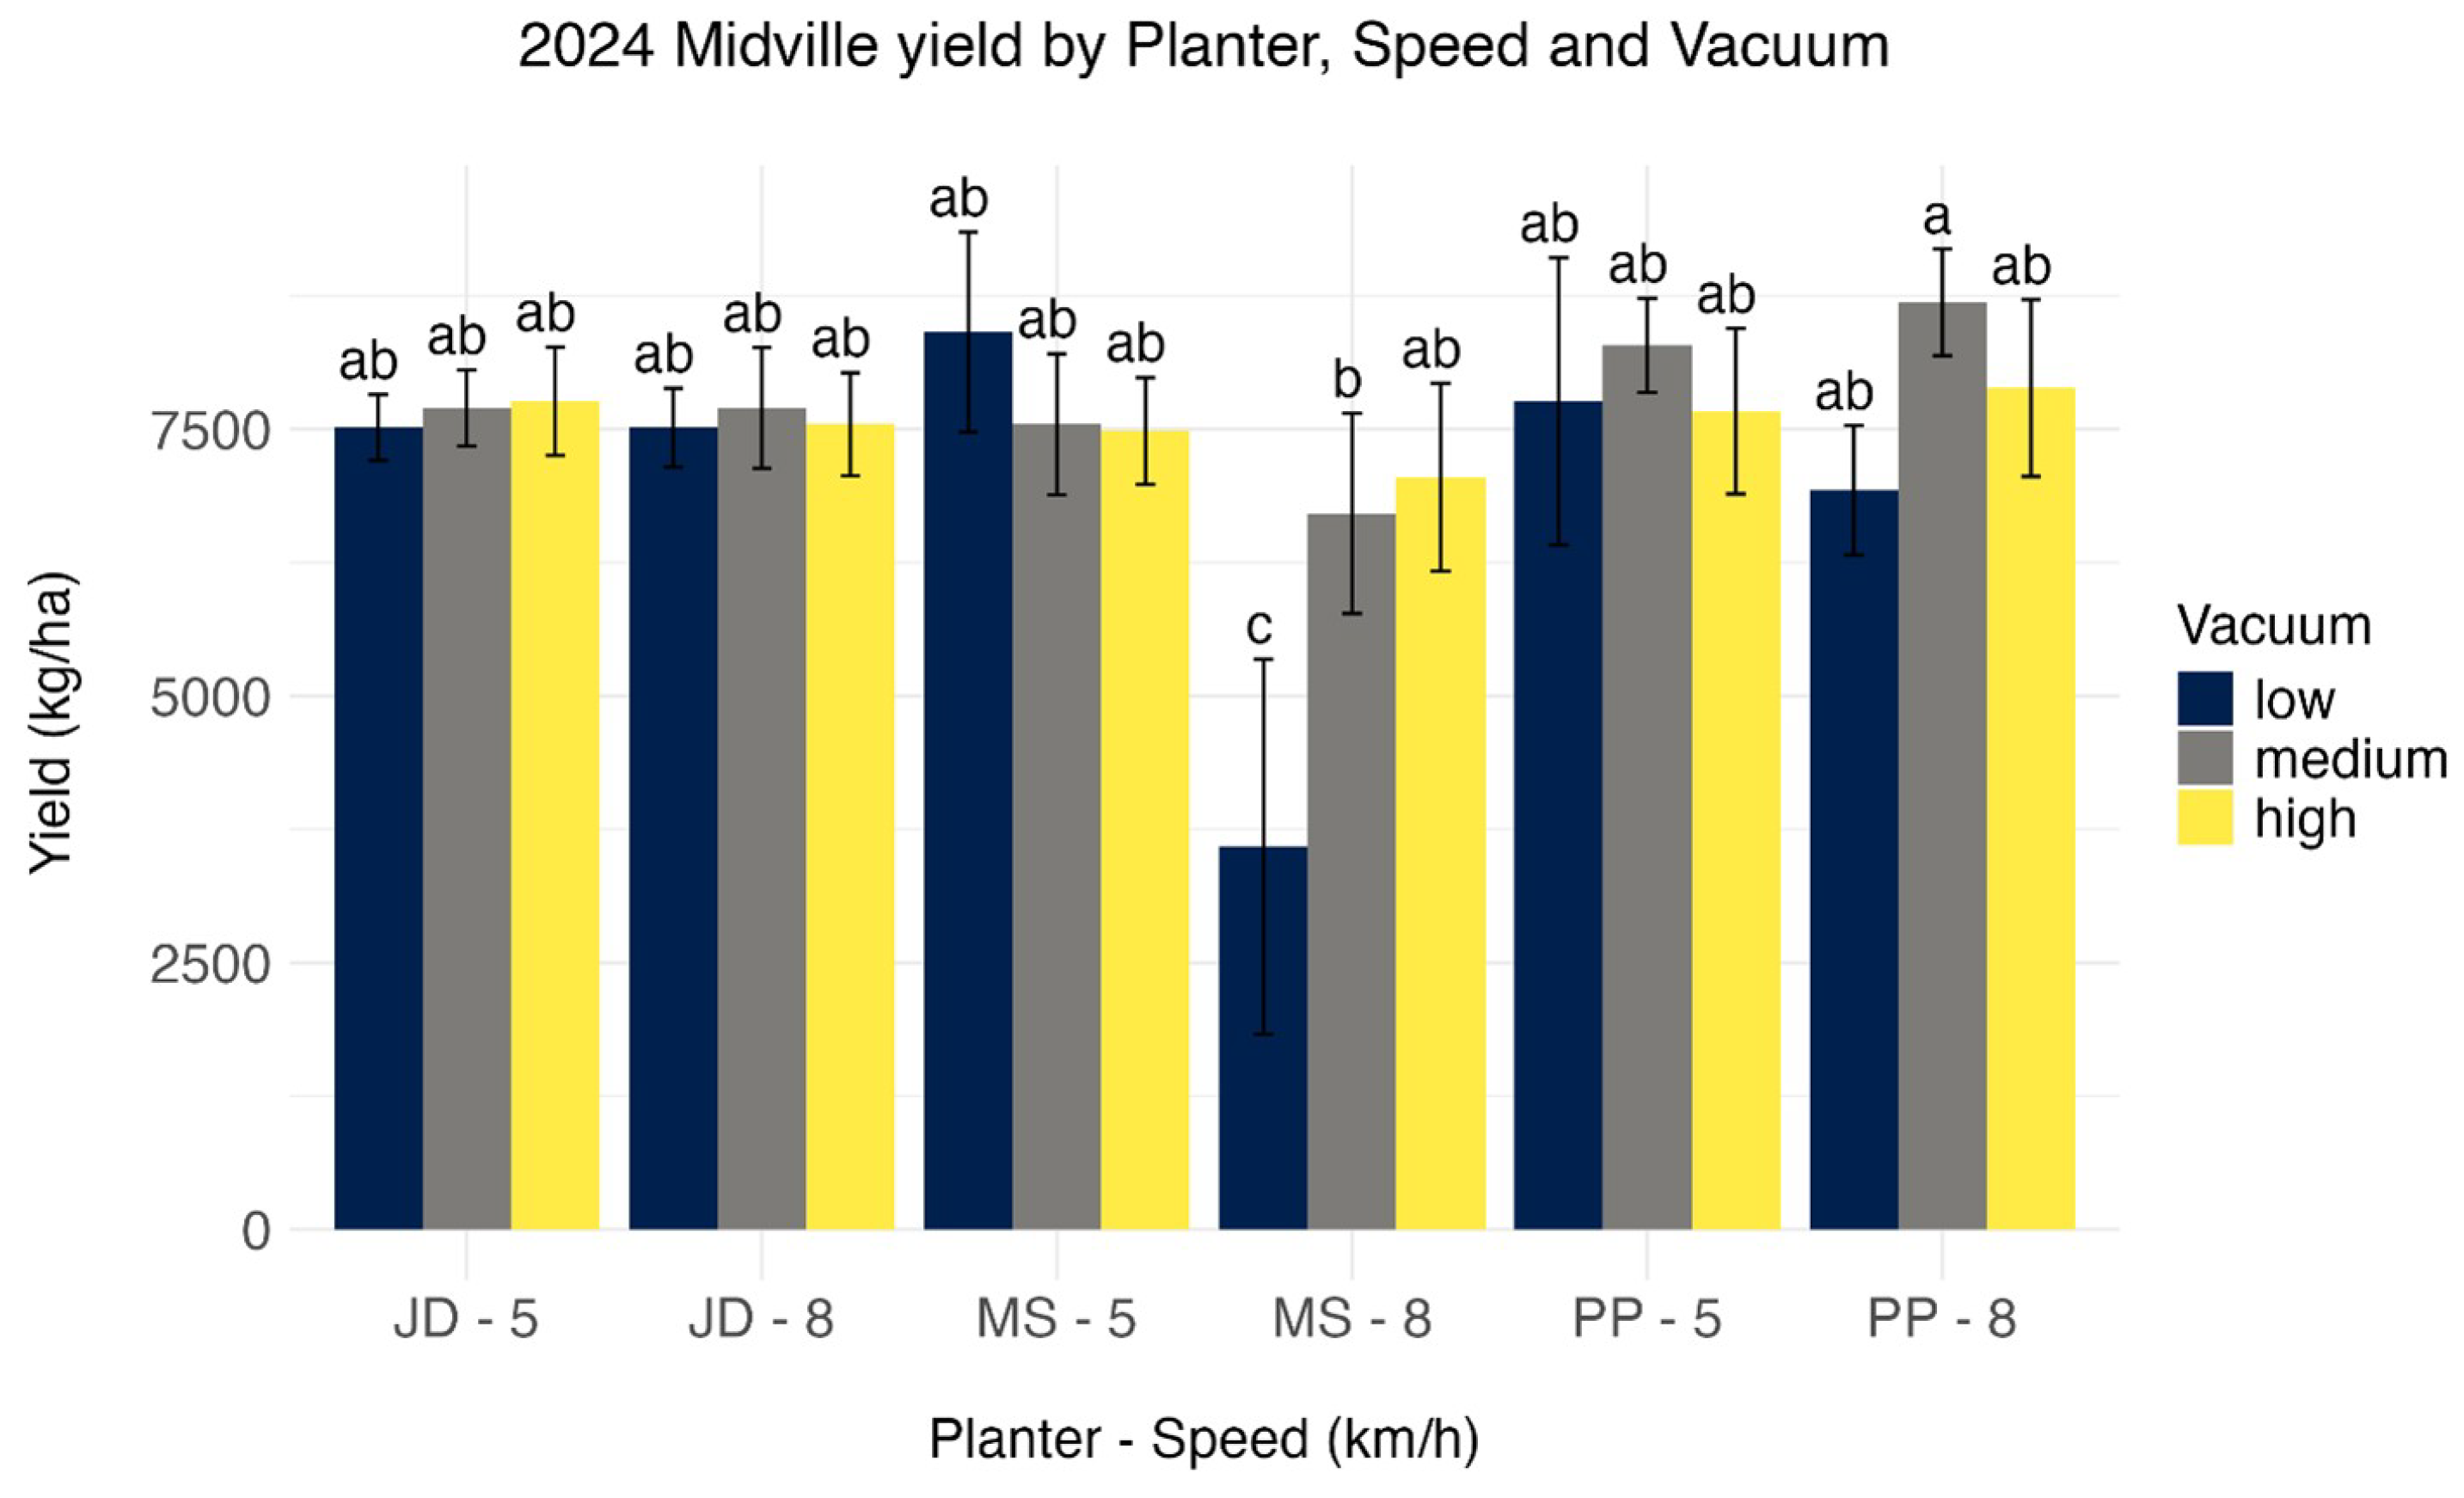
Yield results in 2024 indicated that treatments with relatively low achieved populations (as low as approximately 79,000 plants ha−1 for MS at 8 km h−1 with high vacuum) produced yields comparable to treatments with higher stand counts. Yield ANOVA showed significant planter, speed, and vacuum main effects together with significant planter × speed, speed × vacuum, and planter × speed × vacuum interactions (Supplementary Table S8), so treatment-specific comparisons are more informative than main effects alone. The only treatment with a significantly lower yield was MS at 8 km h−1 with low vacuum, where the achieved population was approximately 10,000 plants ha−1 (Figure 8).
Figure 8.
Yield by planter platform, planting speed, and vacuum level in Midville, GA, in 2024. Bars sharing a common letter are not significantly different at based on Tukey-adjusted mean separation. Error bars represent ±1 standard deviation.
3.2.4. Achieved Population (2025)
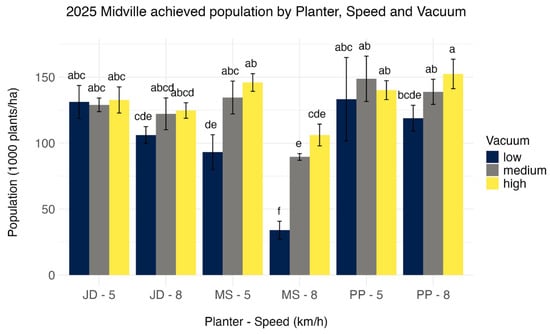
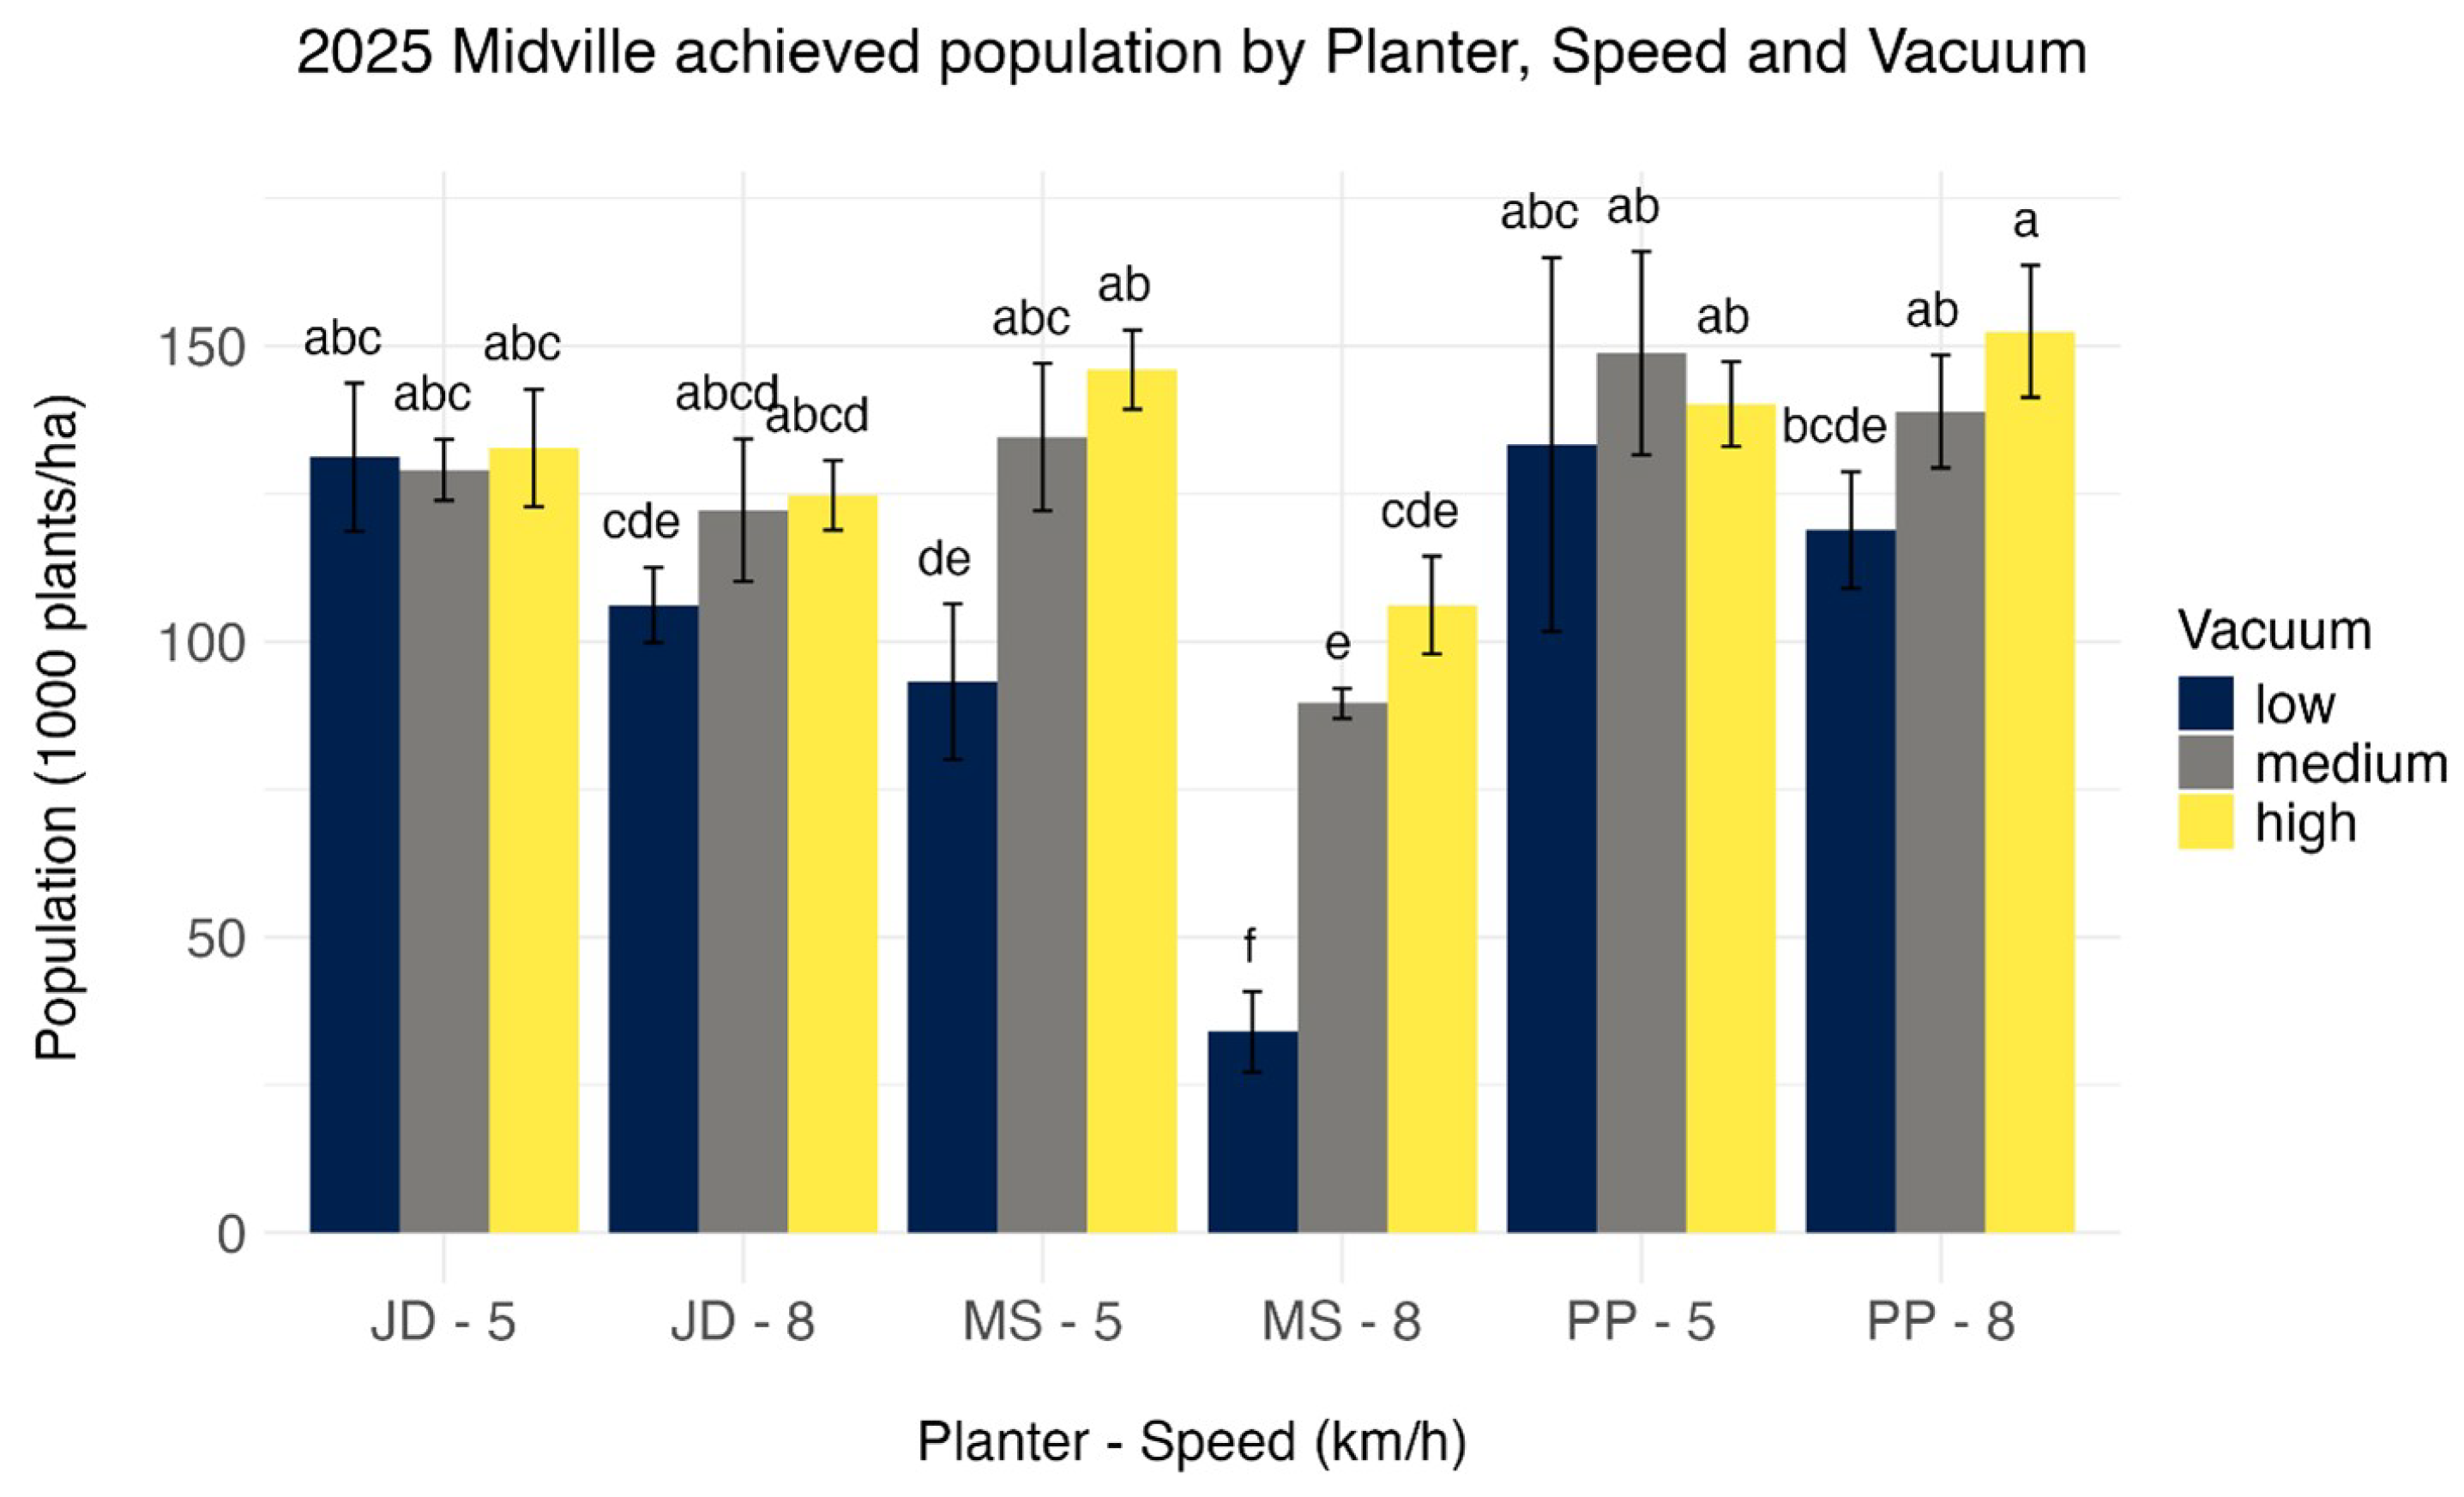
In 2025, planter × speed × vacuum trials were conducted at Midville and Tifton. At Midville, the achieved population showed significant planter, speed, and vacuum main effects together with significant planter × speed, planter × vacuum, and speed × vacuum interactions (Supplementary Table S9), whereas the three-way interaction was not significant. Within that interaction structure, achieved population for the MS planter at 5 km h−1 was significantly greater at medium and high vacuum than at low vacuum. At 8 km h−1, the achieved population declined significantly as the vacuum decreased. For the JD planter, no significant differences were detected among vacuum levels or planting speeds. For the PP planter, achieved population at 8 km h−1 with high vacuum was the highest overall and significantly greater than several low-vacuum treatments (Figure 9).
Figure 9.
Achieved population by planter platform, planting speed, and vacuum level in Midville, GA, in 2025. Bars sharing a common letter are not significantly different at based on Tukey-adjusted mean separation. Error bars represent ±1 standard deviation.
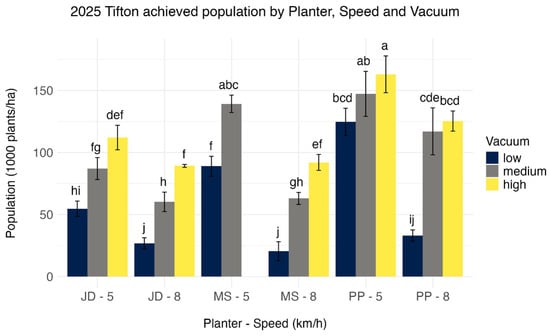
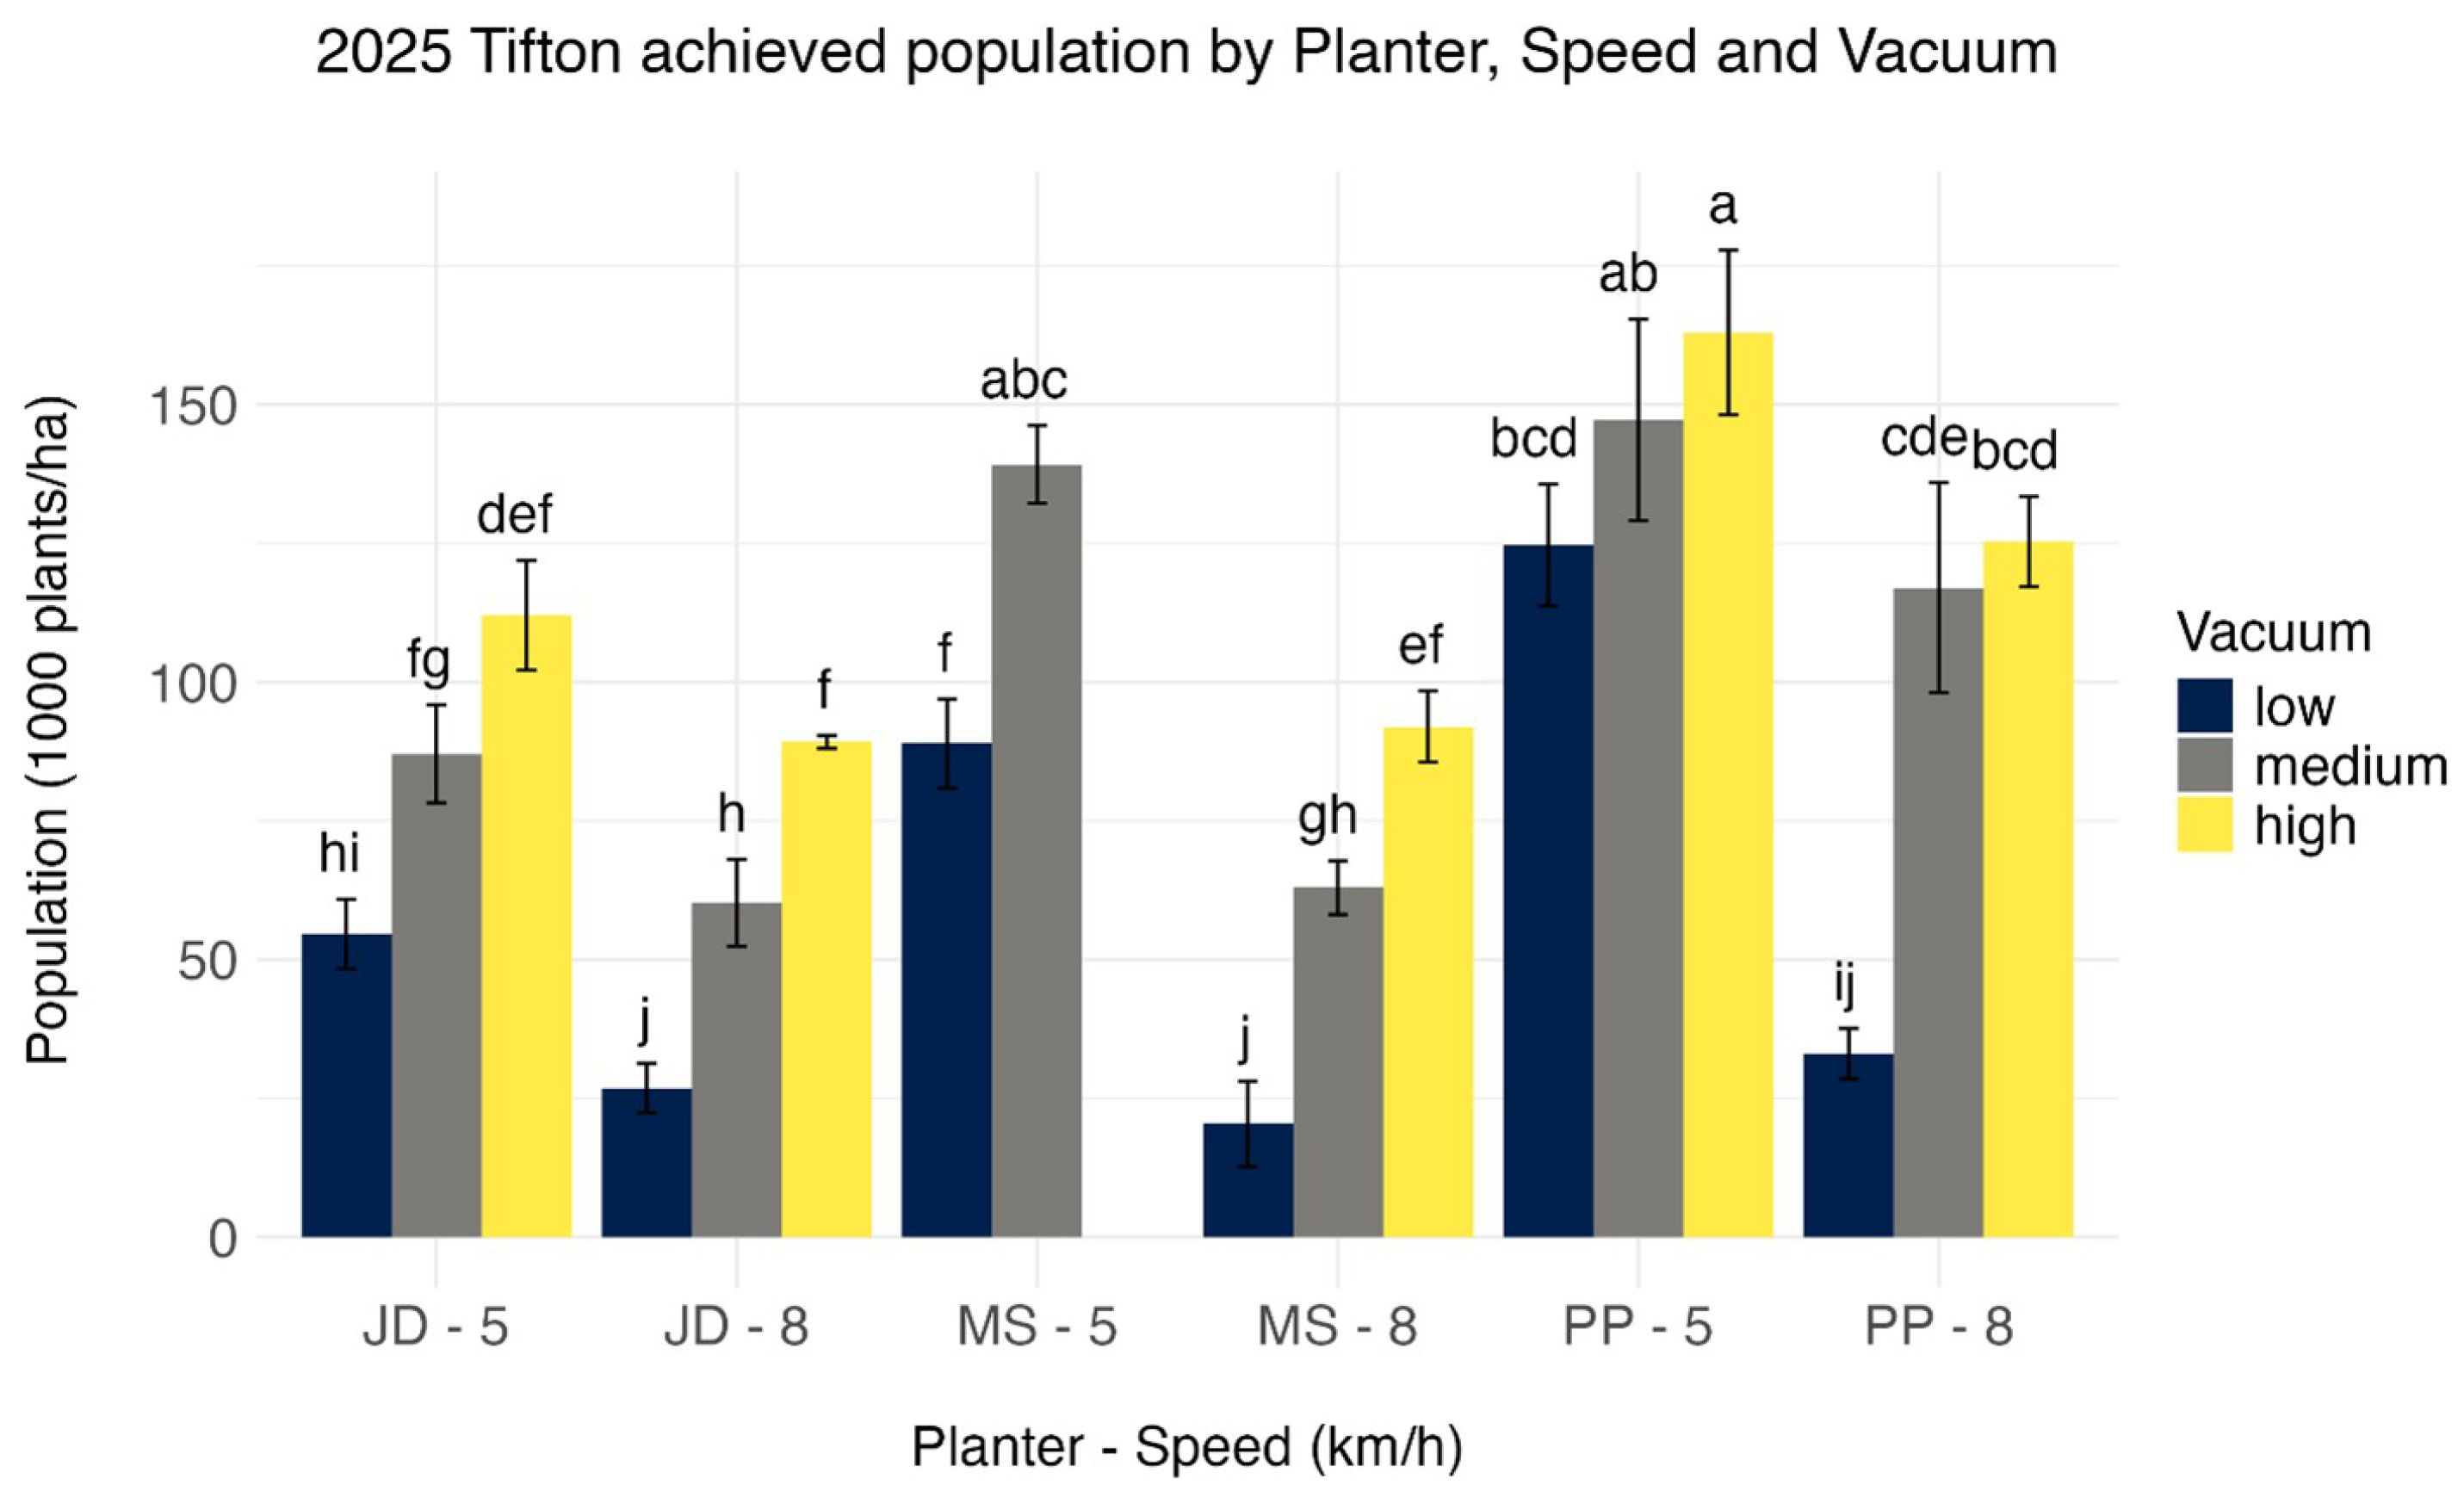
At Tifton, results differed from those observed at Midville and showed the strongest interaction structure of any achieved-population site-year. ANOVA detected significant planter, speed, and vacuum main effects and significant planter × speed, planter × vacuum, speed × vacuum, and planter × speed × vacuum interactions (Supplementary Table S12). The PP planter at 5 km h−1 with high vacuum produced a significantly greater achieved population than most other treatments. The MS planter pass targeted at 5 km h−1 with high vacuum was excluded from treatment comparisons because direct field observation at the end of the pass showed that the ground-drive wheel failed to maintain full soil contact, causing loss of meter rotation and resulting in an incomplete pass that no longer represented the intended treatment. This exclusion was not based on a pre-specified written rule; it was a post hoc data-quality decision applied to an obvious operational failure observed in the field. No similar drive-wheel-slip failure was documented for the other retained planting passes in the 2025 analyses. For the JD planter, the achieved population declined significantly with decreasing vacuum at both planting speeds, a trend not observed at Midville (Figure 10).
Figure 10.
Achieved population by planter platform, planting speed, and vacuum level in Tifton, GA, in 2025. Bars sharing a common letter are not significantly different at based on Tukey-adjusted mean separation. Error bars represent ±1 standard deviation.
3.2.5. Plant Spacing and Position Classification (2025)
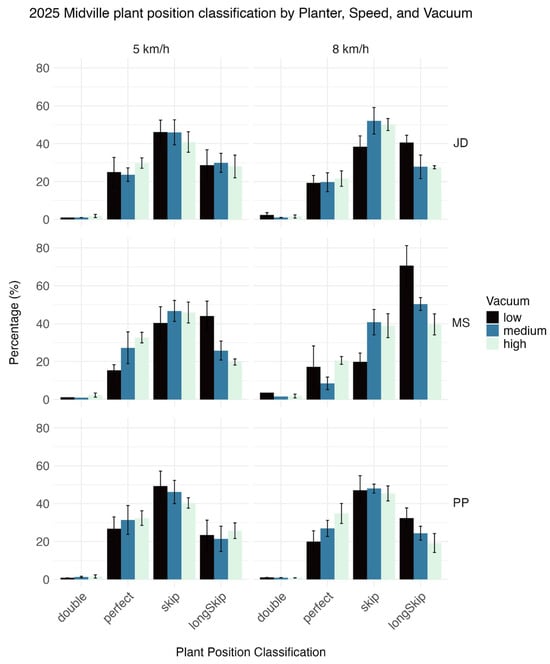
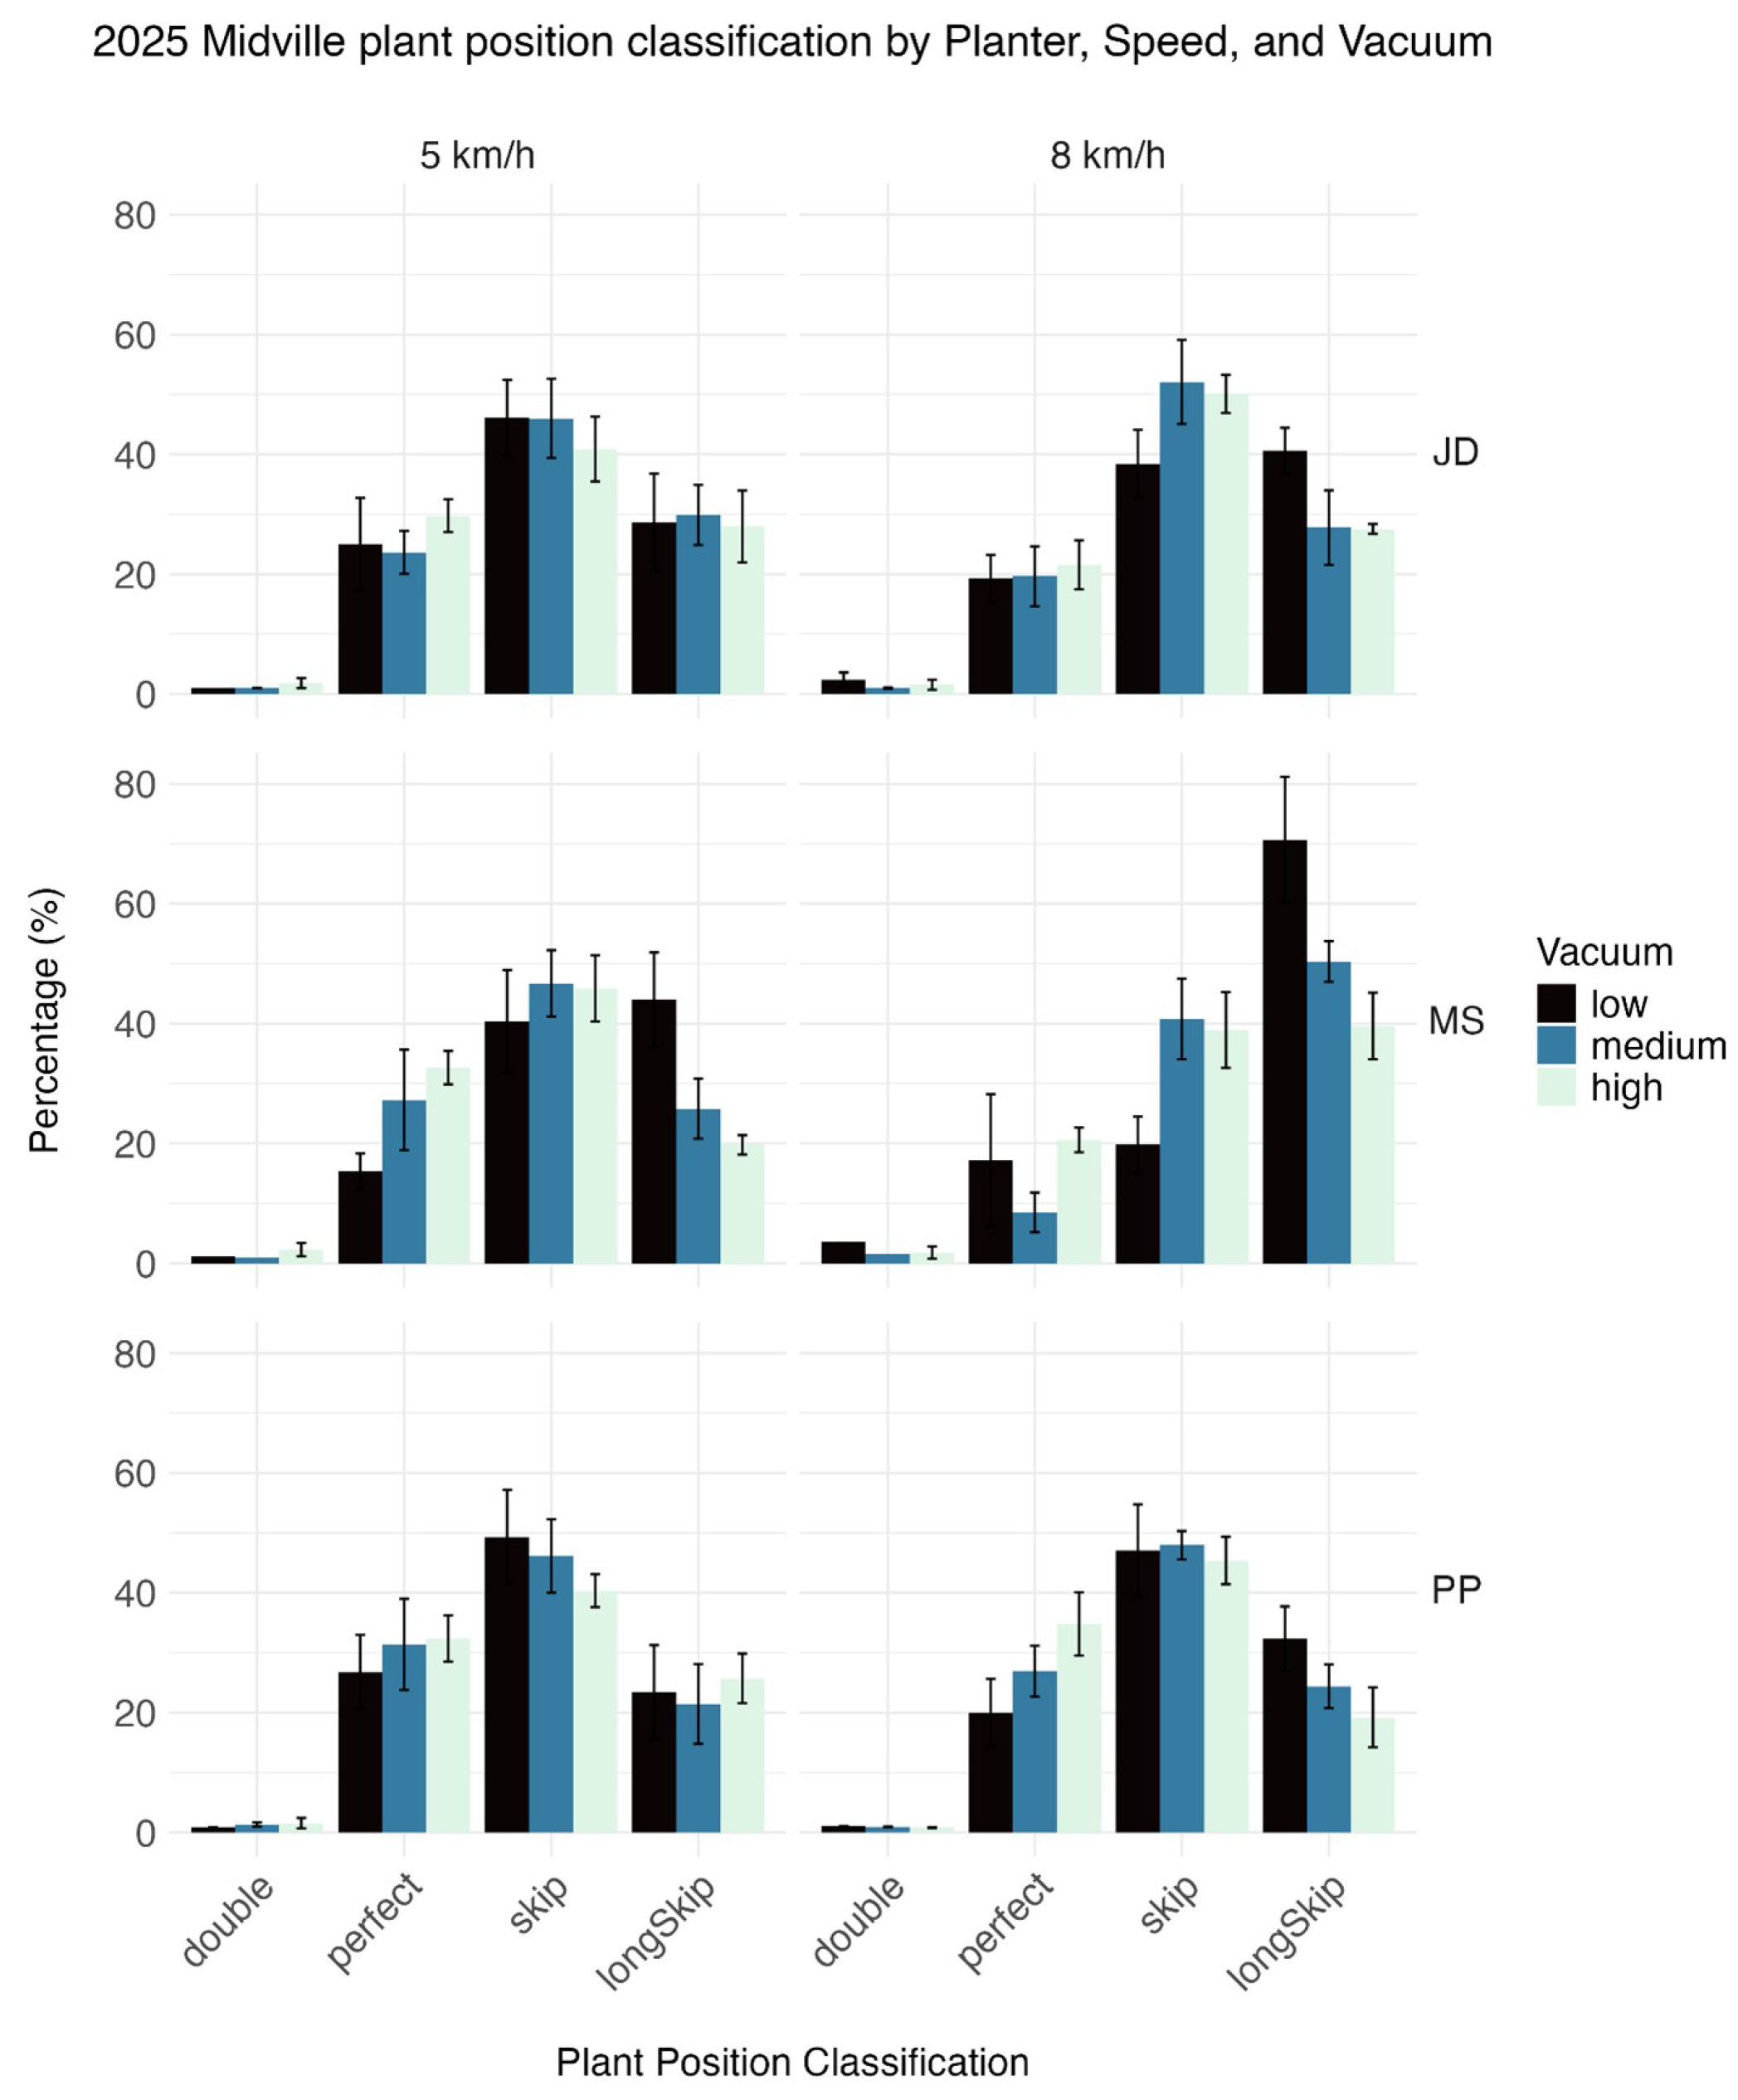
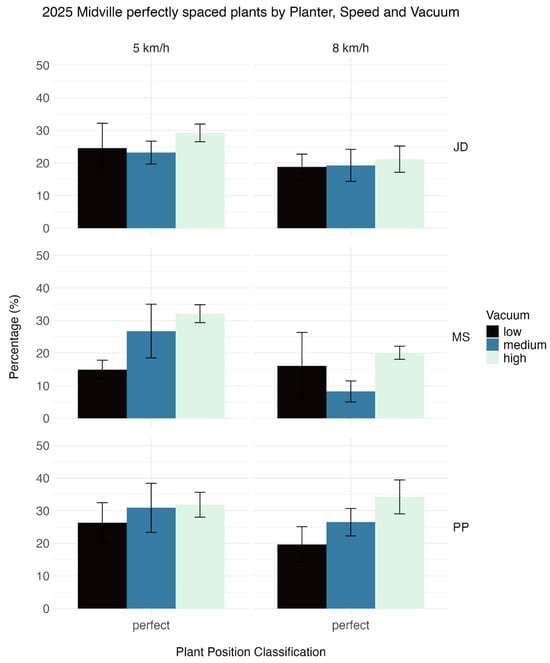
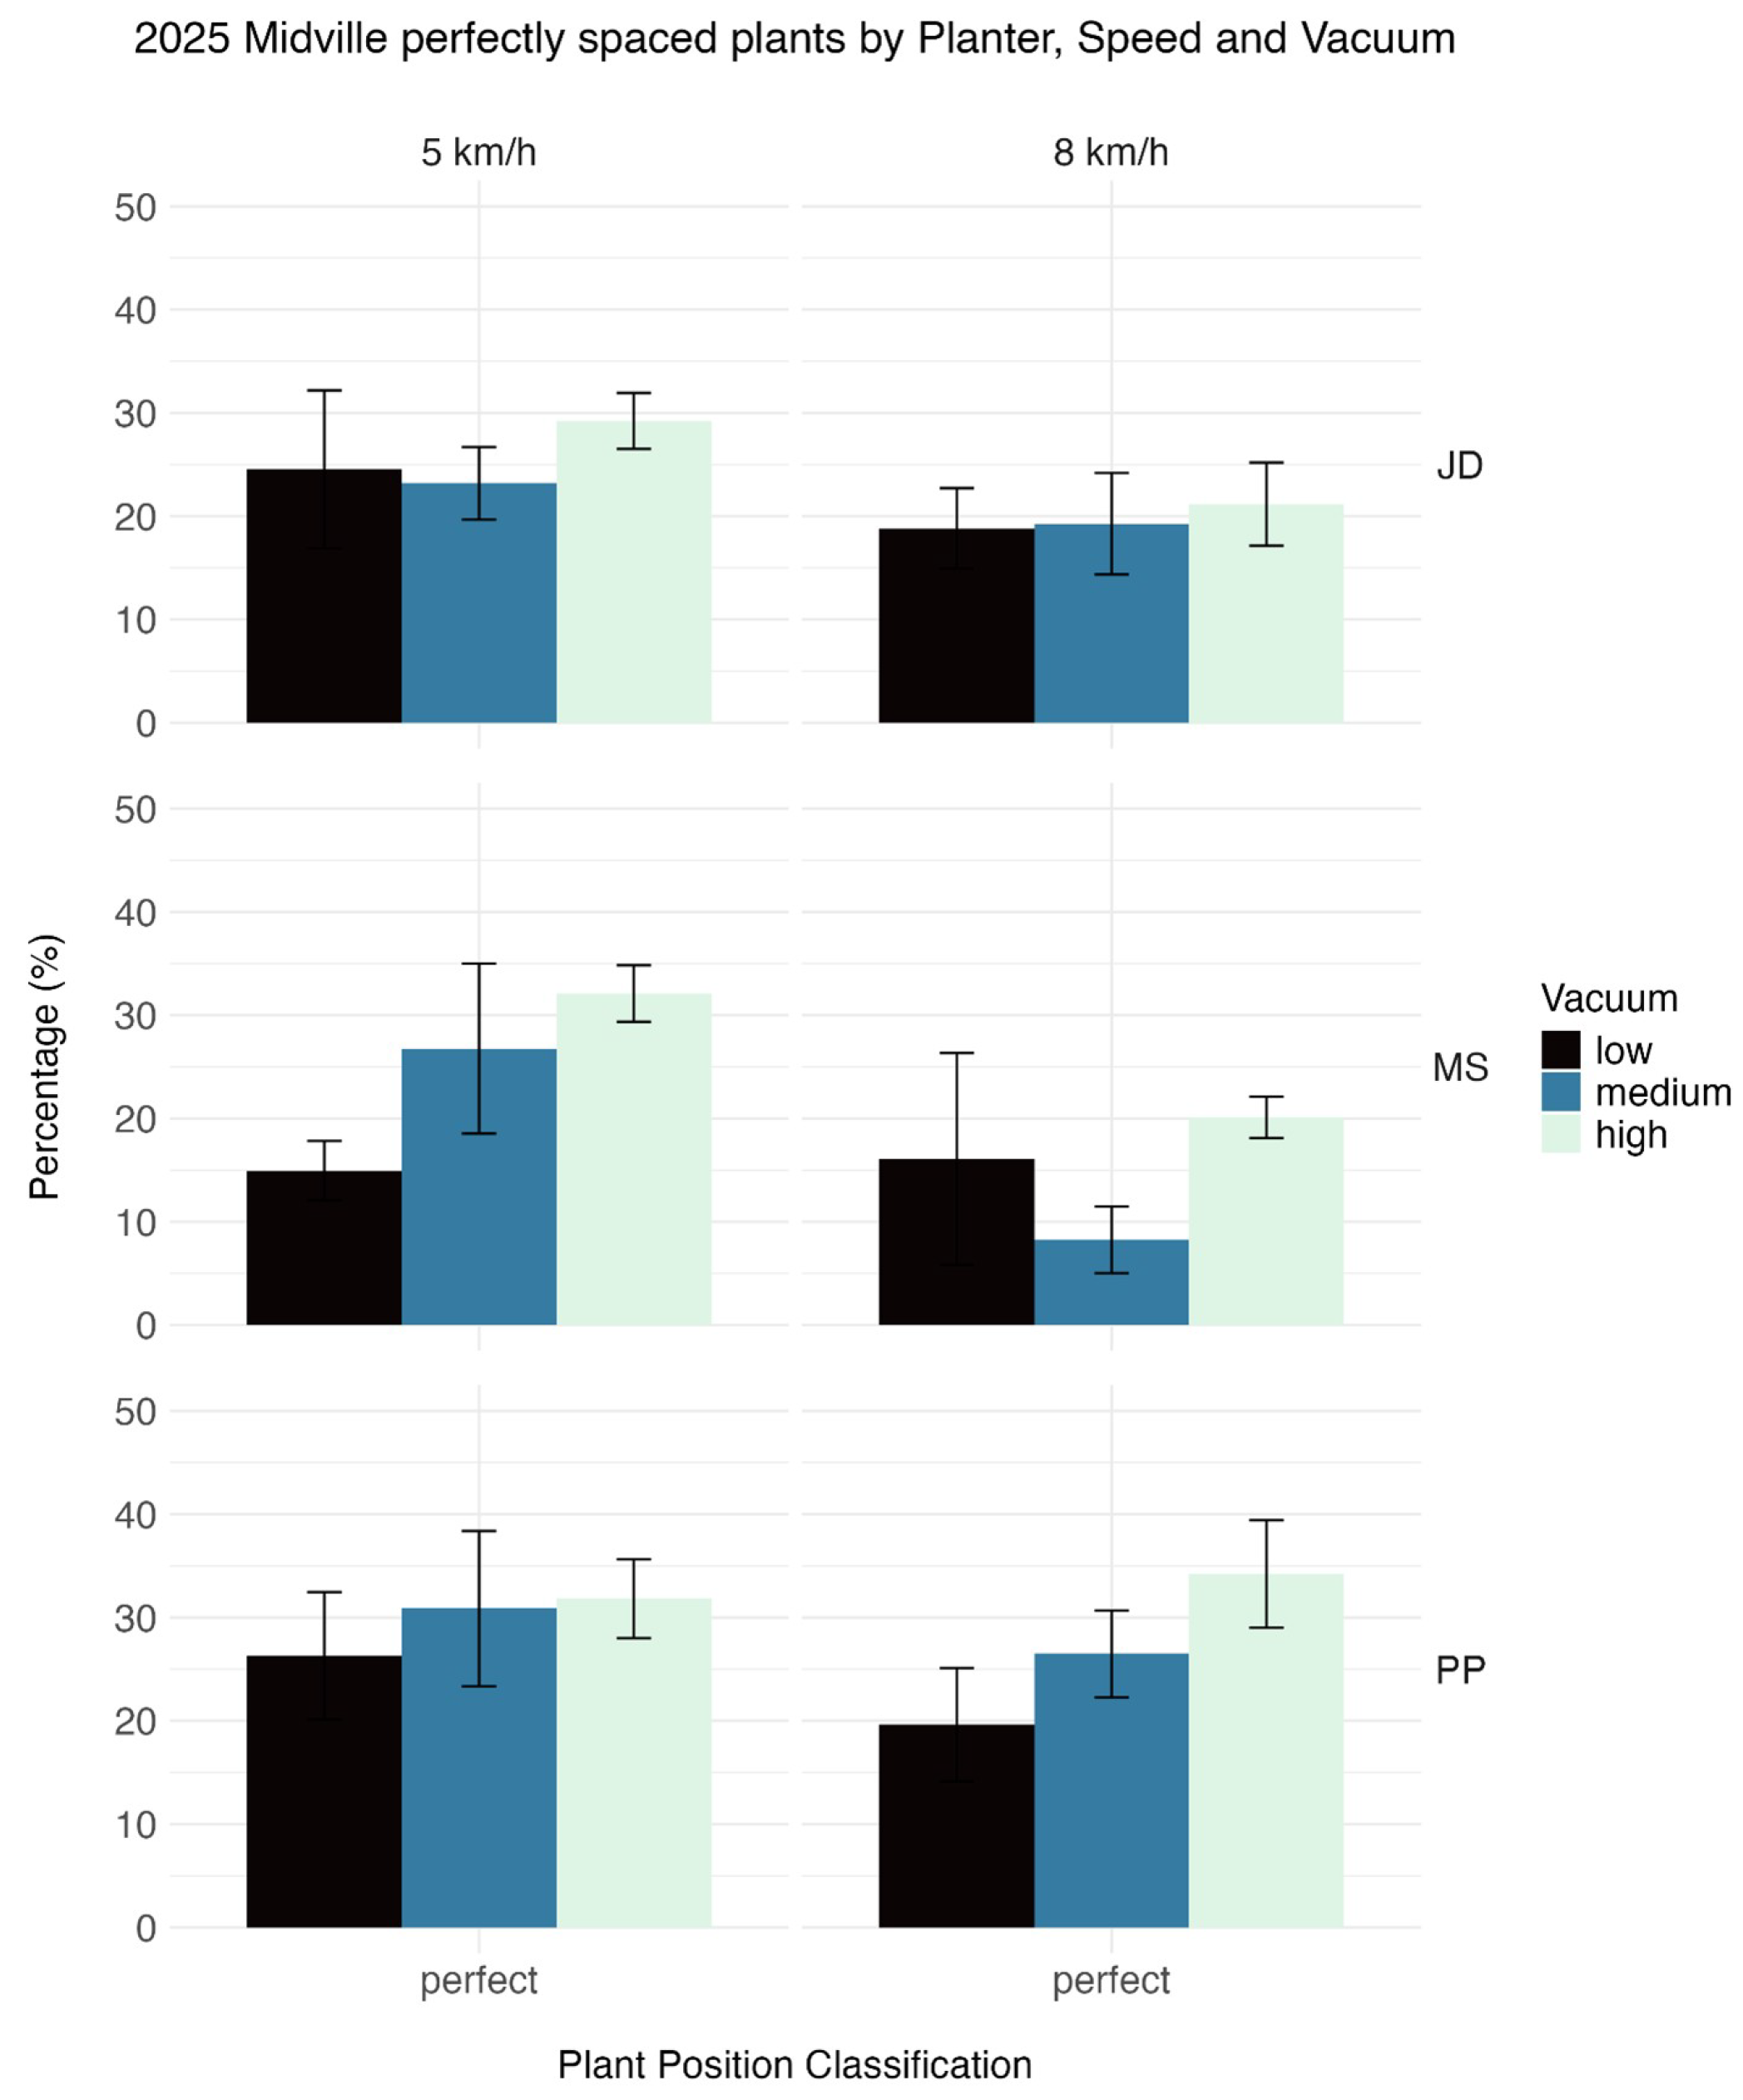
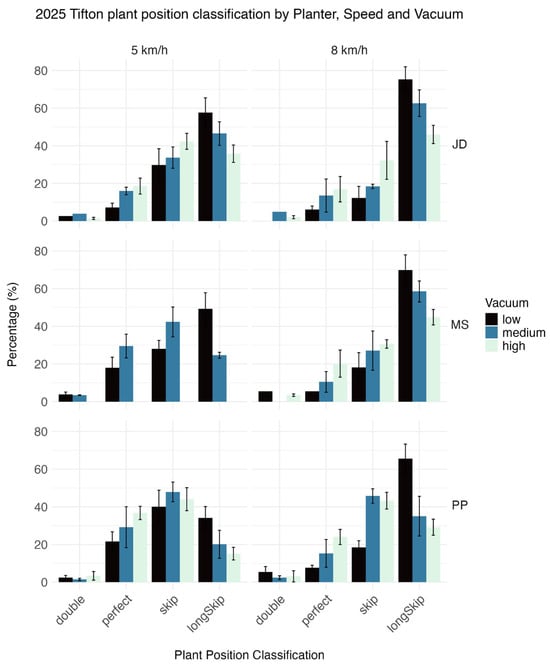
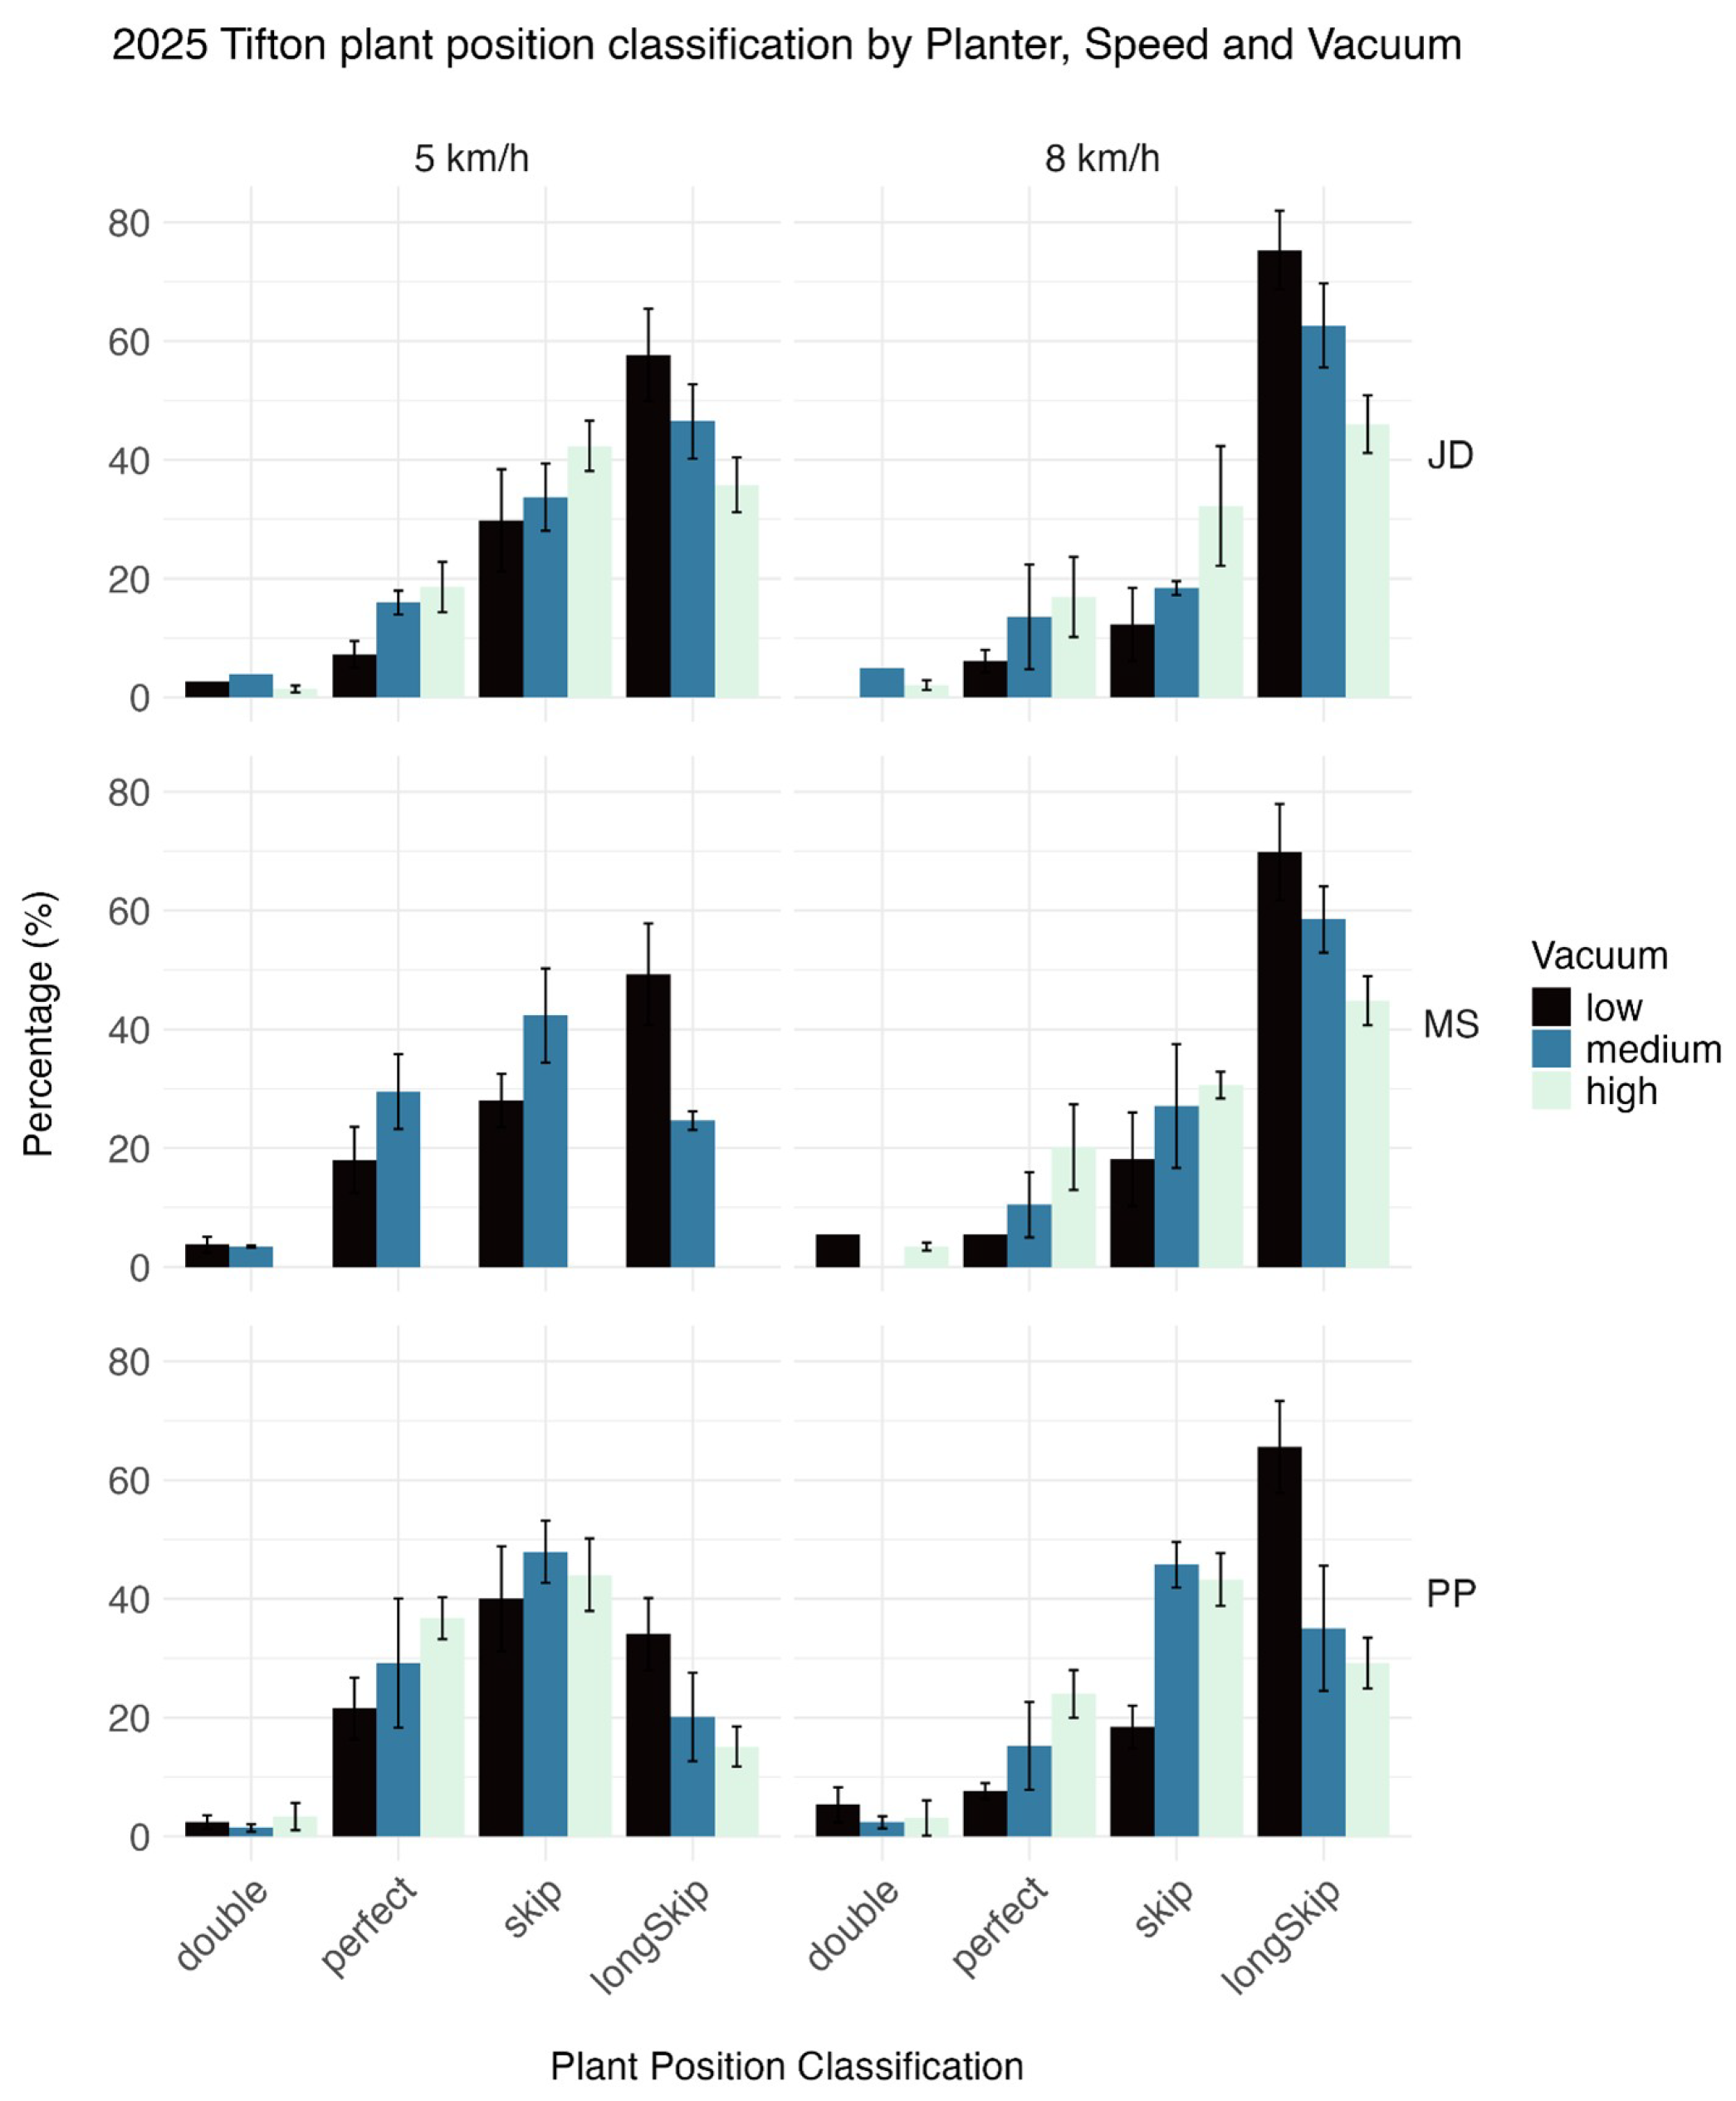
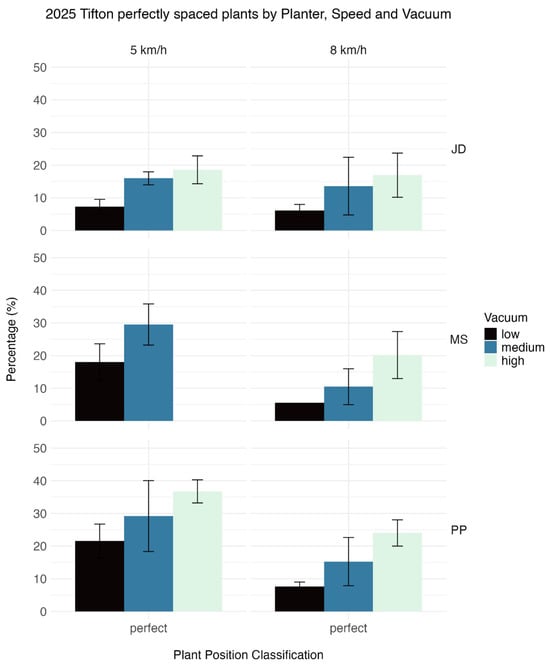
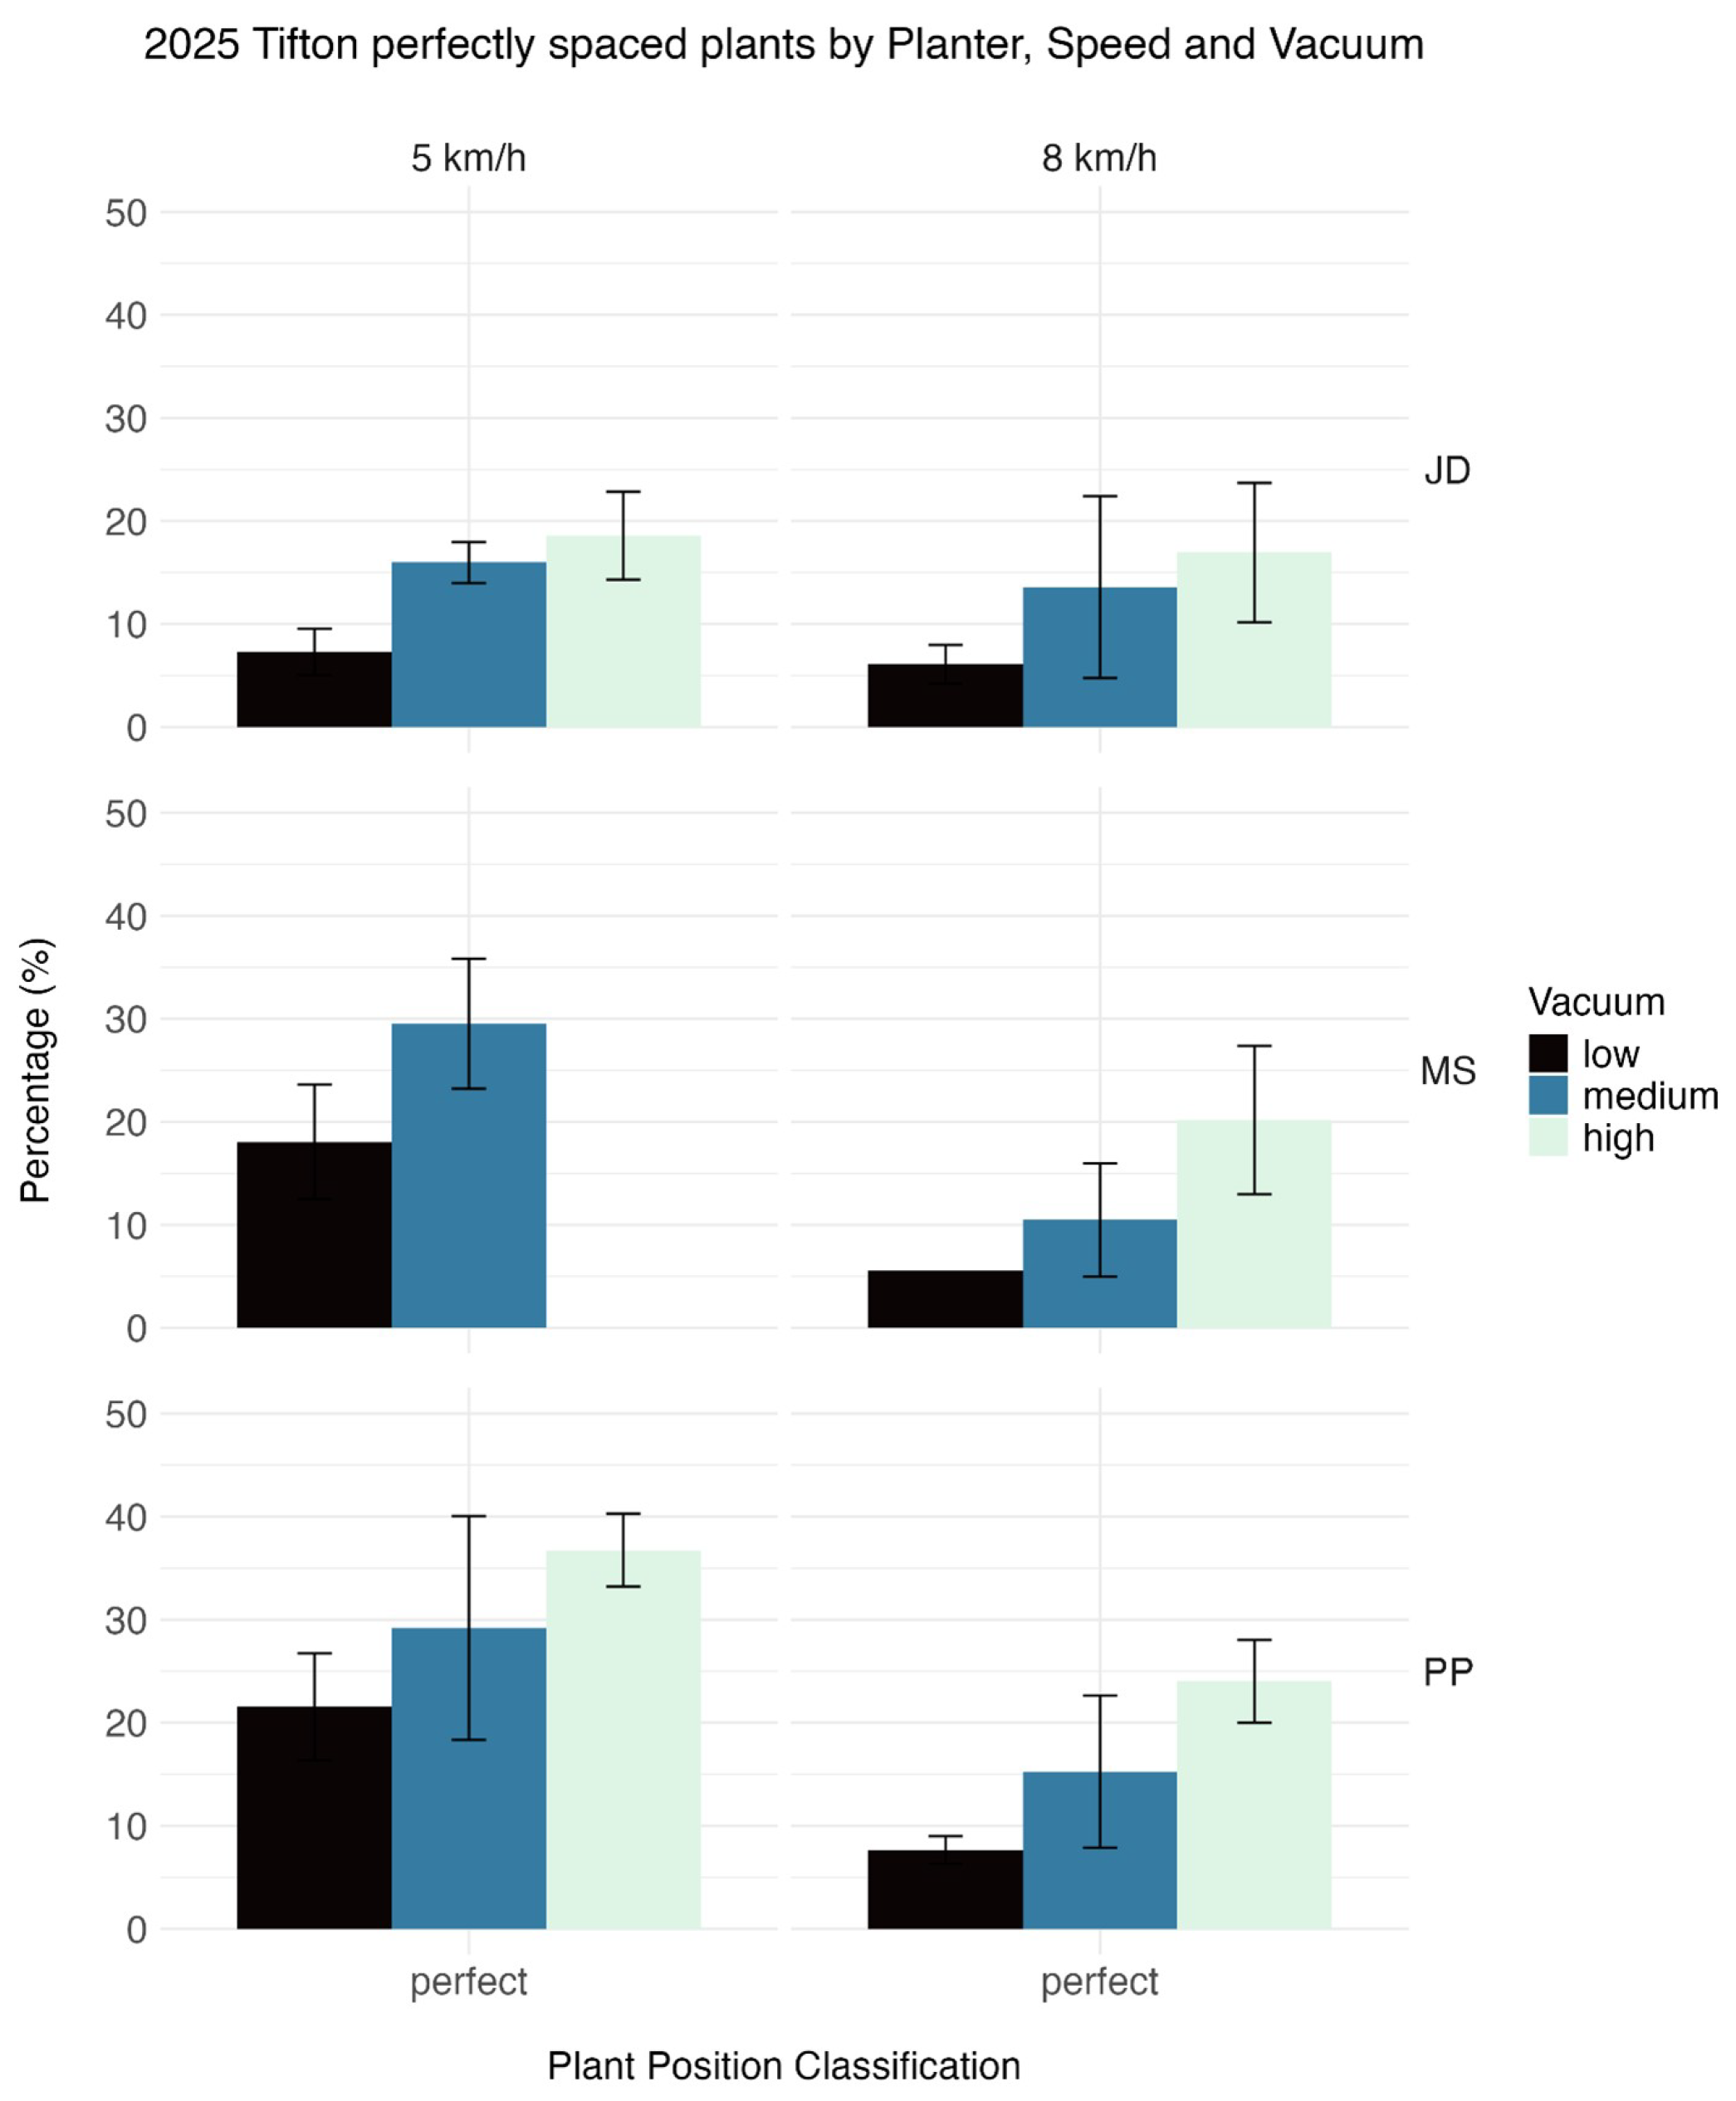
Across both locations in 2025, plants classified as skips and long skips consistently outnumbered perfectly spaced plants for all planters and treatments. In Midville, perfect-spacing ANOVA showed significant planter, speed, and vacuum effects and a significant planter × speed interaction, whereas the remaining interactions were not significant (Supplementary Table S10). In Tifton, planter, speed, and vacuum effects and significant planter × speed and planter × vacuum interactions were detected, whereas the speed × vacuum and three-way interactions were not significant (Supplementary Table S13). The highest percentages of perfectly spaced plants were observed for the PP planter at 5 km h−1 with a high vacuum at Tifton and at 8 km h−1 with a high vacuum at Midville (Figure 11, Figure 12, Figure 13 and Figure 14).
Figure 11.
Plant position classification by planter platform, planting speed, and vacuum level in Midville, GA, in 2025. Because skips and long skips dominate the stacked distributions, this figure should be interpreted together with Figure 12 and Supplementary Table S10.
Figure 12.
Percentage of perfectly spaced plants by planter platform, planting speed, and vacuum level in Midville, GA, in 2025.
Figure 13.
Plant position classification by planter platform, planting speed, and vacuum level in Tifton, GA, in 2025. Because skips and long skips dominate the stacked distributions, this figure should be interpreted together with Figure 14 and Supplementary Table S13.
Figure 14.
Percentage of perfectly spaced plants by planter platform, planting speed, and vacuum level in Tifton, GA, in 2025.
3.2.6. Yield (2025)
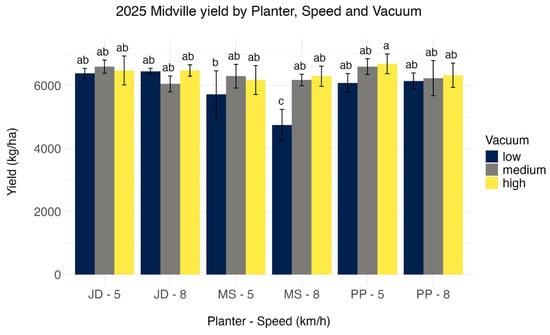
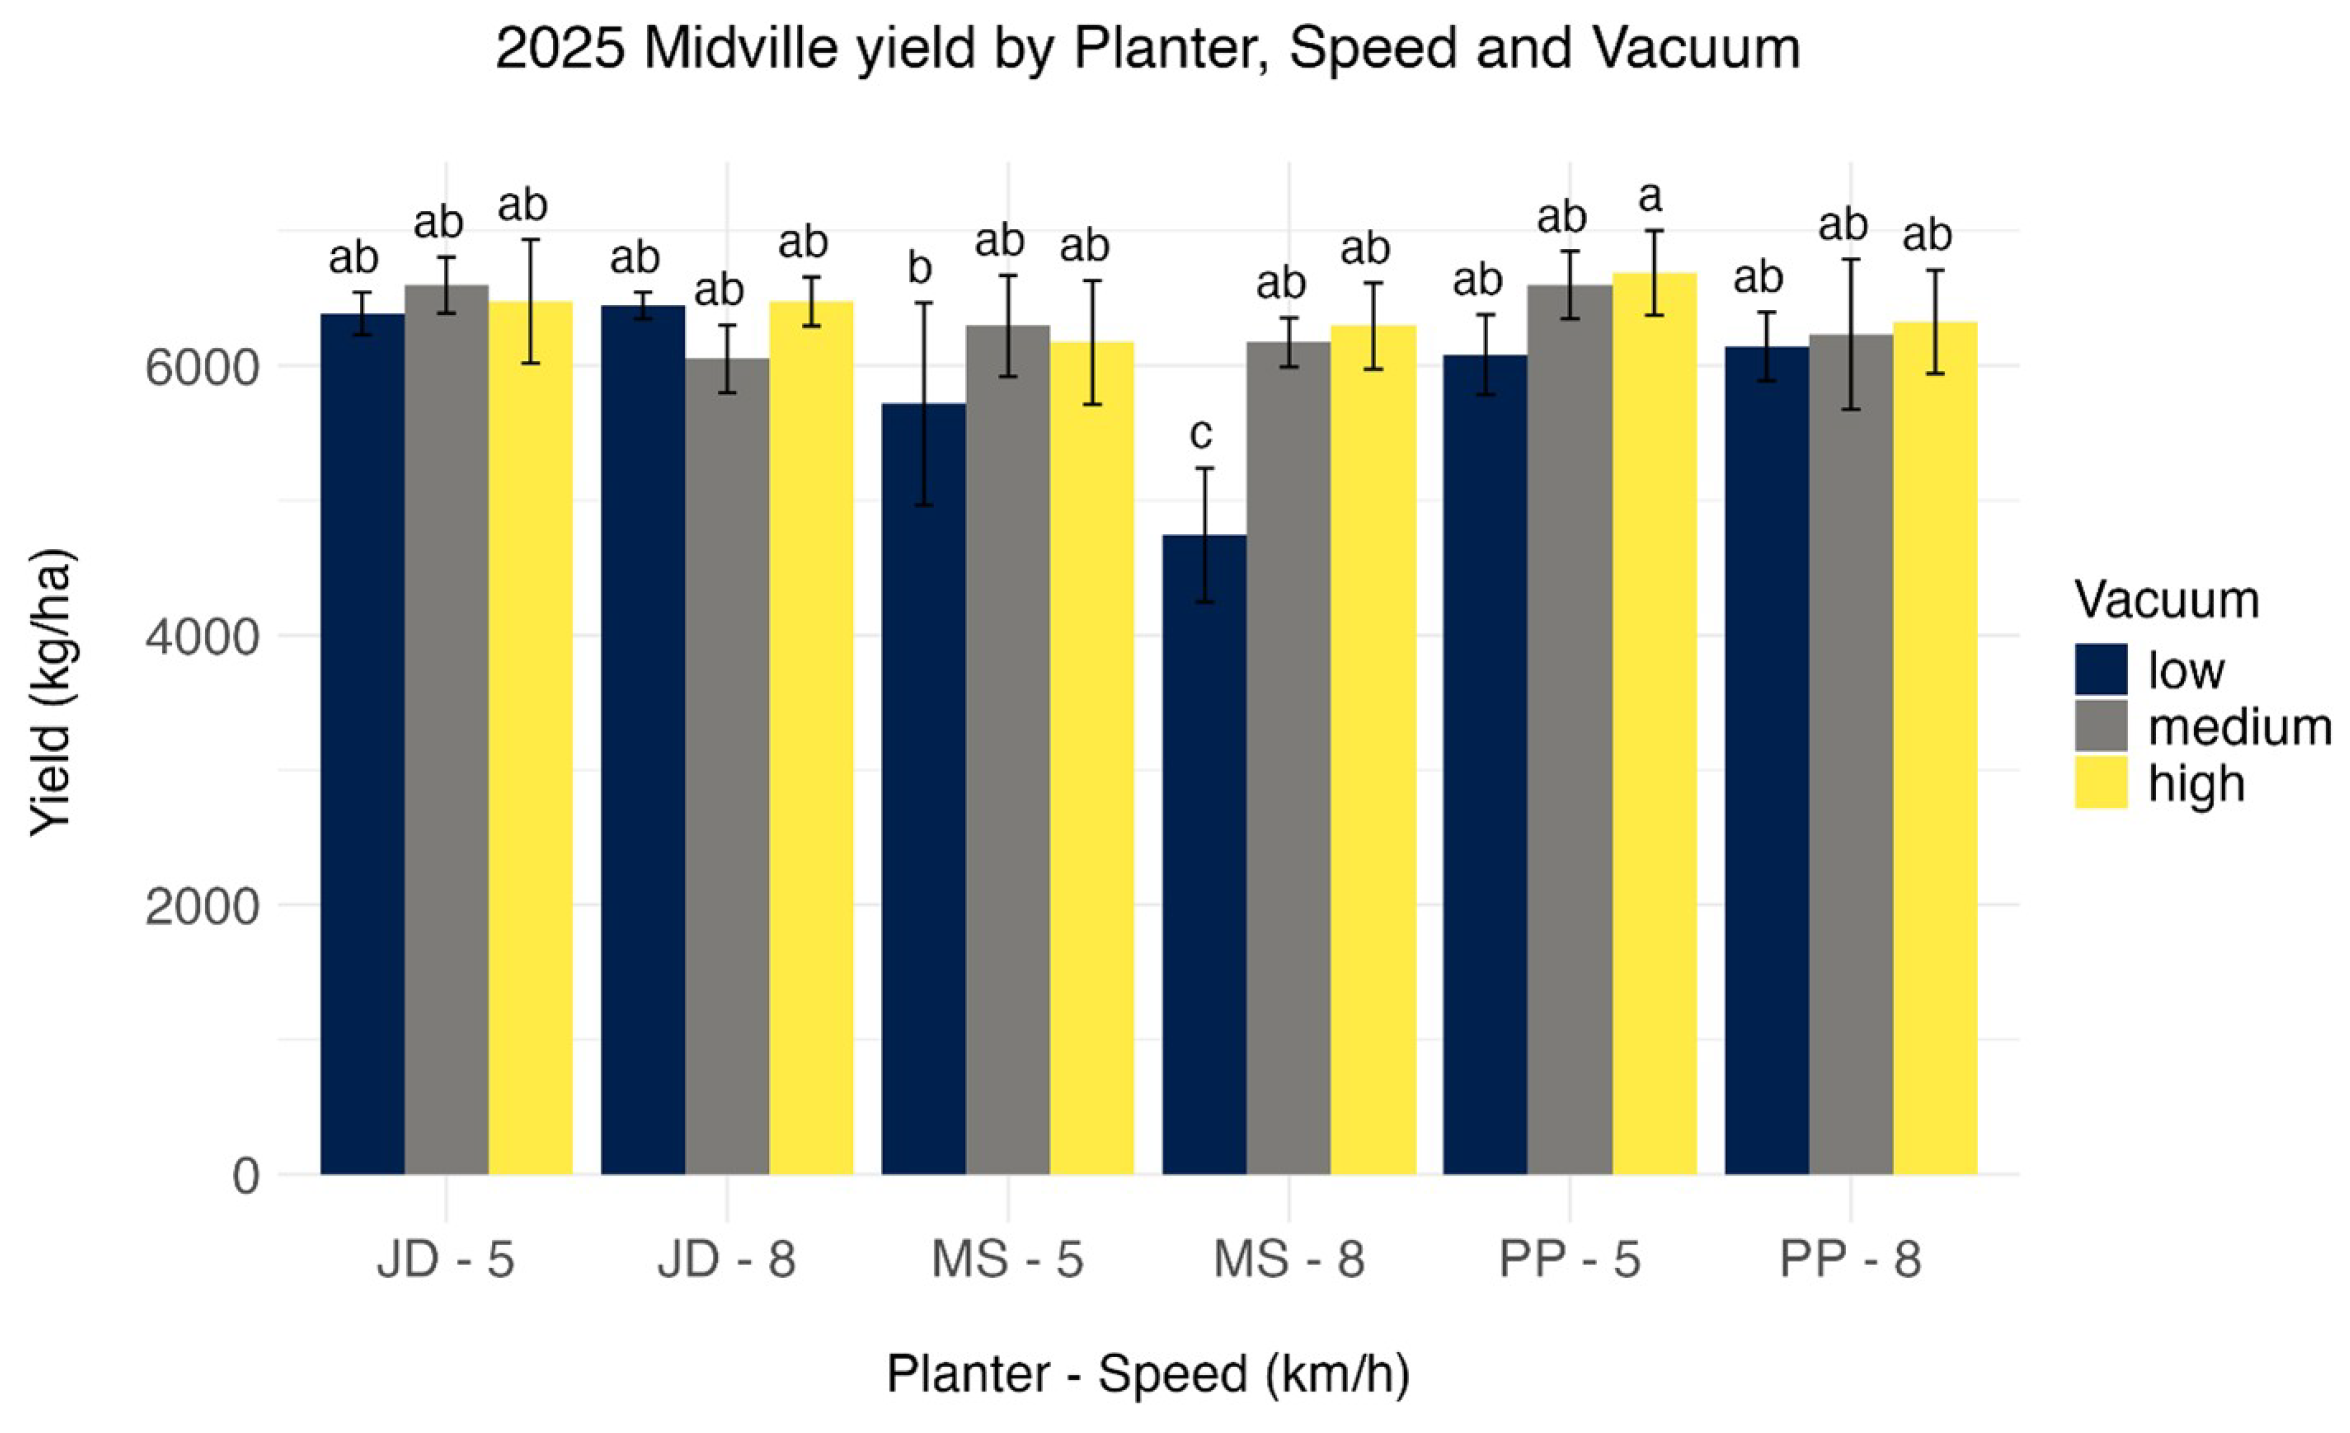
Yield results in 2025 at Midville were similar to those observed in 2024. Yield ANOVA showed significant planter, speed, and vacuum main effects together with significant planter × vacuum and planter × speed × vacuum interactions (Supplementary Table S11). The only treatment with a significantly lower yield was MS at 8 km h−1 with low vacuum, where the achieved population was approximately 30,000 plants ha−1 (Figure 15). These results indicate that peanut yield response to planting speed and vacuum was primarily mediated through achieved population rather than spacing uniformity, consistent with the compensatory growth capacity of peanuts.
Figure 15.
Yield by planter platform, planting speed, and vacuum level in Midville, GA, in 2025. Bars sharing a common letter are not significantly different at based on Tukey-adjusted mean separation. Error bars represent ±1 standard deviation.
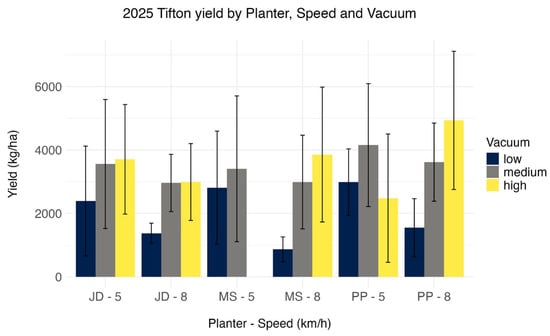
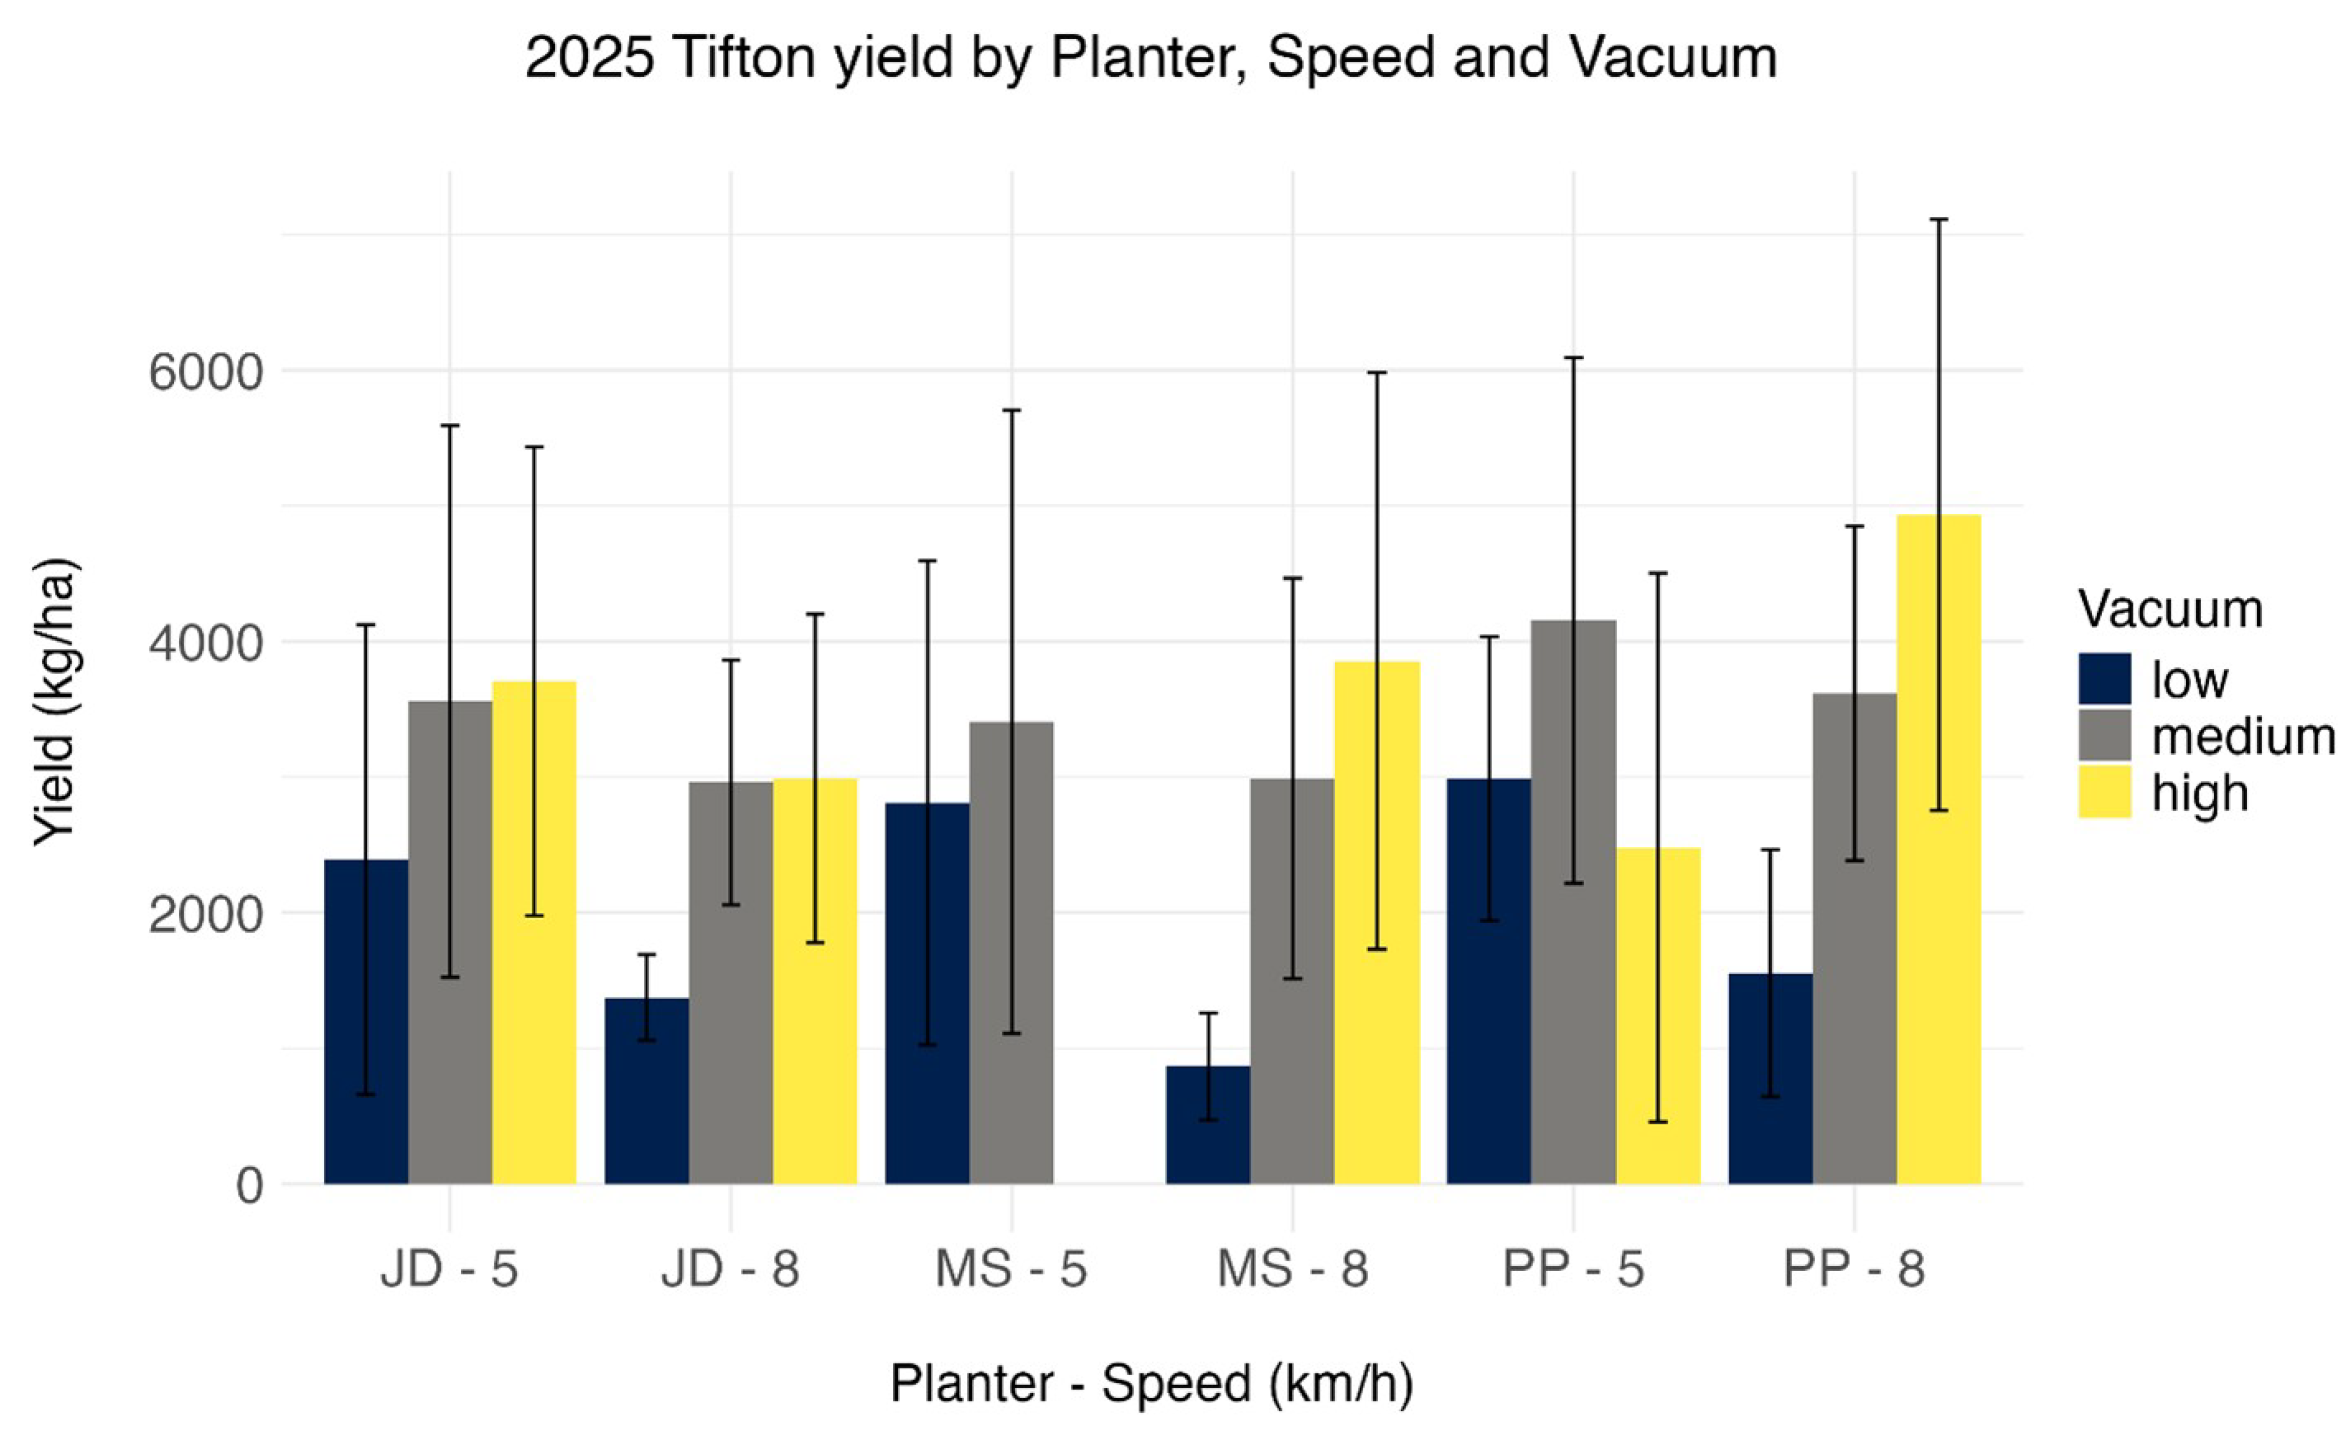
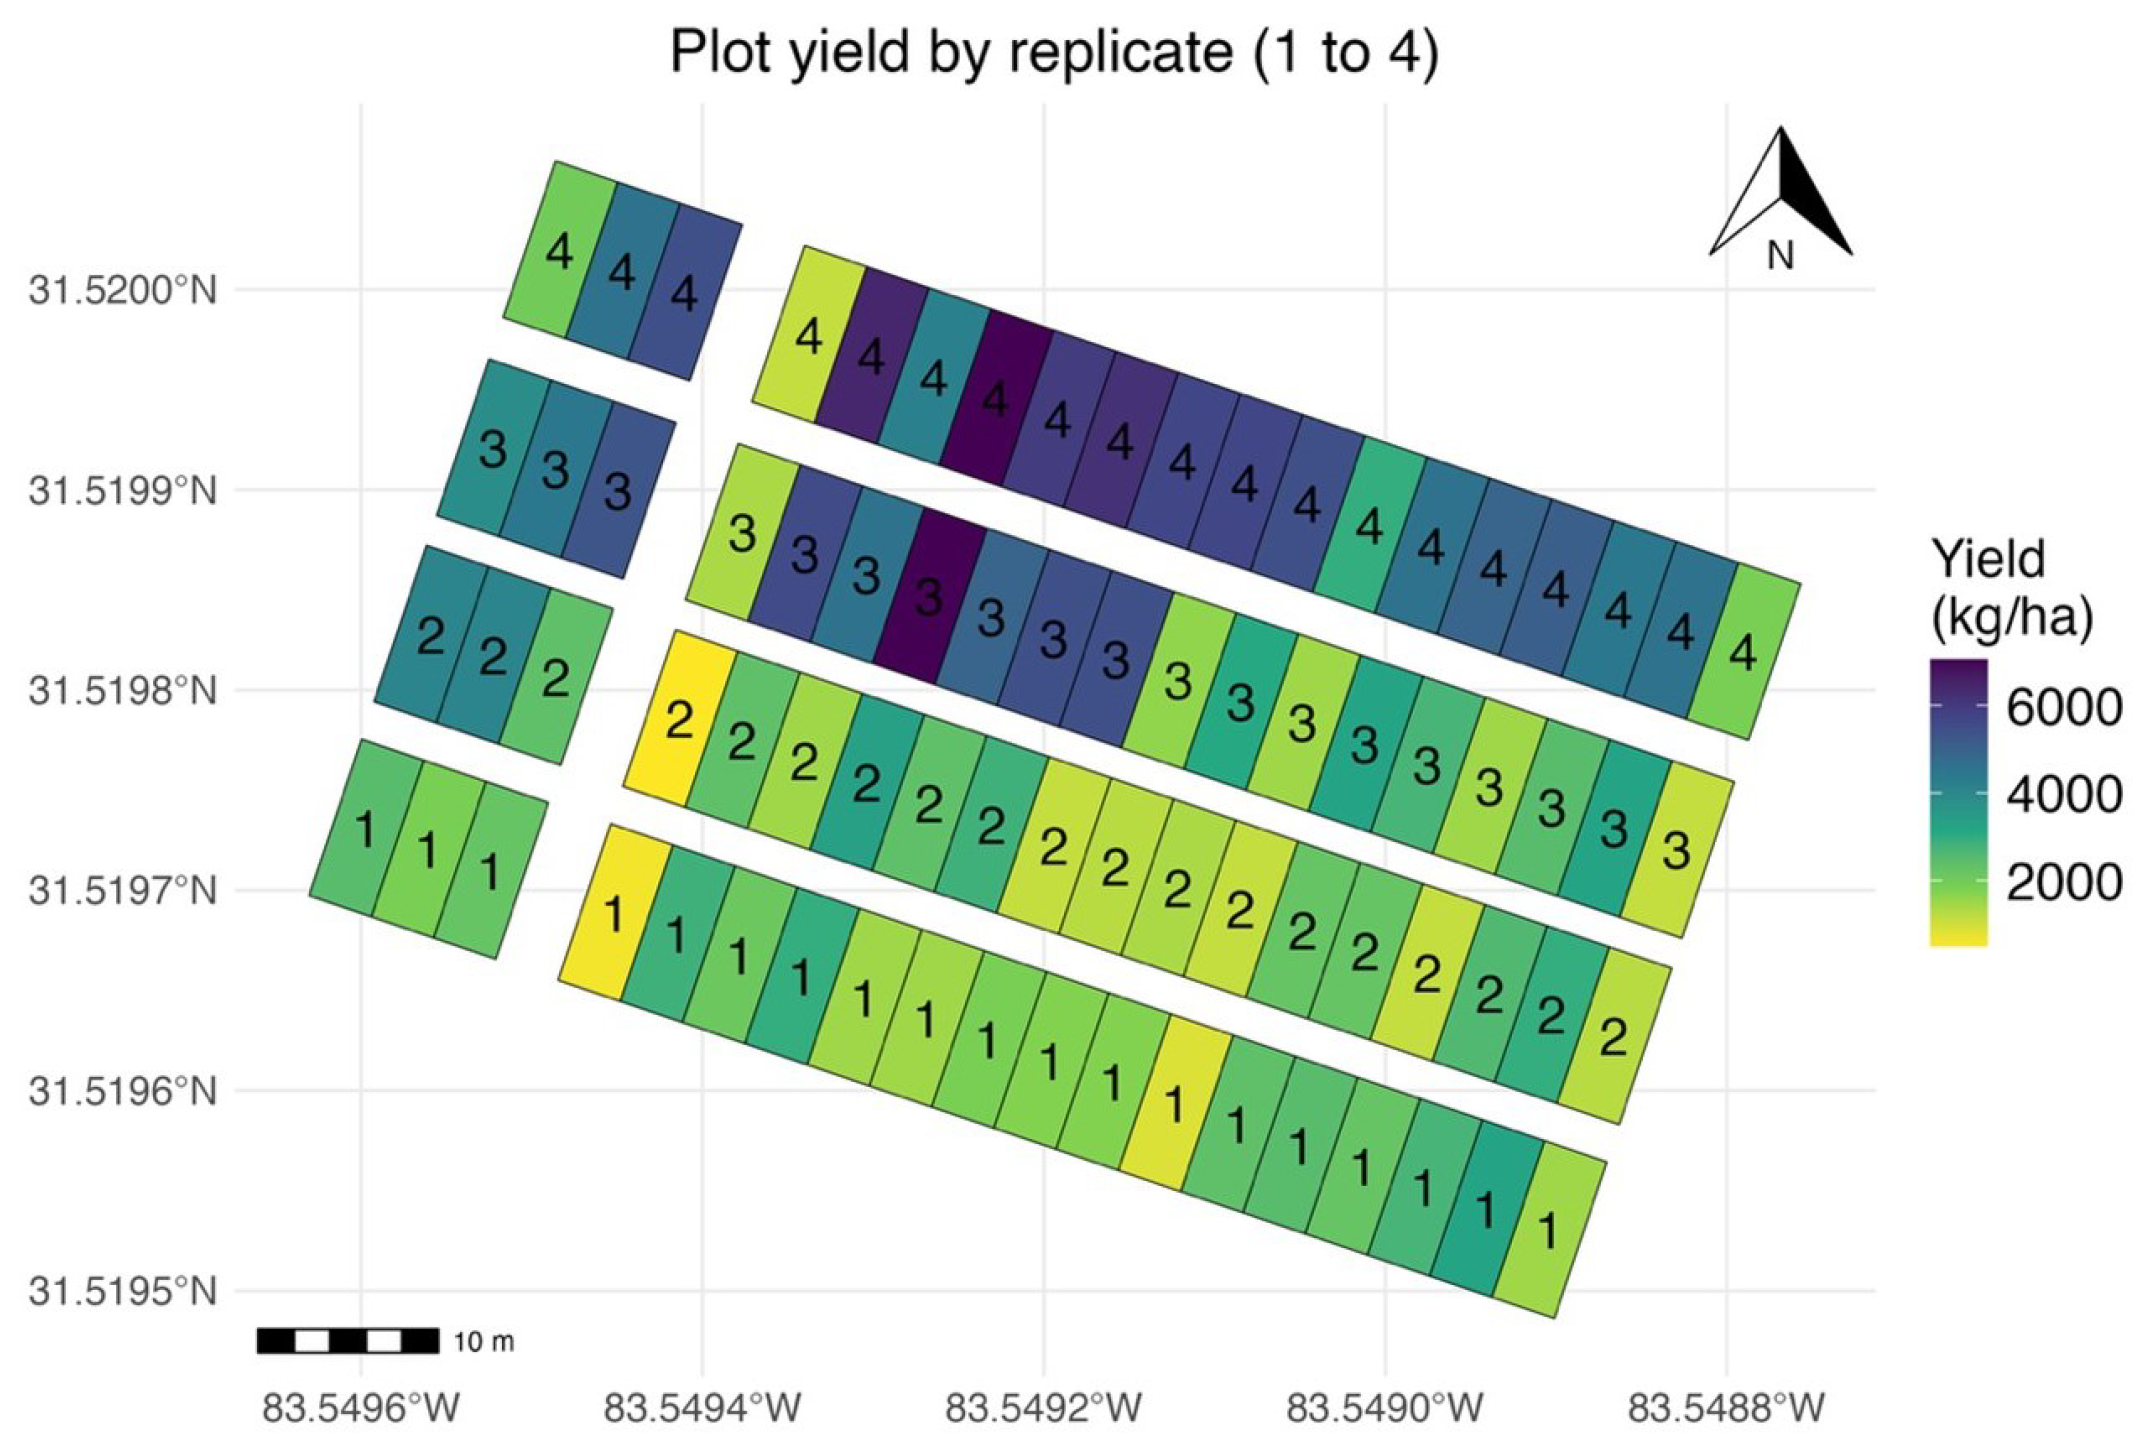
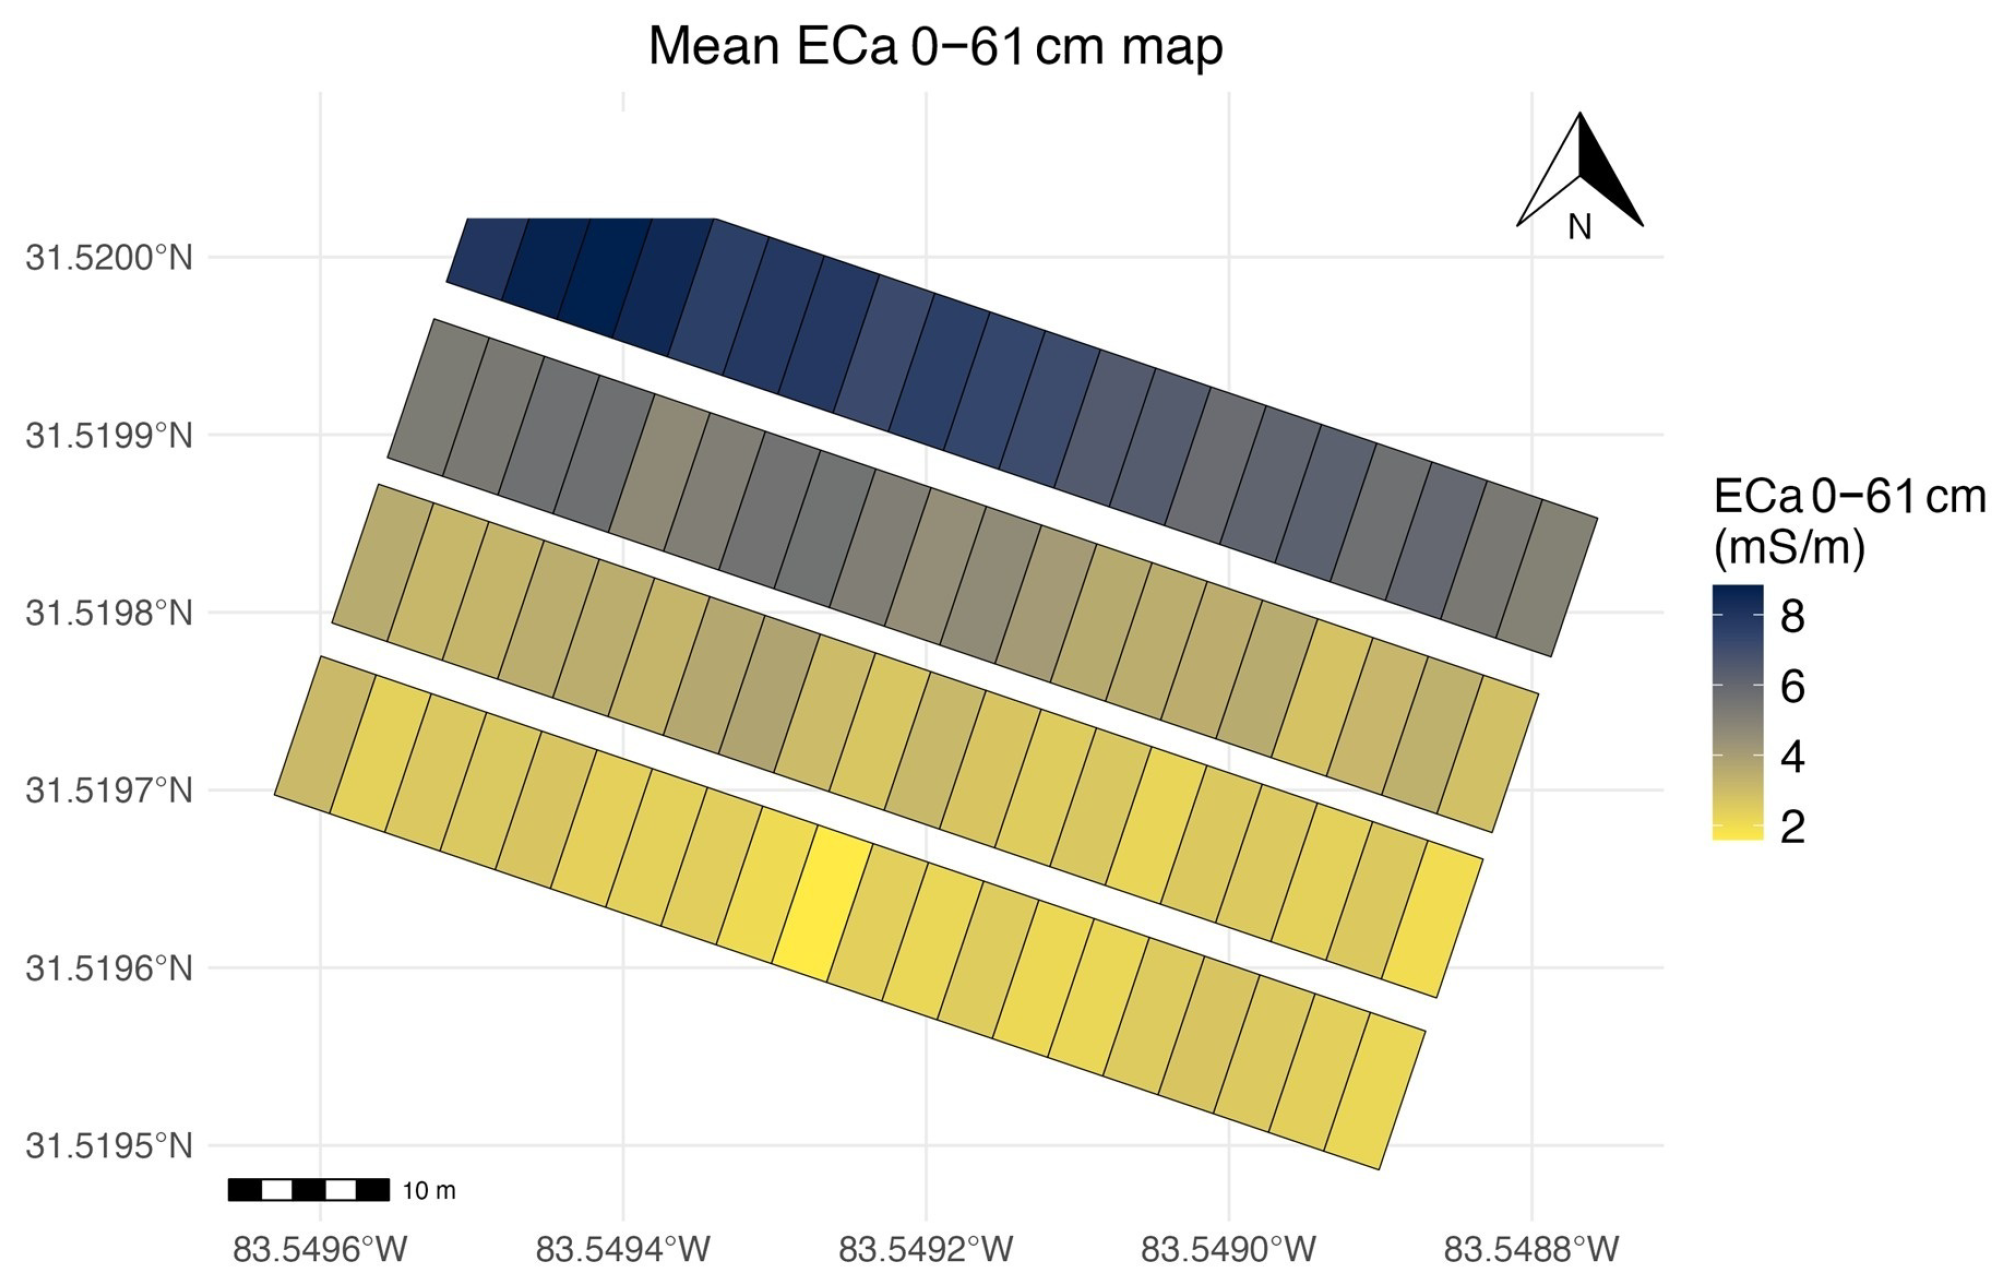
Yield data at Tifton were characterized by large standard deviations due to substantial spatial variability. ANOVA showed significant effects of speed, vacuum, and replication, and a significant speed × vacuum interaction, whereas planter and planter-involving interactions were not significant (Supplementary Table S14). Despite the variability, mean yield generally declined as planting speed increased and vacuum decreased, following trends observed in the achieved population (Figure 16). Plot-level yield variability is shown in Figure 17, and spatial variability in apparent soil electrical conductivity (ECa) is shown in Figure 18.
Figure 16.
Yield by planter platform, planting speed, and vacuum level in Tifton, GA, in 2025.
Figure 17.
Plot-level yield by replicate in Tifton, GA, in 2025.
Figure 18.
Mean apparent soil electrical conductivity (ECa) in the 0–61 cm soil profile at Tifton, GA.
3.3. Increased Vacuum Evaluation (2025)
3.3.1. Test Stand Evaluation
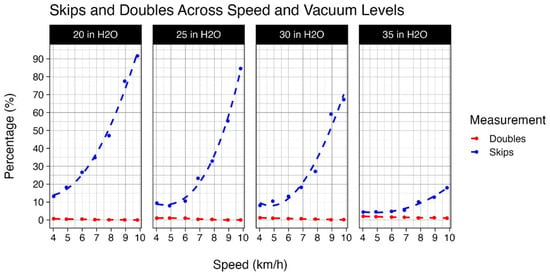
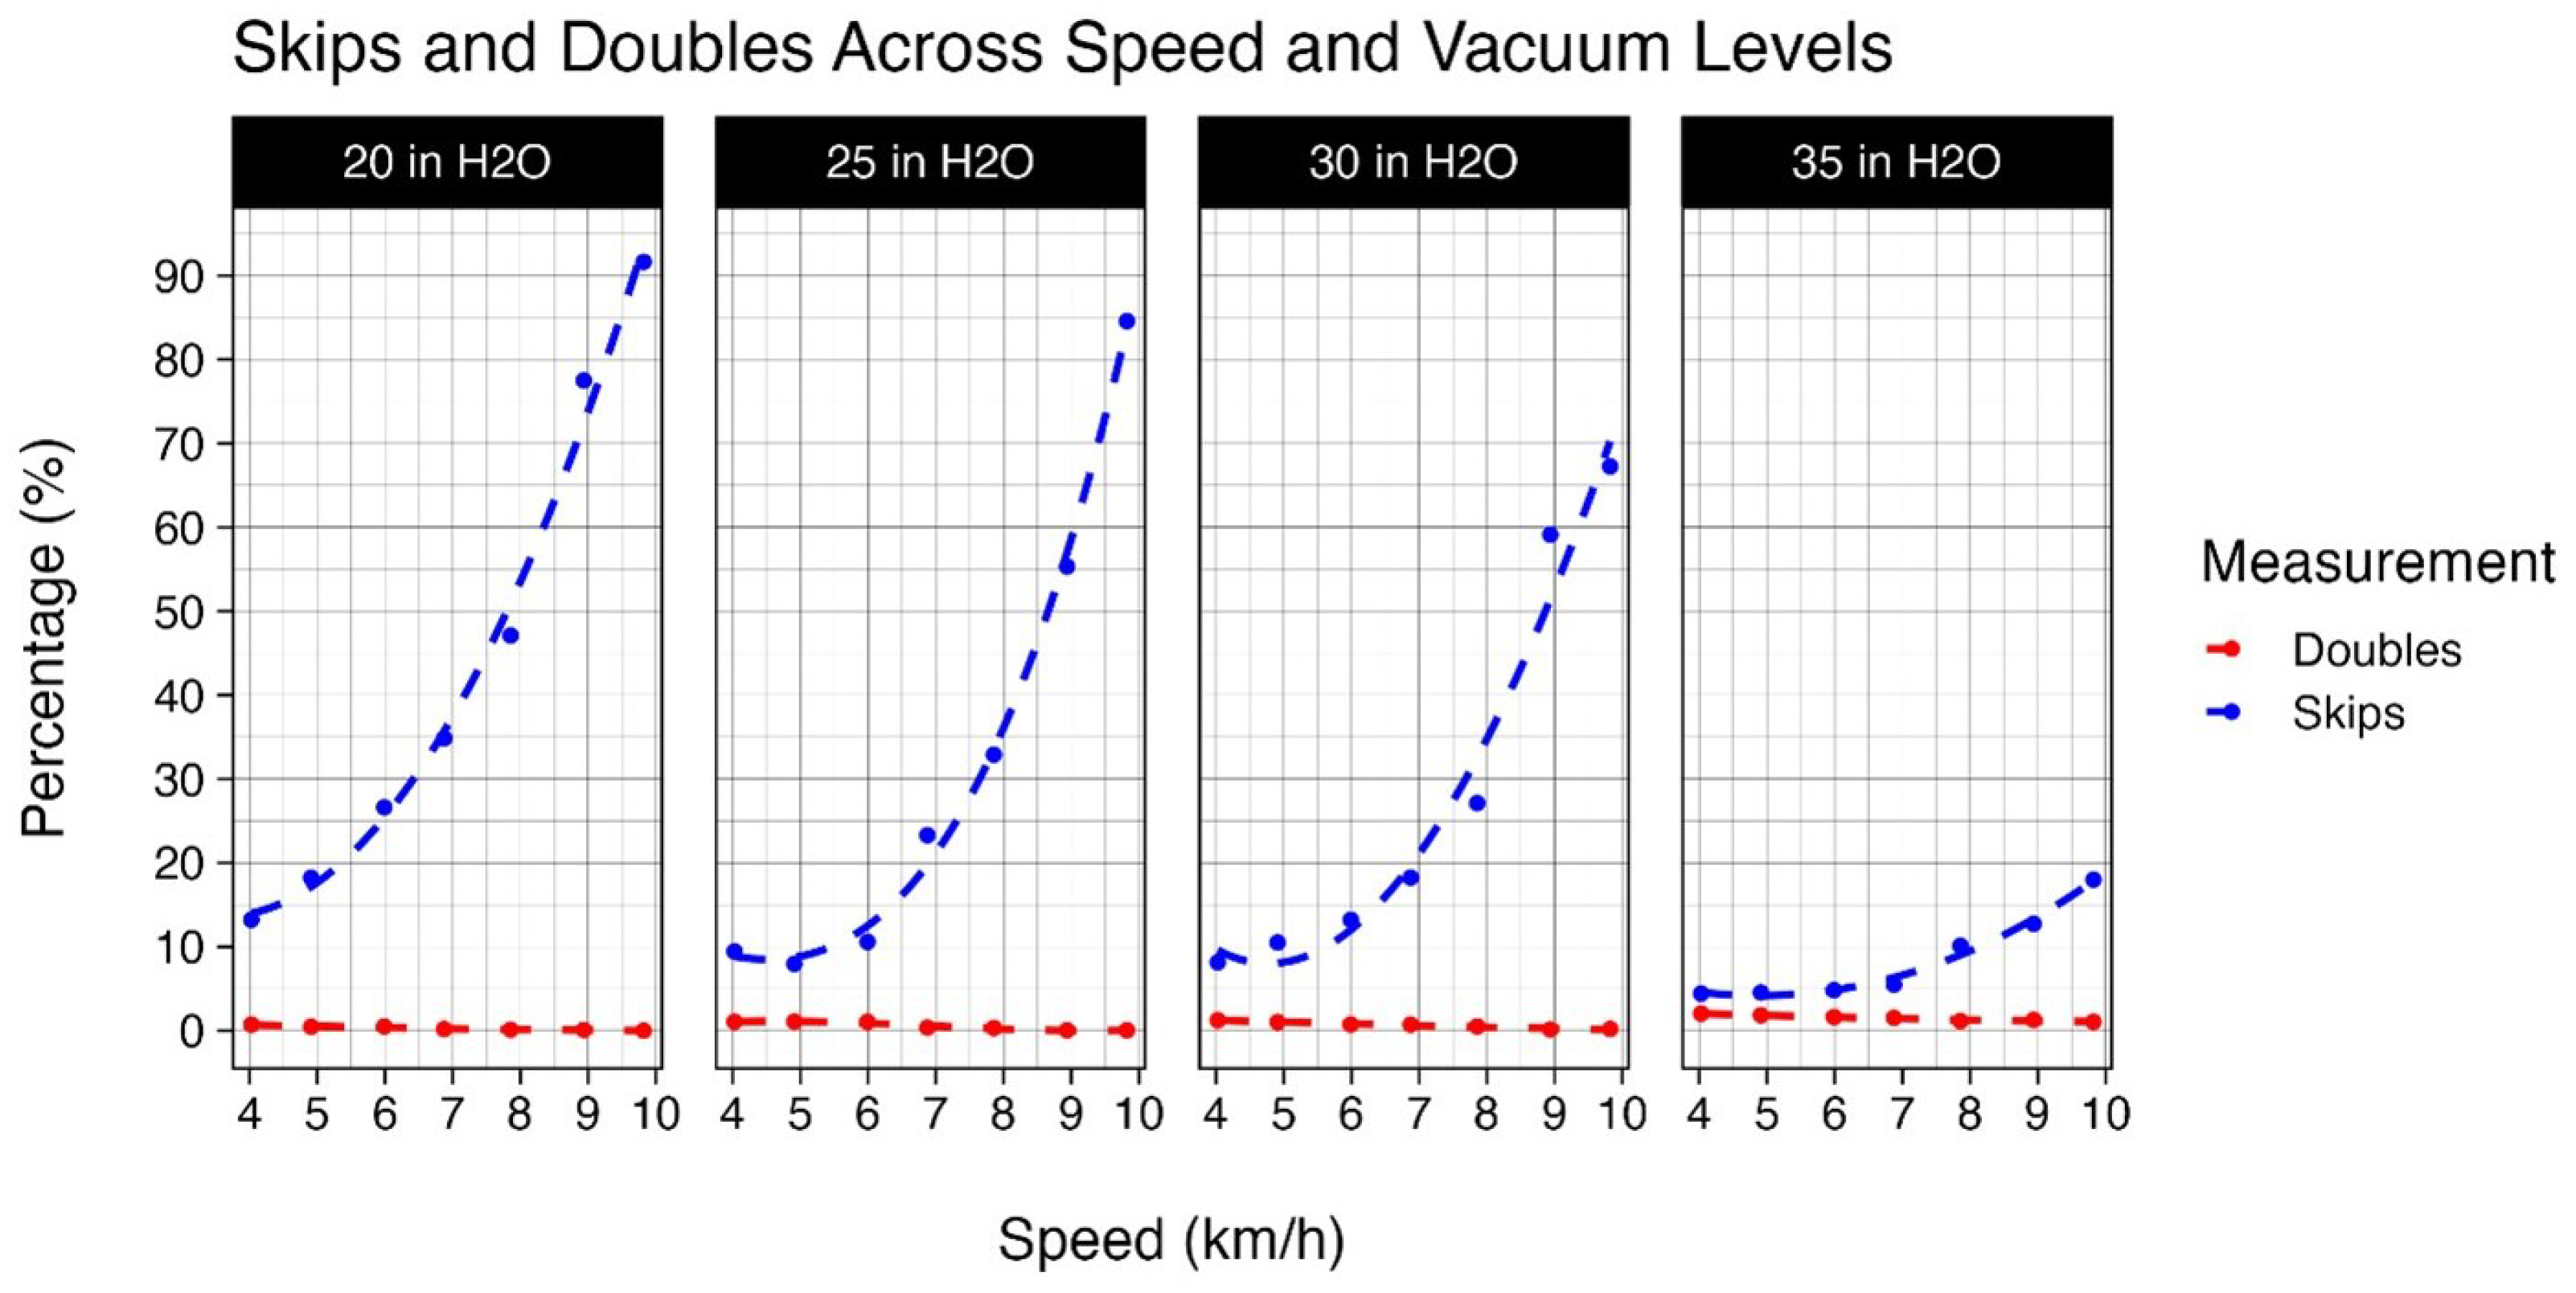
Laboratory evaluation of the Precision Planting vSet seed meter on a test stand showed that singulation performance improved as vacuum increased from 20 to 35 in H2O, primarily due to a reduction in skips (Figure 19).
Figure 19.
Percentage of skips and doubles by planting speed and vacuum level as measured on a Precision Planting test stand.
3.3.2. Field Evaluation
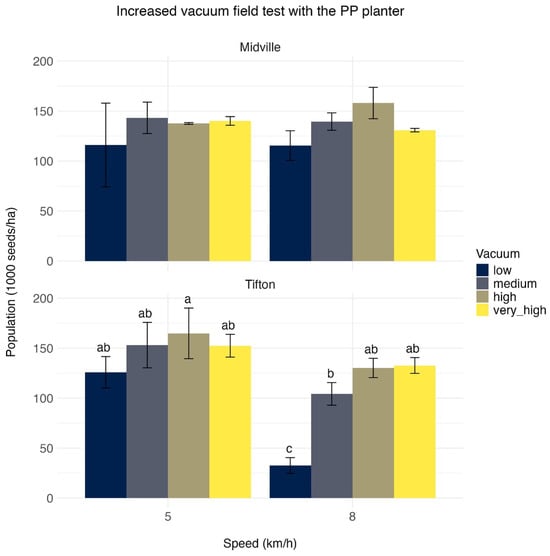
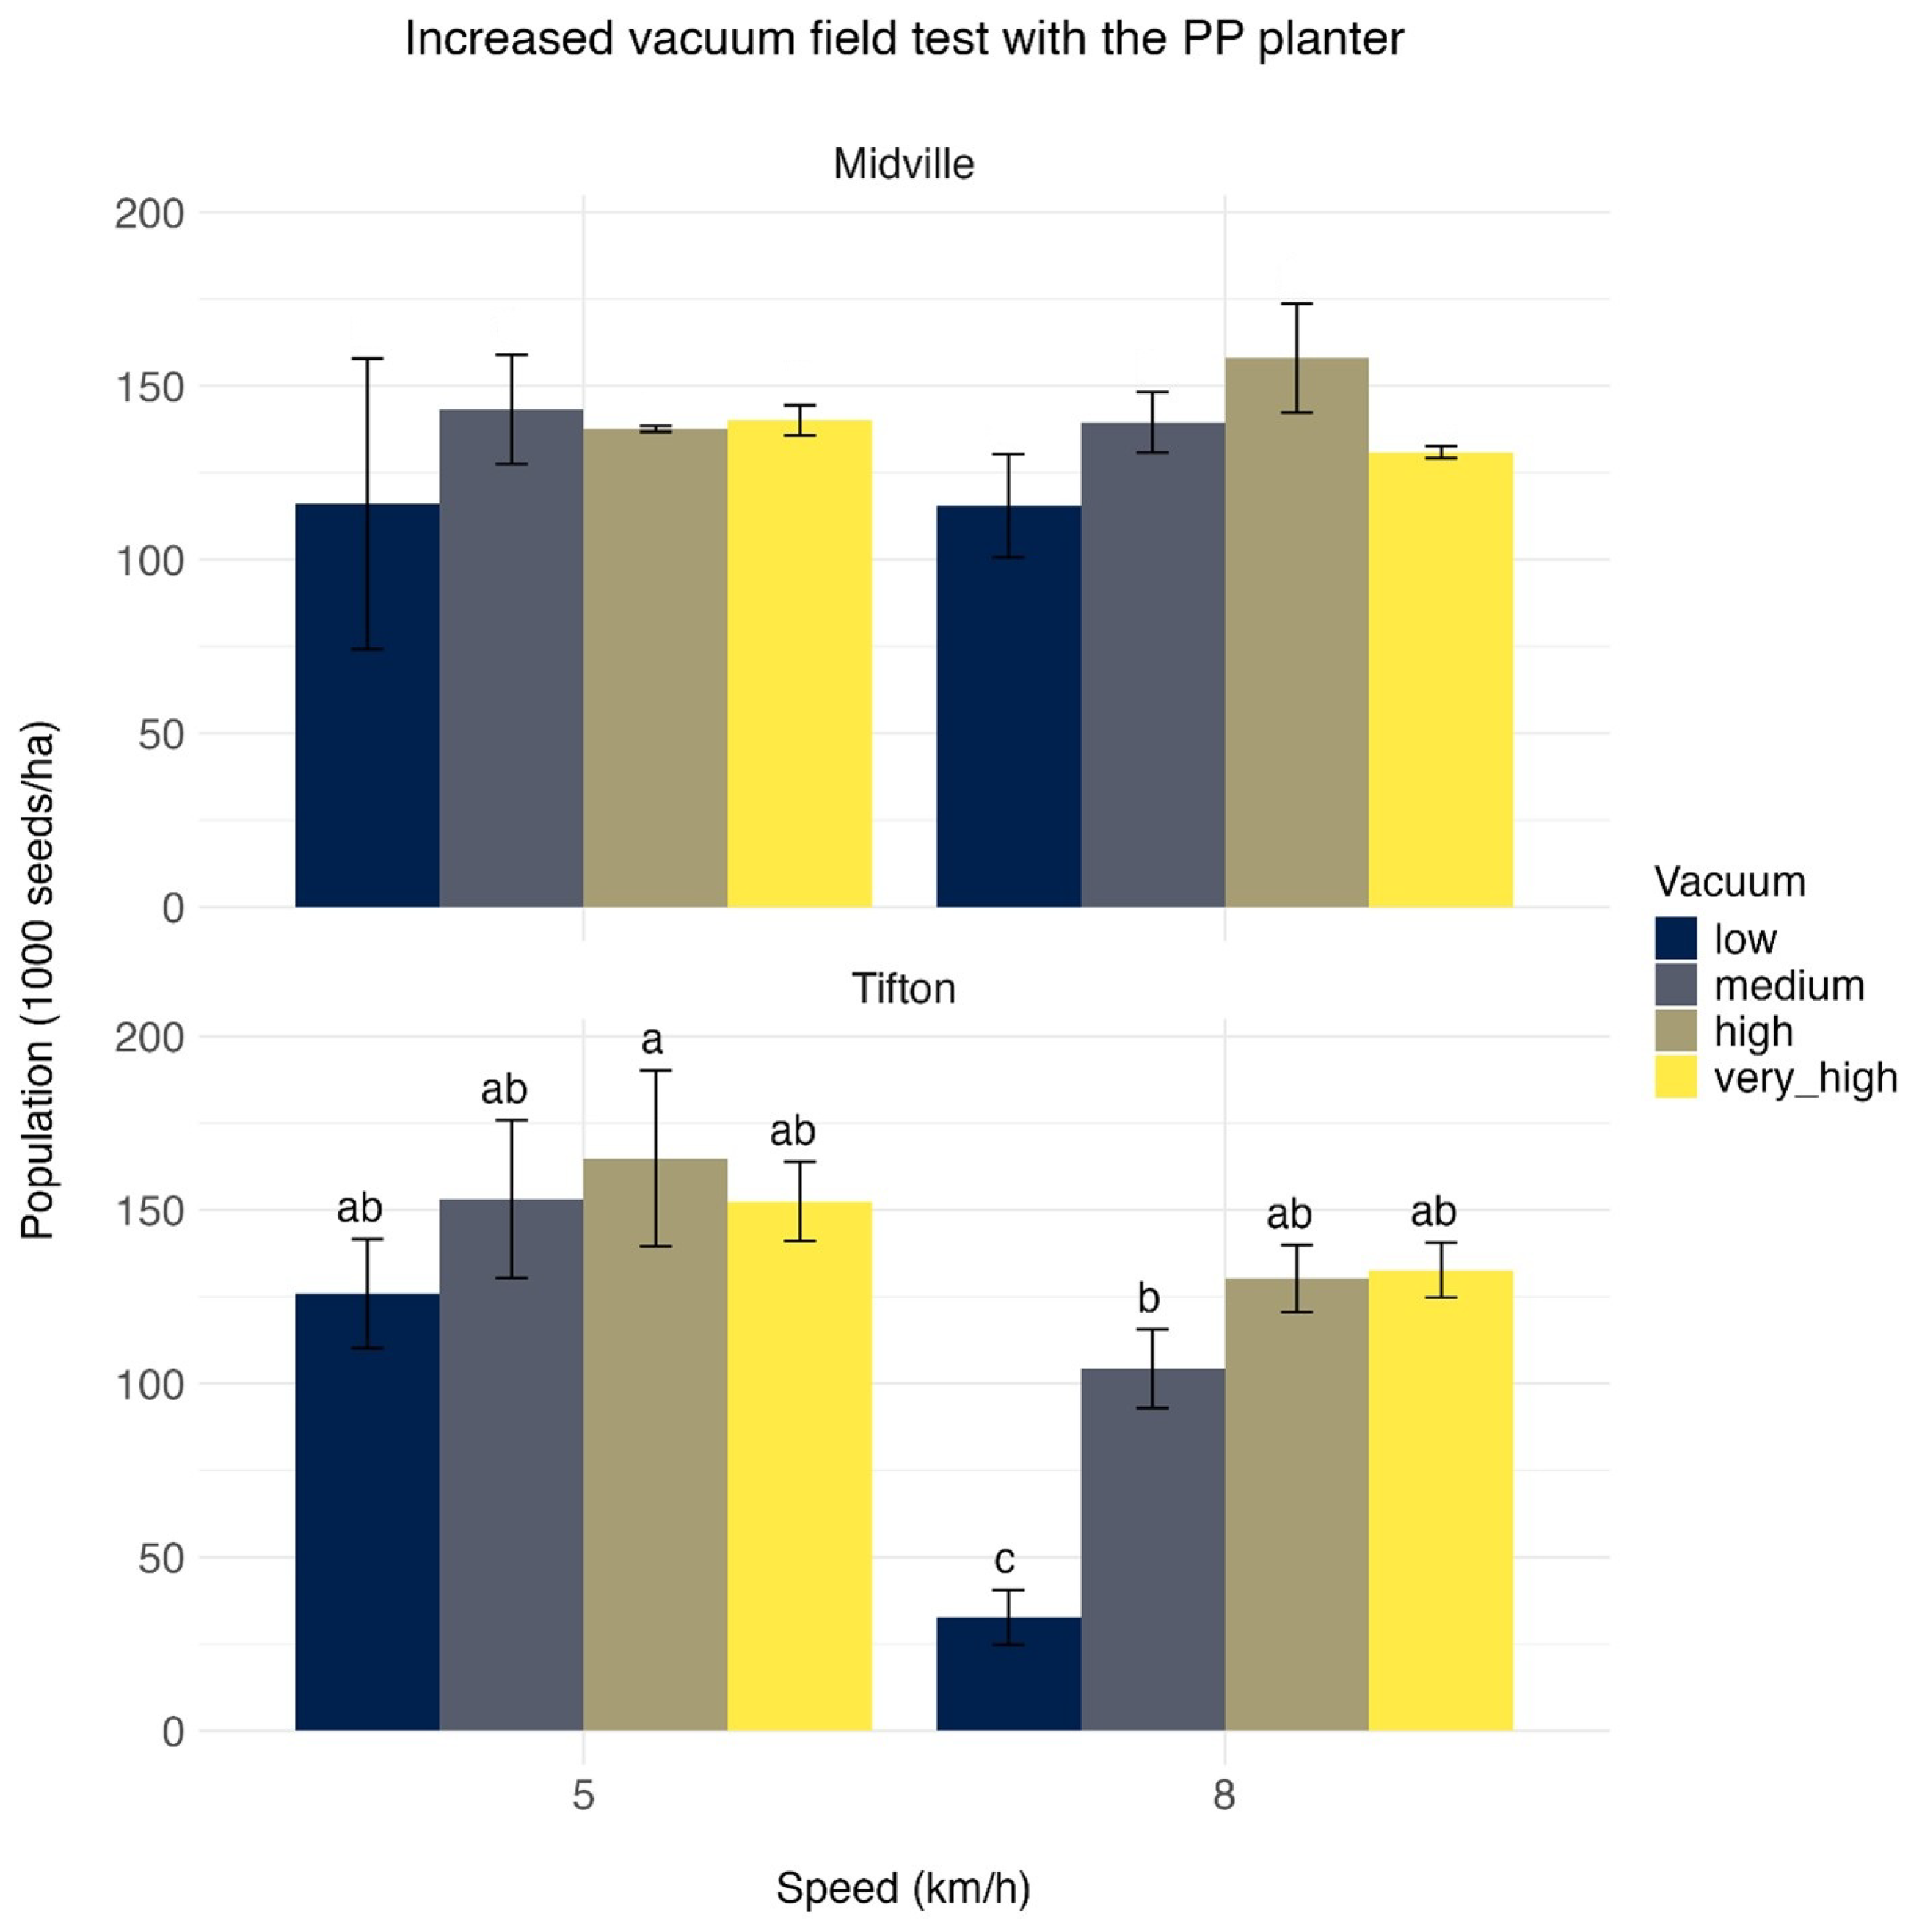
In field trials, increasing the vacuum beyond the standard high setting did not provide a consistent achieved-population benefit. Location-specific reruns showed a significant vacuum effect at Midville and significant speed, vacuum, and speed × vacuum effects at Tifton (Supplementary Tables S15 and S16). However, the very high setting did not outperform the standard high setting consistently across locations or speeds. At Midville, the 35 in H2O treatment closely matched the 30 in H2O treatment at 5 km h−1 but was lower at 8 km h−1; at Tifton, the 35 and 30 in H2O treatments were similar at both speeds (Figure 20). Therefore, no general field advantage of the very high setting was demonstrated under the tested conditions.
Figure 20.
Field evaluation of increased vacuum levels using the Precision Planting vSet planter in 2025. Letters denote Tukey groupings within each location × speed combination; bars sharing the same letter are not significantly different at based on Tukey-adjusted mean separation. Error bars represent ±1 standard deviation. Corresponding ANOVA results and treatment means are reported in Supplementary Tables S15 and S16.
4. Discussion
4.1. Dominant Influence of Planting Speed and Vacuum on Peanut Stand Establishment
Across site-years, peanut stand establishment was more strongly influenced by planting speed and vacuum level than by downforce. Lower planting speeds (5 km h−1) consistently produced higher achieved populations, while increases in speed were associated with reduced emergence, particularly when vacuum levels were insufficient. These findings align with prior peanut metering studies showing that seed discharge performance degrades as meter rotational speed increases and adequate vacuum becomes harder to maintain [2,3], as well as with the available UGA field precursor studies in single-row peanut [6,7].
Vacuum level played an important role in maintaining seed pickup, especially in the planter × speed × vacuum trials. Higher planter-specific vacuum settings generally increased achieved population, whereas reduced vacuum exacerbated stand loss at higher planting speeds. This response reflects the physical characteristics of peanut seed—large mass, irregular shape, and limited contact area with the seed plate—which increase the likelihood of skips when pickup forces are insufficient [1,2,3]. At the same time, low, medium, and high vacuum labels in this study represent planter-specific nominal field settings, rather than physically identical suction intensities across machines.
4.2. Limited and Inconsistent Effects of Downforce in Peanut
Downforce effects on achieved population were minor and inconsistent relative to speed and vacuum effects. In the speed × downforce trials, changes in downforce rarely resulted in statistically significant differences in emergence, except under specific high-speed conditions. This outcome is consistent with the available UGA field precursor studies, in which downforce effects on peanut stand were smaller and less consistent than speed-related effects [6,7].
The limited response to downforce suggests that peanut stand establishment was more constrained by seed pickup and seed delivery than by depth control under the tested conditions. Within the evaluated range, downforce did not function as a rescue lever for stand loss caused by excessive speed or insufficient vacuum. From a practical standpoint, this means that speed and vacuum should be prioritized before further adjustment of downforce.
4.3. Planter-Platform Response to Speed and Vacuum
Planter platforms that differed in seed meter drive system, row-unit design, downforce mechanism, and monitor technology responded differently to changes in speed and vacuum. Ground-driven meters showed greater sensitivity to both factors, with achieved population declining rapidly as speed increased or vacuum decreased. In contrast, hydraulic- and electric-driven meters were generally less sensitive to speed and vacuum changes and maintained acceptable stand establishment at planting speeds up to 8 km h−1.
This behavior is consistent with the expected differences in how meter rotational speed is controlled in ground-driven versus hydraulic- or electric-driven systems [7,9,14]. However, the compared machines also differed in row-unit design, downforce mechanism, and monitor technology, and the JD configuration differed between Midville and Tifton in 2025. Accordingly, these results are best interpreted as planter-platform responses under field conditions rather than as isolated causal effects of meter drive alone. Even with that limitation, the field pattern remains practically useful: the hydraulic and electric platforms were less sensitive to speed and vacuum changes than the ground-driven platform.
4.4. Spacing Uniformity Remains a Limiting Factor in Peanut
Despite differences in achieved population among treatments, spacing uniformity remained poor across all planters and operating conditions [15]. In most cases, plants classified as skips and long skips outnumbered perfectly spaced plants, even at low speeds and high vacuum levels. These results suggest that peanut singulation challenges persist regardless of planter configuration.
The prevalence of skips suggests that peanut planting performance remains constrained by seed geometry and seed pickup limitations rather than by delivery precision alone. Because spacing was measured after emergence, the reported spacing classes reflect the final plant distribution rather than a direct trace of meter output. Accordingly, spacing metrics in this study should be interpreted as indicators of combined metering and establishment limitations, not as direct predictors of yield response under field conditions. The same conclusion held under the narrower 80–120% TPS sensitivity window; across the site-years with raw position data, the best treatment means remained below 20%.
4.5. Yield Compensation Masks Moderate Stand Loss
Peanut yield responses were often insensitive to moderate reductions in achieved population. In multiple site-years, treatments with substantially lower stand counts produced yields comparable to higher-population treatments, indicating compensatory branching and pod set. Yield reductions were observed primarily when stand loss was severe, consistent with prior reports that peanut yield can compensate across a wide range of plant populations [10,11].
This compensatory capacity complicates the interpretation of planting performance because improvements in emergence or spacing do not necessarily translate into yield gains. Consequently, planter setting decisions in peanuts should balance the goal of maximizing the achieved population against the reality that yield responses may be limited until a critical stand threshold is crossed. Given the high spatial variability observed at some site-years, particularly at Tifton, the absence of statistically significant yield differences should not be interpreted as evidence of agronomic equivalence among treatments.
4.6. Increased Vacuum Beyond Standard Field Settings Did Not Provide a Reliable Field Benefit
Although laboratory test-stand evaluations showed improved singulation as vacuum increased beyond standard field settings, these gains did not consistently translate to improved field performance. In the field trials, the very-high vacuum setting did not provide a consistent achieved-population advantage relative to the standard high setting. Under the tested conditions, increasing vacuum beyond the standard high-field setting, therefore, did not justify a general recommendation. This conclusion is intentionally narrow. The available field data support the statement that test-stand improvement at very high vacuum did not consistently improve final stand in the field; they do not support a stronger mechanistic explanation for why that occurred.
4.7. Study Limitations and Scope of Inference
Several limitations affect the scope of inference. The strip layout was systematic rather than fully randomized, and the four plots within a strip were spatial subsamples rather than fully independent experimental units. Adjacent strips may therefore have shared soil conditions. ECa mapping in the spatially variable 2025 Tifton field helped document spatial heterogeneity, but consistent plot-level covariate files were not available for retained site-year analyses across the archived site-years. Archived lot-specific germination, vigor, moisture, size class, and certification records were not consistently recoverable across the 2022–2025 site years. The only recoverable baseline germination record was the 2025 Midville certified seed tag, which identified Georgia-06G seed with 79% germination from an April 2025 test. Comparable lot-specific records were not recoverable for 2022–2024 or for the 2025 Tifton lot, so seed-quality effects could not be evaluated directly. Planter comparisons were confounded by machine-level differences beyond the seed meter drive system. Vacuum treatments were planter-specific nominal setpoints read from planter vacuum gauges, and planting speed was interpreted from nominal target settings because continuous in-pass vacuum traces and complete travel-speed logs were not archived for the retained analyses. Finally, spacing was measured after emergence, so it should be interpreted as the final plant distribution rather than as a direct singulation trace.
These limitations do not remove the practical value of the study, but they do narrow the claims that can be made. The results support within-site-year treatment comparisons and a qualitative synthesis across years. They do not support strong pooled inference across all environments or strict component-level attribution of planter differences to meter drive alone.
4.8. Practical Implications for Peanut Planting Operations
Collectively, these results indicate that peanut planting performance is primarily constrained by seed singulation rather than by downforce within the tested range. Across the evaluated conditions, 5 km h−1 remained the most reliable operating speed when the primary objective was to maximize final stand. For the ground-driven platform, low vacuum was consistently risky, especially at 8 km h−1, and should be avoided when stand preservation is important. The excluded Tifton slip event also showed that loss of reliable drive-wheel contact can become an additional operational failure mode in ground-driven systems. Hydraulic- and electric-driven platforms tolerated 8 km h−1 better than the ground-driven system, but they did not eliminate the spacing problem; their main benefit was operational flexibility, not consistently greater yield.
From an economic standpoint, the present results suggest that the value of hydraulic- or electric-driven systems in peanuts is more likely to come from reduced stand-loss risk and greater planting flexibility during narrow planting windows than from a guaranteed yield increase. Future advances in peanut planting are therefore more likely to come from improved seed-metering solutions for large, irregular seed than from downforce adjustment alone or from simply increasing vacuum [3].
5. Conclusions
Field experiments conducted between 2022 and 2025 evaluated the effects of planting speed, row-unit downforce, vacuum level, and planter platform on peanut stand establishment, spacing uniformity, and yield in single-row production systems. Based on these multi-year results, the following conclusions can be drawn:
- Planting speed and vacuum level were the primary factors influencing achieved peanut population, whereas downforce had a minor and inconsistent effect within the tested ranges.
- Across the tested conditions, 5 km h−1 remained the most reliable operating speed for maximizing final stand.
- Higher planter-specific vacuum settings generally improved achieved population, particularly for the ground-driven planter, whereas low vacuum at 8 km h−1 was consistently risky.
- Hydraulic- and electric-driven planter platforms were less sensitive to speed and vacuum changes than the ground-driven platform and more often maintained acceptable stands at 8 km h−1, providing greater operational flexibility during narrow planting windows.
- Spacing uniformity remained poor across all planters and operating conditions, with skips and long skips common across treatments.
- Peanut yield was often insensitive to moderate reductions in achieved population; yield penalties became more evident only when stand loss was severe.
- Increasing the vacuum beyond the standard high field setting improved test-stand singulation but did not provide a consistent field benefit under the tested conditions.
Overall, these results indicate that improvements in peanut planting performance are more likely to arise from better seed-metering technology than from downforce adjustment alone or from pushing vacuum beyond current standard field settings. For growers, the main value of hydraulic- and electric-driven systems in peanut appears to be greater planting flexibility and reduced stand-loss risk rather than a guaranteed yield increase.
Supplementary Materials
The following supporting information can be downloaded at: https://www.mdpi.com/article/10.3390/agriengineering8040144/s1. Table S1: 2022 Midville—achieved population (A. ANOVA results; B. Treatment means); Table S2: 2022 Plains—achieved population (A. ANOVA results; B. Treatment means); Table S3: 2022 Midville—yield (A. ANOVA results; B. Treatment means); Table S4: 2023 Midville—achieved population (A. ANOVA results; B. Treatment means); Table S5: 2023 Midville—yield (A. ANOVA results; B. Treatment means); Table S6: 2024 Midville—achieved population (A. ANOVA results; B. Treatment means); Table S7: 2024 Midville—perfect spacing (%) (A. ANOVA results; B. Treatment means); Table S8: 2024 Midville—yield (A. ANOVA results; B. Treatment means); Table S9: 2025 Midville—achieved population (A. ANOVA results; B. Treatment means); Table S10: 2025 Midville—perfect spacing (%) (A. ANOVA results; B. Treatment means); Table S11: 2025 Midville—yield (A. ANOVA results; B. Treatment means); Table S12: 2025 Tifton—achieved population (A. ANOVA results; B. Treatment means); Table S13: 2025 Tifton—perfect spacing (%) (A. ANOVA results; B. Treatment means); Table S14: 2025 Tifton—yield (A. ANOVA results; B. Treatment means); Table S15: 2025 Midville—PP high-vacuum comparison (achieved population) (A. ANOVA results; B. Treatment means); Table S16: 2025 Tifton—PP high-vacuum comparison (achieved population) (A. ANOVA results; B. Treatment means); Table S17: Model diagnostics summary.
Author Contributions
Conceptualization, M.T. and W.P.; methodology, W.P. and H.M.; investigation, M.T.; data curation, M.T.; formal analysis, M.T. and H.M.; writing—original draft preparation, M.T. and H.M.; writing—review and editing, H.M., W.P., L.C.H., W.S.M., N.D.F. and G.R.; supervision, W.P. All authors have read and agreed to the published version of the manuscript.
Funding
This work was supported by the Southern Peanut Research Initiative–National Peanut Board and Georgia Peanut Commission (award numbers: AWD00014838; AWD00019648; AWD00016439; AWD00013309; AWD00012329).
Data Availability Statement
Data are available from the corresponding author upon reasonable request.
Acknowledgments
This work was supported by the Dual MS program in Sustainable Agriculture between the University of Georgia (USA) and the University of Padova (Italy). The authors acknowledge technical support from University of Georgia research staff and collaborators.
Conflicts of Interest
The authors declare no conflict of interest.
References
- UGA Extension Peanut Team. Peanut Production Guide. 2022. Available online: https://peanuts.caes.uga.edu/resources.html (accessed on 18 December 2025).
- Da Costa, E.; Yazgi, A. Mathematical Modelling and Optimization of Seed Metering Unit Performance in Precision Peanut Seeding. Appl. Sci. 2024, 14, 7525. [Google Scholar] [CrossRef] [Scilit]
- Guo, P.; Sun, B.; Shang, S.; Hou, J.; Wang, D.; Zhao, Z.; Elshafie, A.; Zheng, X.; Eltoum, F. Effect of Auxiliary Air-Suction Seed-Filling Structure on Seed Discharge Performance of Peanut High-Speed Seed-Metering Machine. Agriculture 2025, 15, 1678. [Google Scholar] [CrossRef] [Scilit]
- Staggenborg, S.A.; Taylor, R.K.; Maddux, L.D. Effect of Planter Speed and Seed Firmers on Corn Stand Establishment. Appl. Eng. Agric. 2004, 20, 573–580. [Google Scholar] [CrossRef] [Scilit]
- Abdolahzare, Z.; Mehdizadeh, S.A. Real time laboratory and field monitoring of the effect of the operational parameters on seed falling speed and trajectory of pneumatic planter. Comput. Electron. Agric. 2018, 145, 187–198. [Google Scholar] [CrossRef] [Scilit]
- Godwin, H.B. Peanut Plant Stand Issues Resulting from Tractor Speed and Downforce at Planting and Physical Damage. Doctoral Dissertation, University of Georgia, Athens, GA, USA, 2022. [Google Scholar]
- Russell, A. An Investigation of Planting Components in Corn and Peanut. Master’s Thesis, University of Georgia, Athens, GA, USA, 2023. [Google Scholar]
- Strasser, R.; Badua, S.A.; Sharda, A.; Mangus, D.; Haag, L. Performance of Planter Electric-Drive Seed Meter during Simulated Planting Scenarios. Appl. Eng. Agric. 2019, 35, 925–935. [Google Scholar] [CrossRef] [Scilit]
- He, X.; Cui, T.; Zhang, D.; Wei, J.; Wang, M.; Yu, Y.; Yang, L. Development of an Electric-Driven Control System for a Precision Planter Based on a Closed-Loop PID Algorithm. Comput. Electron. Agric. 2017, 136, 184–192. [Google Scholar] [CrossRef] [Scilit]
- Sternitzke, D.A.; Lamb, M.C.; Davidson, J.I.; Barron, R.T.; Bennet, C.T. Impact of Plant Spacing and Population on Yield for Single-Row Nonirrigated Peanuts (Arachis hypogaea L.). Peanut Sci. 2000, 27, 52–56. [Google Scholar] [CrossRef] [Scilit]
- Sarver, J.M.; Tubbs, R.S.; Beasley, J.P.; Culbreath, A.K.; Grey, T.L.; Rowland, D.L.; Smith, N.B. Plant Population and Replant Method Effects on Peanut Seeded in Single Rows. Peanut Sci. 2016, 43, 126–132. [Google Scholar] [CrossRef] [Scilit]
- Butts, C.L.; Faircloth, W.H.; Lamb, M.C.; Nuti, R.C.; Rowland, D.L.; Sorensen, R.B.; Guerke, W.R. Effect of Bulk Handling on Runner Peanut Seed Quality. Peanut Sci. 2007, 34, 22–26. [Google Scholar] [CrossRef] [Scilit]
- Kachman, S.D.; Smith, J.A. Alternative Measures of Accuracy in Plant Spacing for Planters Using Single Seed Metering. Trans. ASAE 1995, 38, 379–387. [Google Scholar] [CrossRef] [Scilit]
- Miller, E.A.; Rascon, J.; Koller, A.; Porter, W.M.; Taylor, R.K.; Raun, W.R.; Kochenower, R. Evaluation of Corn Seed Vacuum Metering Systems. In Proceedings of the 2012 ASABE Annual International Meeting, Dallas, TX, USA, 29 July–1 August 2012; p. 121337167. [Google Scholar] [CrossRef] [Scilit]
- Johnson, W.C.; Davis, J.W. Effects of Peanut Stand Uniformity and Herbicide Regime on Weed Management and Yield. Peanut Sci. 2016, 43, 141–147. [Google Scholar] [CrossRef] [Scilit]

Disclaimer/Publisher’s Note: The statements, opinions and data contained in all publications are solely those of the individual author(s) and contributor(s) and not of MDPI and/or the editor(s). MDPI and/or the editor(s) disclaim responsibility for any injury to people or property resulting from any ideas, methods, instructions or products referred to in the content. |
© 2026 by the authors. Licensee MDPI, Basel, Switzerland. This article is an open access article distributed under the terms and conditions of the Creative Commons Attribution (CC BY) license.