


Abstract
Cotton planting efficiency is increasingly constrained by narrow planting windows, motivating interest in higher operating speeds if stand establishment and seed placement accuracy can be maintained. Field experiments were conducted in Georgia between 2020 and 2025 to quantify the effects of planter operating parameters and system configurations on cotton planter performance. Trials evaluated combinations of planting speed, row-unit downforce, seed plate type (singulated vs. hill-drop), and seed delivery system using conventional gravity-tube planters and two high-speed planter systems equipped with advanced delivery systems. The achieved population was determined from stand counts, planting quality was assessed using plant position classification relative to theoretical plant spacing, and lint yield was measured at harvest. Across site-years, the achieved population was generally not affected by planting speed or downforce within the tested ranges. With conventional gravity-tube delivery systems, the proportion of perfectly spaced plants declined from 44.0% to 22.1% in 2020 and from 52.8% to 28.4% in 2021 as planting speed increased from 5 to 11 km . In contrast, across the advanced planter systems evaluated in 2025, mean perfect spacing remained within a narrow range of 45.8% to 49.5% across 8 to 14 km . Hill-drop seed plates increased the achieved population relative to singulated plates in the seed plate × downforce trials, increasing mean achieved population from 79.6 to 87.8 thousand plants h at Midville and from 62.2 to 73.1 thousand plants h at Plains in 2022, and from 45.4 to 58.1 thousand plants h at Midville in 2024, but these increases did not result in consistent lint yield differences. The high-speed hill-drop configuration evaluated in 2025 did not consistently produce plant pairs meeting the hill-drop spacing criterion. These results indicate that current high-speed planter systems can be used for singulated cotton to increase planting productivity while maintaining placement accuracy, although additional research is needed to determine the environmental and management conditions under which spacing improvements translate into yield benefits.
1. Introduction
Cotton (Gossypium hirsutum L.) is a major row crop in Georgia production systems, where growers often operate under narrow planting windows driven by weather variability and field trafficability [1,2]. Under these constraints, planting efficiency becomes a practical limitation: increasing planting speed can improve field capacity, but only if seed placement accuracy and stand establishment are not compromised. Achieving an adequate and uniform stand is particularly critical in cotton because seedling vigor is relatively low compared with other row crops, and poor emergence can result in replanting decisions and reduced economic sustainability [3,4].
Modern cotton planting relies primarily on vacuum planters that open a furrow to a target depth, meter seed at a target rate, deliver seed to the furrow, and close the seed slot. Several planter settings are under the operator’s control, including target seed depth, row-unit downforce, seeding rate, vacuum level, seed plate configuration, and ground speed [5,6]. In practice, these settings are frequently adjusted as growers switch between crops and field conditions, and interactions among settings can influence achieved population, spacing uniformity, and yield. Among these settings, row-unit downforce is especially important in cotton because it maintains gauge-wheel contact with the soil and stabilizes depth control, which is critical for shallow planting in soils prone to surface crusting [7,8,9,10].
Cotton differs from many row crops in that vacuum meters can be configured for either singulated planting or hill-drop planting. Hill-drop seed plates are intended to deliver clusters of seeds at each drop location, based on the premise that multiple seedlings emerging in close proximity increase the likelihood that at least one plant emerges under adverse surface conditions. Previous studies have reported mixed results for hill-drop planting, with some evidence of improved emergence under sub-optimal conditions and other work showing limited or inconsistent effects on final stand and yield [11,12,13]. As seeding rates continue to decrease to reduce input costs, it remains important to quantify how seed plate configuration interacts with other planter settings under field conditions.
Planting speed is a particularly influential operating parameter because increasing speed can affect row-unit dynamics, depth control, and the timing and trajectory of seed release. Research on other row crops has shown that higher planting speeds can increase spacing variability and reduce placement accuracy, even when the achieved population is maintained [14,15,16,17]. In conventional planters, seeds are typically delivered through gravity seed tubes, where higher speeds can increase seed bounce and delivery variability. To address these limitations, high-speed planting systems have been developed that replace gravity delivery with controlled seed delivery mechanisms designed to maintain accurate placement at higher travel speeds [18].
While high-speed planting systems have demonstrated improved spacing uniformity in crops such as soybean, published research directly evaluating these systems in cotton remains limited [19,20]. Moreover, the relationship between early-season plant-to-plant spatial uniformity and lint yield in cotton has not been clearly established under field conditions.
Cotton-specific planter research remains less developed than the corresponding literature for corn and soybean, particularly for modern high-speed planting systems. Much of the available cotton work has focused on stand establishment under conventional planter configurations rather than on controlled high-speed seed-delivery systems. In cotton, stand establishment is especially sensitive to shallow and uniform seed placement, seed vigor, and soil surface conditions, particularly in crust-prone soils of the southeastern United States [13,21]. Previous studies have shown that planter depth and downforce can influence cotton emergence under varying soil moisture conditions [22], while evaluations of hill-drop planting have produced mixed results, with some evidence of improved emergence but inconsistent effects on final stand and lint yield [11,12,13]. By contrast, evidence on planting-speed effects and advanced high-speed planter performance in cotton remains sparse relative to other row crops, where speed-related spacing effects have been more extensively documented [14,15,16,17,19,20]. As a result, it remains unclear whether the spacing advantages associated with advanced planter systems translate into meaningful agronomic benefits in cotton across planting speed, seed plate configuration, and planter system. The present study addresses that unresolved gap through field evaluation of these factors across multiple cotton site-years.
1.1. Purpose Statement
The purpose of this study was to evaluate how planter operating parameters and system configurations influence field-level cotton planter performance. Specifically, the effects of planting speed, row-unit downforce, seed plate configuration (singulated vs. hill-drop), and seed delivery system type (conventional gravity tube vs. advanced high-speed delivery) were quantified for achieved population, plant spacing/position quality, and lint yield across multiple site-years.
1.2. Objectives
- 1.
- Quantify the effects of planting speed and downforce on achieved population, spacing uniformity, and lint yield in cotton under field conditions.
- 2.
- Determine whether seed plate configuration (singulated vs. hill-drop), alone and in combination with downforce, affects achieved population and lint yield.
- 3.
- Compare two high-speed planting systems equipped with advanced seed delivery mechanisms across higher operating speeds for achieved population, spacing uniformity, lint yield, and the ability to achieve true hill-drop placement.
2. Materials and Methods
2.1. Site Descriptions and Experimental Overview
Cotton planting field trials were conducted in Georgia between 2020 and 2025 to evaluate the effects of planter operating parameters and system configurations on stand establishment, spacing uniformity, and lint yield. The primary research location was the Southeast Georgia Research and Education Center (REC) in Midville, GA, where soils are predominantly Dothan sandy loam. In 2022, the seed plate × downforce trial was replicated at the Southwest Georgia REC in Plains, GA, where soils are characterized by a higher clay content (Greenville sandy loam). In 2025, the high-speed planter trials were conducted at two locations in Georgia, Midville and Tifton.
Fields were rotated annually in accordance with standard cropping practices at the research sites. Trials were established in fields selected for visually uniform soil texture to reduce spatial variability. Target seeding rates decreased over the study period to reflect updated University of Georgia recommendations aimed at reducing input costs [21].
Because target seeding rates, planter platforms, and site-year conditions varied across years, and because seed germination and vigor were not consistently evaluated as experimental factors, year-to-year comparisons of achieved population should be interpreted cautiously. Across all years, trials evaluated combinations of planting speed, row-unit downforce, seed plate configuration (singulated vs. hill-drop), and seed delivery system type. A summary of site-years, treatments, and measured responses is provided in Table 1.
Table 1.
Summary of cotton planting field trials conducted from 2020 to 2025, including location, experimental factors, target seeding rate, and measured response variables. “Yes” indicates that the response variable was measured in that site-year; “No” indicates that it was not measured or not available.
2.2. Planters and Equipment Configurations (2020–2024)
From 2020 through 2024, trials were conducted using two four-row vacuum planters equipped with conventional gravity seed delivery systems:
- Monosem NG Plus 4 (Monosem LLC, Edwardsville, KS, USA), hereafter referred to as MS;
- Case IH Early Riser 2000 Series equipped with Precision Planting vSet electric seed meters (CNH Industrial America LLC, Racine, WI, USA; Precision Planting, Tremont, IL, USA), hereafter referred to as PP.
The MS planter was equipped with a ground-driven seed meter and a mechanical spring-loaded downforce system, whereas the PP planter used an electric seed meter and a hydraulic downforce system (Precision Planting DeltaForce). Both planters delivered seed through standard gravity seed tubes. Planter characteristics are summarized in Table 2.
Table 2.
Characteristics of the conventional cotton planters used in the speed × downforce and seed plate × downforce trials (2020–2024).
For the MS planter, mechanical downforce levels were set to 0 N (low), 889 N (medium), and 1779 N (high). For the PP planter, static hydraulic downforce levels were set to 222 N (low), 556 N (medium), and 889 N (high). These values were selected to represent practical downforce ranges used in cotton production with the respective planter systems and to span low, intermediate, and high settings within the operational range of each row-unit configuration [5]. Because the two planters differed in downforce hardware (mechanical spring vs. hydraulic active downforce), the absolute force values were not intended to imply direct equivalence between planter platforms.
2.3. High-Speed Planter Systems (2025)
During the 2025 growing season, two planters equipped with advanced seed delivery systems were evaluated to assess high-speed planting performance:
- John Deere Exact Emerge™ (JD-EE), Deere and Company, Moline, IL, USA equipped with BrushBelt™ seed delivery and John Deere integrated hydraulic downforce;
- Case IH Early Riser 2000 Series with Precision Planting SpeedTube™ delivery (PP-ST), Precision Planting, Tremont, IL, USA using vSet electric seed meters and DeltaForce hydraulic active downforce.
Both planters were operated at ground speeds of 8, 11, and 14 km . Active downforce systems were configured to maintain a target gauge-wheel load of 222 N across all treatments. This gauge-wheel load target was selected as a practical baseline setting for cotton planting with active downforce systems so that gauge–wheel contact could be maintained while holding downforce constant across planter and speed treatments. It was used as a standardized operating target for comparison among treatments and was not intended to represent a universally optimal setting for all field conditions. The PP-ST planter was evaluated using both singulated and hill-drop seed plates, whereas the JD-EE planter was evaluated using singulated seed bowls only. A 10% reduced seeding rate was included at 11 km for both singulated and hill-drop PP-ST treatments to evaluate potential reductions in input costs. Planter configurations are summarized in Table 3.
Table 3.
Characteristics of the high-speed cotton planters evaluated in 2025.
2.4. Experimental Design and Plot Layout
Trials were implemented using four-row planting strips extending the full length of the field. Adjacent strips represented different combinations of planter settings (e.g., speed × downforce or seed plate × downforce). Each strip was subdivided by alleys into four consecutive plots, yielding four within-strip plot observations (spatial subsamples) per treatment strip. Treatment combinations were assigned to adjacent full-length strips, and the four within-strip plots were consecutive rather than randomized because randomization would require multiple passes over the same ground and could confound planter effects through additional soil disturbance.
Treatments were applied in a systematic strip layout rather than a fully randomized design to avoid multiple passes over the same ground, which could confound planter effects through additional soil disturbance. This approach is consistent with planter performance evaluations conducted under field conditions, where maintaining uniform soil conditions across treatments is critical [9]. Spatial bias was mitigated by selecting visually uniform fields and by analyzing each year independently. Plots represent spatial subsamples within planter passes rather than fully independent experimental units; therefore, inferences are restricted to treatment comparisons within individual site-years rather than across pooled environments. Accordingly, each year is treated as an independent experiment, and cross-year comparisons are presented as qualitative synthesis rather than formal statistical inference.
Treatment order within strips was fixed rather than counterbalanced. For the speed × downforce trials in 2020, 2021, and 2023, adjacent strips were ordered 5-low, 8-low, 11-low, 5-medium, 8-medium, 11-medium, 5-high, 8-high, and 11-high km × downforce. For the seed plate × downforce trials in 2022 and 2024, strips were ordered singulated-low, singulated-medium, singulated-high, hill-drop-low, hill-drop-medium, and hill-drop-high; in 2022, this six-treatment sequence was repeated once within each location, increasing the number of plot observations per treatment relative to 2024. For the 2025 trials, JD-EE singulated strips at 8, 11, and 14 km were followed by PP-ST singulated strips at 8, 11, and 14 km , PP-ST hill-drop strips at 8, 11, and 14 km , and reduced-rate singulated and hill-drop strips at 11 km . Order was kept constant within each site-year to avoid repeated traffic over the same ground and to simplify field implementation.
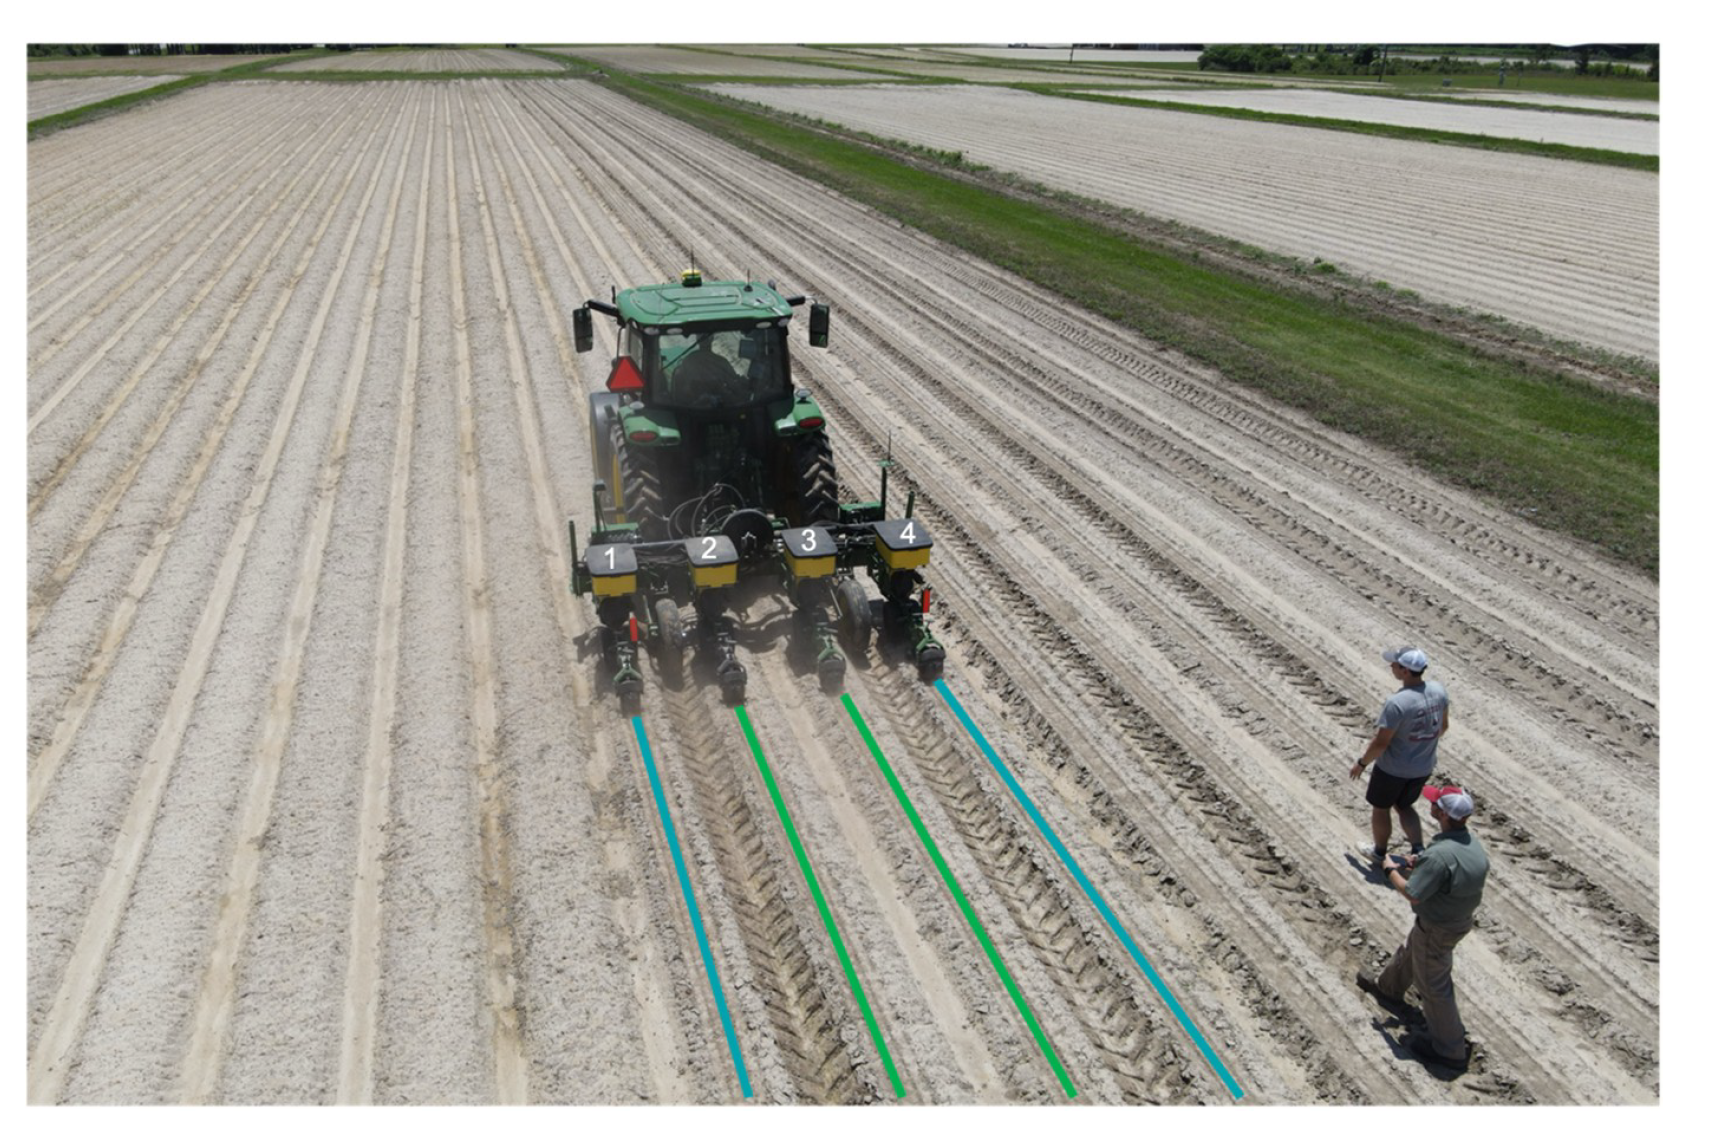
Final plot dimensions were 3.7 m wide (four rows spaced at 0.91 m) and 11 m long after alleys were established. Data were collected from rows 2 and 3 of each plot to minimize edge effects (Figure 1).
Figure 1.
Four-row planting strip layout used in the field trials. Each full-length strip represented one treatment combination and was divided into alleys, with four consecutive plots used as within-strip plot observations (spatial subsamples). Data were collected from rows 2 and 3 of each plot for stand counts, spacing measurements, and yield evaluation.
2.5. Stand Counts and Achieved Population
The achieved population was estimated from stand counts conducted on rows 2 and 3 of each plot following emergence. Plants were counted within a 4.4 m section of row, corresponding to 1/1000 of an acre in a 0.91 m row-spacing system. Counts were converted to plants h using standard unit conversions.
For each treatment, the achieved population values are presented as means ± standard deviation, based on the number of plot observations available for that site-year.
2.6. Plant Spacing and Position Classification
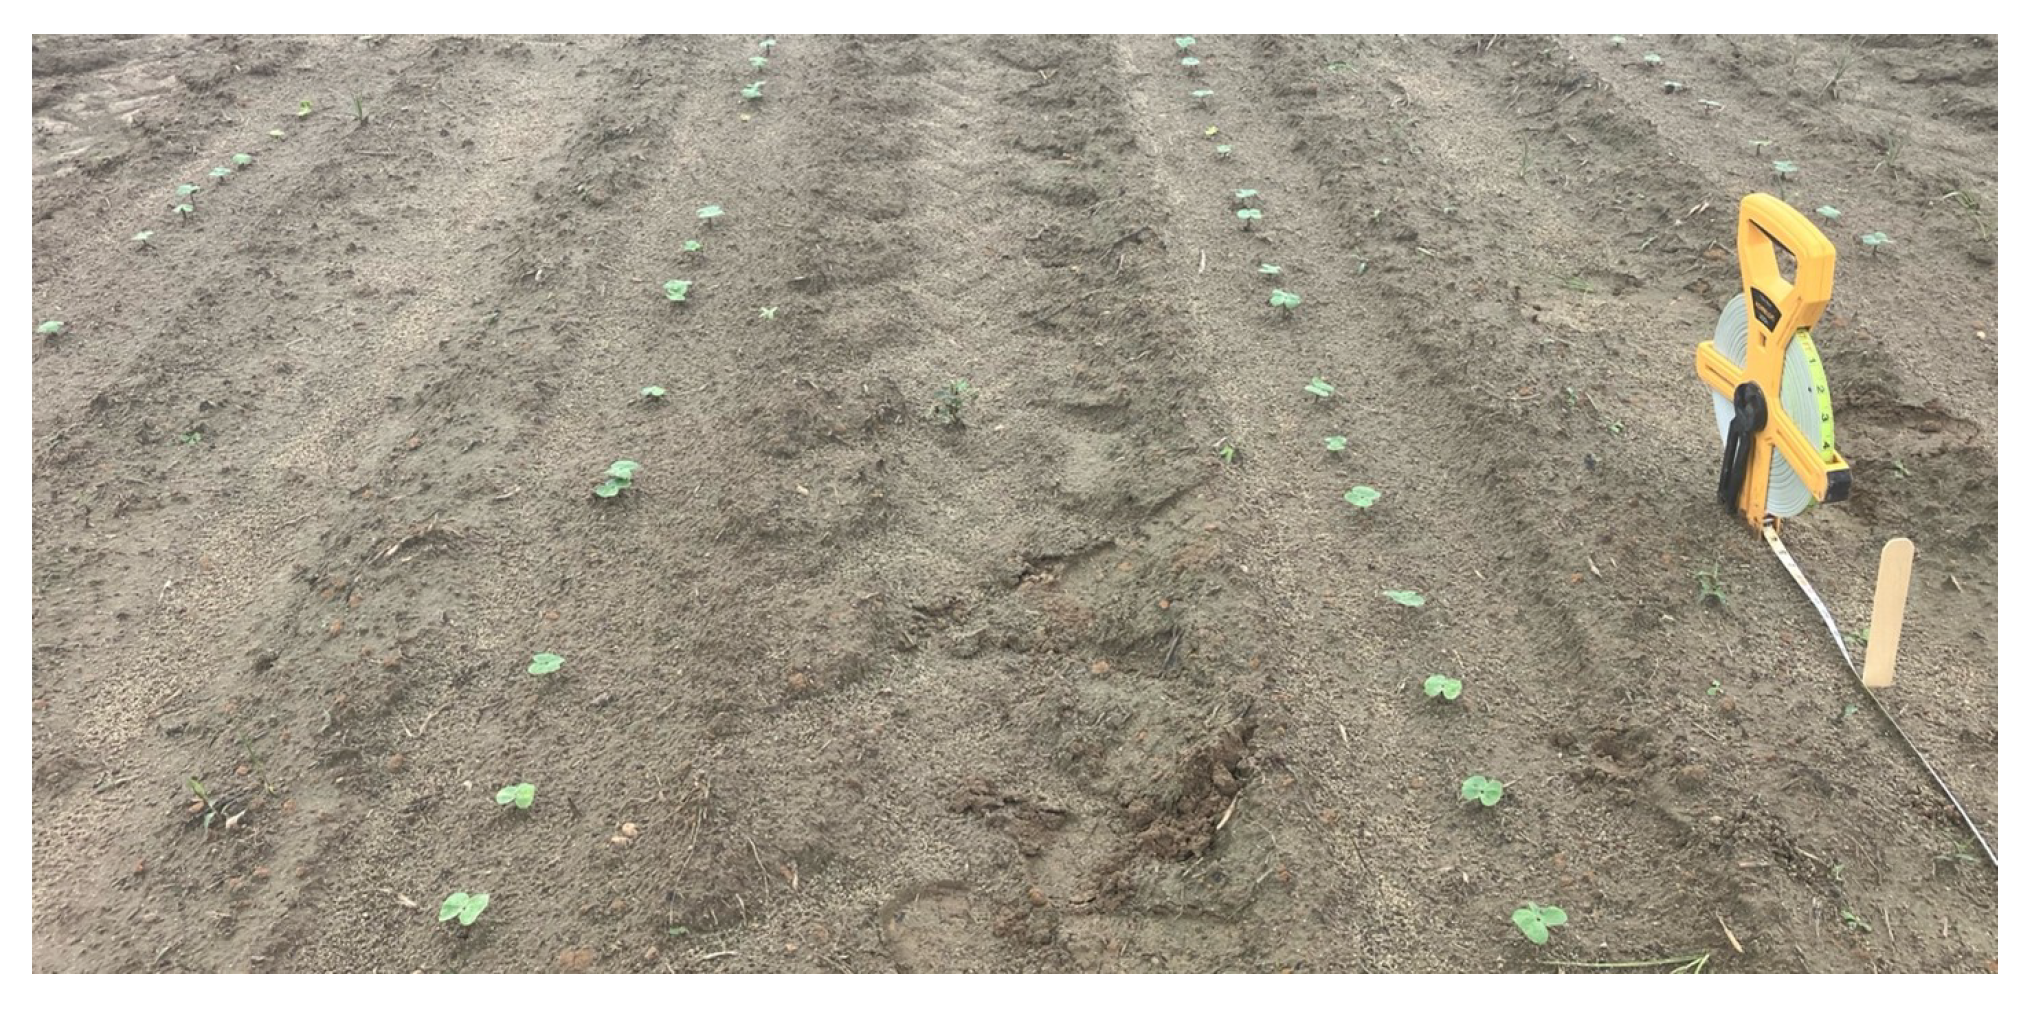
Plant spacing was evaluated after full emergence by recording the position of each plant within the 4.4 m row section using an engineer’s scale tape measure (Figure 2). Measured distances between consecutive plants were compared with the theoretical plant spacing (TPS) based on the target seeding rate.
Figure 2.
Measurement of plant spacing after full emergence using an engineer’s scale tape measure. Plant positions were recorded along a 4.4 m row section beginning at 0.00 cm and compared with the theoretical plant spacing to classify plants as double, misplaced under, perfect, misplaced over, or skip; hill-drop classification was applied where relevant.
Each plant was classified into one of five categories:
- Double: <20% of TPS;
- Misplaced under: 20–80% of TPS;
- Perfect: 80–120% of TPS;
- Misplaced over: 120–180% of TPS;
- Skip: >180% of TPS.
A higher proportion of perfectly spaced plants was interpreted as improved planter performance.
For hill-dropped cotton, plant pairs were evaluated using a 25.4 mm threshold. If the distance between two adjacent plants was <25.4 mm, both plants were classified as hill-dropped. If spacing preceding a plant exceeded 1.8× the theoretical hill spacing (THS), the plant was classified as a skip; all remaining plants were classified as single plants. Plant position classification thresholds followed previously published definitions [12,19].
2.7. Yield Measurement
At the end of each growing season, yield data were collected by harvesting rows 2 and 3 of each plot using a two-row plot picker. Seed cotton was collected and weighed in the field, and subsamples were ginned using the University of Georgia Microgin to determine lint turnout. Lint yield was calculated on an area basis.
In-season crop management followed recommendations outlined in the University of Georgia Cotton Production Guide [21].
2.8. Statistical Analysis
Statistical analyses were conducted in R (R Foundation for Statistical Computing, Vienna, Austria). To match the experimental structure and avoid pooling non-equivalent environments, analyses were performed separately for each site-year and trial structure. For the 2020, 2021, and 2023 speed × downforce trials, factorial ANOVA models were fit for achieved population and lint yield with planting speed, downforce, and their interaction treated as fixed effects and replication included as a blocking factor. Perfect-spacing data from 2020 and 2021 were analyzed using the same fixed-effect structure. For the 2022 and 2024 seed plate × downforce trials, factorial ANOVA models were fit with seed plate configuration, downforce, and their interaction as fixed effects, and replication was included as a blocking factor; the 2022 Midville and Plains trials were analyzed separately. In 2022, the six-treatment strip sequence was repeated once within each location, increasing the number of plot observations per treatment relative to 2024. For the 2025 planter × speed trials, achieved population and lint yield were analyzed separately by location with planter system, planting speed, and their interaction as fixed effects, and replication included as a blocking factor. Because perfect spacing in 2025 was evaluated across both locations, that analysis included location, planter system, planting speed, and the planter × speed interaction, with replications considered within location. For the 2025 PP-ST seed plate × speed and reduced-rate evaluations, population and lint yield were analyzed separately by location, with seed-plate configuration, planting speed, and seed rate as fixed effects, and replication included as a blocking factor.
Fixed-effect significance was assessed using ANOVA tables, and means separation was performed using Tukey-adjusted comparisons with the emmeans package at [23]. Treatments that did not share a common letter were considered significantly different. Because the experiments were implemented as field-scale strip trials rather than fully randomized small-plot trials, treatment effects should be interpreted within the spatial limitations of each field. In 2025, apparent soil electrical conductivity (ECa) was collected prior to planting to characterize spatial soil variability within the study fields. Because ECa was not retained as a covariate in the final reported 2025 models, it is not presented as a model term in Supplementary Tables S5 and S6. Full ANOVA summary statistics supporting the major analyses are provided in Supplementary Tables S1–S6, and Supplementary Table S7 lists the treatment means underlying the quantitative statements reported in the Abstract and Conclusions.
3. Results
3.1. Speed × Downforce Trials (2020, 2021, and 2023)
3.1.1. Achieved Population
Speed × downforce trials were conducted in 2020, 2021, and 2023 to compare three planting speeds (5, 8, and 11 km ) combined with three downforce levels. The MS planter was used in 2020 and 2021 at a target population of 105,000 seeds h, while the PP planter was used in 2023 at a reduced target population of 74,000 seeds h.
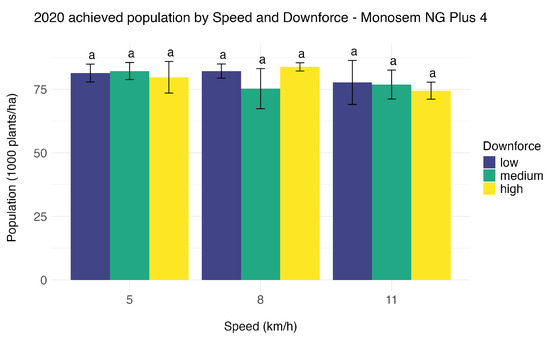
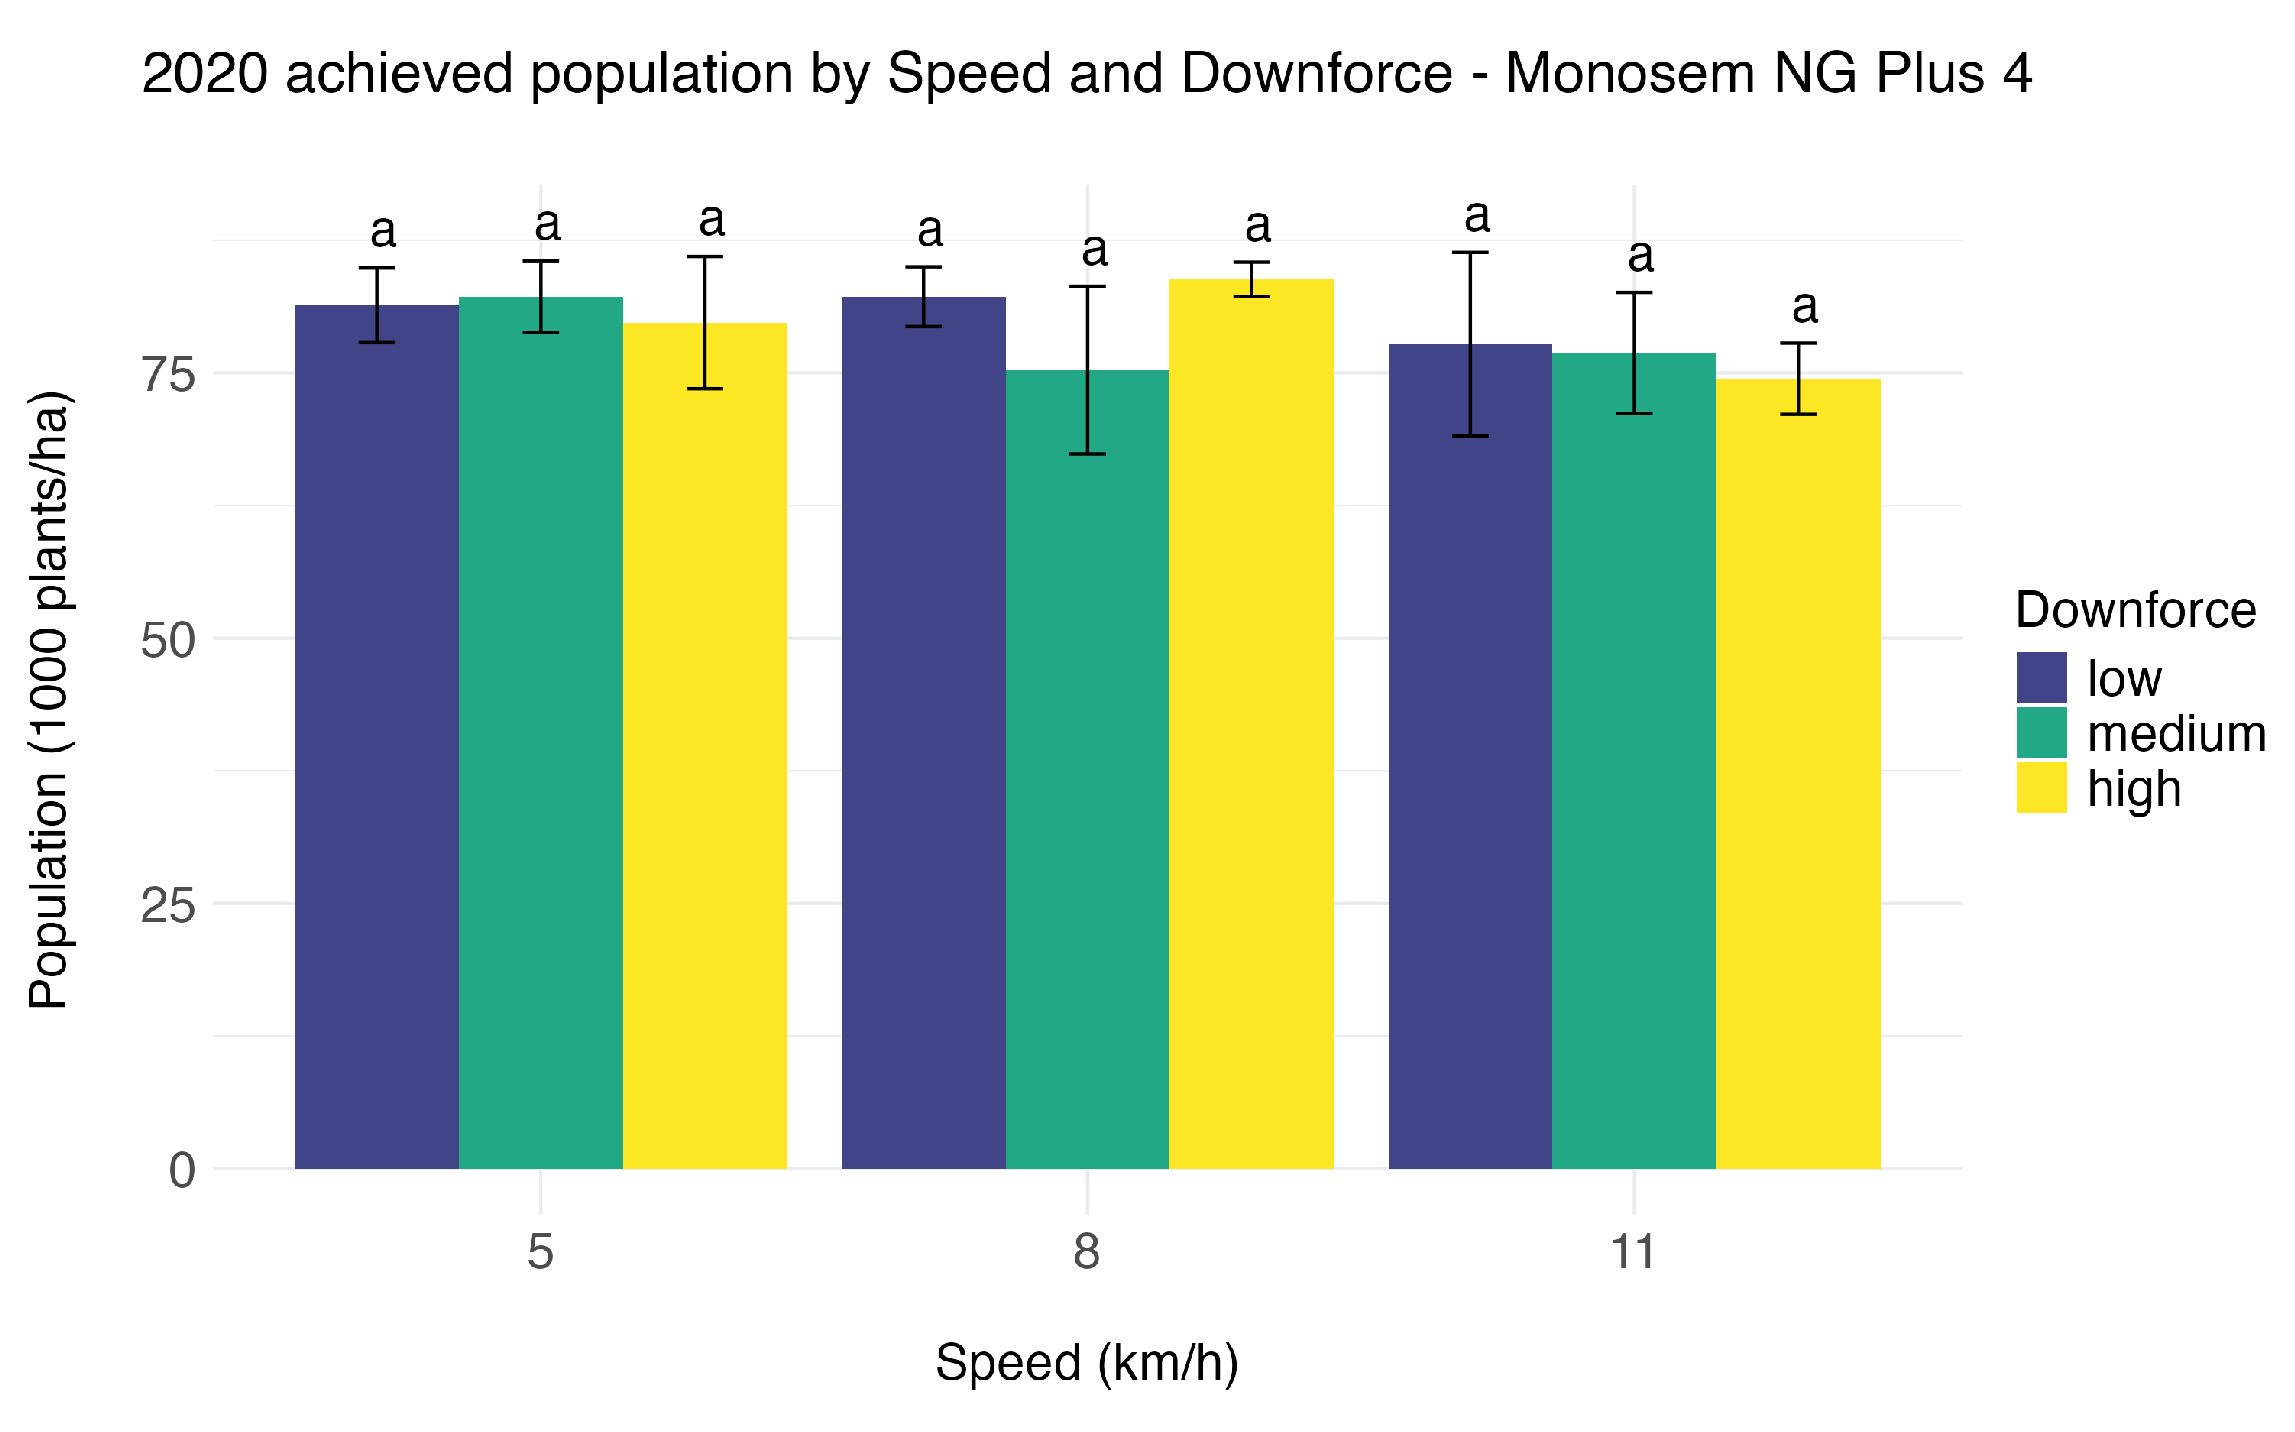
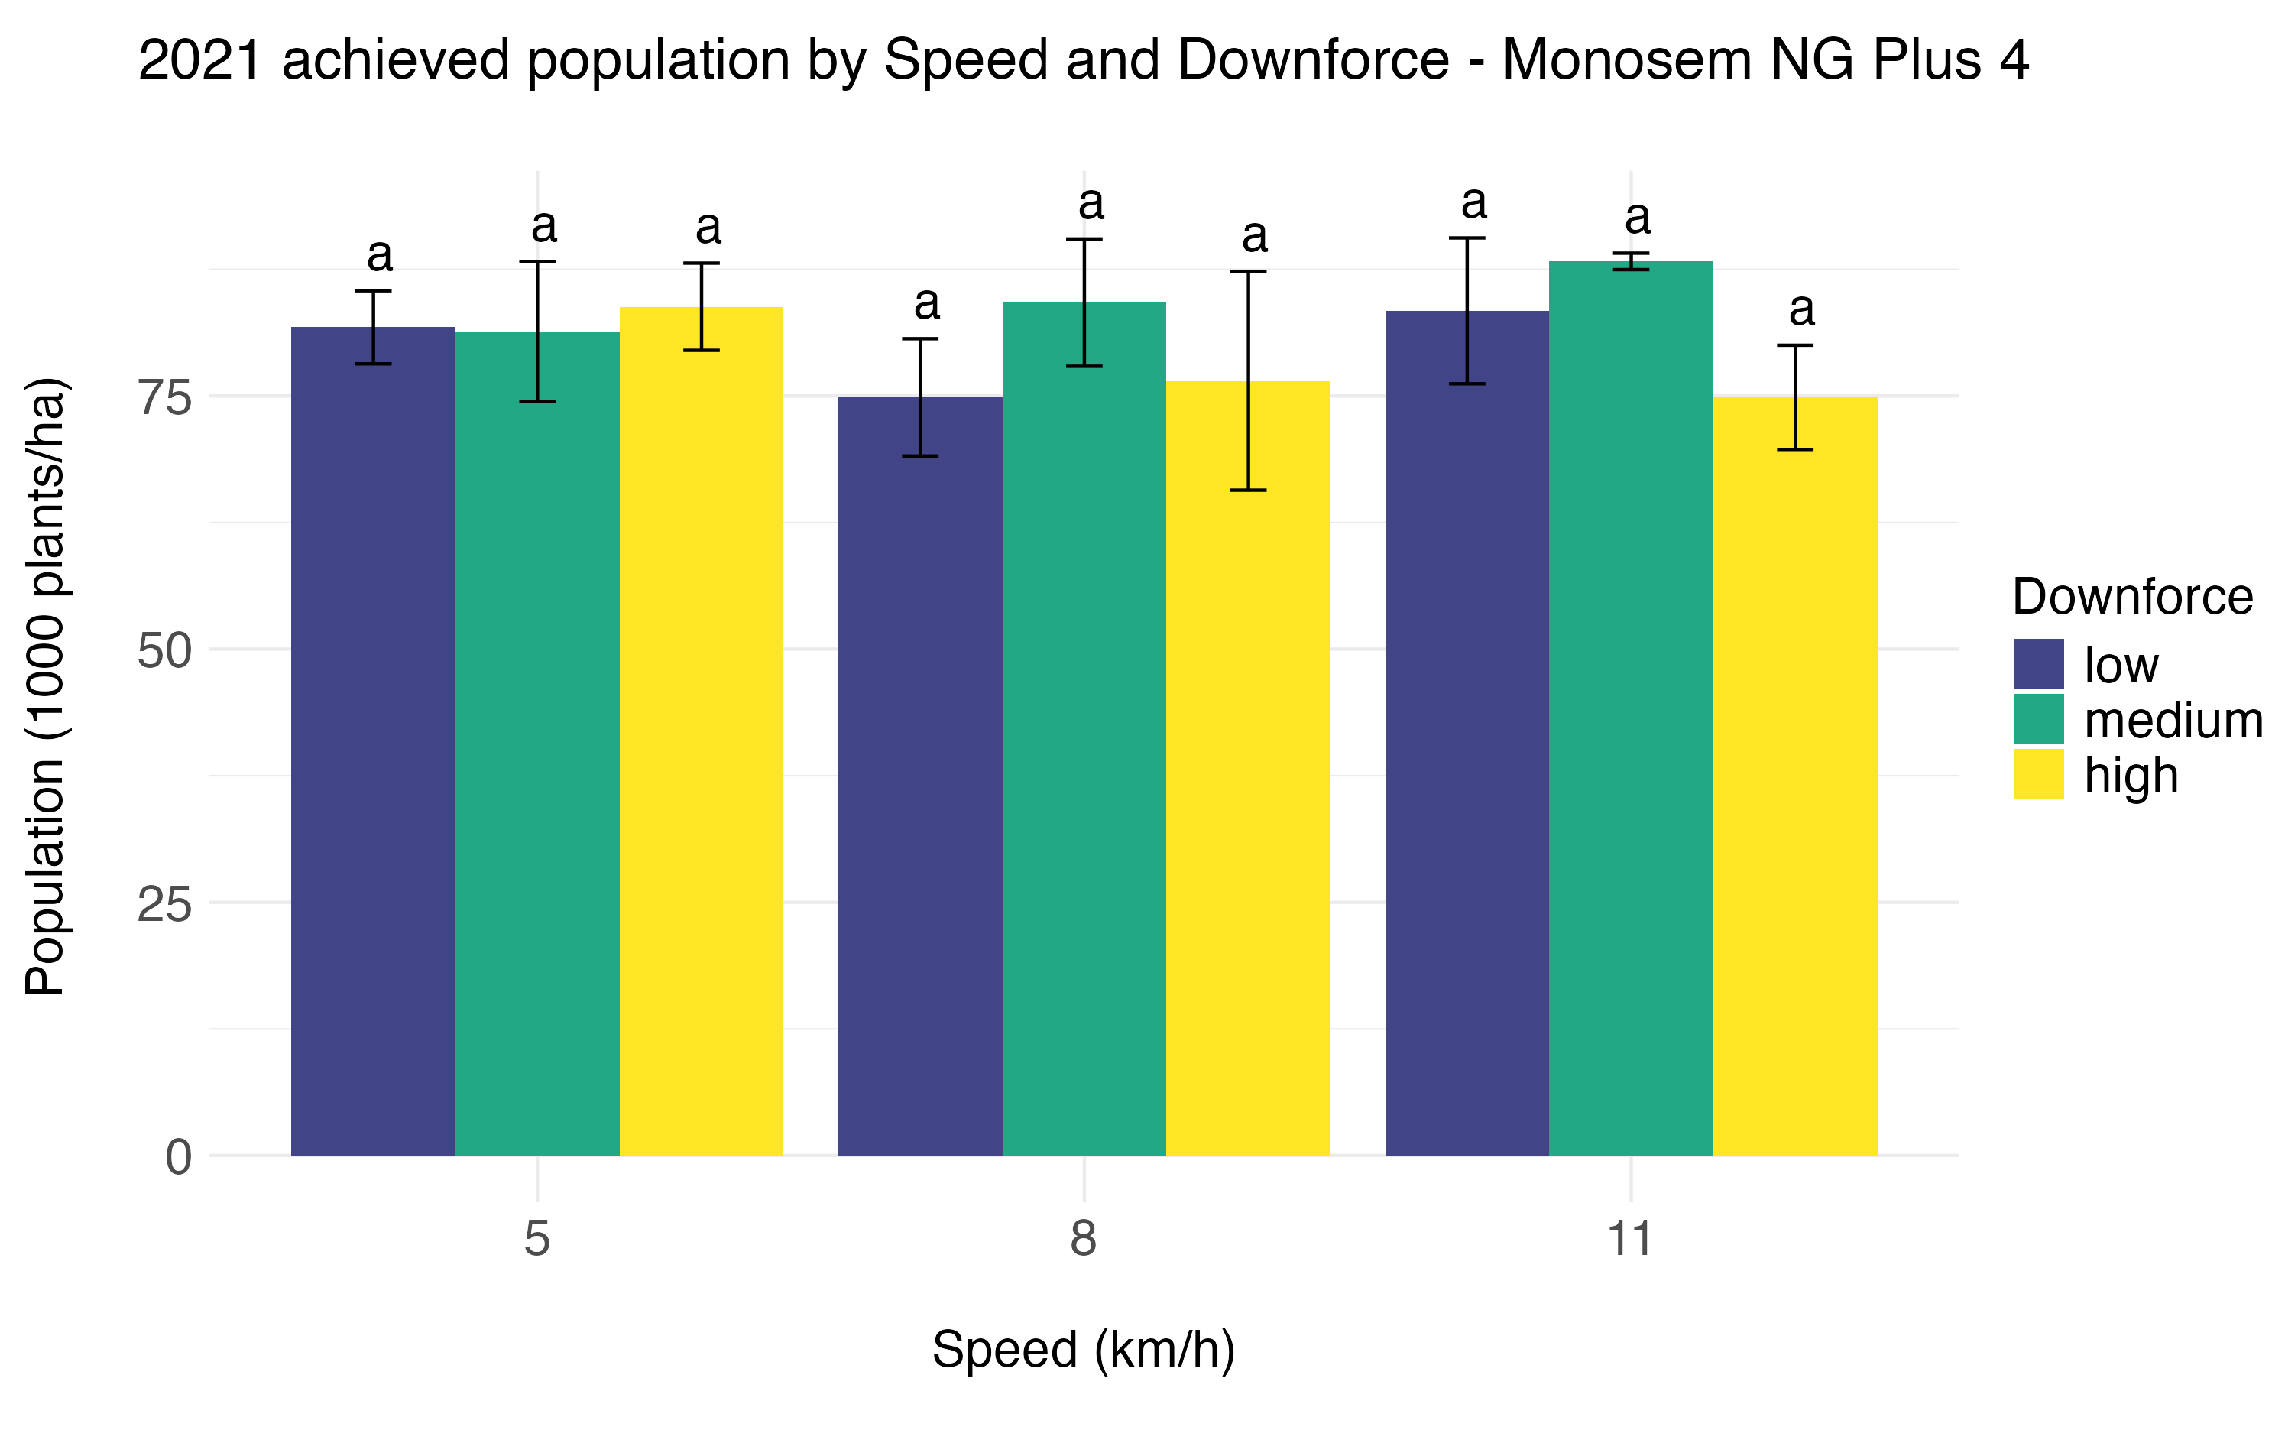
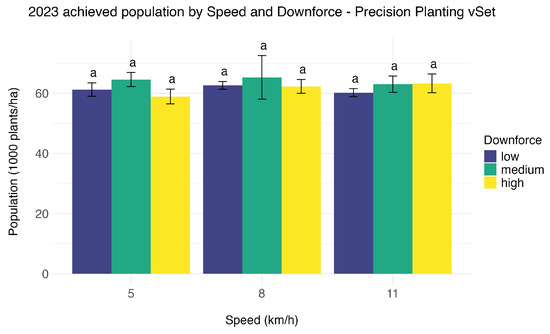
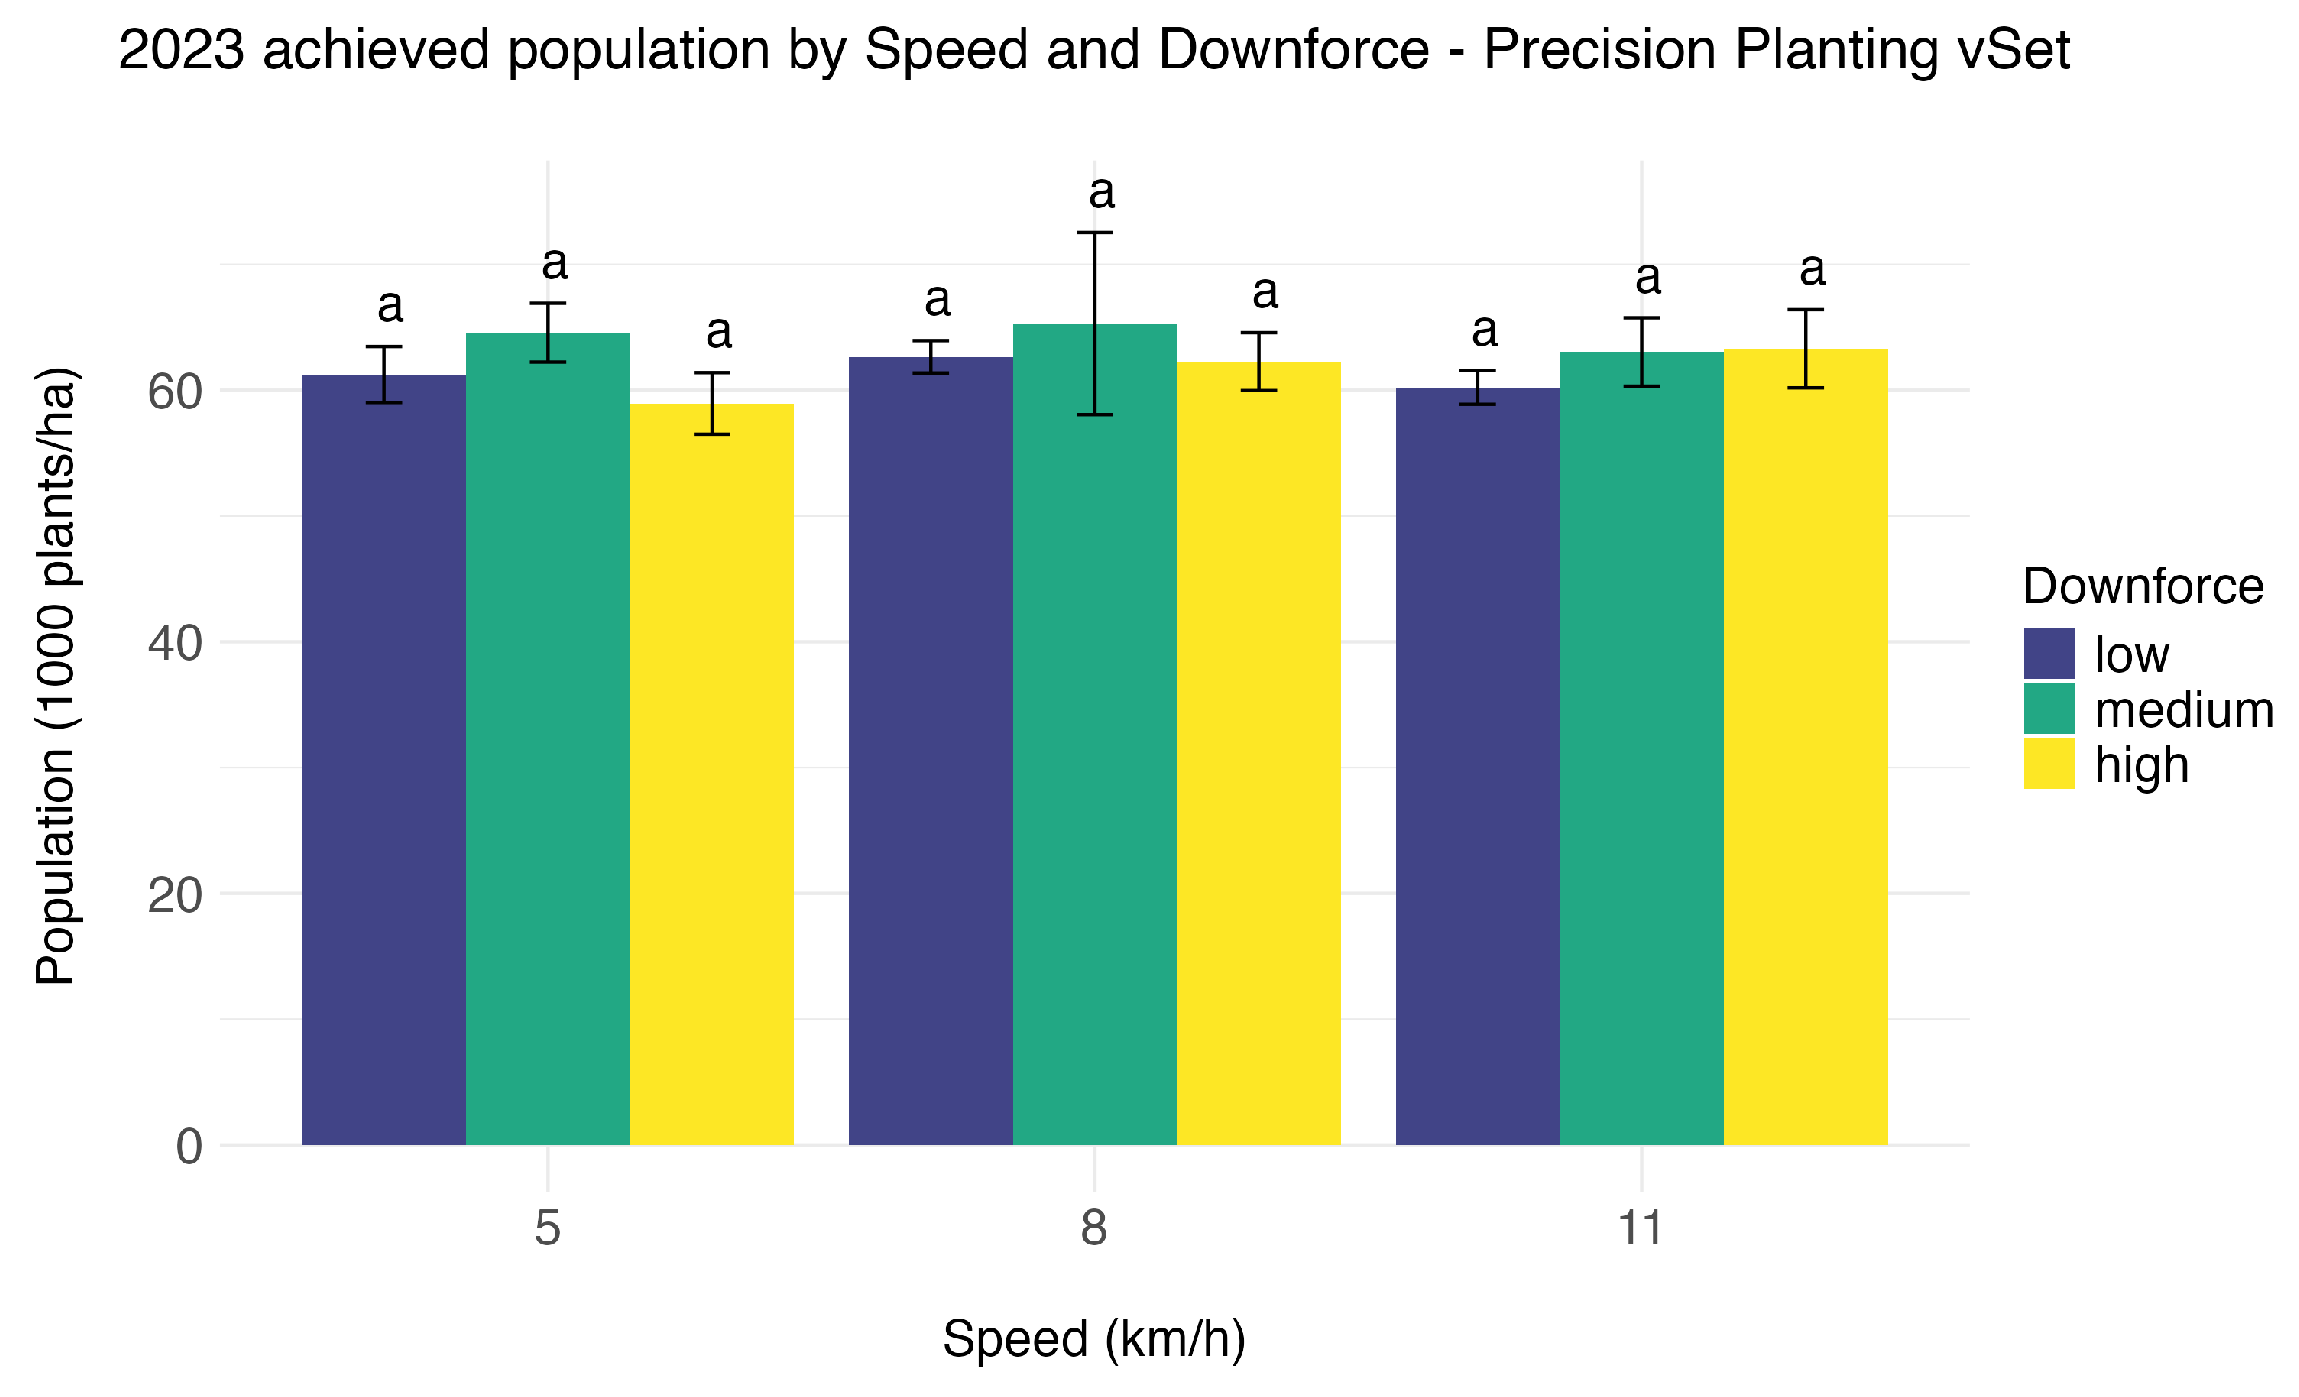
No significant effects of planting speed or planting speed × downforce interactions were detected for the achieved population in 2020, 2021, or 2023. A borderline downforce main effect was observed in 2023 (Supplementary Table S1), but clear pairwise differences among individual treatment combinations were not detected. Achieved population results for 2020, 2021, and 2023 are presented in Figure 3, Figure 4 and Figure 5, respectively.
Figure 3.
Achieved population by planting speed and downforce in 2020 using the MS planter. Bars sharing a common letter are not significantly different at based on Tukey-adjusted mean separation. Error bars represent ±1 standard deviation.
Figure 4.
Achieved population by planting speed and downforce in 2021 using the MS planter. Bars sharing a common letter are not significantly different at based on Tukey-adjusted mean separation. Error bars represent ±1 standard deviation.
Figure 5.
Achieved population by planting speed and downforce in 2023 using the PP planter. Bars sharing a common letter are not significantly different at based on Tukey-adjusted mean separation. Error bars represent ±1 standard deviation.
3.1.2. Plant Spacing and Position Classification
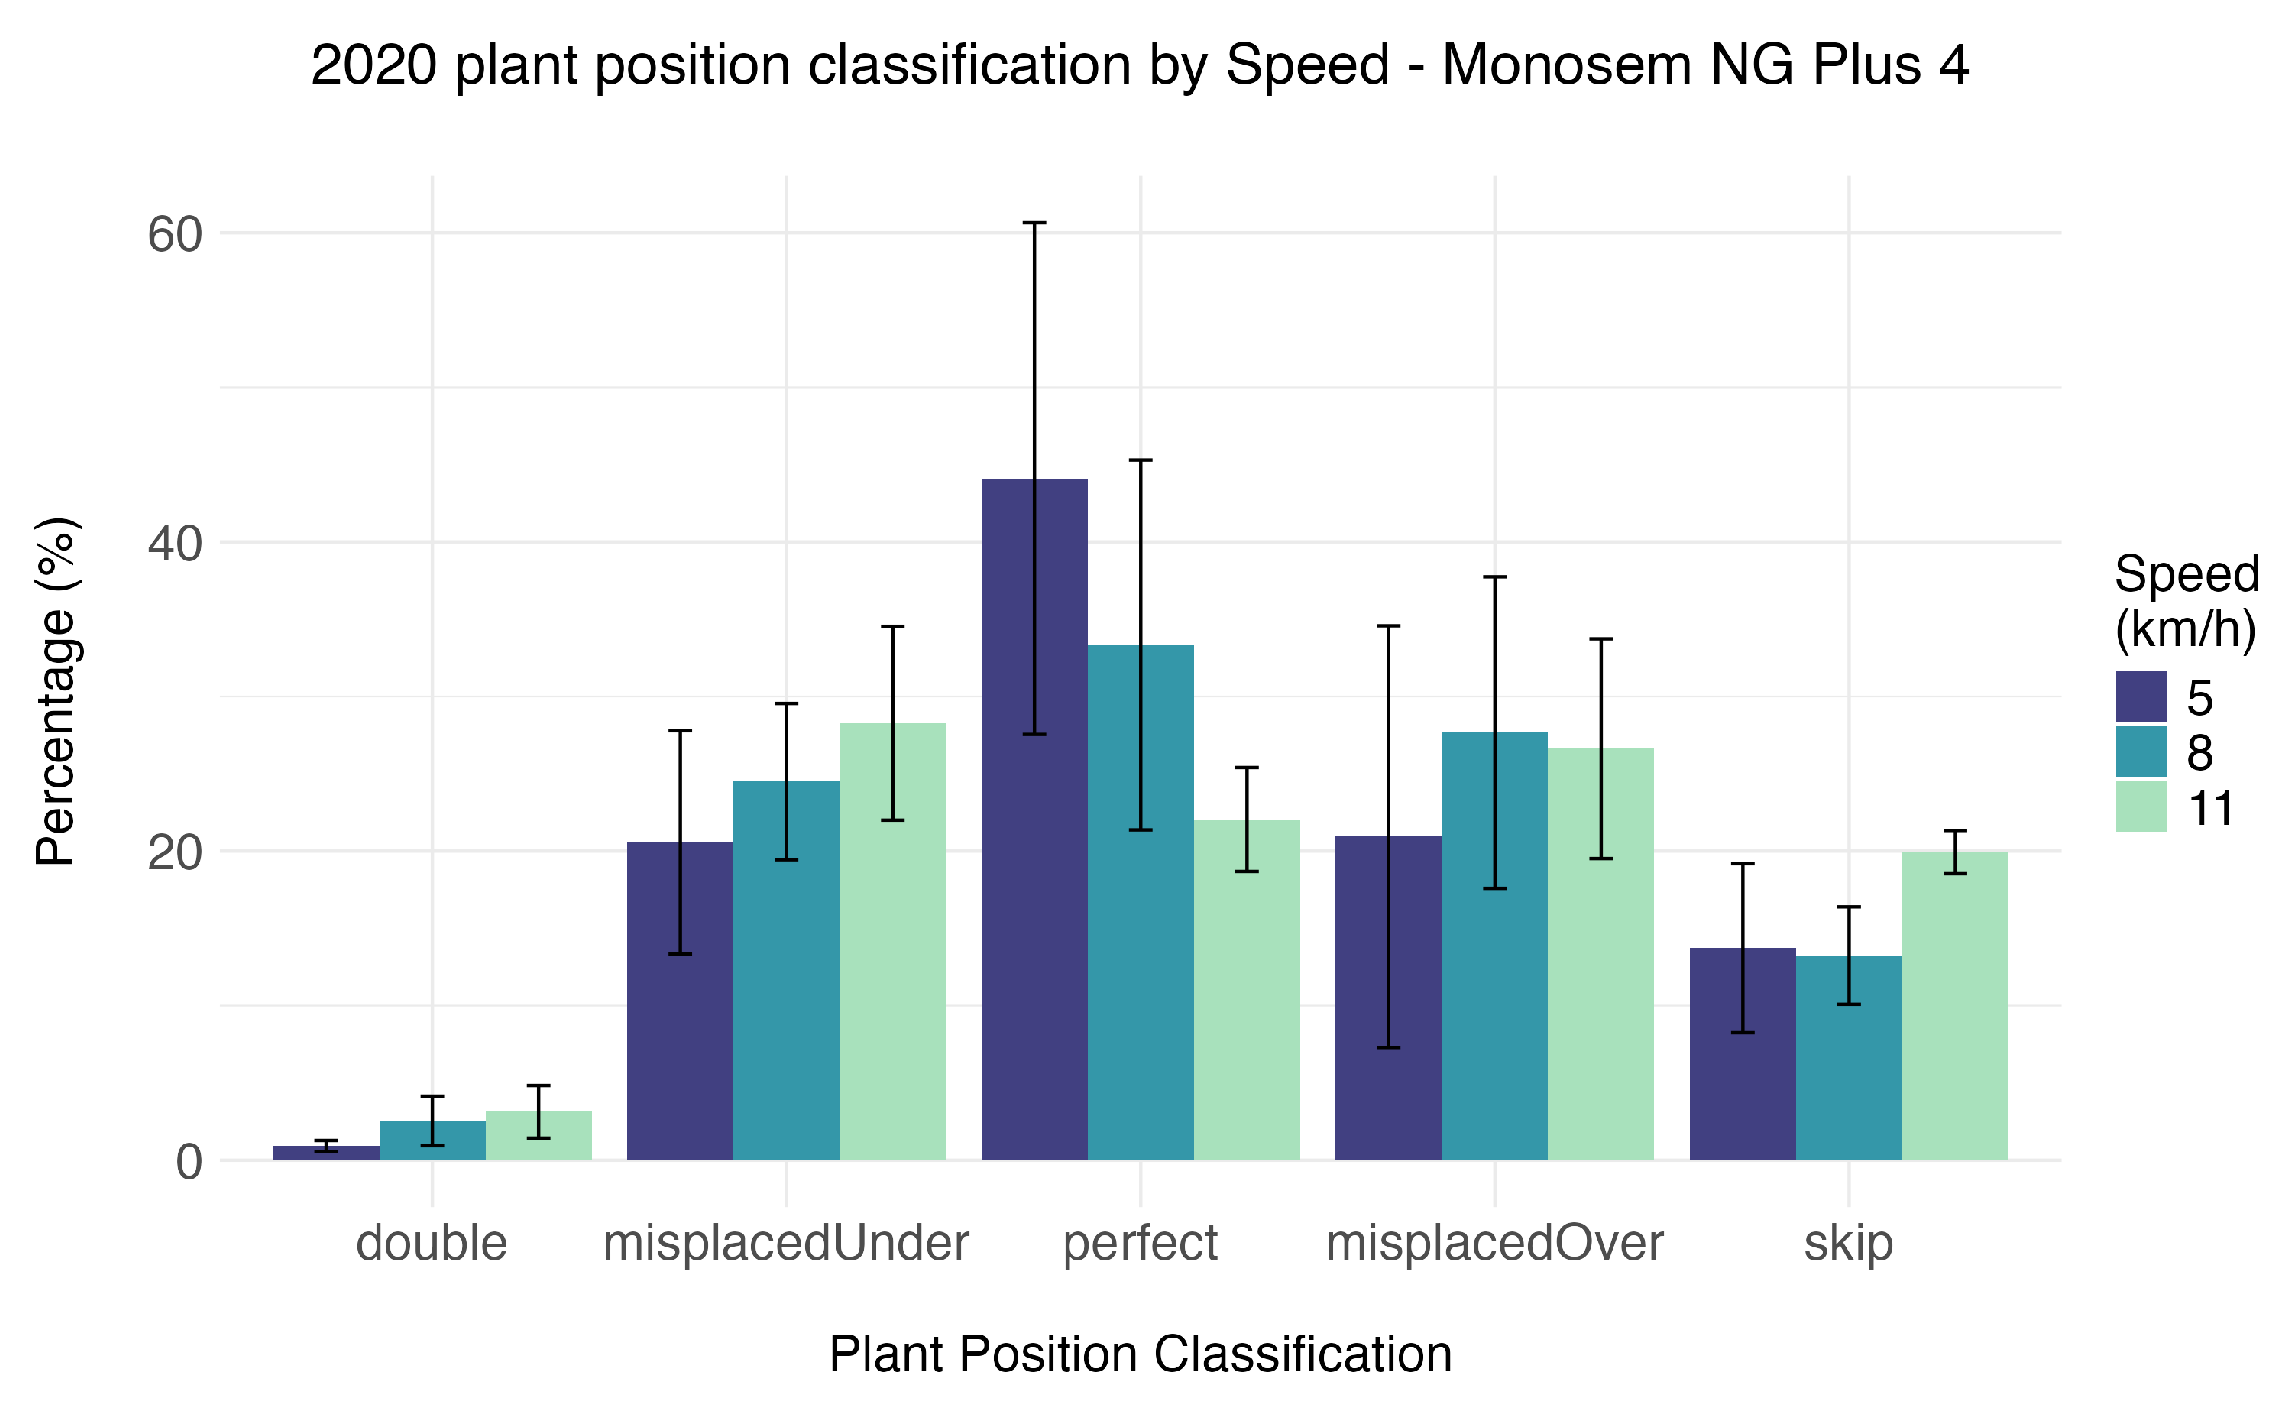
Although the achieved population was not affected by planting speed or downforce, spacing uniformity declined with increasing speed in both years for which spacing data were available. Across downforce levels, the percentage of perfectly spaced plants decreased from 44.0% at 5 km to 32.9% at 8 km and 22.1% at 11 km in 2020, and from 52.8% to 40.1% and 28.4%, respectively, in 2021. Plant position classification results by planting speed for 2020 and 2021 are shown in Figure 6 and Figure 8, respectively, and the percentage of perfectly spaced plants by speed and downforce is shown in Figure 7 and Figure 9. Spacing data were not available for 2023 because of data-collection limitations.
Figure 6.
Plant position classification by planting speed in 2020 using the MS planter. Error bars represent ±1 standard deviation.
3.1.3. Lint Yield
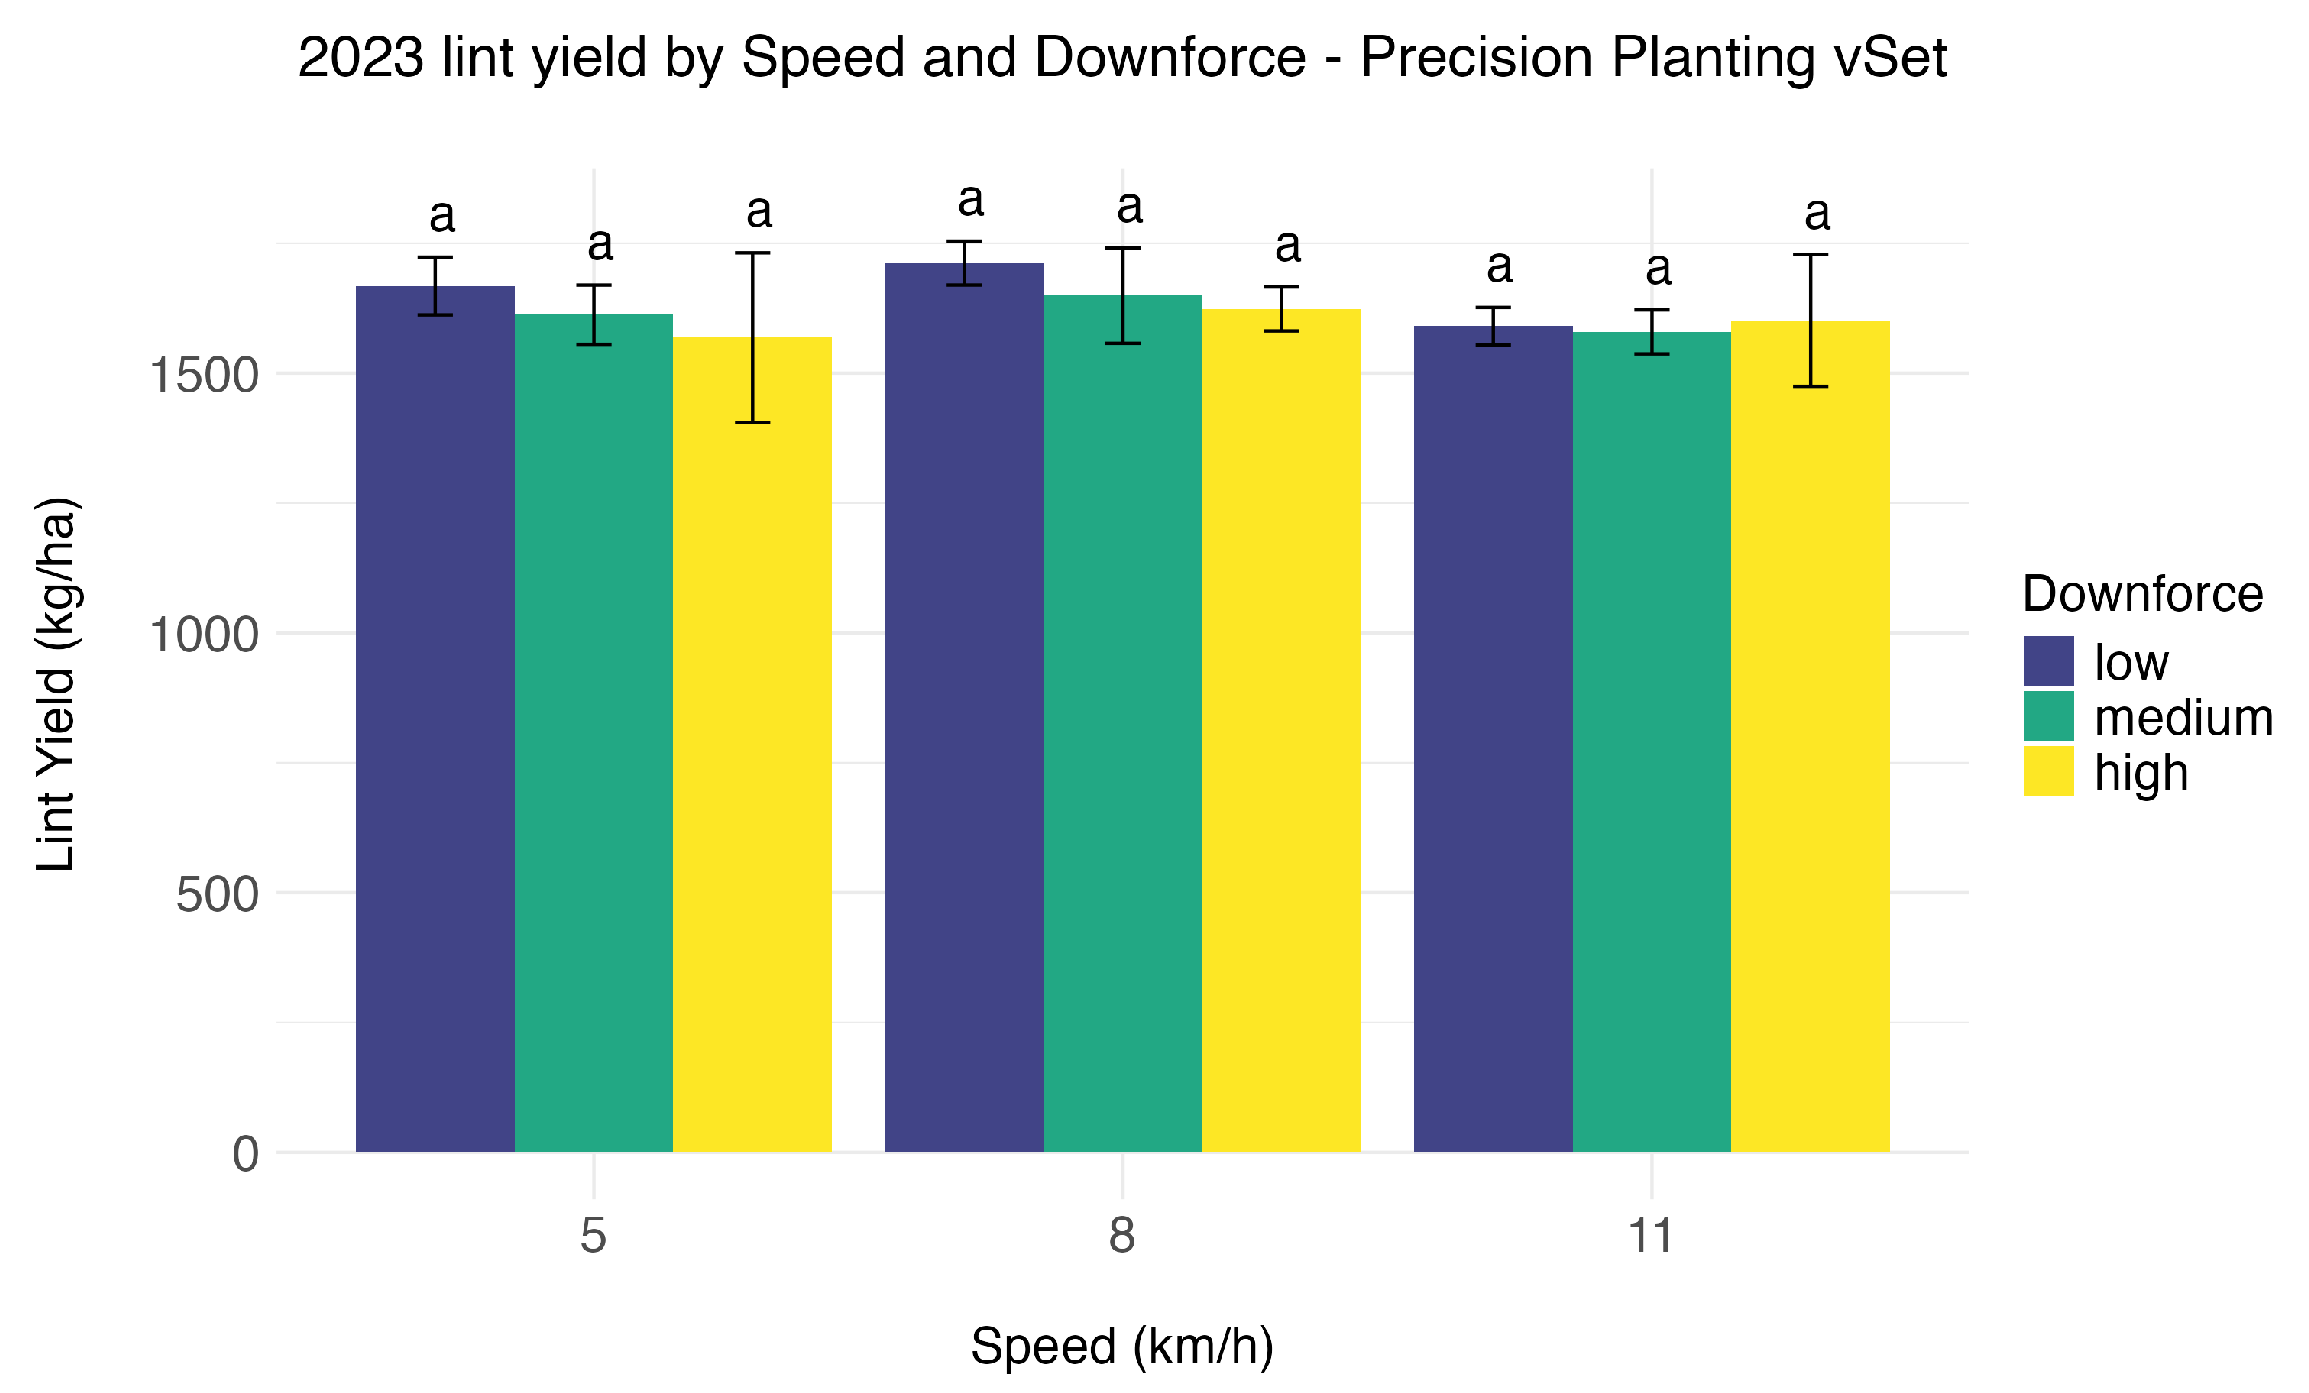
Significant differences in lint yield were detected among treatment means in 2020 and 2021. In 2020, the planting speed × downforce interaction was significant (F = 3.54, p = 0.021; Supplementary Table S3), and Tukey-adjusted mean separation showed that lint yield was higher for the 5 km and 8 km treatments with medium downforce than for the 11 km treatment with high downforce (Figure 10). In 2021, the interaction term was not significant (F = 1.52, p = 0.229; Supplementary Table S3); therefore, the specific treatment differences described here refer to Tukey-adjusted pairwise comparisons among treatment means from the fitted model. In that year, lint yield was higher for the 5 km treatment with high downforce than for the 11 km treatments with low or medium downforce (Figure 11). No significant differences in lint yield were detected among treatments in 2023 (Figure 12).
Figure 7.
Percentage of perfectly spaced plants by planting speed and downforce in 2020 using the MS planter. Error bars represent ±1 standard deviation.
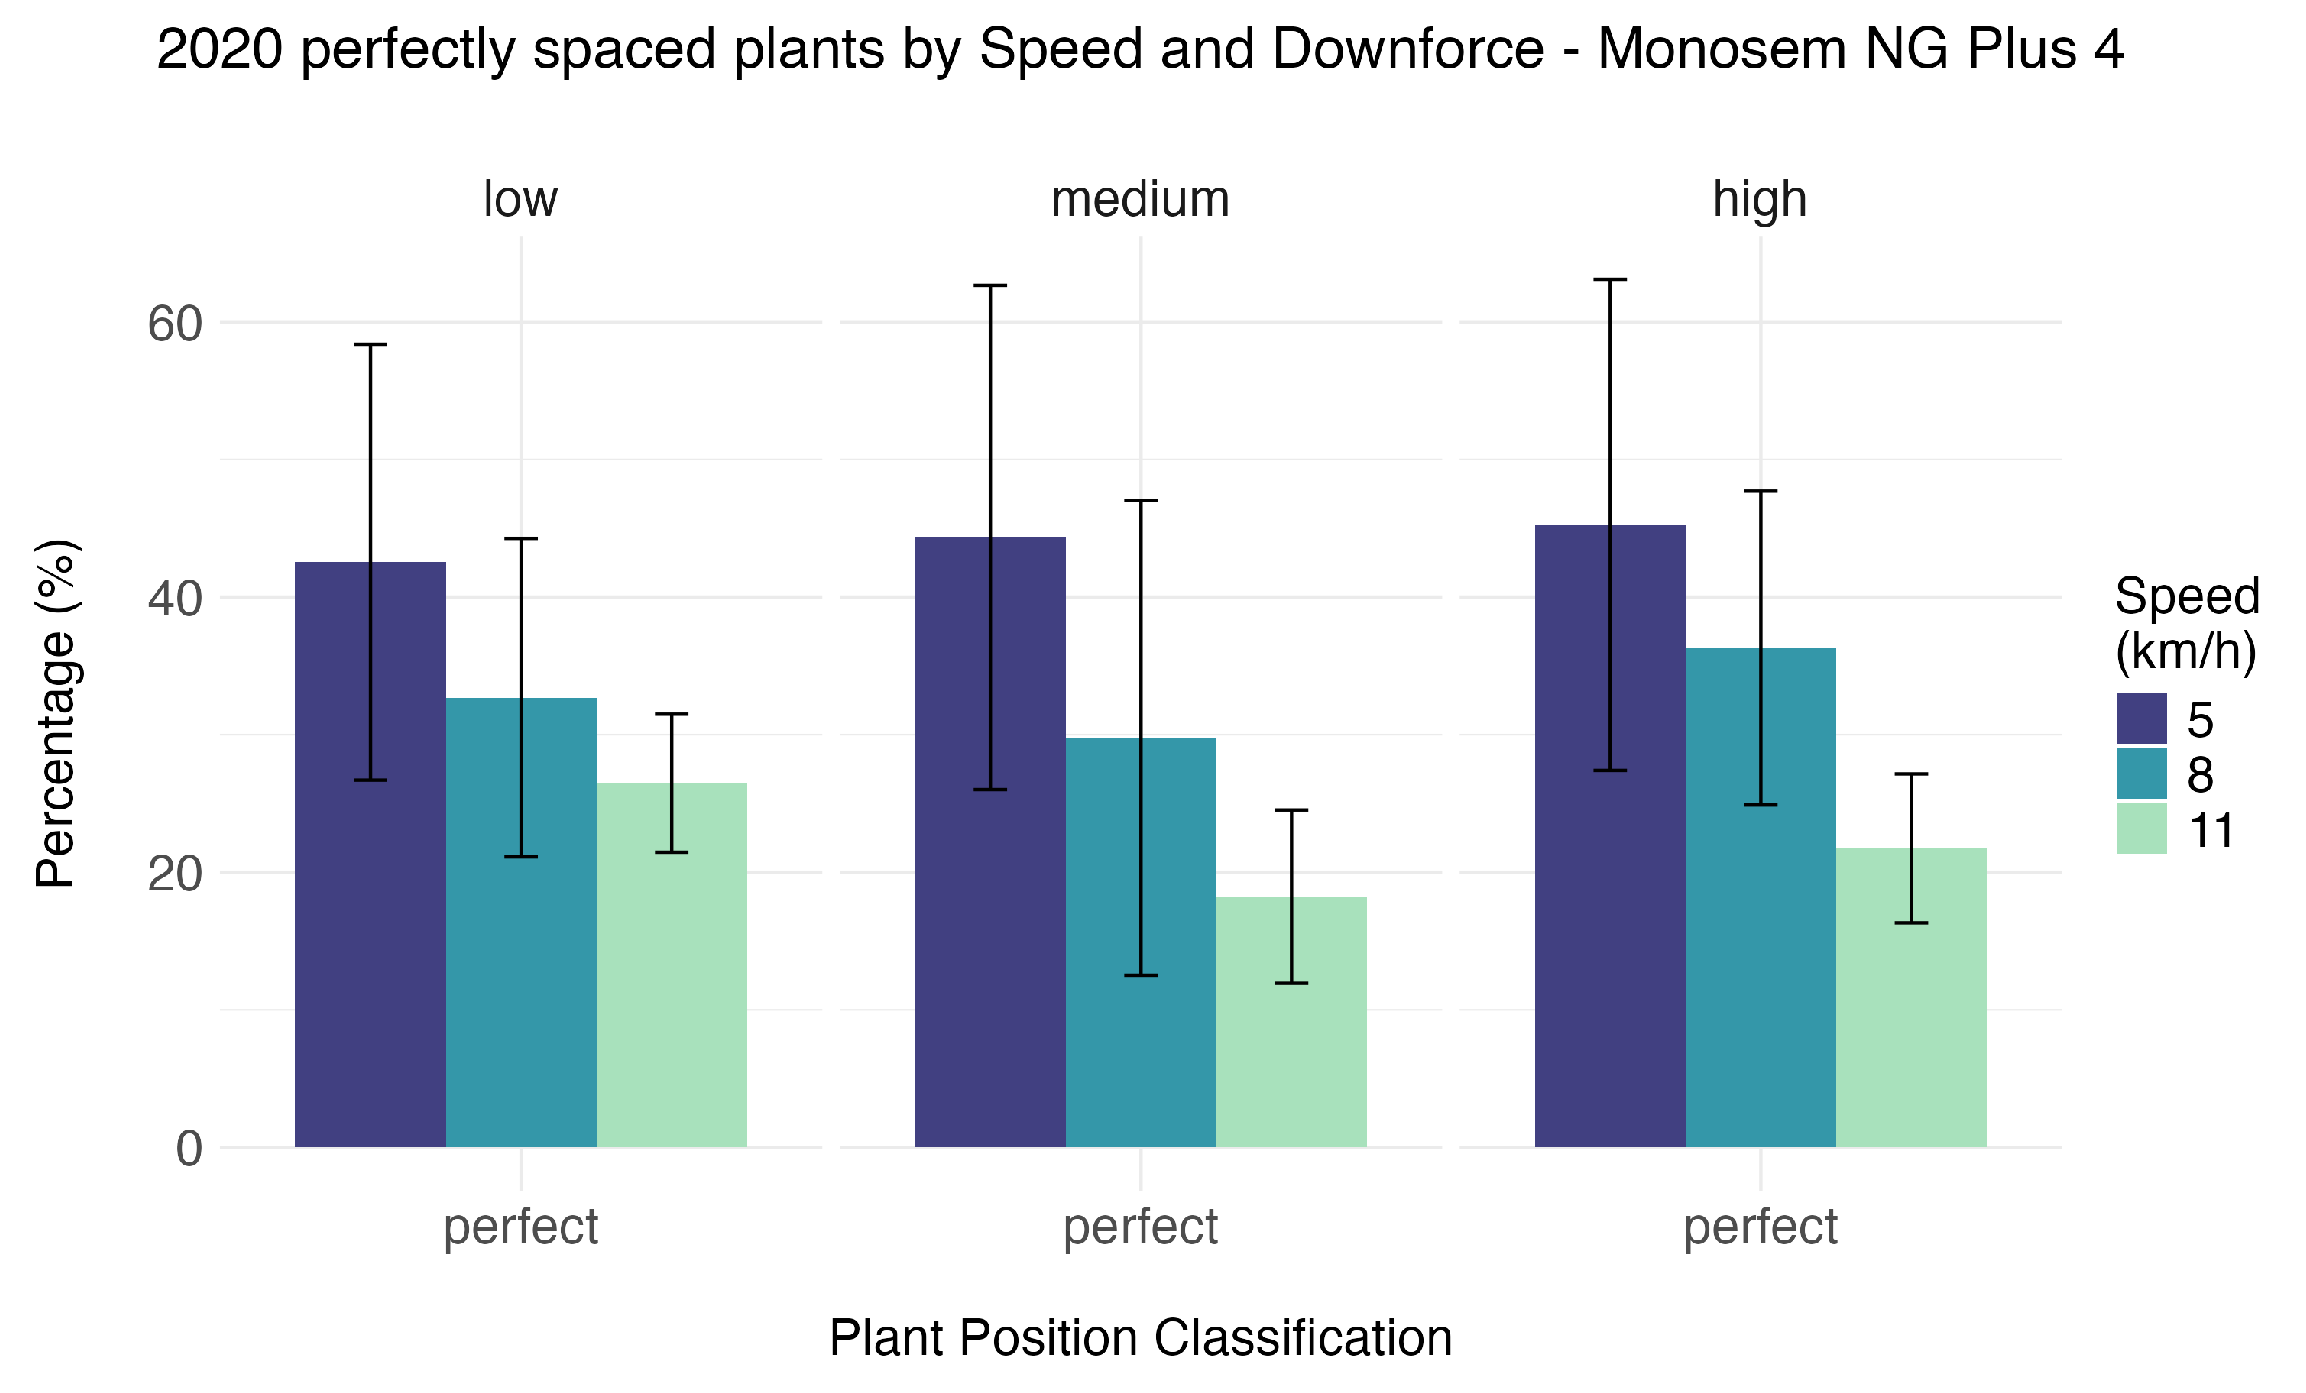
Figure 8.
Plant position classification by planting speed in 2021 using the MS planter. Error bars represent ±1 standard deviation.
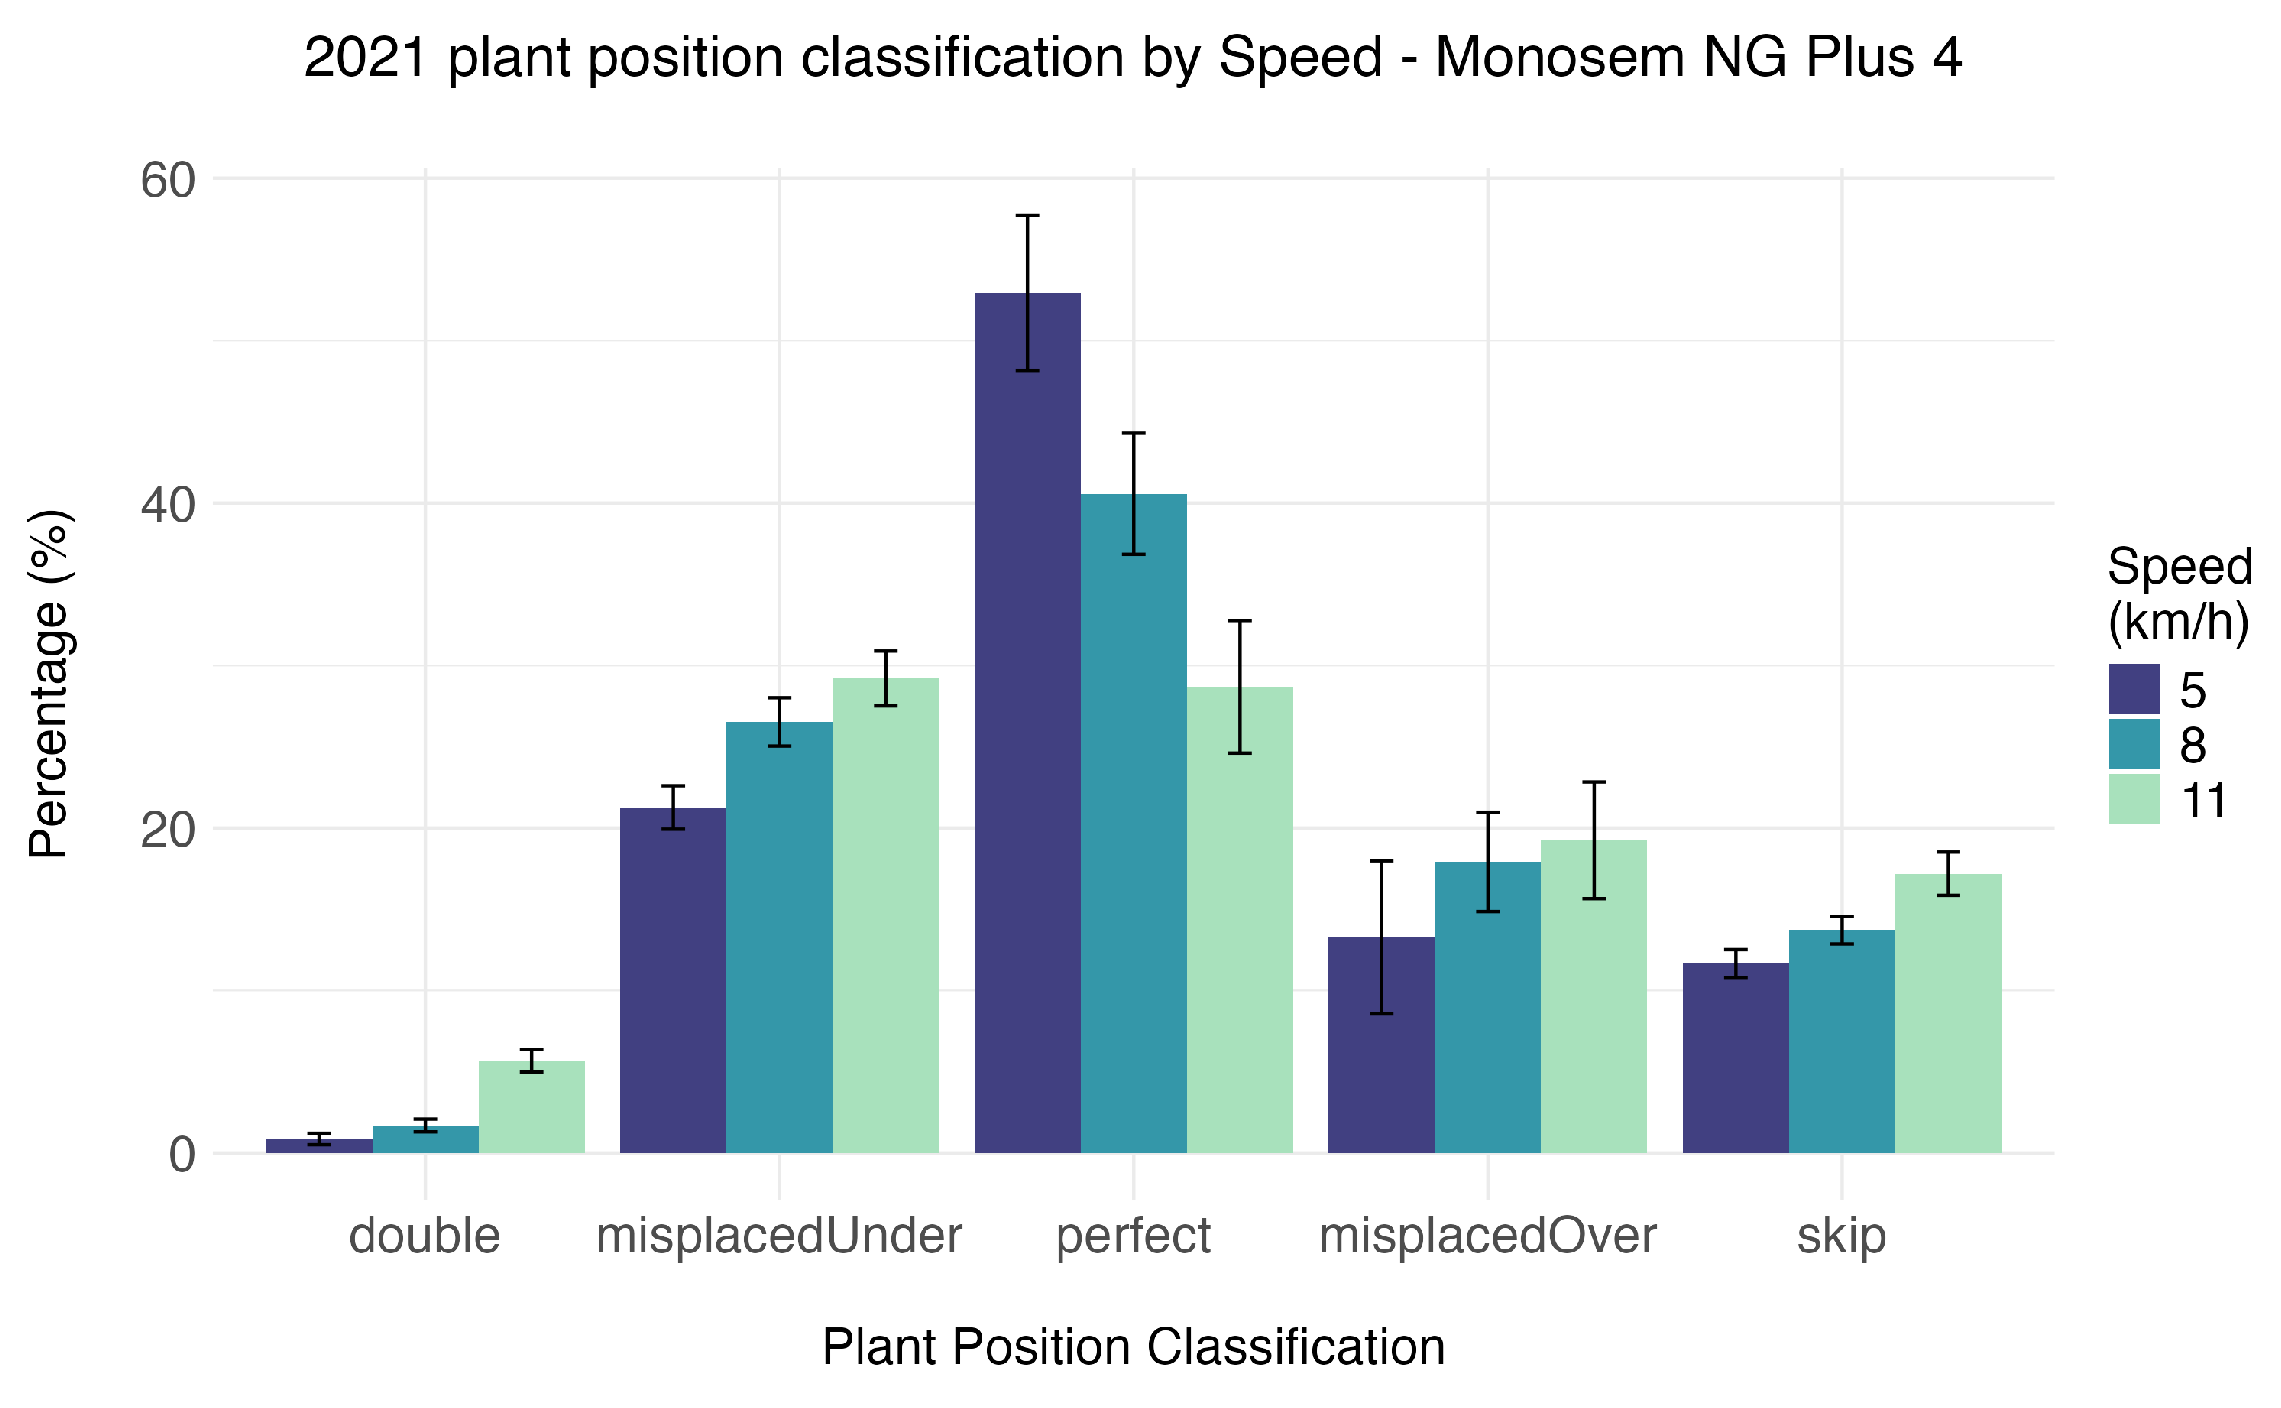
Figure 9.
Percentage of perfectly spaced plants by planting speed and downforce in 2021 using the MS planter. Error bars represent ±1 standard deviation.
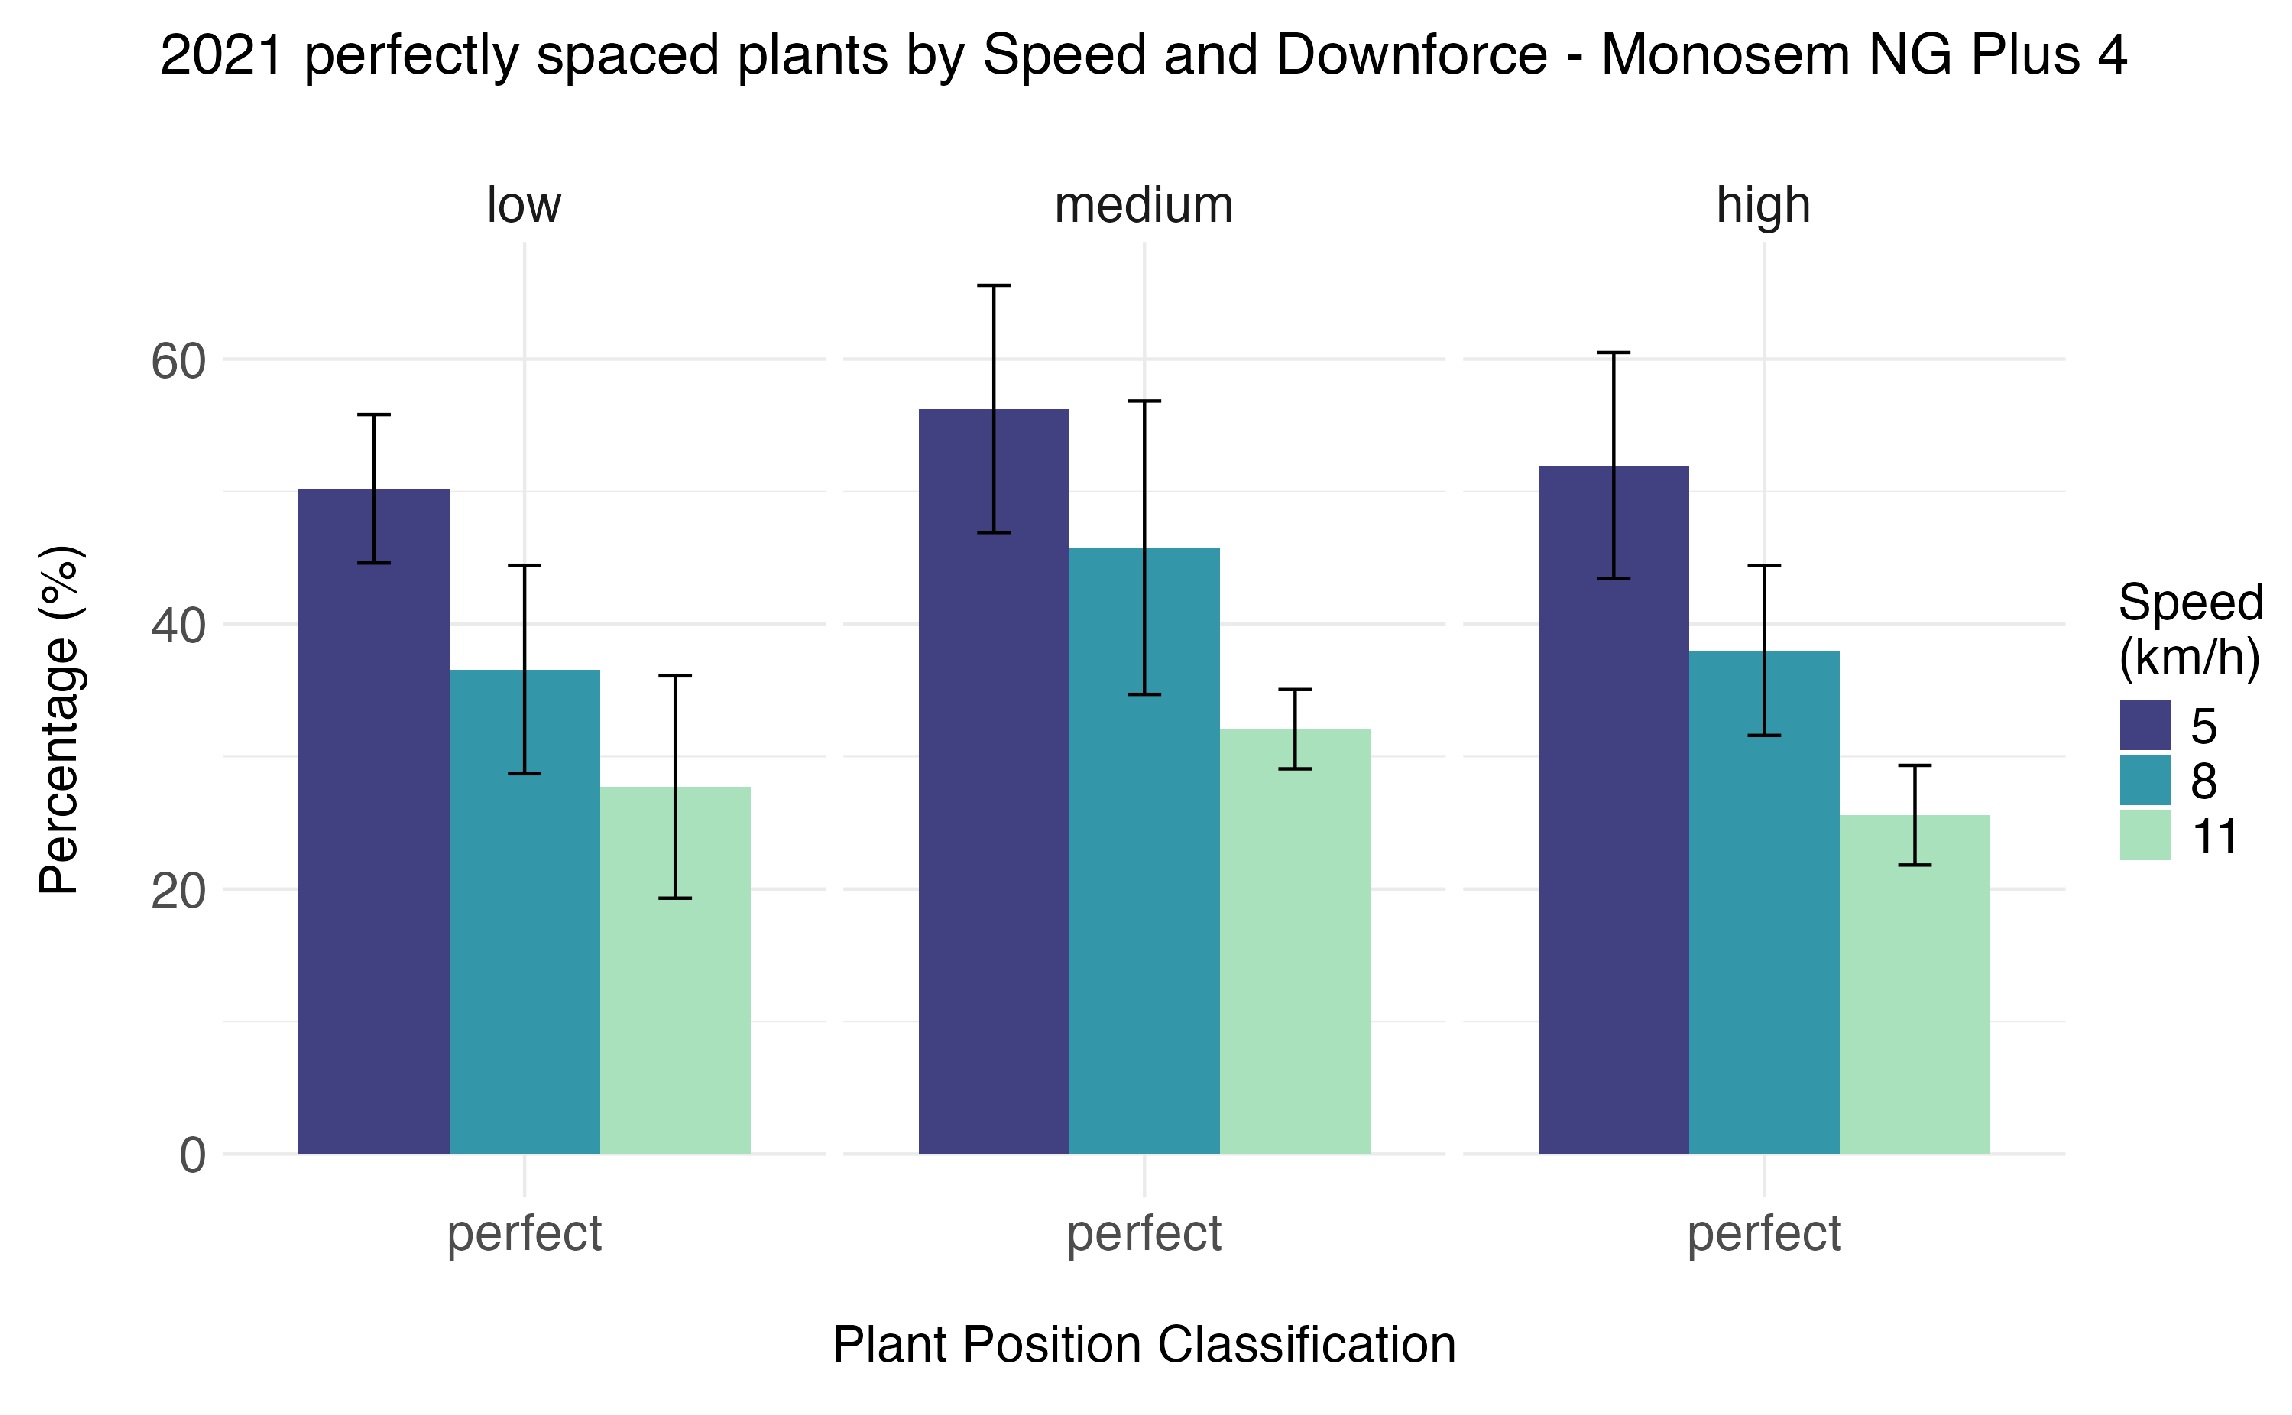
Figure 10.
Lint yield by planting speed and downforce in 2020 using the MS planter. Bars sharing a common letter are not significantly different at based on Tukey-adjusted mean separation. Error bars represent ±1 standard deviation.
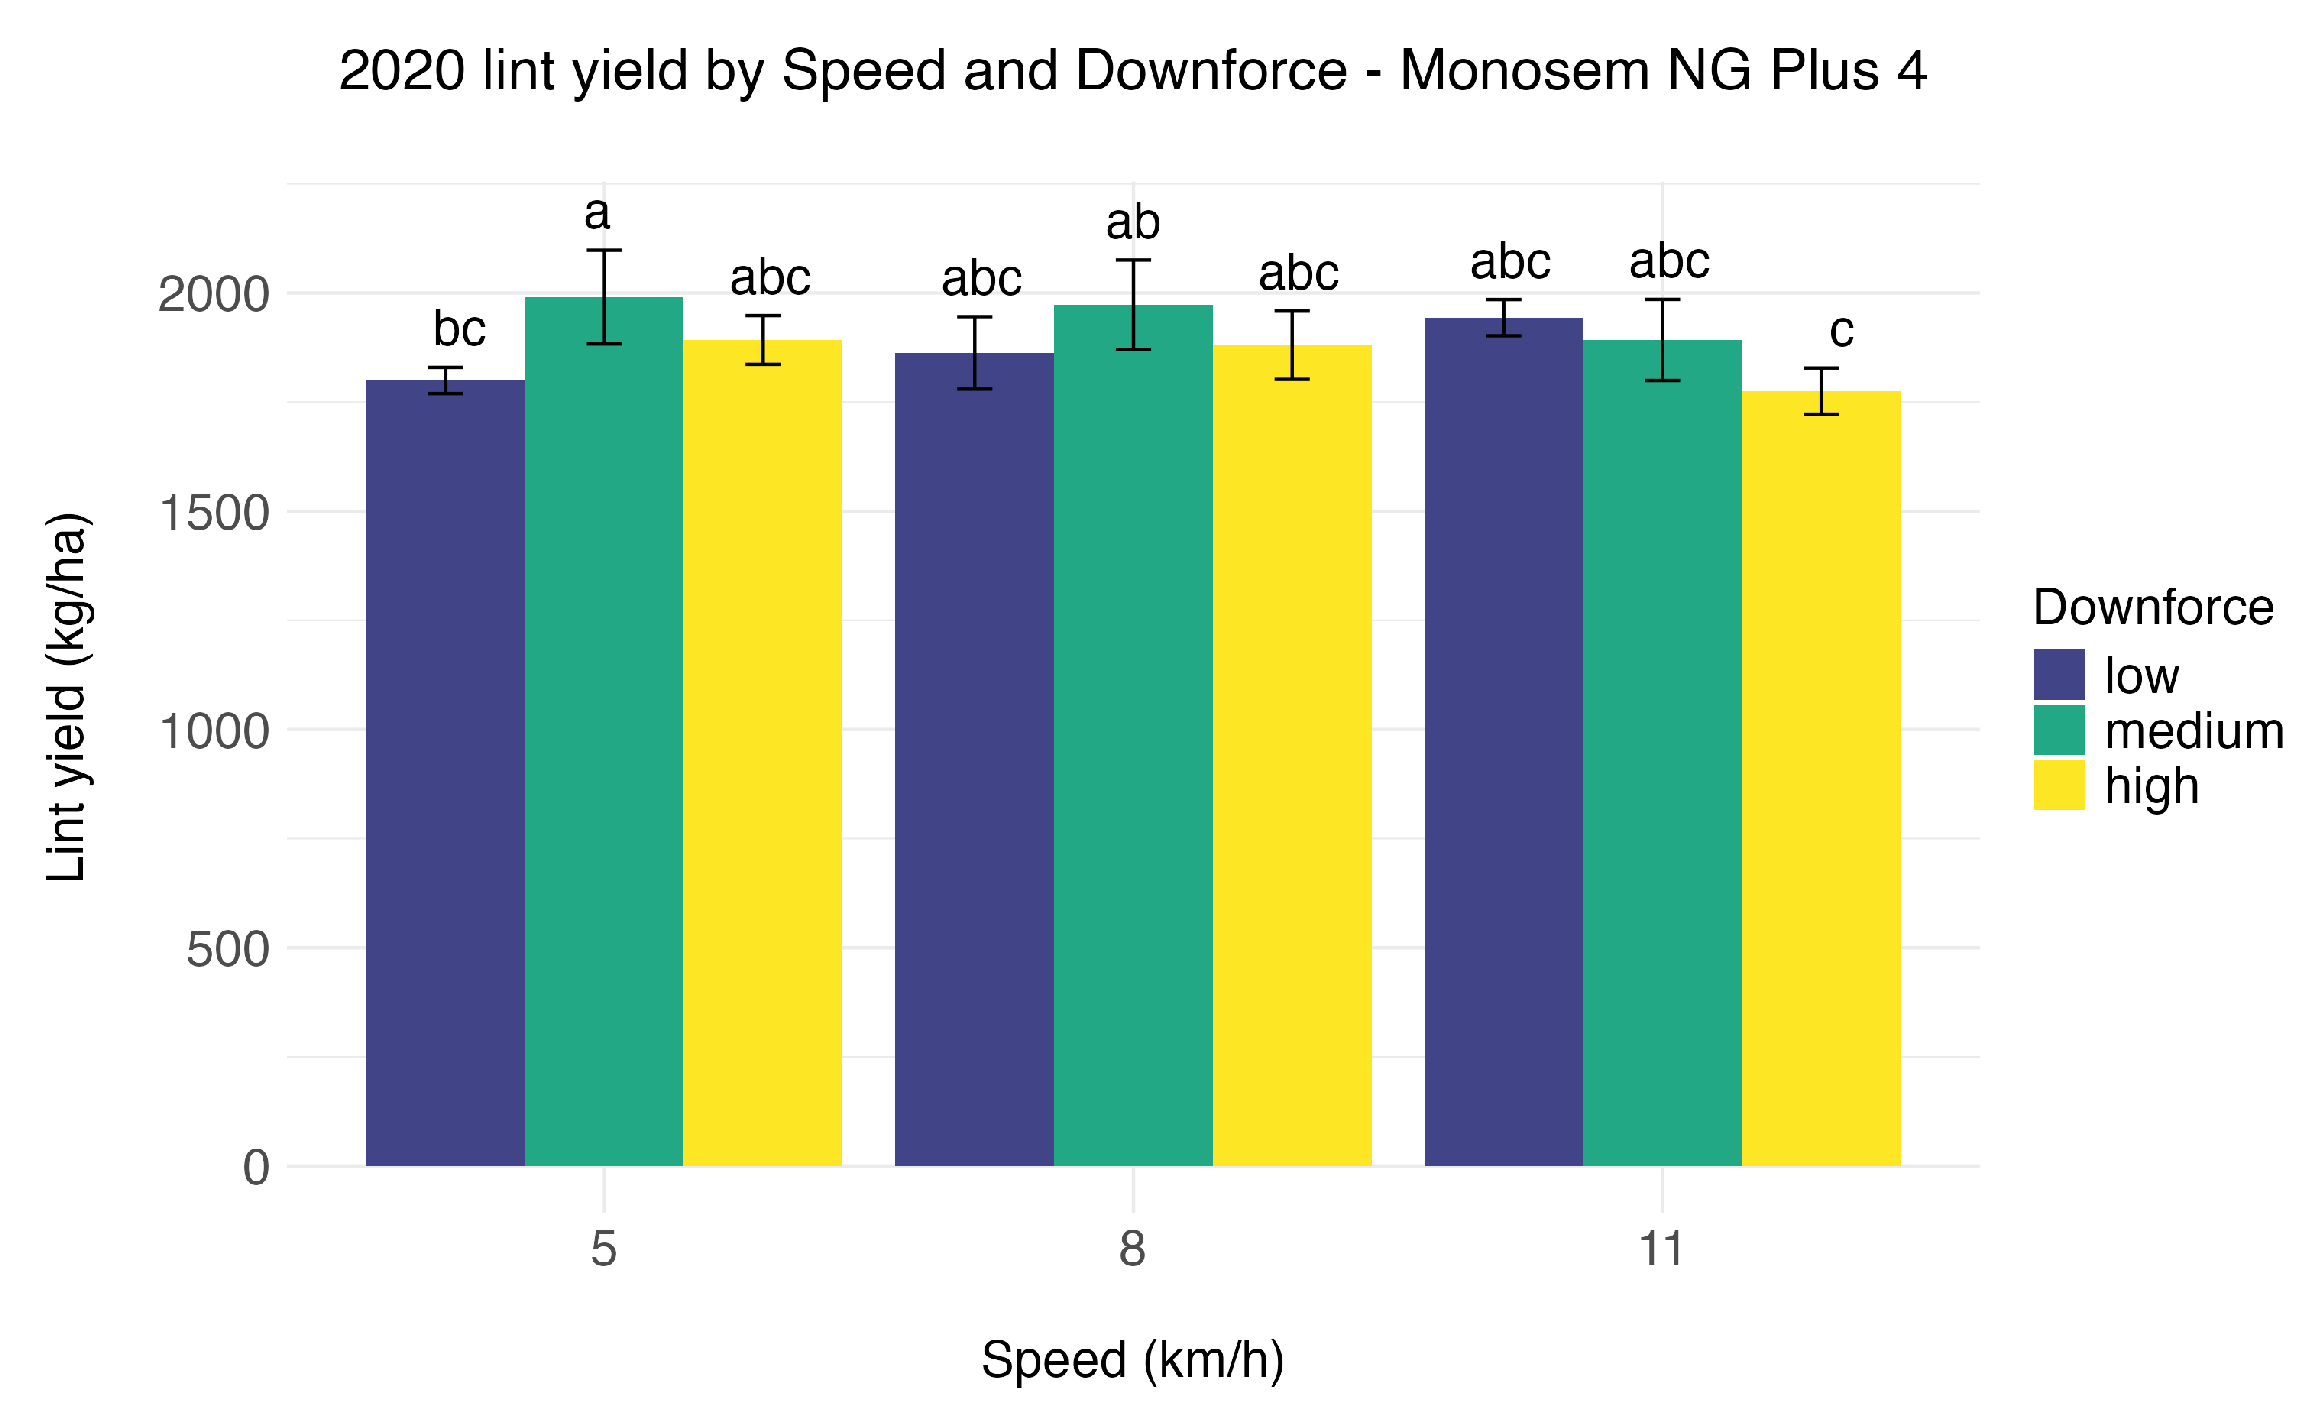
Figure 11.
Lint yield by planting speed and downforce in 2021 using the MS planter. Bars sharing a common letter are not significantly different at based on Tukey-adjusted mean separation. Error bars represent ±1 standard deviation.
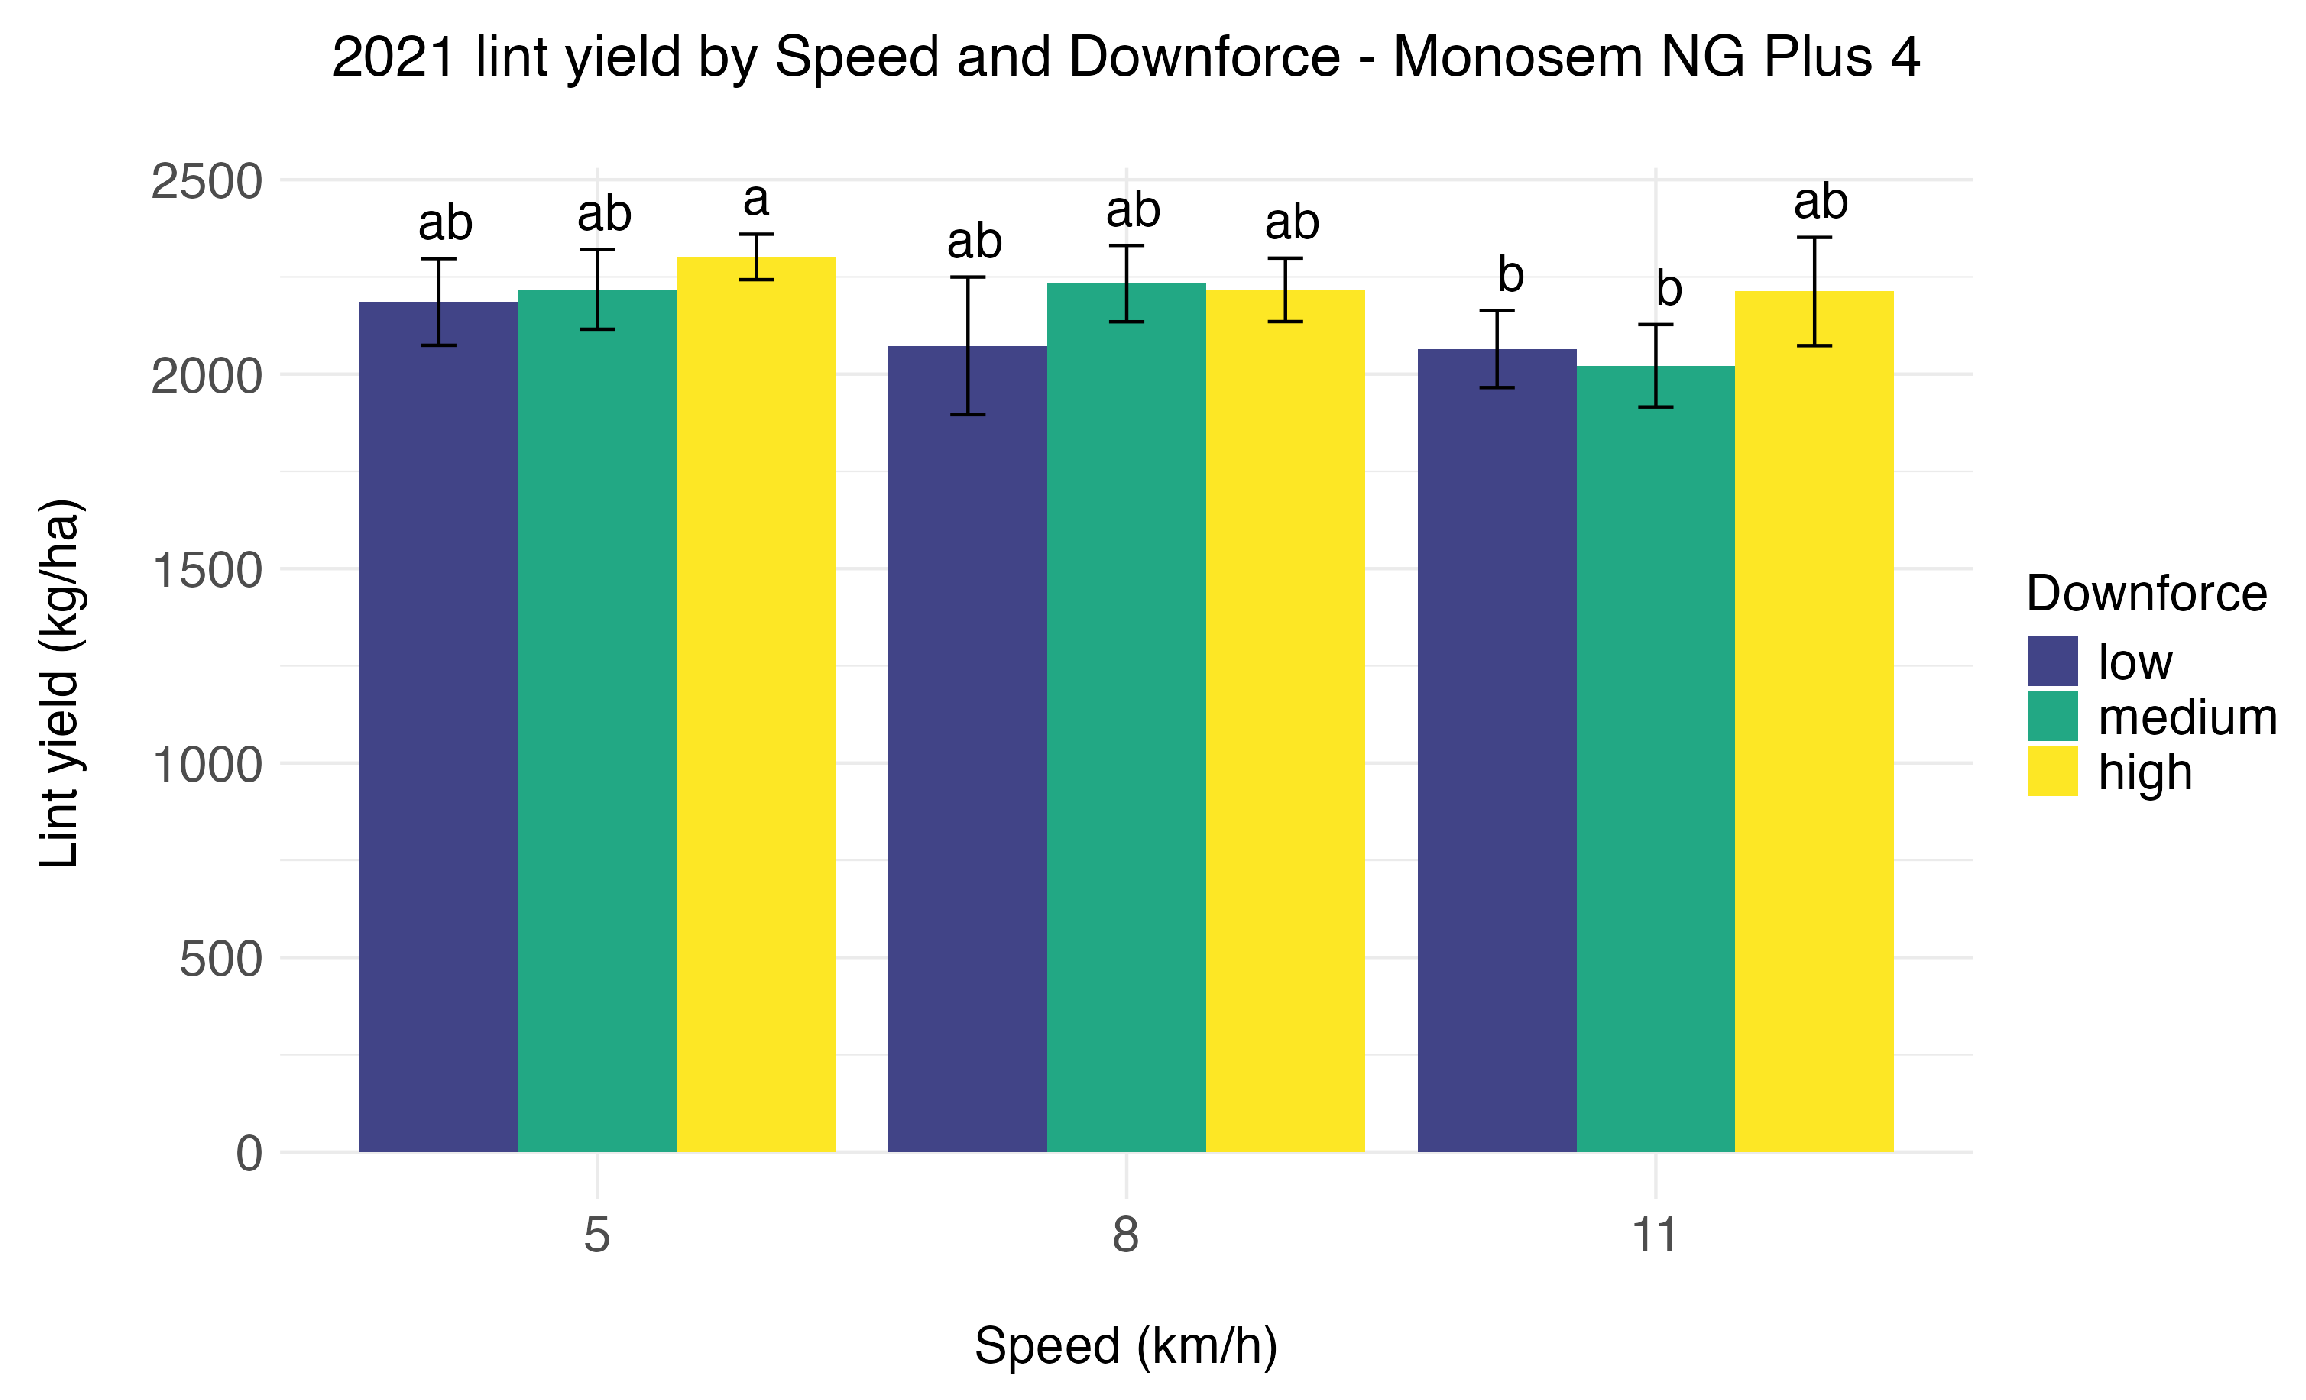
Figure 12.
Lint yield by planting speed and downforce in 2023 using the PP planter. Bars sharing a common letter are not significantly different at based on Tukey-adjusted mean separation. Error bars represent ±1 standard deviation.
3.2. Seed Plate × Downforce Trials (2022 and 2024)
3.2.1. Achieved Population
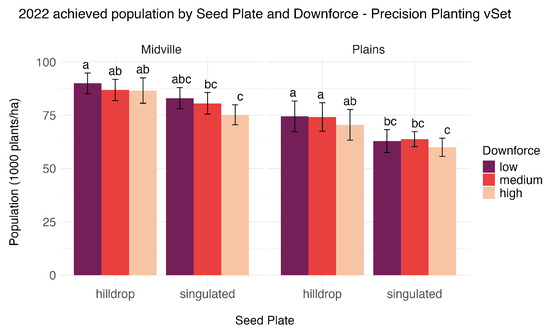
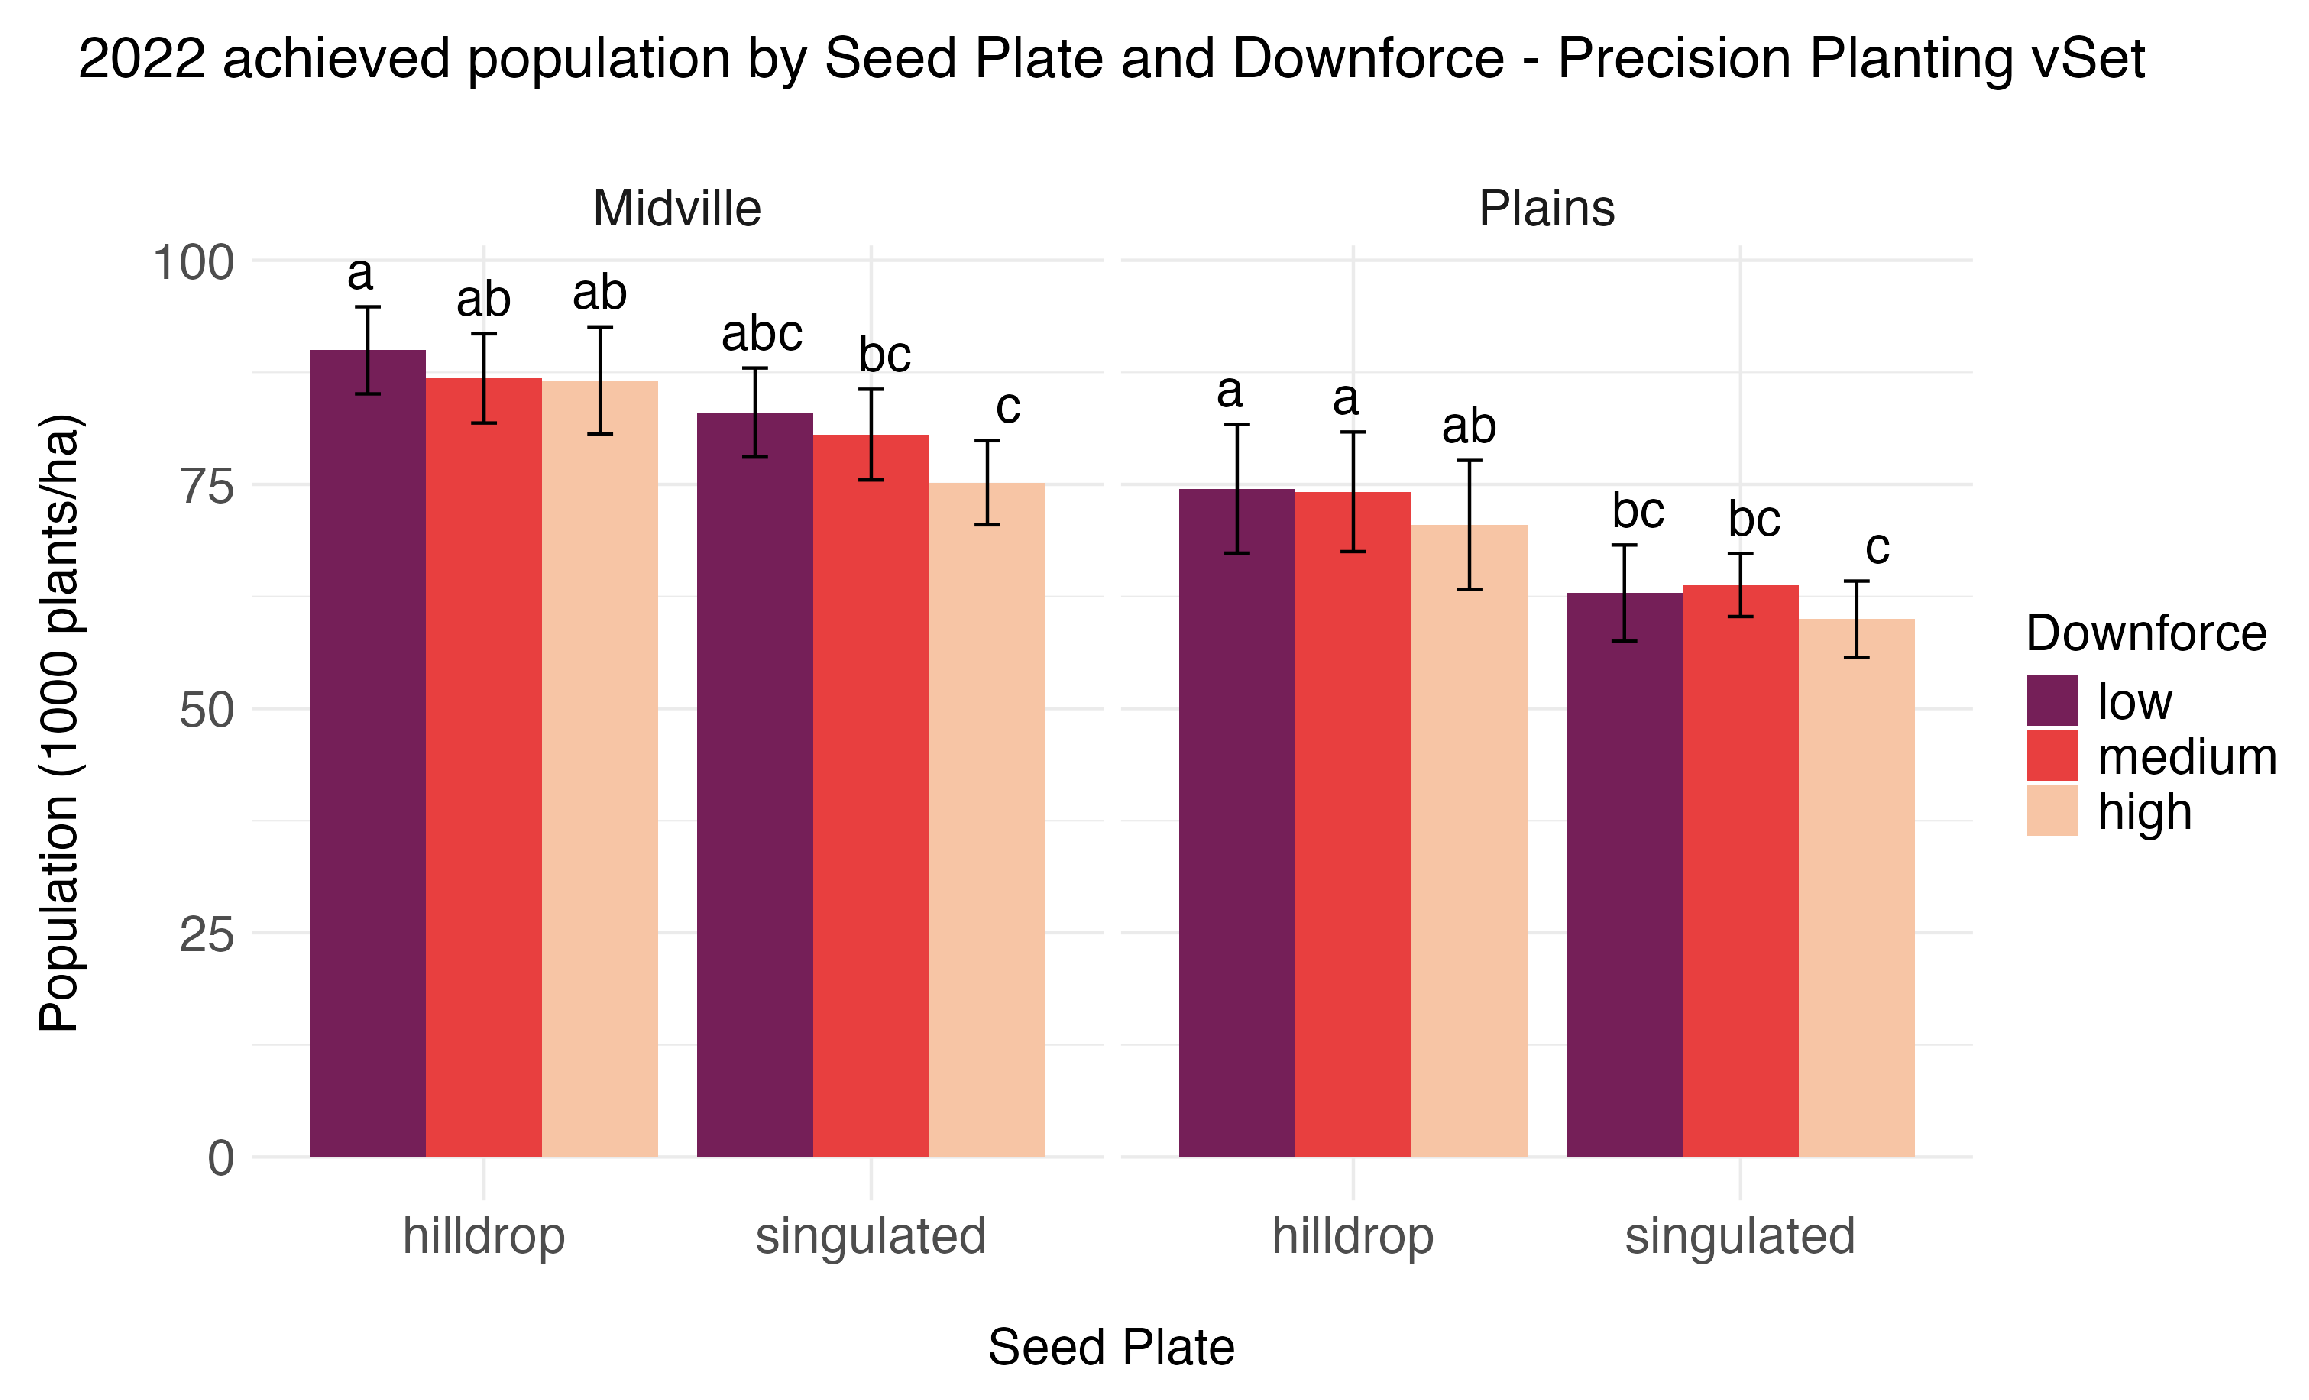
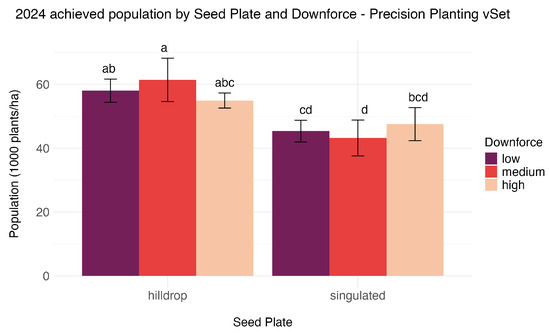
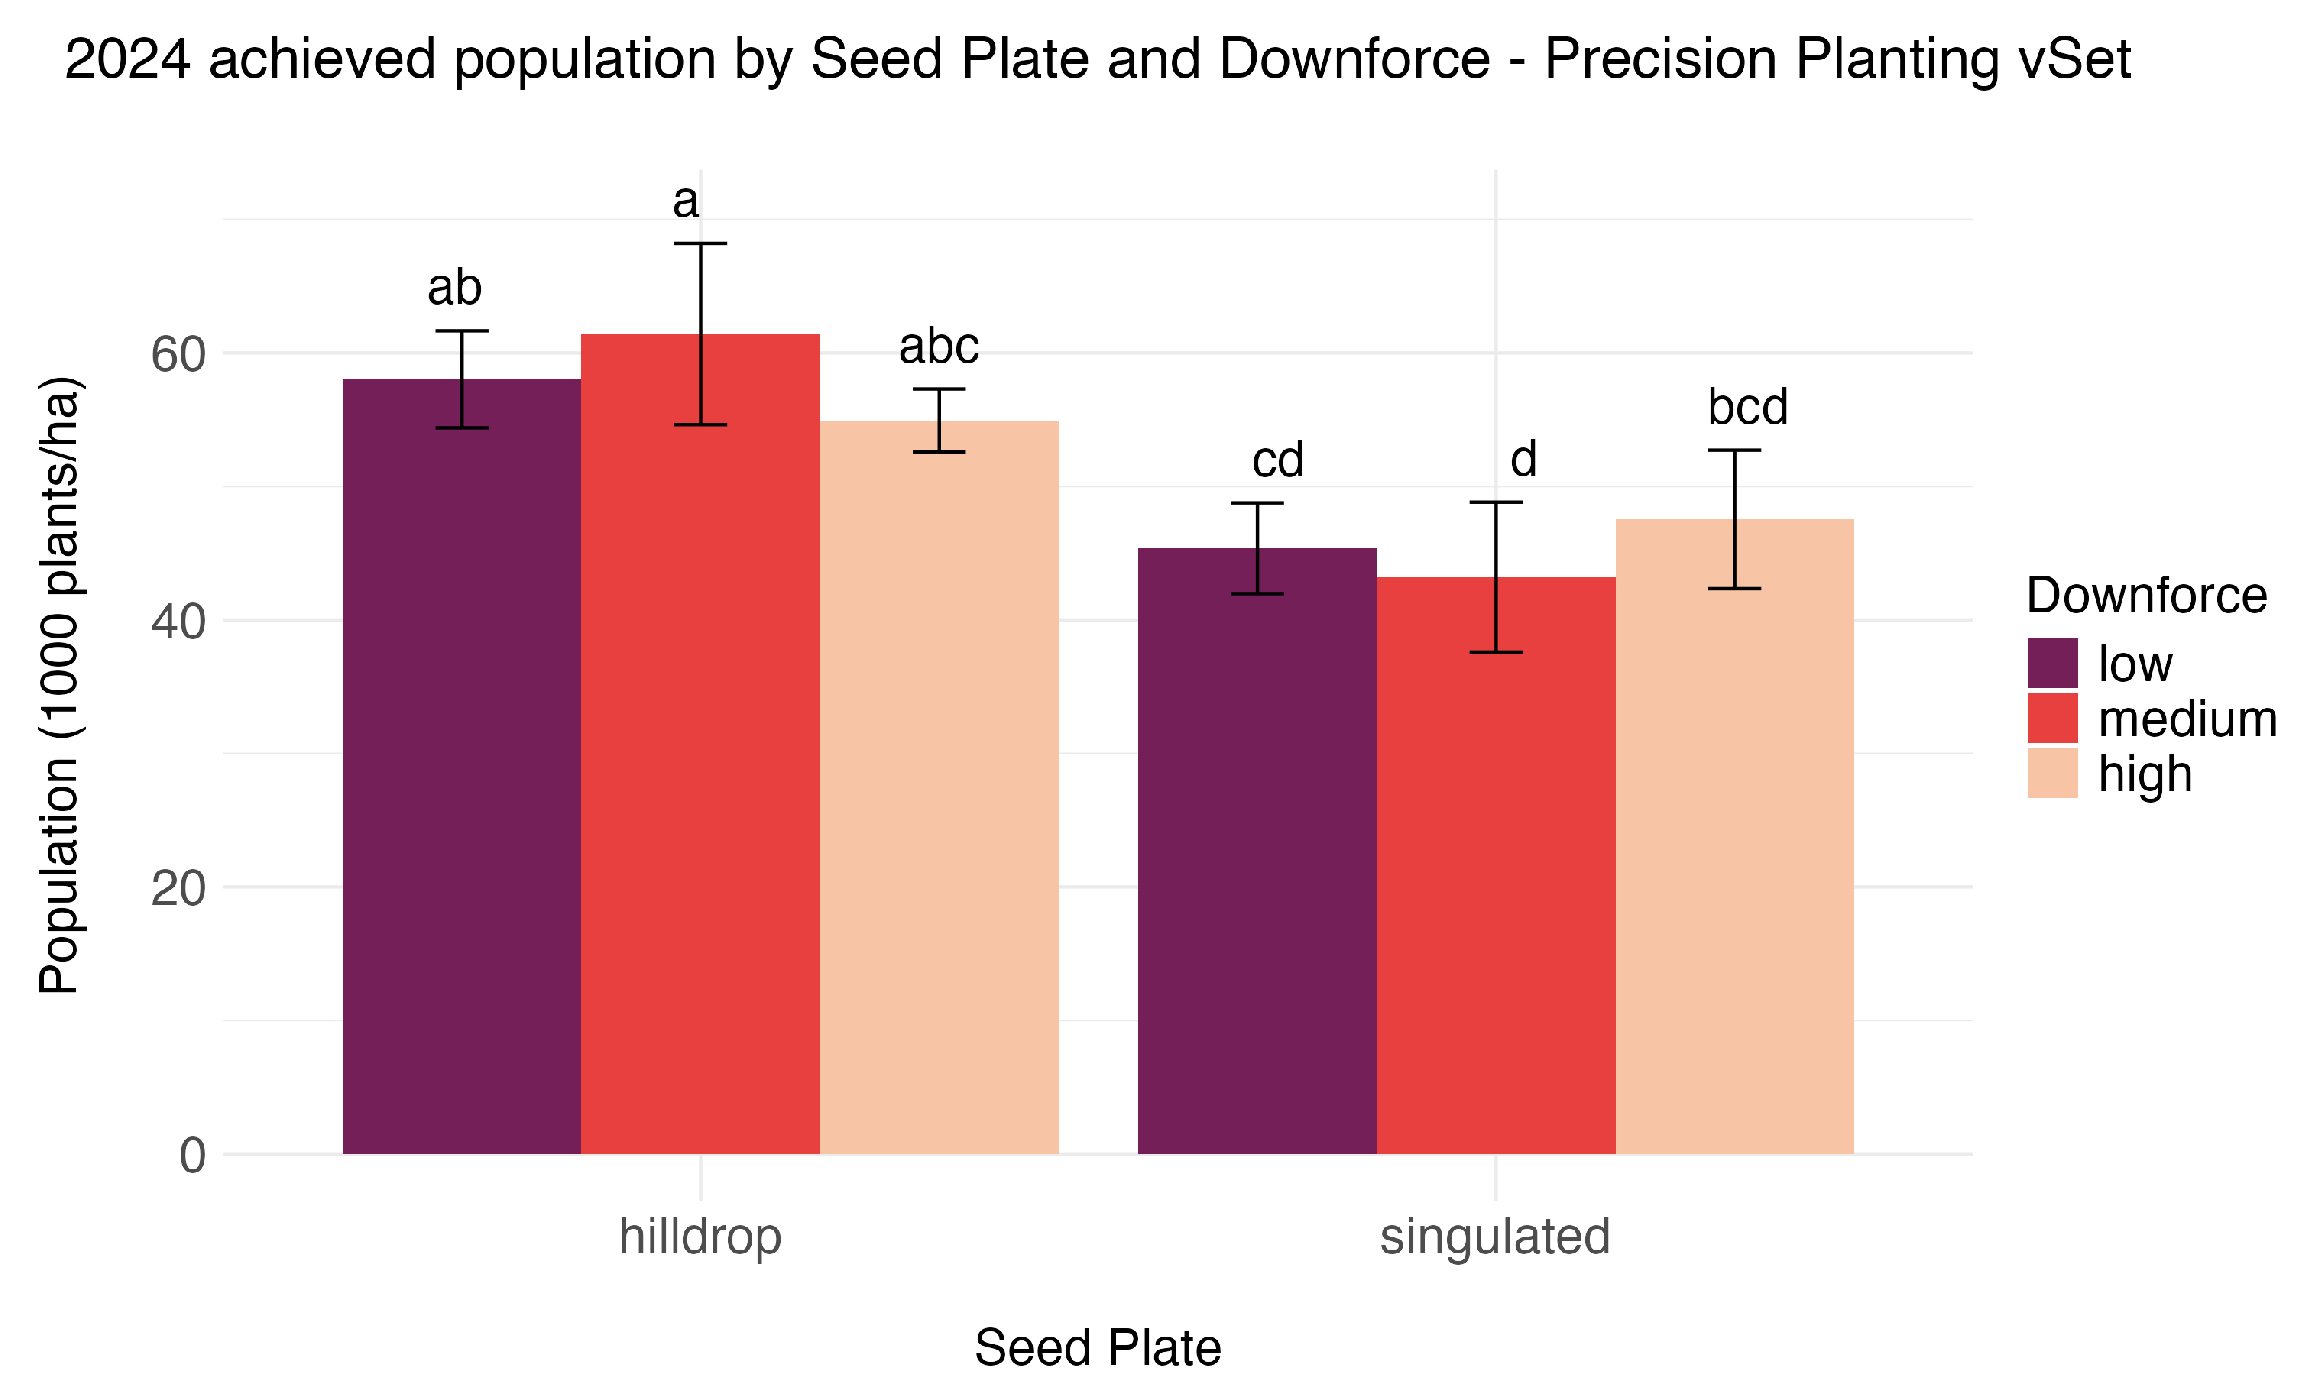
Seed plate configuration was the dominant source of variation in achieved population in the seed plate × downforce trials, with hill-drop plates producing higher achieved populations than singulated plates. Downforce effects were not consistent across site-years and locations (Supplementary Table S4). In 2022, the mean achieved population increased from 79.6 to 87.8 thousand plants h at Midville and from 62.2 to 73.1 thousand plants h at Plains when hill-drop plates were used instead of singulated plates. In 2024 at Midville, the mean achieved population increased from 45.4 to 58.1 thousand plants h with hill-drop planting. Achieved population results for 2022 and 2024 are shown in Figure 13 and Figure 14, respectively.
Figure 13.
Achieved population by seed plate configuration and downforce in 2022 using the PP planter. Bars sharing a common letter are not significantly different at based on Tukey-adjusted mean separation. Error bars represent ±1 standard deviation.
Figure 14.
Achieved population by seed plate configuration and downforce in 2024 using the PP planter. Bars sharing a common letter are not significantly different at based on Tukey-adjusted mean separation. Error bars represent ±1 standard deviation.
3.2.2. Lint Yield
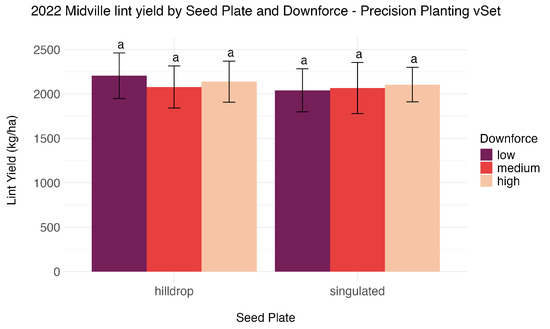
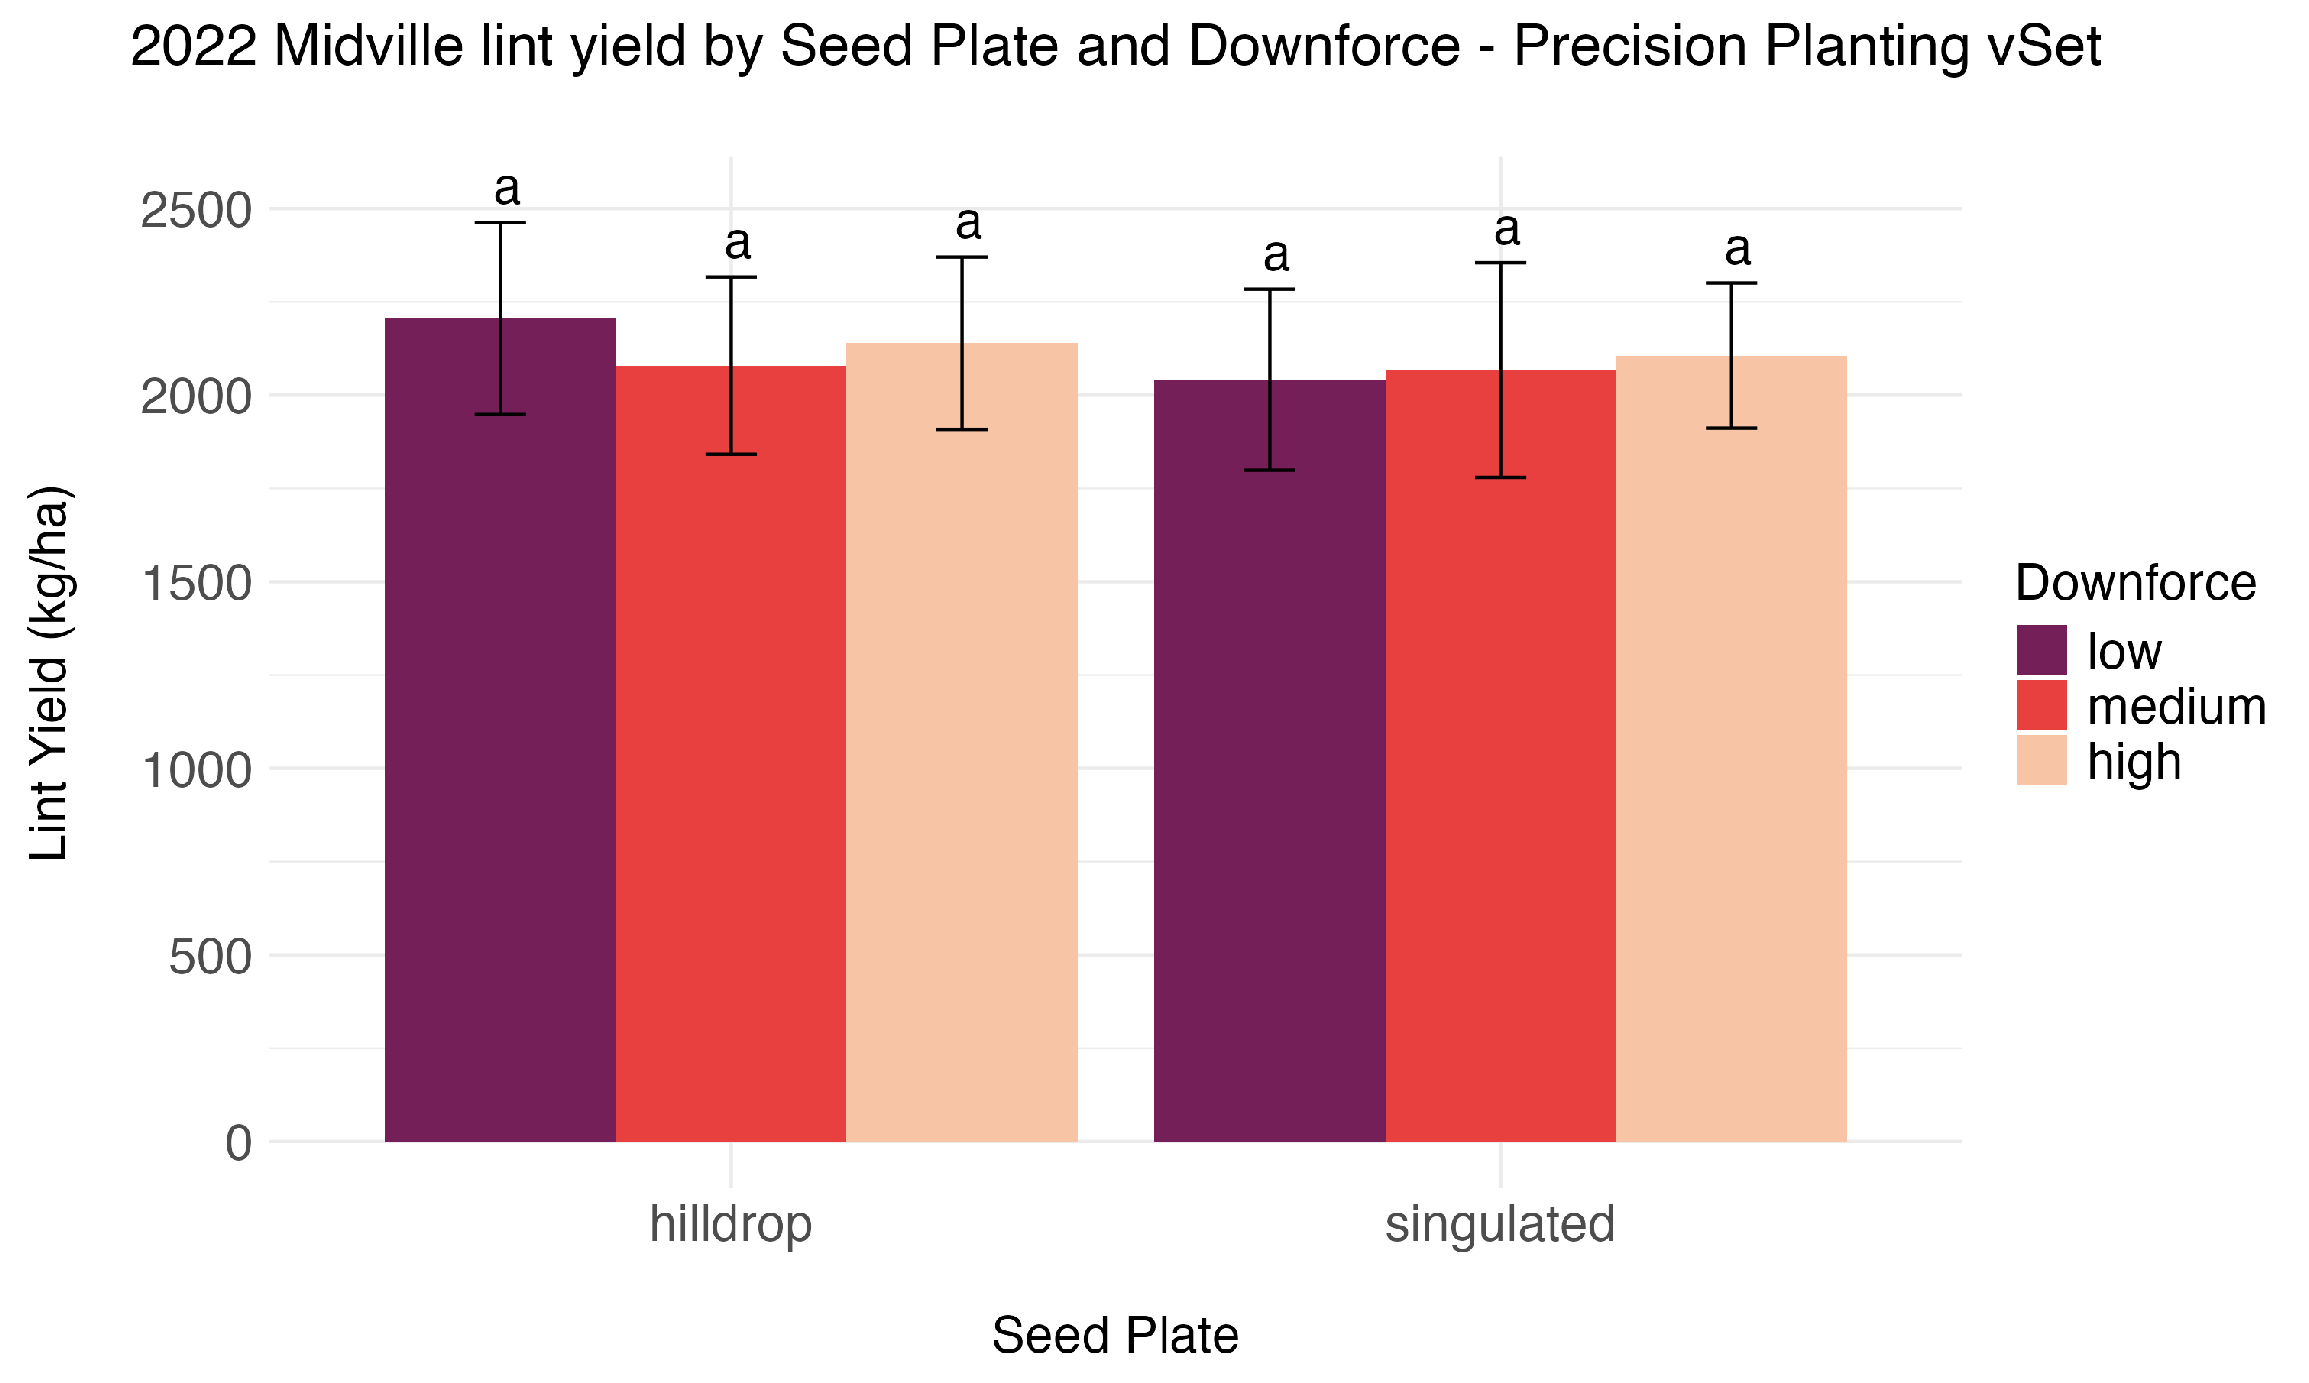
Despite differences in achieved population between seed plate configurations, no statistically significant differences in lint yield were detected between singulated and hill-drop planting in the harvested site-year (Figure 15). Yield data for the Plains location in 2022 were not collected, and the 2024 trial was not harvested due to hurricane damage (Hurricane Helene).
Figure 15.
Lint yield by seed plate configuration and downforce at Midville in 2022 using the PP planter. Bars sharing a common letter are not significantly different at based on Tukey-adjusted mean separation. Error bars represent ±1 standard deviation.
3.3. High-Speed Planting Trials (2025)
3.3.1. Achieved Population
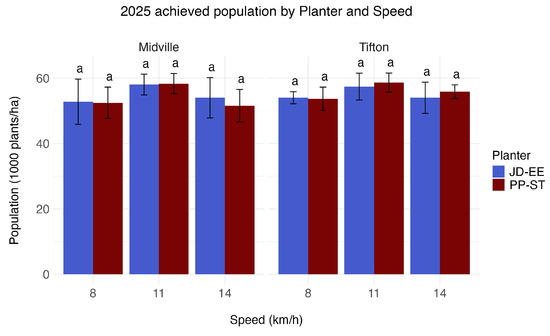
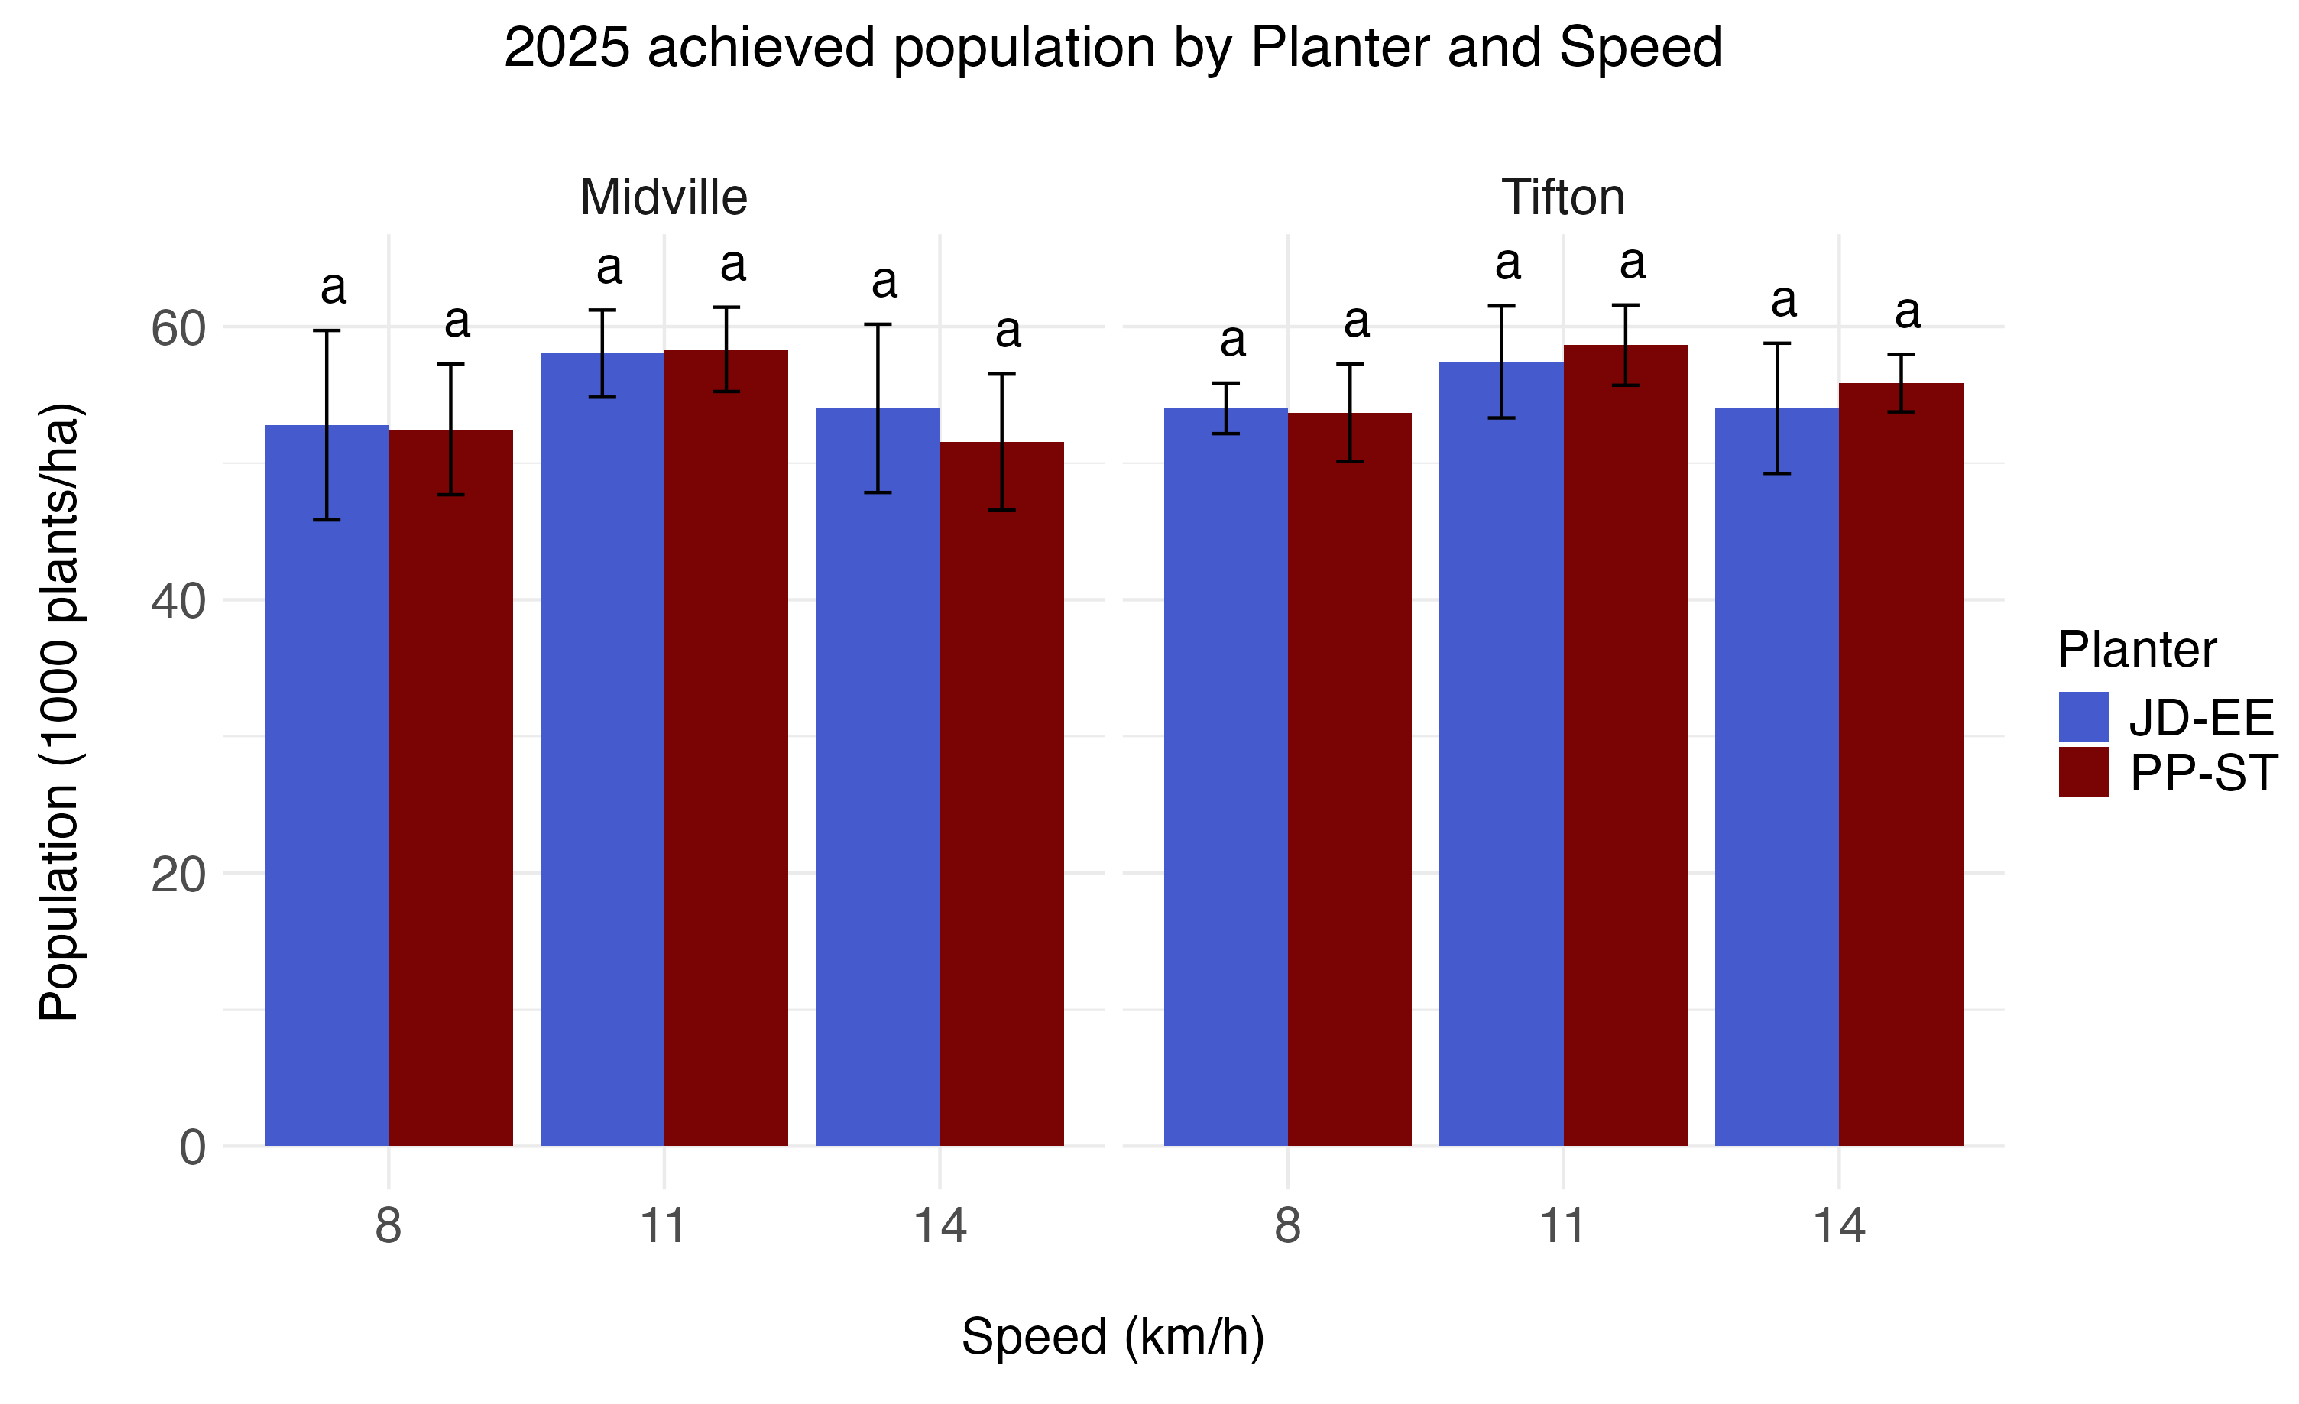
In 2025, two high-speed planters were evaluated at planting speeds of 8, 11, and 14 km . No significant differences in achieved population were detected among planter systems or planting speeds at either Midville or Tifton. Across both planters, the achieved population was numerically greater at 11 km . Achieved population results by planter and speed are presented in Figure 16.
Figure 16.
Achieved population by planter system and planting speed in 2025 at Midville and Tifton, GA. Bars sharing a common letter are not significantly different at based on Tukey-adjusted mean separation. Error bars represent ±1 standard deviation. Abbreviations: JD-EE = John Deere ExactEmerge planter; PP-ST = Case IH Early Riser 2000 Series equipped with Precision Planting SpeedTube delivery and vSet electric seed meters.
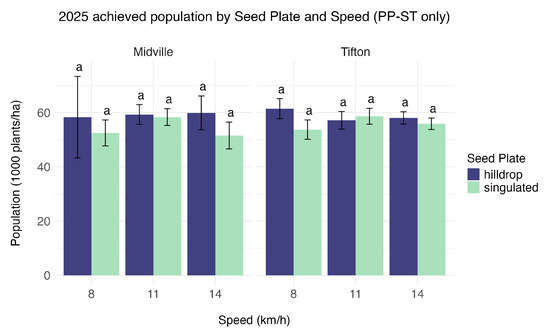
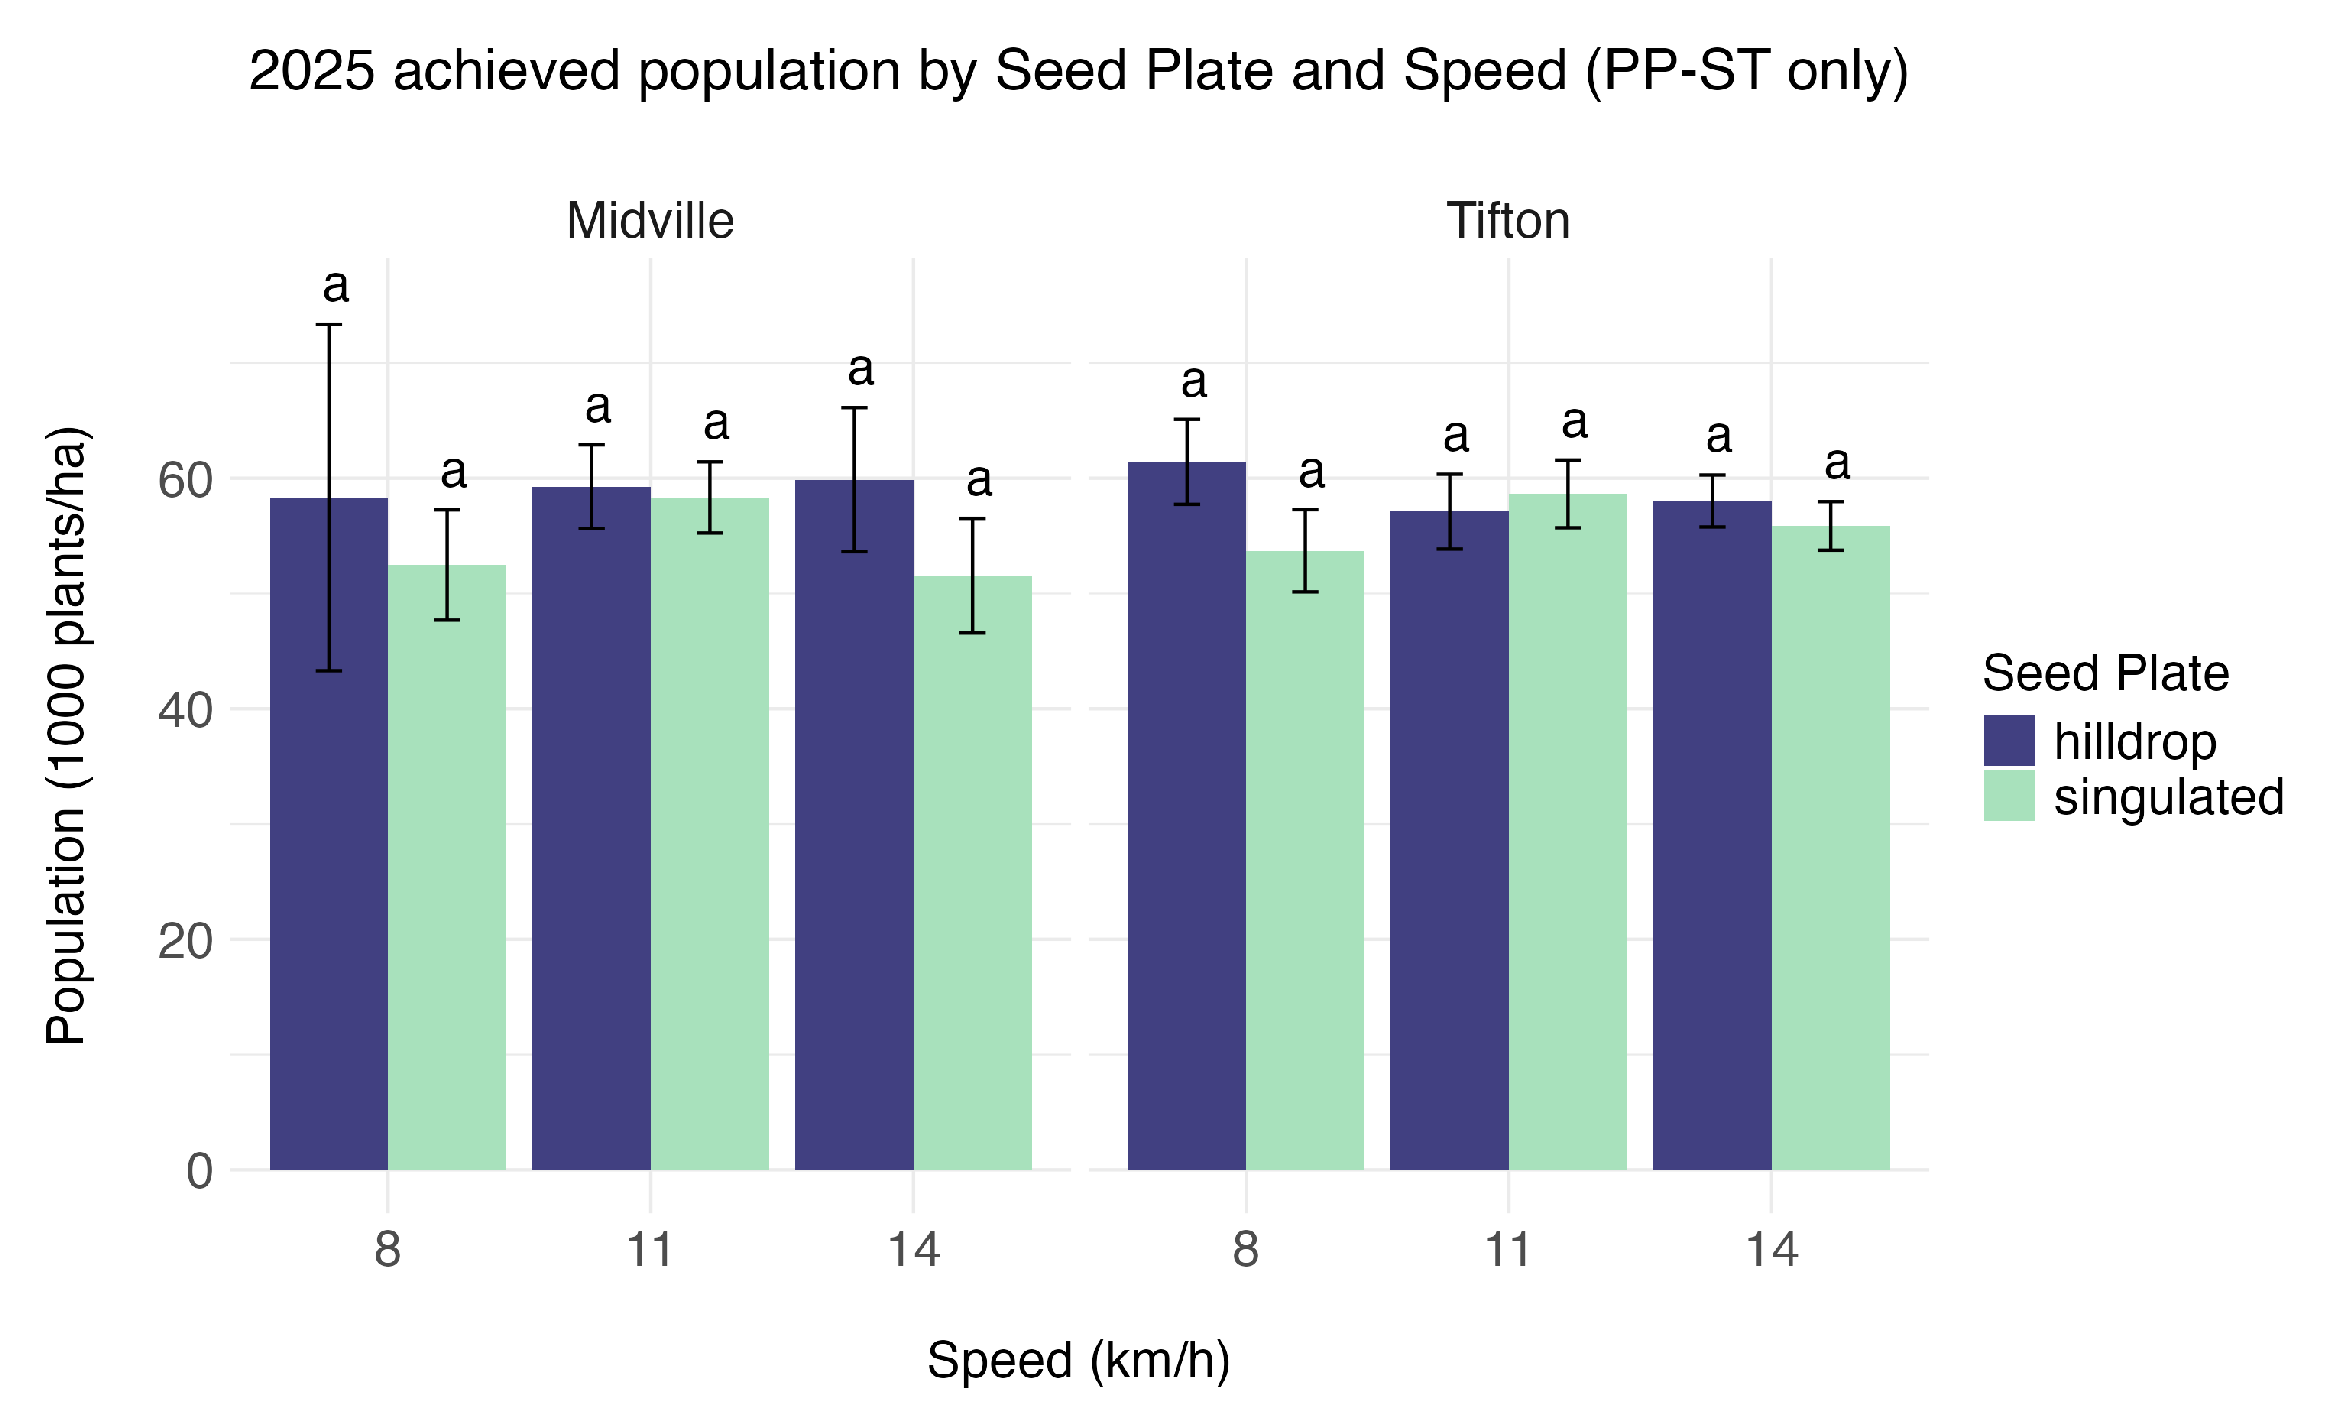
In comparisons between singulated and hill-drop configurations using the PP-ST system, the achieved population responses varied by location. At Midville, no significant seed plate or seed plate × speed effects were detected. At Tifton, the seed plate × speed interaction was significant (Supplementary Table S6), indicating that the effect of seed plate on achieved population depended on planting speed. Overall, hill-drop treatments tended to produce numerically higher achieved populations in most cases, except for the 8 km treatment, which exhibited high variability (Figure 17).
Figure 17.
Achieved population by seed plate configuration and planting speed in 2025 using the PP-ST planter (Case IH Early Riser 2000 Series equipped with Precision Planting SpeedTube delivery and vSet electric seed meters). Bars sharing a common letter are not significantly different at based on Tukey-adjusted mean separation. Error bars represent ±1 standard deviation.
3.3.2. Plant Spacing and Position Classification
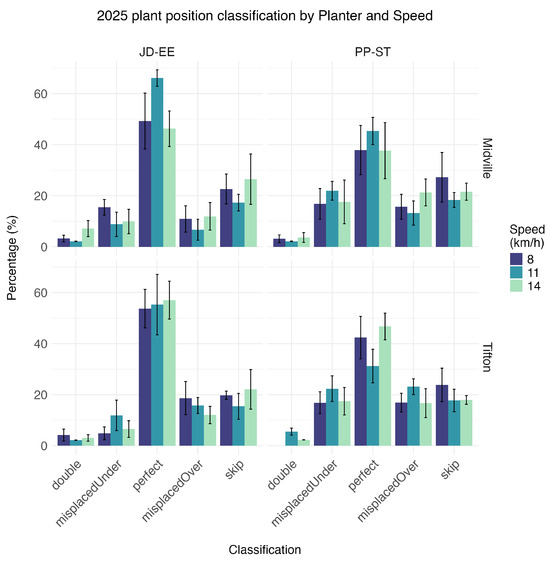
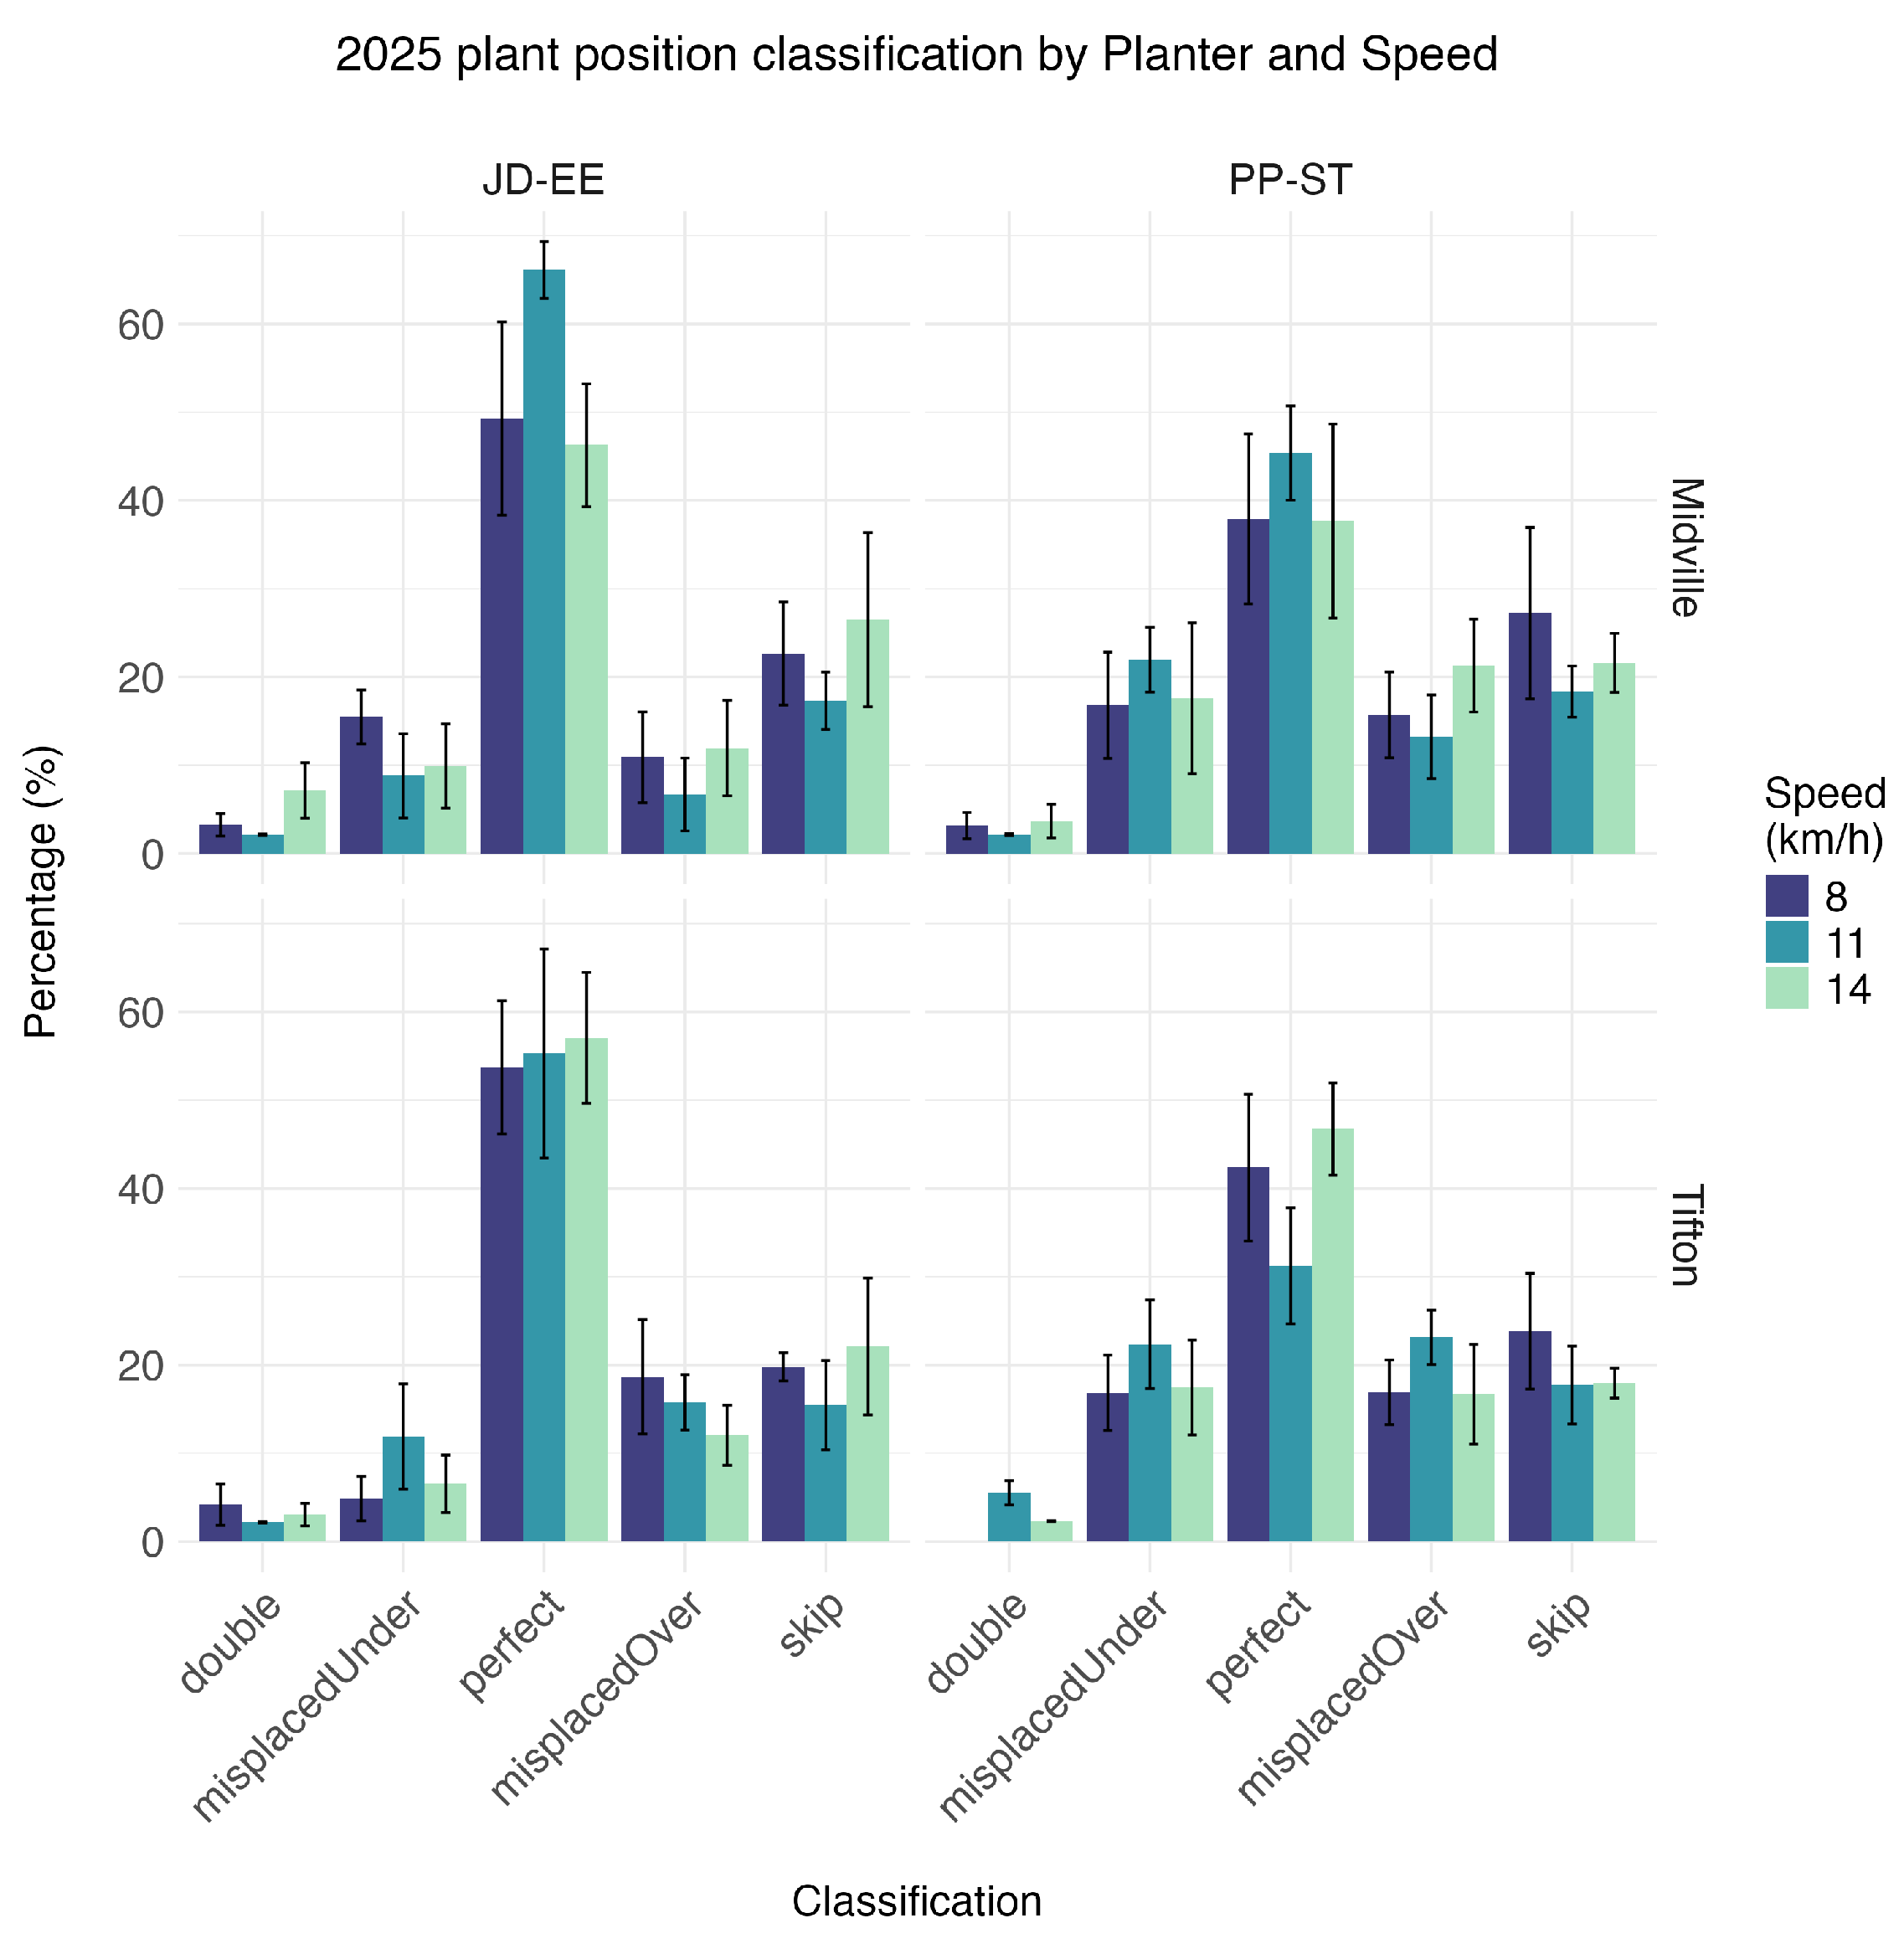
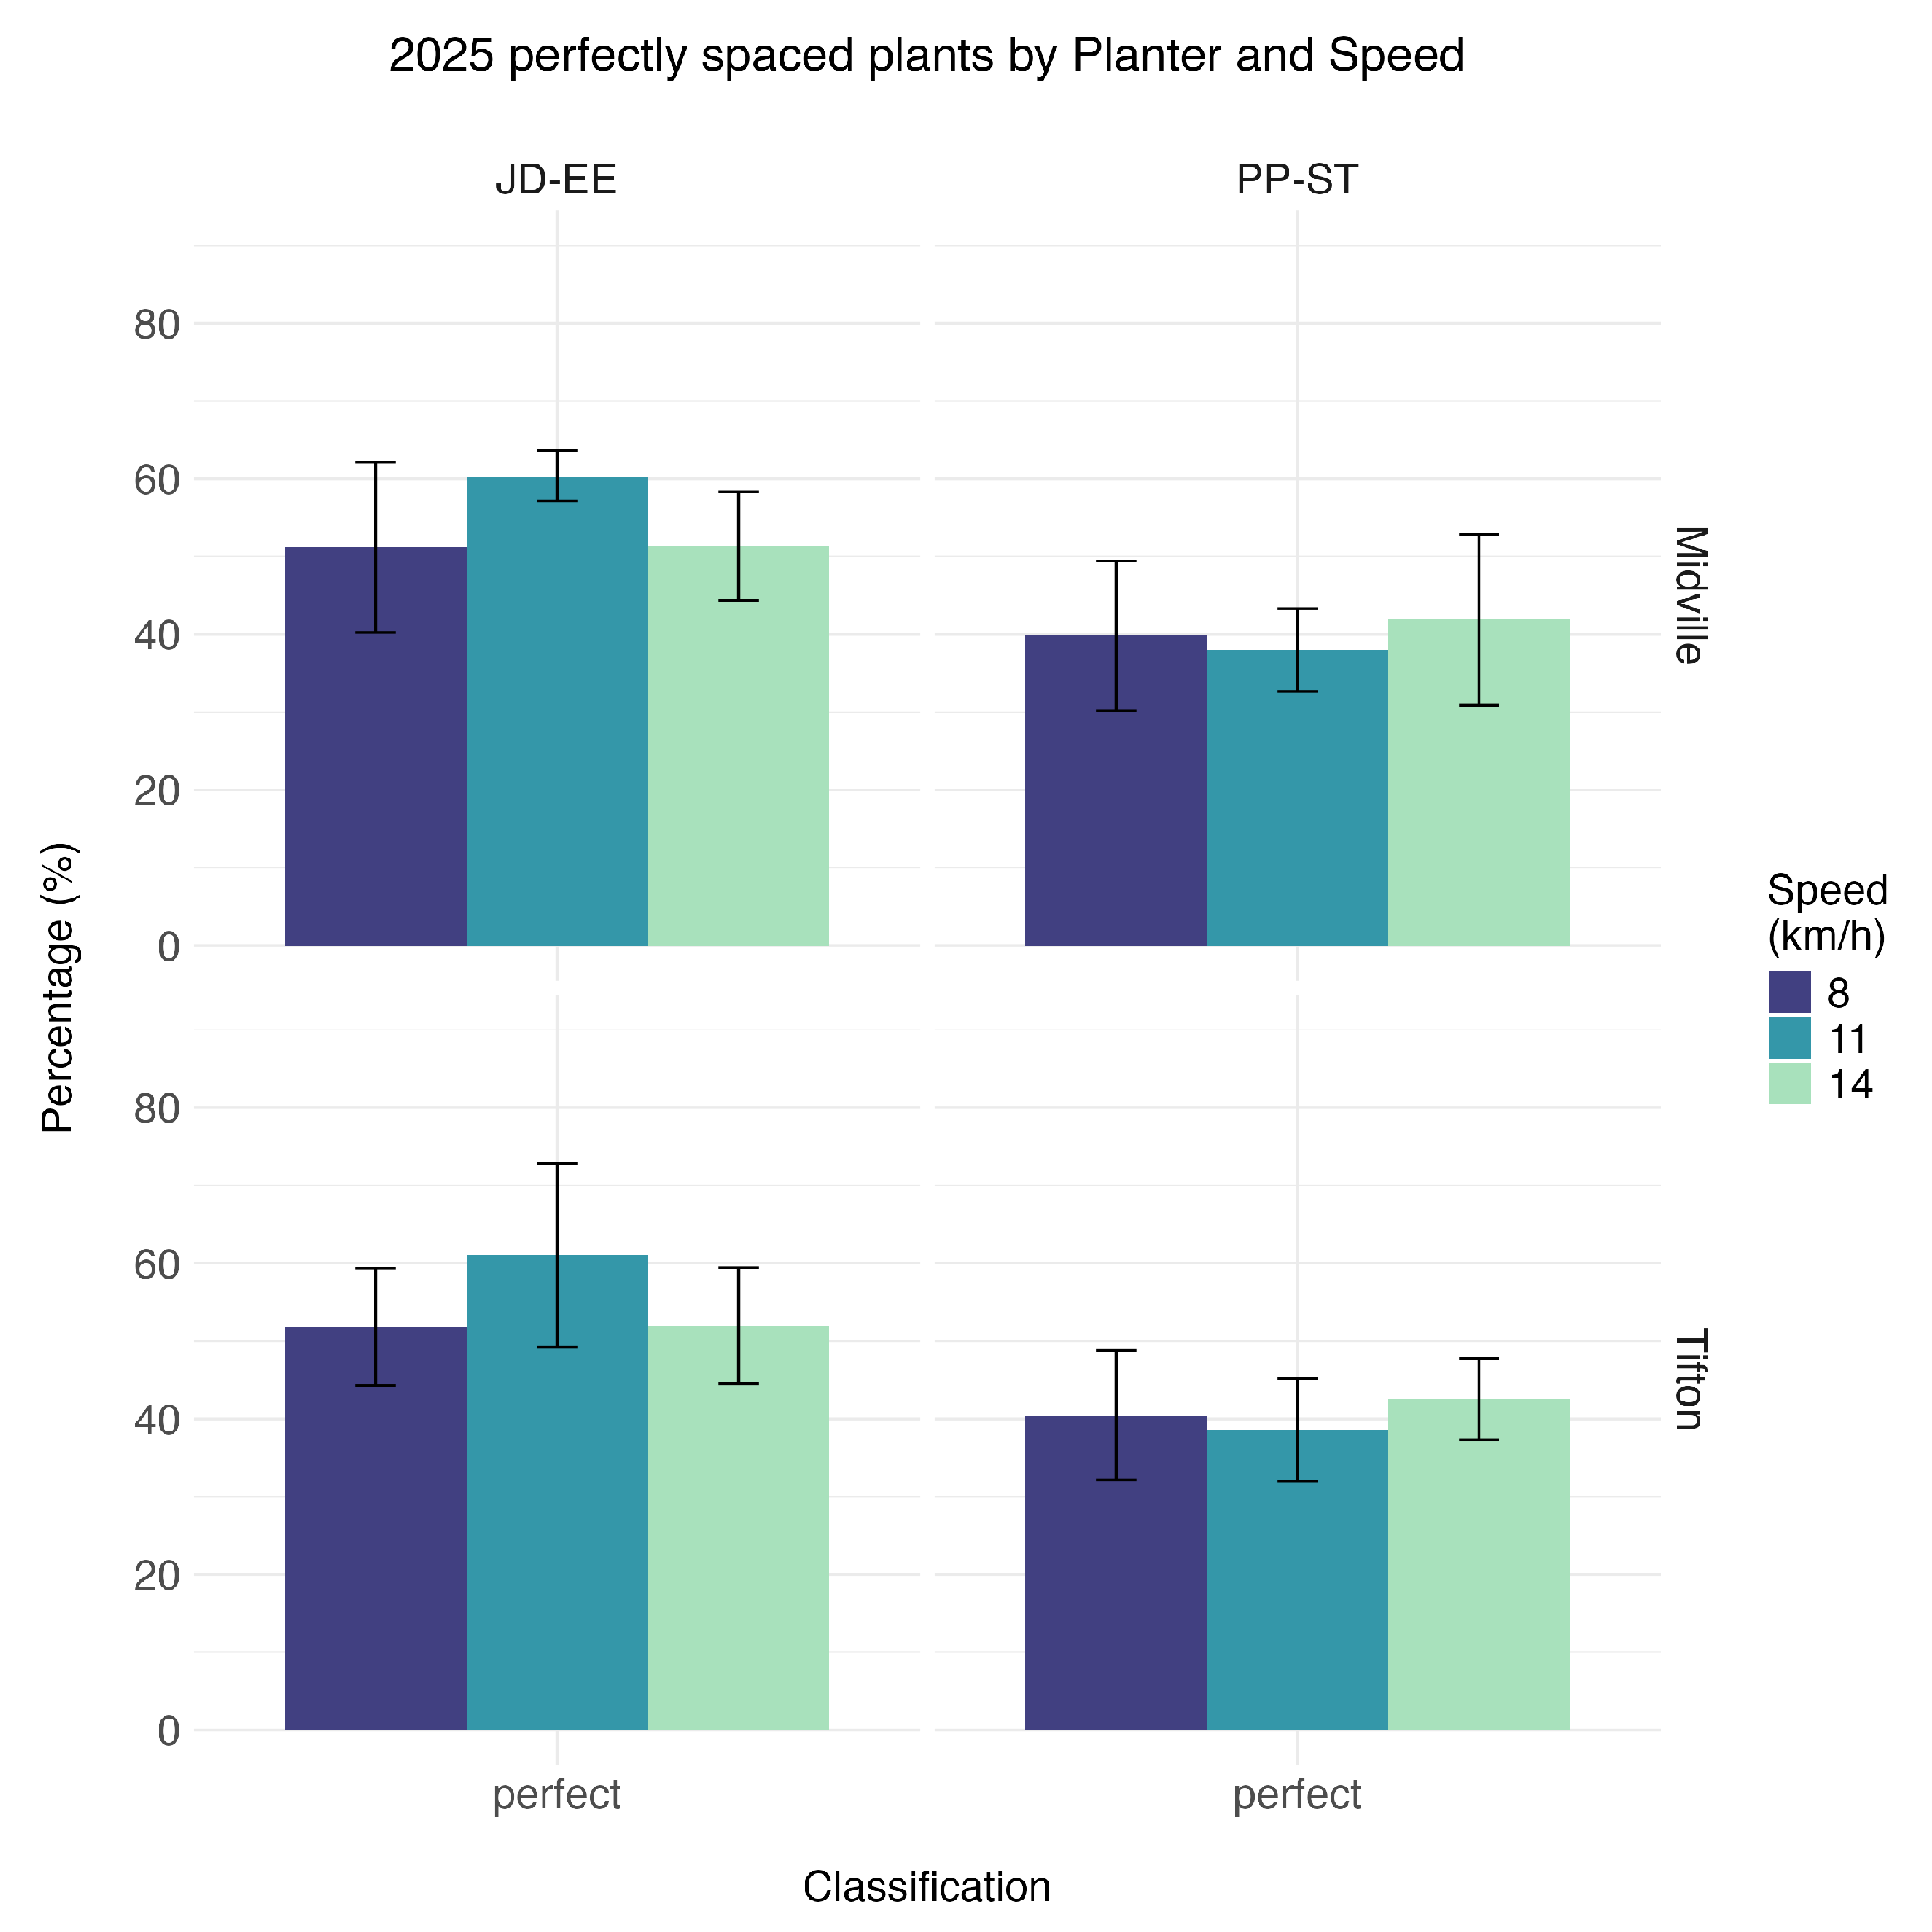
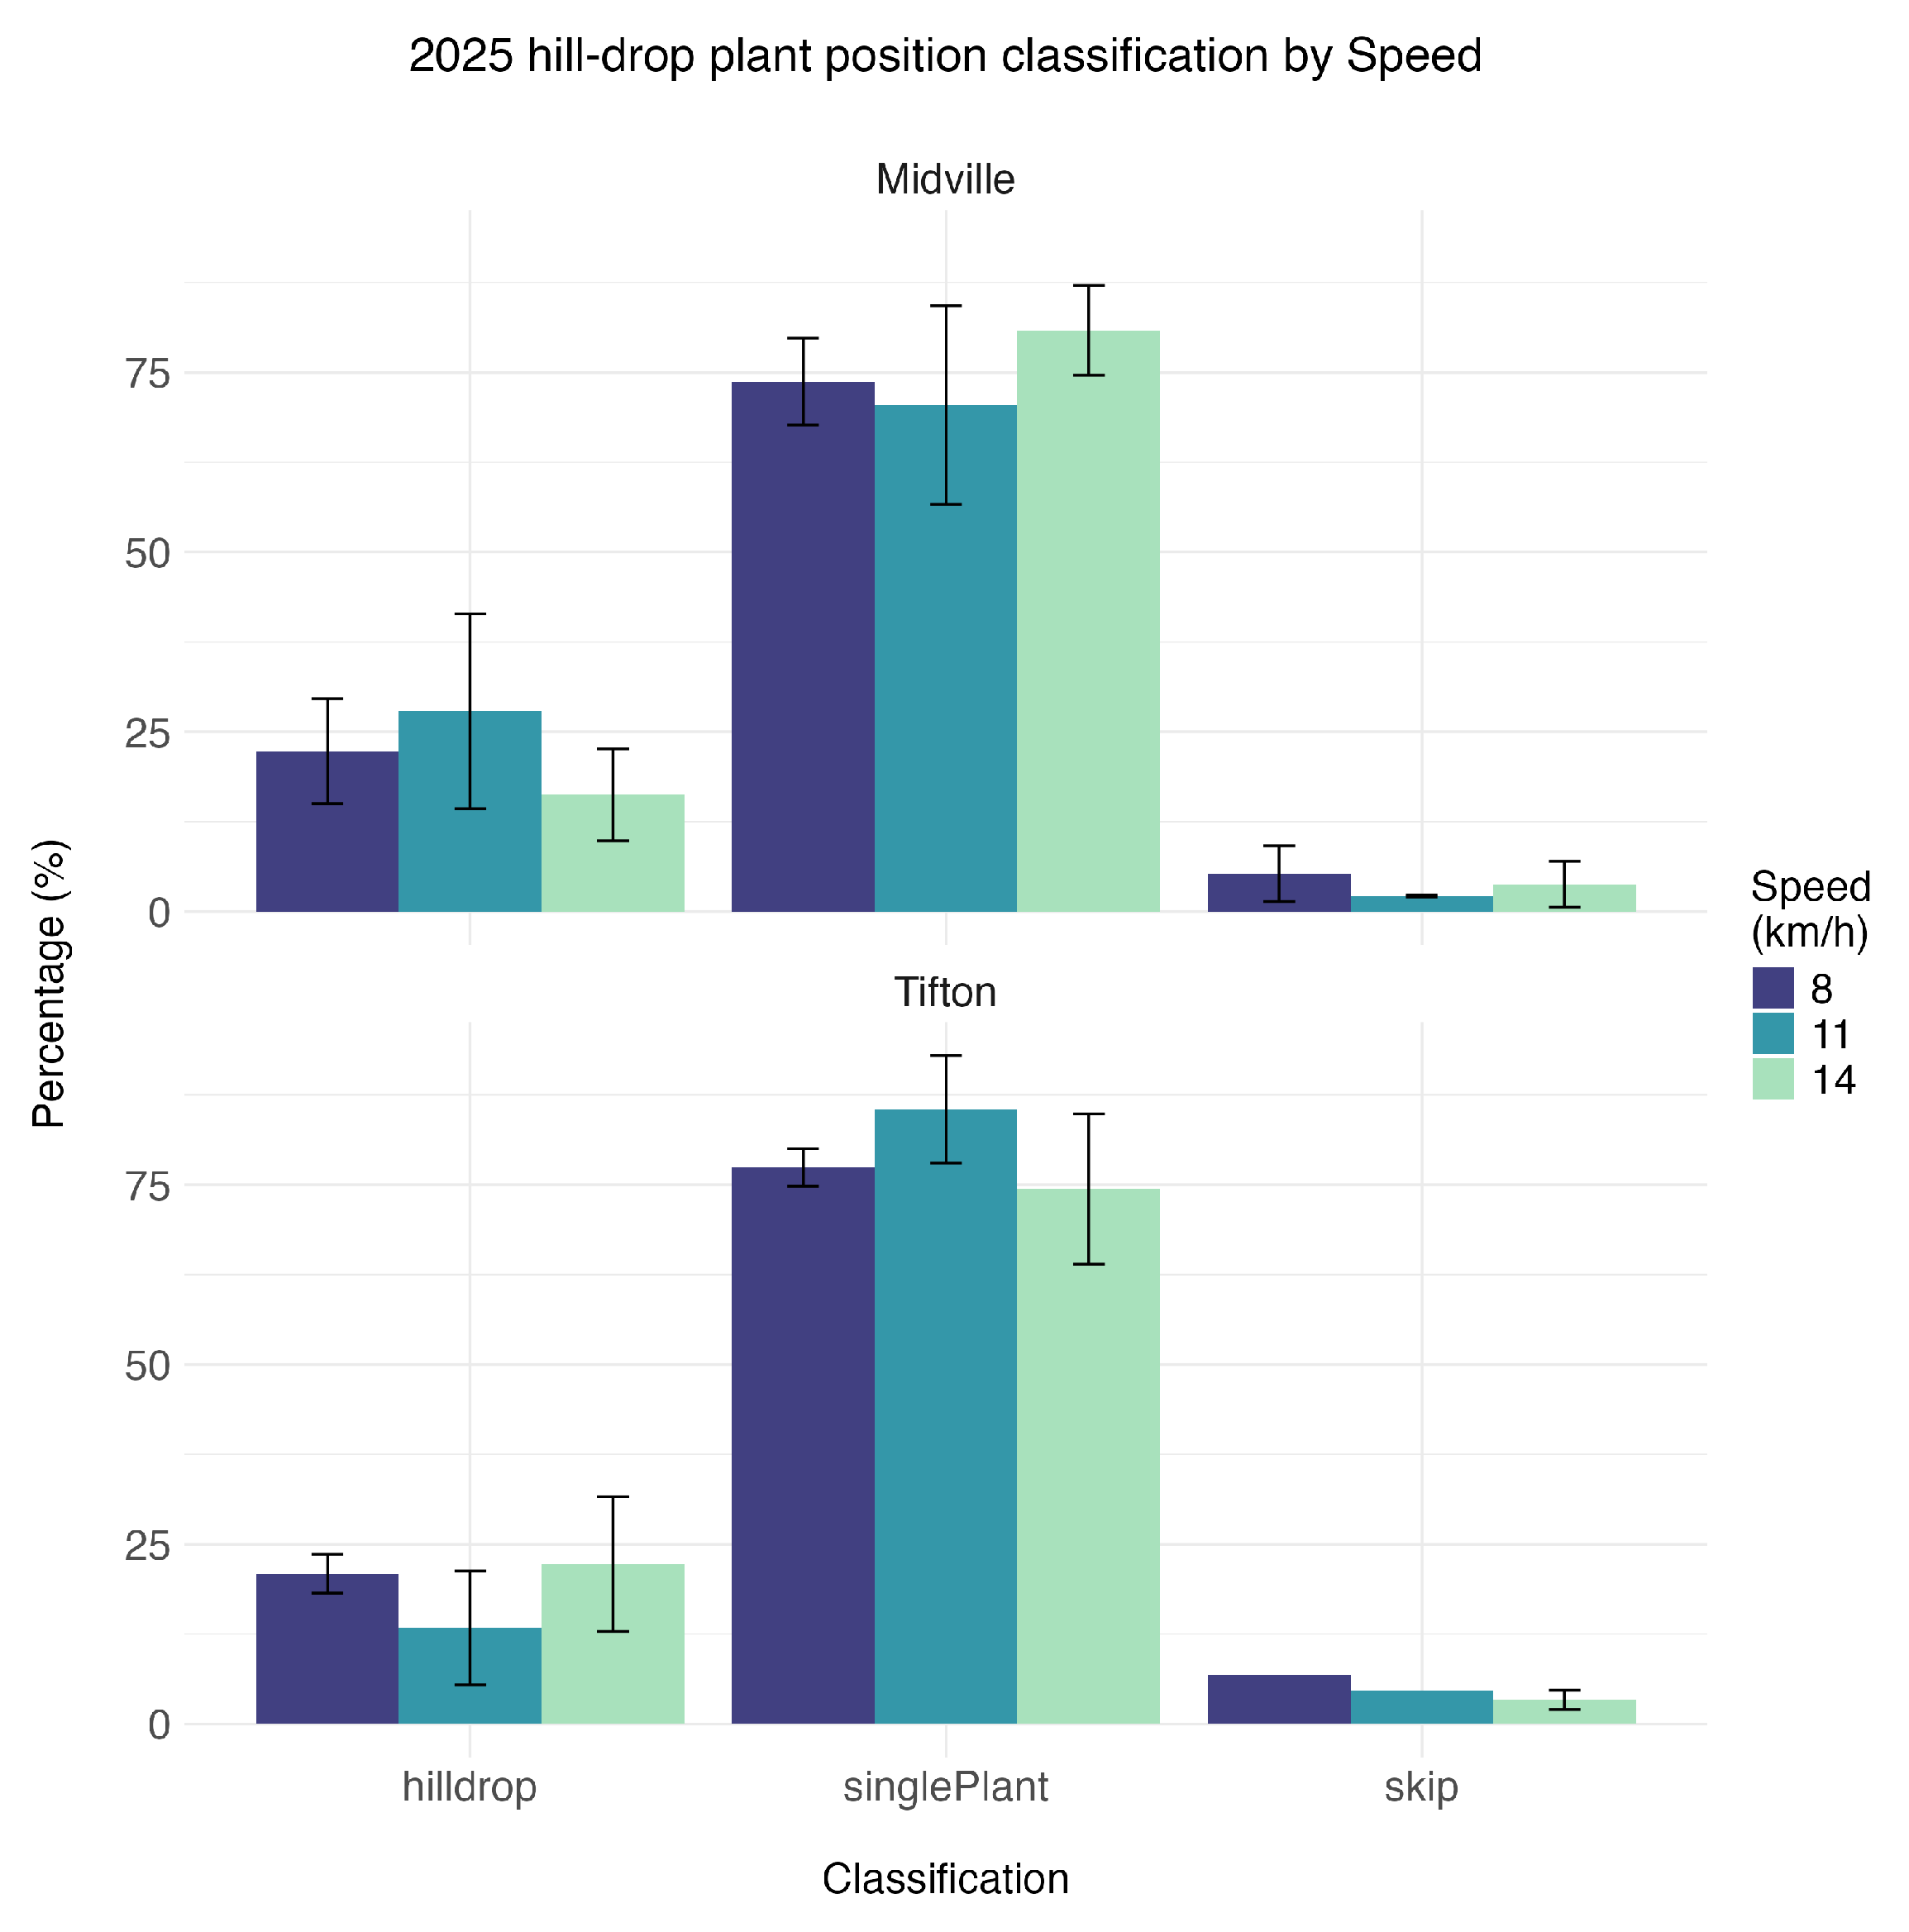
Plant position classification revealed differences between the two integrated high-speed planter systems. Across locations, the JD-EE planter consistently produced a higher percentage of perfectly spaced plants than the PP-ST planter. At 11 km , mean perfect spacing was 66.1% for JD-EE and 45.4% for PP-ST at Midville, and 55.3% and 31.2%, respectively, at Tifton. When averaged across both planter systems and locations, mean perfect spacing remained within a relatively narrow range of 45.8% to 49.5% across 8, 11, and 14 km .
Unlike results obtained with conventional gravity-tube delivery systems in previous years, spacing accuracy in 2025 did not decline as planting speed increased (Supplementary Table S5). Because the two planter systems differed not only in seed delivery architecture but also in seed meter design, calibration workflow, and manufacturer-specific integration, this comparison should be interpreted as a system-level planter comparison rather than as an isolated test of the delivery mechanism alone. Plant position classification results by planter and speed are shown in Figure 18 and Figure 19.
Figure 18.
Plant position classification by the planter system and planting speed in 2025 at Midville and Tifton, GA. Error bars represent ±1 standard deviation. Abbreviations: JD-EE = John Deere ExactEmerge planter; PP-ST = Case IH Early Riser 2000 Series equipped with Precision Planting SpeedTube delivery and vSet electric seed meters.
Figure 19.
Percentage of perfectly spaced plants by planter system and planting speed in 2025 at Midville and Tifton, GA. Error bars represent ±1 standard deviation. Abbreviations: JD-EE = John Deere ExactEmerge planter; PP-ST = Case IH Early Riser 2000 Series equipped with Precision Planting SpeedTube delivery and vSet electric seed meters.
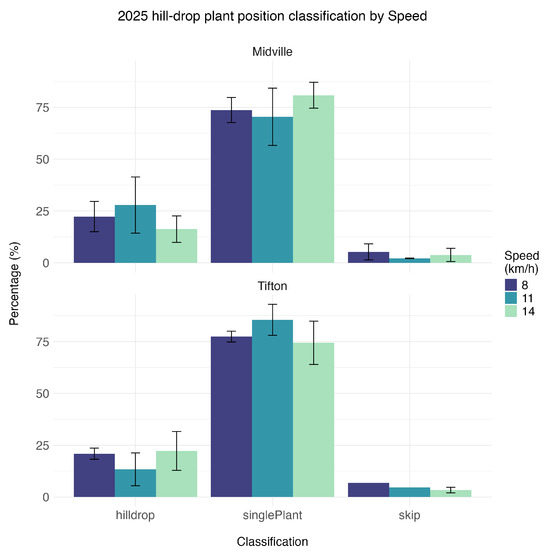
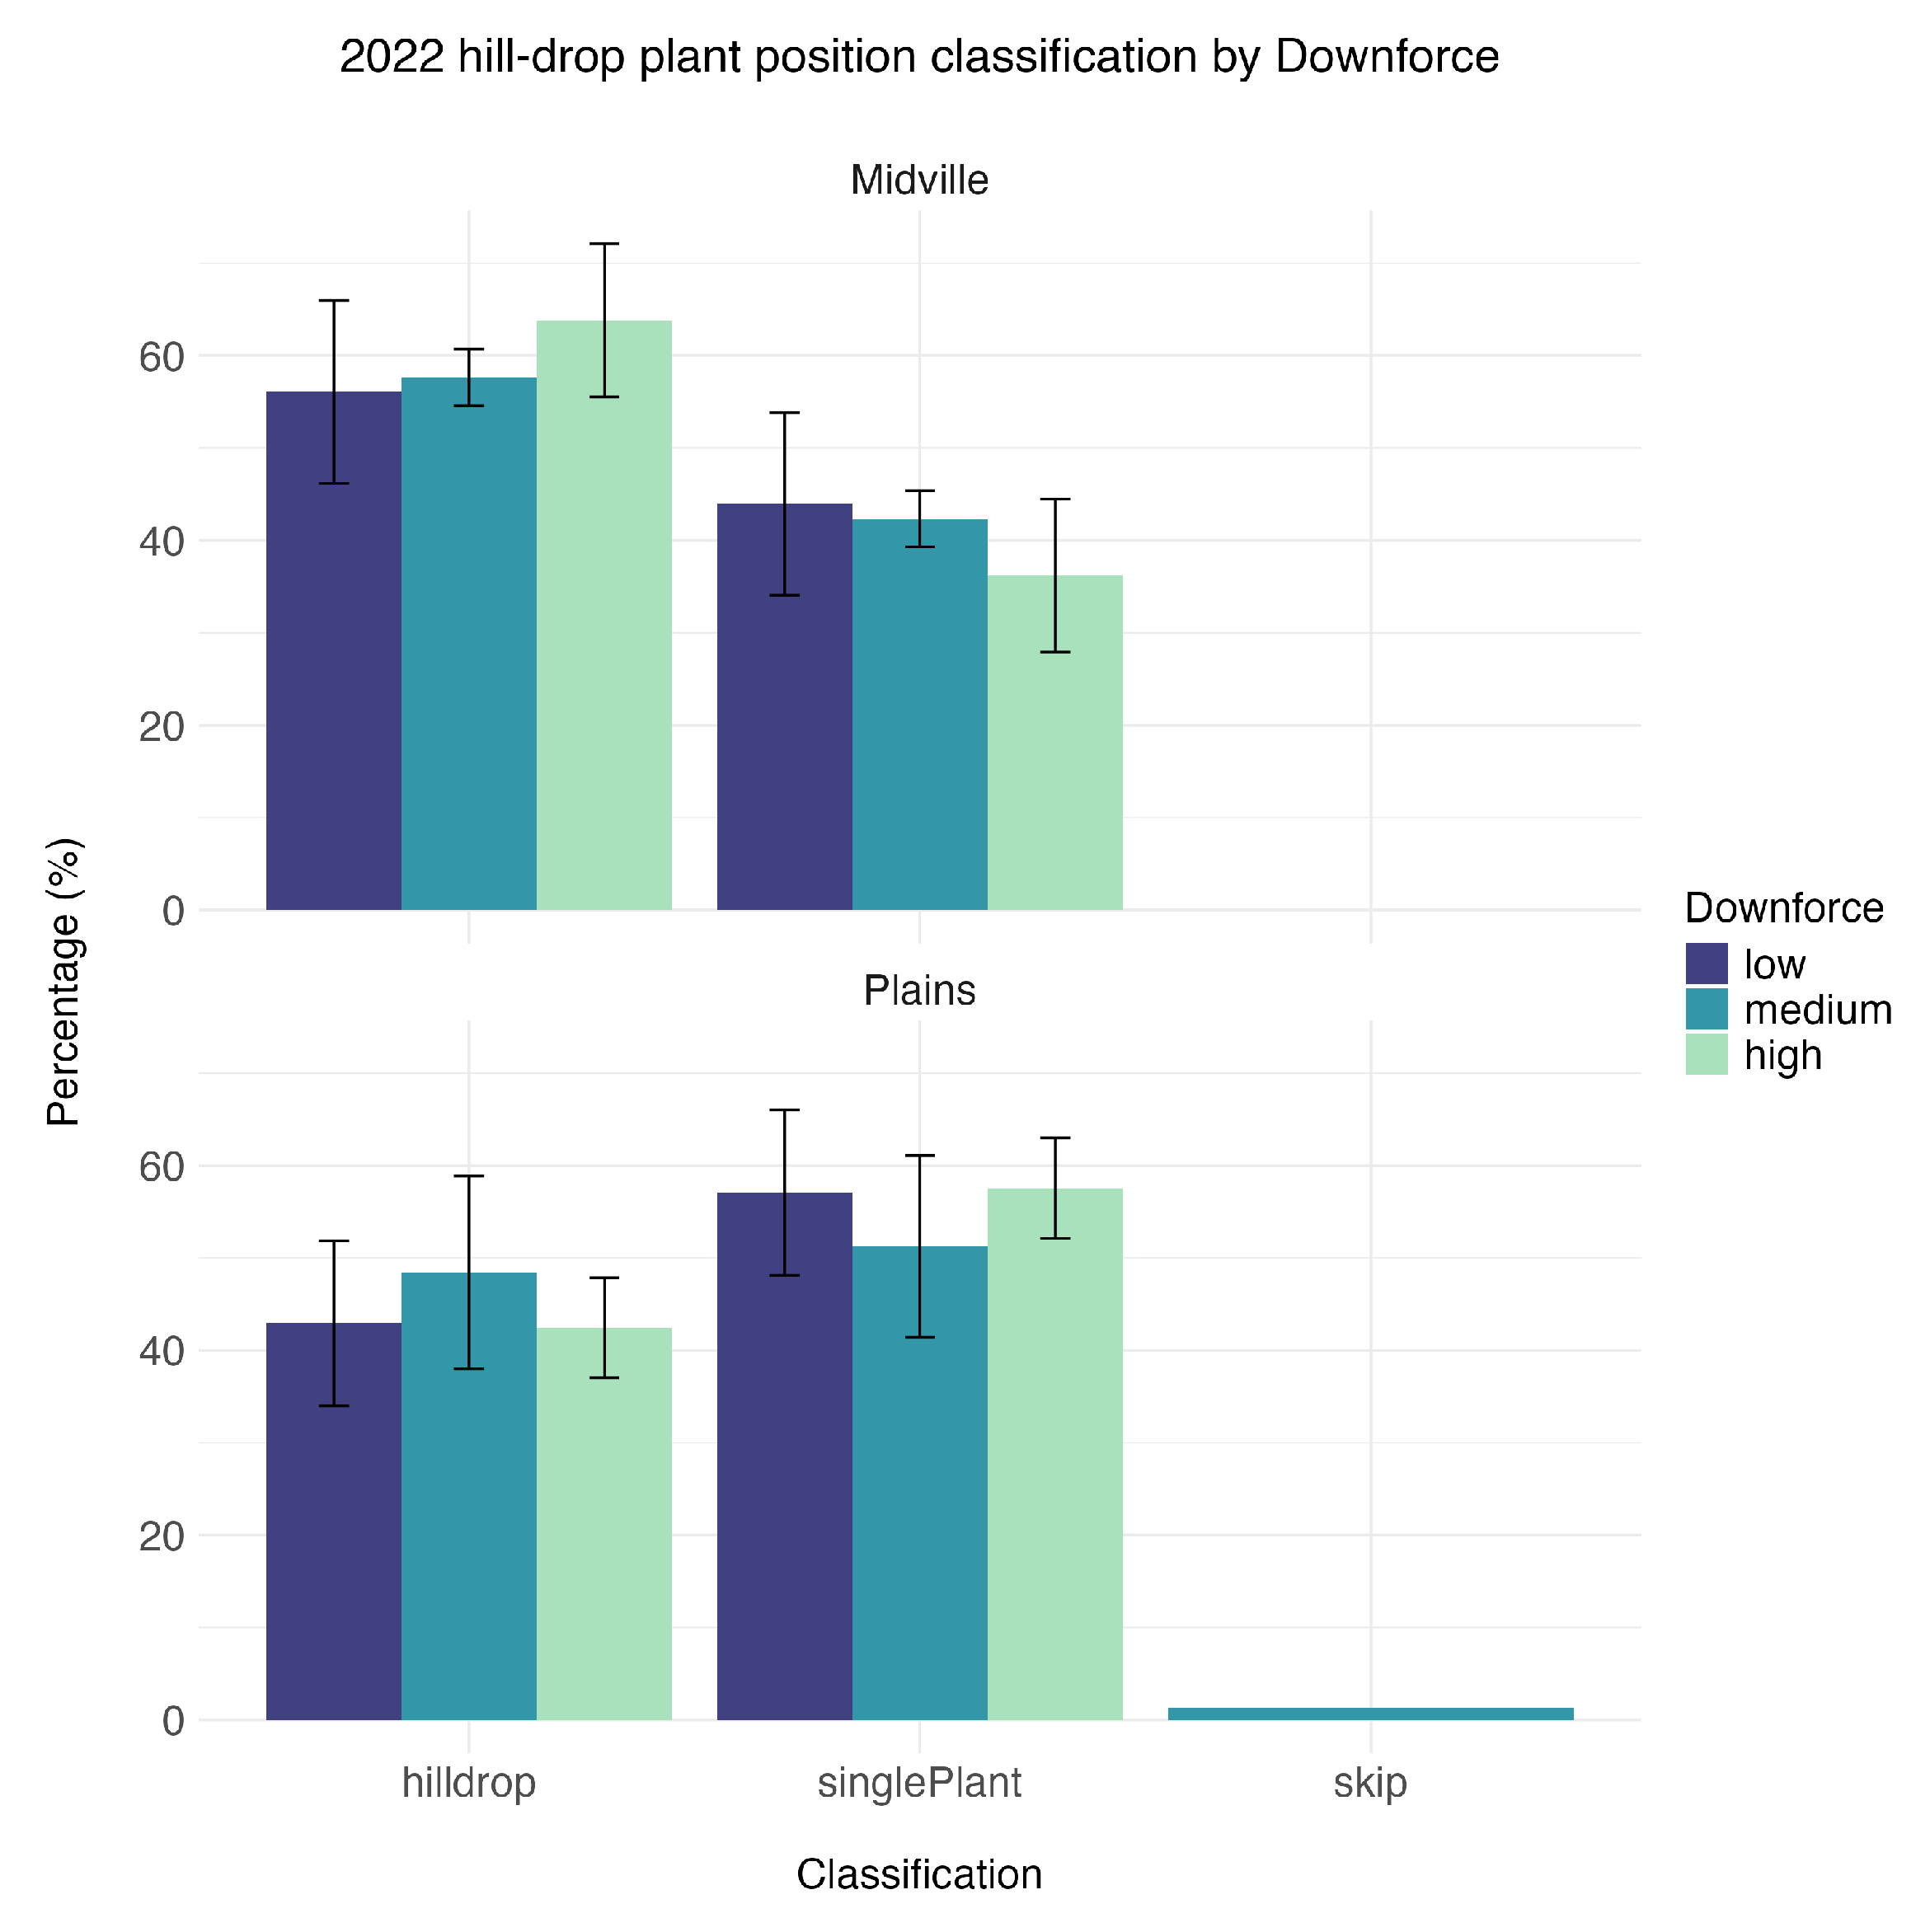
When evaluated for hill-drop performance, the PP-ST system did not consistently produce plant pairs meeting the <25.4 mm criterion required for classification as hill-dropped cotton. Most plants emerged as single plants rather than pairs. In contrast, in the 2022 trial conducted with a conventional gravity-tube system, approximately half of the emerged plants met the hill-drop classification criterion (Figure 20 and Figure 21).
Figure 20.
Plant position classification by planting speed in 2025 for hill-drop treatments using the PP-ST planter (Case IH Early Riser 2000 Series equipped with Precision Planting SpeedTube delivery and vSet electric seed meters). Error bars represent ±1 standard deviation.
Figure 21.
Plant position classification by downforce in 2022 for hill-drop treatments using a conventional gravity seed tube system. Error bars represent ±1 standard deviation.
3.3.3. Lint Yield
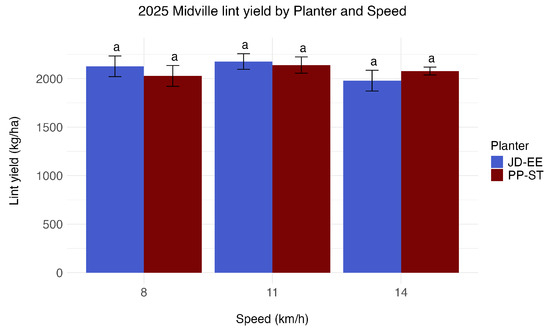
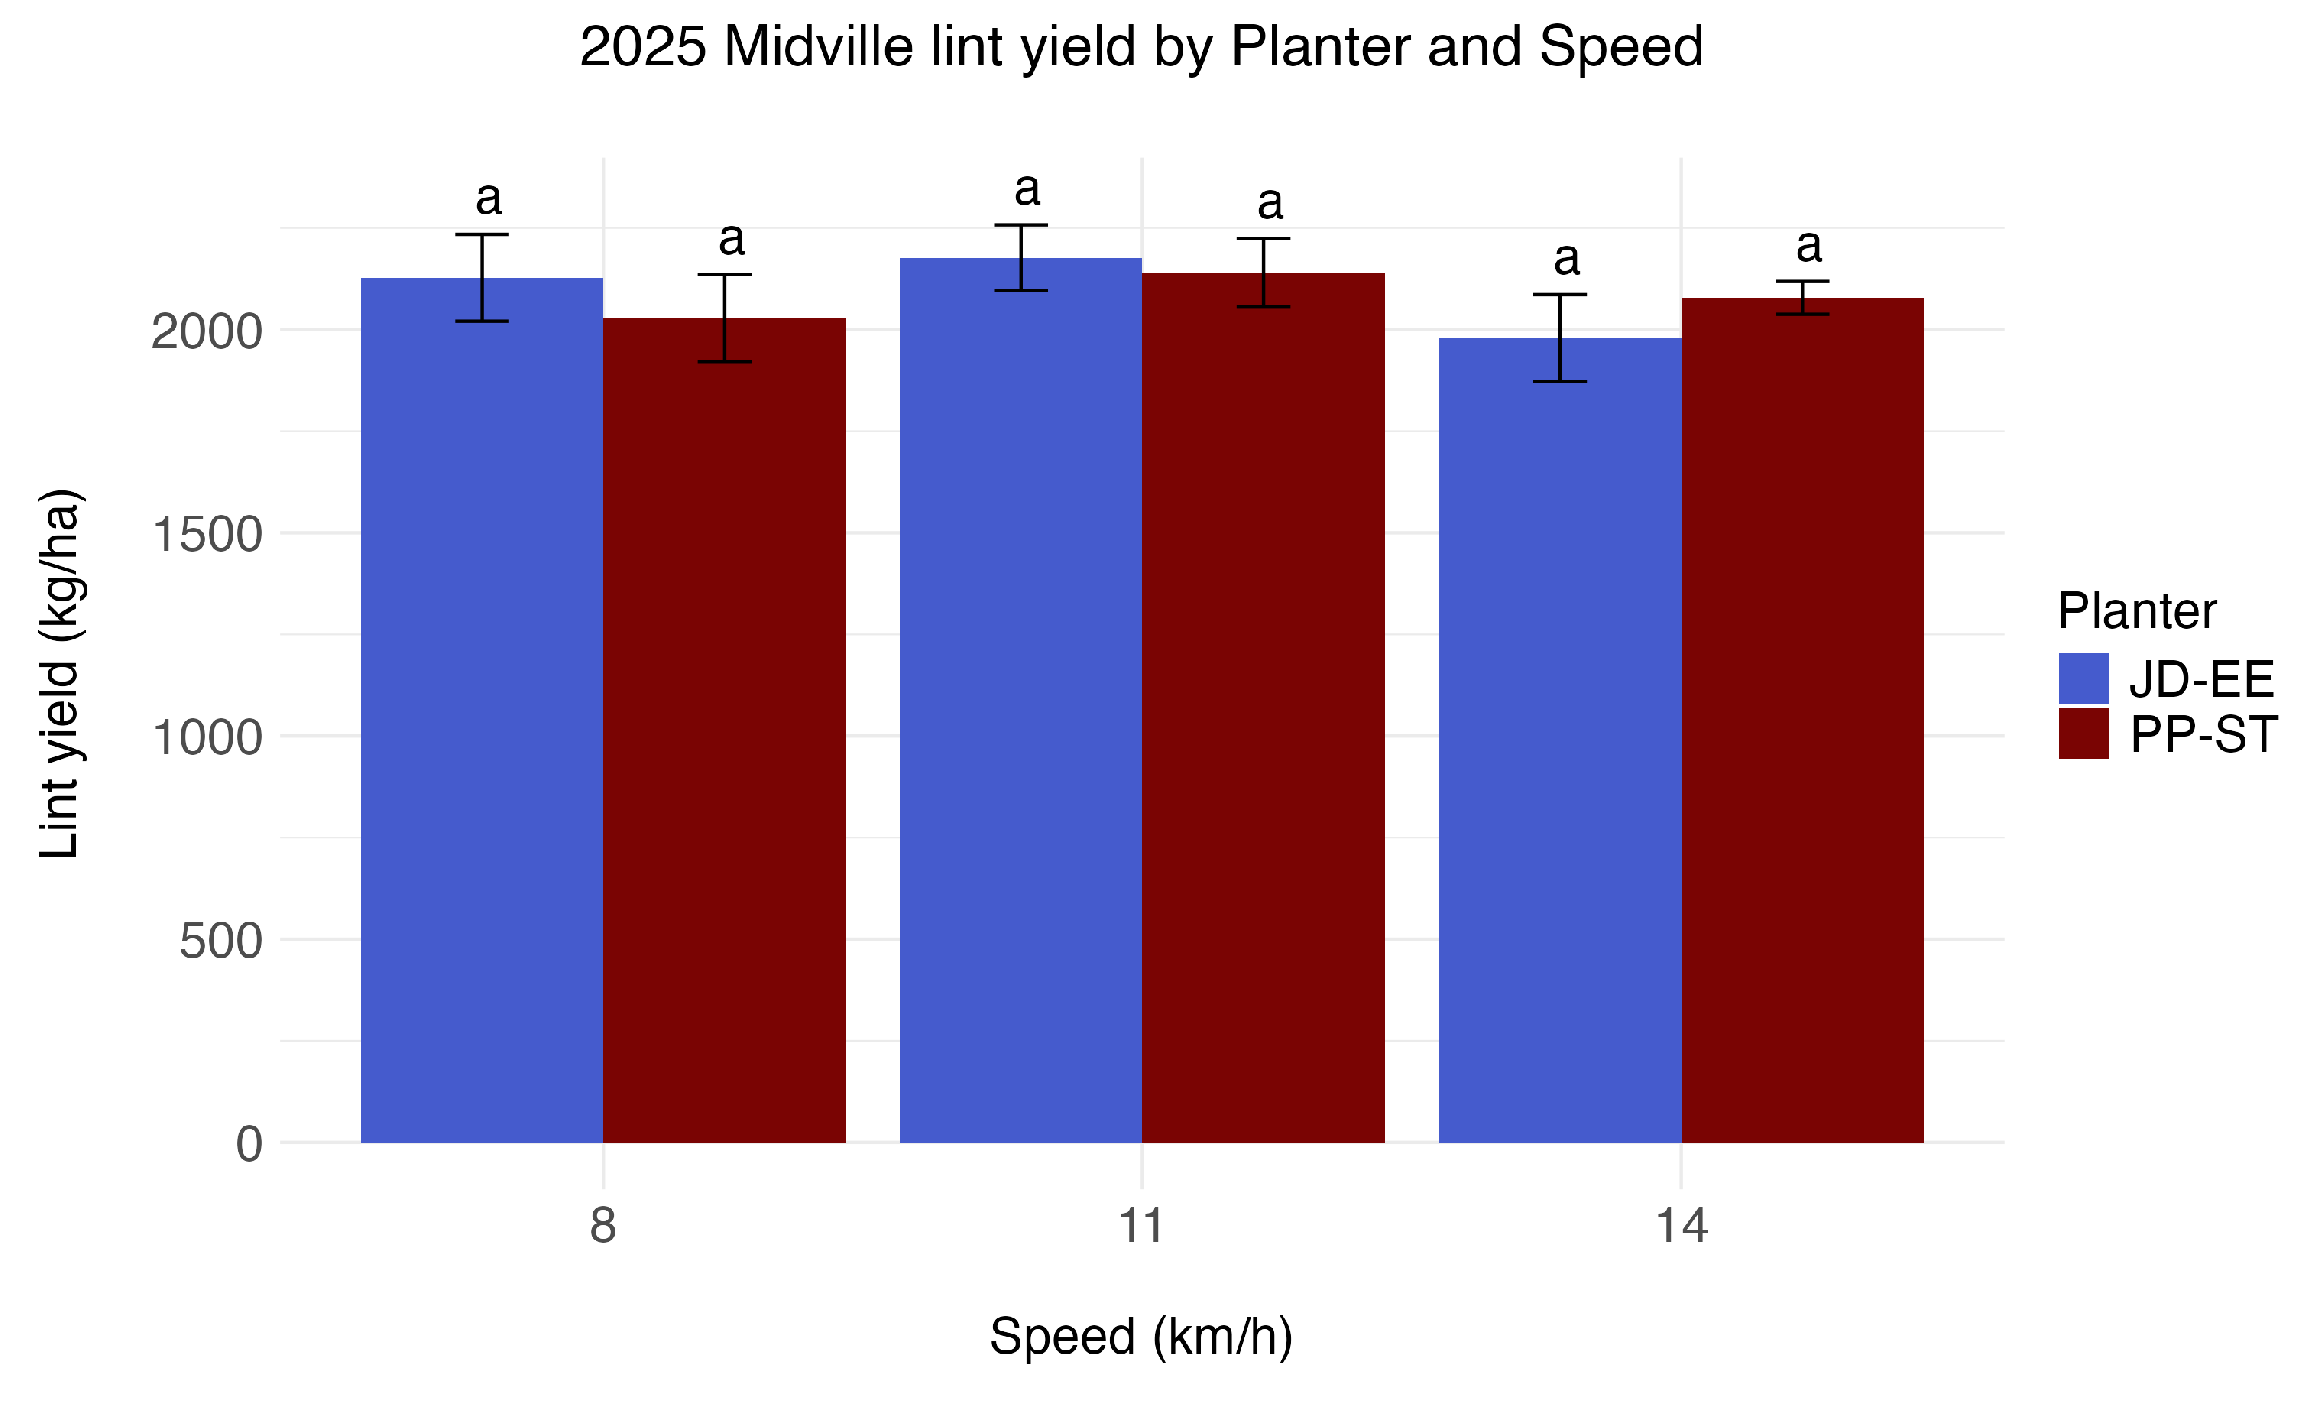
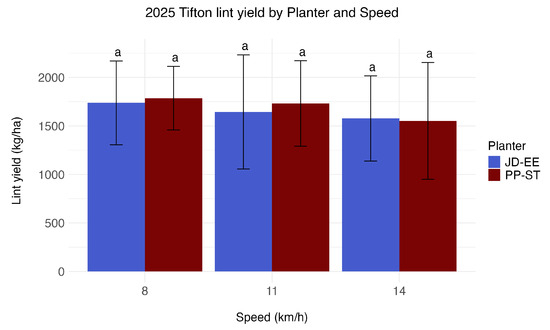
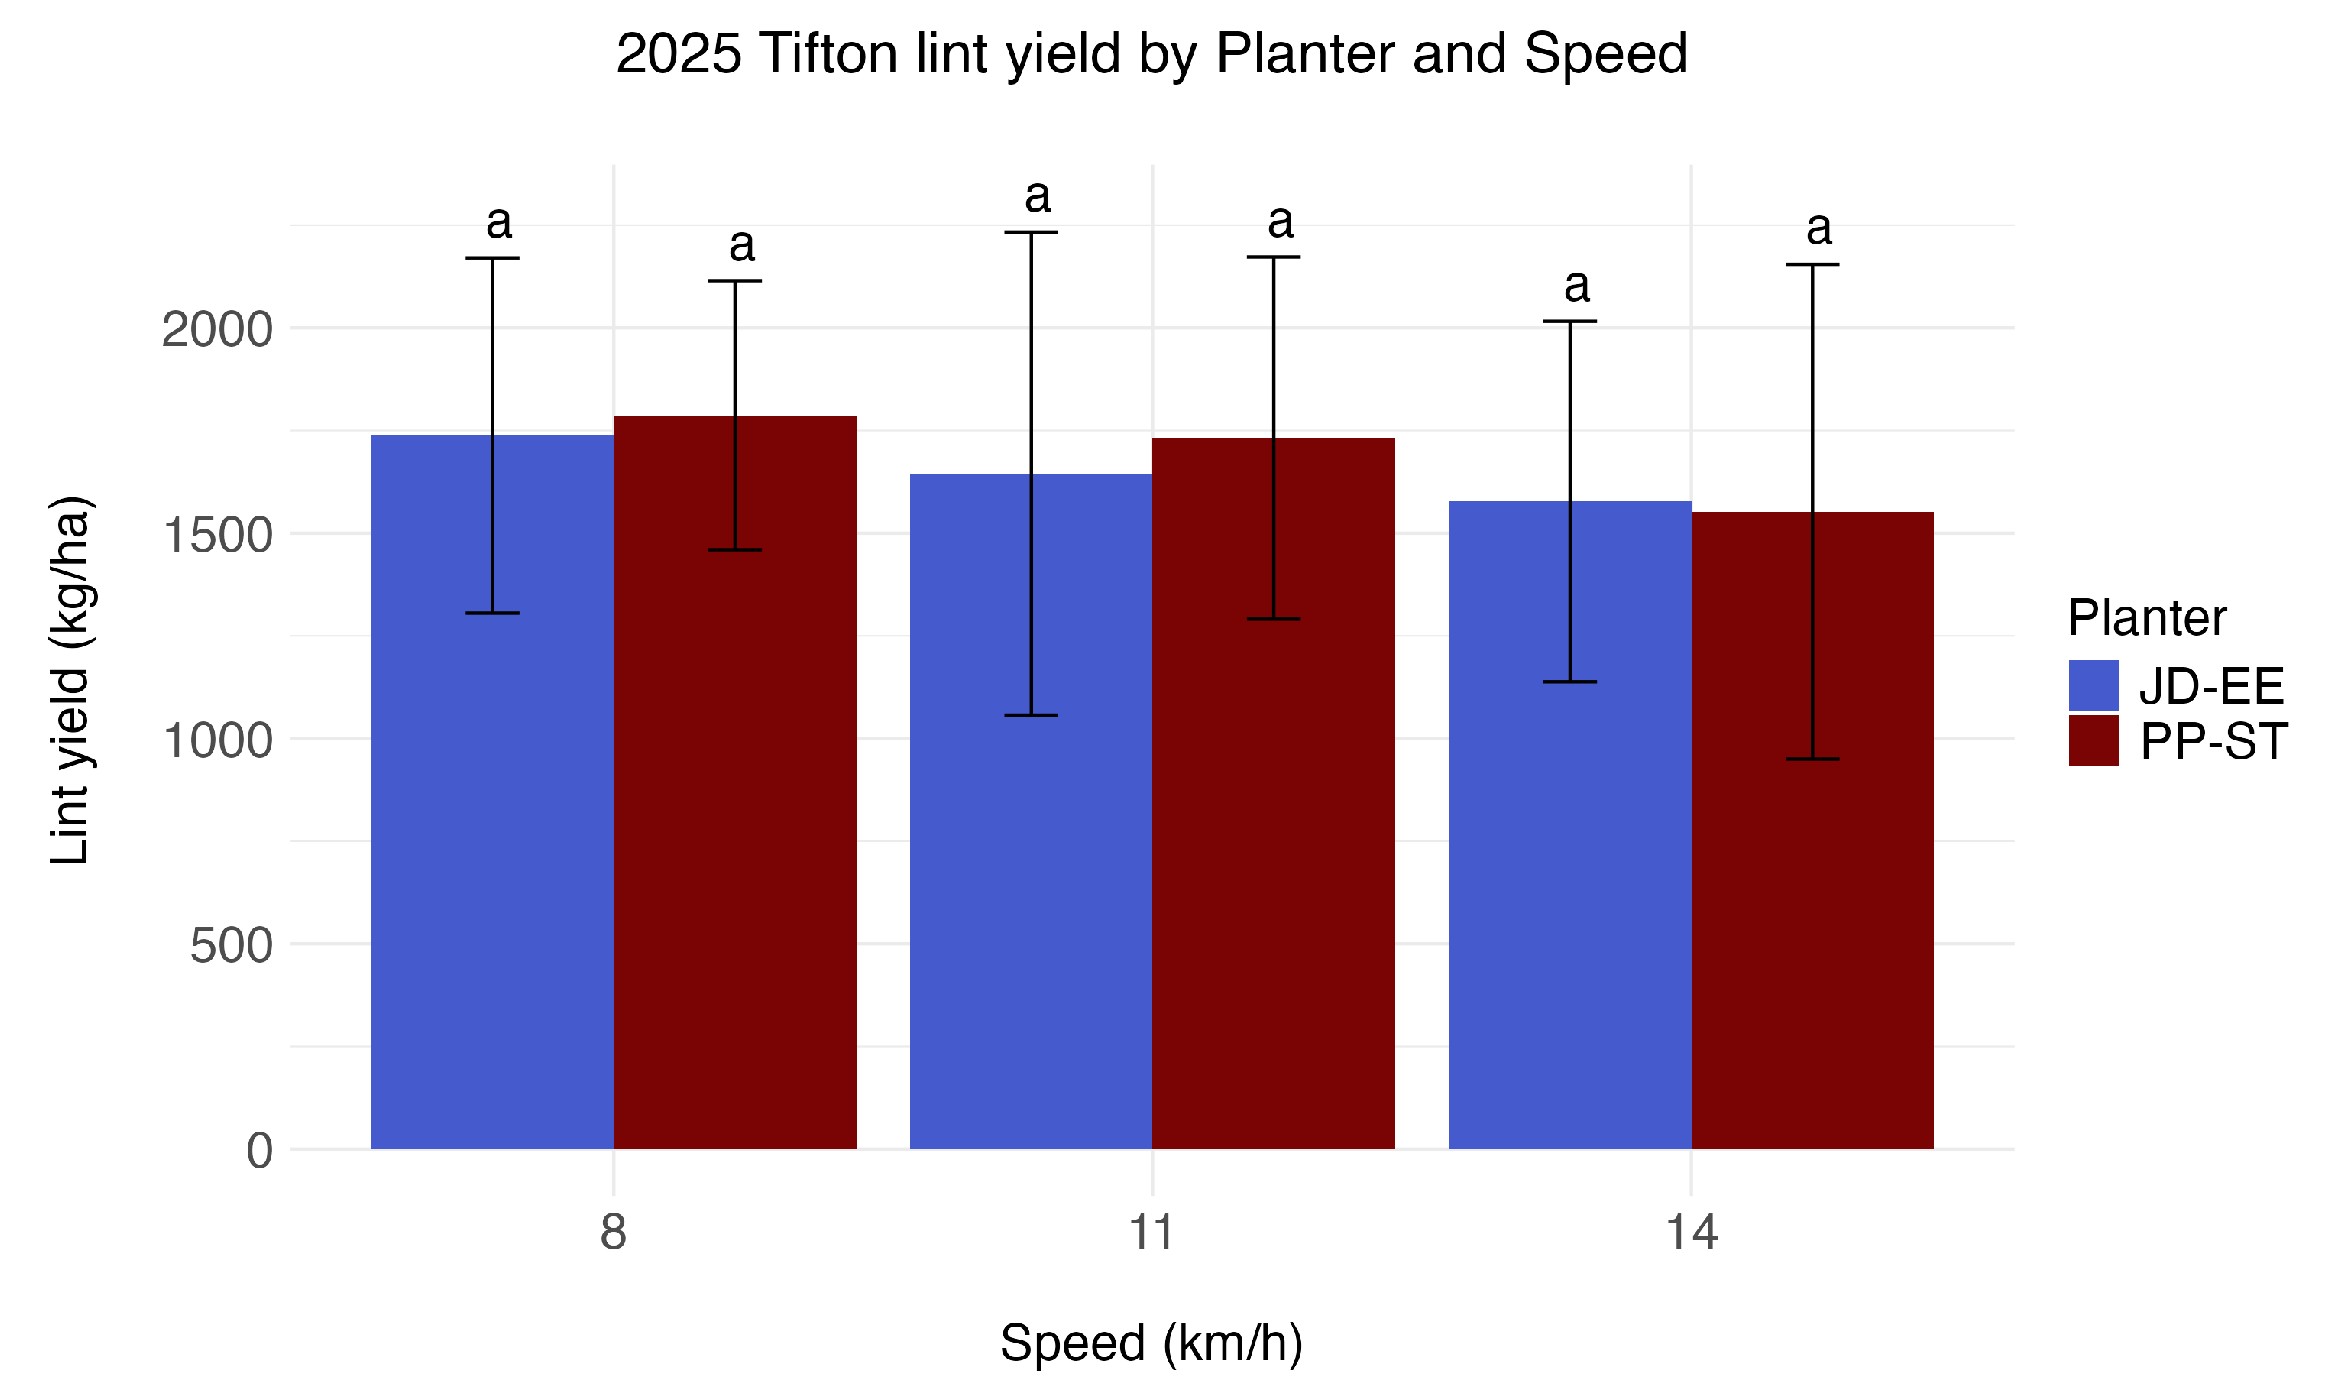
Lint yield results differed between locations in 2025. At Midville, no significant planter-system, planting-speed, or planter-system × speed effects were detected for lint yield (Supplementary Table S5; Figure 22). At Tifton, lint yield was lower overall and exhibited greater variability. For Tifton lint yield, the planting-speed main effect was significant (F = 4.91, p = 0.023), whereas planter-system and planter-system × speed effects were not significant (Supplementary Table S5). Accordingly, the specific treatment difference noted here reflects Tukey-adjusted pairwise comparisons among treatment means: PP-ST at 8 km yielded more than PP-ST at 14 km (Figure 23). This yield difference occurred without corresponding differences in achieved population or spacing classification at Tifton, indicating that factors not captured by those measurements may have contributed to yield variability.
Figure 22.
Lint yield by planter system and planting speed at Midville, GA, in 2025. Bars sharing a common letter are not significantly different at based on Tukey-adjusted mean separation. Error bars represent ±1 standard deviation. Abbreviations: JD-EE = John Deere ExactEmerge planter; PP-ST = Case IH Early Riser 2000 Series equipped with Precision Planting SpeedTube delivery and vSet electric seed meters.
Figure 23.
Lint yield by planter system and planting speed at Tifton, GA, in 2025. Bars sharing a common letter are not significantly different at based on Tukey-adjusted mean separation. Error bars represent ±1 standard deviation. Abbreviations: JD-EE = John Deere ExactEmerge planter; PP-ST = Case IH Early Riser 2000 Series equipped with Precision Planting SpeedTube delivery and vSet electric seed meters.
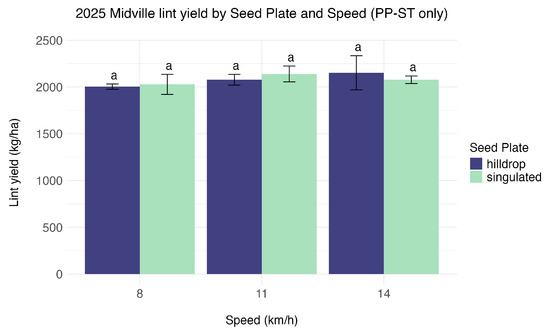
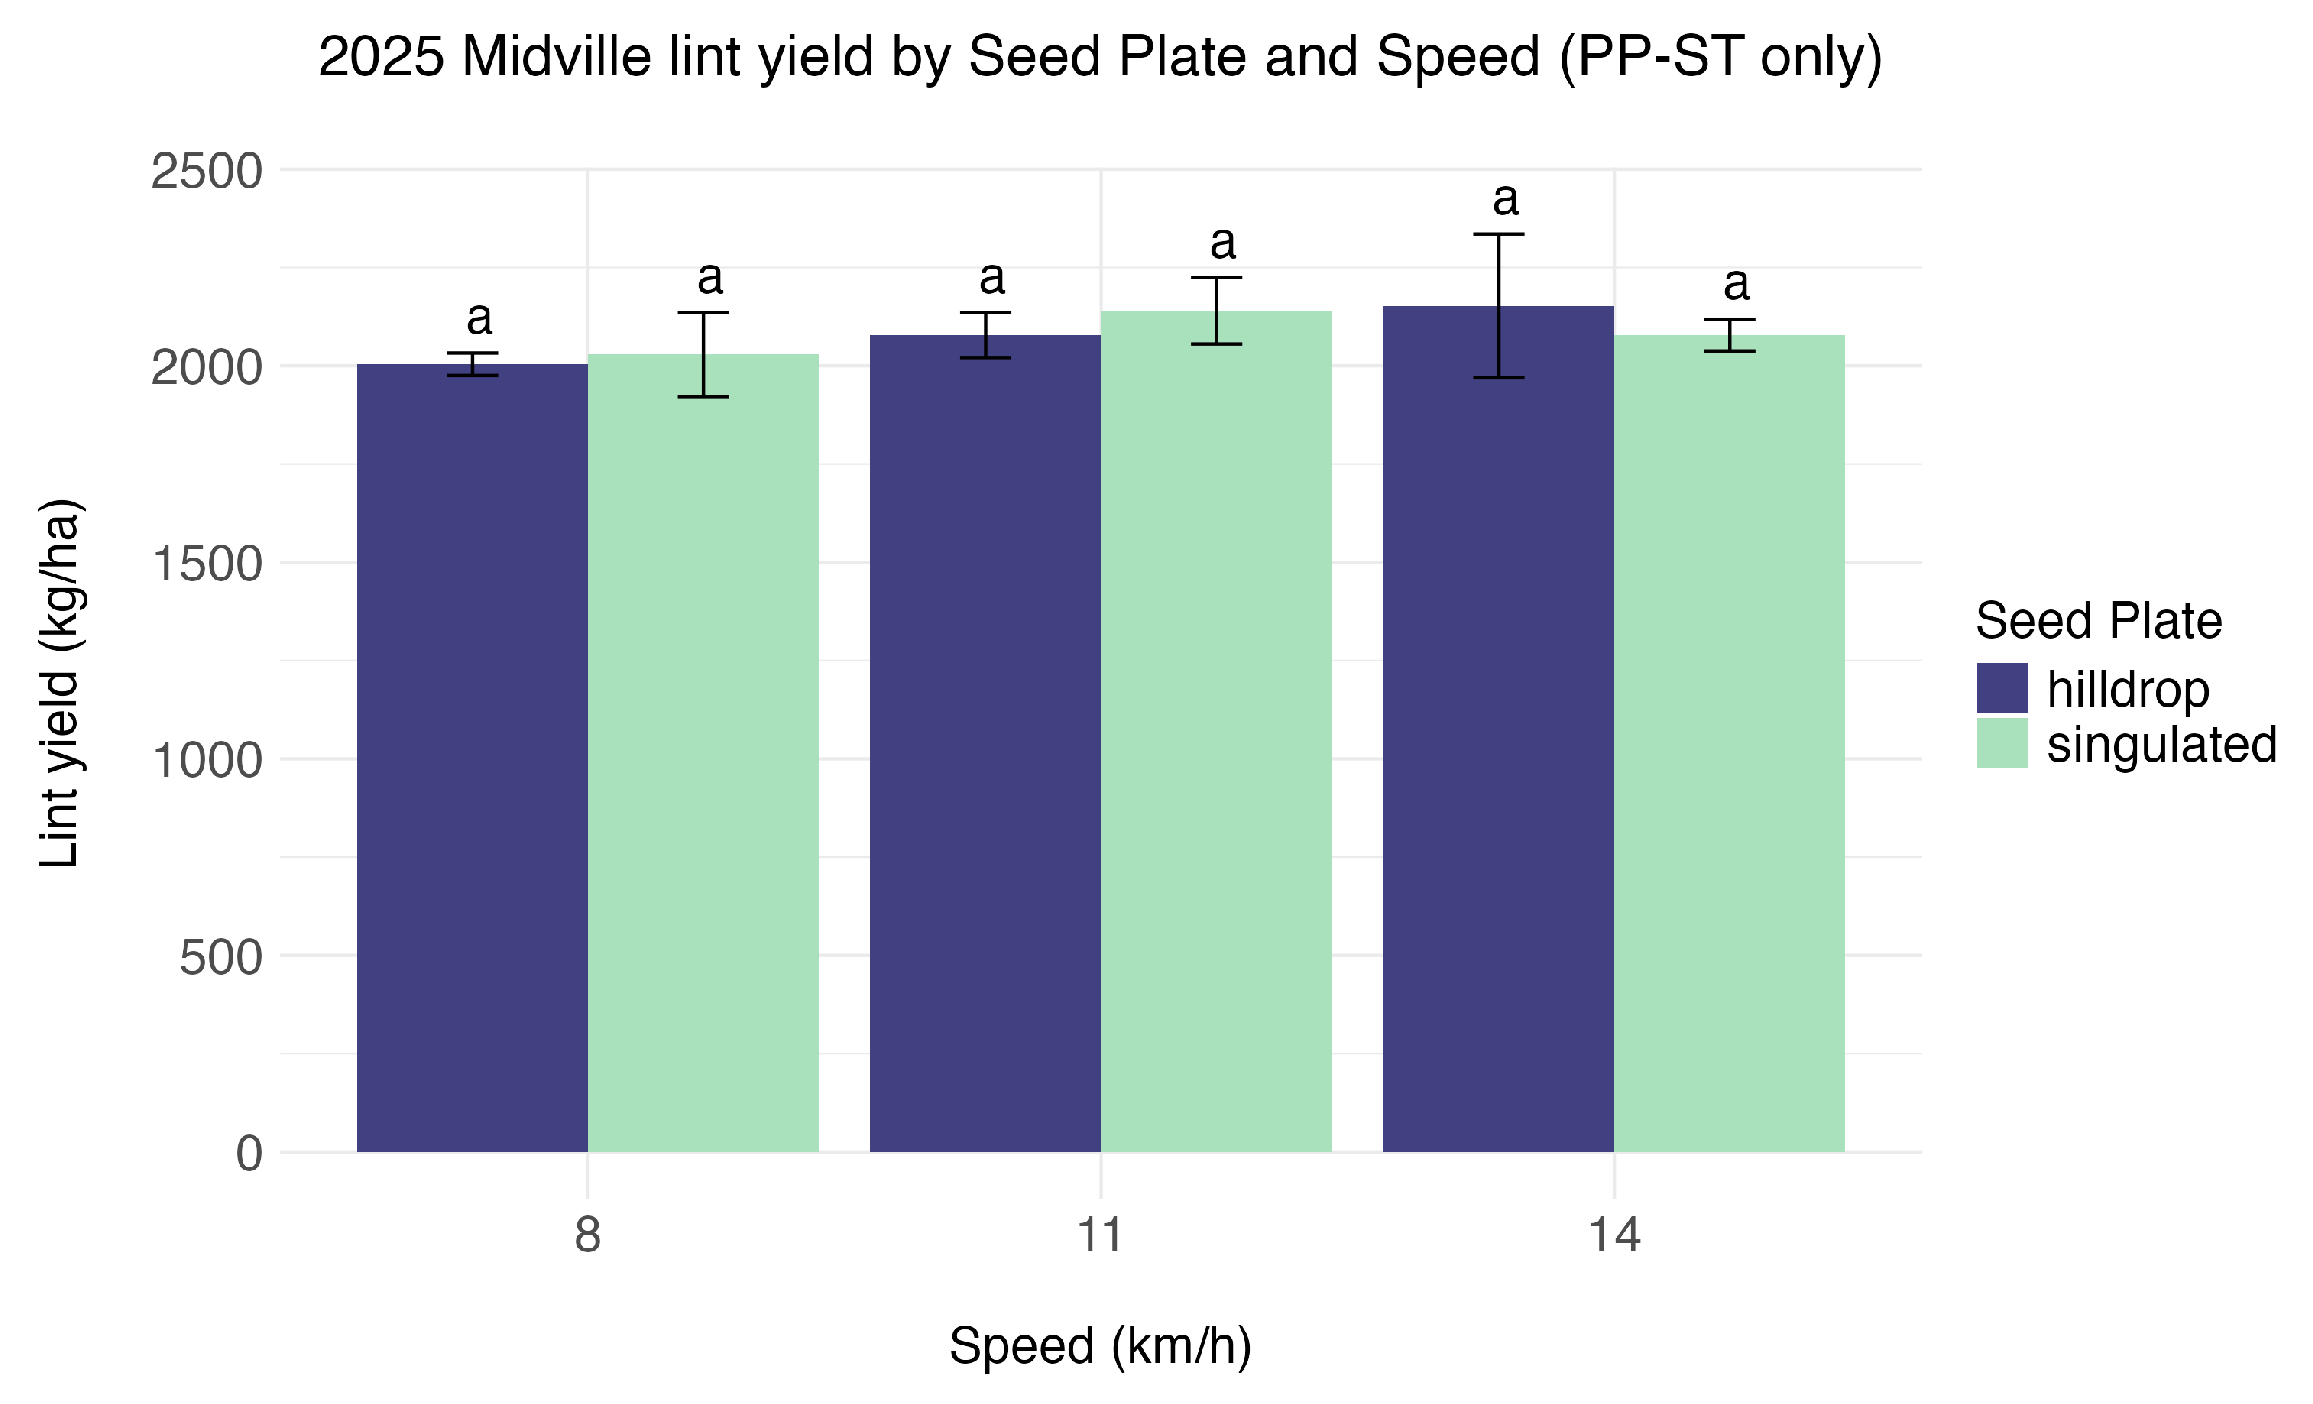
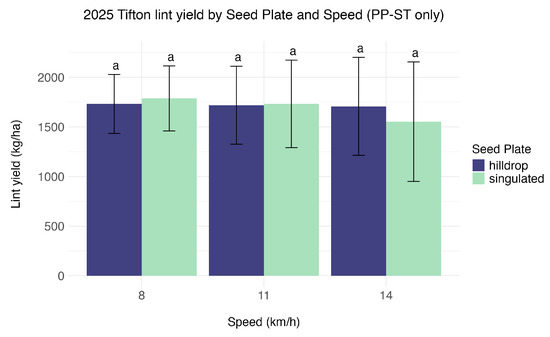
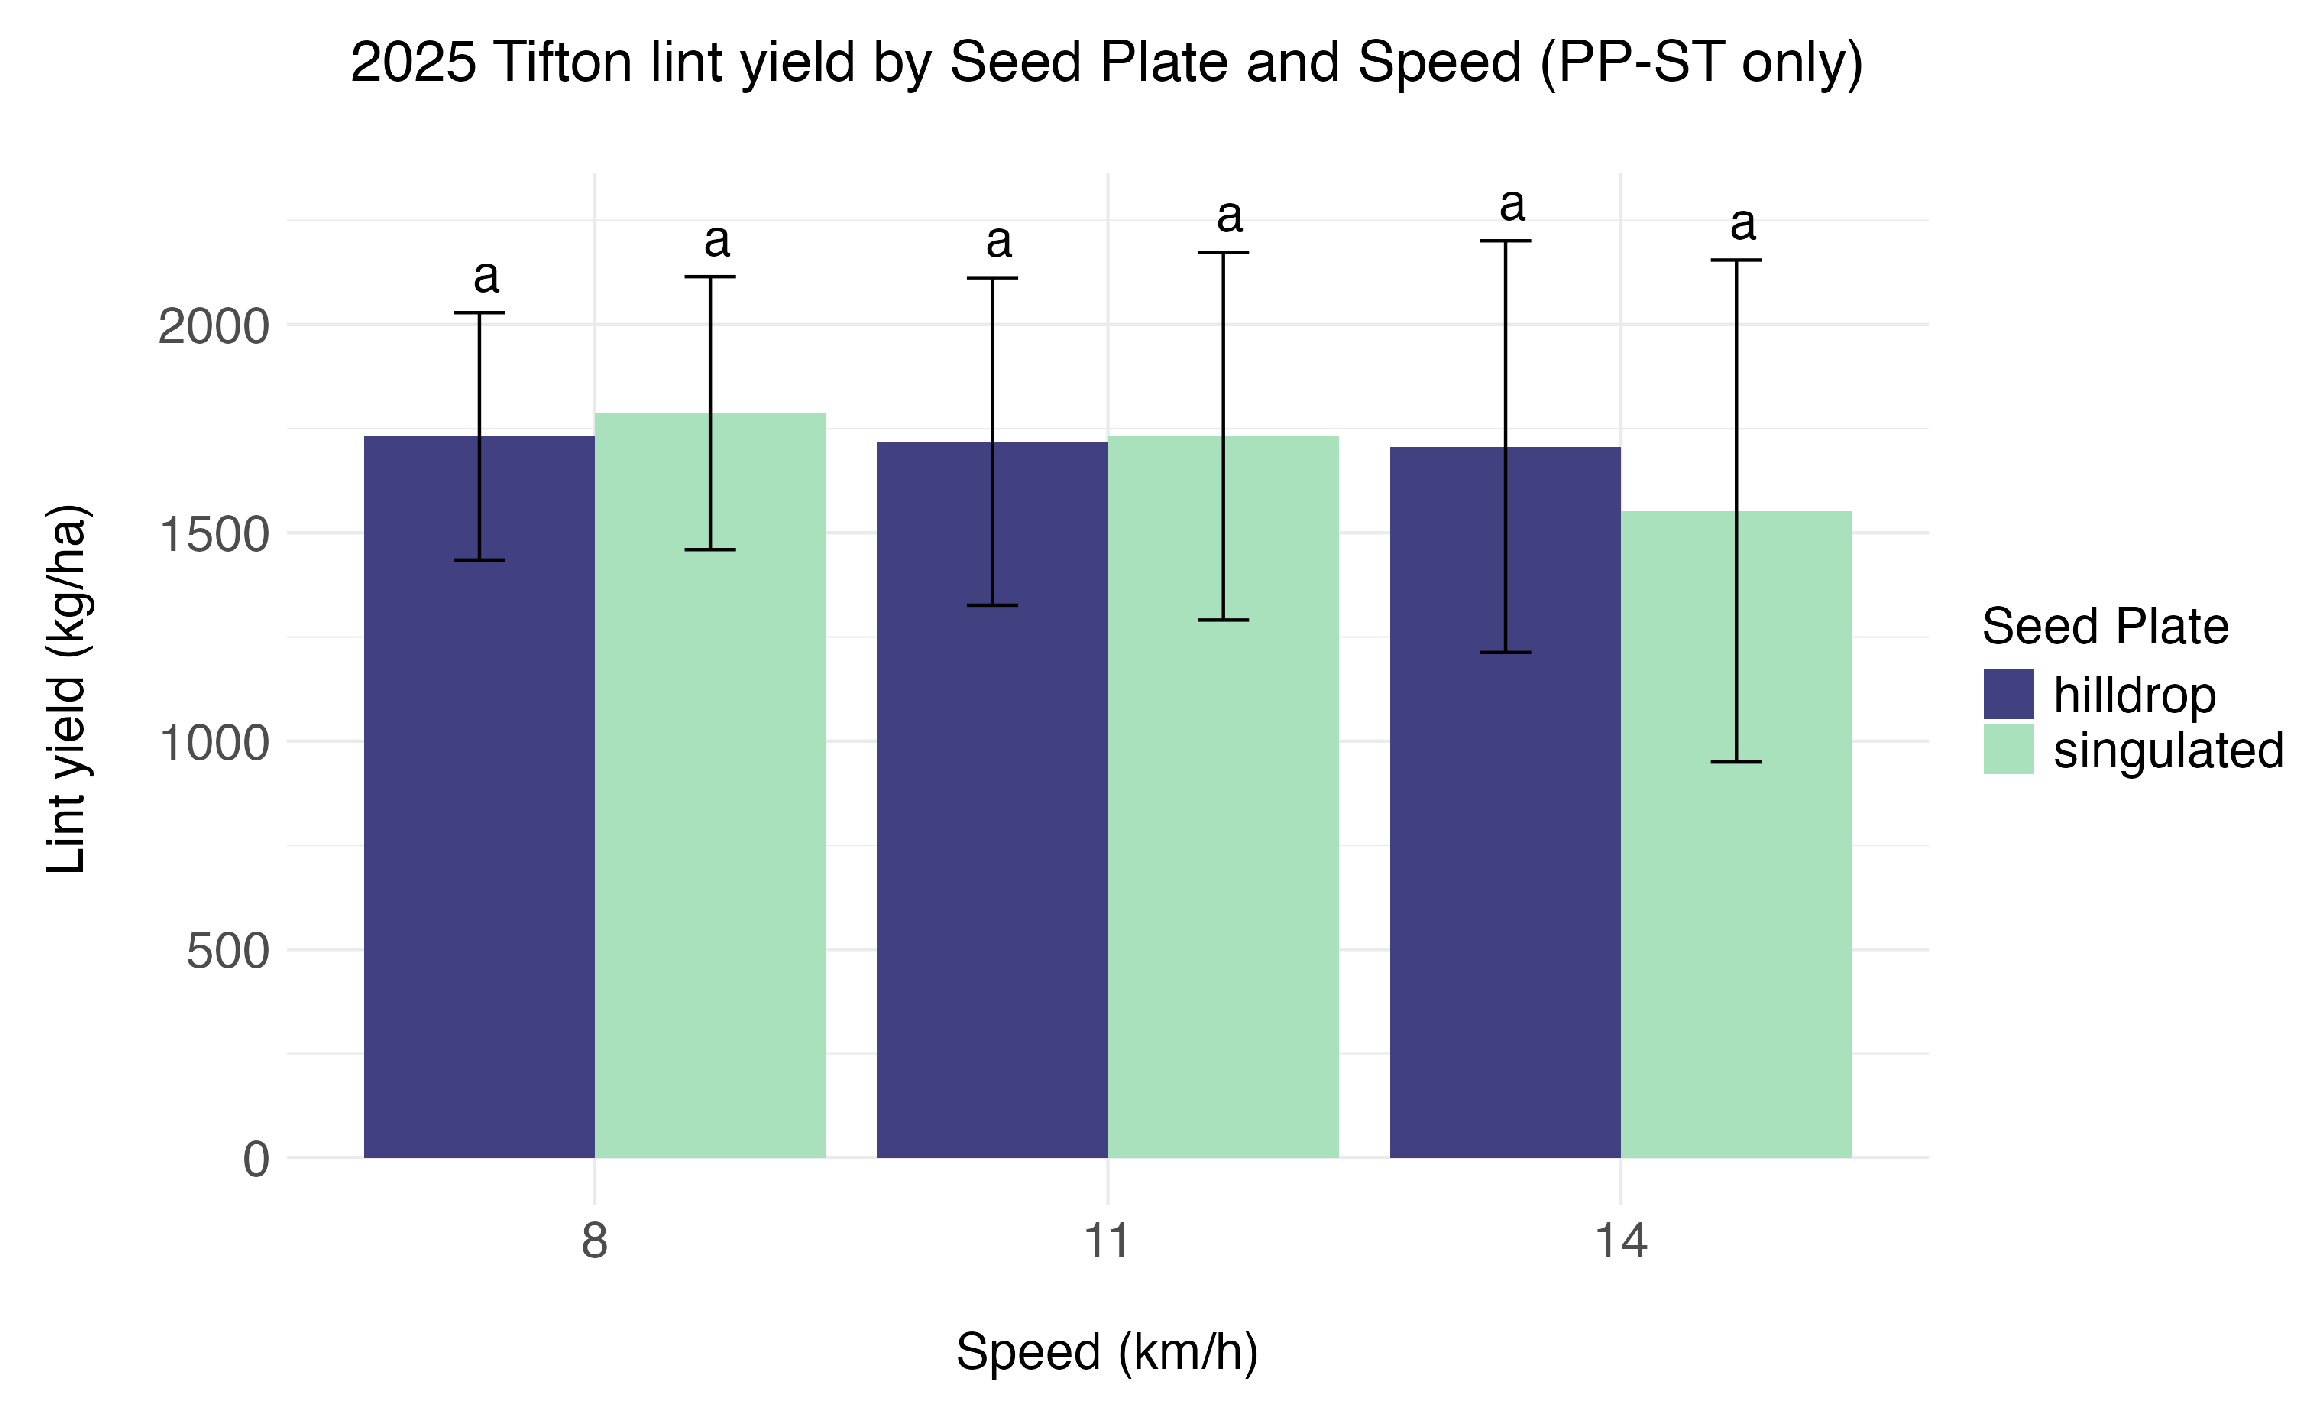
In the seed plate comparison conducted in 2025, no statistically significant differences in lint yield were detected between singulated and hill-drop configurations at any planting speed at either location. However, lint yield tended to decrease numerically as planting speed increased at Tifton, with greater yield differences observed for singulated planting than for hill-drop planting (Figure 24 and Figure 25).
Figure 24.
Lint yield by seed plate configuration and planting speed at Midville, GA, in 2025 using the PP-ST planter (Case IH Early Riser 2000 Series equipped with Precision Planting SpeedTube delivery and vSet electric seed meters). Bars sharing a common letter are not significantly different at based on Tukey-adjusted mean separation. Error bars represent ±1 standard deviation.
Figure 25.
Lint yield by seed plate configuration and planting speed at Tifton, GA, in 2025 using the PP-ST planter (Case IH Early Riser 2000 Series equipped with Precision Planting SpeedTube delivery and vSet electric seed meters). Bars sharing a common letter are not significantly different at based on Tukey-adjusted mean separation. Error bars represent ±1 standard deviation.
3.3.4. Reduced Seeding Rate Evaluation
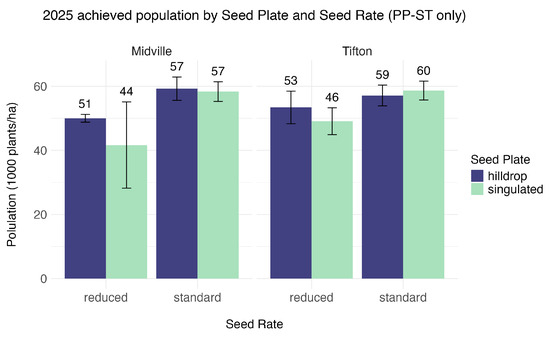
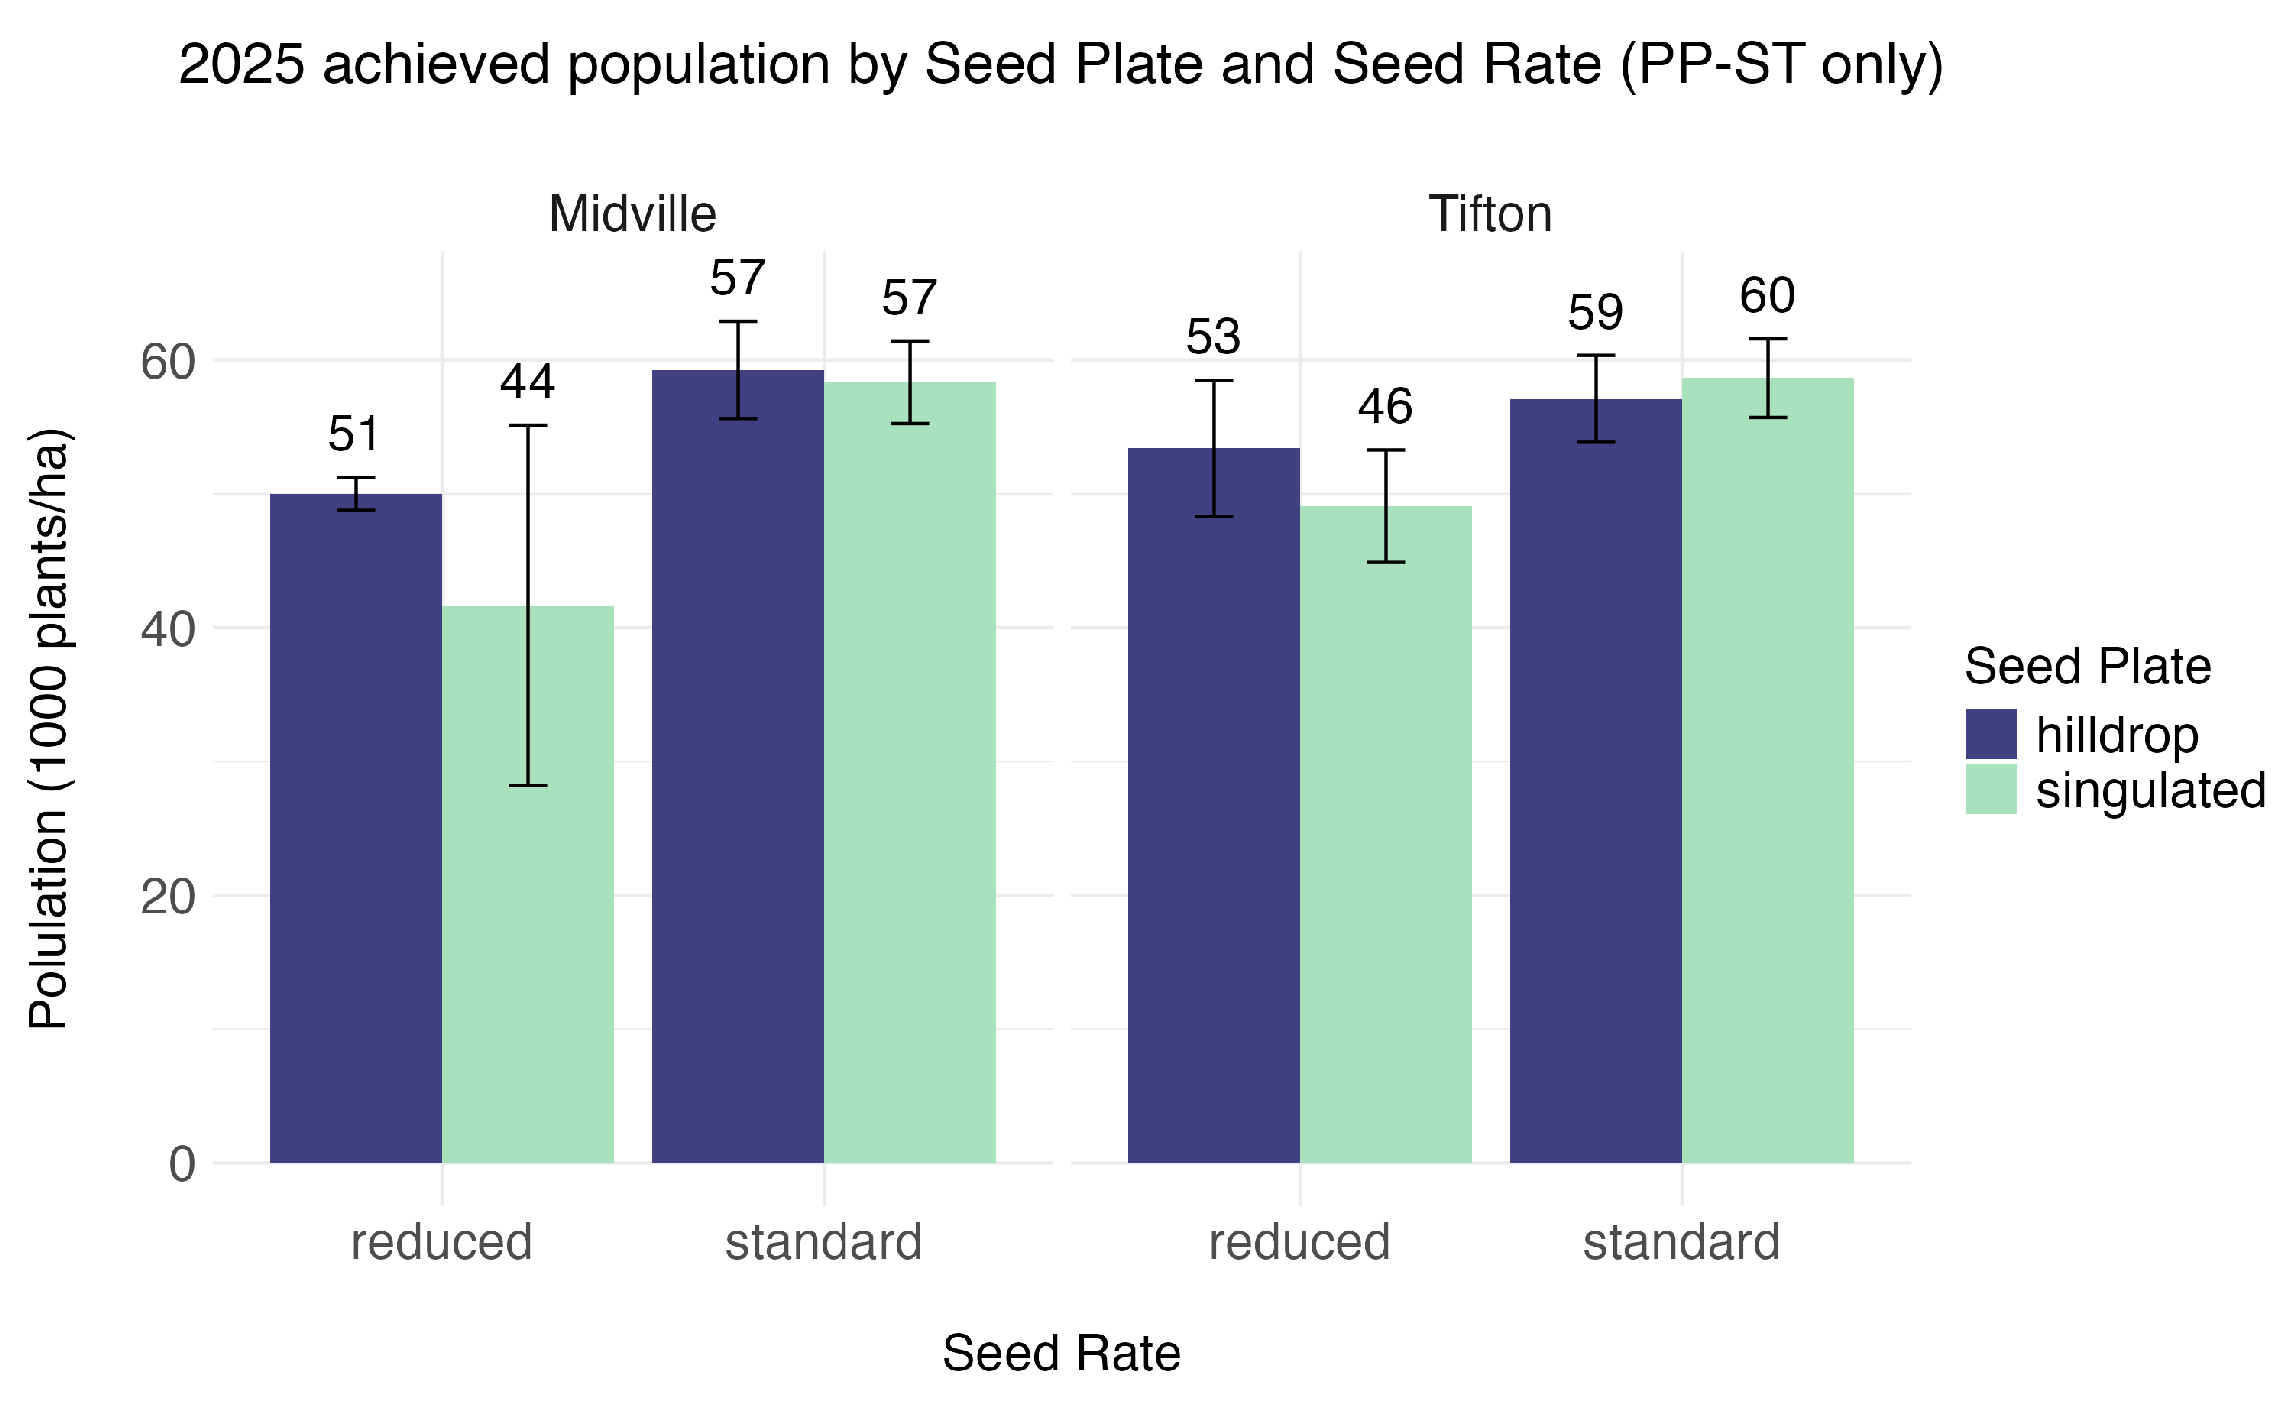
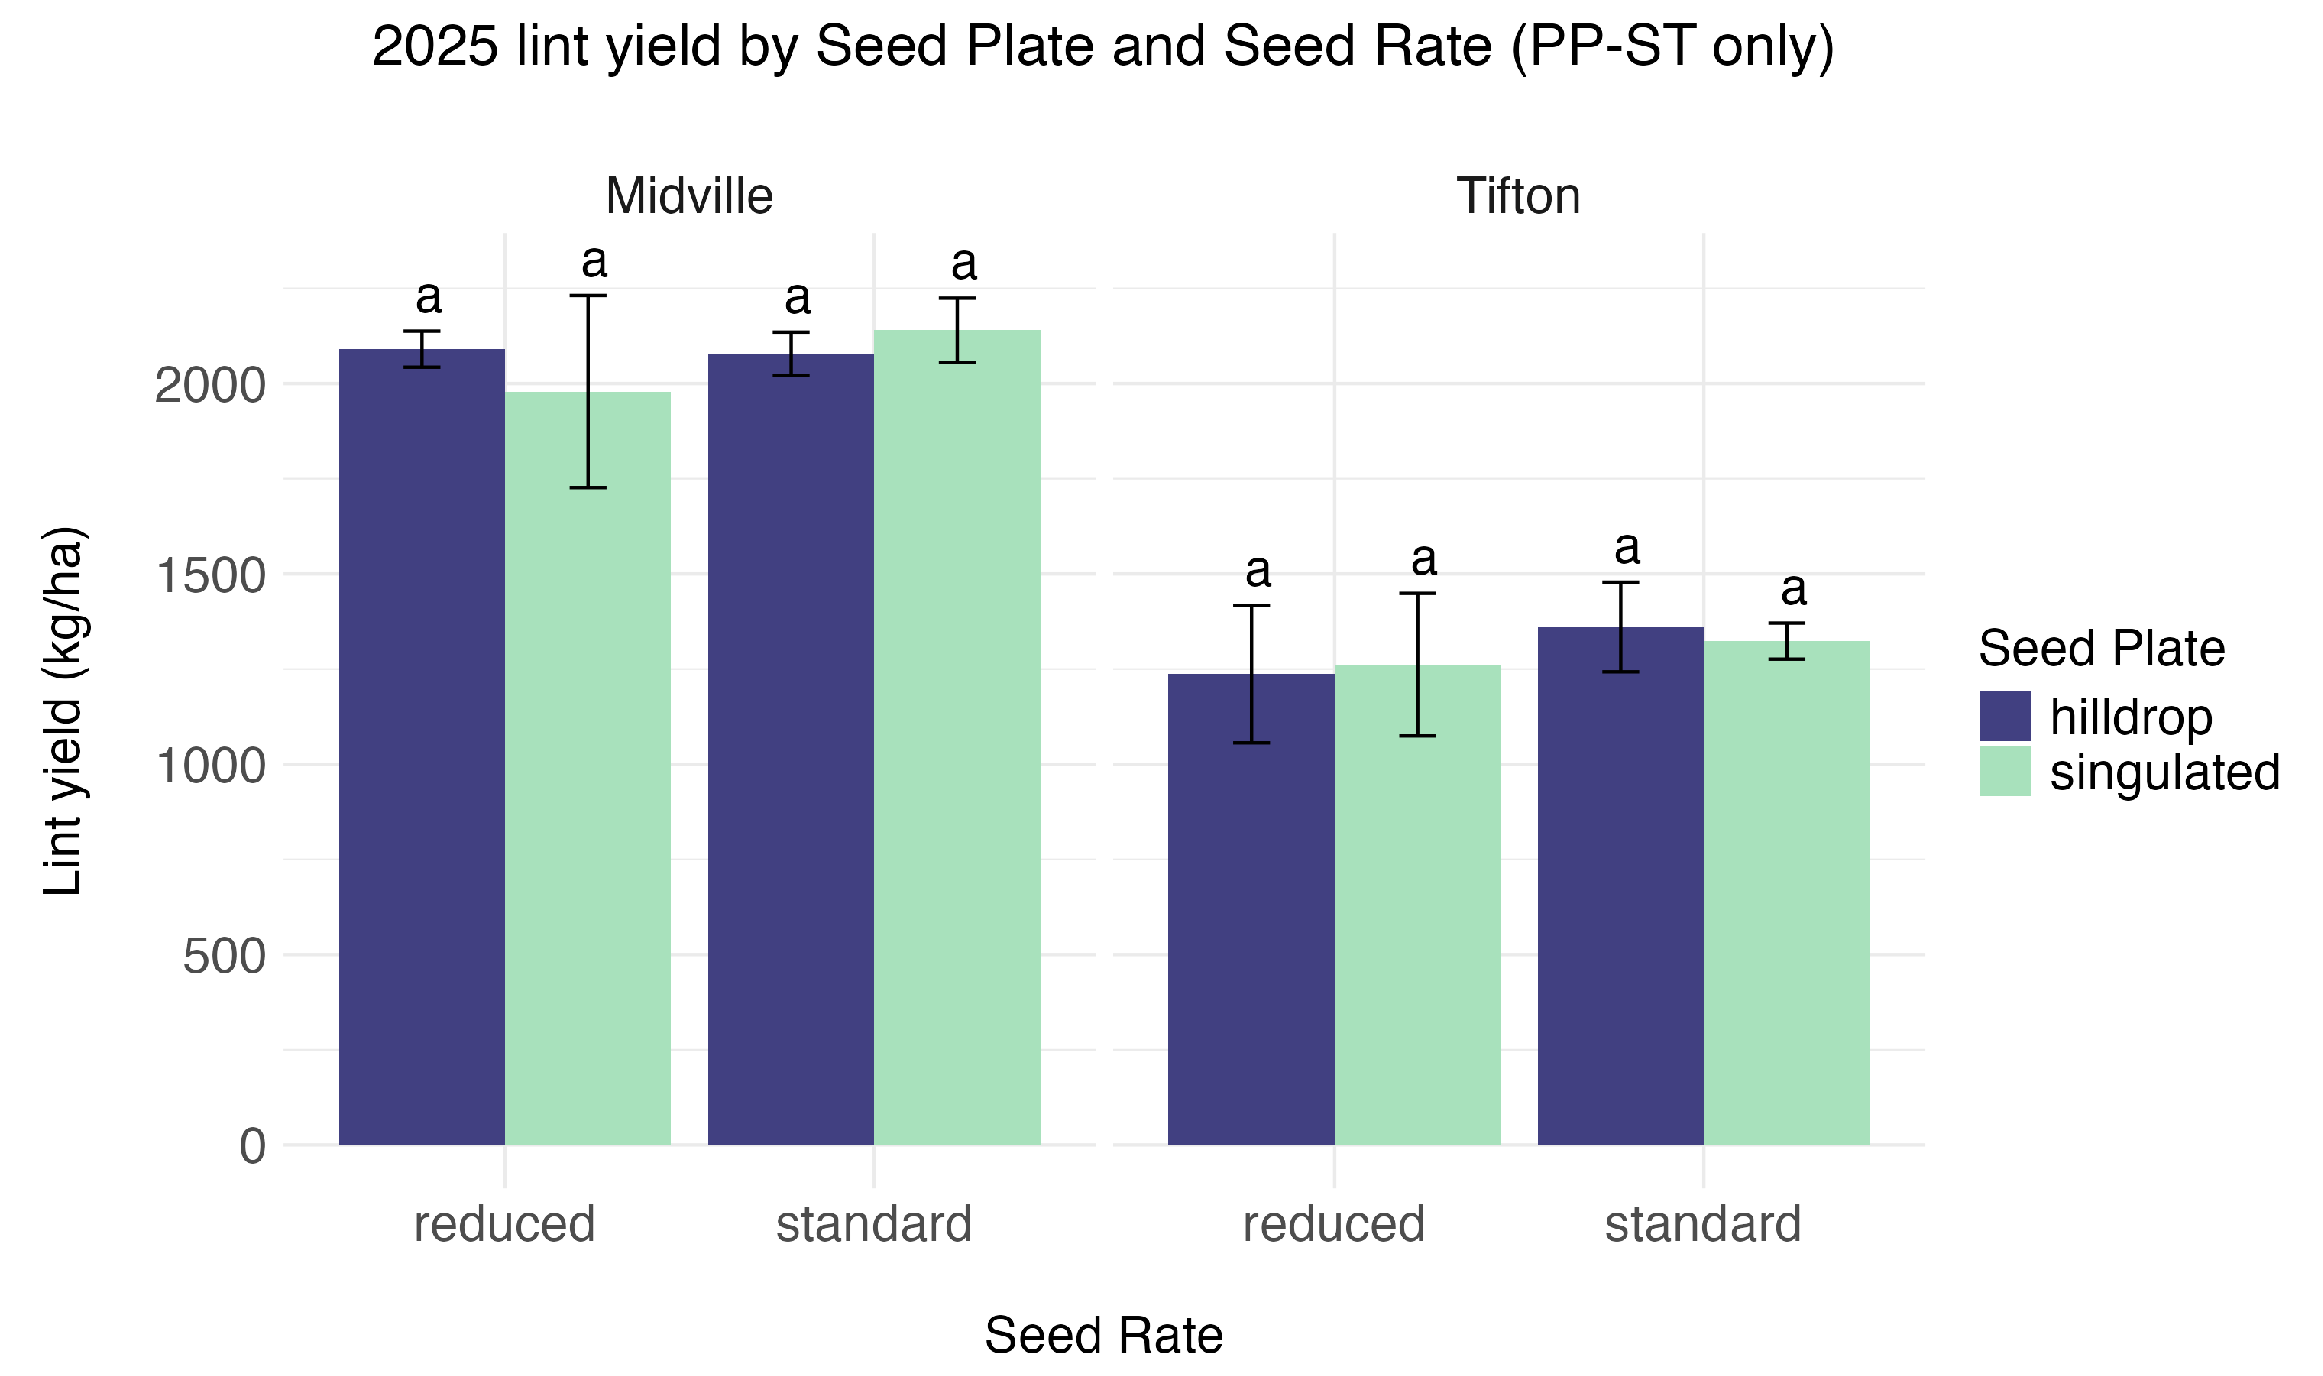
Because hill-drop seed plates produced higher achieved populations in earlier trials, a 10% reduction in seeding rate was evaluated at 11 km in 2025 for both PP-ST seed plate configurations to assess potential reductions in input costs. Achieved population for standard and reduced seeding rates is shown in Figure 26. No seed plate × seed rate interaction was detected for achieved population at either location; however, seed rate significantly affected achieved population at both Midville (F = 14.53, p = 0.004) and Tifton (F = 11.00, p = 0.009), with the standard rate producing greater achieved population than the reduced rate (Supplementary Table S6). No statistically significant seed-rate effects on lint yield were detected at either location, although lint yield at Tifton was numerically lower for the reduced seeding rate regardless of seed plate configuration (Figure 27; Supplementary Table S6).
Figure 26.
Achieved population by seed plate configuration under standard and reduced (%) seeding rates at 11 km in 2025. Error bars represent ±1 standard deviation.
Figure 27.
Lint yield by seed plate configuration under standard and reduced (%) seeding rates at 11 km in 2025. Bars sharing a common letter are not significantly different at based on Tukey-adjusted mean separation. Error bars represent ±1 standard deviation.
4. Discussion
4.1. Achieved Population Stability Across Planting Speeds and Downforce Levels
Across multiple site-years, the achieved population was generally not affected by planting speed or downforce within the ranges evaluated in this study. This response was consistent across conventional gravity-tube planters operated between 5 and 11 km and for high-speed planters operated between 8 and 14 km . These findings align with previous research indicating that cotton stand establishment is often resilient to moderate changes in planter operating parameters when seed placement depth remains within recommended limits [10,22].
The lack of achieved population response to downforce within the practical ranges evaluated is consistent with prior observations that downforce primarily affects depth consistency rather than final emergence when depth settings are appropriate [8,9]. Because seed depth variability and dynamic gauge-wheel load were not directly measured, downforce effects outside the evaluated range or under more limiting soil moisture conditions cannot be ruled out. In the present study, downforce levels were selected to represent practical field settings, and achieved population results suggest that these levels were sufficient to maintain gauge-wheel contact and consistent depth across the tested speed range.
4.2. Spacing Degradation with Gravity-Tube Delivery and Stability with Advanced Seed Delivery
While the achieved population remained stable, spacing uniformity declined as planting speed increased when conventional gravity-tube delivery systems were used. This response was evident in 2020 and 2021, where the proportion of perfectly spaced plants decreased as speed increased from 5 to 11 km . Similar trends have been reported in other row crops, where higher planting speeds increase row-unit vibration and seed bounce within the delivery system, resulting in less uniform plant spacing [14,15].
In contrast, spacing uniformity in 2025 did not degrade with increasing speed when advanced high-speed planter systems were used. Both the JD-EE and PP-ST planter systems maintained placement accuracy across the 8–14 km speed range. These results are consistent with the intended engineering function of controlled high-speed seed delivery, which reduces the variability associated with gravity-based delivery [18]. Similar improvements in spacing uniformity have been reported for soybean planted with high-speed planter technology [19,20].
However, the 2025 comparison should be interpreted as a comparison between integrated planter systems rather than as an isolated test of the delivery mechanism alone. The JD-EE and PP-ST configurations differed not only in their delivery architectures but also in seed meter design, calibration workflows, and manufacturer-specific system integration. For example, the JD-EE system allowed stationary seed-meter verification and adjustment prior to planting at the target operating speed, whereas the PP-ST system relied on manufacturer-recommended vacuum settings during field operation. Therefore, differences observed between these planters reflect system-level performance differences and should not be attributed solely to the seed-delivery mechanism.
4.3. Hill-Drop Seed Plates: Increased Population Without Consistent Yield Response
Hill-drop seed plates produced higher achieved populations than singulated plates in the 2022 and 2024 trials, consistent with prior work showing that multiple seeds per drop can increase emergence probability under challenging conditions [11,12]. However, these population increases did not translate into statistically significant lint yield differences in the harvested site-years.
This outcome is consistent with previous research indicating that cotton yield is often insensitive to moderate differences in stand density once a minimum threshold population is achieved [21]. The lack of yield response suggests that the additional plants established by hill-drop planting did not confer a yield advantage under the environmental conditions present during these trials.
Importantly, the high-speed PP-ST configuration evaluated in 2025 did not consistently produce true hill-dropped cotton, because most plant pairs failed to meet the <25.4 mm spacing criterion required for hill-drop classification. Under the tested conditions, most emerged plants were single plants rather than paired plants. Therefore, the 2025 results indicate that the specific high-speed hill-drop configuration evaluated in this study was not effective for reproducing the hill-drop placement pattern observed with the conventional gravity-tube system in 2022; they do not demonstrate that hill-drop strategies are broadly incompatible with all current high-speed planter systems.
4.4. Yield Variability and Environmental Influence
Lint yield responses varied substantially among years and locations and were not consistently associated with achieved population or spacing uniformity. Yield differences observed in 2020 and 2021 did not follow a consistent pattern across downforce levels, and no yield differences were observed in 2023 despite spacing differences in earlier years. Similarly, in 2025, yield responses differed between Midville and Tifton, with Tifton exhibiting lower yields and greater variability. Notably, the Tifton site-year showed a yield decline with increasing planting speed despite stable achieved population and spacing uniformity, indicating that factors not captured by the stand and spacing metrics measured here may have contributed to yield variability.
Given the field-scale strip design, the absence of uniform soil and seed-quality measurements across all site-years, and the lack of consistent yield responses across environments, yield differences could not be confidently attributed solely to planter settings. Site-specific soil, moisture, and other environmental conditions may have contributed to the observed variability [10,22]. The collection of apparent soil ECa data in 2025 further illustrates the importance of accounting for spatial variability when interpreting yield responses in field-scale planter evaluations.
4.5. Implications for High-Speed Cotton Planting
Collectively, these results indicate that high-speed planting systems equipped with advanced seed delivery mechanisms can increase planting productivity while maintaining placement accuracy for singulated cotton. However, improvements in spacing uniformity did not consistently translate into yield benefits across environments, suggesting that the primary advantage of high-speed planting in cotton may be increased operational efficiency rather than yield enhancement.
Further research is needed to better define the conditions under which improved spacing uniformity may influence yield and to determine whether adjustments to other planter parameters, such as higher downforce targets at elevated speeds, could improve yield stability under high-speed planting scenarios.
Because the evaluated site-years did not represent the full range of cold, wet, dry, or severe crusting conditions encountered in commercial cotton production, stronger responses to planter settings may occur under more stressful planting environments than those represented here.
4.6. Practical Implications for Cotton Planting Operations
Results from this study indicate that cotton producers can increase planting speed without compromising the achieved population when planter depth and downforce are properly managed. For conventional gravity-tube planters, operating speeds up to approximately 8 km maintained acceptable placement accuracy, whereas further increases in speed reduced spacing uniformity. In contrast, high-speed planters equipped with advanced seed delivery systems maintained spacing uniformity across a wider speed range (8–14 km ), suggesting that these systems can be used to improve field productivity during narrow planting windows without sacrificing seed placement accuracy in singulated cotton.
From a management perspective, the lack of consistent yield response to improved spacing uniformity suggests that the primary benefit of high-speed planting in cotton is operational efficiency rather than yield enhancement. Hill-drop seed plates increased the achieved population in some cases but did not provide a reliable yield advantage, and the high-speed PP-ST configuration evaluated in 2025 did not consistently produce true hill-dropped cotton under the tested conditions. Consequently, producers considering high-speed planting technology should prioritize singulated configurations and focus on consistent depth control and appropriate downforce settings, particularly at higher operating speeds. Future work evaluating downforce requirements and depth stability under high-speed conditions may further refine recommendations for optimizing planter performance in cotton.
5. Conclusions
Field experiments conducted between 2020 and 2025 evaluated the effects of planting speed, row-unit downforce, seed plate configuration, and seed delivery system type on cotton stand establishment, spacing uniformity, and lint yield across multiple Georgia site-years. Because each site-year differed in planter system, target seeding rate, and environmental context, the experiments should be interpreted as independent field evaluations rather than as a single pooled factorial comparison across years. Based on these site-year-specific results, the following conclusions can be drawn:
- Achieved plant population was generally not affected by planting speed or downforce within the tested ranges, including conventional gravity-tube planters operated at 5–11 km and high-speed planter systems operated at 8–14 km .
- With conventional gravity-tube seed delivery, spacing uniformity declined as planting speed increased. The proportion of perfectly spaced plants decreased from 44.0% to 22.1% in 2020 and from 52.8% to 28.4% in 2021 as speed increased from 5 to 11 km .
- In contrast, across the advanced planter systems evaluated in 2025, mean perfect spacing remained between 45.8% and 49.5% across 8–14 km , indicating that high-speed planter systems can mitigate the spacing degradation typically observed with conventional gravity-tube delivery in singulated cotton.
- Hill-drop seed plates increased the achieved population in the seed plate × downforce trials, from 79.6 to 87.8 thousand plants h at Midville and from 62.2 to 73.1 thousand plants h at Plains in 2022, and from 45.4 to 58.1 thousand plants h at Midville in 2024, but these increases did not result in consistent lint yield differences.
- The high-speed hill-drop configuration evaluated in 2025 did not consistently produce true hill-dropped cotton, indicating that the specific PP-ST hill-drop setup tested here was not effective for reproducing the plant-pair placement pattern observed with the conventional gravity-tube system.
- Lint yield responses varied across site-years and were not consistently associated with achieved population or spacing uniformity; therefore, the present results do not support a consistent yield advantage from improved spacing uniformity across the environments evaluated.
Overall, the results indicate that current high-speed planter systems can be used for singulated cotton to increase planting efficiency while maintaining placement accuracy. Additional research is needed to determine under which soil, weather, seed quality, and management conditions improved spacing uniformity translates into a meaningful yield response.
Supplementary Materials
The following supporting information can be downloaded at: https://www.mdpi.com/article/10.3390/agriengineering8040127/s1. Table S1: ANOVA summary for speed × downforce trials: achieved population in 2020, 2021, and 2023; Table S2: ANOVA summary for speed × downforce trials: perfect spacing in 2020 and 2021; Table S3: ANOVA summary for speed × downforce trials: lint yield in 2020, 2021, and 2023; Table S4: ANOVA summary for seed plate × downforce trials: achieved population in 2022 and 2024 and lint yield at Midville in 2022; Table S5: ANOVA summary for 2025 planter × speed analyses: achieved population, perfect spacing, and lint yield; Table S6: ANOVA summary for 2025 PP-ST seed plate × speed and reduced-rate analyses: achieved population and lint yield; Table S7: Treatment means underlying the quantitative statements reported in the Abstract and Conclusions.
Author Contributions
Conceptualization, M.T. and W.P.; methodology, W.P. and H.M.; investigation, M.T.; data curation, M.T.; formal analysis, M.T. and H.M.; writing—original draft preparation, M.T. and H.M.; writing—review and editing, H.M., W.P., L.C.H., W.S.M., N.D.F. and G.R.; supervision, W.P. All authors have read and agreed to the published version of the manuscript.
Funding
This work was supported by the Georgia Cotton Commission (award numbers: AWD00011856; AWD00013106; AWD00014604; AWD00015829; AWD00017683; AWD00018932; AWD00019041; AWD00020240).
Institutional Review Board Statement
Not applicable.
Informed Consent Statement
Not applicable.
Data Availability Statement
Data are available from the corresponding author upon reasonable request.
Acknowledgments
This work was supported by the Dual MS program in Sustainable Agriculture between the University of Georgia (USA) and the University of Padova (Italy). The authors acknowledge technical support from University of Georgia research staff and collaborators.
Conflicts of Interest
The authors declare no conflict of interest.
References
- USDA National Agricultural Statistics Service. 2024 State Agriculture Overview for Georgia. 2024. Available online: https://www.nass.usda.gov/Quick_Stats/Ag_Overview/stateOverview.php?state=GEORGIA (accessed on 21 October 2024).
- USDA Economic Research Service. Cotton Sector at a Glance. 2025. Available online: https://www.ers.usda.gov/topics/crops/cotton-and-wool/cotton-sector-at-a-glance (accessed on 22 January 2025).
- Bourland, F.M. Functional characterization of seed and seedling vigor in cotton. J. Cotton Sci. 2019, 23, 168–176. [Google Scholar] [CrossRef] [Scilit]
- Snider, J.L.; Pilon, C.; Virk, G. Seed Characteristics and Seedling Vigor. In Cotton Seed and Seedlings; Chastain, D.R., Kaur, G., Reddy, K.R., Oosterhuis, D.M., Eds.; The Cotton Foundation: Cordova, TN, USA, 2020; pp. 9–22. [Google Scholar]
- Porter, W.; Andrade-Sanchez, P.; Long, J.; Lowe, W.; Barnes, E. Precision Planter Components and Their Effects on Cotton Seed Placement and Emergence, Part 1: Seed Metering, Downforce Control and Depth Control; Cotton Incorporated: Cary, NC, USA, 2023. [Google Scholar]
- Precision Planting. SmartDepth: Depth Control. 2019. Available online: https://www.precisionplanting.com/products/planters/smartdepth (accessed on 14 February 2025).
- Bridges, R. Soil–Planter Interaction Force Distribution as Affected by Planting Depth Setting and Planter Configuration. Ph.D. Thesis, Auburn University, Auburn, AL, USA, 2016. [Google Scholar]
- Poncet, A. Optimization of Standard Depth Control Systems to Improve Row-Crop Planter Performance in the Southeast US. Ph.D. Thesis, University of Georgia, Athens, GA, USA, 2016. [Google Scholar]
- Virk, S.S.; Porter, W.M.; Li, C.; Rains, G.C.; Snider, J.L.; Whitaker, J.R. On-farm evaluation of planter downforce in varying soil textures within grower fields. Precis. Agric. 2021, 22, 777–799. [Google Scholar]
- Oliveira, L.; Ortiz, B.; Pate, G.; Way, T.; Silva, R. Soil and crop response to varying planter downforce in corn and cotton fields. Smart Agric. Technol. 2025, 10, 100798. [Google Scholar] [CrossRef] [Scilit]
- Virk, S.S. Evaluating the Effect of Planter Downforce and Seed Vigor on Crop Emergence and Yield in Hill-Drop vs. Singulated Cotton. Ph.D. Thesis, University of Georgia, Athens, GA, USA, 2018. [Google Scholar]
- Virk, S.S.; Porter, W.M.; Snider, J.L.; Whitaker, J.R.; Rains, G.C.; Li, C.C. Influence of seeding rate, planter downforce, and cultivar on crop emergence and yield in singulated and hill-dropped cotton. J. Cotton Sci. 2020, 24, 137–147. [Google Scholar] [CrossRef] [Scilit]
- Snider, J.; Virk, S.; Hand, L.C.; Porter, W. Considerations for stand establishment and early seedling growth in cotton. Crop. Soils 2022, 55, 48–55. [Google Scholar] [CrossRef] [Scilit]
- Nielsen, R.L. Planting speed effects on stand establishment and grain yield of corn. J. Prod. Agric. 1995, 8, 391–393. [Google Scholar] [CrossRef] [Scilit]
- Badua, S.A.; Sharda, A.; Strasser, R.; Ciampitti, I. Ground speed and planter downforce influence on corn seed spacing and depth. Precis. Agric. 2021, 22, 1154–1170. [Google Scholar] [CrossRef] [Scilit]
- Petrović, I.; Vučajnk, F.; Trdan, S.; Bernik, R.; Vidrih, M. Influence of planting speed on maize spacing variability. Agronomy 2025, 15, 462. [Google Scholar] [CrossRef] [Scilit]
- Siega, G.A.; Filho, A.C.P.M.; Sharma, P.; Melo, A.F.; Ventura, M.V.A. Influence of planting speed on soybean emergence uniformity and distribution. Cerrado Agric. Biol. Res. 2024, 1, 21–29. [Google Scholar] [CrossRef] [Scilit]
- Andrade-Sanchez, P.; Long, J.; Porter, W.; Lowe, W. Precision Planter Components and Their Effects on Cotton Seed Placement and Emergence, Part 2: Planning for Planting Operations; Seed Monitoring and Delivery; Opening and Closing Systems; and Reporting Options; Cotton Incorporated: Cary, NC, USA, 2023. [Google Scholar]
- Pereyra, V.M.; Bastos, L.M.; Reis, A.F.B.; Melchiori, R.J.M.; Maltese, N.E.; Appelhans, S.C.; Prasad, P.V.V.; Wright, Y.; Brokesh, E.; Sharda, A.; et al. Early-season plant-to-plant spatial uniformity can affect soybean yields. Sci. Rep. 2022, 12, 17128. [Google Scholar] [CrossRef] [Scilit] [PubMed]
- Olomitutu, O.E.; Mulvaney, M.J.; Lowe, J.W.; Bryant, C.J.; Wallace, J.; Harper, N.; Larson, E.J.; Shavers, G.; Hilyer, T.; Dhillon, J. Soybean response to high-speed planting in Mississippi. Agron. J. 2024, 116, 2817–2826. [Google Scholar] [CrossRef] [Scilit]
- UGA Extension Cotton Team. Georgia Cotton Production Guide. 2023. Available online: https://extension.uga.edu/publications/detail.html?number=AP124-3 (accessed on 15 February 2025).
- Virk, S.; Porter, W.; Snider, J.; Rains, G.; Li, C.; Liu, Y. Cotton emergence and yield response to planter depth and downforce settings in different soil moisture conditions. AgriEngineering 2021, 3, 323–338. [Google Scholar] [CrossRef] [Scilit]
- Piepho, H.P. Letters in mean comparisons: What they do and don’t mean. Agron. J. 2018, 110, 431–434. [Google Scholar] [CrossRef] [Scilit]

Disclaimer/Publisher’s Note: The statements, opinions and data contained in all publications are solely those of the individual author(s) and contributor(s) and not of MDPI and/or the editor(s). MDPI and/or the editor(s) disclaim responsibility for any injury to people or property resulting from any ideas, methods, instructions or products referred to in the content. |
© 2026 by the authors. Licensee MDPI, Basel, Switzerland. This article is an open access article distributed under the terms and conditions of the Creative Commons Attribution (CC BY) license.