


Abstract
This study provides a practical and replicable improvement model for productivity and inspection reliability improvement in resource-constrained food logistics environments. This study presents an engineering-based optimization of productivity and process reliability in an agro-industrial post-harvest processing system for canned young green jackfruit using an integrated Define–Measure–Analyze–Improve–Control (DMAIC) and Failure Mode and Effects Analysis (FMEA) framework. The case-study production system experienced high raw-material loss, prolonged blanching cycles, and low inter-operator inspection agreement, which reduced process yield and logistics throughput. Root causes were identified through process mapping and fishbone analysis and prioritized using FMEA Risk Priority Number (RPN) scoring. Key improvement actions included optimizing blanching time, standardizing supplier grading to reduce material variability, and strengthening inspection decisions through Attribute Gage Repeatability and Reproducibility (Gage R&R)-based training and criteria alignment. After implementation, productivity increased by 2.31%, raw-material loss decreased by 1.90%, and inter-operator inspection agreement improved by 16%, exceeding the benchmark. Blanching time was reduced from 3 to 1 min at ≥90 °C, shortening cycle time by 67% and generating an estimated annual cost saving of USD 7200 without major capital investment. The results demonstrate that structured, risk-based improvement combined with validated measurement systems can enhance workforce consistency, process stability, and logistics flow efficiency in agro-industrial food processing environments, providing a replicable improvement model for agro-industrial processing small and medium-sized enterprises (SMEs).
1. Introduction
Thailand’s agricultural sector provides a continuous supply of raw materials for the food processing industry, creating significant opportunities for engineering-driven value-added agro-industrial systems. Canned young green jackfruit has emerged as a promising product due to the growing demand in global plant-based food markets. However, many Thai agro-industrial small and medium-sized enterprises (SMEs) still experience operational inefficiencies that limit productivity, increase material loss, and reduce logistics throughput.
The case-study production system relies heavily on manual operations and subjective inspection decisions, with limited process standardization. These conditions lead to persistent problems, including high raw-material loss, prolonged blanching cycles, inconsistent product classification, and low inter-operator agreement. Such inefficiencies not only reduce process yield but also disrupt material flow, increase rework, and weaken supply chain reliability. From a post-harvest processing perspective, variability in processing directly affects cycle time, inventory levels, and overall operational performance.
The Six Sigma DMAIC (Define–Measure–Analyze–Improve–Control) methodology has been widely recognized as an effective framework for systematic problem solving and productivity improvement in various industries, including food processing [1,2]. DMAIC enables organizations to identify root causes of variation, implement data-driven improvements, and establish sustainable control mechanisms without major capital investment. Failure Mode and Effects Analysis (FMEA) complements DMAIC by providing a structured risk-based approach to prioritize process failures according to severity, occurrence, and detectability [3,4]. While DMAIC and FMEA have been widely applied in manufacturing and food processing systems to improve quality and productivity [5,6,7], their application in agro-industrial SMEs remains limited, particularly in labor-intensive and semi-standardized environments.
In such contexts, the reliability of measurement and inspection systems is critical to ensure valid process improvement outcomes. However, this aspect has received limited attention in agro-industrial food processing, particularly in human-dependent inspection systems. The application of Attribute Gage Repeatability and Reproducibility (Gage R&R) remains rarely explored in this domain [8,9,10]. Unlike previous studies that primarily focus on process optimization and risk reduction using DMAIC and FMEA, this study integrates measurement system validation through Attribute Gage R&R as a core component. This ensures that process decisions are based on reliable inspection systems, which is particularly critical in labor-intensive agro-industrial SMEs where human judgment significantly influences quality outcomes.
This study addresses these gaps by implementing an integrated DMAIC–FMEA framework for canned young green jackfruit processing, combining process optimization, measurement system analysis, and risk-based decision making to improve logistics throughput, reduce raw-material loss, and enhance inspection consistency. Blanching time and inspection decisions are explicitly treated as a multi-criteria trade-off problem, influencing yield, product quality, cycle time, and cost efficiency. In this study, “productivity” refers to output efficiency, “yield” to mass-based conversion efficiency, and “throughput” to process flow performance. These terms are used consistently throughout the manuscript.
The objectives of this study are to: (i) reduce process waste and raw-material loss; (ii) optimize blanching conditions to balance mass retention, texture quality, and enzyme inactivation; (iii) improve inspection reliability using Attribute Gage R&R and operator training; and (iv) develop a practical DMAIC–FMEA model to support sustainable logistics in agro-industrial SMEs. By achieving these objectives, the study contributes both practically and theoretically to agro-industrial processing engineering and post-harvest food processing systems, while extending the application of integrated DMAIC–FMEA decision logic in labor-intensive SME contexts.
2. Literature Review
The Six Sigma DMAIC methodology has been extensively adopted as a systematic approach for process improvement, defect reduction, and productivity enhancement across a wide range of industries [1,11]. Originally developed by Motorola and later formalized by Harry and Schroeder [11], DMAIC provides a structured, data-driven framework that supports problem identification, root cause analysis, and sustainable performance control. In parallel, FMEA serves as a complementary risk assessment tool that prioritizes potential process failures based on severity, occurrence, and detectability [3,4]. The integration of DMAIC and FMEA has therefore become a widely accepted strategy for improving operational reliability and reducing process-related risks.
A substantial body of literature demonstrates the effectiveness of DMAIC in manufacturing environments. Previous studies have reported significant improvements in rejection rates, lead time reduction, and overall productivity performance [12,13,14,15]. Within the food processing sector, DMAIC has been successfully applied to enhance process control and increase product yield, such as in potato chip production [2]. Furthermore, the combined use of DMAIC and FMEA has been shown to strengthen risk management capabilities in various industrial contexts [16]. Applications have also been documented in healthcare systems [17,18,19], casting and automotive assembly [20,21,22], as well as in recent production optimization studies in electronics manufacturing and scheduling environments [23,24]. These studies collectively highlight the versatility of DMAIC as a general-purpose improvement methodology adaptable to diverse operational settings.
Despite this extensive evidence, most prior research has focused on highly automated manufacturing systems with well-established measurement infrastructures. In contrast, semi-automated and labor-intensive agro-industrial environments have received comparatively little attention. In food manufacturing, the successful implementation of DMAIC–FMEA requires not only process optimization but also reliable measurement systems and consistent human decision making. However, few studies have explicitly examined the role of measurement system validation—particularly Attribute Gage Repeatability and Reproducibility (Gage R&R)—in supporting inspection reliability within food processing operations [8,9]. The limited integration of Gage R&R into DMAIC-based food industry studies represents a critical methodological gap, especially in contexts where quality decisions rely heavily on operator judgment.
From a logistics and operations management perspective, process variability in food production directly affects material flow, cycle time, and supply chain efficiency. Previous DMAIC studies have largely evaluated outcomes in terms of defect reduction and quality improvement, while relatively few have considered logistics-oriented performance indicators such as throughput, inventory stability, and rework reduction. Research that links DMAIC implementation with logistics performance improvement in agro-food supply chains therefore remains scarce. Moreover, decision problems in food processing—such as determining optimal blanching conditions—often involve trade-offs among multiple criteria including yield, texture, processing time, and cost. Empirical studies that treat such decisions as multi-criteria optimization problems within a DMAIC framework are still limited.
In the Southeast Asian context, agro-industrial SMEs play a vital economic role but typically operate with constrained resources, limited automation, and informal process controls. These characteristics make the direct transfer of conventional DMAIC models challenging. Although several studies have reported productivity improvements through DMAIC–FMEA integration [16], documented applications in canned fruit processing—particularly young green jackfruit—are virtually nonexistent. Consequently, there is a clear need for a practical and context-specific improvement framework that integrates risk prioritization, measurement system reliability, and logistics-oriented decision making for resource-constrained food enterprises.
To address these limitations, the present study extends existing literature by applying an integrated DMAIC–FMEA approach to canned young green jackfruit processing, with explicit consideration of logistics throughput, inspection reliability, and multi-criteria process optimization. This approach aims to bridge the gap between traditional quality improvement studies and the practical operational challenges faced by agro-industrial SMEs.
3. Methodology
Productivity improvement centers on optimizing resource utilization to increase output while reducing costs and losses. Rather than merely expanding production volume, it emphasizes process and workflow efficiency [1,12]. Structured approaches such as DMAIC, when combined with Failure Mode and Effects Analysis (FMEA), provide a systematic pathway for identifying inefficiencies, examining failure risks, and guiding data-driven improvements [3,4,20].
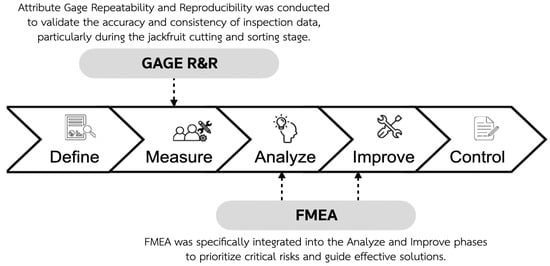
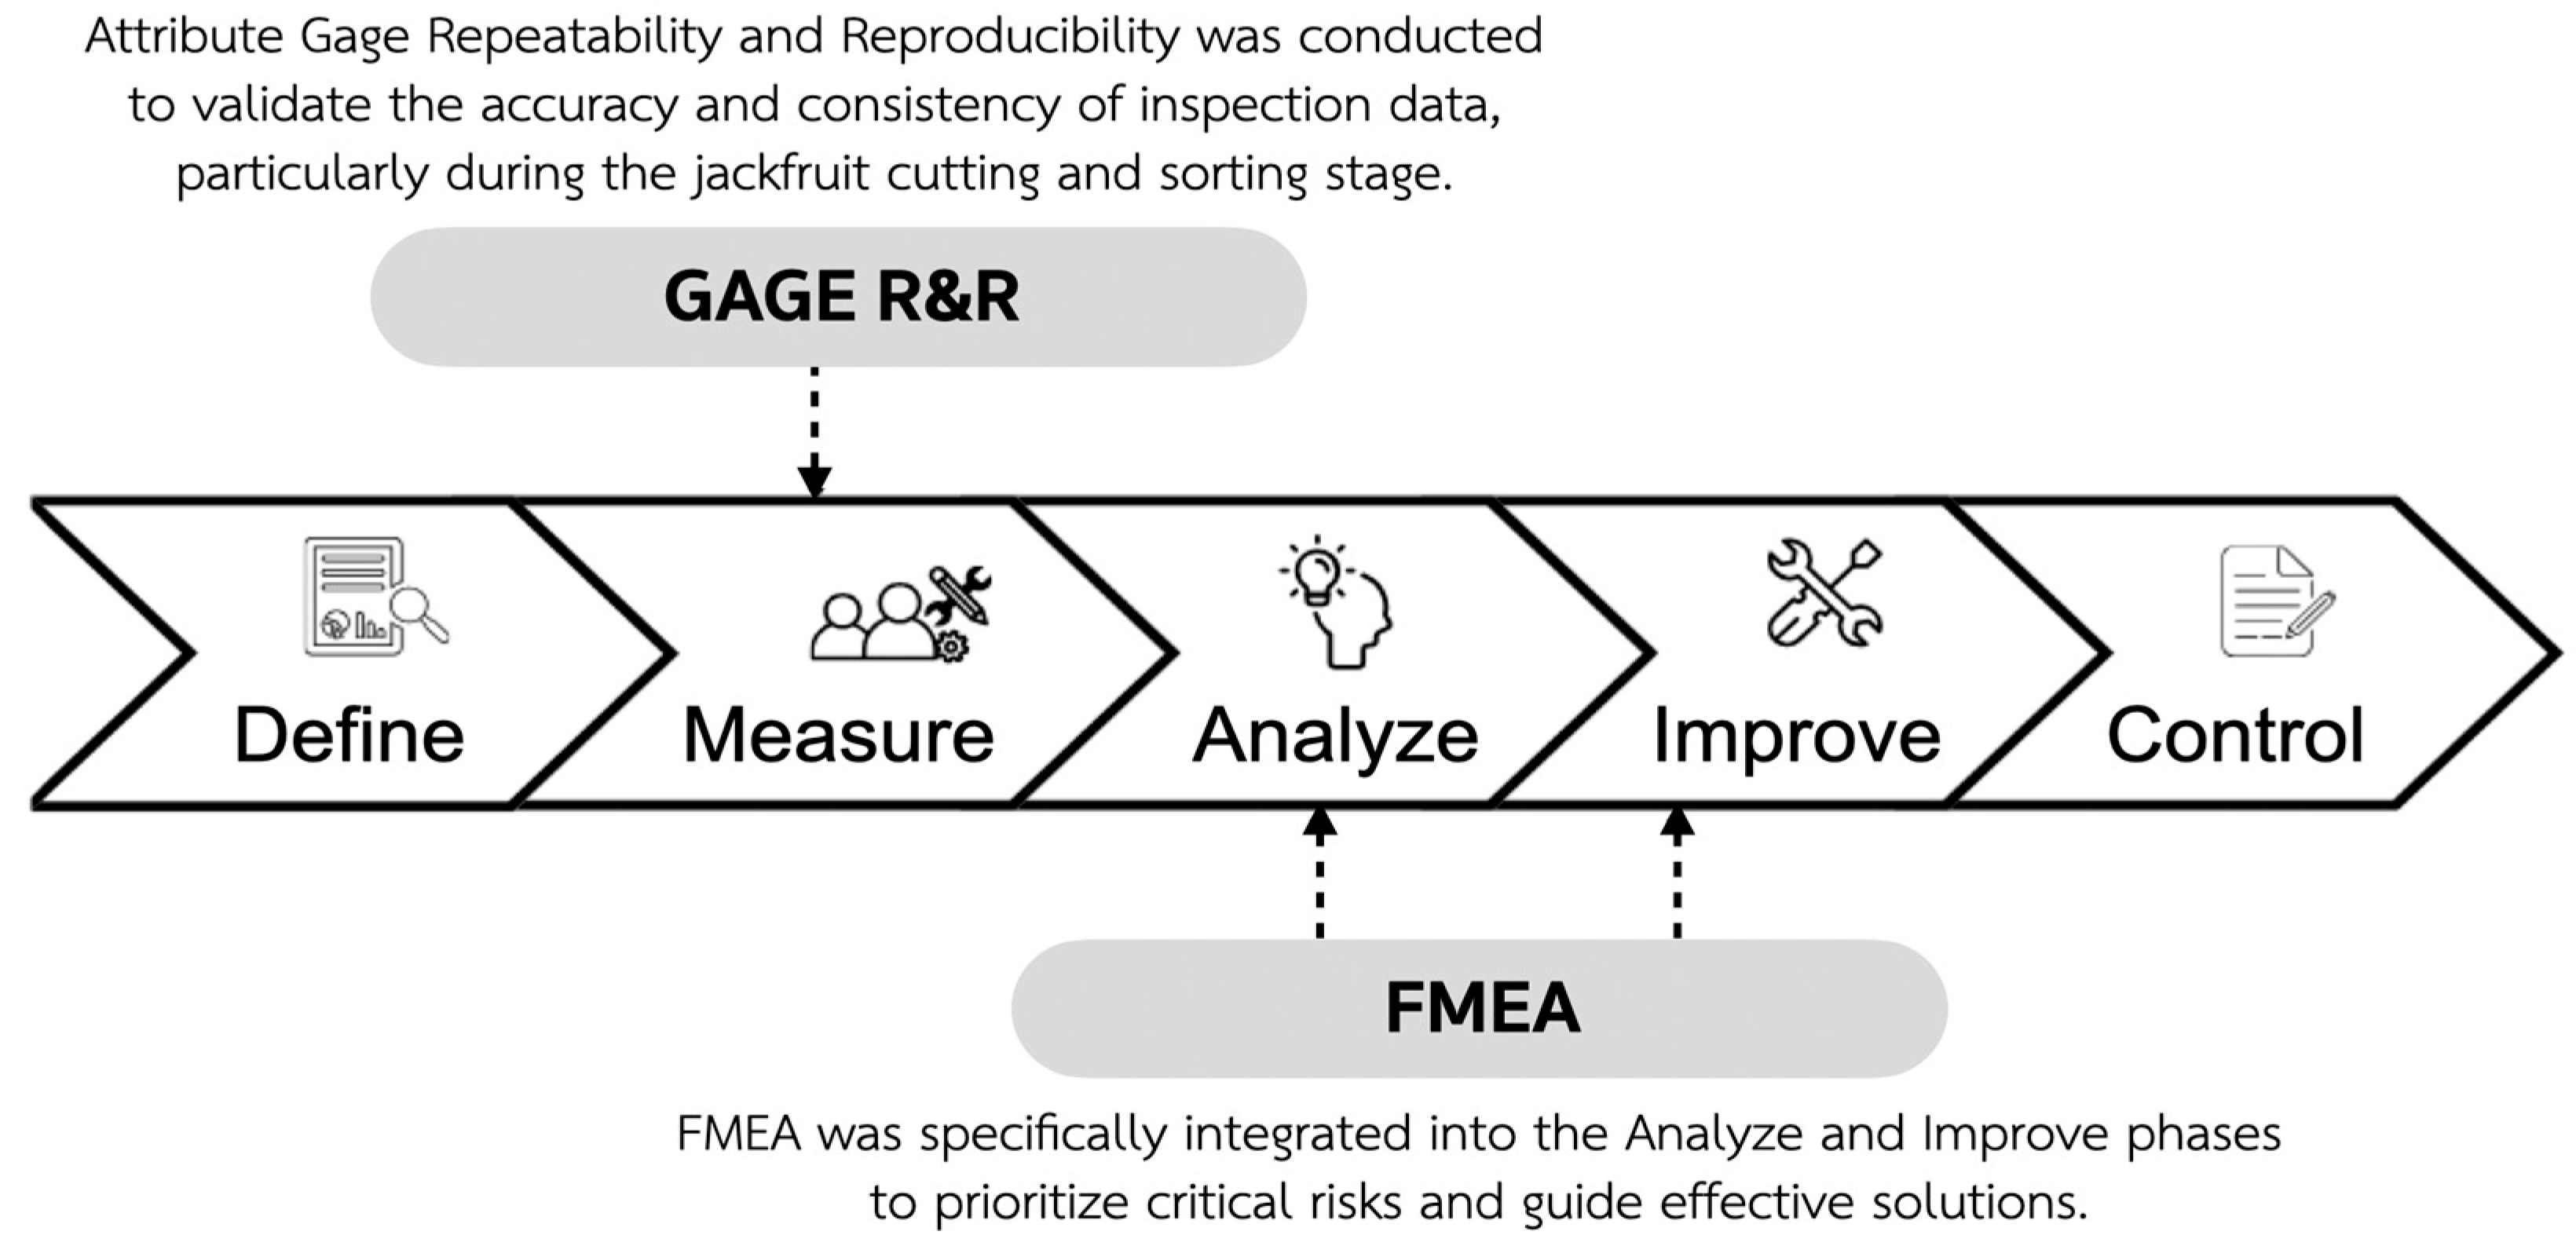
In this study, the DMAIC framework was applied to diagnose and enhance the canned young jackfruit production process. During the Measure phase, an Attribute Gage Repeatability and Reproducibility (Gage R&R) study was conducted to verify the consistency of inspection decisions at the cutting and sorting stage. FMEA was incorporated in the Analyze and Improve phases to prioritize high-risk failure modes and support targeted interventions. The overall research framework is presented in Figure 1, illustrating the integration of Gage R&R within the Measure phase and FMEA within the Analyze and Improve phases. Each DMAIC stage was executed sequentially to identify root causes, validate measurement reliability, implement corrective actions, and establish control measures to ensure long-term process stability.
Figure 1.
Integrated DMAIC–FMEA framework applied in this study.
Following this integrated framework, the subsequent sections describe the detailed implementation of each DMAIC phase, including process analysis, root cause identification, improvement actions, and performance validation.
3.1. Define
3.1.1. Problem Definition
A diagnostic assessment was conducted across the entire canned young jackfruit production line, from raw material reception to final packaging. Two tools—a macro process map and a Line Assembly Diagram—were used to identify inefficiencies and material losses [8,25].
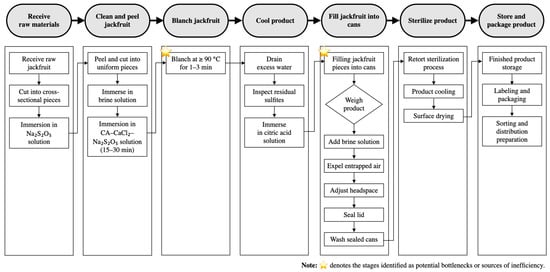
As illustrated in Figure 2, the macro process map outlines the end-to-end workflow, highlighting process interfaces, recurring bottlenecks, and deviation-prone operations that restrict yield and throughput. The Line Assembly Diagram further visualized waste distribution across unit operations, enabling identification of non-value-added activities and material losses. Together, these tools established the basis for subsequent root cause analysis using the Fishbone Diagram and FMEA.
Figure 2.
Macro process map of canned young jackfruit production line highlighting potential waste points and process bottlenecks.
Problem selection was based on three criteria: (1) magnitude of material loss, (2) impact on cycle time and logistics throughput, and (3) feasibility of improvement without major capital investment.
Figure 2 indicates two critical stages where waste occurs most frequently: blanching (≥90 °C for 1–3 min) and manual can filling. The blanching step produced substantial raw-material loss due to moisture evaporation and structural softening, with extended blanching increasing breakage and further reducing yield. During can filling, manual handling and inconsistent operator judgment resulted in product damage, non-uniform appearance, and higher rejection rates.
These observations identify two primary issues affecting productivity: heat-induced loss during blanching and operator-dependent variability during filling. These issues established the need for systematic improvement and informed the DMAIC–FMEA framework applied in this study.
3.1.2. Project Scope and Objectives
Based on the diagnostic findings in Figure 2, the project scope was defined to quantify productivity-related waste, identify improvement opportunities, and enhance labor efficiency and process control in canned young jackfruit production. The scope focused specifically on raw-material losses and operator-driven inefficiencies.
The study aimed to: (i) reduce process waste; (ii) minimize blanching-related losses; (iii) improve inspection reliability through a strengthened measurement system; and (iv) establish a DMAIC–FMEA framework to support sustained process control and productivity improvement.
Table 1 summarizes the alignment between each research objective and its expected outcome, ensuring that subsequent DMAIC phases are guided by measurable targets. The identified problems and objectives were translated into measurable KPIs including process yield, percentage loss, cycle time, and inspection agreement.
Table 1.
Research Objectives and Expected Outcomes.
3.2. Measure
This phase aimed to quantify process performance and validate the reliability of measurement systems, ensuring that subsequent analyses were based on accurate and consistent data. Three key activities were undertaken, outlined below.
3.2.1. Measurement System Analysis (MSA)
A comprehensive Measurement System Analysis (MSA) was conducted to verify that the measurement process produced consistent, repeatable, and accurate data, in line with quality engineering principles [8,9]. Daily production and defect data were systematically recorded by trained quality control (QC) personnel according to the organization’s Standard Operating Procedures (SOPs). All measurements were performed using calibrated instruments and standardized procedures to ensure data reliability and traceability. As shown in Table 2, the data collection plan covered key production variables such as raw material input, acceptable output, defects, and processing time, all of which formed the foundation for subsequent performance evaluation.
Table 2.
Data collection plan and measurement variables.
3.2.2. Process Performance Indicators
The primary Key Performance Indicator (KPI) was process yield, calculated as:
where refers to the acceptable product quantity after processing, and refers to the raw material supplied to the production system. In addition, two supplementary indicators were monitored:
Raw material loss ():
:
3.2.3. Measurement Accuracy Validation (Gage R&R)
Because acceptance decisions in the cutting and filling stages rely primarily on human visual judgment, validating inspection consistency was essential before analyzing overall process performance. To assess the reliability of visual inspection during jackfruit cutting and filling, an Attribute Gage Repeatability and Reproducibility (Gage R&R) study was implemented [8,9]. Multiple inspectors independently classified jackfruit pieces under controlled conditions. The study quantified intra-operator (repeatability) and inter-operator (reproducibility) variation. The acceptance criterion for the measurement system was set at a minimum of 80% agreement, consistent with standard MSA guidelines.
As summarized in Table 3, the study design involved three operators, 30 jackfruit samples, and two inspection trials per operator. Classification was binary (pass/fail), distinguishing conforming from non-conforming pieces. Where agreement was below the threshold, corrective actions such as clarification of inspection criteria and operator retraining were implemented prior to reassessment.
Table 3.
Structure of Gage R&R study.
The Attribute Gage R&R design (3 operators × 30 samples × 2 trials) follows established practices for attribute agreement analysis and aligns with standard measurement system analysis (MSA) guidelines [9]. Based on the evaluation results, when the measurement system did not meet the acceptance criterion, corrective actions were implemented, including clarification of inspection criteria and operator retraining prior to reassessment.
3.2.4. Blanching Time Study
To evaluate process variation, blanching trials were conducted at three-time intervals (1, 2, and 3 min) based on internal quality standards. These time intervals were selected because they represent the practical operating range used in routine production and were confirmed through preliminary in-plant trials. Three key parameters were measured:
- Weight Loss (): Calculated from the difference in sample weight before and after blanching, serving as an indicator of mass retention and yield performance.
- Texture: Firmness was measured instrumentally as a critical quality attribute influencing product acceptability.
- Peroxidase Activity: Residual enzyme activity, expressed as absorbance or activity units (U/g), was used as a biochemical indicator of blanching effectiveness due to its association with enzymatic browning and product deterioration.
Table 4 summarizes the blanching conditions, measurement methods, units, and experimental parameters, providing a structured and repeatable basis for subsequent analysis. Each treatment was performed in triplicate (n = 3), which is commonly accepted in food process validation studies and was considered appropriate given the operational constraints of the production line. Normality of the data was assessed using the Shapiro–Wilk test, and homogeneity of variance was evaluated using Levene’s test. Depending on the results of these assumption checks, either one-way ANOVA or the Kruskal–Wallis test was applied to determine statistically significant differences among treatments. Post hoc comparisons were conducted using Fisher’s Least Significant Difference (LSD) test where appropriate. Statistical analyses were performed using IBM SPSS Statistics (Version 28), while Minitab® Statistical Software (Version 19) was used to support process analysis and validation. A significance level of α = 0.05 was applied in all analyses.
Table 4.
Blanching time study design and measurement parameters.
Given the operational constraints of an in-line industrial setting and the exploratory objective of process optimization rather than product formulation, triplicate trials were considered sufficient and consistent with comparable industrial food process validation studies.
3.3. Analyze
This phase identified and prioritized the root causes of productivity loss, focusing on the blanching and filling/inspection stages. Statistical analysis, structured root cause elicitation, and risk assessment (FMEA) were used to establish a systematic basis for improvement.
3.3.1. Statistical Analysis
Process data were analyzed to assess the effects of blanching times on key indicators: weight loss (), texture firmness, and residual peroxidase activity. Statistical tests were selected according to data distribution characteristics and variance assumptions to ensure appropriate and unbiased analysis. Measurement parameters and methods are summarized in Table 4. Normality and variance assumptions were evaluated prior to selecting appropriate tests. Depending on data characteristics, one-way ANOVA or the Kruskal–Wallis test was applied, followed by suitable post hoc comparisons. Correlation analyses were conducted to examine the relationships among %Loss, texture, and enzyme inactivation. Operator inspection outcomes (pass/fail) were analyzed using chi-square or proportion tests.
3.3.2. Root Cause Analysis
A fishbone diagram under the 4M framework (Man, Machine, Method, Material) was used to categorize potential causes of yield loss and inspection inconsistency. This tool, widely applied in quality engineering, supports systematic identification of systemic and operator-dependent factors [1,3]. The diagram provided a qualitative foundation for subsequent risk prioritization using FMEA.
3.3.3. Failure Mode and Effects Analysis (FMEA)
FMEA was employed as a prioritization tool because it enables systematic evaluation of process risks in resource-constrained environments, which is particularly suitable for agro-industrial SMEs. FMEA was applied to prioritize risks in the blanching and filling/inspection stages, consistent with prior DMAIC–FMEA applications in manufacturing and food processing [26].
Each failure mode was scored for Severity (S), Occurrence (O), and Detection (D) on a 1–10 scale, and the Risk Priority Number (RPN) was calculated as:
Table 5 summarizes the rating scales used to compute RPN values and to rank improvement priorities.
Table 5.
FMEA rating scales and RPN calculation.
To ensure that the FMEA results directly informed process improvements, high-priority failure modes identified based on RPN values were systematically translated into targeted corrective actions. Table 6 presents the mapping between failure modes and corresponding improvement actions. The results demonstrate that improvement actions were directly derived from the highest-risk failure modes, ensuring that resources were focused on the most critical process issues.
Table 6.
Mapping of FMEA Results to Improvement Actions.
3.4. Improve
This phase implemented improvement actions prioritized through FMEA to address the root causes identified in the Analyze phase. Improvement actions were implemented primarily for failure modes with high RPN scores to ensure efficient use of limited resources. Blanching parameters were optimized through controlled time-interval trials to balance enzyme inactivation, weight retention, and textural quality, and the resulting conditions were standardized in revised operating procedures. Inspection criteria were refined with explicit pass/fail rules, and operators received structured retraining focused on aligning inspection criteria and improving decision consistency. The training included clarification of defect classification standards, example-based evaluation, and supervised practice sessions under controlled conditions. Training effectiveness was evaluated based on improvements in Attribute Gage R&R agreement results after retraining.
These actions directly targeted the highest-priority failure modes, ensuring that the improvements were data-driven, operationally practical, and sustainable for long-term application.
To further evaluate the effectiveness of the implemented improvements, a comparison of Risk Priority Numbers (RPN) before and after corrective actions was conducted. This comparison provides a quantitative assessment of the extent to which the identified risks were mitigated through targeted interventions (Table 7).
Table 7.
Comparison of RPN Values Before and After Improvement.
The results indicate a substantial reduction in risk levels across all major failure modes, demonstrating the effectiveness of the improvement actions and reinforcing the role of FMEA as a practical risk-reduction tool within the DMAIC framework.
3.5. Control
This phase established control mechanisms to sustain improvements and prevent regression. Control charts were implemented to continuously monitor yield, waste, and defect trends. Periodic Attribute Gage R&R assessments were scheduled to maintain inspection reliability. All revised process parameters and inspection rules were consolidated into updated SOPs to support standardization and workforce training. A structured feedback channel between production and quality teams enabled real-time reporting and corrective action, reinforcing DMAIC as a continuous-improvement system. To ensure sustainability, process performance is continuously monitored using control charts and periodic Gage R&R assessment. Long-term validation remains a limitation and is recommended for future work.
These mechanisms secured long-term process stability and ensured that productivity gains achieved in the Improve phase could be sustained over time, forming a solid foundation for the performance results presented in Section 4.
4. Results
This section presents the results of applying the DMAIC–FMEA framework to the canned young jackfruit process. The analysis highlights key improvements in yield, raw material loss reduction, and inspection reliability, with emphasis on the blanching and filling/inspection stages where most inefficiencies occurred. Both process- and operator-related improvements are quantitatively demonstrated to confirm the framework’s effectiveness.
4.1. Baseline Performance: Yield and Waste
The initial survey of the production line under study revealed substantial raw material losses across multiple stages. Table 8 summarizes the baseline mass yield and waste for July and August 2024, calculated from raw material input to final packed product. The overall yield averaged 51.33%, while nearly half of the raw material was lost as waste (48.67%). These results indicate that, at the system level, almost one in every two kilograms of raw jackfruit failed to reach the final product stage, reflecting significant inefficiencies.
Table 8.
Baseline production yield and waste.
Further analysis of the packing stage indicated that part of the rejected jackfruit pieces remained usable, suggesting that waste was not solely due to raw material defects but also to inconsistent operator judgment and process inefficiencies. This observation highlighted a clear opportunity for reducing avoidable losses through process standardization and operator retraining.
This observation provided the rationale for a detailed evaluation of measurement reliability and operator performance, which is presented in the following section. These baseline findings confirmed the relevance of the selected KPIs—yield, percentage loss, and inspection agreement—and justified the subsequent measurement system validation and improvement actions conducted in the DMAIC framework.
4.2. Measurement Reliability and Operator Performance
To ensure that improvement outcomes were supported by reliable data, measurement system performance was evaluated through an Attribute Gage Repeatability and Reproducibility (Gage R&R) study. Although baseline yield and waste data (Table 8) quantified production losses, they did not clarify whether these variations originated from true process behavior or inconsistent operator judgment. The Gage R&R study therefore examined the cutting and filling stages, where operator decisions directly influence product classification.
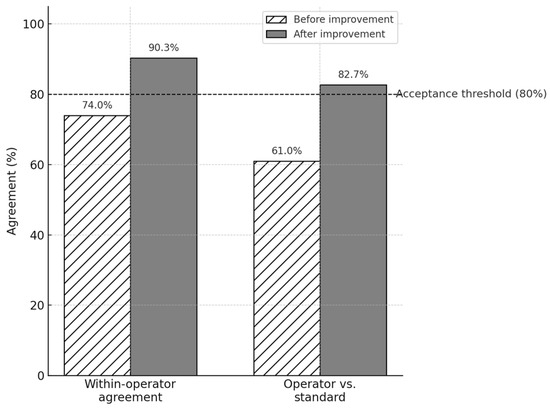
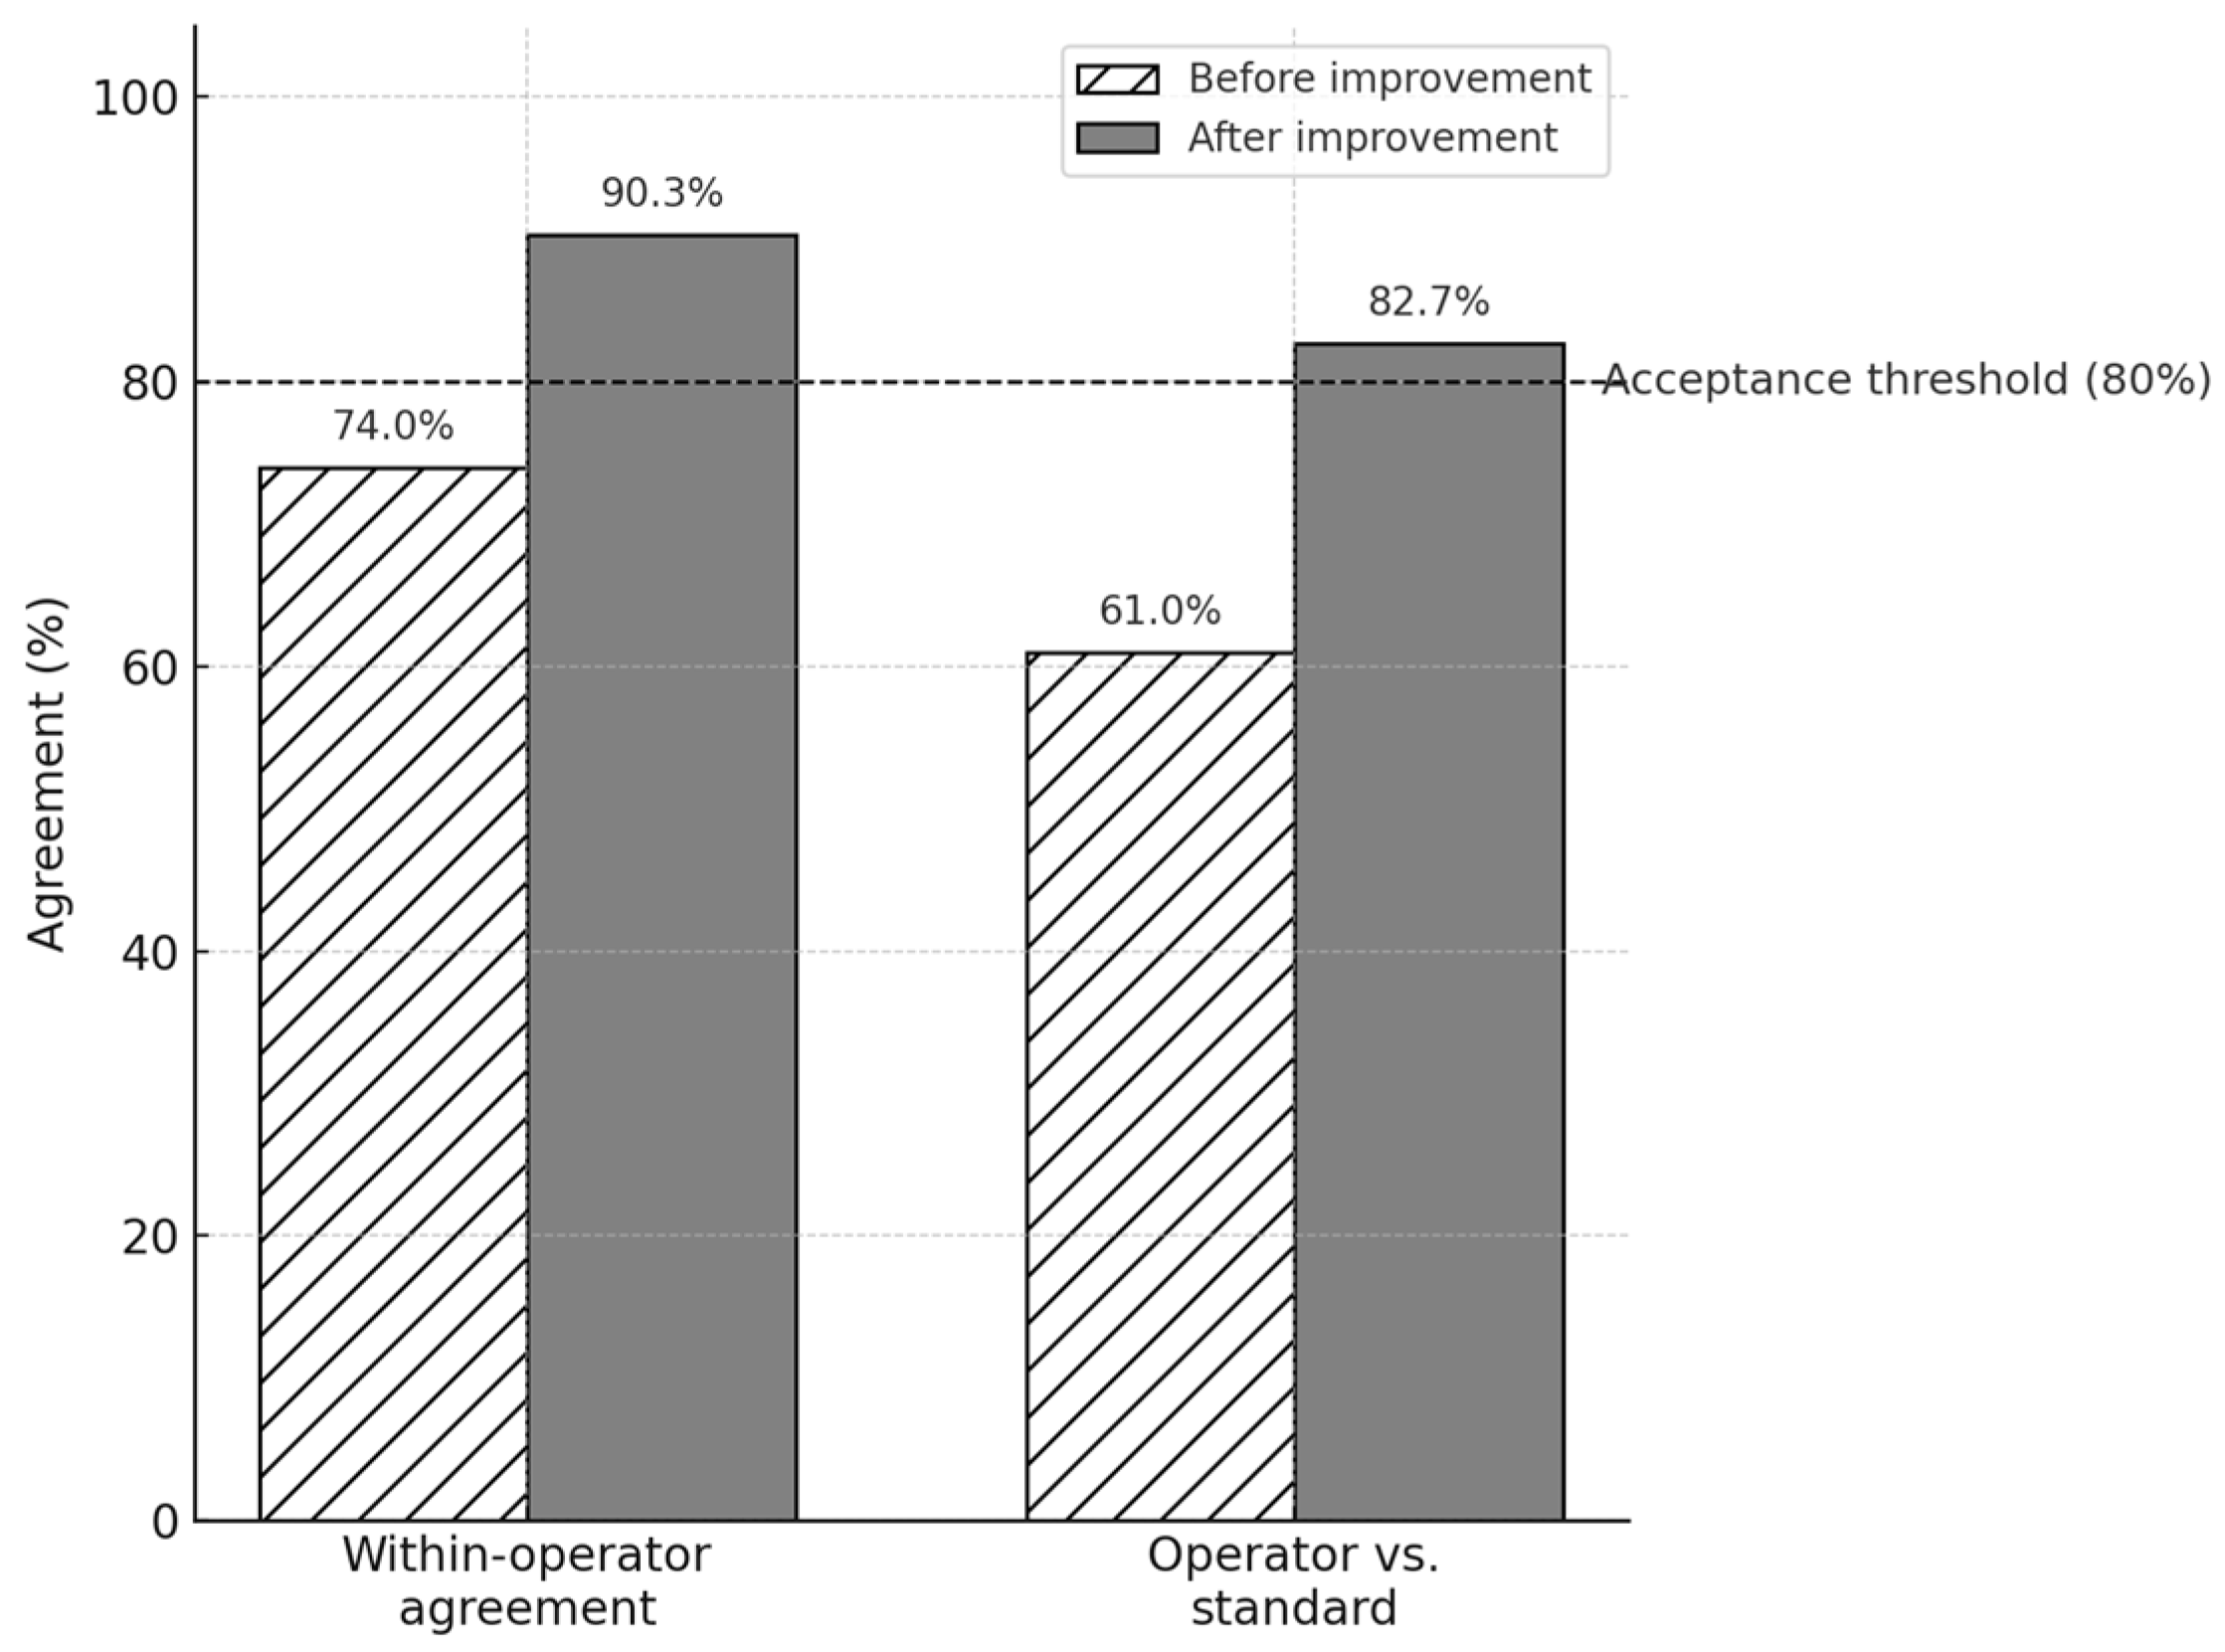
Before improvement, within-operator agreement averaged 74.0%, and operator-to-standard agreement averaged 61.0%, both below the 80% acceptance threshold. After revising inspection criteria and providing retraining, these values increased to 90.3% and 82.7%, respectively—exceeding the benchmark. According to the predefined acceptance criterion established in the Measure phase, these post-improvement results indicate that the inspection system had reached an acceptable level of reliability.
These results confirmed that baseline variation was primarily operator-dependent rather than process-driven. A summary of the pre- and post-improvement performance metrics is provided in Figure 3, illustrating a comparative visualization of the Gage R&R outcomes.
Figure 3.
Comparative results of Attribute Gage R&R before and after improvement.
4.3. Effect of Blanching Time
Blanching trials were conducted at 1, 2, and 3 min to evaluate their effects on raw material retention, process yield, and product quality. All experiments were performed in triplicate (n = 3), consistent with the experimental design specified in the Methodology section and commonly accepted in food process validation studies.
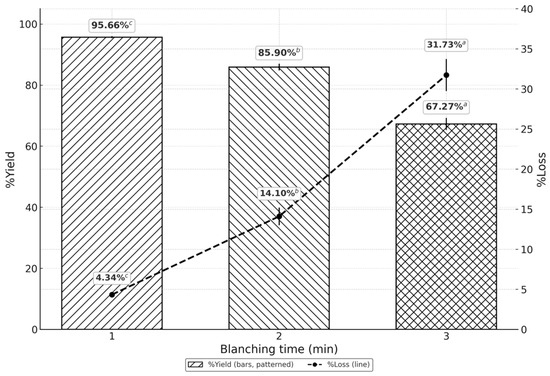
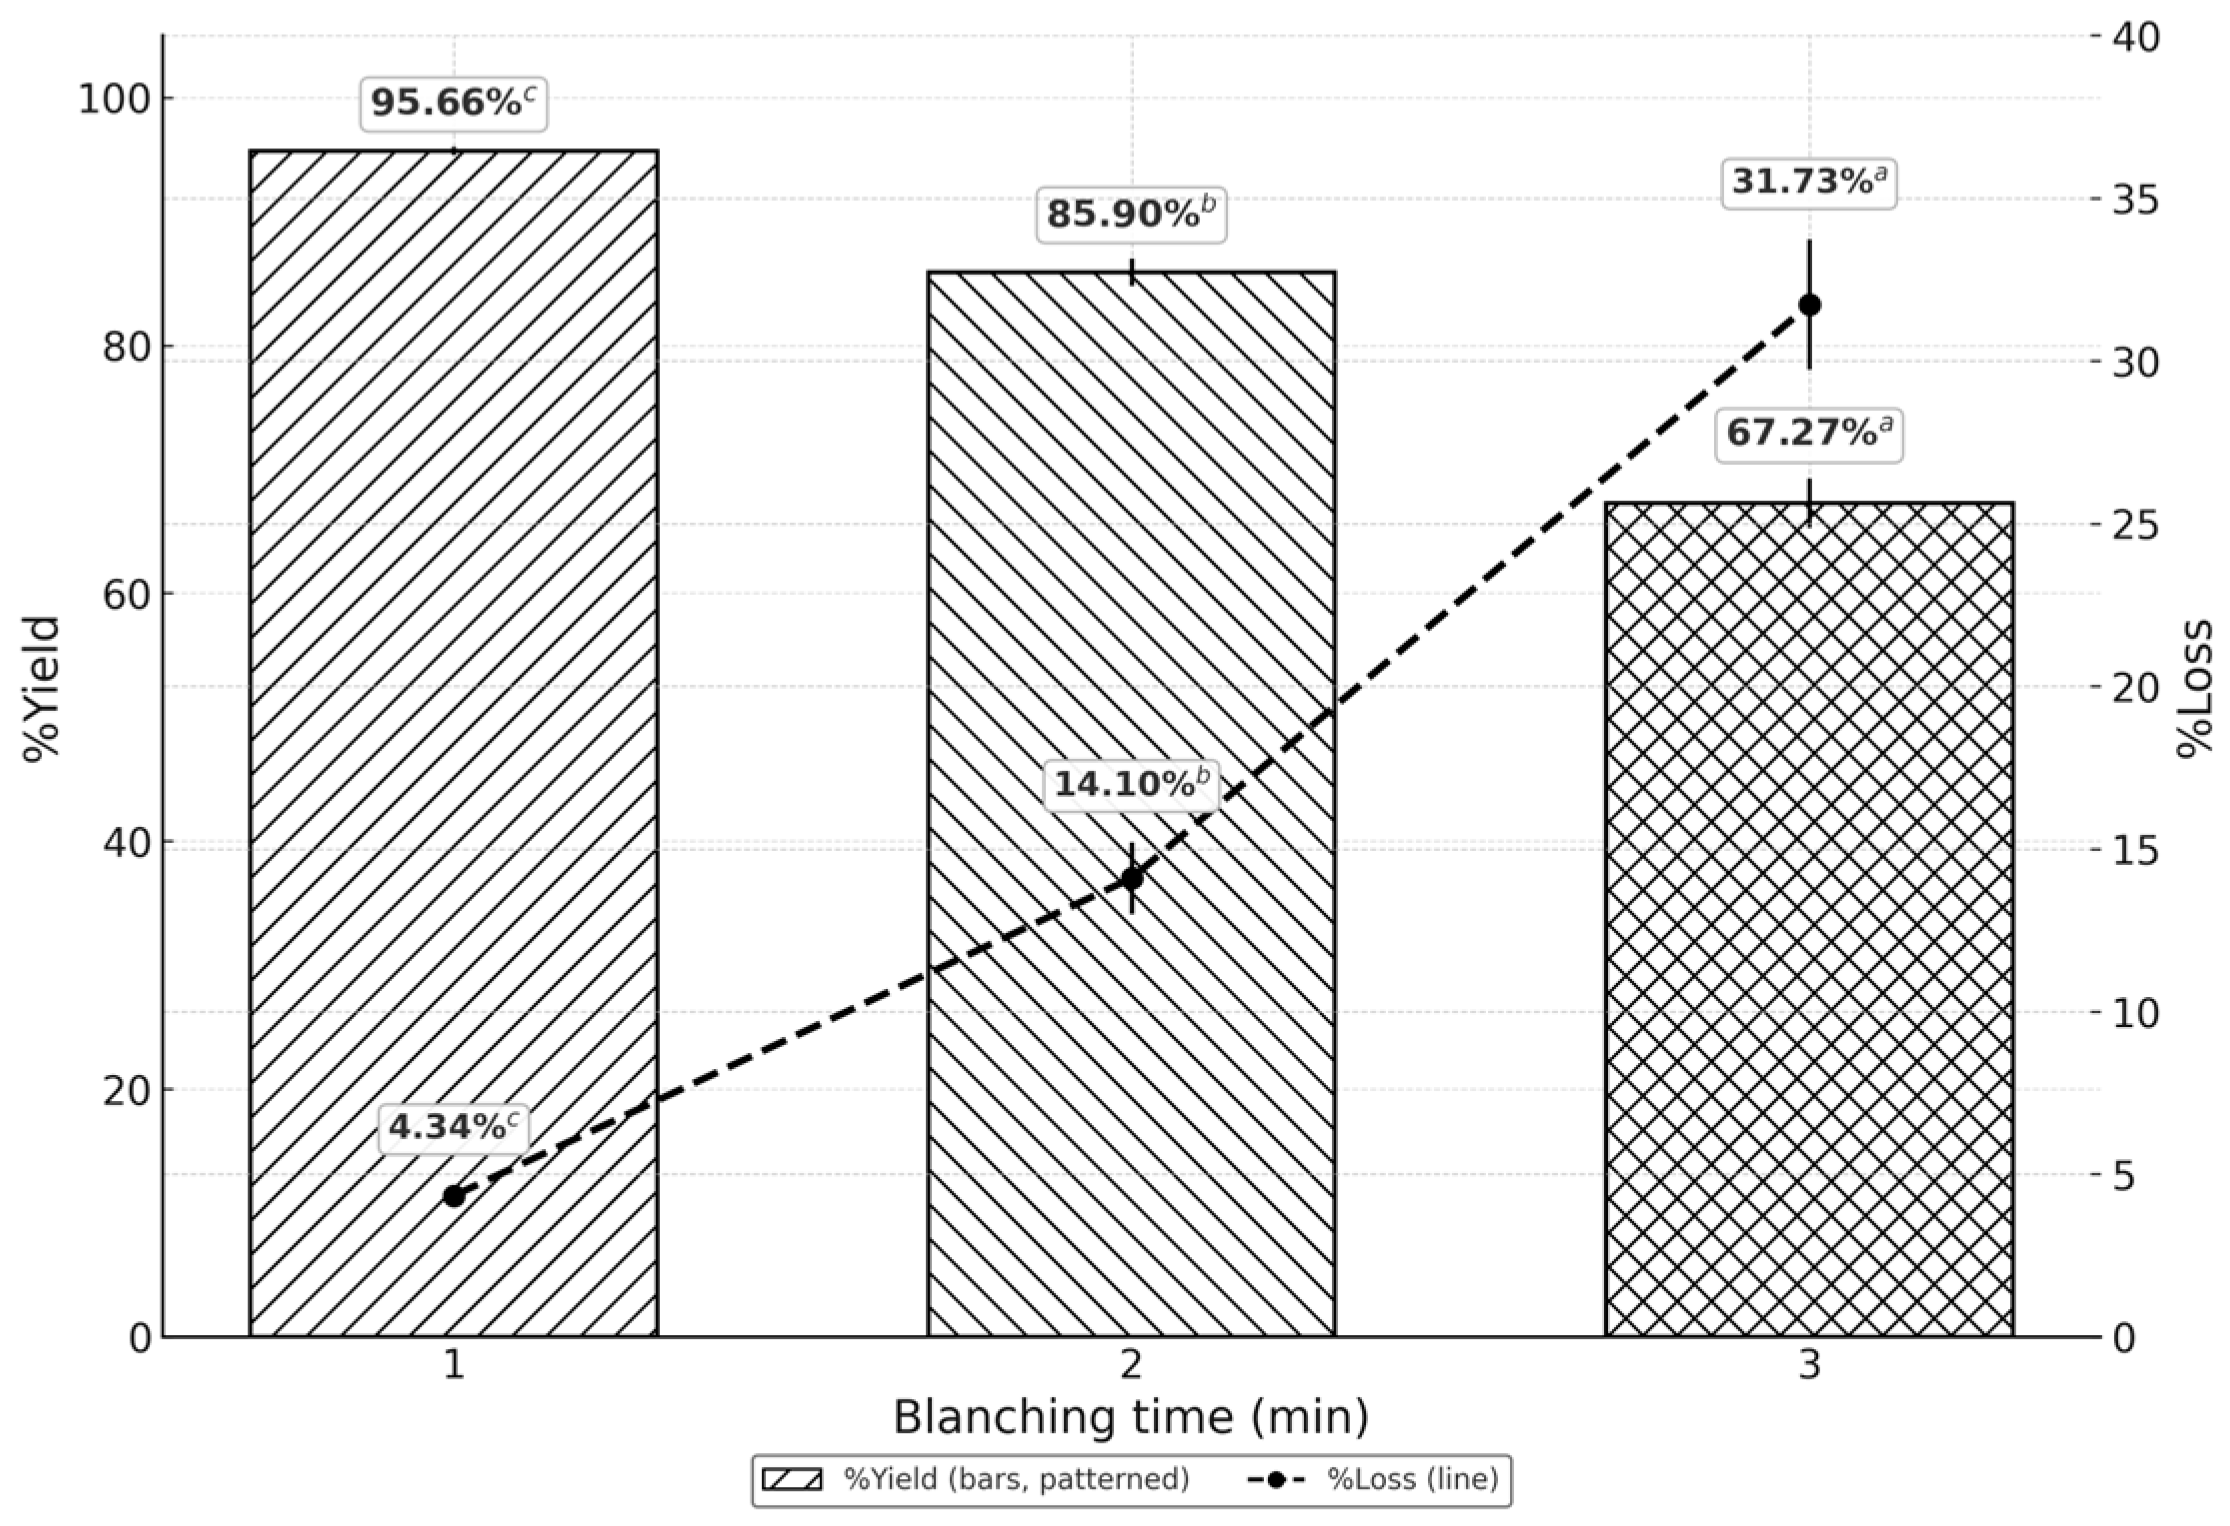
Figure 4 summarizes the average initial weight, final weight, percentage loss, and percentage yield (mean ± SD) of jackfruit pieces subjected to blanching at different times. At 1 min, the mean %Loss was lowest (4.34 ± 0.33%), corresponding to the highest %Yield (95.66 ± 0.33%). Increasing blanching time to 2 min resulted in higher %Loss (14.10 ± 1.10%) and reduced %Yield (85.90 ± 1.10%). At 3 min, mass loss increased sharply (31.73 ± 2.00%), reducing %Yield to 67.27 ± 2.00%. One-way ANOVA indicated a significant effect of blanching time on %Loss (F(2, 6) = 214.37, p < 0.001). The effect size (η2 = 0.986) demonstrated a very strong effect of blanching time on mass loss. Post hoc comparisons (LSD test) confirmed that all blanching times (1, 2, and 3 min) were significantly different from each other, as reflected by the distinct statistical groupings (a, b, and c) in Figure 4. These findings indicate that shorter blanching times favor mass retention and yield performance, forming a critical input for the multi-criteria evaluation incorporating texture quality and enzyme inactivation presented in the following subsections.
Figure 4.
Effect of blanching time on percent loss and yield. Different superscript letters (a–c) indicate significant differences at p < 0.05.
Figure 4 shows that blanching at 1 min achieved the highest yield (95.66 ± 0.33%) with the lowest weight loss (4.34 ± 0.33%). Prolonged blanching at 3 min reduced yield to 67.27 ± 2.00% and increased weight loss to 31.73 ± 2.00%. Different superscript letters (a–c) indicate significant differences at p < 0.05. These findings confirm blanching time as a critical factor influencing mass retention and product quality.
4.3.1. Textural Properties
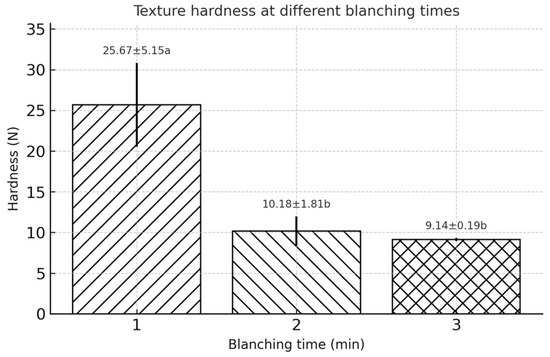
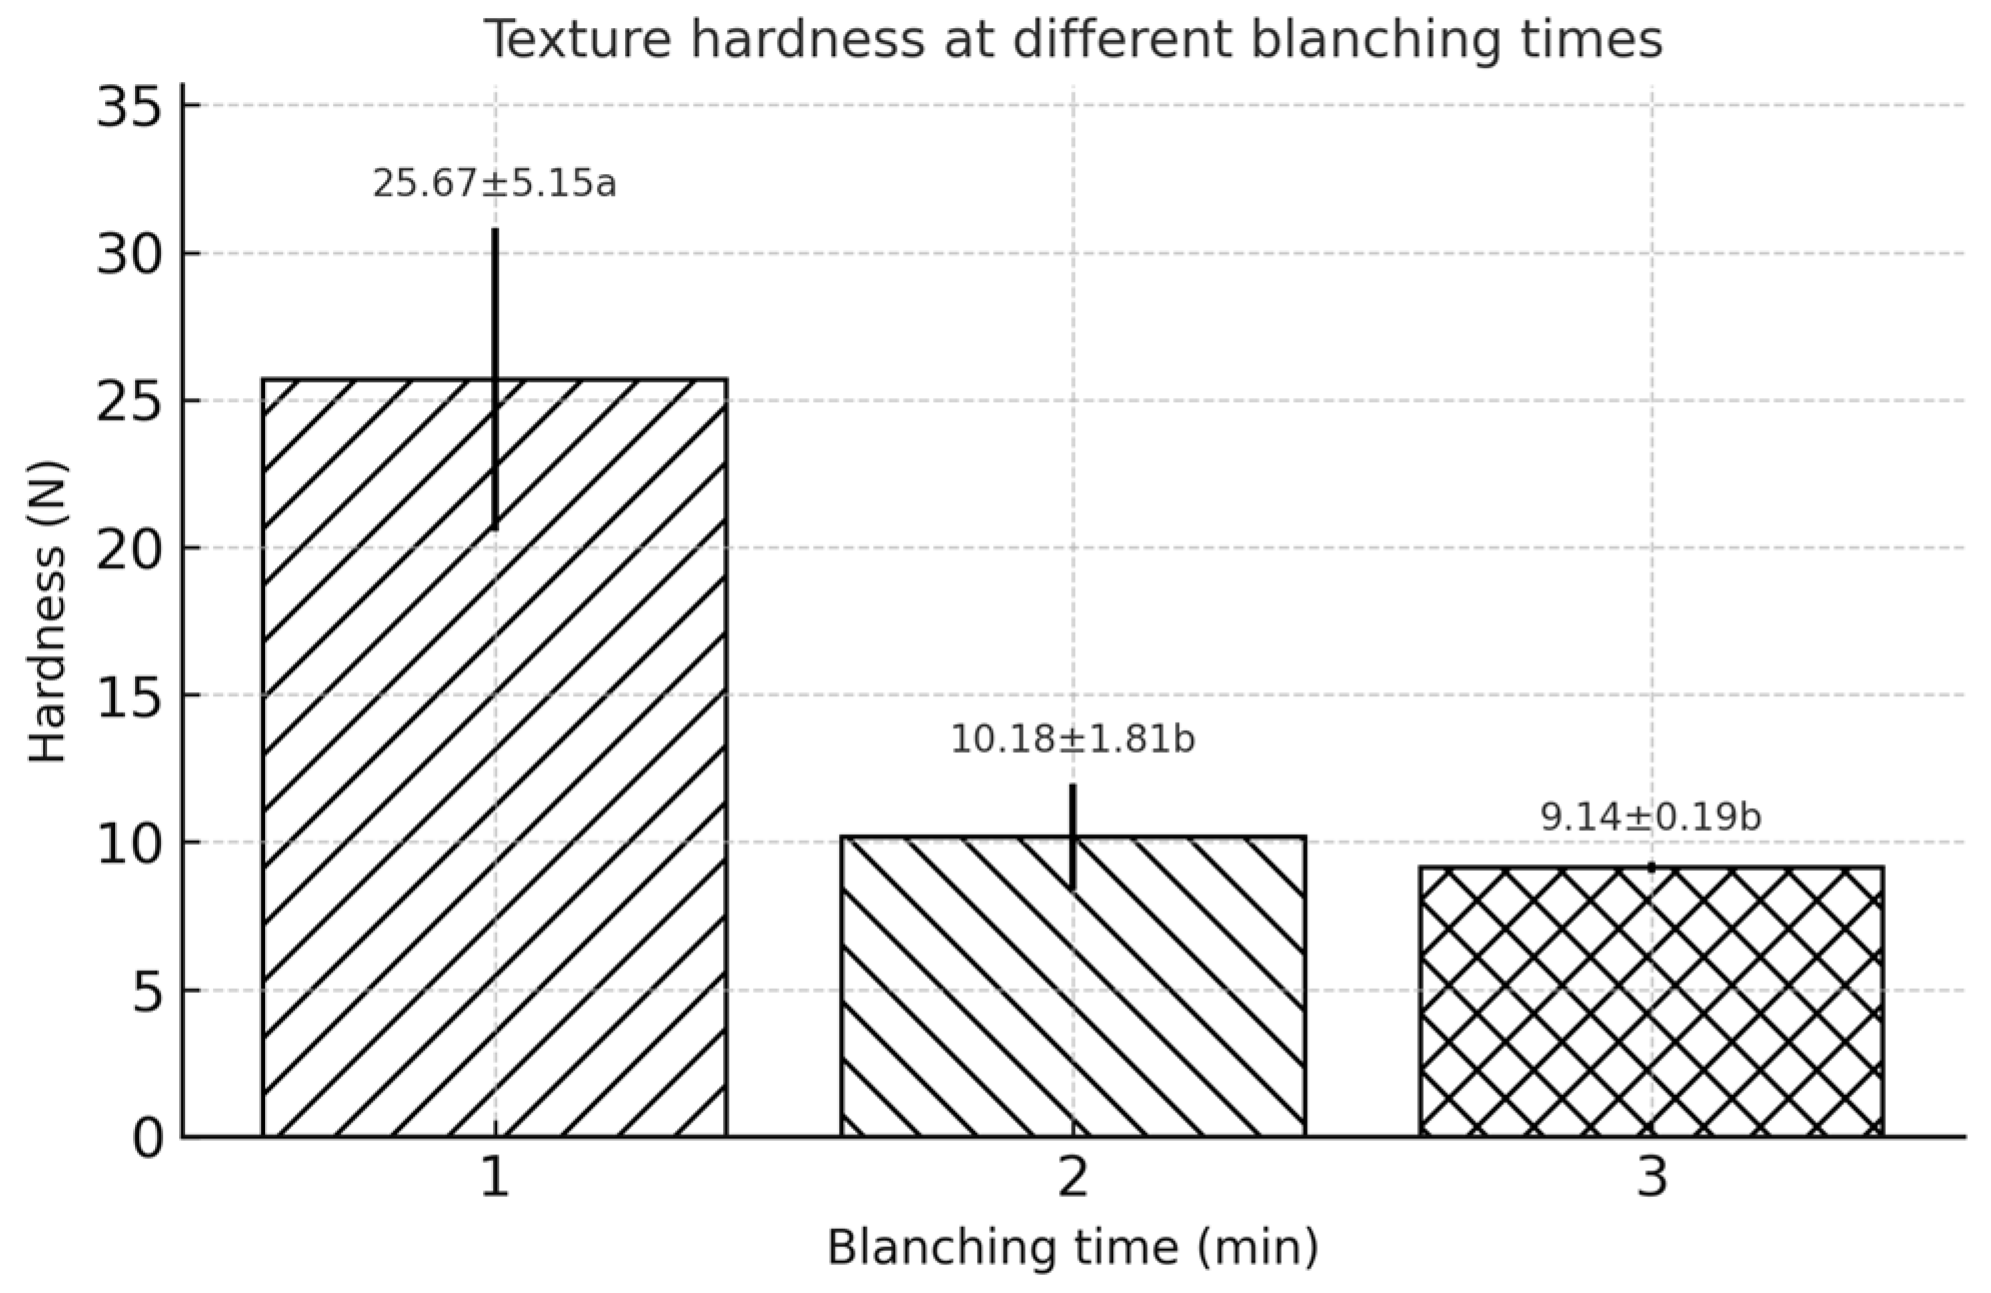
Texture is a key quality attribute for plant-based foods, and maintaining adequate firmness is particularly critical for processed young jackfruit to ensure handling efficiency, packaging integrity, and consumer acceptance. Blanching time had a strong influence on textural integrity, as shown in Figure 5 by hardness measurements using a TA-XT Plus texture analyzer (probe P/6). Hardness was highest at 1 min (25.67 ± 5.15 N) and decreased significantly at 2 min (10.18 ± 1.81 N) and 3 min (9.14 ± 0.19 N) (p < 0.05), with no difference between the latter two treatments. These results indicate that prolonged blanching accelerates thermal softening of the cell-wall matrix, whereas shorter blanching better preserves desirable firmness, reinforcing the advantage of minimal blanching durations from both quality and yield perspectives.
Figure 5.
Texture hardness at different blanching times. Different superscript letters (a and b) indicate significant differences at p < 0.05.
4.3.2. Peroxidase Activity
Peroxidase was selected as an indicator enzyme to evaluate blanching effectiveness, as it is among the most heat-stable plant enzymes. Complete inactivation of peroxidase indicates that less heat-resistant enzymes (e.g., polyphenol oxidase, PPO) would also be destroyed, thereby reducing the risk of enzymatic browning.
Table 9 presents peroxidase activity (U/g) and pH of young jackfruit slices measured immediately after blanching and after 2 h holding at blanching times of 1, 2, and 3 min. Relative activity in the unheated control was defined as 100%. Immediately after blanching, enzyme activity decreased progressively from 29.00 ± 0.15 a U/g at 1 min to 22.00 ± 0.10 b U/g at 2 min and to 3.00 ± 0.10 c U/g at 3 min. After 2 h of holding, activities further declined to 17.00 ± 0.15 a, 6.00 ± 0.15 b, and 2.00 ± 0.06 c U/g, respectively, demonstrating that both heat treatment and subsequent holding contributed to enzyme destabilization.
Table 9.
Effect of blanching time on peroxidase activity and pH.
The decrease in activity over time is consistent with partial denaturation of the enzyme during blanching and subsequent loss of structural stability during the 2 h holding period prior to retorting. Concurrently, pH decreased slightly with blanching time (from 6.47 ± 0.02 a at 1 min to 6.28 ± 0.01 c at 3 min immediately after blanching), and further decreased after holding (6.38 ± 0.01 a–6.22 ± 0.01 b). Since peroxidase is stable near neutral pH, this acidification may have contributed to its instability.
From an industrial perspective, these results highlight a trade-off: while 3 min blanching ensures near-complete peroxidase inactivation (<5% residual activity), it also coincides with severe texture softening (Figure 5) and greater yield loss (Figure 4). Thus, optimizing blanching requires balancing sufficient enzyme inactivation with acceptable textural integrity and yield performance, supporting a multi-criteria decision approach rather than reliance on enzyme inactivation alone.
The combined evidence from mass balance (Figure 4), textural properties (Figure 5), and peroxidase activity (Table 9) identifies 1 min at ≥90 °C as the optimal blanching condition. At this duration, weight loss was minimized (4.34 ± 0.33%), yield remained highest (95.66 ± 0.33%), and firmness was preserved (25.67 ± 5.15 N). Although peroxidase was not completely inactivated (29.00 ±0.15 a U/g immediately; 17.00 ±0.15 a U/g after 2 h), the reduction was considered sufficient to mitigate enzymatic browning under practical processing and retorting conditions. In contrast, longer blanching (2–3 min) achieved stronger enzyme inactivation but caused excessive mass loss and textural degradation.
The acceptable level of enzyme inactivation was determined based on a multi-criteria balance among enzyme reduction, yield retention, texture preservation, and subsequent thermal processing conditions. Although peroxidase activity was not completely inactivated during the 1 min blanching, this enzyme is widely recognized as one of the most heat-resistant indicators of blanching adequacy [27,28]. Previous studies have reported that residual peroxidase activity does not necessarily compromise product quality or shelf-life, provided that subsequent thermal processing ensures further enzyme inactivation [27,29,30]. Therefore, the observed residual activity was interpreted in relation to the downstream retorting effects, where cumulative heat treatment contributes to additional enzyme degradation and guarantees final product stability [30,31]. Therefore, blanching for 1 min at ≥90 °C was selected as the standard operating condition, providing the best overall balance among enzyme inactivation, material retention, product quality, and process productivity.
4.4. Root Cause Analysis and Improvements
4.4.1. Fishbone Diagram Analysis
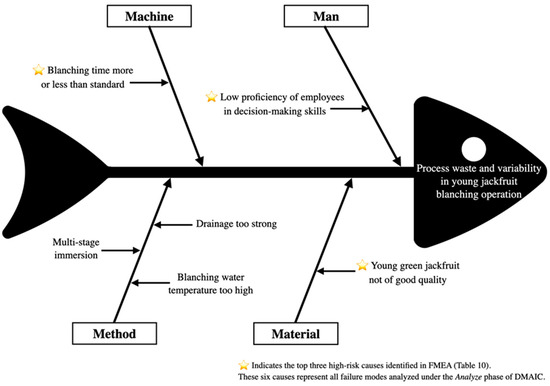
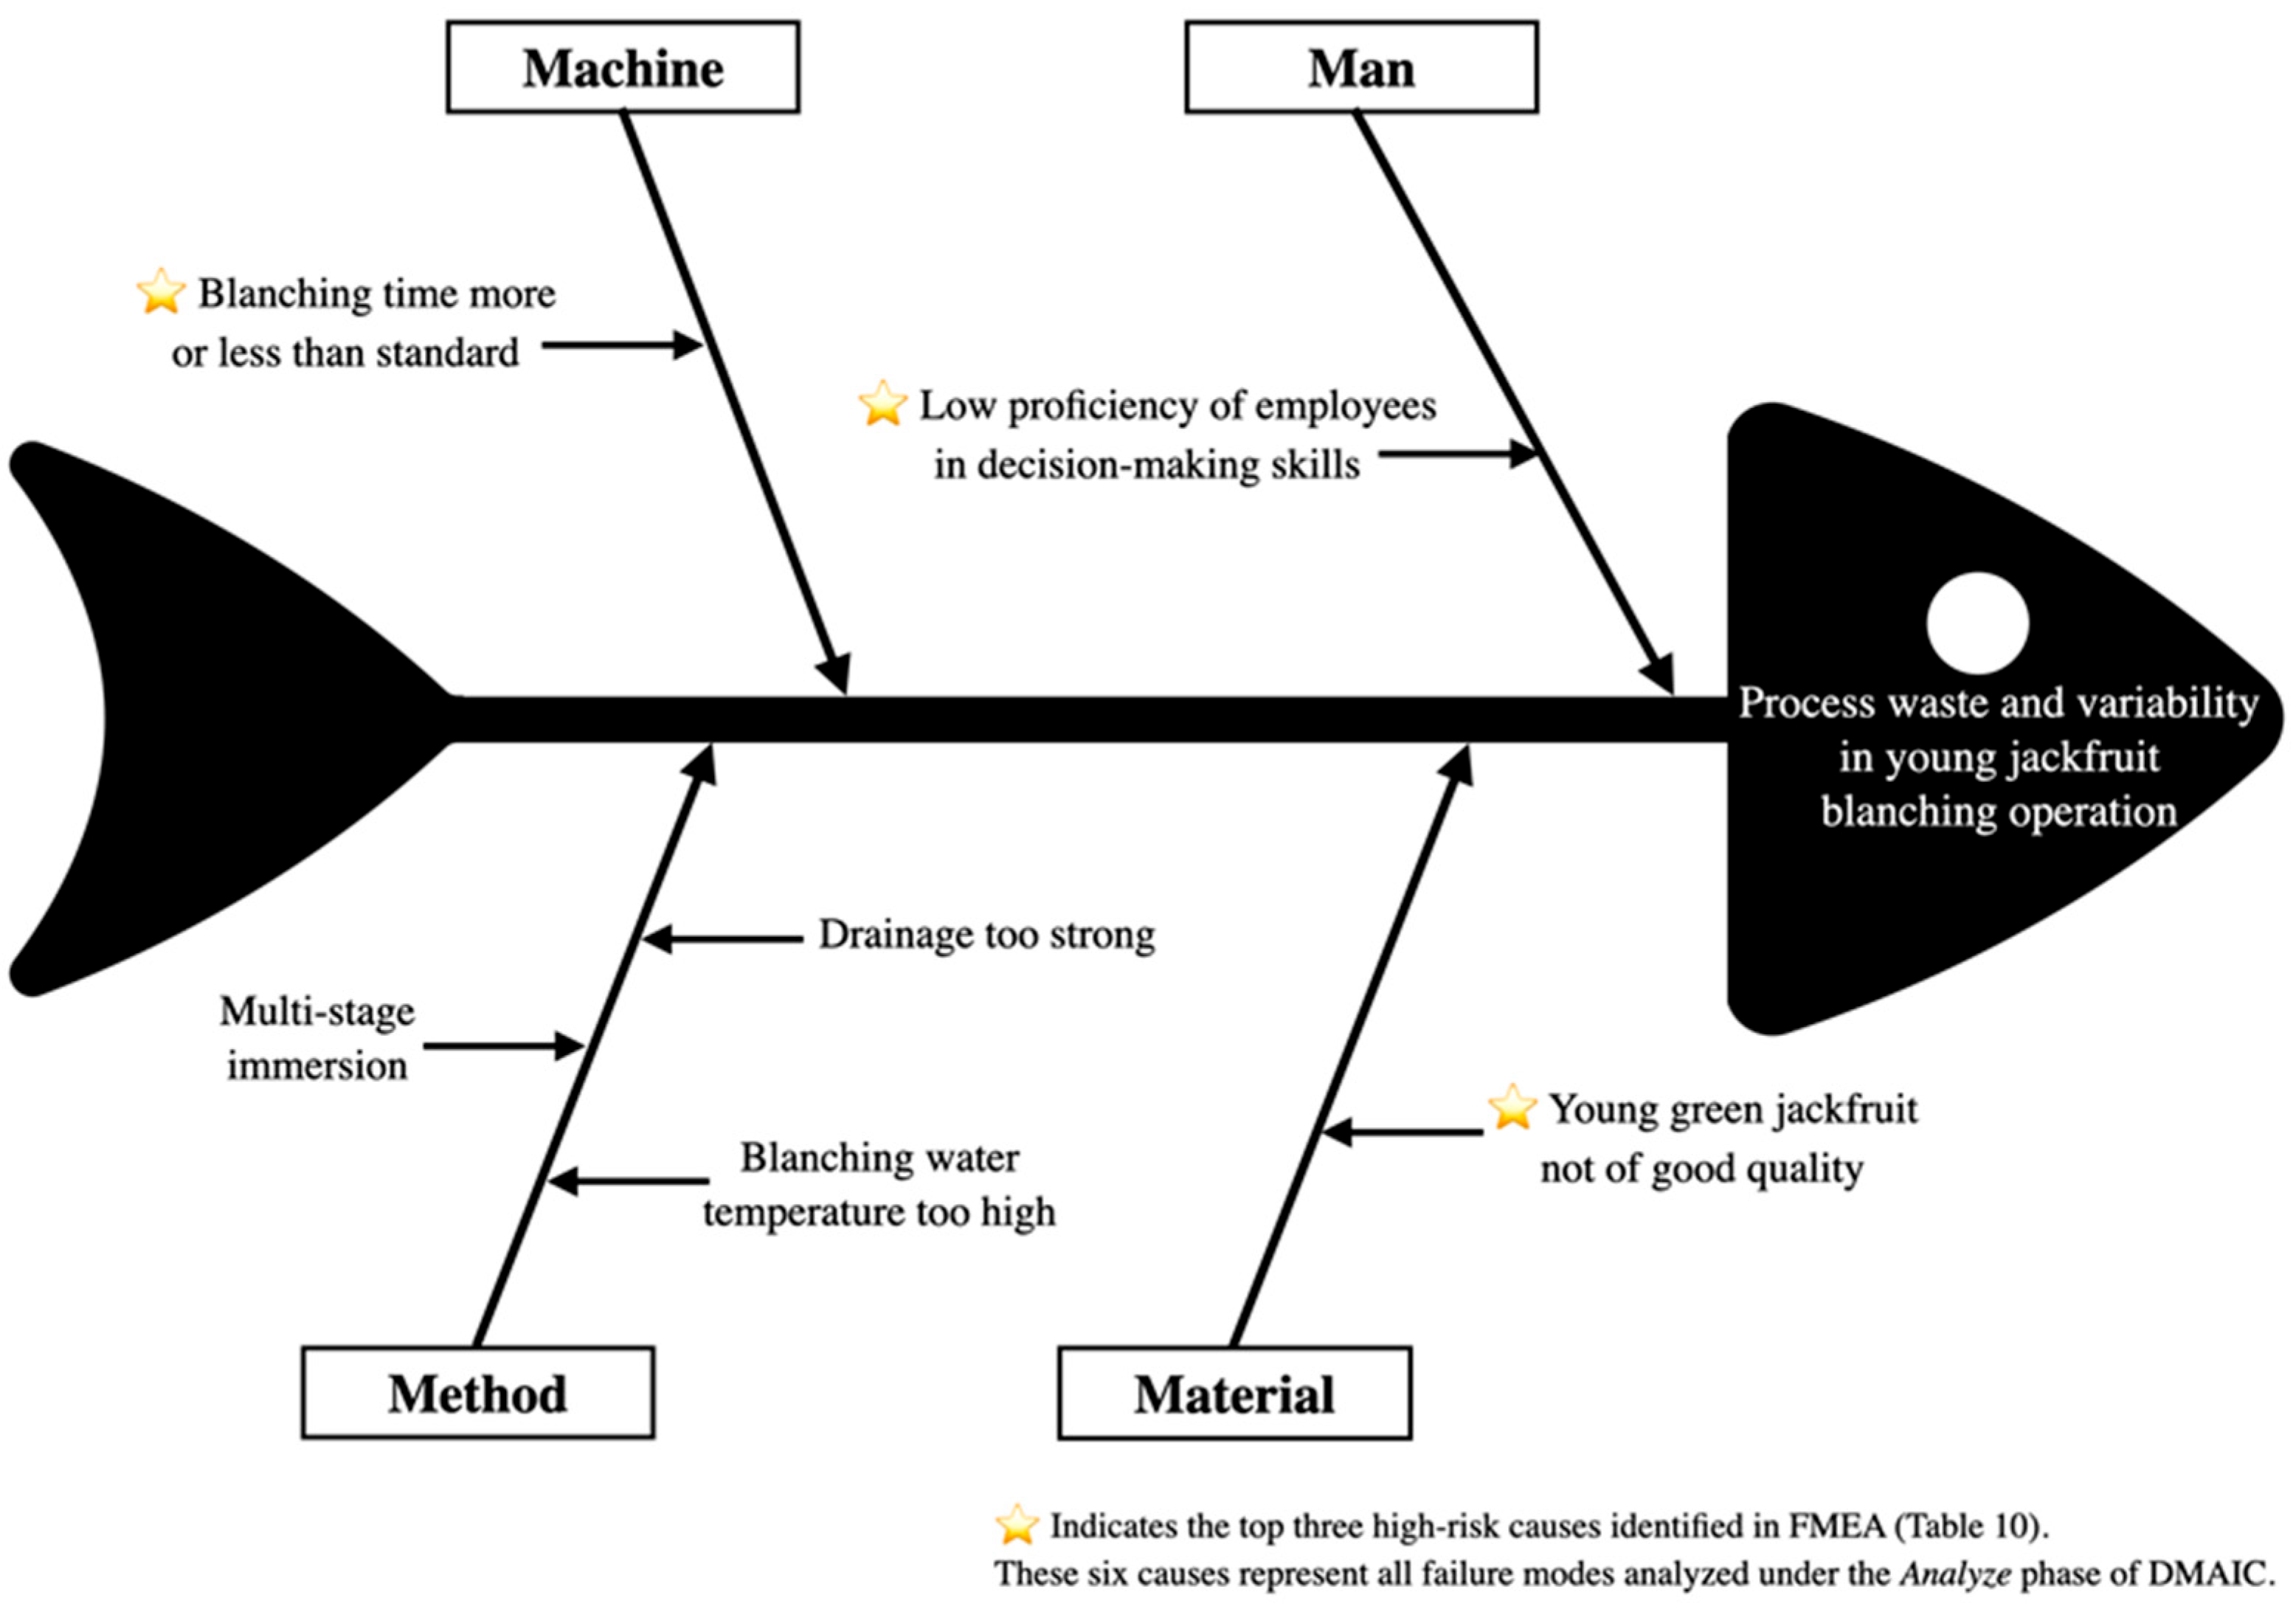
To identify key sources of waste and process variation in the young jackfruit canning line, a Fishbone Diagram (Ishikawa Analysis) was developed using the 4M framework—Man, Machine, Method, and Material—as shown in Figure 6. The identified failure modes and their corresponding risk priorities are summarized in Table 10.
Figure 6.
Fishbone diagram of potential causes of waste (see Table 10).
Table 10.
FMEA risk assessment of potential failure modes.
This framework was selected to systematically categorize controllable factors influencing waste generation and to provide structured inputs for subsequent prioritization using FMEA. The diagram highlights how operator performance, equipment control, and raw-material variability jointly contribute to waste. Cross-functional teams from production, quality, and engineering departments identified and prioritized these causes by their impact and frequency, as indicated by star rankings.
Among the identified factors, three main causes were prioritized as the most critical: (1) low operator proficiency in decision-making, (2) non-standardized blanching time, and (3) variability in raw-material quality of young jackfruit. Other contributors—such as excessive drainage force, multi-stage immersion, and high blanching temperature—were classified as lower-priority issues and addressed as secondary actions in the Improve phase. It should be noted that the measurement system was evaluated separately using Attribute Gage R&R within the DMAIC framework to ensure the reliability and consistency of inspection results, and was therefore not included as a category in the fishbone diagram.
4.4.2. FMEA Risk Assessment
To prioritize the root causes identified earlier, a Failure Mode and Effects Analysis (FMEA) was performed with operators and process engineers. Failure modes were ranked according to their RPN values, with higher scores indicating greater priority for improvement actions. Each failure mode was evaluated using severity (S), occurrence (O), and detectability (D) scores to compute the Risk Priority Number (RPN) [26]. The results are summarized in Table 10.
The analysis revealed that the highest-risk failure mode was low operator decision-making proficiency (RPN = 448), driven by inconsistent judgment during blanching. This finding reinforced the importance of strengthening the inspection system and operator training as key levers for productivity improvement. The next critical issues were substandard raw-material quality (RPN = 392) and non-standard blanching time control (RPN = 384). These three high-priority risks formed the primary focus of corrective actions in the Improve phase to ensure effective allocation of limited resources.
4.4.3. Improvement Implementation
Based on the FMEA prioritization, three critical causes were identified: (1) low operator proficiency in decision-making, (2) variability in raw-material quality, and (3) non-standardized blanching time control. Accordingly, two major improvement directions were implemented in the DMAIC Improve phase: (i) human-skill enhancement and process standardization, and (ii) optimization of blanching and inspection operations.
The highest-priority action focused on improving operator proficiency (RPN = 448). Standard operating procedures (SOPs) were developed to formalize decision rules for blanching control and product classification, and structured training programs were conducted to strengthen operator awareness and consistency. As a result, subjective variation among operators was substantially reduced, as evidenced by the post-improvement Gage R&R results reported earlier.
In parallel, blanching and inspection operations were optimized to address material and method-related risks. The blanching time was reduced from 3 min to 1 min, which shortened cycle time while maintaining acceptable enzyme inactivation and product quality. Visual timers, monitoring sheets, and revised work instructions were introduced to standardize manual control and improve repeatability. Supplier evaluation and grading criteria were also implemented to reduce raw-material variability prior to processing.
Enhancement of inspection accuracy represented a key outcome of these actions. Attribute Gage R&R results demonstrated a 16% improvement in inter-operator agreement after training and clarification of inspection criteria, confirming that inspection decisions more reliably reflected true process conditions. Collectively, these improvements contributed to more stable operations, reduced waste, and higher process consistency, forming the basis for the overall productivity gains summarized in Section 4.4.4.
4.4.4. Results of Improvement
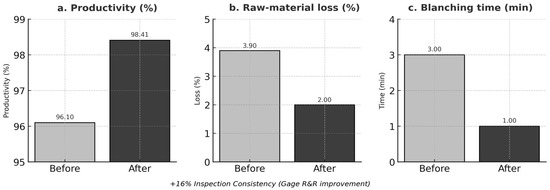
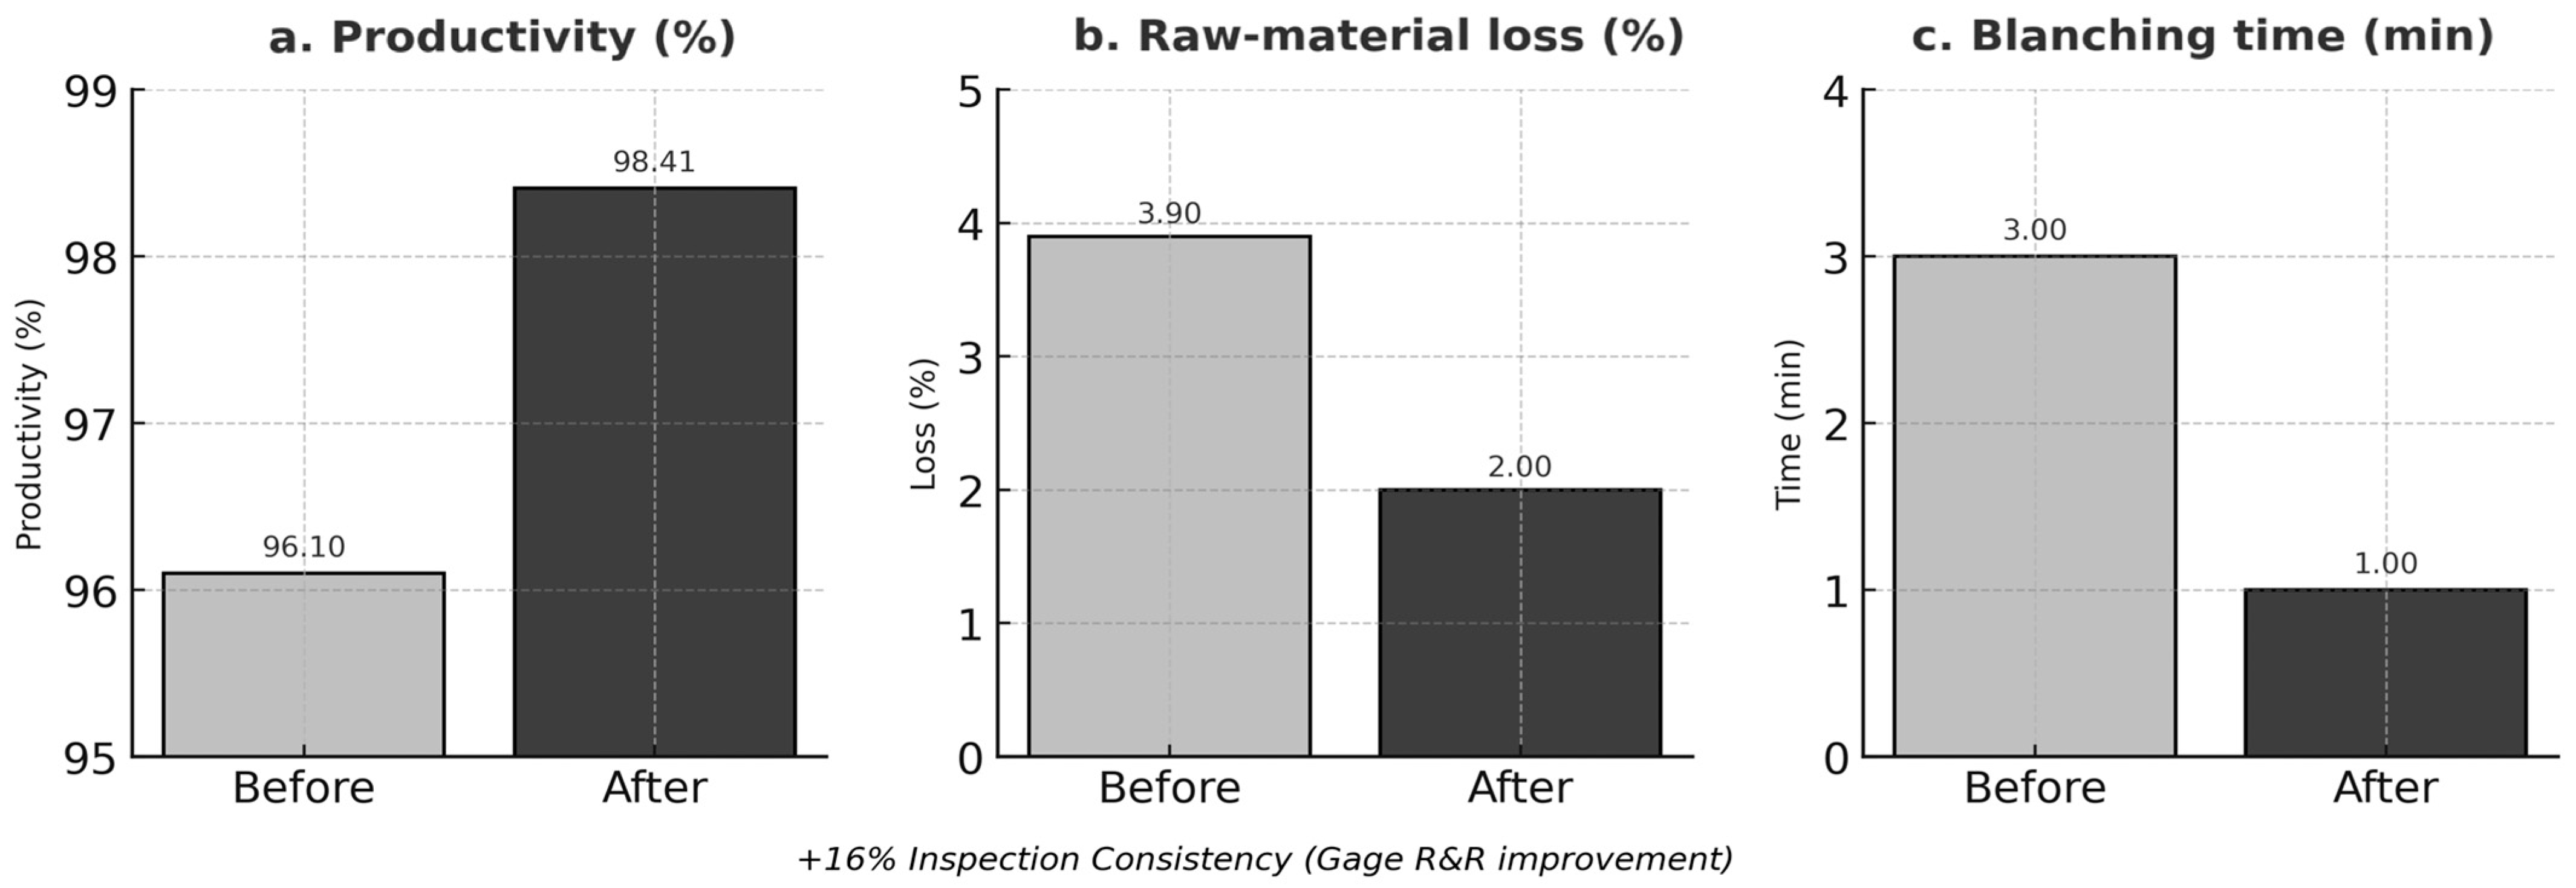
These improvements generated an estimated annual cost saving of USD 7200. The estimated annual cost saving was calculated based on reductions in raw material loss, processing time, and operational inefficiencies, assuming consistent production volume under standard operating conditions. This result confirms the practical value of integrating DMAIC and FMEA to strengthen process capability. To further illustrate these performance gains, Figure 7 provides a comparative visualization of the key indicators before and after implementation.
Figure 7.
Before–after comparison of key process indicators. (a) Productivity; (b) Raw-material loss; (c) Blanching time.
As shown in Figure 7a–c, productivity increased from 96.10% to 98.41%, raw-material loss declined from 3.90% to 2.00%, and average blanching time decreased by 67%, reflecting a more stable and efficient process. Operator performance also improved, demonstrated by a 16% increase in inter-operator inspection consistency from the Gage R&R study. Collectively, these human- and process-level improvements reinforce proactive process control, enhance logistics throughput, and lay the foundation for sustained operational stability in agro-industrial SME operations. Control measures to maintain these gains are detailed in Section 4.5.
4.5. Control and Overall Impact
The integrated DMAIC–FMEA approach strengthened both technical performance and organizational capability. Standardized blanching reduced operator-dependent variation, enhanced supplier control minimized waste, and continuous skill development fostered a culture of improvement. Performance stability sustained over six months confirmed an annual cost saving of approximately USD 7200, demonstrating the practical and financial value of the implemented solutions. Overall, the control phase institutionalized a standardized and self-sustaining system that supports long-term process stability and continuous productivity improvement in agro-industrial SME operations.
5. Discussion
Among the implemented actions, blanching time reduction had the most immediate impact on throughput, while improvements in inspection reliability primarily contributed to yield stabilization and waste reduction. These findings demonstrate that the integration of DMAIC and FMEA can effectively enhance productivity in labor-intensive agro-industrial SMEs. The results confirm that structured, data-driven problem solving can deliver significant performance gains without major capital investment [1,11,12].
The 16% improvement in inter-operator agreement indicates that inspection variability was a critical source of inefficiency. The successful application of Attribute Gage R&R highlights the importance of validating measurement systems prior to process optimization [8,9]. These findings further suggest that measurement system reliability should be considered a critical prerequisite for ensuring the validity of process improvement outcomes, rather than merely a supporting activity. In addition, the results emphasize that human-related variability must be addressed alongside technical process improvements to achieve sustainable performance gains.
In addition, blanching optimization demonstrates that productivity enhancement requires balancing multiple criteria, including yield, product quality, and cycle time. Reducing blanching time from 3 to 1 min increased throughput while maintaining acceptable quality levels. The statistical validation of enzymatic activity and pH levels, performed in triplicate, further confirmed the reliability of these quality parameters under the optimized conditions (Table 9).
Although Design of Experiments (DoE) is a powerful statistical tool for process optimization, the DMAIC framework was selected in this study due to its practical suitability for real industrial SME environments characterized by operational constraints and process variability. Furthermore, FMEA enabled systematic prioritization of high-risk failure modes, supporting efficient allocation of limited SME resources [3,4,16].
The findings of this study are largely consistent with previous research demonstrating that DMAIC and FMEA frameworks can significantly improve productivity, reduce process variability, and standardize operations in food manufacturing systems [3,5,6,32]. However, while existing literature primarily focuses on process performance outcomes, limited attention has been given to the reliability of the inspection systems that underpin these improvements. Therefore, this study extends the current body of knowledge by explicitly incorporating measurement system validation through Attribute Gage R&R within the DMAIC–FMEA framework. By ensuring that process variations and defect classifications are consistently evaluated, the proposed framework reduces decision uncertainty. This integration provides a more robust foundation for risk-based decision-making and strengthens the reliability of process optimization outcomes, particularly in labor-intensive agro-industrial SMEs where inspection processes rely heavily on human judgment.
From a logistics perspective, the reduction in blanching time accelerated material flow, improved throughput, and reduced rework. Increased process consistency enhanced operational stability and contributed to lower logistics-related costs. These results indicate that the implementation of the DMAIC–FMEA framework can simultaneously improve internal process efficiency and overall supply chain performance, reinforcing its practical applicability in food logistics systems.
This study is subject to certain limitations. It was conducted in a single production facility, focused on one product type, and evaluated over a six-month period. These contextual constraints may influence the applicability of the proposed framework, particularly in production systems with different raw material characteristics, processing technologies, or levels of automation. For instance, variations in product structure or thermal sensitivity may require adjustments to blanching conditions and process parameters, while differences in workforce skill levels may affect the implementation of inspection reliability improvements. Nevertheless, the proposed framework can be adapted to other agro-industrial processes with appropriate modifications in product characteristics, processing conditions, and inspection criteria. Future research should validate the framework across diverse agro-industrial settings and explore the integration of digital monitoring technologies and multi-criteria decision-making approaches to further enhance process optimization.
6. Conclusions
This research achieved measurable productivity improvement in canned young green jackfruit processing through an integrated DMAIC–FMEA framework. Productivity increased by 2.31%, raw-material loss decreased by 1.90%, inspection reliability improved by 16%, and blanching time was reduced from 3 to 1 min, generating estimated annual savings of USD 7200.
The findings confirm that structured improvement methodologies can substantially enhance efficiency and logistics throughput in agro-industrial post-harvest processing systems without significant capital investment. The proposed framework offers a practical and replicable model for improving process reliability, production stability, and engineering-based decision making in agro-industrial processing SMEs.
The study therefore contributes to agro-industrial processing engineering by demonstrating a scalable, risk-based improvement approach for productivity enhancement in agricultural product processing environments. Future studies may extend this approach to other products and scales, incorporate advanced analytics, and evaluate long-term organizational impacts.
Author Contributions
Conceptualization, D.D.; methodology, D.D.; formal analysis, D.D.; investigation, S.K., S.P. and P.L.; data curation, S.K., S.P. and P.L.; writing—original draft preparation, D.D.; writing—review and editing, D.D.; visualization, S.K., S.P. and P.L.; supervision, D.D.; project administration, D.D. All authors have read and agreed to the published version of the manuscript.
Funding
This research received no external funding.
Institutional Review Board Statement
Not applicable.
Informed Consent Statement
Not applicable.
Data Availability Statement
The data presented in this study are available on request from the corresponding author. The data are not publicly available due to confidentiality agreements with the participating company.
Acknowledgments
The authors gratefully acknowledge the participating case study company for providing essential data and operational insights. Support from King Mongkut’s University of Technology North Bangkok for academic and logistical resources is also highly appreciated.
Conflicts of Interest
The authors declare no conflicts of interest.
References
- Sokovic, M.; Pavletic, D.; Kern Pipan, K. Quality improvement methodologies—PDCA cycle, RADAR matrix, DMAIC and DFSS. J. Achiev. Mater. Manuf. Eng. 2010, 43, 476–483. Available online: https://jamme.acmsse.h2.pl/papers_vol43_1/43155.pdf (accessed on 26 March 2026).
- Mustaniroh, S.A.; Widyanantyas, B.A.; Kamal, M.A. Quality control analysis for minimizing defects in potato chips production using Six Sigma DMAIC. IOP Conf. Ser. Earth Environ. Sci. 2021, 733, 012053. [Google Scholar] [CrossRef] [Scilit]
- Stamatis, D.H. Failure Mode and Effect Analysis: FMEA from Theory to Execution; ASQ Quality Press: Milwaukee, WI, USA, 2003. [Google Scholar]
- Zhao, X. The application of FMEA method in the risk management of medical devices during the lifecycle. In Proceedings of the 2nd International Conference on e-Business and Information System Security (EBISS), Wuhan, China, 22–23 May 2010; pp. 1–4. [Google Scholar] [CrossRef] [Scilit]
- Antony, J. Readiness factors for the Lean Six Sigma journey in the higher education sector. Int. J. Product. Perform. Manag. 2014, 63, 257–277. [Google Scholar] [CrossRef] [Scilit]
- Dora, M.; Kumar, M.; Van Goubergen, D.; Molnar, A.; Gellynck, X. Lean Six Sigma in food processing SMEs. Int. J. Prod. Econ. 2014, 150, 115–124. [Google Scholar] [CrossRef] [Scilit]
- Kumar, M.; Antony, J.; Madu, C.N.; Montgomery, D.C.; Park, S.H. Common myths of Six Sigma demystified. Int. J. Qual. Reliab. Manag. 2008, 25, 878–895. [Google Scholar] [CrossRef] [Scilit]
- Montgomery, D.C. Introduction to Statistical Quality Control, 7th ed.; Wiley: Hoboken, NJ, USA, 2012. [Google Scholar]
- Automotive Industry Action Group (AIAG). Measurement Systems Analysis (MSA), 4th ed.; AIAG: Southfield, MI, USA, 2010. [Google Scholar]
- Pan, J.N. Evaluation of measurement systems. Qual. Reliab. Eng. Int. 2006, 22, 541–551. [Google Scholar] [CrossRef] [Scilit]
- Harry, M.J.; Schroeder, R. Six Sigma: The Breakthrough Management Strategy Revolutionizing the World’s Top Corporations; Doubleday: New York, NY, USA, 2000. [Google Scholar]
- Carrim, M.O.; Gupta, K. Improving efficiency and productivity of a production line using lean manufacturing and DMAIC. Int. Res. J. Sci. Technol. Educ. Manag. 2024, 4, 1–14. [Google Scholar] [CrossRef]
- Daniyan, I.; Adeodu, A.; Mpofu, K.; Maladzhi, R.; Kana-Kana Katumba, M.G. Application of Lean Six Sigma methodology using DMAIC approach for improvement of a bogie assembly process in the railcar industry. Heliyon 2022, 8, e09043. [Google Scholar] [CrossRef] [Scilit]
- Ferreira, C.; Sá, J.C.; Ferreira, L.P.; Lopes, M.J.P.; Pereira, T.; Silva, F.J.G. iLeanDMAIC—A methodology for implementing lean tools. Procedia Manuf. 2019, 41, 1095–1102. [Google Scholar] [CrossRef] [Scilit]
- Mittal, A.; Gupta, P.; Kumar, V.; Owad, A.A.; Mahlawat, S.; Singh, S. Performance improvement analysis using Six Sigma DMAIC methodology: A case study of an Indian manufacturing company. Heliyon 2023, 9, e14625. [Google Scholar] [CrossRef] [Scilit]
- Godina, R.; Silva, B.G.R.; Espadinha-Cruz, P. A DMAIC-integrated fuzzy FMEA model: A case study in the automotive industry. Appl. Sci. 2021, 11, 3726. [Google Scholar] [CrossRef] [Scilit]
- dos Reis, M.E.D.M.; Abreu, M.; Braga Neto, O.O.; Vieira, L.E.V.; Torres, L.F.; Calado, R.D. DMAIC in improving patient care processes: Challenges and facilitators in the healthcare context. IFAC-PapersOnline 2022, 55, 215–220. [Google Scholar] [CrossRef] [Scilit]
- Ahmed, S. Integrating DMAIC approach of Lean Six Sigma and theory of constraints toward quality improvement in healthcare. Rev. Environ. Health 2019, 34, 427–434. [Google Scholar] [CrossRef] [Scilit]
- Mousli, H.M.; El Sayed, I.; Zaki, A.; Abdelmonem, S. Improving VTE prophylaxis in ward and ICU surgical urology patients: A Six Sigma DMAIC methodology improvement project. TQM J. 2024, 36, 634–663. [Google Scholar] [CrossRef] [Scilit]
- Marques, P.d.A.; Matthé, R. Six Sigma DMAIC project to improve the performance of an aluminum die casting operation in Portugal. Int. J. Qual. Reliab. Manag. 2017, 34, 307–330. [Google Scholar] [CrossRef] [Scilit]
- Condé, G.C.P.; Oprime, P.C.; Pimenta, M.L.; Sordan, J.E.; Bueno, C.R. Defect reduction using DMAIC and Lean Six Sigma: A case study in a manufacturing car parts supplier. Int. J. Qual. Reliab. Manag. 2023, 40, 2184–2204. [Google Scholar] [CrossRef] [Scilit]
- Ranade, P.B.; Reddy, G.; Koppal, P.; Paithankar, A.; Shevale, S. Implementation of DMAIC methodology in a green sand-casting process. Mater. Today Proc. 2021, 42, 500–507. [Google Scholar] [CrossRef] [Scilit]
- Wang, C.N.; Vo, T.T.B.C.; Le, D.S.; Chung, Y.C. Optimizing production line efficiency via DMAIC, VSM and FMEA: A case study of an electronics manufacturing services company. Eng. Manag. J. 2025, 1–19. [Google Scholar] [CrossRef] [Scilit]
- Saputra, D.A.; Kurnia, H.; Feriaty, S.R. Implementation of the Six Sigma–DMAIC method to improve product scanning unit quality in the electronics industry. Teknosains 2025, 12, 271–285. [Google Scholar] [CrossRef] [Scilit]
- Slack, N.; Brandon-Jones, A.; Johnston, R. Operations Management, 8th ed.; Pearson Education Limited: Harlow, UK, 2016. [Google Scholar]
- Stamatis, D.H. The Basics of FMEA, 2nd ed.; CRC Press: Boca Raton, FL, USA, 2019. [Google Scholar]
- Fellows, P.J. Food Processing Technology: Principles and Practice, 3rd ed.; Woodhead Publishing: Cambridge, UK, 2009. [Google Scholar]
- Ramesh, M.N. Blanching of vegetables: Science and practice. In Handbook of Food Preservation, 2nd ed.; Rahman, M.S., Ed.; CRC Press: Boca Raton, FL, USA, 2007; pp. 491–515. [Google Scholar]
- Iqbal, A.; Murtaza, S.; Asghar, M.; Usman, S. Effect of cooking on antioxidant activity in vegetables. Food Chem. 2010, 121, 1062–1067. [Google Scholar] [CrossRef] [Scilit]
- Anthon, G.E.; Barrett, D.M. Kinetic parameters for the thermal inactivation of quality-related enzymes in carrots and potatoes. J. Agric. Food Chem. 2002, 50, 4119–4125. [Google Scholar] [CrossRef] [Scilit] [PubMed]
- Lee, S.C.; Kim, J.H.; Jeong, S.M.; Kim, S.Y.; Park, S.K.; Nam, K.C.; Ahn, D.U. Effect of far-infrared radiation on the antioxidant activity of rice hulls. LWT Food Sci. Technol. 2006, 39, 389–394. [Google Scholar] [CrossRef] [Scilit] [PubMed]
- Liu, H.C.; Liu, L.; Liu, N. Risk evaluation approaches in failure mode and effects analysis: A literature review. Expert Syst. Appl. 2013, 40, 828–838. [Google Scholar] [CrossRef] [Scilit]

Disclaimer/Publisher’s Note: The statements, opinions and data contained in all publications are solely those of the individual author(s) and contributor(s) and not of MDPI and/or the editor(s). MDPI and/or the editor(s) disclaim responsibility for any injury to people or property resulting from any ideas, methods, instructions or products referred to in the content. |
© 2026 by the authors. Licensee MDPI, Basel, Switzerland. This article is an open access article distributed under the terms and conditions of the Creative Commons Attribution (CC BY) license.