


Abstract
Agrivoltaic systems are regarded as multifunctional land-use strategies, but their effects on high-value aromatic crops remain poorly understood. This exploratory single-site study described biomass production, essential oil yield, antioxidant traits and volatile composition of Thymus vulgaris L., Salvia officinalis L. and Salvia rosmarinus Spenn. at three positions within an agrivoltaic corridor and in an adjacent open-field control. Compared with the open field, the agrivoltaic area received 17.7% less solar radiation, had 6.8% lower reference evapotranspiration and strongly reduced wind speed, and showed 19.2% higher soil water content under the same irrigation schedule. Fresh biomass per plant was 2.4–3.4 times higher at all agrivoltaic positions than in the control, with similar values among positions, while dry matter content varied with position. The most shaded position showed the lowest dry matter content, associated in S. officinalis with a lower proportion of desiccated tissue, and the highest essential oil yield on a dry matter basis (+69.2% in T. vulgaris, +19.4% in S. officinalis and +112.2% in S. rosmarinus), whereas on a fresh weight basis yield was higher only in S. rosmarinus. Estimated oil production per plant was higher under agrivoltaic conditions in all species. Antioxidant capacity was generally highest in the same position, whereas volatile composition differed mainly from open-field control. Although species-specific, the results point to crop position within corridors as a potential agrivoltaic design variable. Since areas and positions were not replicated and chemical analyses were performed on composite samples, this hypothesis requires confirmation through studies with a replicated experimental design.
1. Introduction
Agrivoltaic systems, hereafter APV, integrate photovoltaic energy production with agricultural land use and have emerged as a strategy to improve land-use efficiency, resource use and cropping-system resilience under climate change [1,2]. Originally proposed by Goetzberger and Zastrow (1982) [3] as a dual-use land management approach, APV is now recognised as a transformative solution to improve land productivity through the simultaneous production of electricity and agricultural biomass on the same land, and to contribute to climate change mitigation and global sustainability goals [4,5,6,7]. By enabling crops to grow beneath or between photovoltaic modules (hereafter PV), APV systems can modify the crop microclimate and reduce heat and water stress while generating renewable energy, thereby supporting the sustainable intensification of agriculture [8,9].
Recent research has increasingly examined the effects of APV-induced partial shading on crop physiology and productivity. Studies on horticultural and fruit crops, including grapevine [10], tomato and lettuce [11,12], and strawberry, kiwi, and other fruit species [13,14], have shown that APV structures can significantly modify the understory microclimate by reducing incoming radiation, buffering temperature extremes, lowering wind speed and decreasing evaporative demand.
Although PV installations modify crop microclimate, their agronomic effects are not unequivocal: stress reduction may promote vegetative growth, whereas reduced radiation can limit biomass accumulation or alter biochemical pathways involved in crop quality formation [15]. This issue is particularly relevant for aromatic and medicinal plants, whose productivity and secondary metabolism are highly sensitive to environmental modulation [16,17]. Despite the rapid expansion of APV pilot systems, most studies have focused on vegetable and fruit crops, mainly assessing yield performance and water use efficiency, while perennial aromatic species remain poorly investigated [18,19,20].
Reduced light availability has been investigated extensively in essential oil-producing plants using shade nets, and the reported responses are strongly species- and intensity-dependent. Shading increased essential oil content in sage, oregano and rosemary [21], in thyme, marjoram and oregano [17] and in lemon balm, mint and sweet basil [22], whereas neutral or negative effects were reported for thyme and mint [16] and for Melissa officinalis [23]. Shading also modifies oil composition, with shifts in the main constituents of thyme and mint [16] and harvest time-dependent effects in sage [24]. Reduced radiation can also induce morphological acclimation, including shoot elongation and increased leaf area, while decreasing the dry-to-fresh biomass ratio because of the greater relative contribution of tissue water under shaded conditions [25]. Most of this evidence, however, comes from shade-net experiments, which impose a relatively uniform and largely diffuse reduction in irradiance, whereas an APV structure generates moving shadows and a spatial radiation gradient across the inter-row, together with concurrent changes in wind speed and evaporative demand. Understanding how this spatially heterogeneous shading affects crop growth and essential oil production, therefore, remains a key gap for the development of multifunctional APV systems.
Mediterranean Lamiaceae, including rosemary, sage and thyme, are suitable models for addressing this gap because of their stress resilience, economic value and use as sources of high-quality raw materials for the cosmetic and pharmaceutical sectors [26,27]. Their aromatic profiles are strongly influenced by environmental and agronomic factors, making them particularly relevant for evaluating APV-induced effects on essential oil yield and quality [27]. Essential oil yield depends not only on biomass production but also on metabolite concentration, which may respond positively to moderate stress alleviation and improved microclimatic conditions [28,29]. Although some studies report slight reductions in total dry matter under shading, compensatory effects, such as increased essential oil concentration or reduced irrigation demand, can offset potential yield penalties [30]. Consequently, APV systems may enhance overall system sustainability rather than maximising the productivity of a single crop [29]. However, successful implementation requires careful system design to optimise light distribution at crop level [31,32]. In fixed-tilt systems, ground-level irradiance depends on panel height, row pitch, tilt, orientation and ground coverage ratio, which together generate direct and diffuse shading patterns that vary across the inter-row and throughout the year [33,34,35,36]. Crops grown at different positions within the same corridor may therefore experience markedly different light and microclimatic conditions, making crop positions a design and management variable rather than a source of experimental noise. Aromatic crops have also been recognised as opportunities for farm diversification and territorial development because of their economic value and structural characteristics [37,38,39], while recent evidence from dynamic APV systems indicates that microclimatic conditions can modify and influence essential oil production in aromatic species [27]. These responses can only be interpreted through integrated monitoring approaches able to link atmospheric conditions, soil water dynamics, spatial radiation heterogeneity, and crop performance within the APV system. Furthermore, the spatial and temporal heterogeneity generated within APV systems is rarely quantified through integrated monitoring, despite its relevance for understanding crop responses and product-quality outcomes.
Therefore, this exploratory single-site study evaluated the performance of a fixed tilt APV system in central Italy using an integrated monitoring approach, as described by Di Domenico et al. (2026) [40]. The novelty of this study lies in linking APV spatial heterogeneity, quantified through microclimatic monitoring and a geometric shading model, with both quantitative and qualitative traits of essential oil crops. Instead of assessing crop yield alone, this study explores whether different light microenvironments within a fixed tilt APV corridor are associated with differences in biomass accumulation, dry matter content, essential oil yield, antioxidant traits and key volatile markers in Salvia rosmarinus Spenn., Salvia officinalis L., and Thymus vulgaris L. Specifically, this study aimed to (i) quantify the microclimatic changes induced by the APV system and the spatial distribution of shading across the corridor; (ii) compare biomass and essential oil production per plant between APV positions and the open-field control; and (iii) describe how essential oil yield and quality varied with crop position within the corridor in each species, as a basis for hypotheses on crop placement in APV design. This approach is essential for understanding how APV-induced microclimatic heterogeneity may affect the productivity and quality of aromatic species intended for cosmetic and pharmaceutical applications.
2. Materials and Methods
Generative AI (ChatGPT 6.1) was used to generate individual illustrative icons included in the Graphical Abstract. The overall design, layout, composition, integration of elements and scientific content of the Graphical Abstract were created and finalised by the authors.
2.1. Study Area and Agrivoltaic Layout
This study was conducted at an experimental fixed tilt APV facility in Viterbo, central Italy (Figure 1). The experimental design included two adjacent study areas, each measuring 500 m2—corresponding to the portions of the field in which plants were grown, monitored and sampled: (i) an APV area equipped with photovoltaic panels and (ii) an open-field control area. Both areas were in the same field and were managed with identical agronomic practices throughout the study period to minimise management-related confounding effects.
Figure 1.
Study site: (a) experimental farm in Viterbo; (b) APV corridor; (c) the adjacent open-field control area.
The APV system consisted of fixed module rows oriented east–west, with south-facing panels tilted at approximately 25°. Each structure comprised two vertically stacked modules (1.67 × 1.00 m each, portrait orientation), giving a collector width of 3.34 m and a horizontal projection of 3.03 m. The panels were mounted on a single central support pole 2.1 m high, with the lower (southern) and upper (northern) edges at approximately 1.39 m and 2.81 m above ground. The row pitch, measured between the support poles of adjacent rows, was approximately 4.4 m, corresponding to a ground coverage ratio (GCR) of 0.69 and leaving an uncovered ground strip of approximately 1.37 m between the projections of adjacent panel rows. This configuration created conditions of partial shading and a spatial gradient of solar radiation at ground level.
Three Mediterranean aromatic species were studied: Thymus vulgaris L., Salvia officinalis L., and Salvia rosmarinus Spenn. Uniform seedlings grown in pots were transplanted into both the APV and open-field control areas. For each species, crop rows were established within dedicated APV corridors, and the same crop row arrangement and species sequence were mirrored in the adjacent open-field area to provide a full sun reference. Within the APV system, the three crop rows were positioned across the inter-row at 1.4 m (Row 1), 2.2 m (Row 2) and 3.0 m (Row 3) north of the support pole of the reference PV row. Row 1 was therefore located beneath the upper (northern) edge of the reference panel row, Row 3 beneath the lower (southern) edge of the adjacent row to the north, and Row 2 in the uncovered strip between the two panel projections (Figure 2). These rows represented distinct spatial positions along the radiation gradient generated by the PV structure and were therefore considered spatial positions within the APV configuration rather than independent replicated treatments. Details on row positioning, plant number and monitored samples are provided in Table 1.
Figure 2.
North–south section of the APV corridor showing the panel geometry and the position of the three crop rows.
Table 1.
Summary of experimental design parameters.
2.2. Plant Material, Crop Management and Condition at Harvest
Potted plants of T. vulgaris L., S. officinalis L. and S. rosmarinus Spenn. (5–6 cm tall, 7–9 cm pots) were obtained from a single batch per species from a commercial nursery in Lazio and transplanted in November 2023, after tillage and hilling. In both areas, plants were spaced 0.8 m within rows and rows were 0.8 m apart. In the APV area, the three rows of each species (Rows 1–3) were placed across a 4.4 m-wide corridor (Figure 2); in the open-field control, the three rows of each species were placed side by side, giving nine consecutive rows 0.8 m apart. Rows were covered with biodegradable mulch film and drip irrigated with the same schedule in both areas; no fertilisers were applied. Soil properties were determined in May 2024 on composite samples (0–20 cm) from each area by an accredited laboratory, following Italian official methods (Ministerial Decree 13/09/1999) and US EPA methods for total P and K (Supplementary Table S4).
Each row was irrigated by its own drip line, with the same type of drip line and emitters in both areas. All drip lines were supplied by a single 10 m3 tank, which was emptied at each irrigation event; each event supplied about 6 L per metre of drip line, i.e., about 5 L per plant in both areas. Irrigation was applied every other day for two months after transplanting (November 2023 to January 2024) and daily from April to June in both 2024 and 2025, with the last irrigation season ending at harvest; no irrigation was applied in the other months. APV and control were therefore compared under equal irrigation input rather than under equivalent soil-water status; because evaporative demand was lower under APV (Section 3.1), the same water supply may have resulted in a wetter root zone in the APV corridors.
Plants were harvested on 11 June 2025. For each species, ten plants per row were randomly selected (30 plants per species in the control and ten at each of the three APV positions), cut at soil level and weighed individually in the field (platform scale, 0.1 kg resolution). The material was pooled by species and position. Because a single distillation unit was available and each distillation, including loading and cleaning, required approximately 2 h and 30 min, the twelve distillations (three species × four positions) were carried out over two consecutive days: S. officinalis and T. vulgaris on the day after harvest and S. rosmarinus on the second day. To avoid confounding position with processing date, all positions of each species were processed on the same day. Until processing, the material was stored in jute bags in a dark, dry place at approximately 15–20 °C.
Canopy condition was visually assessed by photography during field visits. These observations were qualitative and were used only to support the interpretation of dry matter data.
2.3. Integrated Monitoring Framework
An integrated monitoring framework was adopted to characterise the APV system from both environmental and agronomic perspectives. Environmental variables were measured with the sensors listed in Table 2, connected to METER data loggers (METER Group, Pullman, WA, USA), recording at 15 min intervals. In the APV area, one set of atmospheric sensors and one soil moisture sensor were installed in each species corridor, at the centre of the corridor (Row 2, in the uncovered strip between panel projections) and midway along the row; APV values are reported as the mean of the three corridors. In the open-field control, a single set of atmospheric sensors was installed at the centre of the area, with one soil moisture sensor per species row. Atmospheric sensors were installed at 2 m height and soil moisture sensors at 20–25 cm depth. Microclimatic and soil data in the APV area therefore represent the least covered position of the inter-row. Before installation, the pyranometers, ATMOS 14 sensors and anemometers of the APV and control areas were operated side by side during October 2023; the differences between paired sensors remained within the accuracy declared by the manufacturers (Table 2), and no correction was applied. APV and control data were compared over the same monitoring period (January 2024 to May 2025). Solar radiation data were aggregated to hourly and daily values, air temperature to daily mean, minimum and maximum, and precipitation to monthly and annual totals. Vapour pressure deficit and reference evapotranspiration (ET0) were calculated following Allen et al., 1998 [41]. Because wind speed in the APV area was mostly below the lower limit of the anemometer measurement range (1 m s−1), APV wind speed indicates strongly reduced ventilation rather than providing a quantitative estimate, and APV ET0 should be regarded as approximate.
Table 2.
Environmental sensors used in the integrated monitoring framework, with measurement range, accuracy and calibration.
Crop performance was assessed at harvest on randomly selected plants (Section 2.2), followed by essential oil extraction and chemical characterisation (Section 2.5, Section 2.6, Section 2.7 and Section 2.8).
2.4. Theoretical Shading Model
To aid interpretation of the shading dynamics produced by photovoltaic modules across crop rows in each APV corridor, a simplified theoretical geometric model was developed in the vertical north–south plane. The model assumed flat ground, infinitely long parallel module rows with the geometry described in Section 2.1, and south-facing panels. In line with radiation-modelling approaches commonly used in APV systems, ground-level radiation distribution was assumed to depend primarily on system geometry and solar position [34]. Solar elevation and azimuth were calculated at 10 min intervals over the monitoring period (January 2024–May 2025) from site coordinates and astronomical time, using the NOAA solar position algorithm based on [42]. For each time step, direct shading was determined by testing whether the ray from the evaluation point towards the sun, projected onto the north–south plane, intersected any panel of the array. Evaluation points were placed at canopy height (0.3 m) for each crop row and at the pyranometer position (Row 2, 2 m). For each point, the model returned the mean daily hours and percentage of daylight under direct shade, the fraction of clear-sky direct horizontal irradiance intercepted by the panels, and the sky view factor for isotropic diffuse radiation. Clear-sky direct irradiance was estimated with the air mass model of Meinel and Meinel (1976) [43], using the air mass formulation of Kasten and Young (1989) [44]. Global radiation reduction was then estimated assuming a diffuse fraction of 0.4, with a sensitivity range of 0.3–0.5. Because the model does not include anisotropic diffuse radiation, multiple reflections, row ends or local three-dimensional effects, its outputs were interpreted as theoretical estimates. The estimate at the pyranometer position was compared with the measured radiation reduction to assess model consistency, and the model was then used to estimate radiation conditions at crop level, where no sensors were installed.
2.5. Essential Oil Extraction Methodology and Yield Determination
Essential oils were extracted using an Inox L 20 Plus steam distillation unit (Albrigi Luigi srl, Grezzana, VR, Italy), comprising an electrically heated boiler, a stainless-steel alembic for loading plant material, a water-cooled condenser, and a decanter for phase separation.
All samples were processed under standardised extraction conditions. For each species and position, a single distillation was performed on the pooled fresh biomass (2.0–2.6 kg for T. vulgaris, 1.0–1.5 kg for S. officinalis and 1.2 kg for S. rosmarinus). Extraction was carried out for 2 h at a boiling temperature of 100 ± 5 °C, while the condenser temperature was maintained at 15 ± 2 °C. For each extraction, the boiler was charged with 2.5 L of distilled water. At the end of the process, the distillate collected in the decanter spontaneously separated into two phases: the essential oil (upper layer) and the hydrolate (lower aqueous phase). The oil volume was read in the graduated decanter (0.5 mL resolution) and converted to mass using the oil density. Oils were recovered, dried over anhydrous sodium sulfate, and stored at 4 °C until analysis. Before each extraction, dry matter was determined on two aliquots (approximately 3 g each) of the same material used for the extraction, dried in an electric thermostatic air-drying oven at 105 ± 2 °C to constant weight. Essential oil yield was expressed on both a fresh weight and a dry matter basis (g 100 g−1). Essential oil production per plant was estimated separately for each species and position by combining the mean fresh aboveground biomass per plant, measured individually in the field at harvest, with the fresh-weight essential oil yield determined from the corresponding pooled sample. Mean biomass was calculated from ten plants at each APV position and from thirty plants in the open-field control. Estimated essential oil production was calculated as EO production (g plant−1) = mean fresh biomass (g plant−1) × EO yield (g 100 g−1 FW)/100. This calculation assumes that the essential oil yield of the distilled portion is representative of the pooled biomass from the corresponding species and position. The resulting values represent estimated mean oil.
2.6. Gas Chromatography–Mass Spectrometry (GC–MS) Analysis
Chemical profiling was performed using a PerkinElmer Clarus 680 GC system coupled with a Clarus SQ 8 MS detector and fitted with a 60 m capillary column (PerkinElmer Inc., Shelton, CT, USA), using an autosampler for automated 1 µL injections. The technical parameters maintained during analysis are summarised in Table 3. Compound identification was based on the combined evaluation of mass spectra and linear retention indices (LRIs). Mass spectra were compared with those in the NIST 98 library (Version 2.0), retaining assignments with a match ≥ 80%. A homologous series of n-alkanes (C7–C25) was analysed under the same chromatographic conditions as the essential oil samples. Experimental LRI were calculated by linear interpolation between the retention times of the n-alkanes eluting immediately before and after each compound, using the following equation: LRI = 100 × [n + (tR,x − tR,n)/(tR,n + 1 − tR,n)] [45], where tR,x is the retention time of the compound, tR,n and tR,n + 1 are the retention times of the immediately preceding and following n-alkanes, respectively, and n is the number of carbon atoms in the preceding n-alkane. Experimental indices were compared with reference values reported by Adams (2007) [46] to support compound assignments. Peak areas were integrated using TurboMass software (Version 5.4.2, PerkinElmer Inc., Shelton, CT, USA) and relative abundances were calculated by peak-area normalisation, without response-factor correction, and therefore represent relative chromatographic abundances rather than absolute compound concentrations.
Table 3.
GC–MS instrumental and analytical parameters.
2.7. Determination of Total Phenolic Content (TPC)
For the chemical characterization, 100 µL of each pure essential oil was dissolved in 10 mL of pure methanol (Carlo Erba, Cornaredo, Italy), following the procedure described by EL-Lateef Gharib & Teixeira da Silva (2013) [47]. The resulting methanolic solution served as the stock sample for the quantification of TPC. Concurrently, the same preparation was employed to evaluate the overall antioxidant capacity via the ferric reducing antioxidant power (FRAP) assay. This preliminary dilution ensured complete solubilization of the extract and optimal reactivity with the analytical reagents. The TPC of the essential oils was determined using the Folin–Ciocalteu colorimetric method [48], slightly adapted. As the Folin–Ciocalteu reagent is light-sensitive, all determinations were carried out in centrifuge tubes wrapped in aluminium foil. For each sample, 4 mL of distilled water, 1 mL of the diluted essential oil, and 0.5 mL of Folin–Ciocalteu reagent (ITW Reagents, S.R.L., Monza, Italy) were added to the tube. After 2 min, 2 mL of a 20% sodium carbonate (Sigma-Aldrich, Merck KGaA, Darmstadt, Germany) solution was added. The mixture was then brought to a final volume of 10 mL with distilled water, vortexed, and incubated for 30 min in the dark at room temperature.
Absorbance was measured at 765 nm using a UV–Vis spectrophotometer against a blank containing all reagents except the sample. TPC was expressed as gallic acid equivalents per gram of essential oil (mg GAE g−1 EO), based on a calibration curve (y = 450.84x + 4.8393; R2 = 0.9966) prepared using gallic acid standard solutions (Sigma-Aldrich, Merck KGaA, Darmstadt, Germany) in the range of 10–320 µg/mL, and converted from volume to mass using the measured oil density. Each essential oil sample was analysed in duplicate.
2.8. Ferric Reducing Antioxidant Power (FRAP) Assay
Antioxidant capacity was determined using the Ferric Reducing Antioxidant Power (FRAP) assay following Benzie and Strain (1999) [49], adapted for 96-well microplates (Infinite 200 PRO, Tecan, Salzburg, Austria). The assay is based on the reduction of the Fe3+–TPTZ complex to its ferrous form (Fe2+–TPTZ) under acidic conditions (pH 3.6), producing an intense blue colour with maximum absorbance at 593 nm. Each well contained 160 µL of freshly prepared FRAP reagent (Sigma-Aldrich, Merck KGaA, Darmstadt, Germany), 30 µL of distilled water, and 10 µL of either diluted essential oil, Trolox standard (Sigma-Aldrich, Merck KGaA, Darmstadt, Germany), or methanol as the reagent blank. The microplate was incubated in the dark for 30 min at 37 °C, after which absorbance was measured at 593 nm using the automated reader. Antioxidant capacity was expressed as millimoles of Trolox equivalents per litre of essential oil (mmol TE L−1 EO), based on a calibration curve (y = 1.2134x − 0.0532; R2 = 0.9956) prepared with Trolox standard solutions (0.1–2.0 mM). Each essential oil sample was analysed in duplicate.
2.9. Data Analysis
This study was designed as an exploratory, single-site case study. The APV area and the open-field control were single, unreplicated areas, and plants of each species were sampled in a single APV corridor, in which Rows 1–3 represent distinct spatial positions along the radiation gradient generated by the PV structure. Neither areas nor positions were replicated: for both the APV versus open-field contrast and the comparison among positions, the experimental unit is a single area or row (n = 1). Individual plants are observational units (subsamples) within each position and do not provide independent replicates of a treatment. Accordingly, no inferential tests were applied, and all variables are reported descriptively. Fresh aboveground biomass, plant height and plant width are reported as mean ± SD of the ten plants harvested in each row, where SD describes plant-to-plant variability within a position; in the open-field control, the three mirrored rows were pooled (30 plants). Essential oil yield, dry matter content, TPC, FRAP and volatile composition were determined on pooled material from each species and position (a single distillation per position analysed in duplicates), and their SD values represent analytical repeatability only. Microclimatic variables were compared between the APV and control areas as cumulative or period mean values and differences, expressed in °C for air temperature and as percentage differences for the other variables. Analyses were carried out using Python (v. 3.12) with the SciPy library (v. 1.17, Virtanen et al., 2020 [50]), and results are reported as mean ± standard deviation (SD).
A principal component analysis (PCA) on standardised variables was used as an exploratory visualisation of the relationships among dry matter, essential oil yield, TPC and FRAP across positions, without inferential purpose (Supplementary Figure S1).
3. Results
3.1. Microclimate and Soil Characterization
Microclimatic variables followed similar seasonal trends in the APV and open-field areas, but their intensity differed due to the presence of the photovoltaic structure (Figure 3; Table 4). Because APV sensors were located at the centre of each corridor, these data describe conditions in the uncovered strip (Row 2). Over the monitoring period (January 2024–May 2025), mean air temperature was slightly lower under APV than in the control (13.38 vs. 13.58 °C; −1.5%). The reduction was larger for mean daily maximum temperature (20.75 vs. 21.17 °C; −2.0%) than for mean daily minimum temperature (6.52 vs. 6.84 °C), suggesting a slightly larger effect on daytime maxima, although differences of this size are of the same order as sensor accuracy (Table 2). Cumulative precipitation was 9.0% lower in the APV area (1186.0 vs. 1302.8 mm), reflecting partial interception by the modules, while the monthly distribution remained similar between areas.
Figure 3.
Trends in the microclimatic variables monitored in the open-field area and the APV area. Data refer to the period January 2024–May 2025. (a) Daily maximum (upper line), mean (thick line) and minimum (dashed line) air temperature. (b) Difference in daily maximum (solid line), mean (dashed line) and minimum (dotted line) air temperature between APV and open field (APV − open field). Negative values indicate lower temperatures under APV, and the horizontal line marks zero difference. (c) Daily volumetric soil water content. The shaded area marks the summer period (June–August 2024). (d) Monthly cumulative precipitation.
Table 4.
Cumulative and period-mean values of the main environmental parameters in the open-field control and APV areas (January 2024–May 2025).
Wind speed showed the strongest response, with a mean value of 0.34 m s−1 in the APV corridor compared with 3.77 m s−1 in the open field (−91.1%); as APV values were mostly below the starting threshold of the anemometer, this difference indicates strongly reduced ventilation rather than a precise estimate of its magnitude. Cumulative solar radiation measured at 2 m height was 17.7% lower under APV (7901.4 vs. 9596.6 MJ m−2), with larger differences between January and May 2024 and more modest reductions during the summer months. The combined reduction in radiation and ventilation decreased cumulative ET0 by 6.8% (1039.6 vs. 1115.7 mm), with stronger reductions during periods of high atmospheric demand, particularly from March to September 2024.
Soil water content responded to the altered microclimate in different ways throughout the season (Figure 3c). Over the entire period, mean soil water content was 19.2% higher under APV than in the control (0.257 vs. 0.215 m3 m−3), with the largest differences in the thyme (0.320 vs. 0.263 m3 m−3; +22%) and sage corridors (0.260 vs. 0.202 m3 m−3; + 29%) and a smaller difference in the rosemary corridor (0.191 vs. 0.181 m3 m−3; +6%). However, a temporary reversal occurred from June to August 2024, when soil water content under APV was 15.0% lower than in the control. This indicates that soil water dynamics were influenced not only by shading, but also by precipitation interception, irrigation, reduced evaporation, crop water uptake and APV-induced spatial heterogeneity. The soil was classified as sandy loam (USDA) in both areas, with similar chemical and biological properties: pH 7.9–8.1, organic matter 3.3% and 3.1%, total N 0.26% and 0.24%, and microbial abundance of approximately 52,000 and 48,000 CFU g−1 in the APV and control areas, respectively (Supplementary Table S4).
3.2. Theoretical Shading at Crop Level
The theoretical shading analysis showed that the APV structure did not reduce radiation uniformly but created a spatial gradient of light availability within the corridor. All three crop rows were potentially affected by structural shading, although with different durations and intensities (Table 5). Row 1, located beneath the upper edge of the reference panel row, was the most shaded position, with 10.5 h day−1 of direct shade (87% of daylight) and 95% of clear sky direct irradiance intercepted. Row 2, in the uncovered strip, showed intermediate values (9.6 h day−1; 80% of daylight; 85% of direct irradiance intercepted), whereas Row 3 was the least affected by direct shading (8.1 h day−1; 68% of daylight; 54% of direct irradiance intercepted), although its proximity to the lower panel edge resulted in the lowest sky view factor (0.30). Consequently, the estimated reduction in global radiation at crop level ranged from −60% in Row 3 to −80% in Row 1.
Table 5.
Theoretical shading and estimated reduction in global solar radiation at crop level and at the radiation sensor position within the APV corridor (January 2024–May 2025).
3.3. Plant Growth, Dry Matter and Essential Oil Yield
Fresh biomass per plant was higher under APV than in the control for all three species (Figure 4), ranging from 1.53–1.60 vs. 0.47 kg plant−1 in T. vulgaris, 1.57–1.70 vs. 0.65 kg plant−1 in S. officinalis and 1.60–1.77 vs. 0.62 kg plant−1 in S. rosmarinus, with similar values among the three APV positions. Plant width was larger at all APV positions than in the control, with the largest differences in Row 1 for S. officinalis and S. rosmarinus and in Row 3 for T. vulgaris (Table 6).
Figure 4.
Fresh aboveground biomass of (a) T. vulgaris, (b) S. officinalis and (c) S. rosmarinus in the open-field control and at the three positions within the APV corridor.
Table 6.
Plant height and width at harvest according to plant position.
Dry matter content differed among positions: Row 1 had markedly lower values than the control in all species (−50.3% in T. vulgaris, −42.4% in S. officinalis and −29.1% in S. rosmarinus; Table 7), whereas Rows 2 and 3 showed values closer to the control. Field observations suggested that these differences were associated with canopy condition rather than with the hydration of living tissue: plants in Row 1 retained a largely green canopy, whereas a substantial part of the canopy in Row 2 and, to a lesser extent, in Row 3 consisted of desiccated, grey-brown leaves still attached to the plants. This within corridor pattern matched the ranking of dry matter content in this species (Row 1 < Row 3 < Row 2). Because whole plants were harvested, desiccated tissue was included in the harvested biomass and contributed to its dry matter content. The estimated dry biomass per plant was lowest in Row 1 among the APV positions, although it remained higher than in the control in all species (+63% in T. vulgaris, +51% in S. officinalis and +103% in S. rosmarinus); since it includes a variable proportion of non-living tissue, these values should be interpreted with caution.
Table 7.
Dry matter, essential oil yield, total phenolic content and antioxidant capacity according to plant position.
Essential oil yield on a dry matter basis was highest in Row 1 in all species, with increases of 69.2% in T. vulgaris, 19.4% in S. officinalis and 112.2% in S. rosmarinus compared with the control, whereas Row 2 and Row 3 showed more variable, species-specific responses (Table 7). On a fresh weight basis, the highest yield was observed in Row 3 for T. vulgaris, in Row 1 for S. rosmarinus and in the control for S. officinalis. Combining biomass and yield, the estimated essential oil production per plant was higher under APV than in the control in all species. The highest values were observed in Row 3 for T. vulgaris (4.2 vs. 0.9 g plant−1 in the control) and in Row 1 for S. rosmarinus (21.0 vs. 4.9 g plant−1), whereas the three APV positions showed similar values in S. officinalis (8.1–9.4 vs. 4.5 g plant−1).
3.4. Total Phenolic Content and Antioxidant Capacity
Total phenolic content and antioxidant capacity of the essential oils varied with plant position, with species-specific patterns (Table 7). In T. vulgaris, TPC was highest in Row 1 and Row 2 (approximately + 10% compared with the control), and FRAP was higher in all APV positions, particularly in Row 1 (+27.8%) and Row 2 (+26.4%). In S. officinalis, FRAP increased markedly in Row 1 (+78.8%) and Row 2 (+54.8%), while TPC increased only slightly in Row 1 (+4.0%) and decreased in Row 2 and Row 3. In S. rosmarinus, Row 1 showed the highest values for both TPC and FRAP, with increases of 56.7% and 65.5%, respectively, compared with the control. Overall, Row 1 showed the highest or near-highest antioxidant capacity in all species. As these values were obtained from a single essential oil sample per position, they indicate trends rather than statistically tested differences.
An exploratory PCA showed that, in all species, Row 1 was mainly associated with essential oil yield on a dry matter basis and antioxidant capacity, whereas the control was more closely related to dry matter content (Supplementary Figure S1).
3.5. Essential Oil Volatile Composition
The relative composition of the essential oils differed between the APV positions and the open-field control. Complete volatile profiles are reported in Supplementary Tables S1–S3, while selected markers are summarised in Table 8. In T. vulgaris, thymol was the dominant compound, ranging from 44.4 to 50.6%. The open-field control (50.61%) and Row 1 (49.66%) showed the highest relative abundances, whereas values were lower in Row 3 (44.43%) and Row 2 (44.71%). Conversely, the precursor monoterpenes p-cymene and γ-terpinene showed slightly higher relative abundances under APV conditions, reaching 18.87% and 11.55%, respectively, in Row 2. Carvacrol remained relatively stable across treatments, varying between 5.36 and 6.78%.
Table 8.
Selected volatile markers of essential oils according to plant position (relative abundance, %).
In S. officinalis, α-thujone and camphor were the main constituents. Relative abundances of α-thujone varied within a narrow range (24.57–26.35%), indicating limited effects of growing position on this compound. In contrast, 1,8-cineole increased under APV conditions, reaching approximately 19–20% compared with 14.68% in the control. Camphor showed the opposite trend, decreasing from 23.70% in the control to approximately 17.7–19.2% in the APV rows.
In S. rosmarinus, 1,8-cineole remained the predominant constituent irrespective of treatment, accounting for 60.6–65.7% of the volatile fraction. Relative α-pinene abundance increased markedly under APV conditions, rising from 2.75% in the control to approximately 9.6–10.2% in the APV rows. Conversely, camphor and 1,8-cineole showed slightly lower proportions under APV, whereas borneol remained substantially unchanged.
Thus, APV conditions induced species-specific shifts in the relative distribution of volatile compounds, mainly between the APV and open-field conditions rather than among APV positions. These shifts included an increase in α-pinene in S. Rosmarinus; an increase in 1,8-cineole and a reduction in camphor in S. officinalis; and a moderate decrease in thymol accompanied by higher proportions of its biosynthetic precursors in Row 2 and Row 3 of T. vulgaris. As each profile was obtained from a single essential oil sample per position, these differences are reported descriptively.
4. Discussion
4.1. Agrivoltaic Microclimate and Spatial Heterogeneity
The APV system primarily acted as a microclimatic moderator, reducing environmental stress conditions without substantially changing the average temperature regime. Mean air temperature under APV was only slightly lower than in the open field (−0.20 °C over the monitoring period), whereas the most evident thermal effect was on daily maximum temperatures, which were reduced by approximately 0.42 °C. Temperature differences between areas were small and of the same order as sensor accuracy, so the APV effect on air temperature appears limited compared with its effects on radiation, wind speed and evaporative demand, in agreement with previous studies describing APV systems as able to mitigate heat stress and atmospheric water demand [30,31,51]. The 17.7% reduction in solar radiation measured at 2 m height confirms the shading effect of the photovoltaic structure, although the geometric model indicates a considerably stronger reduction at crop level (Section 3.2). Reduced light availability can mitigate radiative and thermal stress in Mediterranean environments, but can also involve trade-offs in biomass production, phenology or product quality, depending on crop requirements and developmental stage [33,52,53,54]. Wind speed within the corridor was markedly lower than in the open field, indicating that the modules and supporting structures acted not only as shading elements, but also as physical barriers to air circulation within the cultivated corridor, as previously reported for PV structures [55,56]. The combined reduction in radiation and ventilation led to lower reference evapotranspiration, particularly during the months of highest atmospheric demand, supporting the interpretation that the APV system reduced evaporative pressure. However, the magnitude of these effects depends on system geometry, panel height, row spacing, orientation, ventilation and sensor position [30,31,36,57,58]. Consistently, soil water content was on average 19.2% higher under APV, with the largest differences in the thyme and sage corridors, suggesting improved soil moisture conservation. Nevertheless, the temporary summer reversal, with lower soil water content under APV between June and August, indicates that water dynamics were also influenced by rainfall interception, irrigation, evaporation, crop uptake and water redistribution beneath the panels. As the two areas had comparable soil properties, these differences can be mainly attributed to the microclimatic and hydrological effects induced by the APV structure [32].
The APV area did not behave as a uniformly shaded environment, but rather as a spatially heterogeneous system. The geometric model indicated that panel geometry, solar elevation and shadow movement created a mosaic of light microenvironments within the cultivated corridor, consistent with previous studies on the spatial and temporal variability of ground-level radiation and PAR in APV systems [34,35]. Row 1, located beneath the upper edge of the panels, was the most shaded position, whereas Row 3 received more direct radiation during the high sun months but a smaller share of diffuse radiation because of its proximity to the lower panel edge. The model also showed that radiation measured at 2 m height, close to the panel plane, substantially underestimates the shading experienced at crop level, where the estimated reduction in global radiation ranged from 60% to 80%. Although these values are likely upper bounds, since the model overestimated the reduction measured at the sensor position, the difference between sensor height and crop level remains substantial. This has practical implications for APV monitoring: sensors placed at standard meteorological height may not represent the light conditions of low-growing crops. This heterogeneity is particularly relevant for aromatic plants, as radiation influences both vegetative growth and secondary metabolite biosynthesis. Therefore, row position should be considered an agronomic factor capable of modulating yield and product quality under APV conditions [36,59,60,61], although in this study this could not be tested with replicated positions.
4.2. Plant Growth, Dry Matter and Essential Oil Response
Fresh biomass per plant was approximately three times higher under APV than in the open field in all species, despite a modelled reduction of 60–80% in global radiation at crop level. This difference should not be interpreted as direct stimulation of growth by shading. Both areas received the same irrigation schedule, but plants in the open field were exposed to full radiation, considerably higher wind speed and higher evaporative demand, and soil water content was lower for most of the monitoring period. Because irrigation input was identical, the higher soil water content under APV is itself part of the APV effect described here; the biomass difference should therefore be interpreted as the response to APV under equal water supply, not under equal water availability. Moreover, plant spacing and the water supplied per plant at each irrigation event (about 5 L) were the same in both areas, so the higher biomass under APV cannot be attributed to differences in water supply per plant or in plant spacing. These conditions are likely to have limited the establishment and growth of the young plants during their first year after transplanting, so that the biomass difference probably reflects the buffering of less favourable open-field conditions more than a positive effect of shading per se. As plant condition in the control area was not systematically documented, this interpretation remains to be verified, and the magnitude of the APV effect may differ once plants are fully established, when light limitation may become more relevant.
Dry matter content was markedly lower in Row 1 than at the other positions in all species. Shading can reduce the dry-to-fresh biomass ratio by increasing tissue water content [25,62,63], but the magnitude of the difference between Row 1 and Row 2, located 0.8 m apart and with comparable modelled radiation (−80% and −72%; Table 5), is difficult to explain by differences in tissue hydration alone. Field observations in S. officinalis instead indicate that a large part of the difference reflected the proportion of desiccated tissue in the harvested biomass: Row 1 plants remained largely green, whereas plants in Rows 2 and 3 carried a considerable amount of dead foliage. The causes of this within-corridor pattern could not be determined. The symptoms resemble cold injury, and the APV area recorded lower minimum temperatures and very low wind speed (Section 3.1). This contrasts with the nighttime warming often reported beneath PV modules [30], but calm conditions and exposure to the night sky are known to favour radiative cooling and cold-air accumulation near the ground [64], and ventilation within the corridor was strongly reduced [55]. As air temperature was measured only at 2 m height in the central strip, this hypothesis could not be tested at crop level. Differential water loss during the one to two days of storage before processing may also have contributed to the differences in dry matter content. Finally, because essential oil yield on a dry matter basis is calculated on total dry mass, it is sensitive to the composition of the harvested material. In Lamiaceae, essential oil is produced and stored mainly in leaf glandular trichomes [65]; if desiccated foliage and woody stems contained less oil than living leaves, for example, because of volatilisation from damaged trichomes, a higher proportion of such tissue would lower dry matter-based yields. The higher dry matter-based yield of Row 1 may therefore partly reflect a larger share of living, green tissue rather than a higher oil concentration in living tissue.
Essential oil yield on a dry matter basis was highest in Row 1 in all three species, with increases over the control of 69.2% in T. vulgaris, 19.4% in S. officinalis and 112.2% in S. rosmarinus. However, part of this increase reflects the lower dry matter content of Row 1: on a fresh weight basis, the increase was confirmed only in S. rosmarinus. When biomass and yield were combined, the estimated essential oil production per plant was higher under APV than in the control in all species, with the highest values in Row 3 for T. vulgaris and in Row 1 for S. rosmarinus, and similar values across positions in S. officinalis. This indicates that the effect of APV depends not only on the presence of shading, but on the combination of plant position, light availability, evaporative demand and species-specific physiological responses, and that actual oil productivity should be assessed by considering oil yield, biomass and plant density together. Milenković et al. (2021) [17] observed that modifying light intensity using shade nets can increase the essential oil yield of thyme, marjoram and oregano, improving certain quality parameters, and also reported a slightly higher oil yield in shaded sage plants; similarly, Lalević et al. (2023) [16] highlighted that shading can alter the yield, chemical composition and biological activity of essential oils in various Lamiaceae. The response observed in this study thus fits into a broader context in which essential oil production is regulated by multiple factors, including radiation, temperature, humidity, water status, genotype and phenological stage [66]. Jordán et al. (2009) [67] also showed that water regime modifies yield, oil quality, phenolic content and antioxidant activity in Thymus zygis, supporting the role of water status in the responses observed here.
4.3. Antioxidant Traits and Volatile Profile
The essential oils showed species-specific differences in total phenolic content and ferric reducing capacity, with Row 1 generally exhibiting values comparable to or higher than those of the control and other APV positions. In T. vulgaris, TPC was higher in Row 1 and Row 2 than in the control and Row 3, while FRAP was higher in all APV positions (+27.8% in Row 1). In S. officinalis, FRAP values were 78.8% and 54.8% higher in Row 1 and Row 2, respectively, than in the control, while TPC was only slightly higher in Row 1. In S. rosmarinus, Row 1 showed the highest values for both TPC and FRAP, with increases of 56.7% and 65.5%, respectively. These observations describe differences in the chemical properties of the extracted oils but do not establish whether reduced radiation or evaporative demand altered antioxidant-related biosynthetic pathways. These results suggest that reduced radiation and evaporative demand may support antioxidant-related metabolism, although the response was species-specific. The partial decoupling between TPC and FRAP, particularly evident in sage, suggests that the Folin–Ciocalteu response alone does not fully account for the variation in ferric reducing capacity. Differences in the identity and relative abundance of reactive constituents, together with the different response characteristics of the two assays, may contribute to this pattern. However, the compounds responsible for these responses were not specifically quantified, and their individual contributions cannot be resolved from the present data.
This interpretation agrees with previous studies showing that antioxidant assay responses in Lamiaceae depend on matrix composition, chemical profile, extraction method and assay type [68,69,70]. Moreover, interactions among essential oil constituents may contribute to the measured activity, as reported for thyme oils [66], although such interactions were not evaluated here. Given the single pooled oil sample analysed per species and position, these patterns remain descriptive and require confirmation through independent biological replication [71].
The volatile profiles differed mainly between APV and open-field conditions rather than among APV positions, indicating that APV affected not only oil quantity but also oil composition. In T. vulgaris, thymol remained the dominant constituent in all positions, confirming the preservation of the thymol chemotype. However, plants in Rows 2 and 3 showed a lower relative proportion of thymol, together with slightly higher relative proportions of γ-terpinene and p-cymene, whereas Row 1 was similar to the control. γ-Terpinene is the monoterpene precursor of thymol, whereas p-cymene is formed as a by-product of the same pathway [72]. One possible explanation is that the environmental conditions at these positions altered the balance between the precursor and the end product of the pathway, as light intensity has been reported to modify the volatile profile and gene expression in T. vulgaris [25] and to shift the composition of thyme oils under shading [17]. Differences in phenological stage among positions may also have contributed, as the composition and antioxidant activity of thyme essential oils vary with phenological stage and among Thymus species and chemotypes [66,73,74].
However, the observed differences were modest and derived from a single pooled sample per position, and neither biosynthetic activity nor pathway regulation was directly assessed. This interpretation therefore remains hypothetical and requires validation through independent biological replication and targeted analyses of gene expression and enzyme activity. In S. officinalis, APV plants showed a higher relative proportion of 1,8-cineole and a lower relative proportion of camphor than the control, whereas α-thujone and β-thujone varied within a relatively narrow range. This does not necessarily indicate an overall reduction in quality, but rather a change in chemical profile, with different implications depending on the intended use of the oil. Similar effects were reported by Milenković et al. (2021) [17], who observed that photoselective nets altered both essential oil yield and composition in sage, with cis-thujone, trans-thujone, camphor and 1,8-cineole among the main constituents. In S. rosmarinus, the most evident compositional differences between APV and the control were observed: although 1,8-cineole remained the dominant constituent, the relative proportion of α-pinene was more than three times higher under APV than in the control, while 1,8-cineole and camphor showed moderate decreases in relative abundance. The maintenance of 1,8-cineole, α-pinene and camphor as the main constituents [75,76] suggests that the characteristic rosemary chemotype was preserved, despite changes in the relative distribution of secondary metabolites.
Taken together, these results indicate that APV conditions primarily affected the balance among volatile constituents rather than the presence or absence of key marker compounds. As each essential oil profile was obtained from a single sample per position, these compositional differences should be confirmed with replicated analyses. Nevertheless, they indicate that APV conditions may shift oil composition in species-specific directions, with implications for the intended use of the oil.
4.4. Implications for Product-Oriented APV Management, Limitations and Future Perspectives
The species-specific patterns observed in this study suggest that Mediterranean aromatic crops may not respond as a functionally homogeneous group under APV conditions. At this site, the position was associated with higher dry matter-based oil yield and antioxidant capacity but with lower dry matter content, and the relative abundance of key volatile markers differed between APV and the open field. Row position within the APV corridor should therefore be considered not only as a source of microclimatic variability, but also as a potential management variable for orienting production toward different product objectives. For example, in the present system, the highest estimated oil production per plant was observed for rosemary, which was placed beneath the upper panel edge, and thyme beneath the lower panel edge, whereas sage showed similar values across the corridor. The monitoring framework made it possible to relate APV-induced environmental conditions to crop-specific responses and to distinguish species effects from position effects within the APV corridor, which radiation, temperature or oil yield measurements alone would not have allowed.
Some limitations should be considered when interpreting these results. First, this study compared a single APV installation with a single adjacent open-field area, with one corridor per species. Plants within each area and position are therefore subsamples rather than independent replicates, and differences between APV and control cannot be fully separated from other site-specific effects, although the two areas were adjacent, received the same management and had similar soil properties. Moreover, estimated essential oil production per plant was obtained by combining mean fresh biomass measured on individual plants at harvest with the oil yield determined from a single distillation of pooled material. This estimate assumes that the distilled portion adequately represents the composition and oil content of the pooled biomass. It does not capture variation in oil yield among individual plants or variability among independent distillations. These values should therefore be interpreted as sample-based estimates, and differences among positions require confirmation through independent biological sampling and replicated distillations.
Similarly, essential oil yield, dry matter, TPC, FRAP and volatile composition were determined on pooled material, with a single distillation per species and position. Oil volume was read with a resolution of 0.5 mL, corresponding to a reading uncertainty of about 5–7% for the smallest oil volumes obtained, which is not negligible relative to some of the differences in fresh-weight yield among positions. Dry matter was determined on two small aliquots of heterogeneous whole-plant material after one to two days of storage, which may have affected both absolute values and position-dependent differences, and consequently the dry-weight-based yields.
Third, microclimatic and soil moisture sensors were installed only in the central strip of each corridor, with one soil moisture sensor per corridor, and wind speed in the APV area was mostly below the starting threshold of the anemometer, which also affects the calculation of ET0. Radiation at crop level was therefore estimated with a two-dimensional geometric model which, at the sensor position, overestimated the measured reduction, so crop-level values should be regarded as upper bounds. Finally, the results refer to young plants, a single harvest and one growing cycle, and yields were expressed per plant rather than per unit area.
Future studies should include replicated APV corridors and control plots, multi-year observations with repeated harvests, row-level measurements of radiation (preferably PAR) and soil moisture, replicated distillations with gravimetric oil determination, dry matter determined on separate plant fractions immediately after harvest, and yield assessment per unit area combined with land equivalent ratio estimates. These data would make it possible to confirm the position-dependent responses observed here and to translate them into design and management guidelines for APV systems with high-value aromatic crops.
5. Conclusions
Focusing on aromatic Mediterranean species, which remain underrepresented in APV research, this exploratory single-site study described how a fixed-tilt APV system modified the crop environment and how crop traits differed between the APV corridor and an adjacent open field, and among positions within the corridor. Compared with the open field, the APV area was characterised mainly by lower incident radiation, strongly reduced ventilation and lower evaporative demand, rather than by substantial changes in mean air temperature, and by higher soil water content for most of the monitoring period under the same irrigation input. Integrated monitoring and geometric modelling indicated that the APV corridor is not a homogeneous environment, but rather a mosaic of light and microclimatic microenvironments, with radiation at crop level likely to be considerably lower than that measured at standard sensor height. Under these conditions, fresh biomass per plant was higher at all APV positions than in the open-field control in all species, a difference that probably reflects the buffering of less favourable open-field conditions during establishment rather than a direct effect of shading. Dry matter content, essential oil yield, total phenolic content and antioxidant capacity differed among positions. Row 1, the most shaded position, showed the highest essential oil yield on a dry matter basis, largely associated with a lower proportion of desiccated tissue in the harvested biomass, and the highest or near-highest antioxidant capacity in several species. Volatile composition differed mainly between APV and the open field, with species-specific shifts in the relative proportions of the main constituents while the chemotypes were preserved.
Because the APV and control areas and the positions within the corridor were not replicated, plants were subsampled within positions, and chemical traits were determined on single pooled samples, these differences are site-specific observations and cannot be attributed causally to APV shading or to plant position. They suggest, however, that APV may modify the balance among biomass, dry matter, oil yield and phytochemical quality in a species-specific way, and that crop position within the corridor may be a relevant design and management variable. This hypothesis should be tested in replicated, multi-year experiments, with replicated distillations, row-level radiation and soil moisture measurements and yield assessment per unit area, before it can inform crop placement in APV systems with high-value aromatic crops.
Supplementary Materials
The following supporting information can be downloaded at https://www.mdpi.com/article/10.3390/agriengineering8110469/s1, Figure S1: Principal component analysis of dry matter, essential oil yield, TPC and FRAP; Table S1: Complete GC-MS profile of Thymus vulgaris essential oil according to plant position; Table S2: Complete GC-MS profile of Salvia officinalis essential oil according to plant position; Table S3: Complete GC-MS profile of Salvia rosmarinus essential oil according to plant position; Table S4: Soil properties in the APV and open-field control areas. Physical, chemical and biological soil properties in the APV and open-field control areas (composite samples, 0–20 cm, May 2024).
Author Contributions
Conceptualization, G.D.D., V.D.S., L.B. and A.C.; methodology, G.D.D., D.D.S., S.F. and M.M.; validation, D.D.S., S.F., M.M. and A.C.; formal analysis, D.D.S., S.F. and M.M.; investigation, G.D.D., D.D.S., A.R., S.F. and M.M.; data curation, G.D.D., A.R., S.F. and M.M.; writing—original draft preparation, G.D.D.; writing—review and editing, G.D.D., D.D.S., S.F., M.M., V.D.S., L.B. and A.C.; visualization, V.D.S. and L.B.; supervision, D.D.S. and A.C.; project administration, A.C. All authors have read and agreed to the published version of the manuscript.
Funding
This research received no external funding.
Institutional Review Board Statement
Not applicable.
Informed Consent Statement
Not applicable.
Data Availability Statement
The data that support the findings of this study are available from the corresponding author upon reasonable request.
Acknowledgments
During the preparation of this manuscript, the authors used ChatGPT 6.1 for the purposes of generating illustrative icons incorporated into the Graphical Abstract. The authors have reviewed and edited the output and take full responsibility for the content of this publication.
Conflicts of Interest
The authors declare no conflicts of interest.
References
- Dinesh, H.; Pearce, J.M. The Potential of Agrivoltaic Systems. Renew. Sustain. Energy Rev. 2016, 54, 299–308. [Google Scholar] [CrossRef] [Scilit]
- Trommsdorff, M.; Kang, J.; Reise, C.; Schindele, S.; Bopp, G.; Ehmann, A.; Weselek, A.; Högy, P.; Obergfell, T. Combining Food and Energy Production: Design of an Agrivoltaic System Applied in Arable and Vegetable Farming in Germany. Renew. Sustain. Energy Rev. 2021, 140, 110694. [Google Scholar] [CrossRef] [Scilit]
- Goetzberger, A.; Zastrow, A. On the Coexistence of Solar-Energy Conversion and Plant Cultivation. Int. J. Sol. Energy 1982, 1, 55–69. [Google Scholar] [CrossRef] [Scilit]
- Ahmed, R.; Izaz, M.H.B.; Manik, K.H.; Khatun, H.; Nath, A.; Mim, J.J.; Hossain, N. Advancements in Agrivoltaic Systems for Enhanced Sustainable Energy Utilization: A Review. Environ. Chall. 2025, 20, 101299. [Google Scholar] [CrossRef] [Scilit]
- Chae, S.-H.; Kim, H.-W.; Moon, Y.-H.; Kim, K.-M.; Ku, H. Agrivoltaic Systems Enhance Farmers’ Profits through Broccoli Visual Quality and Electricity Production without Dramatic Changes in Yield, Antioxidant Capacity, and Glucosinolates. Agronomy 2022, 12, 1415. [Google Scholar] [CrossRef] [Scilit]
- Wagner, J.; Bühner, C.; Gölz, S.; Trommsdorff, M.; Jürkenbeck, K. Factors Influencing the Willingness to Use Agrivoltaics: A Quantitative Study among German Farmers. Appl. Energy 2024, 361, 122934. [Google Scholar] [CrossRef] [Scilit]
- Di Domenico, G.; Colantoni, A.; Bianchini, L.; Cecchini, M.; Gallucci, F.; Di Stefano, V. Agrivoltaics Systems Potentials in Italy: State of the Art and SWOT–AHP Analysis. Sustainability 2025, 17, 925. [Google Scholar] [CrossRef] [Scilit]
- Johnson, B.A.; Arino, Y.; Magcale-Macandog, D.B.; Liu, X.; Yamanoshita, M. Potential of Agrivoltaics in ASEAN Considering a Scenario Where Agroforestry Expansion Is Also Pursued. Resour. Conserv. Recycl. 2024, 209, 107808. [Google Scholar] [CrossRef] [Scilit]
- Widmer, J.; Weselek, A.; Ehmann, A.; Schindele, S.; Högy, P.; Obergfell, T. Agrivoltaics-A Promising Approach to Combine Crop Production and Renewable Energy Generation: A Review. Renew. Sustain. Energy Rev. 2024, 189, 113887. [Google Scholar] [CrossRef] [Scilit]
- Bonini, P.; Dias, C.W.S.; Giordano, L.; Magnanini, E.; Poni, S. Exploring the Interaction between Radiation Availability and Grapevine Canopy Physiology across Different Agrivoltaics Configurations. Environ. Exp. Bot. 2026, 247, 106377. [Google Scholar] [CrossRef] [Scilit]
- Cossu, M.; Tiloca, M.T.; Cossu, A.; Deligios, P.A.; Pala, T.; Ledda, L. Increasing the Agricultural Sustainability of Closed Agrivoltaic Systems with the Integration of Vertical Farming: A Case Study on Baby-Leaf Lettuce. Appl. Energy 2023, 344, 121278. [Google Scholar] [CrossRef] [Scilit]
- Dal Prà, A.; Dainelli, R.; Santoni, M.; Lanini, G.M.; Di Serio, A.; Zanotti, D.; Greco, A.; Ronga, D. Impact of Different Shading Conditions on Processing Tomato Yield and Quality Under Organic Agrivoltaic Systems. Horticulturae 2025, 11, 319. [Google Scholar] [CrossRef] [Scilit]
- Jamil, U.; Pearce, J.M. Experimental Impacts of Transparency on Strawberry Agrivoltaics Using Thin-Film Photovoltaic Modules under Low-Light Conditions. Sol. Energy 2025, 290, 113375. [Google Scholar] [CrossRef] [Scilit]
- Livera, A.; Lodolini, E.M.; Saraginovski, N.; Crescenzi, S.; Neri, D.; Manganaris, G.A. Current Trends and Challenges of Agrivoltaic Systems towards Sustainable Production of Temperate Fruit Crops under Intensive Orchard Setups. Sci. Hortic. 2025, 348, 114210. [Google Scholar] [CrossRef] [Scilit]
- Dupraz, C.; Marrou, H.; Talbot, G.; Dufour, L.; Nogier, A.; Ferard, Y. Combining Solar Photovoltaic Panels and Food Crops for Optimising Land Use: Towards New Agrivoltaic Schemes. Renew. Energy 2011, 36, 2725–2732. [Google Scholar] [CrossRef] [Scilit]
- Lalević, D.; Ilić, Z.S.; Stanojević, L.; Milenković, L.; Šunić, L.; Kovač, R. Shade-Induced Effects on Essential Oil Yield, Chemical Profiling, and Biological Activity in Some Lamiaceae Plants Cultivated in Serbia. Horticulturae 2023, 9, 84. [Google Scholar] [CrossRef] [Scilit]
- Milenković, L.; Ilić, S.Z.; Šunić, L.J.; Tmušić, N.; Stanojević, L.J.; Cvetković, D. Modification of Light Intensity Influence Essential Oils Content, Composition and Antioxidant Activity of Thyme, Marjoram and Oregano. Saudi J. Biol. Sci. 2021, 28, 6532–6543. [Google Scholar] [CrossRef] [Scilit] [PubMed]
- Asa’a, S.; Reher, T.; Rongé, J.; Diels, J.; Poortmans, J.; Radhakrishnan, H.S.; van der Heide, A.; Van de Poel, B.; Daenen, M. A Multidisciplinary View on Agrivoltaics: Future of Energy and Agriculture. Renew. Sustain. Energy Rev. 2024, 200, 114515. [Google Scholar] [CrossRef] [Scilit]
- Chalgynbayeva, A.; Gabnai, Z.; Lengyel, P.; Pestisha, A.; Bai, A. Worldwide Research Trends in Agrivoltaic Systems: A Bibliometric Review. Energies 2023, 16, 611. [Google Scholar] [CrossRef] [Scilit]
- Ukwu, U.N.; Muller, O.; Meier-Gruell, M.; Uguru, M.I. Yield Sensitivity of Mungbean (Vigna Radiata L.) Genotypes to Different Agrivoltaic Environments in Tropical Nigeria. Plants 2025, 14, 1326. [Google Scholar] [CrossRef] [Scilit] [PubMed]
- Şeker, S.; Çakaloğulları, U.; Bayram, E.; Tatar, Ö. Production of Sage, Oregano and Rosemary under Shading Conditions and the Effects of Light on Growth and Essential Oil Properties. Ind. Crops Prod. 2023, 193, 116254. [Google Scholar] [CrossRef] [Scilit]
- Ilić, Z.S.; Milenković, L.; Tmušić, N.; Stanojević, L.; Stanojević, J.; Cvetković, D. Essential Oils Content, Composition and Antioxidant Activity of Lemon Balm, Mint and Sweet Basil from Serbia. LWT 2022, 153, 112210. [Google Scholar] [CrossRef] [Scilit]
- Russo, M.; Honermeier, B. Effect of Shading on Leaf Yield, Plant Parameters, and Essential Oil Content of Lemon Balm (Melissa Officinalis L.). J. Appl. Res. Med. Aromat. Plants 2017, 7, 27–34. [Google Scholar] [CrossRef] [Scilit]
- Milenković, L.; Ilić, Z.S.; Stanojević, L.; Šunić, L.; Milenković, A.; Tmušić, N.; Lalević, D.; Stanojević, J.; Cvetković, D.; Kevrešan, Ž. Influence of Shading on Essential Oil Quantity and Quality of Sage (Salvia Officinalis L.) at Different Harvest Times. Plants 2026, 15, 1711. [Google Scholar] [CrossRef] [Scilit] [PubMed]
- Hashemifar, Z.; Sanjarian, F.; Naghdi Badi, H.; Mehrafarin, A. Impact of Varying Light Intensities on Morphology, Phytochemistry, Volatile Compounds, and Gene Expression in Thymus Vulgaris L. PLoS ONE 2025, 20, e0317840. [Google Scholar] [CrossRef] [Scilit] [PubMed]
- Chrysargyris, A. It Runs in the Family: The Importance of the Lamiaceae Family Species. Agronomy 2024, 14, 1274. [Google Scholar] [CrossRef] [Scilit]
- Disciglio, G.; Frabboni, L.; Tarantino, A.; Stasi, A. Association between Dynamic Agrivoltaic System and Cultivation: Viability, Yields and Qualitative Assessment of Medical Plants. Sustainability 2023, 15, 16252. [Google Scholar] [CrossRef] [Scilit]
- Selmar, D.; Kleinwächter, M. Stress Enhances the Synthesis of Secondary Plant Products: The Impact of Stress-Related Over-Reduction on the Accumulation of Natural Products. Plant Cell Physiol. 2013, 54, 817–826. [Google Scholar] [CrossRef] [Scilit] [PubMed]
- Touil, S.; Richa, A.; Fizir, M.; Bingwa, B. Shading Effect of Photovoltaic Panels on Horticulture Crops Production: A Mini Review. Rev. Environ. Sci. Biotechnol. 2021, 20, 281–296. [Google Scholar] [CrossRef] [Scilit]
- Barron-Gafford, G.A.; Pavao-Zuckerman, M.A.; Minor, R.L.; Sutter, L.F.; Barnett-Moreno, I.; Blackett, D.T.; Thompson, M.; Dimond, K.; Gerlak, A.K.; Nabhan, G.P.; et al. Agrivoltaics Provide Mutual Benefits across the Food–Energy–Water Nexus in Drylands. Nat. Sustain. 2019, 2, 848–855. [Google Scholar] [CrossRef] [Scilit]
- Marrou, H.; Dufour, L.; Wery, J. How Does a Shelter of Solar Panels Influence Water Flows in a Soil-Crop System? Eur. J. Agron. 2013, 50, 38–51. [Google Scholar] [CrossRef] [Scilit]
- Weselek, A.; Bauerle, A.; Hartung, J.; Zikeli, S.; Lewandowski, I.; Högy, P. Agrivoltaic System Impacts on Microclimate and Yield of Different Crops within an Organic Crop Rotation in a Temperate Climate. Agron. Sustain. Dev. 2021, 41, 59. [Google Scholar] [CrossRef] [Scilit]
- Dupraz, C. Assessment of the Ground Coverage Ratio of Agrivoltaic Systems as a Proxy for Potential Crop Productivity. Agrofor. Syst. 2024, 98, 2679–2696. [Google Scholar] [CrossRef] [Scilit]
- Pulido-Mancebo, J.S.; López-Luque, R.; Fernández-Ahumada, L.M.; Ramírez-Faz, J.C.; Gómez-Uceda, F.J.; Varo-Martínez, M. Spatial Distribution Model of Solar Radiation for Agrivoltaic Land Use in Fixed PV Plants. Agronomy 2022, 12, 2799. [Google Scholar] [CrossRef] [Scilit]
- Tahir, Z.; Butt, N.Z. Implications of Spatial-Temporal Shading in Agrivoltaics under Fixed Tilt & Tracking Bifacial Photovoltaic Panels. Renew. Energy 2022, 190, 167–176. [Google Scholar] [CrossRef] [Scilit]
- Zainali, S.; Ma Lu, S.; Stridh, B.; Avelin, A.; Amaducci, S.; Colauzzi, M.; Campana, P.E. Direct and Diffuse Shading Factors Modelling for the Most Representative Agrivoltaic System Layouts. Appl. Energy 2023, 339, 120981. [Google Scholar] [CrossRef] [Scilit]
- Di Vita, G.; Spina, D.; De Cianni, R.; Carbone, R.; D’Amico, M.; Zanchini, R. Enhancing the Extended Value Chain of the Aromatic Plant Sector in Italy: A Multiple Correspondence Analysis Based on Stakeholders’ Opinions. Agric. Food Econ. 2023, 11, 15. [Google Scholar] [CrossRef] [Scilit]
- Macaluso, D.; Licciardo, F.; Carbone, K. Farming of Medicinal and Aromatic Plants in Italy: Structural Features and Economic Results. Agriculture 2024, 14, 151. [Google Scholar] [CrossRef] [Scilit]
- Spina, D.; Barbieri, C.; Carbone, R.; Hamam, M.; D’Amico, M.; Di Vita, G. Market Trends of Medicinal and Aromatic Plants in Italy: Future Scenarios Based on the Delphi Method. Agronomy 2023, 13, 1703. [Google Scholar] [CrossRef] [Scilit]
- Di Domenico, G.; Rossi, P.; Magadley, E.; Colantoni, A. Monitoring Agrivoltaic Systems: A Scoping Review of Sensing Architectures and Cost-Complexity Trade-Offs. Smart Agric. Technol. 2026, 14, 102121. [Google Scholar] [CrossRef] [Scilit]
- Allen, R.G.; Pereira, L.S.; Raes, D. Crop Evapotranspiration (Guidelines for Computing Crop Water Requirements); FAO: Rome, Italy, 1998. [Google Scholar]
- Meeus, J. Astronomical Algorithms, 2nd ed.; Willmann-Bell, Inc.: Richmond, VA, USA, 1998. [Google Scholar]
- Meinel, A.B. Applied Solar Energy: An Introduction; Addison-Wesley Publishing Company, Inc.: Reading, MA, USA, 1976. [Google Scholar]
- Kasten, F.; Young, A.T. Revised Optical Air Mass Tables and Approximation Formula. Appl. Opt. 1989, 28, 4735–4738. [Google Scholar] [CrossRef] [Scilit] [PubMed]
- van Den Dool, H.; Kratz, P.D. A Generalization of the Retention Index System Including Linear Temperature Programmed Gas—Liquid Partition Chromatography. J. Chromatogr. A 1963, 11, 463–471. [Google Scholar] [CrossRef] [Scilit] [PubMed]
- Adams, R. Identification of Essential Oil Components by Gas Chromatography/Quadrupole Mass Spectroscopy. J. Am. Soc. Mass Spectrom. 2005, 16, 65–120. [Google Scholar] [CrossRef] [Scilit]
- Gharib, F.; Teixeira da Silva, J. Composition, Total Phenolic Content and Antioxidant Activity of the Essential Oil of Four Lamiaceae Herbs. Med. Aromat. Plant Sci. Biotechnol. 2013, 7, 19–27. [Google Scholar]
- Singleton, V.L.; Orthofer, R.; Lamuela-Raventos, R.M. Analysis of Total Phenols and Other Oxidation Substrates and Antioxidants by Means of Folin-Ciocalteau Reagent. Methods Enzymol. 1999, 299, 152–178. [Google Scholar] [CrossRef] [Scilit]
- Benzie, I.F.F.; Strain, J.J. Ferric Reducing/Antioxidant Power Assay: Direct Measure of Total Antioxidant Activity of Biological Fluids and Modified Version for Simultaneous Measurement of Total Antioxidant Power and Ascorbic Acid Concentration. Methods Enzymol. 1999, 299, 15–27. [Google Scholar] [CrossRef] [Scilit] [PubMed]
- Virtanen, P.; Gommers, R.; Oliphant, T.E.; Haberland, M.; Reddy, T.; Cournapeau, D.; Burovski, E.; Peterson, P.; Weckesser, W.; Bright, J.; et al. SciPy 1.0: Fundamental Algorithms for Scientific Computing in Python. Nat. Methods 2020, 17, 261–272. [Google Scholar] [CrossRef] [Scilit] [PubMed]
- Thum, C.H.; Okada, K.; Yamasaki, Y.; Kato, Y. Impacts of Agrivoltaic Systems on Microclimate, Grain Yield, and Quality of Lowland Rice under a Temperate Climate. Field Crops Res. 2025, 326, 109877. [Google Scholar] [CrossRef] [Scilit]
- Lopez, G.; Pasquali, A.; Hitte, V.; Lesniak, V.; Bregeon, M.; Persello, S.; Juillion, P.; Chopard, J.; Fumey, D. Sun Protection for Fruit: Dynamic Agrivoltaics Reduces Apple Temperature and Sunburn Damage. AgriVoltaics Conf. Proc. 2025, 3. [Google Scholar] [CrossRef] [Scilit]
- Reher, T.; Willockx, B.; Schenk, A.; Bisschop, J.; Huyghe, Y.; Nicolaï, B.M.; Martens, J.A.; Diels, J.; Cappelle, J.; Van de Poel, B. Agrivoltaic Cultivation of Pears under Semi-Transparent Panels Reduces Yield Consistently and Maintains Fruit Quality in Belgium. Agron. Sustain. Dev. 2025, 45, 25. [Google Scholar] [CrossRef] [Scilit]
- Scalisi, A.; McClymont, L.; Peavey, M.; Goodwin, I. Long-Term Effects of Agrivoltaics on Yield and Fruit Quality Performance of Bi-Color (Blush) Pears. Sci. Hortic. 2026, 357, 114663. [Google Scholar] [CrossRef] [Scilit]
- Hassanpour Adeh, E.; Selker, J.S.; Higgins, C.W. Remarkable Agrivoltaic Influence on Soil Moisture, Micrometeorology and Water-Use Efficiency. PLoS ONE 2018, 13, e0203256. [Google Scholar] [CrossRef] [Scilit] [PubMed]
- Rahimi Jahangirlou, M.; Pullens, J.W.M.; Lindhardt, M.K.K.; El Khoury, Y.V.; Antoniuk, V.; Manevski, K.; Ottosen, C.O.; Jørgensen, U. Agrivoltaic Systems: Trade-Offs on Microclimate, Physiology, Yield and Canopy Thermal-Spectral Maps. Agric. Syst. 2026, 232, 104557. [Google Scholar] [CrossRef] [Scilit]
- Fagnano, M.; Fiorentino, N.; Visconti, D.; Baldi, G.M.; Falce, M.; Acutis, M.; Genovese, M.; Di Blasi, M. Effects of a Photovoltaic Plant on Microclimate and Crops’ Growth in a Mediterranean Area. Agronomy 2024, 14, 466. [Google Scholar] [CrossRef] [Scilit]
- Ramos-Fuentes, I.A.; Elamri, Y.; Cheviron, B.; Dejean, C.; Belaud, G.; Fumey, D. Effects of Shade and Deficit Irrigation on Maize Growth and Development in Fixed and Dynamic AgriVoltaic Systems. Agric. Water Manag. 2023, 280, 108187. [Google Scholar] [CrossRef] [Scilit]
- Doubleday, K.; Oleskewicz, K.; Ovaitt, S.; Hickey, T.; Herbert, S.J.; Macknick, J. Impacts of Year-to-Year Weather Variability and Inter-Panel Spacing on Agrivoltaic Crop Yields in Massachusetts. Agrofor. Syst. 2025, 99, 152. [Google Scholar] [CrossRef] [Scilit]
- Moretta, M.; Moriondo, M.; Leolini, L.; Padovan, G.; Staglianó, N.; Palchetti, E.; Lanini, G.M.; Bindi, M.; Rossi, R. Towards Crop Monitoring in Agro-Photovoltaic Systems: An Image-Driven Modeling Approach for FAPAR-Derived Biomass Estimation. Eur. J. Agron. 2025, 170, 127748. [Google Scholar] [CrossRef] [Scilit]
- Prakash, V.; Lunagaria, M.M.; Trivedi, A.P.; Upadhyaya, A.; Kumar, R.; Das, A.; Gupta, A.K.; Kumar, Y. Shading and PAR under Different Density Agrivoltaic Systems, Their Simulation and Effect on Wheat Productivity. Eur. J. Agron. 2023, 149, 126922. [Google Scholar] [CrossRef] [Scilit]
- Laub, M.; Pataczek, L.; Feuerbacher, A.; Zikeli, S.; Högy, P. Contrasting Yield Responses at Varying Levels of Shade Suggest Different Suitability of Crops for Dual Land-Use Systems: A Meta-Analysis. Agron. Sustain. Dev. 2022, 42, 51. [Google Scholar] [CrossRef] [Scilit]
- Sun, H.; Li, W.; Liang, Y.; Li, G. Shading Stress at Different Grain Filling Stages Affects Dry Matter and Nitrogen Accumulation and Remobilization in Fresh Waxy Maize. Plants 2023, 12, 1742. [Google Scholar] [CrossRef] [Scilit] [PubMed]
- Snyder, R.L.; Melo-Abreu, J.P.d. Frost Protection: Fundamentals, Practice and Economics; Food and Agriculture Organization of the United Nations: Rome, Italy, 2005. [Google Scholar]
- Venkatachalam, C.D.; Sekar, S.; Sengottian, M.; Ravichandran, S.R.; Bhuvaneshwaran, P. A Critical Review of the Production, Activation, and Morphological Characteristic Study on Functionalized Biochar. J. Energy Storage 2023, 67, 107525. [Google Scholar] [CrossRef] [Scilit]
- Tohidi, B.; Rahimmalek, M.; Arzani, A. Essential Oil Composition, Total Phenolic, Flavonoid Contents, and Antioxidant Activity of Thymus Species Collected from Different Regions of Iran. Food Chem. 2017, 220, 153–161. [Google Scholar] [CrossRef] [Scilit] [PubMed]
- Jordán, M.; Martínez, R.; Conesa, C.; Moñino, I.; Sotomayor, J. Polyphenolic Extract and Essential Oil Quality of Thymus Zygis Ssp. Gracilis Shrubs Cultivated under Different Watering Levels. Ind. Crops Prod. 2009, 29, 145–153. [Google Scholar] [CrossRef] [Scilit]
- Ulewicz-Magulska, B.; Wesolowski, M. Antioxidant Activity of Medicinal Herbs and Spices from Plants of the Lamiaceae, Apiaceae and Asteraceae Families: Chemometric Interpretation of the Data. Antioxidants 2023, 12, 2039. [Google Scholar] [CrossRef] [Scilit] [PubMed]
- Vergun, O.; Svidenko, L.; Grygorieva, O.; Horčinová Sedláčková, V.; Fatrcová Šramková, K.; Ivanišová, E.; Brindza, J. Polyphenol Components and Antioxidant Activity of Thymus Spp. Potravin. Slovak J. Food Sci. 2022, 16, 1–14. [Google Scholar] [CrossRef] [Scilit] [PubMed]
- Walasek-Janusz, M.; Papliński, R.; Mysiak, B.; Nurzyńska-Wierdak, R. Phenolic Profile and Antioxidant Activity of Extracts from Aerial Parts of Thymus Vulgaris L. and Sideritis Scardica Griseb. Appl. Sci. 2025, 15, 3842. [Google Scholar] [CrossRef] [Scilit]
- Pandur, E.; Micalizzi, G.; Mondello, L.; Horváth, A.; Sipos, K.; Horváth, G. Antioxidant and Anti-Inflammatory Effects of Thyme (Thymus Vulgaris L.) Essential Oils Prepared at Different Plant Phenophases on Pseudomonas Aeruginosa LPS-Activated THP-1 Macrophages. Antioxidants 2022, 11, 1330. [Google Scholar] [CrossRef] [Scilit] [PubMed]
- Krause, S.T.; Liao, P.; Crocoll, C.; Boachon, B.; Förster, C.; Leidecker, F.; Wiese, N.; Zhao, D.; Wood, J.C.; Buell, C.R.; et al. The Biosynthesis of Thymol, Carvacrol, and Thymohydroquinone in Lamiaceae Proceeds via Cytochrome P450s and a Short-Chain Dehydrogenase. Proc. Natl. Acad. Sci. USA 2021, 118, e2110092118. [Google Scholar] [CrossRef] [Scilit] [PubMed]
- Blanco Salas, J.; Ruiz Téllez, T.; Vázquez Pardo, F.M.; Cases Capdevila, M.A.; Pérez-Alonso, M.J.; Gervasini Rodríguez, C. Short Communication. Influence of Phenological Stage on the Antioxidant Activity of Thymus Zygis s. l. Essential Oil. Span. J. Agric. Res. 2012, 10, 461–465. [Google Scholar] [CrossRef] [Scilit]
- Nikolic, M.; Glamoclija, J.; Ferreira, I.; Calhelha, R.; Fernandes, A.; Marković, T.; Marković, D.; Giweli, A.; Soković, M. Chemical Composition, Antimicrobial, Antioxidant and Antitumor Activity of Thymus Serpyllum L., Thymus Algeriensis Boiss. and Reut and Thymus Vulgaris L. Essential Oils. Ind. Crops Prod. 2013, 52, 183–190. [Google Scholar] [CrossRef] [Scilit]
- Pintore, G.; Usai, M.; Bradesi, P.; Juliano, C.; Boatto, G.; Tomi, F.; Chessa, M.; Cerri, R.; Casanova, J. Chemical Composition and Antimicrobial Activity of Rosmarinus Officinalis L. Oils from Sardinia and Corsica. Flavour Fragr. J. 2002, 17, 15–19. [Google Scholar] [CrossRef] [Scilit]
- Rocha-Pimienta, J.; Espino, J.; Martillanes, S.; Delgado-Adámez, J. Essential Oils as Nature’s Dual Powerhouses for Agroindustry and Medicine: Volatile Composition and Bioactivities-Antioxidant, Antimicrobial, and Cytotoxic. Separations 2025, 12, 145. [Google Scholar] [CrossRef] [Scilit]
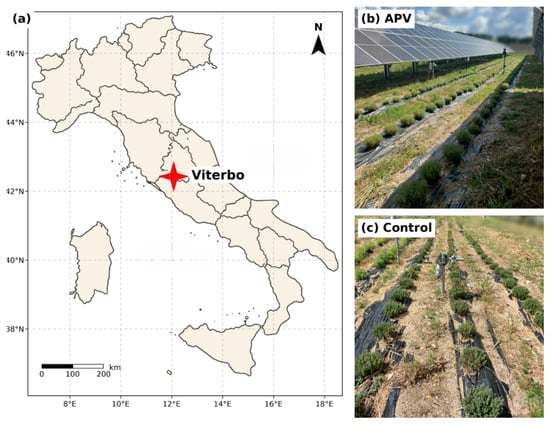
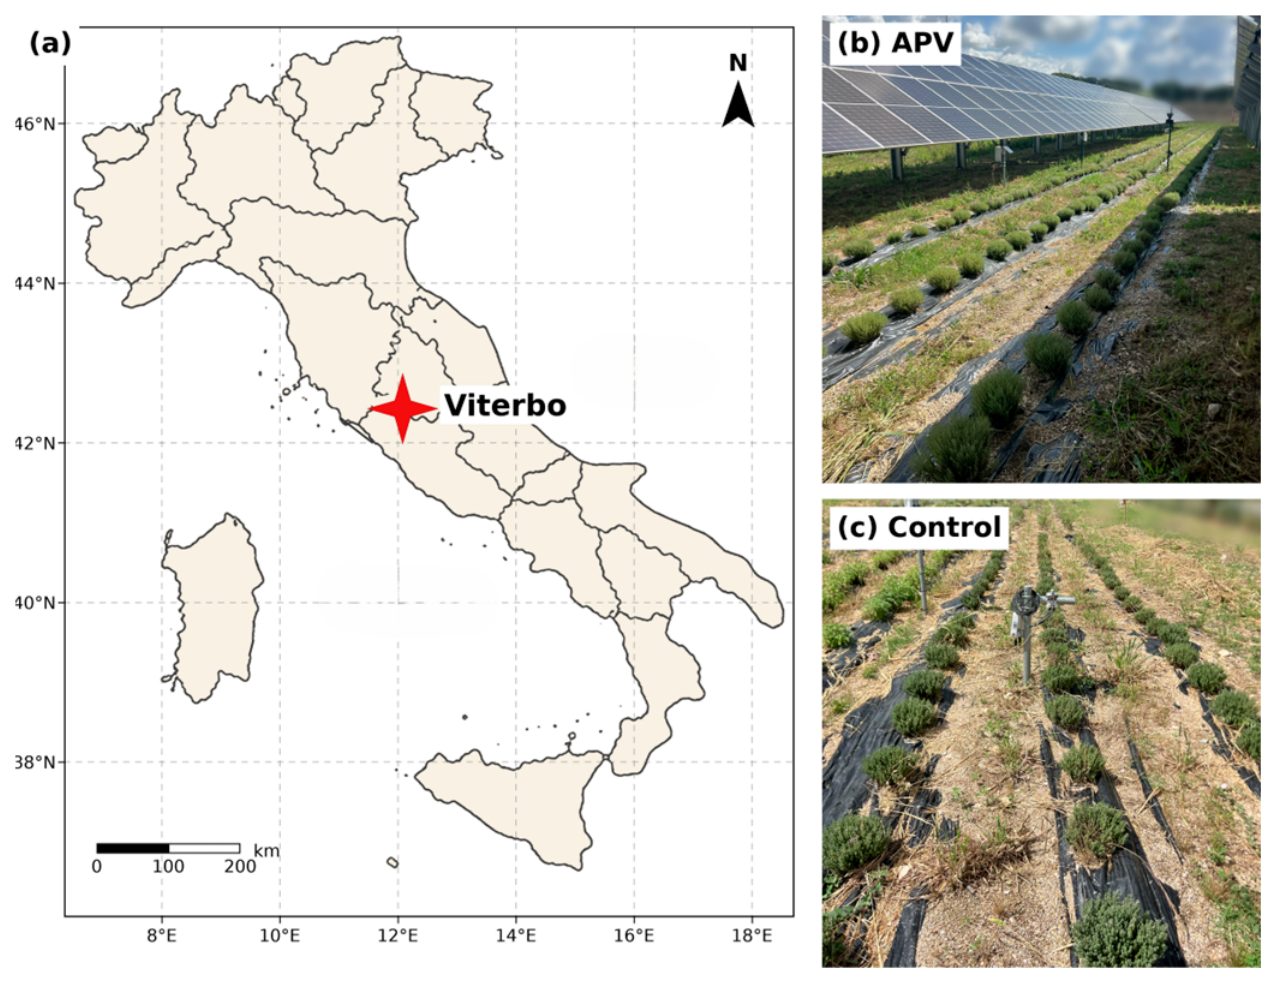
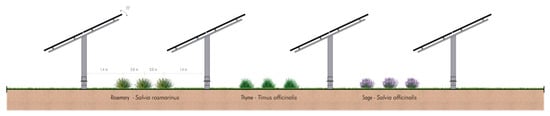
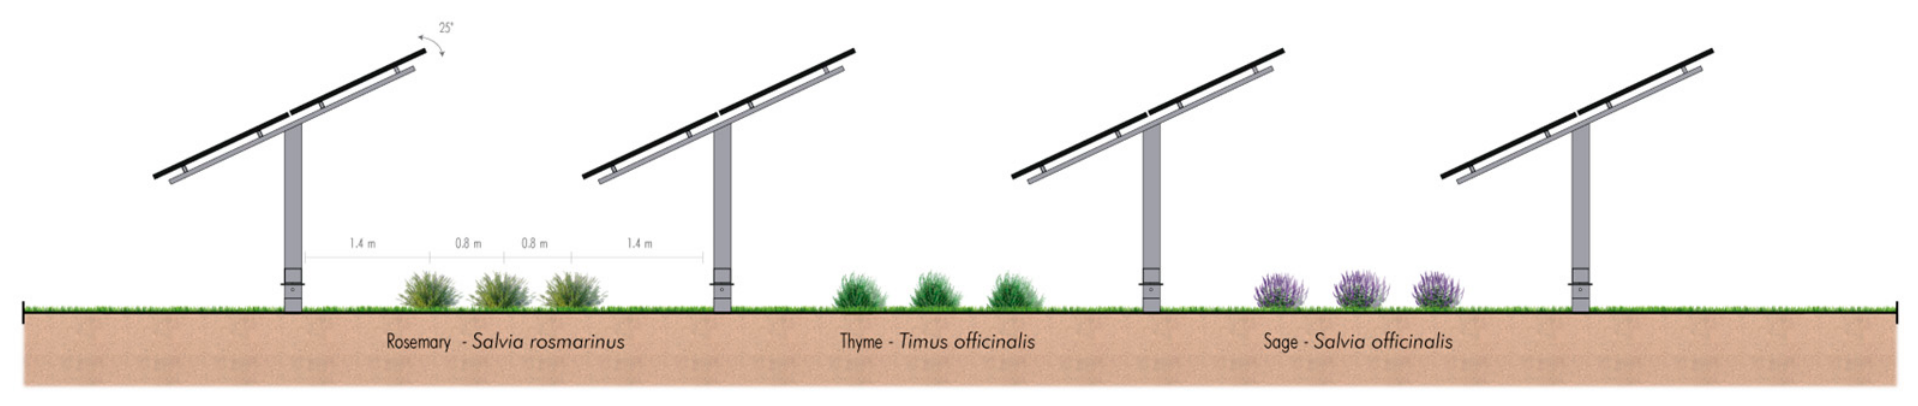
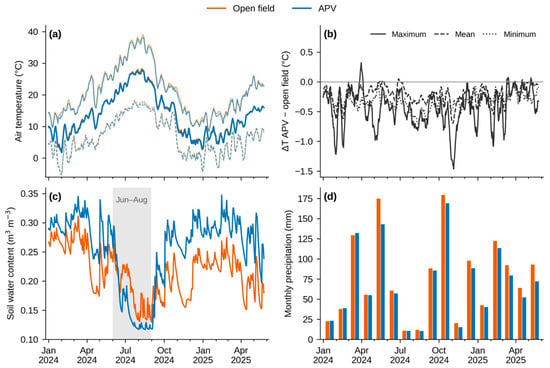
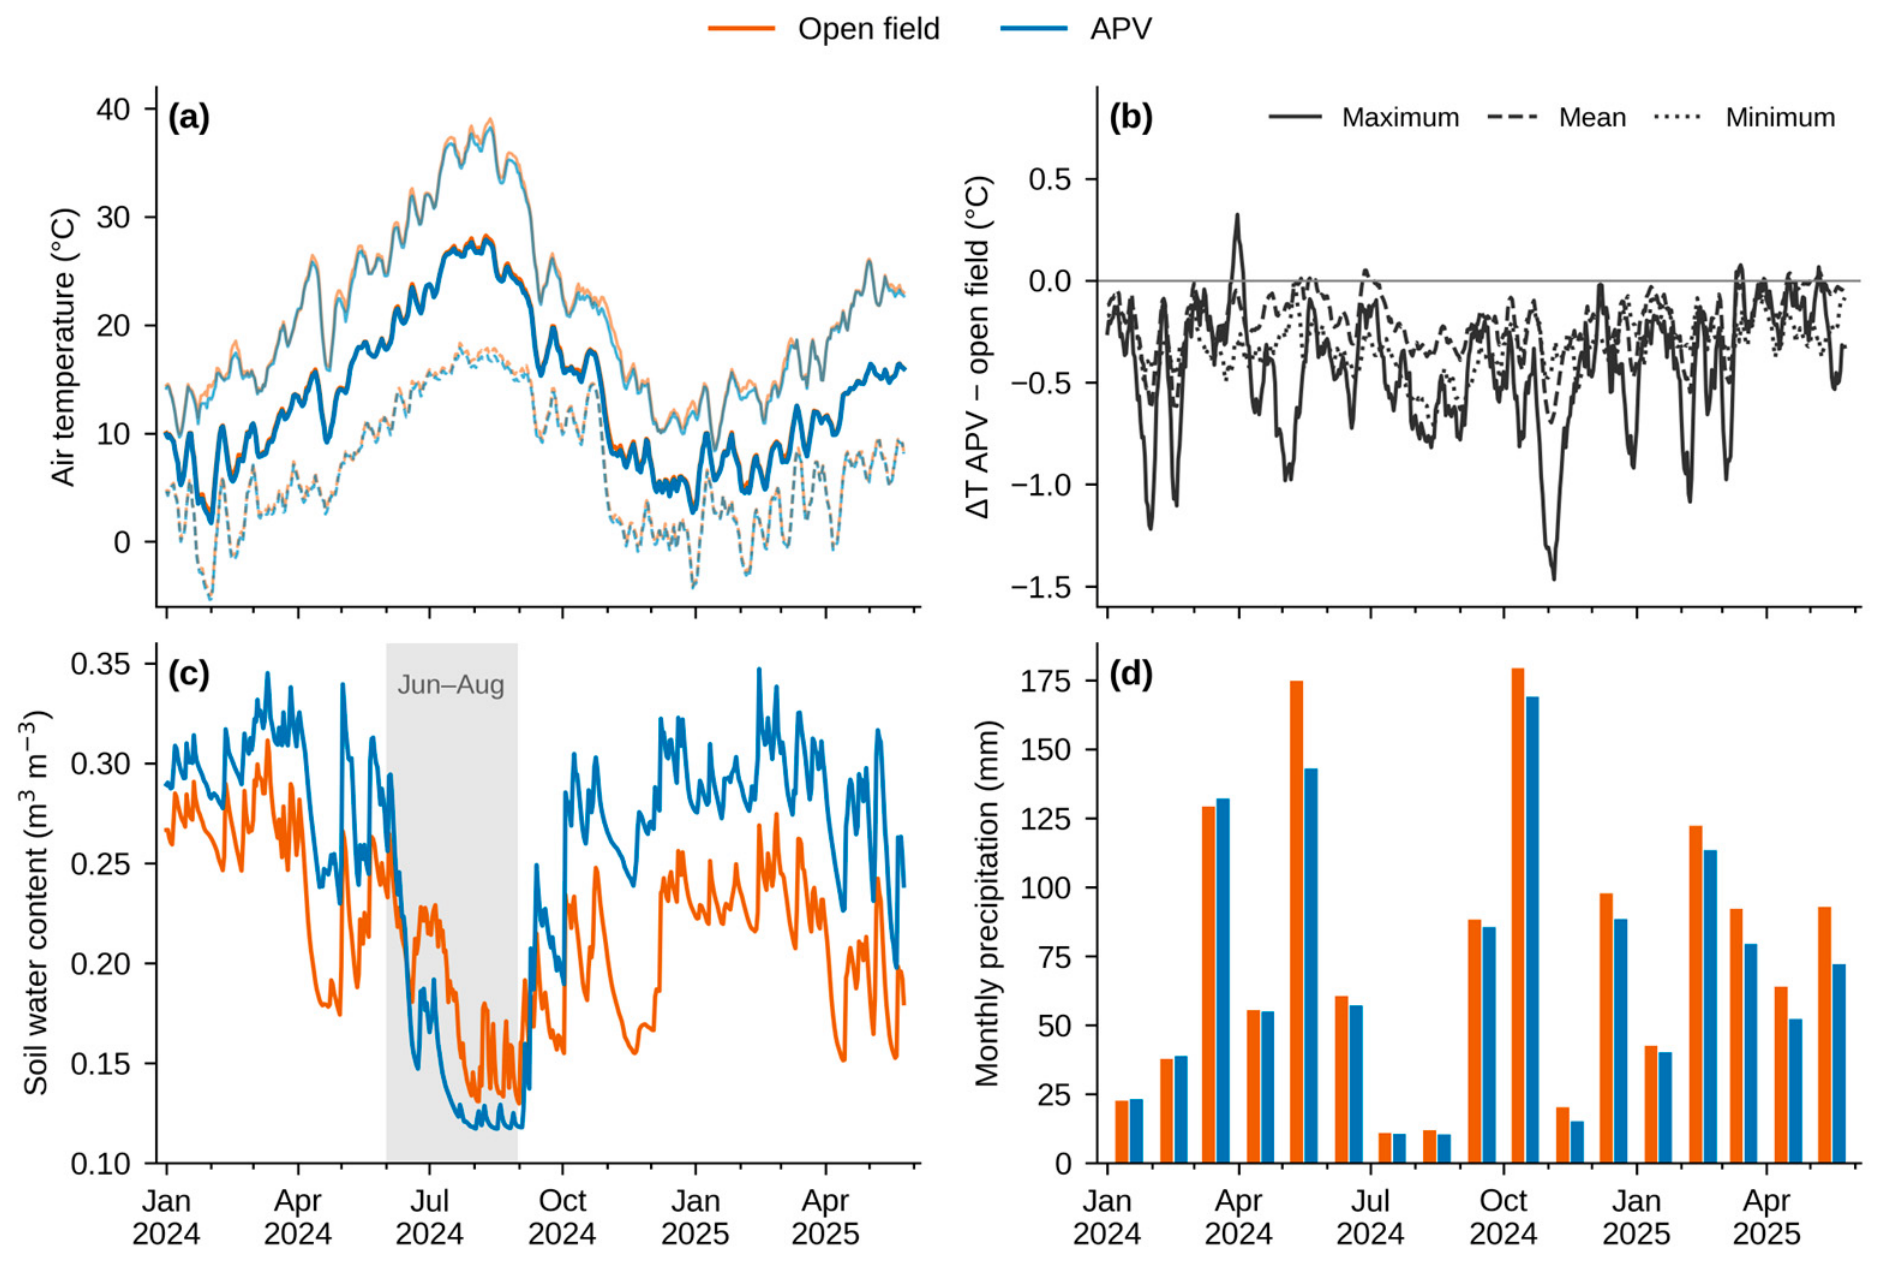
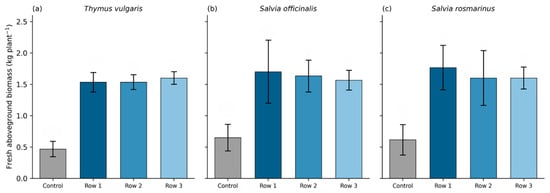
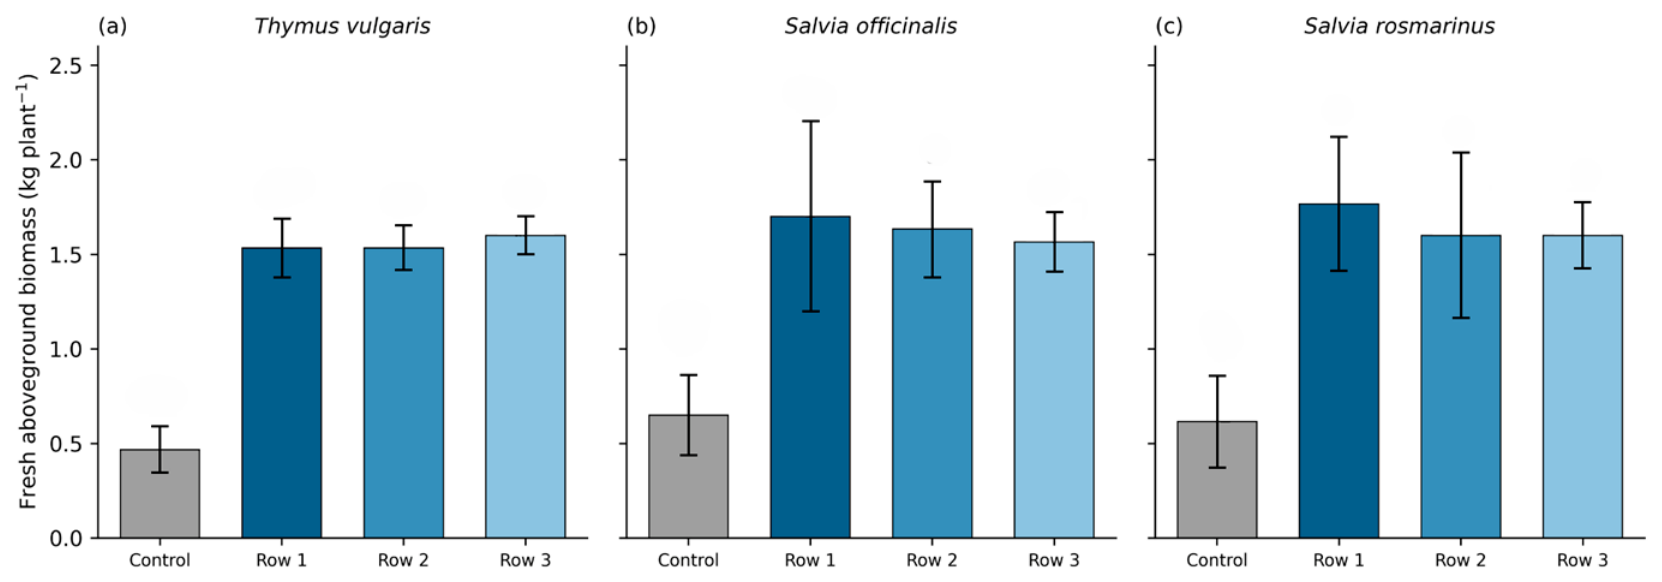

Disclaimer/Publisher’s Note: The statements, opinions and data contained in all publications are solely those of the individual author(s) and contributor(s) and not of MDPI and/or the editor(s). MDPI and/or the editor(s) disclaim responsibility for any injury to people or property resulting from any ideas, methods, instructions or products referred to in the content. |
© 2026 by the authors. Licensee MDPI, Basel, Switzerland. This article is an open access article distributed under the terms and conditions of the Creative Commons Attribution (CC BY) license.