


Abstract
To establish the fundamental parameter set required for discrete element modeling of pruned apple branches, one-year-old Fuji apple branches collected during winter pruning from a high-density dwarf-rootstock orchard were investigated. Physical experiments and EDEM numerical simulations were combined to calibrate and validate the contact and bonding parameters of the branches. First, basic physical properties, including branch dimensions, moisture content, density, Poisson’s ratio, and elastic modulus, were measured. Restitution, friction, cylinder-lifting angle-of-repose, and three-point bending tests were then conducted to obtain the macroscopic responses required for model calibration. Based on the Hertz–Mindlin (no-slip) model, the angle of repose was selected as the target response. Significant factors were screened using a Plackett–Burman design, and contact parameters were optimized through steepest-ascent tests and central composite design (CCD) response surface methodology. The branch–branch static and rolling friction coefficients were the principal factors affecting the angle of repose; their optimized values were 0.348 and 0.067, respectively. The experimentally measured branch–branch coefficient of restitution was 0.157, while the measured branch–steel coefficient of restitution, static friction coefficient, and rolling friction coefficient were 0.41, 0.42, and 0.08, respectively. The final contact parameter set produced a simulated angle of repose of 28.35°, differing from the experimental mean of 28.57° by 0.77%. Subsequently, bonding parameters were analyzed and optimized using the Hertz–Mindlin with Bonding model, with the maximum failure load in three-point bending as the target response. Response surface optimization yielded a normal contact stiffness per unit area of 2.15 × 10¹¹ N·m−3, a tangential contact stiffness per unit area of 2.00 × 10¹¹ N·m−3, and a critical tangential stress of 5.17 × 10⁷ Pa. Because the effect of critical normal stress was not statistically significant, it was fixed at its center level of 5.00 × 10⁷ Pa; the bond radius was preset to 1.2 mm. Five repeated three-point bending simulations using the final parameter set gave a mean maximum bending failure load of 413.30 ± 23.53 N, a relative difference of 2.50% from the calibration target of 423.9 N. These results indicate that the identified parameter set can adequately characterize the bulk stacking behavior and quasi-static bending load-bearing capacity of apple branches under the present experimental conditions. The calibrated parameters provide a basis for discrete element modeling and equipment optimization in subsequent branch collection, conveying, feeding, and shredding operations.
1. Introduction
The apple industry is an important component of agriculture in China and plays a crucial role in increasing farmers’ incomes and promoting rural revitalization [1]. China ranks first worldwide in both apple cultivation area and production [2]. In 2024, the national apple cultivation area was approximately 29 million mu, and production reached 51.2851 million t, maintaining steady growth over the past decade [3]. Dwarfing-rootstock high-density planting, an advanced mode of modern apple cultivation, offers significant advantages such as a compact canopy, early fruiting, high yield, convenient management, and suitability for mechanized operations [4], and has been widely adopted in countries with advanced apple production. Meanwhile, pruning generates large quantities of branches, and their collection, crushing, and resource utilization have become important components of mechanized orchard management [5]. Crushing and field incorporation can reduce branch accumulation and provide an effective pathway for the resource utilization of orchard waste biomass [6]. However, apple branches have a relatively high degree of lignification [7], and complex mechanical behaviors, including collision, sliding, rolling, and fracture, occur between branches and machine components during pickup, conveying, feeding, and crushing. Physical experiments alone cannot efficiently reveal the relationships between material motion characteristics, machine structure, and operating parameters [8]. Therefore, numerical simulation is needed to investigate branch-handling processes.
In recent years, the Discrete Element Method (DEM) has been widely applied to numerical studies of the motion characteristics of agricultural materials and their interactions with mechanical components [9,10,11,12,13,14], and rational calibration of model parameters is essential for ensuring simulation reliability. For different agricultural materials, researchers generally determine DEM parameters by combining direct measurement with inverse calibration based on macroscopic responses [15]. For contact-parameter calibration, Fang et al. [16] investigated particle mixtures composed of different tissues of corn stalks, used the angle of repose as the response, screened significant friction parameters using a Plackett–Burman design, and then determined the parameter combination through a steepest ascent test and Central Composite Design; the mean relative error of the validation test was only 0.29%. Zhang et al. [17] calibrated the contact parameters of chopped cotton stalks and optimized interparticle contact parameters using response surface methodology, providing a parameter basis for DEM simulation of the separation of cotton-stalk particles from residual film. Hu et al. [18] further considered the material differences between the bast and woody tissues of ramie, obtained the angle of repose using methods such as cylinder lifting, and combined a Plackett–Burman design to calibrate contact parameters among different ramie tissues and between ramie and steel, achieving a validation relative error below 2.11%. For stalk materials with pronounced bending and fracture behavior, the Bonding model has been used to represent flexibility and failure. Liu et al. [19] established a flexible discrete element model of wheat straw based on the Hertz–Mindlin with Bonding model and, using three-point bending tests, calibrated the bond radius and normal and tangential stiffnesses through sensitivity analysis and a Box–Behnken design; the difference between simulated and measured elastic moduli was 4.20%. Cao et al. [20] established a Hertz–Mindlin Bonding model for highly lignified Caragana korshinskii stems, calibrated the bonding parameters using a Plackett–Burman design and response surface methodology, and evaluated the model through three-point bending, radial compression, axial tension, shearing, and cutting tests, with simulation errors in the maximum failure forces controlled within approximately 5%. In addition, Zhang et al. [21] established tensile, compressive, bending, and shear discrete element models for cotton stalks in mechanically harvested film–stalk mixtures, demonstrating that combining physical experiments with numerical simulations can be used for inverse identification of mechanical parameters and characterization of failure behavior in plant stalks. These studies indicate that calibrating contact parameters using bulk responses such as the angle of repose and calibrating bonding parameters using mechanical responses such as bending or failure loads have become relatively mature technical approaches in DEM modeling of agricultural biomass. However, the relevant parameters are strongly material-dependent, and targeted calibration is still required for specific materials based on their geometric and mechanical characteristics.
However, DEM parameters are clearly dependent on both the material and the model. Their values are influenced not only by surface contact characteristics but also by geometric form, tissue structure, moisture condition, and model discretization. Compared with common herbaceous or semi-lignified stalks, pruned apple branches have a higher degree of lignification and a more complex radial tissue structure composed of epidermis, phloem, xylem, pith, and other tissues. Their contact and bending-failure characteristics therefore cannot be represented directly using parameters obtained for other crop stalks. In particular, mechanized branch handling requires, on the one hand, description of the collective contact behavior among large numbers of branches and between branches and machine components and, on the other hand, characterization of the bending and fracture response of individual branches under external loading. Consequently, obtaining only a single type of contact or mechanical parameter is insufficient for subsequent discrete element modeling of branch-handling processes. At present, systematic DEM parameter studies specifically targeting winter-pruned apple branches and simultaneously covering collective contact behavior and quasi-static bending-failure response remain limited [22].
Accordingly, this study used one-year-old Fuji apple branches collected during winter pruning from a dwarfing-rootstock high-density apple orchard and established a discrete element parameter system by combining physical experiments with EDEM numerical simulations. First, the basic physical properties, contact parameters, angle of repose, and three-point bending failure characteristics of the branches were measured experimentally. Second, using the physical angle of repose as the macroscopic response, the Hertz–Mindlin (no slip) contact model was combined with a Plackett–Burman design, a steepest ascent test, and Central Composite Design response surface methodology to screen and optimize branch contact parameters. The maximum three-point bending failure force was then used as the target response, and the Hertz–Mindlin with Bonding model was employed to calibrate key bonding parameters, which were validated against the corresponding physical responses. The objective was to obtain equivalent DEM parameter combinations capable of characterizing the collective piling behavior and quasi-static bending-failure response of pruned apple branches, thereby providing a parameter basis for subsequent discrete element modeling and equipment optimization of branch pickup, conveying, feeding, and crushing operations.
2. Materials and Methods
2.1. Experimental Materials
One-year-old Fuji apple branches collected during winter pruning were used as the test material. Fuji apples are widely cultivated and stably distributed in China, making them representative of the crop. Branch samples were collected on 28 December 2025 from a dwarfing-rootstock high-density apple orchard in Shunping County, Hebei Province (longitude 114, latitude 38), from trees 5–8 years old. Sampling followed GB/T 5262-2008 [23], General Rules for Measuring Methods of Agricultural Machinery Test Conditions. A five-point sampling method was used, and healthy branches with uniform growth and no disease or insect damage were selected as test samples.
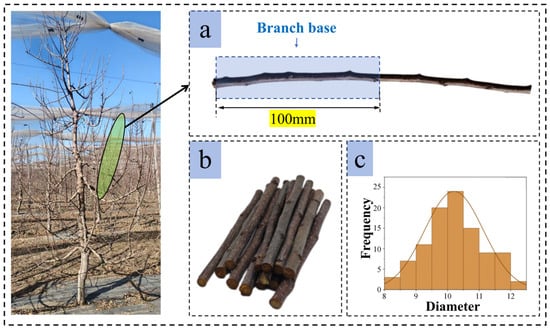
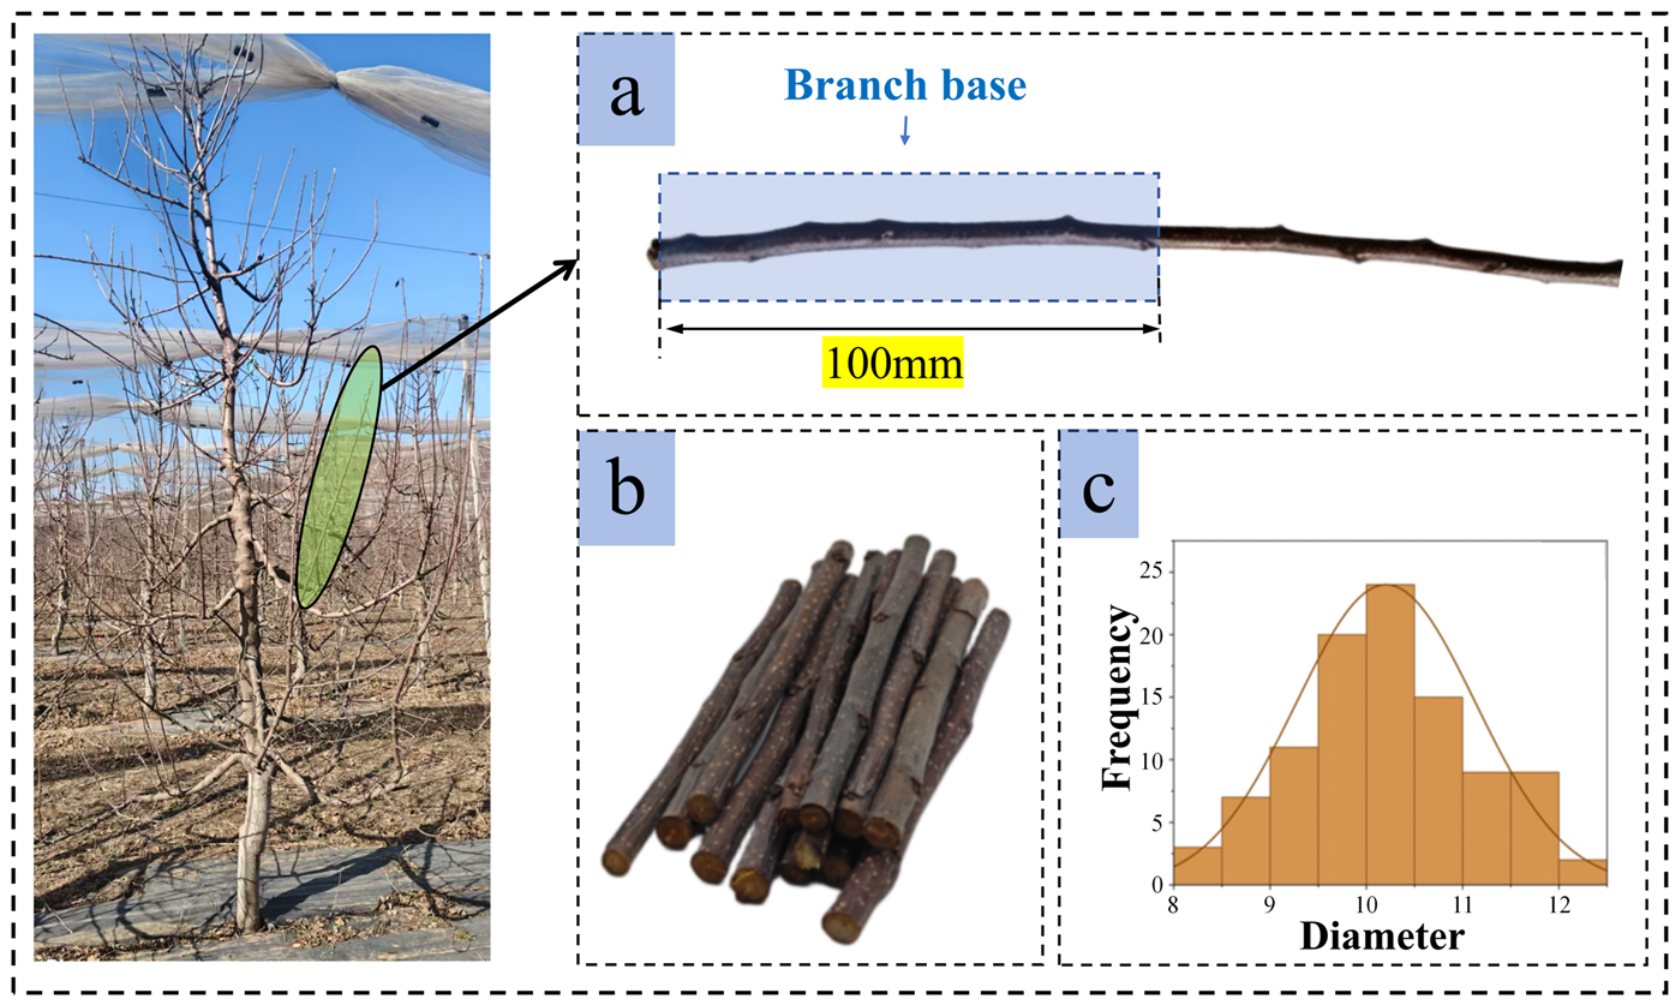
Because the basal portion of pruned branches has a larger diameter and a higher degree of lignification, it experiences the most concentrated impact and crushing loads during crushing operations and is therefore highly representative from an engineering perspective. Accordingly, 100 mm segments were uniformly cut upward from the branch base as test samples (Figure 1a). The branch sample morphology is shown in Figure 1b. After repeated measurements and averaging (Figure 1c), the mean basal diameter of the samples was 10.2 mm.
Figure 1.
Apple branch sample: (a) schematic diagram of the sampling location; (b) branch samples; (c) diameter distribution.
2.2. Determination of Physical and Mechanical Properties
2.2.1. Moisture Content and Density
Moisture content is a key factor affecting the mechanical behavior of branches. To avoid measurement bias caused by moisture loss after sampling, the collected branches were immediately sealed in plastic bags and tested within 24 h.
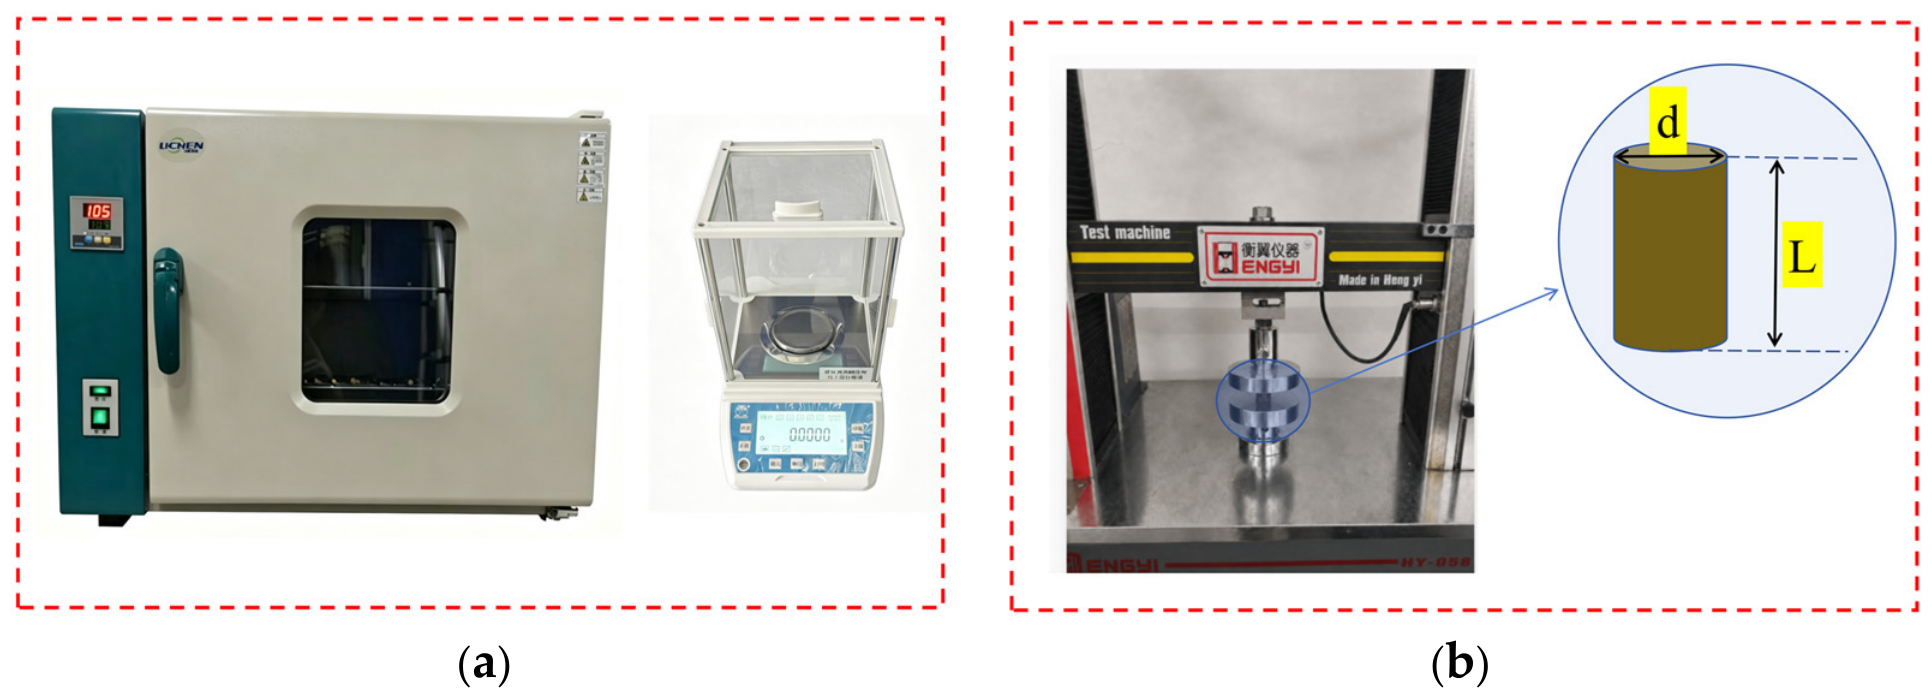
Moisture content was determined using the oven-drying method (Figure 2a). The drying-to-constant-mass procedure was developed with reference to GB/T 1927.4-2021 and the apple-branch moisture measurement method reported by Li et al. [7], with adjustments for the specimens used in this study. After recording the initial mass, the samples were placed in a constant-temperature oven (LC101, Shanghai Lichen Bangxi Instrument Technology Co., Ltd., Shanghai, China) at 105 °C for an initial drying period of 5 h. The samples were then transferred to a desiccator, cooled to room temperature for 2 h, and weighed. Drying, cooling, and weighing were repeated until the difference between two successive mass measurements did not exceed 0.01 g, which was considered to indicate constant mass. In this study, moisture content was expressed on a wet basis, using the initial specimen mass before drying as the denominator, and was calculated using Equation (1).
where ω denotes the wet-basis moisture content (%), m1 is the initial specimen mass before drying (g), and m2 is the oven-dry specimen mass (g).
Figure 2.
Measurement of physical and mechanical properties of apple branches: (a) oven-drying method; (b) uniaxial compression test.
Branch density was determined using the liquid-displacement method. The branch mass was measured using an electronic balance (accuracy 0.0001 g, MTL324, Nanjing Bonita Scientific Instruments Co., Ltd., Nanjing, China), after which the branch was completely immersed in a 100 mL graduated cylinder containing deionized water, and the displaced water volume was recorded. The test was repeated 10 times, and the mean value was used.
2.2.2. Poisson’s Ratio and Shear Modulus
Poisson’s ratio and elastic modulus were obtained simultaneously through uniaxial compression tests (Figure 2b) [24]. Apple branches were machined into cylindrical specimens with a length of L = 15 mm and a diameter of d = 10.2 mm. Both ends were polished flat with sandpaper to ensure parallel loading surfaces. Axial compression was performed using a universal mechanical testing machine (HY-0580, Shanghai Hengyi Precision Instrument Co., Ltd., Shanghai, China) at a loading rate of 2 mm/min. The test was repeated 10 times, and the mean value was used. Poisson’s ratio was determined as the ratio of radial strain to axial strain, and the elastic modulus was calculated from the slope of the linear elastic segment of the stress–strain curve. The shear modulus was calculated using Equation (2).
2.3. Measurement of Contact Parameters
During crushing, branches frequently collide and rub against one another and against crusher components, which are mainly steel plates. Their contact behavior is primarily characterized by the coefficient of restitution, static friction coefficient, and rolling friction coefficient. These parameters were determined in this section using free-fall and inclined-plane tests.
2.3.1. Coefficient of Restitution
The coefficient of restitution is defined as the ratio of the separation velocity of two bodies along the contact-surface normal after collision to their approach velocity before collision, reflecting the degree of kinetic-energy loss during the collision. It was measured using a free-fall test.
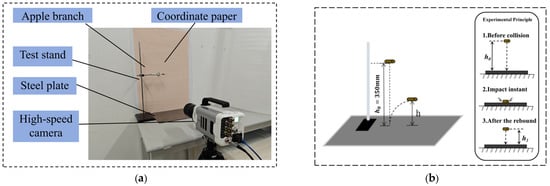
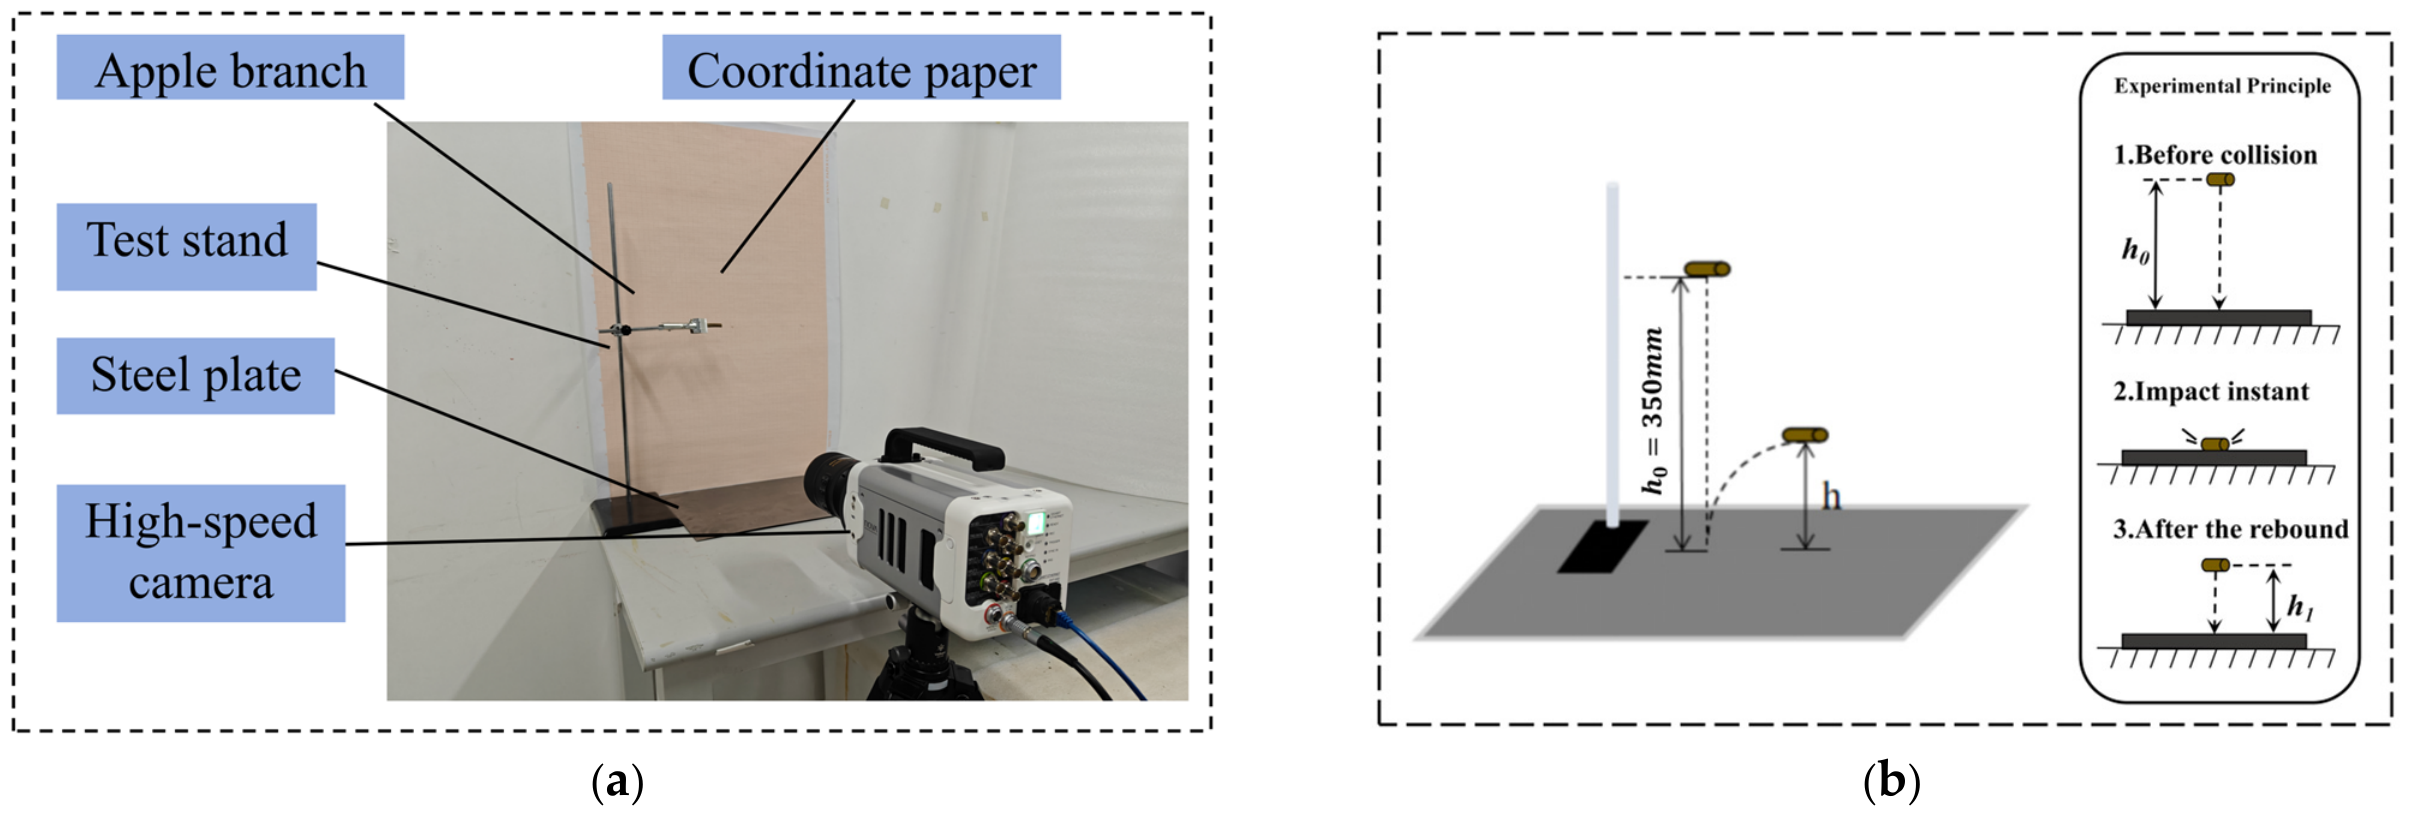
The measurement setup is shown in Figure 3a, and the collision process was recorded using a high-speed camera (Photron Limited, Tokyo, Japan). As illustrated in Figure 3b, a 30 mm long branch specimen was raised to an initial height h0 = 350 mm and released freely so that it collided normally with either a horizontally placed steel plate or the surface of a branch array. The branch array consisted of 10 branches of similar diameter and 150 mm in length, tightly arranged and fixed to a base, providing stable contact-surface conditions for branch–branch collisions. The maximum rebound height h1 after impact was determined from the recorded images, and the coefficient of restitution was calculated using Equation (3). Each test group was repeated 10 times, and the mean value was used.
where is the separation velocity of the two bodies along the normal direction after collision (m/s); is the approach velocity of the two bodies along the normal direction before collision (m/s); h0 is the initial release height of the branch (mm); and h1 is the maximum rebound height reached by the branch after collision (mm).
Figure 3.
Collision recovery coefficient measurement test: (a) coefficient-of-restitution measurement setup; (b) test principle.
2.3.2. Static and Rolling Friction Coefficients
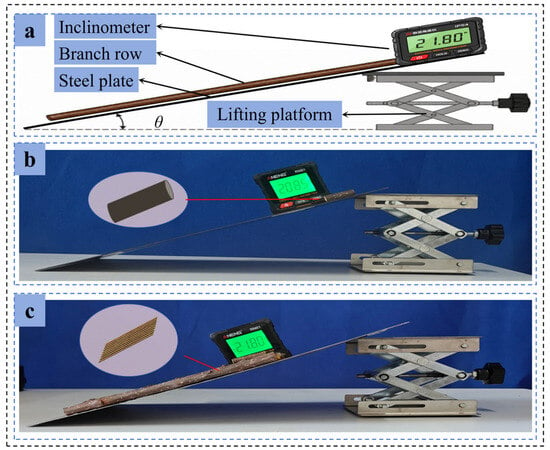
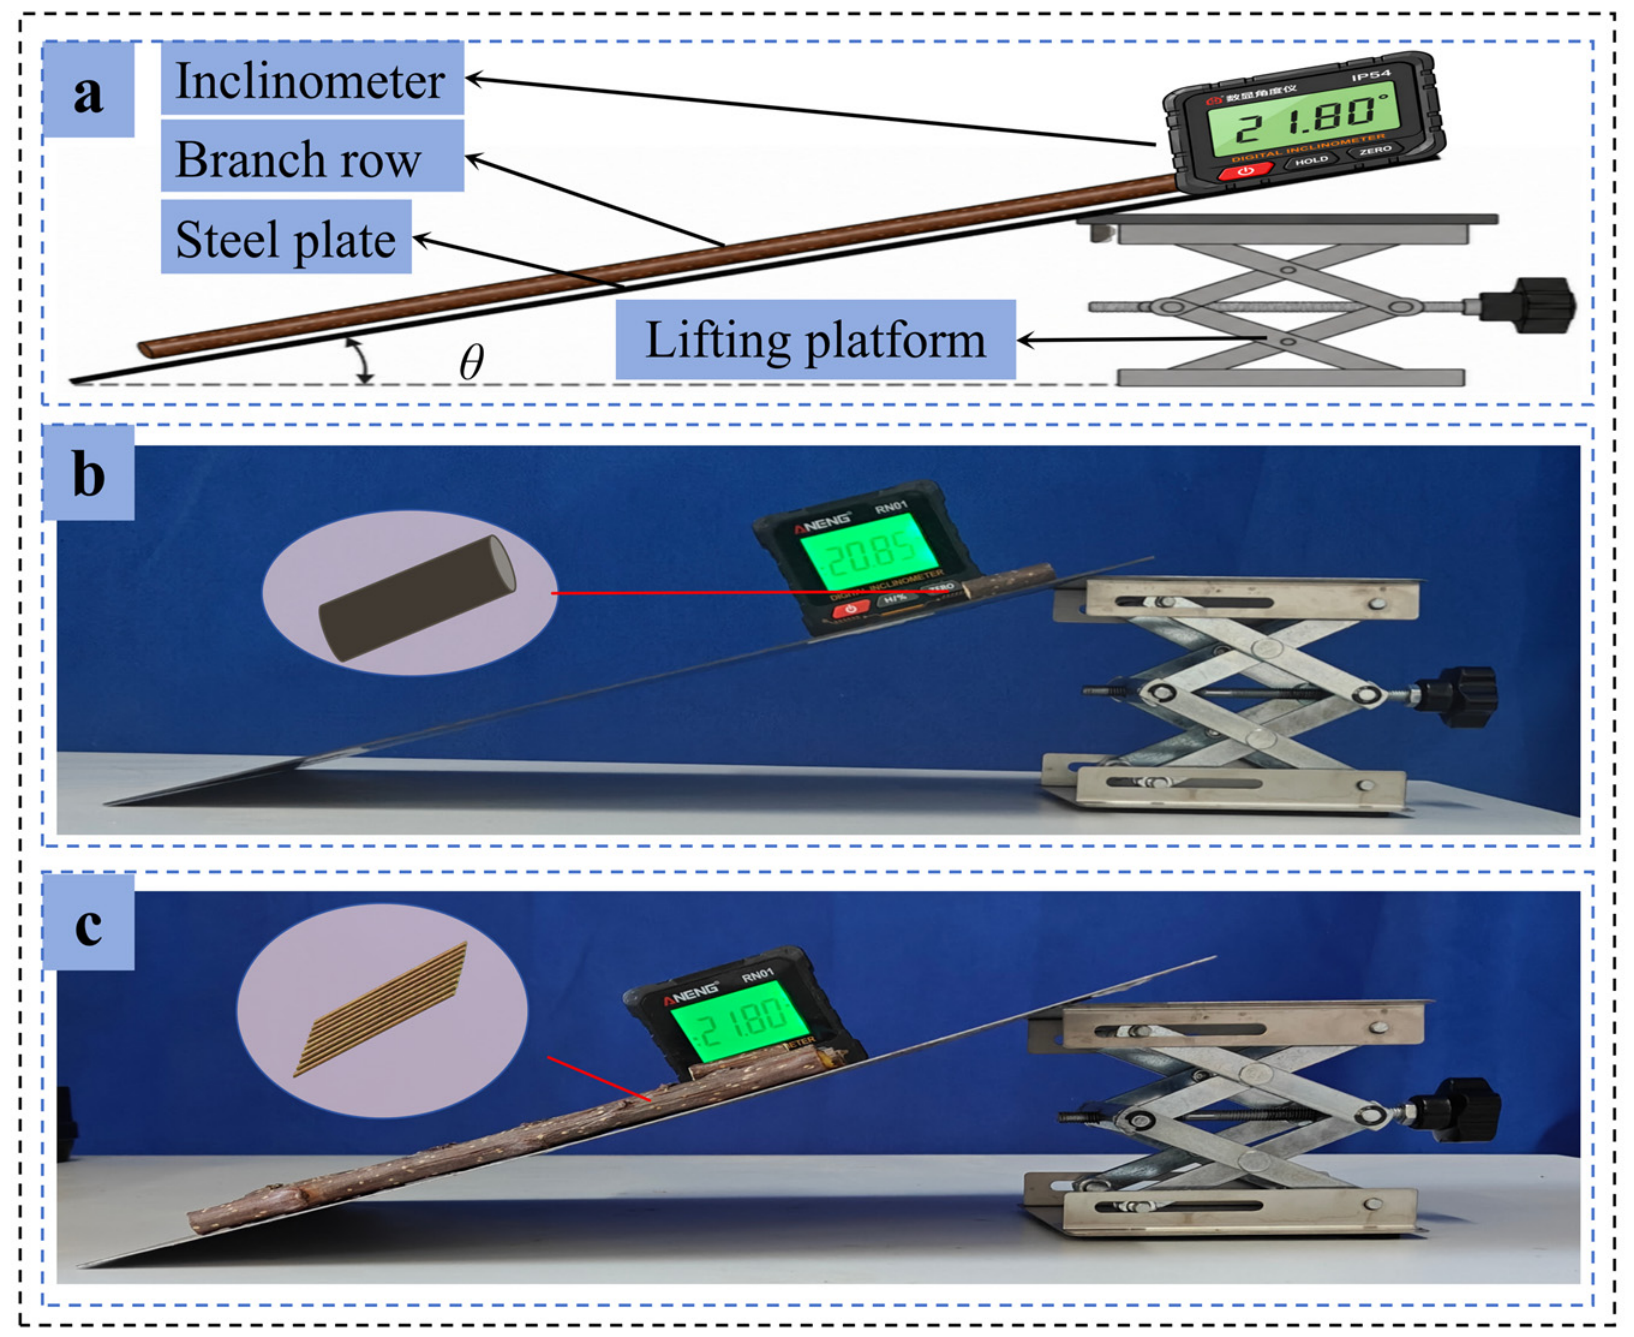
Both the static friction coefficient and rolling friction coefficient were measured using the inclined-plane method [25]. The test setup, shown in Figure 4a, consisted of a steel plate, lifting platform, branch array, inclinometer, and specimen.
Figure 4.
Friction-coefficient measurement test: (a) measuring principle; (b) branch–steel plate friction coefficient measurement device; (c) branch–branch friction coefficient measurement device.
Static friction coefficient measurement (Figure 4b): A 30 mm long branch specimen was placed on the surface of the steel plate or branch array with its axis aligned with the incline. The free end of the inclined plane was slowly raised until the branch began to slide, and the critical inclination angle between the plane and the horizontal surface, , was recorded. Each test group was repeated 10 times, and the mean value was used. The static friction coefficient was calculated using Equation (4):
Rolling friction coefficient measurement (Figure 4c): The branch specimen was placed transversely on the surface of the steel plate or branch array (i.e., with the branch axis perpendicular to the direction of the incline). Using the same slow-lifting procedure as in the static-friction test, the critical inclination angle at which the branch began to roll from rest, , was recorded. The rolling friction coefficient was calculated using Equation (5):
Each test group was repeated 10 times, and the mean value was used.
2.4. Macroscopic-Response Physical Tests
To provide macroscopic target responses for subsequent calibration of the contact and bonding parameters in the discrete element model, physical angle-of-repose and three-point bending failure tests were conducted on apple branches. The angle-of-repose test was used to characterize the natural piling behavior of a branch group under unconstrained conditions and to provide a basis for calibrating contact parameters. The three-point bending test was used to determine the maximum failure force of a single branch under bending loading and to provide the target response for calibrating bonding parameters.
2.4.1. Physical Angle-of-Repose Test for Branches
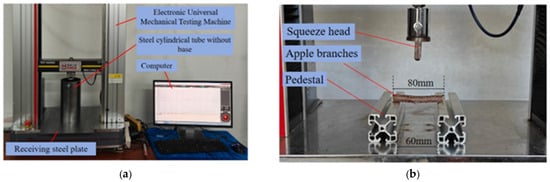
The angle of repose of the apple branches was measured using the cylinder-lifting method [17]. As shown in Figure 5a, the test setup consisted of a steel cylinder (inner diameter 150 mm, height 200 mm), a universal material testing machine (HY-0580, Shanghai Hengyi Precision Instrument Co., Ltd., Shanghai, China), and a receiving steel plate.
Figure 5.
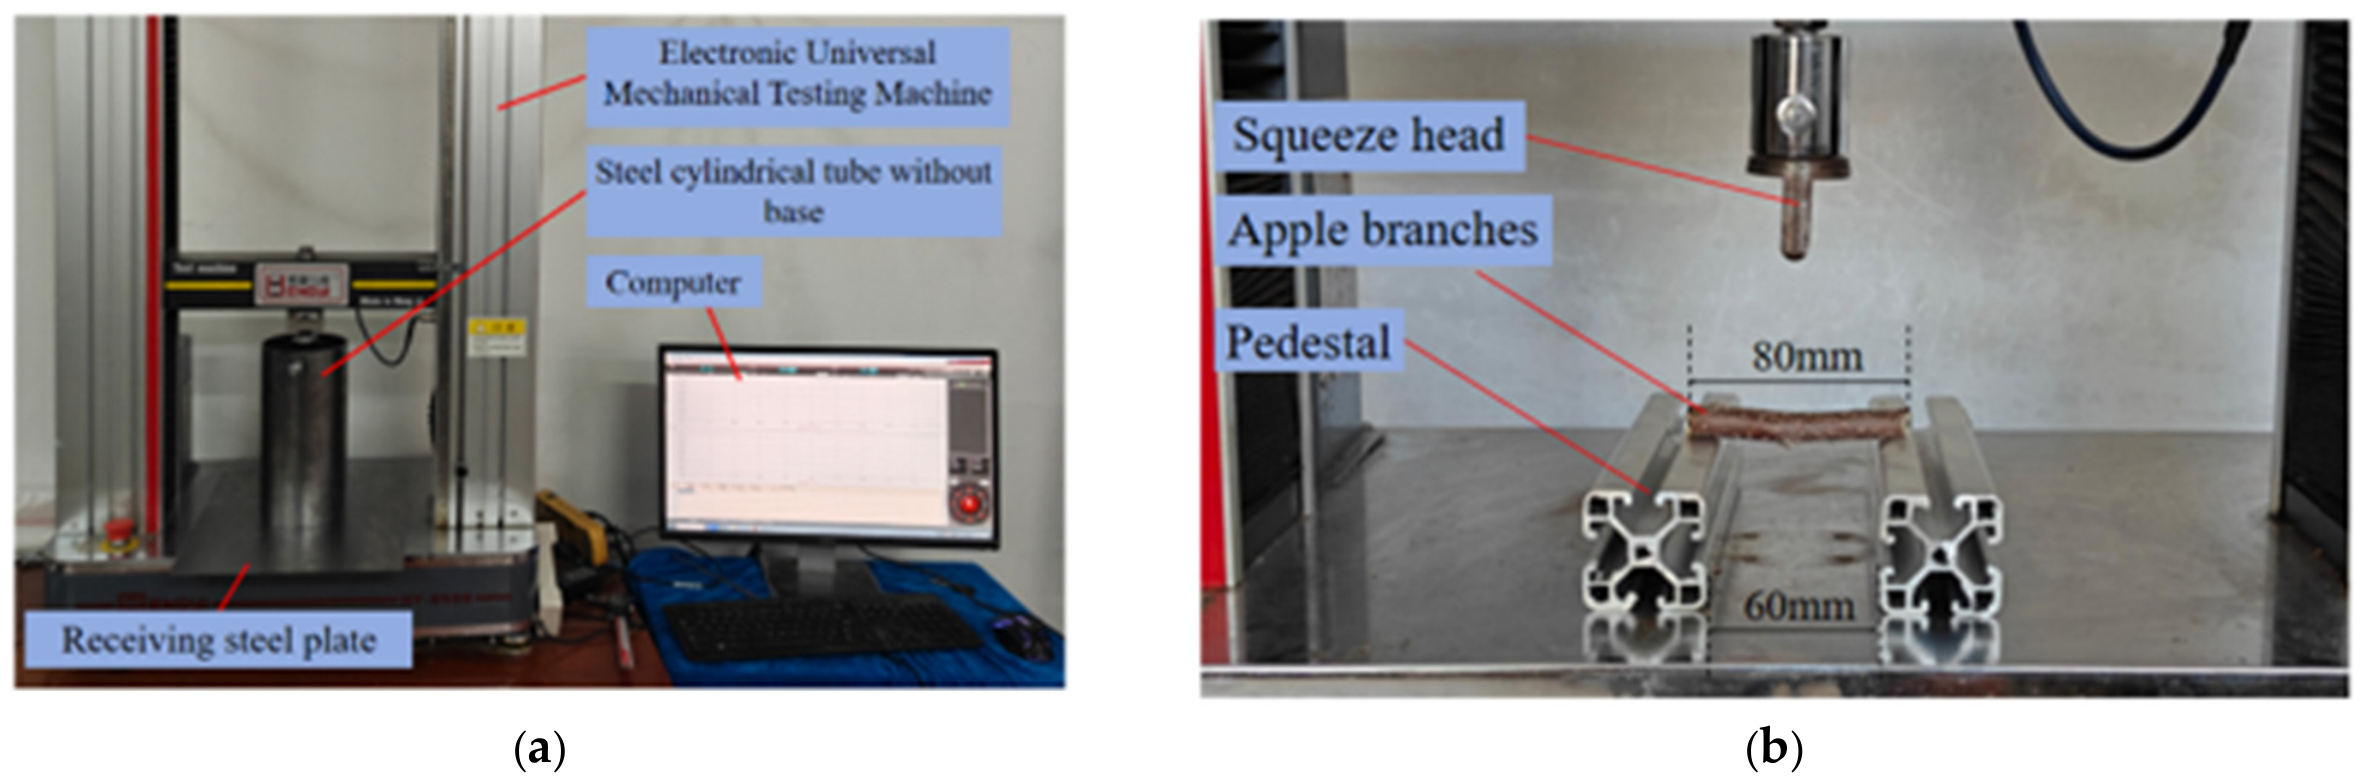
Macroscopic Response Physical Experiment: (a) cylinder-lifting test; (b) physical three-point bending test.
Before testing, 40 mm specimens were cut from the middle portions of the 100 mm branch samples described in Section 2.1. With a mean branch diameter of 10.2 mm, the length-to-diameter ratio was approximately 3.92. This geometry retained the elongated, nonspherical characteristics of the branches while enabling consistent specimen preparation and compatibility with the cylinder-lifting apparatus. For each test, 300 branch specimens were placed in the steel cylinder.
The universal testing machine lifted the cylinder vertically at a constant speed of 5 mm/s. This relatively low lifting speed allowed the branches to be released gradually under gravity as the lateral confinement was removed, thereby minimizing additional dynamic disturbance associated with rapid cylinder movement. Consequently, the final pile shape predominantly reflected interbranch collisions, sliding, and rolling. After all specimens had exited the cylinder, the pile was allowed to settle for approximately 30 s. Once stable, an image was acquired from the side for angle-of-repose measurement.
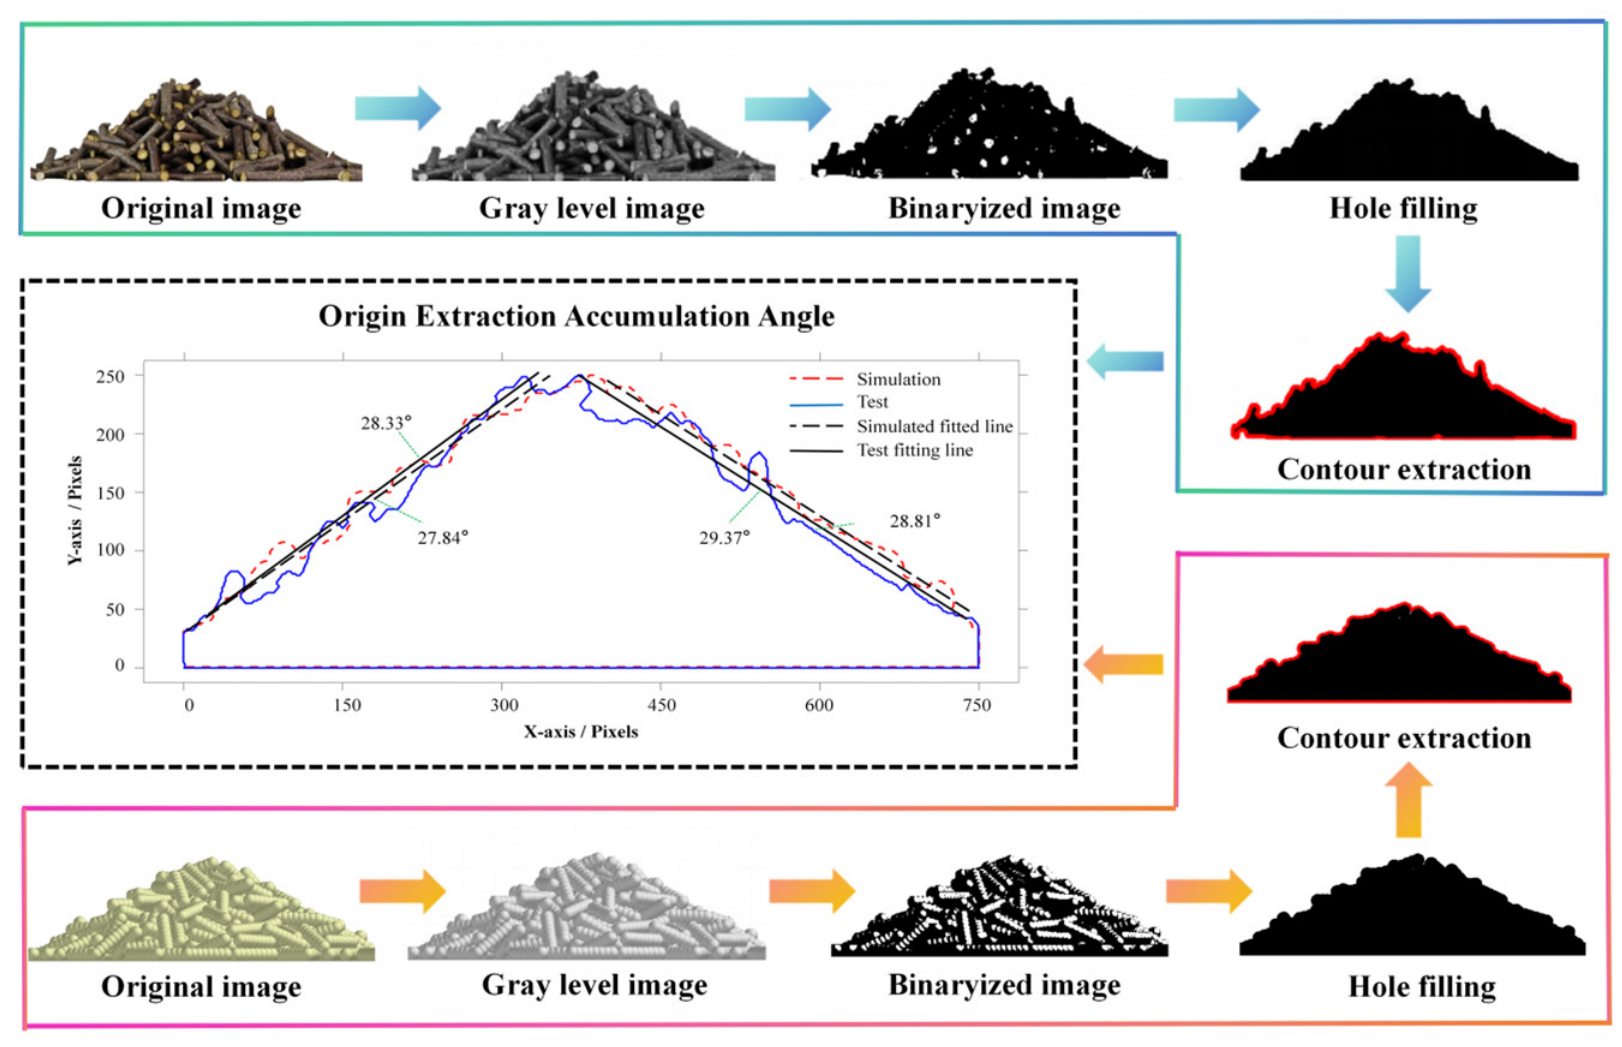
To reduce subjective errors associated with manual measurements, the images were processed in MATLAB R2025b (MathWorks, Natick, MA, USA) [26]. First, each original color image was converted to grayscale. Otsu’s global thresholding method was then applied to determine an optimal threshold from the gray-level histogram and binarize the image, separating the pile from the background. Next, morphological operations were performed: imfill was used to fill internal holes; bwareaopen removed small, connected components; and morphological opening (imopen) and closing (imclose) reduced residual noise, smoothed pile boundaries, and closed small gaps. The pile outline was extracted from the processed image for subsequent calculation of the angle of repose. The outline coordinates were imported into Origin 2024 (OriginLab Corporation, Northampton, MA, USA), and straight lines were fitted to discrete points along both slopes of the pile. The arctangent of the fitted slope was taken as the angle of repose. Five replicates were performed, and their mean was used as the final angle of repose.
2.4.2. Three-Point Bending Test
The maximum bending failure force of the apple branches was determined using three-point bending loading [27]. Specimens 80 mm in length were cut upward from the base of the branch samples described in Section 2.1, ensuring that they were straight and free of knots and surface cracks. Loading was performed using a three-point bending fixture mounted on a universal mechanical testing machine (HY-0580, Shanghai Hengyi Precision Instrument Co., Ltd., Shanghai, China). The support span was set to 60 mm, the loading head was positioned directly above the midpoint of the specimen span, and the loading direction was perpendicular to the branch axis. The loading head moved downward at a constant speed of 1 mm/s to apply the bending load. The testing machine automatically recorded load–displacement data during loading. Each test group was repeated 10 times, and the mean peak load was taken as the maximum three-point bending failure force of the branch. The test setup is shown in Figure 5b.
2.5. Establishment of the Branch Angle-of-Repose Simulation Model
Based on the geometry and loading conditions of the physical angle-of-repose test described in Section 2.4.1, a corresponding simulation model was established in EDEM 2022 (Altair Engineering Inc., Troy, MI, USA). During natural piling, the main contact behaviors of branches include interparticle collision, sliding, and rolling, whereas bonding and fracture do not occur between particles. Therefore, the Hertz–Mindlin (no-slip) contact model was used to describe branch–branch and branch–steel plate contact mechanics.
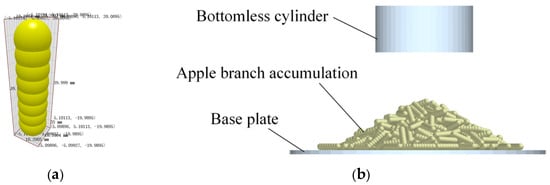
According to the actual dimensions of the branch samples in Section 2.1 (diameter 10.2 mm and length 40 mm), a single apple branch was simplified as a short cylinder of uniform diameter. To improve computational efficiency while maintaining geometric representation accuracy, Zhang et al. proposed that an eight-sphere model can provide a good balance between computational efficiency and geometric fidelity. Therefore, the present study used the multi-sphere filling method to construct the branch particle model by arranging eight spherical particles with a diameter of 10.2 mm along the axial direction, as shown in Figure 6a.
Figure 6.
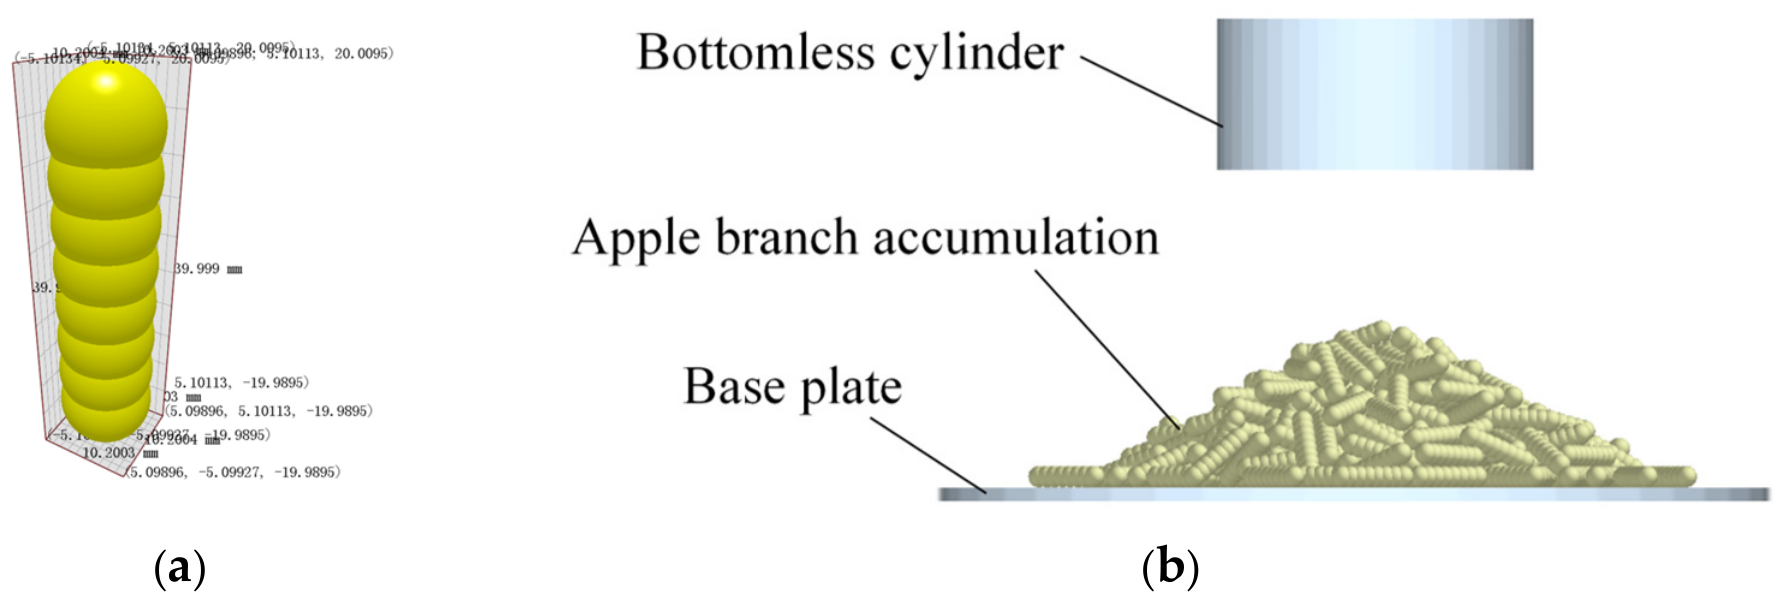
Angle-of-repose simulation test: (a) branch contact model; (b) cylindrical lifting simulation test.
A cylinder-lifting simulation device with an inner diameter of 150 mm was established in EDEM, as shown in Figure 6b. A virtual cylindrical particle factory with the same inner diameter as the cylinder was placed inside it, and 300 branch particles were randomly generated using a static generation method. After generation, the branches settled naturally to the bottom of the cylinder under gravity, forming the initial filling state. The cylinder lifting speed was set to 5 mm/s. The simulation was stopped after all branches had completely exited the cylinder and formed a stable pile.
GPU-accelerated computation was used, and the time step was set to 20% of the Rayleigh time step. After the simulation, the contour image of the branch pile was extracted using the same method as in the physical test, and the simulated angle of repose was obtained through Matlab image processing. The angle-of-repose simulation model is shown in Figure 6b.
2.6. Experimental Design for Contact-Parameter Calibration
To obtain contact parameters that accurately reproduce apple branch stacking, the experimentally measured angle of repose from Section 2.4.1 was used as the target response. A stepwise strategy was adopted to calibrate six branch–branch and branch–steel contact parameters. The calibration involved three successive stages: (1) screening significant factors using a Plackett–Burman (PB) design; (2) approaching the optimal parameter region by steepest-ascent tests; and (3) developing a regression model and solving for the optimal parameter combination through CCD response surface methodology. Design-Expert 13 software (Stat-Ease Inc., Minneapolis, MN, USA) was used for experimental design, regression modeling, analysis of variance (ANOVA), and response surface optimization in all three stages.
2.6.1. Screening of Key Factors Using the Plackett–Burman Design
The PB test is a two-level fractional factorial design [16] that can identify key factors with significant effects on the response using a minimum number of experimental runs [28]. The six contact parameters listed in Table 1 were used as test factors (X1–X3 represent the branch–branch coefficient of restitution, static friction coefficient, and rolling friction coefficient, respectively; X4–X6 represent the corresponding branch–steel plate parameters), and the simulated angle of repose θ′ was used as the response. The PB design was generated using Design-Expert 13 software (Stat-Ease Inc., Minneapolis, MN, USA). The low (−1) and high (+1) levels of each factor were determined by appropriately extending the physically measured values obtained in Section 2.3. Analysis of variance (ANOVA) was used to evaluate the significance of each factor on the angle of repose (p < 0.05, significant; p < 0.01, highly significant), thereby identifying the factors requiring focused calibration in subsequent steps.
Table 1.
Plackett–Burman test factors and coding.
2.6.2. Steepest Ascent Test to Approach the Optimal Region
Based on the significant factors screened by the PB test, the steepest ascent test was used to rapidly approach the region with the best response. The principle of this method is to move stepwise along the direction of the maximum gradient fitted by the regression model (i.e., the steepest ascent direction), allowing the response value to rapidly approach the target region [29]. The relative error η between the simulated angle of repose and the physical angle of repose was used as the evaluation index and was calculated using Equation (6):
where θ′ is the simulated angle of repose (°), and θ is the physical-test angle of repose (°).
The optimal value ranges of the significant factors were determined from the increasing or decreasing trend of the error values. The remaining nonsignificant parameters were set to the physically measured values and kept constant in subsequent validation models.
2.6.3. Central Composite Response Surface Design
Near the optimal region identified by the steepest-ascent tests, a second-order response surface model relating the key factors to the angle of repose was established using central composite design (CCD) [30].
The significant factors were selected as CCD factors, centered at the optimal point identified by the steepest-ascent tests, and experiments were arranged using a rotatable CCD (α = 1.414). Multiple regression analysis was performed to establish a second-order regression equation for the angle of repose. Finally, the regression model was optimized using a desirability function with the physical angle of repose as the target, yielding the optimal contact parameter combination. After calibration, the optimized parameter combination was re-entered into EDEM 2022 for a new stacking simulation. The simulated angle of repose was compared with the same physical target value to assess the ability of the calibrated parameters to reproduce the target response.
2.7. Establishment of the Three-Point Bending Simulation Model
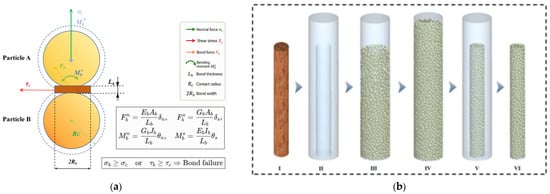
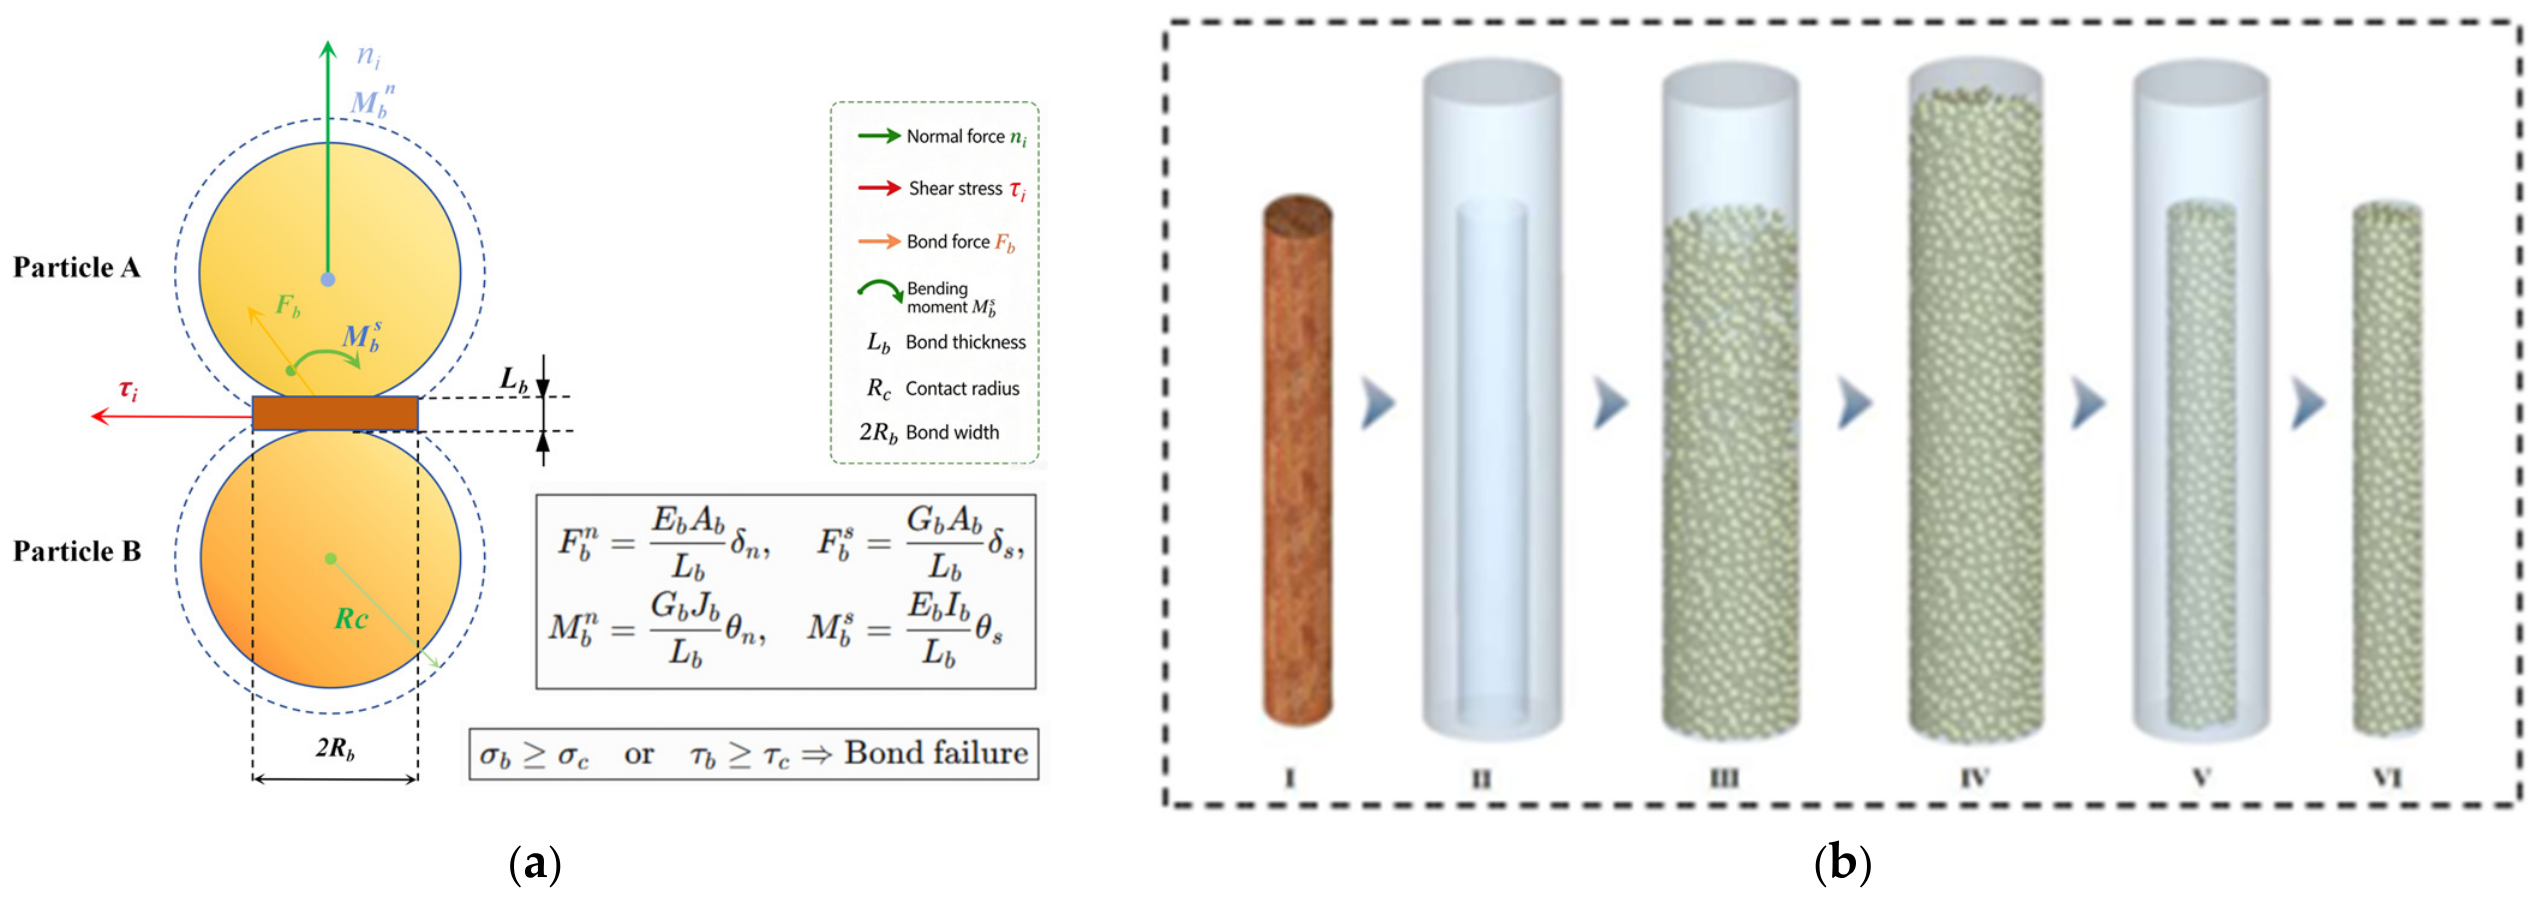
Based on the geometry and loading conditions of the physical three-point bending test described in Section 2.4.2, a corresponding bending-fracture simulation model was established in EDEM 2022 to provide a simulation platform for subsequent bonding-parameter calibration. Unlike the angle-of-repose simulation, the three-point bending simulation involves bonding and fracture between internal branch particles. Therefore, the Hertz–Mindlin with Bonding model was used to describe bonded contacts between particles, as shown in Figure 7a.
Figure 7.
Three-point bending model of apple branches: (a) bonding principle; (b) bonding model formulation.
Actual apple branches are composed of multiple heterogeneous tissues, including the epidermis, phloem, xylem, and pith. These tissues differ in deformation and fracture characteristics during bending, and the branch as a whole exhibits anisotropic mechanical behavior. However, this study focused on the equivalent macroscopic mechanical response required for simulation of the branch-crushing process rather than an exact description of the mesoscopic fracture mechanisms of internal tissues. Therefore, the branch was simplified as an isotropic elastic body; a single-particle material was used to construct the branch model, and equivalent bonding parameters were adopted to characterize its overall bending-failure behavior.
Accordingly, the bonding parameters determined in this study were treated as equivalent model parameters representing the overall macroscopic mechanical response of apple branches, rather than the intrinsic mechanical properties of individual tissue layers.
- (1)
- Construction of the Branch Particle Model
The establishment process of the three-point bending simulation model is shown in stages I–VI in Figure 7b. Based on the geometry of the specimen used in the physical three-point bending test (length 80 mm and diameter 10.2 mm), an .stl branch model was created and imported into EDEM. A cylinder 20 mm in diameter and 100 mm long was established outside the branch model for particle generation, and the branch model was initially set as a “Virtual Region”. The outer cylinder was then used as a particle factory to randomly generate spherical particles with a diameter of 2.0 mm using a static method. After filling, the outer cylinder was set as a virtual region, while the branch model was converted to a “Physical Boundary”. Excess particles outside the geometric contour of the branch then left the computational domain, resulting in a final branch model containing 831 spherical particles. Finally, bonded interactions were established between particles using the Hertz–Mindlin with Bonding model to obtain the bonded branch model.
- (2)
- Simulation Device and Boundary Conditions
Three-dimensional models of the loading head and supports used in the three-point bending test were established in Autodesk Inventor 2020 (Autodesk, Inc., San Francisco, CA, USA) and imported into EDEM in .stl format. The support span was set to 60 mm, consistent with the physical test, and the loading head was positioned directly above the midpoint between the two supports. Both the supports and loading head were defined as rigid bodies and did not deform during the simulation. To ensure consistency with the physical loading conditions, the loading head was set to move vertically downward at a constant speed of 1 mm/s, corresponding to the physical-test loading speed.
- (3)
- Solver Settings and Termination Conditions
CPU computation was used, and the time step was set to 10% of the Rayleigh time step. After the simulation, the force data on the loading head were extracted, and the maximum load was taken as the simulated three-point bending failure force.
2.8. Bonding-Parameter Calibration Method
Following contact parameter calibration, the key bonding parameters of the Hertz–Mindlin with Bonding model were analyzed using the three-point bending simulation model developed in Section 2.7. The maximum three-point bending failure load measured in Section 2.4.2 (423.9 N) was used as the target response. A central composite design (CCD) was employed to investigate the effects of normal contact stiffness per unit area, tangential contact stiffness per unit area, critical normal stress, and critical tangential stress on the maximum bending failure load. The parameters requiring optimization and the final bonding parameter set were then determined from significance analysis.
2.8.1. Bonding Model Parameters and Their Physical Significance
The Hertz–Mindlin with Bonding model represents the mechanical behavior of bonded materials by generating interparticle bonds with specified stiffness, strength, and radius at particle contacts. During bending, the bonds are subjected simultaneously to normal and tangential forces and bending moments; a bond breaks when its normal or tangential stress exceeds the corresponding critical threshold, which manifests macroscopically as material failure.
The main model parameters are as follows:
- Normal contact stiffness per unit area (kn, N·m−3) and tangential contact stiffness per unit area (ks, N·m−3): these govern the normal and tangential load–displacement relations of the bonds, respectively, and affect the overall flexural stiffness and deformation characteristics of the branches.
- Critical normal stress (σc,crit, Pa) and critical tangential stress (τc,crit, Pa): these define the bond fracture thresholds under normal tension and tangential shear, respectively, and directly influence the ultimate load-bearing capacity of the branches.
- Bond radius (R_bond, mm): this specifies the effective range of the bond and is generally chosen as a proportion of the particle radius.
All these quantities are microscale equivalent parameters of the model. Normal and tangential contact stiffnesses per unit area and critical normal and tangential stresses were treated as candidate CCD factors, and their effects on maximum bending failure load were evaluated numerically. The bond radius was preset based on particle size and the relevant literature, and was held constant during the subsequent CCD analysis and response surface optimization.
2.8.2. Parameter Ranges and Experimental Design
Based on previous studies [31,32] and the relatively high lignification and bending failure loads of apple branches, the initial ranges of the bonding parameters were determined as shown in Table 2. The bond radius was fixed at 1.2 mm (generally selected as 1.1–1.3 times the particle radius) and remained unchanged throughout the CCD experiments and subsequent optimization; it was therefore not included as a response surface optimization factor.
Table 2.
Value range for Central Composite test.
Normal contact stiffness per unit area (X7), tangential contact stiffness per unit area (X8), critical normal stress (X9), and critical tangential stress (X10) were used as the test factors, and the maximum three-point bending failure force F from the simulation was used as the response. A rotatable Central Composite Design (CCD, α = 2) with four factors and five levels was adopted. The CCD comprised 29 runs: 16 factorial points (24 full-factorial combinations), 8 axial points (α = ±2), and 5 center-point replicates. The center-point replicates were used to estimate pure error and assess model fit. The factor coding scheme is shown in Table 3.
Table 3.
Bonding-parameter test factors and coding.
2.8.3. Regression Modeling and Parameter Optimization
The calibrated contact parameters and the X7, X8, X9, and X10 levels corresponding to each CCD run were entered into EDEM 2022. Three-point bending simulations were performed, and the maximum bending failure load was recorded for each combination. Multiple quadratic regression was applied to establish a second-order model relating the maximum failure load to the candidate bonding parameters. ANOVA was used to test the significance of main effects, interactions, and quadratic terms (p < 0.05, significant; p < 0.01, highly significant). Bonding parameter CCD design, regression, ANOVA, and response surface optimization were also conducted in Design-Expert 13.
According to the significance analysis, critical normal stress X9 had no statistically significant effect on the maximum bending failure load within the investigated range and was therefore fixed at its center level of 5.00 × 10⁷ Pa. With X9 fixed, X7, X8, and X10 were optimized using the experimentally measured maximum three-point bending failure load of 423.9 N as the target. Together with the preset bond radius of 1.2 mm, the optimized values constituted the final bonding parameter set.
To reduce the influence of random particle generation on the representativeness of a single numerical result, five independent three-point bending simulations were carried out with different random particle configurations while keeping the final bonding parameters, model geometry, particle size, contact parameters, boundary conditions, and loading conditions unchanged. The mean of the five maximum bending failure loads was taken as the final simulated response. The standard deviation (SD) and coefficient of variation (CV) were calculated to quantify variation among repeated simulations.
3. Results
3.1. Measured Physical, Mechanical, and Contact Parameters
This section reports the intrinsic parameters, contact parameters, and macroscopic physical test results (angle of repose and three-point bending) of apple branches. The parameters can be divided into two categories: intrinsic physical properties of the material (moisture content, density, Poisson’s ratio, elastic modulus, and shear modulus) and contact parameters (coefficient of restitution, static friction coefficient, and rolling friction coefficient). The measured contact parameters were used to define the factor levels in the subsequent PB test and were ultimately determined after calibration and optimization.
3.1.1. Intrinsic Physical and Mechanical Parameters
The intrinsic parameters of apple branches and steel plates used as inputs to EDEM are summarized in Table 4. The mean moisture content, measured by oven drying, was 48.3%, and the mean density, measured by liquid displacement, was 1044.8 ± 53.1 kg·m−3. Uniaxial compression tests yielded a branch Poisson’s ratio of 0.42 ± 0.0266 and an elastic modulus of 1.53 ± 0.0629 GPa, from which the shear modulus was calculated as 0.54 GPa. These values were directly entered as the intrinsic material properties of the branches in subsequent EDEM simulations.
Table 4.
Intrinsic parameters of apple branches and steel plate.
3.1.2. Contact Parameters
The free-fall and inclined-plane tests yielded the following contact parameters. The branch–steel coefficient of restitution was 0.41 ± 0.0169, and the branch–branch coefficient was 0.157 ± 0.0060. The branch–steel static friction coefficient was 0.42 ± 0.0186, and the branch–branch coefficient was 0.45 ± 0.0162. The branch–steel rolling friction coefficient was 0.08 ± 0.0038, and the branch–branch coefficient was 0.06 ± 0.0024. These measurements informed the factor ranges used in the PB design, as shown in Table 1.
3.1.3. Physical Angle-of-Repose Test
Five replicate tests were conducted using the cylinder-lifting and image-processing procedures described in Section 2.4.1. The image-processing workflow is shown in Figure 8. The measured angles of repose were 27.64°, 28.12°, 28.69°, 29.05°, and 29.35°. The mean angle was 28.57 ± 0.69° (mean ± sample standard deviation; n = 5), with a coefficient of variation of 2.43% and a range of 27.64–29.35°. The mean served as the target response for subsequent contact parameter calibration.
Figure 8.
Angle-of-repose image-processing workflow.
3.1.4. Physical Three-Point Bending Test
Ten replicate tests were conducted using the three-point bending loading method described in Section 2.4.2, yielding an average maximum bending failure force of 423.9 ± 26.3 N for the apple branches.
3.2. Contact-Parameter Calibration and Validation Results
Following the three-step calibration strategy described in Section 2.6 (PB screening → steepest ascent → CCD optimization), this section sequentially reports the calibration process and results for the contact parameters. The physical angle of repose (28.57°) was used as the target response throughout the calibration procedure. Finally, validation tests were conducted to evaluate the reliability of the calibrated parameters.
3.2.1. Plackett–Burman Test: Screening of Key Factors
The 12 PB test runs and corresponding simulated angles of repose are shown in Table 5. When the branch–branch static friction coefficient X2 and rolling friction coefficient X3 were at low levels (e.g., Run 1: X2 = 0.2, X3 = 0.02), the angle of repose was only 14.527°, far below the physical-test value. In contrast, when both parameters were at high levels (Run 3: X2 = 0.6, X3 = 0.1), the angle of repose reached 40.792°, which was substantially higher. These results indicate that both factors exert a clear positive effect on the angle of repose.
Table 5.
Plackett–Burman factor coding scheme and results.
Analysis of variance of the test results (Table 6) showed that the overall model was highly significant (p = 0.0010). Among the factors, X2 (branch–branch static friction coefficient) had the largest F-value (116.74, p = 0.0001) and exerted the most significant effect on the angle of repose, followed by X3 (branch–branch rolling friction coefficient; F = 49.14, p = 0.0009). None of the three branch–steel plate parameters (X4, X5, and X6) reached statistical significance (p > 0.05), although X5 (branch–steel plate static friction coefficient) had a p-value of 0.0799, close to the significance threshold. These results indicate that branch–branch interactions, specifically sliding and rolling resistance, are the main factors determining pile morphology during the cylinder-lifting process, whereas branch–steel plate contact behavior has a relatively limited effect on the angle of repose. Accordingly, X2 and X3 were selected as the key factors for subsequent calibration, while the remaining parameters were fixed at their physically measured values.
Table 6.
Plackett–Burman test significance analysis.
3.2.2. Steepest Ascent Test: Approaching the Optimal Region
The significance analysis of the Plackett–Burman test showed that the branch–branch static friction coefficient X2 and branch–branch rolling friction coefficient X3 had the most significant effects on the angle of repose θ′, whereas the other contact parameters had relatively minor effects. This indicates that, when the branches transition from a constrained state to free piling after cylinder lifting, branch–branch sliding resistance and rolling resistance are the primary factors controlling the stable pile morphology. Therefore, X2 and X3 were selected as the adjustable factors in the steepest ascent test, and the relative error η between the simulated angle of repose and the physical bench-test angle of repose of 28.57° was used as the evaluation index. The remaining nonsignificant parameters were set to the values measured in the preliminary physical tests to reduce interference from irrelevant factors. The steepest ascent test scheme and results are shown in Table 7.
Table 7.
Steepest ascent test scheme and results.
As X2 increased from 0.2 to 0.6 and X3 increased from 0.02 to 0.10, the simulated angle of repose θ′ increased monotonically from 15.717° to 41.298°, while the relative error η first decreased and then increased in a V-shaped pattern: Run 1, η = 44.99% → Run 2, 12.71% → Run 3, 1.32% (minimum) → Run 4, 8.87% → Run 5, 44.55%. This trend indicates that when the friction parameters are too small, insufficient resistance between branches allows the pile to spread easily, resulting in a low angle of repose. When the friction parameters are too large, branch sliding and rolling are inhibited, producing an excessively steep pile slope and an overly high angle of repose. The angle of repose in Run 3 (X2 = 0.4, X3 = 0.06) was 28.194°, closest to the physical value of 28.57°, with a relative error of only 1.32%. Therefore, this run was selected as the center point, while Runs 2 and 4 were used as the low and high levels, respectively, to determine the CCD factor ranges.
3.2.3. Central Composite Response Surface Optimization
Based on the key-factor ranges determined by the steepest ascent test, a Central Composite response surface design was further used to optimize the contact parameters of the apple branches. According to the preceding significance-screening results, the branch–branch static friction coefficient X2 and branch–branch rolling friction coefficient X3 were selected as response-surface factors, and the branch angle of repose θ′ was used as the response. Their individual and interactive effects on the angle of repose were analyzed. Central Composite experimental factor coding is presented in Table 8.
Table 8.
Central Composite test factors and coding.
The CCD scheme and results are shown in Table 9.
Table 9.
Central Composite test scheme and results.
A significance analysis was performed on the test-result data in Table 9, and the results are presented in Table 10:
Table 10.
Central Composite test significance analysis of contact parameters.
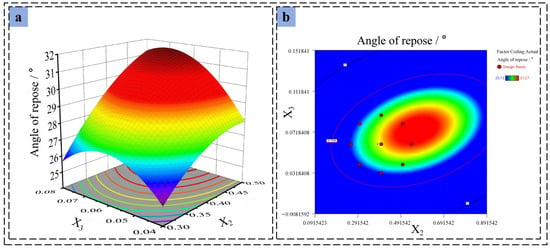
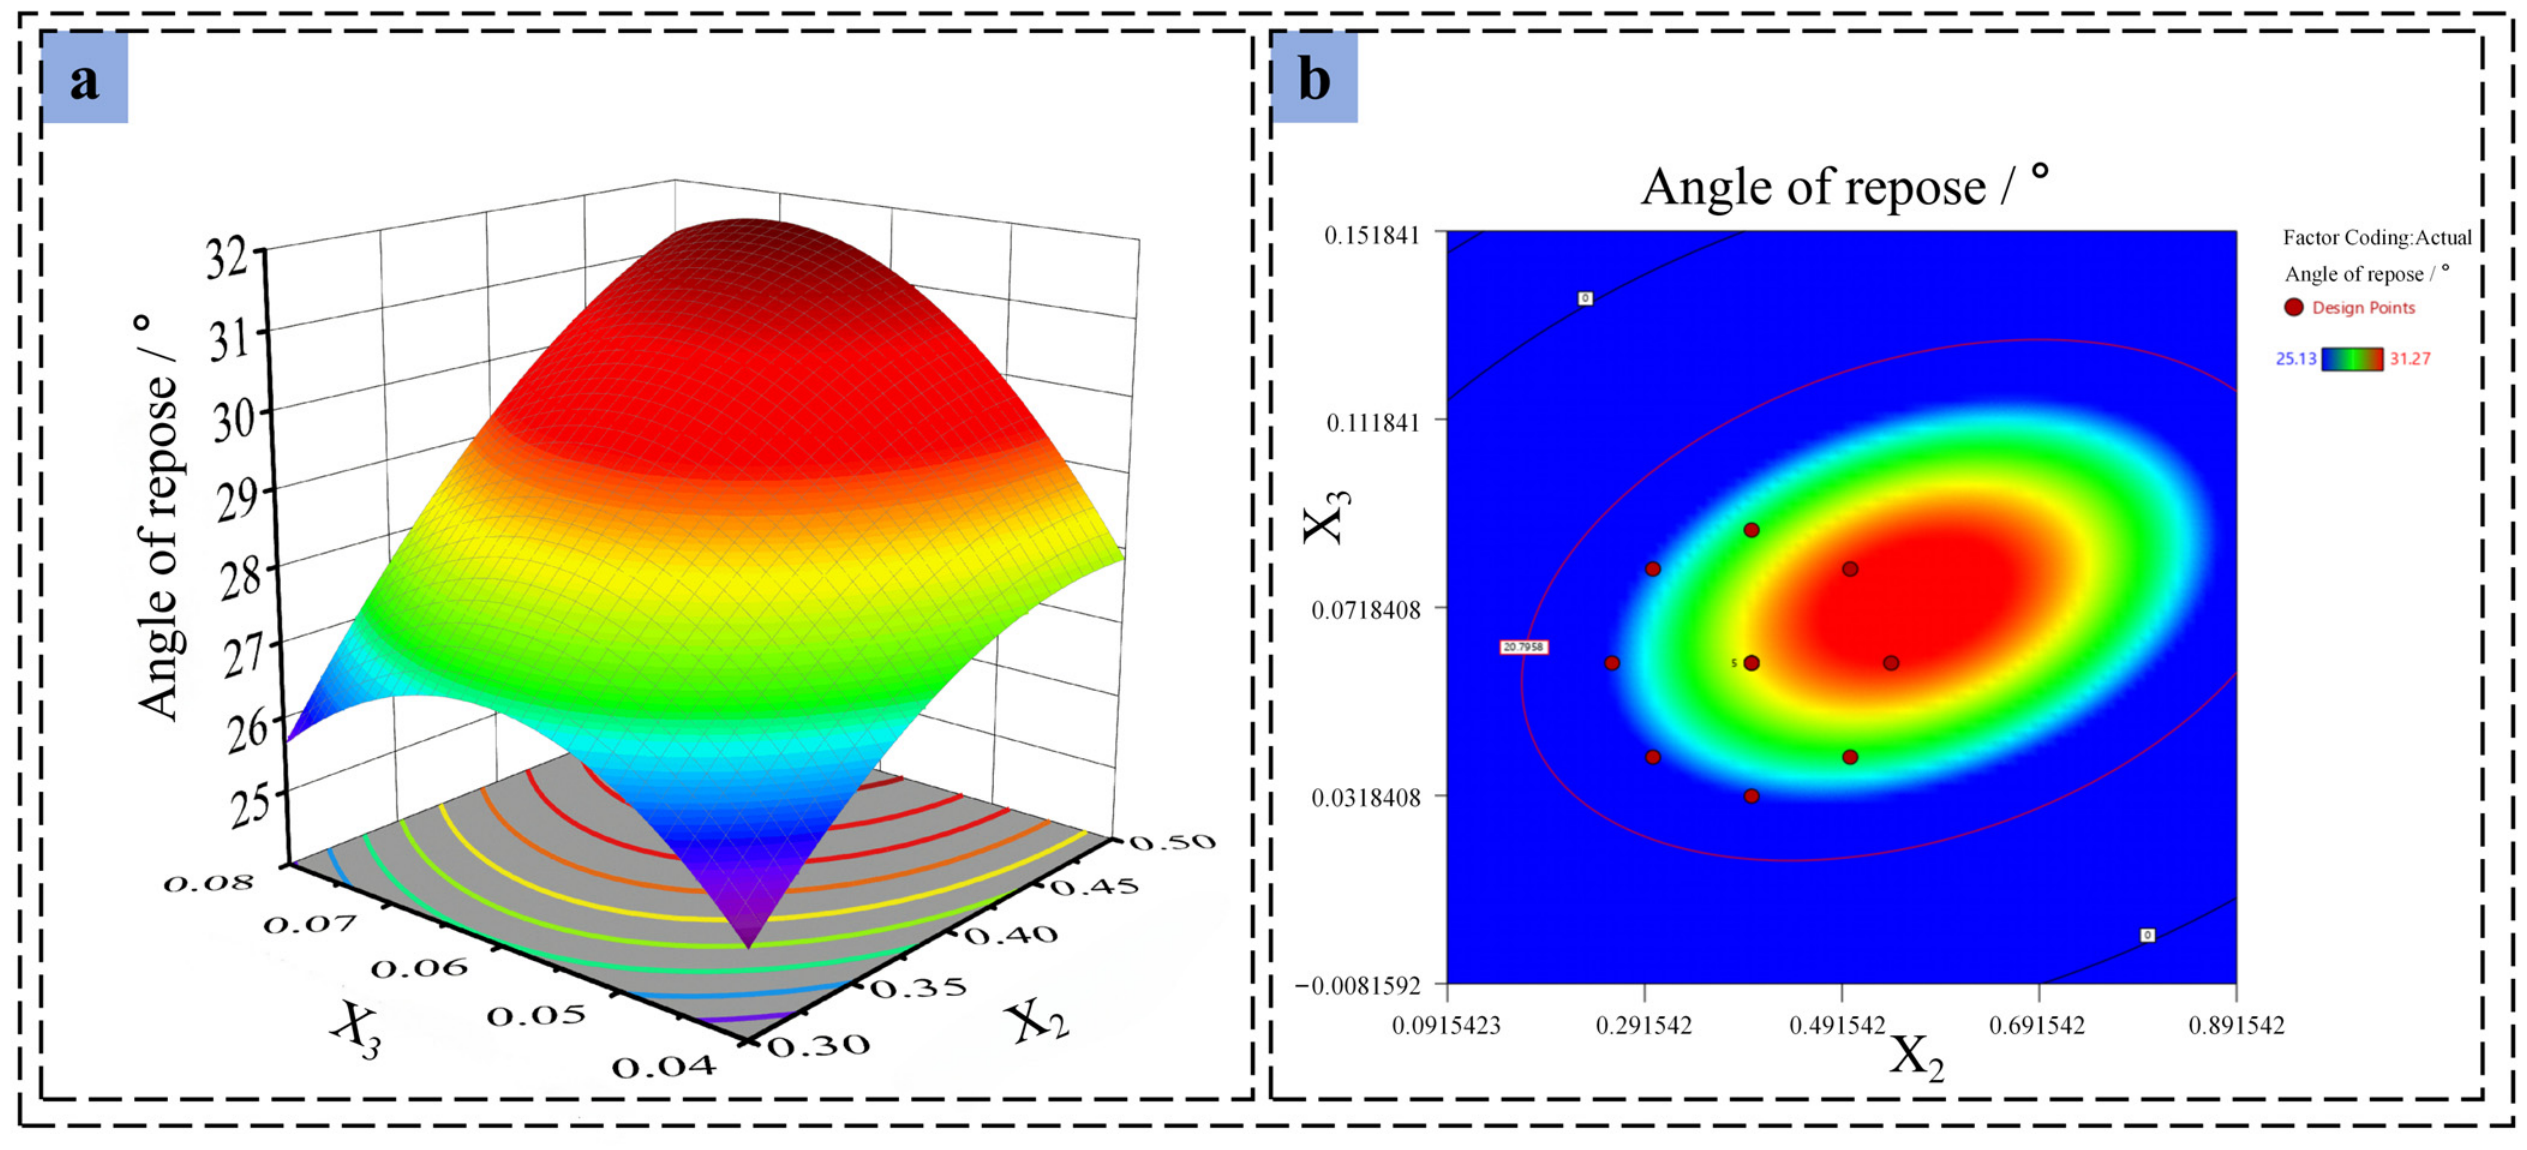
The angles of repose from the 13 runs ranged from 25.13° to 31.27°, covering the region around the physical value of 28.57°. Multiple regression analysis of the test results (Table 10) showed that the model was highly significant (p < 0.0001), with a coefficient of determination R2 = 0.9992 and an adjusted coefficient of determination R2_adj = 0.9986, indicating extremely high fitting accuracy. The lack-of-fit term was not significant (p = 0.0689 > 0.05), indicating no significant lack of fit and demonstrating that the model effectively described the response relationship between X2, X3, and the angle of repose. The regression equation is given in Equation (7):
The regression equation shows that the linear coefficient of X2 (2.09) is approximately 2.1 times that of X3 (0.984), further confirming that the main effect of X2 on the angle of repose is stronger than that of X3. The interaction coefficient is positive (0.715), indicating a synergistic effect between the two factors: when both increase simultaneously, the increase in the angle of repose is greater than the linear superposition of their individual effects. The response surface is shown in Figure 9.
Figure 9.
Response surface of the angle of repose of apple branches: (a) three-dimensional response surface; (b) response-surface two-dimensional contour plot.
Using the physical angle of repose θ = 28.57° as the target value, optimization of the regression equation yielded X2 = 0.348 and X3 = 0.067.
3.2.4. Angle-of-Repose Simulation Validation
To assess the reliability of the calibrated parameters, the intrinsic material parameters (Table 4), measured values of the nonsignificant contact factors (X1 = 0.157, X4 = 0.41, X5 = 0.42, and X6 = 0.08), and response-surface-optimized values of the key factors (X2 = 0.348 and X3 = 0.067) were compiled in Table 11. The final contact parameter set was entered into EDEM for an angle-of-repose simulation, yielding 28.35°. The mean of five physical measurements was 28.57 ± 0.69°, with a range of 27.64–29.35°. The simulated value differed from the experimental mean by 0.22°, or 0.77% in relative terms. It fell within the range of the five physical measurements, and its deviation from the mean (0.22°) was smaller than the experimental standard deviation (0.69°). Thus, considering the variability among repeated physical tests, the calibrated contact parameter set adequately reproduced the target angle of repose under the conditions of this study.
Table 11.
Parameter values used in the apple-branch angle-of-repose validation simulation.
3.3. Bonding-Parameter Calibration and Validation Results
After completing the contact-parameter calibration in Section 3.2, the physical three-point bending maximum failure force (423.9 N) was used as the target response in this section. CCD response surface methodology was employed to calibrate four key parameters of the Hertz–Mindlin with Bonding model: normal contact stiffness X7, tangential contact stiffness X8, critical normal stress X9, and critical tangential stress X10. The optimized parameters were then validated by a three-point bending simulation to evaluate the reliability of the calibrated parameter set.
3.3.1. Central Composite Response Surface Calibration
The CCD scheme and the results of the 29 simulation runs are shown in Table 12.
Table 12.
Central Composite bonding-parameter test scheme and results.
The maximum three-point bending failure load varied substantially among bonding parameter combinations. The minimum value occurred in Run 16 (X7 = −2; normal stiffness at its lowest level of 1.0 × 10¹¹ N·m−3), with F = 244.30 N, equivalent to only 57.6% of the physical value. The maximum occurred in Run 12 (X7 = +2; normal stiffness at its highest level of 3.0 × 10¹¹ N·m−3), with F = 526.37 N, exceeding the experimental value by 24.2%. For the five center-point runs, the mean response was 392.01 N, the sample standard deviation was 15.91 N, and CV was 4.06%. These findings indicate that normal contact stiffness is the dominant factor controlling the ultimate bending load-bearing capacity of the branches.
ANOVA (Table 13) showed that the overall regression model was highly significant (p < 0.0001), with R2 = 0.9839 and an adjusted R2_adj = 0.9678. Thus, the model explained more than 98% of the response variation. The lack-of-fit term was not significant (p = 0.8554 > 0.05), indicating no significant lack of fit and suggesting that the model adequately represents the response relationships between the bonding parameters and bending failure load.
Table 13.
Central Composite test significance analysis of bonding parameters.
Among the factors, the normal contact stiffness X7 had the largest F-value (769.15, p < 0.0001) and the most significant effect on bending failure force, consistent with the preceding extreme-value analysis. Critical tangential stress X10 ranked second (F = 38.65, p < 0.0001), while tangential contact stiffness X8 had a significant effect (F = 5.09, p = 0.0406); the effect of critical normal stress X9 was not significant (p = 0.7279). Among the interaction terms, X7X8 (normal stiffness × tangential stiffness) was highly significant (p = 0.0010), while X7X10 and X8X10 were significant (p = 0.0212 and 0.0177, respectively). These results indicate coupling between the stiffness parameters and critical tangential stress: changes in stiffness alter the stress level within the bonds and thus affect the time at which the tangential stress reaches its critical value. Among the quadratic terms, only X102 was significant (p = 0.045), whereas the remaining quadratic terms were not significant.
Based on the regression analysis, the quadratic regression equation for the three-point bending failure force is given in Equation (8):
Because the critical normal stress X9, its interaction terms, and its quadratic term were not significant in the bending test, the center-level value was selected for this parameter; that is, the critical normal stress was set to 5.00 × 10⁷ Pa. After fixing X9, the significance analysis was repeated, and the results are shown in Table 14.
Table 14.
Central Composite test significance analysis of bonding parameters after fixing X9.
The adjusted significant quadratic regression equation is:
Using the maximum three-point bending failure force measured in the physical test, 423.9 N, as the target value, the regression equation was optimized, and the resulting parameters are listed in Table 15.
Table 15.
Final bonding parameter settings.
3.3.2. Three-Point Bending Simulation Validation
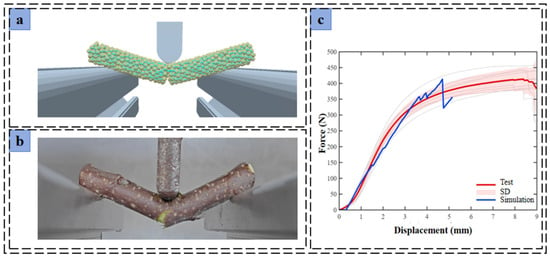
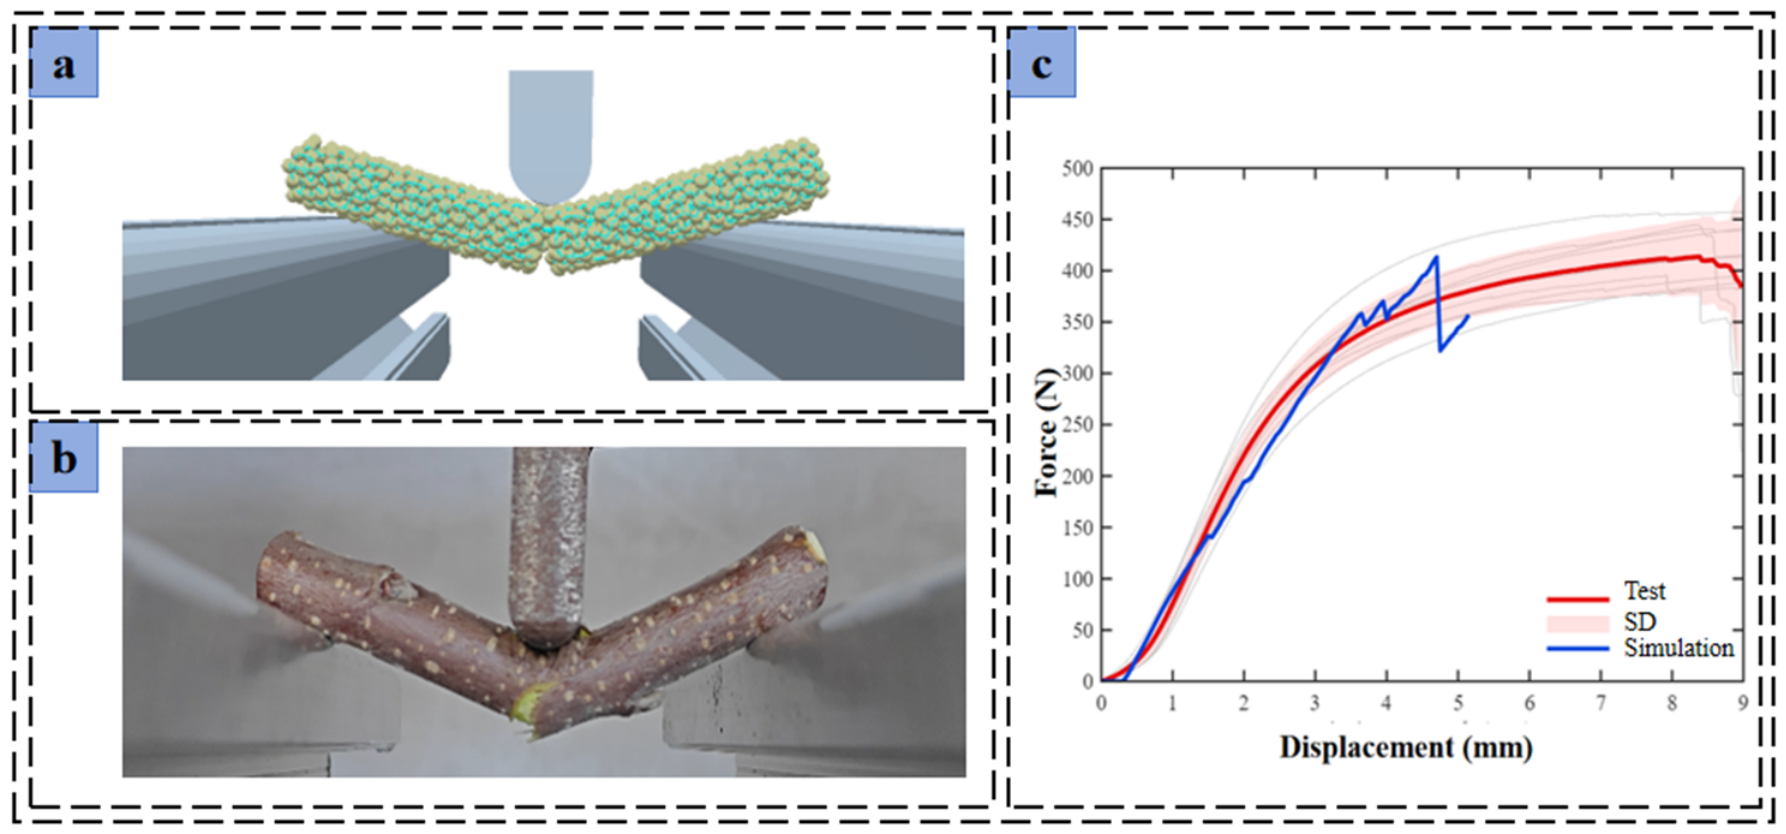
The final bonding parameters in Table 15, contact parameters in Table 11, and intrinsic properties in Table 4 were entered into EDEM 2022 for repeated three-point bending simulations. Five repeated simulations with the final parameter set produced a maximum bending failure load of 413.30 ± 23.53 N (mean ± standard deviation), corresponding to a relative difference of 2.50% with respect to the experimental target value of 423.9 N used for parameter calibration. This indicates that the identified parameter set can adequately reproduce the peak quasi-static three-point bending failure load under the conditions investigated. Simulated and experimental load–displacement curves are compared in Figure 10.
Figure 10.
Three-point bending test: (a) simulation; (b) physical test; (c) force–displacement curve.
As shown in Figure 10, the simulated and experimentally measured peak loads were relatively close. The difference between the simulated and physical mean values was 10.60 N, corresponding to a relative difference of 2.50%. However, the maximum three-point bending failure load was itself the target response for bonding parameter calibration, and the experimental mean of 423.9 N served as both the optimization target and the comparison benchmark. Accordingly, this result mainly demonstrates the ability of the identified parameter set to reproduce the calibration target peak load and should not be regarded as independent predictive validation.
Nevertheless, substantial differences remained between simulation and experiment in displacement at peak load and in post-peak response. In the simulated curve, the load peaked at approximately 4.7 mm displacement and then decreased rapidly with some fluctuations. The experimental curve reached its peak at a noticeably larger displacement, and its load changed more gradually near and after the peak, indicating greater sustained deformation and progressive damage. Therefore, the agreement observed here is limited to the peak load; the current model does not yet accurately reproduce the displacement at peak, post-peak behavior, or the full load–displacement response.
4. Discussion
The final branch–branch coefficient of restitution, static friction coefficient, and rolling friction coefficient determined in this study were 0.157, 0.348, and 0.067, respectively; the latter two were the main factors influencing the angle of repose. Previous DEM studies of agricultural stalks have reported appreciable differences in equivalent contact parameters across materials. Hu et al. [18] calibrated ramie stalk parameters against the angle of repose and obtained static and rolling friction coefficients of 0.41 and 0.056 for bast–bast contacts, and 0.44 and 0.016 for woody tissue–woody tissue contacts, respectively. Zhang et al. [17] used cylinder-lifting angle-of-repose tests and response surface methodology to calibrate contact parameters for chopped cotton stalks, obtaining interparticle coefficients of restitution, static friction, and rolling friction of 0.45, 0.47, and 0.16, respectively.
Compared with these reports, the coefficient of restitution for apple branches in the present study was generally lower; the static friction coefficient was of a similar order of magnitude to those reported for other stalk materials. The rolling friction coefficient was lower than values reported for chopped cotton stalks but higher than that for woody tissue–woody tissue contacts in ramie. Differences among studies may arise jointly from surface morphology, tissue structure, moisture condition, specimen size and geometry, particle representation, contact model, and calibration procedure. Importantly, the parameter determination methods are not identical across studies: some values were measured directly, whereas others are equivalent DEM parameters inversely calibrated from angle-of-repose responses. Cross-material comparisons therefore illustrate the scale of parameter values and differences among models, but should not be interpreted directly as differences in intrinsic material friction properties.
When the final parameter set was used to reproduce the calibration responses, the simulated angle of repose of apple branches was 28.35°, and five repeated three-point bending simulations yielded a maximum failure load of 413.30 ± 23.53 N. The relative difference between the simulated and experimental mean bending failure loads was 2.50%. Because these same physical responses were used for parameter calibration, the results primarily reflect the capacity of the chosen parameters to reproduce the calibration targets. This study used the maximum three-point bending failure load as the sole response for bonding parameter calibration. This quantity represents the ultimate macroscopic load-bearing capacity of a branch under quasi-static bending and is commonly used as an equivalent calibration index in bonding-model studies of plant stalks; it is therefore consistent with the aim of providing macroscopic load-bearing parameters for mechanical branch processing. However, a single peak-load response imposes limited constraints on bonding parameters, and different bonding parameter combinations may produce similar maximum failure loads. Consequently, the uniqueness of the resulting parameter combination has not been established. The values reported here should be regarded as an equivalent parameter set that reproduces the current target peak force. Agreement in peak force does not imply accurate reproduction of the complete load–displacement response.
As shown in Figure 10, differences remain between simulation and experiment in displacement at peak load and post-peak fracture behavior. The model uses a homogeneous, isotropic representation of bonded particles without explicitly distinguishing the mechanical properties of bark, phloem, xylem, and pith. This simplification may affect the simulation of deformation and progressive failure. Nevertheless, the available results do not allow its effects to be separated from those of particle discretization and single-response calibration. Therefore, the error attributable specifically to the homogenization assumption cannot be quantified independently.
Accordingly, the obtained values should be considered equivalent model parameters dependent on the material condition, particle discretization, and bonding settings used in this study. Their applicability is primarily limited to conditions similar to those of the one-year-old Fuji apple branches, moisture condition, and modeling setup investigated here. The present evaluation covers only static stacking and quasi-static three-point bending. Although the parameters provide a basis for subsequent DEM modeling of branch pickup, conveying, feeding, and shredding, their applicability under high-speed impact, shear, and compression remains to be verified. Future work will extend calibration to branches of different types and moisture conditions and evaluate the model through dynamic cutting, impact, and actual shredding tests. Additional response variables, such as flexural stiffness, and tissue-structure information will be incorporated to improve particle discretization and bond modeling.
5. Conclusions
- (1)
- One-year-old Fuji apple branches collected during winter pruning from a high-density dwarf-rootstock orchard were used to measure the fundamental physical properties required for DEM modeling. The mean basal diameter was 10.2 mm; moisture content, 48.3%; density, 1044.8 kg·m−3; Poisson’s ratio, 0.42; elastic modulus, 1.53 GPa; and shear modulus, 0.54 GPa. Physical tests yielded a mean angle of repose of 28.57° and a maximum three-point bending failure load of 423.9 N.
- (2)
- Contact parameters were calibrated using the angle of repose as the target response. The branch–branch static and rolling friction coefficients were the primary factors affecting the angle of repose, and response surface optimization yielded final values of 0.348 and 0.067, respectively. The measured branch–branch coefficient of restitution, 0.157, was adopted, together with the measured branch–steel coefficient of restitution, static friction coefficient, and rolling friction coefficient of 0.41, 0.42, and 0.08, respectively. The resulting contact parameter set produced a simulated angle of repose of 28.35°, differing from the experimental mean of 28.57° by 0.77%, indicating that it adequately reproduced the target angle of repose under the study conditions.
- (3)
- Bonding parameters were calibrated using the Hertz–Mindlin with Bonding model and the maximum three-point bending failure load as the target response. Response surface optimization yielded normal and tangential contact stiffnesses per unit area of 2.15 × 10¹¹ and 2.00 × 10¹¹ N·m−3, respectively, and a critical tangential stress of 5.17 × 10⁷ Pa. Based on significance analysis, the critical normal stress was fixed at its center level of 5.00 × 10⁷ Pa, and the bond radius was preset to 1.2 mm. Five repeated bending simulations using the final parameter set yielded a maximum failure load of 413.30 ± 23.53 N, with a CV of 5.69% and a relative difference of 2.50% between simulated and experimental mean values. Thus, the parameters reproduced the target quasi-static three-point bending peak failure load under the present conditions, but this does not demonstrate accurate representation of the full deformation and fracture process.
The reported parameters are equivalent model parameters identified for specific material conditions, particle discretization, and bonding settings. Their main applicability is to one-year-old Fuji apple branches and moisture conditions and model configurations similar to those investigated here. The results provide a parameter basis for subsequent DEM modeling of branch collection, conveying, feeding, and shredding, although applicability to high-speed impact, shear, and compression must be evaluated further.
Author Contributions
Conceptualization, Z.L., H.L. and P.W.; methodology, Z.L., P.W. and X.Y.; software, Z.L. and L.L.; validation, Z.L., L.L. and J.L.; formal analysis, H.L. and Z.L.; investigation, H.L. and Z.L.; resources, X.Y.; data curation, Z.L. and H.L.; writing—original draft preparation, Z.L.; writing—review and editing, X.Y. and L.L.; visualization, H.L.; supervision, X.Y., P.W. and J.L.; project administration, X.Y.; funding acquisition, X.Y. All authors have read and agreed to the published version of the manuscript.
Funding
This study was supported by the Special Fund of the National Modern Agricultural Industry Technology System (CARS-25); it was also funded by the Special Fund of the Apple Innovation Team of the Modern Agricultural Industry Technology System of Hebei Province (HBCT2024150202).
Institutional Review Board Statement
Not applicable.
Data Availability Statement
The data presented in this study are available on request from the corresponding author.
Acknowledgments
During the writing of this paper, GPT―5.6 was only adopted for language polishing and format typesetting optimization. All research ideas, experimental data, analyses and original conclusions in this manuscript were independently completed by the author. AI tools were not involved in experimental design, data generation, result deduction and core viewpoint creation. The author has fully reviewed the full text and takes full responsibility for the authenticity and academic originality of this paper.
Conflicts of Interest
The authors declare no conflicts of interest.
References
- Lu, Y.; Liu, G.; Xian, Y.; Tang, J.; Zhong, L. Climate change brings both opportunities and challenges to rural revitalization in China: Evidence from apple geographical indication predictions. Agric. Syst. 2024, 216, 103900. [Google Scholar] [CrossRef] [Scilit]
- Mhamed, M.; Zhang, Z.; Yu, J.; Li, Y.; Zhang, M. Advances in apple’s automated orchard equipment: A comprehensive research. Comput. Electron. Agric. 2024, 221, 108926. [Google Scholar] [CrossRef] [Scilit]
- Food and Agriculture Organization of the United Nations (FAO). Apple Production—UN FAO [Dataset]. Production: Crops and Livestock Products; Major Processing by Our World in Data, 2025. Available online: https://ourworldindata.org/grapher/apple-production (accessed on 6 March 2026).
- Zhou, S.; Shen, Z.; Yin, B.; Liang, B.; Li, Z.; Zhang, X.; Xu, J. Effects of Dwarfing Interstock Length on the Growth and Fruit of Apple Tree. Horticulturae 2023, 9, 40. [Google Scholar] [CrossRef] [Scilit]
- Zhou, E.; Lyu, S.; Du, G.; Lyu, D. Evaluation of the Effects of Returning Apple Shoots In Situ on Soil Quality in an Apple Orchard. Agronomy 2022, 12, 2645. [Google Scholar] [CrossRef] [Scilit]
- Kowaluk, G.; Szymanowski, K.; Kozlowski, P.; Kukula, W.; Sala, C.; Robles, E.; Czarniak, P. Functional Assessment of Particleboards Made of Apple and Plum Orchard Pruning. Waste Biomass Valorization 2020, 11, 2877–2886. [Google Scholar] [CrossRef] [Scilit]
- Li, C.; Zhang, H.; Wang, Q.; Chen, Z. Influencing Factors of Cutting Force for Apple Tree Branch Pruning. Agriculture 2022, 12, 312. [Google Scholar] [CrossRef] [Scilit]
- Maraveas, C.; Tsigkas, N.; Bartzanas, T. Agricultural processes simulation using discrete element method: A review. Comput. Electron. Agric. 2025, 237, 110733. [Google Scholar] [CrossRef] [Scilit]
- Scheffler, O.C.; Coetzee, C.J.; Opara, U.L. A discrete element model (DEM) for predicting apple damage during handling. Biosyst. Eng. 2018, 172, 29–48. [Google Scholar] [CrossRef] [Scilit]
- Zhao, H.; Huang, Y.; Liu, Z.; Liu, W.; Zheng, Z. Applications of Discrete Element Method in the Research of Agricultural Machinery: A Review. Agriculture 2021, 11, 425. [Google Scholar] [CrossRef] [Scilit]
- Tian, Y.; Zeng, Z.; Xing, Y. A Review of Discrete Element Method Applications in Soil–Plant Interactions: Challenges and Opportunities. Agriculture 2024, 14, 1486. [Google Scholar] [CrossRef] [Scilit]
- Guo, Q.; Xia, H. A review of the discrete element method/modelling in agricultural engineering. J. Agric. Eng. 2023, 54, 425–434. [Google Scholar] [CrossRef] [Scilit]
- Chen, Z.; Wassgren, C.; Ambrose, R.P.K.; Du, Y.; Song, Z.; Li, X. Coefficient of restitution considerations in the discrete element method for agricultural materials: A review. Biosyst. Eng. 2026, 262, 104364. [Google Scholar] [CrossRef] [Scilit]
- Yue, Y.; Zhang, Q.; Dong, B.; Li, J. Application of Discrete Element Method to Potato Harvesting Machinery: A Review. Agriculture 2025, 15, 315. [Google Scholar] [CrossRef] [Scilit]
- Chen, Z.; Wassgren, C.; Veikle, E.; Ambrose, K. Determination of material and interaction properties of maize and wheat kernels for DEM simulation. Biosyst. Eng. 2020, 195, 208–226. [Google Scholar] [CrossRef] [Scilit]
- Fang, M.; Yu, Z.; Zhang, W.; Cao, J.; Liu, W. Friction coefficient calibration of corn stalk particle mixtures using Plackett-Burman design and response surface methodology. Powder Technol. 2022, 396, 731–742. [Google Scholar] [CrossRef] [Scilit]
- Zhang, B.; Chen, X.; Liang, R.; Wang, X.; Meng, H.; Kan, Z. Calibration and Test of Contact Parameters between Chopped Cotton Stalks Using Response Surface Methodology. Agriculture 2022, 12, 1851. [Google Scholar] [CrossRef] [Scilit]
- Hu, Y.; Xiang, W.; Duan, Y.; Yan, B.; Ma, L.; Liu, J.; Lyu, J. Calibration of Ramie Stalk Contact Parameters Based on the Discrete Element Method. Agriculture 2023, 13, 1070. [Google Scholar] [CrossRef] [Scilit]
- Liu, F.; Zhang, J.; Chen, J. Modeling of flexible wheat straw by discrete element method and its parameter calibration. Int. J. Agric. Biol. Eng. 2018, 11, 42–46. [Google Scholar] [CrossRef] [Scilit]
- Qingqiu, C.; Shengwei, Z.; Tao, L.; Gaixia, Z.; Hongfang, Y. Discrete element modelling and mechanical properties and cutting experiments of Caragana korshinskii Kom. stems. Front. Plant Sci. 2024, 15, 1457243. [Google Scholar] [CrossRef] [Scilit] [PubMed]
- Zhang, J.; Xie, J.; Du, Y.; Li, Y.; Yue, Y.; Cao, S. Discrete element modeling and experimental study of biomechanical properties of cotton stalks in machine-harvested film-stalk mixtures. Sci. Rep. 2024, 14, 12933. [Google Scholar] [CrossRef] [Scilit] [PubMed]
- Su, Q.; Ma, X.; Liu, W.; Zhang, J.; Yu, Z.; Liu, Z. Elastoplastic fracture behavior of Caragana korshinskii Kom. branches: A discrete element model for biomechanical insights into shrub resource utilization. Front. Plant Sci. 2025, 16, 1590054. [Google Scholar] [CrossRef] [Scilit] [PubMed]
- GB/T 5262-2008; Agricultural Machinery Testing Conditions—General Rules for Measuring Methods. Standards Press of China: Beijing, China, 2008. Available online: https://openstd.samr.gov.cn/bzgk/std/newGbInfo?hcno=24242BA41C6C88B16F72B808459C3A4F (accessed on 6 March 2026).
- Zhao, W.; Chen, M.; Xie, J.; Cao, S.; Wu, A.; Wang, Z. Discrete element modeling and physical experiment research on the biomechanical properties of cotton stalk. Comput. Electron. Agric. 2023, 204, 107502. [Google Scholar] [CrossRef] [Scilit]
- Wang, C.; Yang, Y.; Zhou, Y.; Shao, Y.; Zhang, W. Development and experimental validation of a flexible model for Vicia villosa stems based on a DEM-MBD coupled calibration framework. Ind. Crops Prod. 2026, 249, 123710, Correction in Ind. Crops Prod. 2026, 251, 124198. [Google Scholar] [CrossRef] [Scilit]
- Long, S.; Zhang, Y.; Kang, S.; Li, B.; Wang, J. Parameter calibration of the angle of repose of particle materials based on convolutional neural network. Biosyst. Eng. 2024, 245, 152–163. [Google Scholar] [CrossRef] [Scilit]
- Sun, K.; Yu, J.; Zhao, J.; Liang, L.; Wang, Y.; Yu, Y. A DEM-based general modeling method and experimental verification for wheat plants in the mature period. Comput. Electron. Agric. 2023, 214, 108283. [Google Scholar] [CrossRef] [Scilit]
- Chen, X.; Bai, J.; Wang, X.; Fang, W.; Hong, T.; Zang, N.; Fang, L.; Wang, G. Calibration and Testing of Discrete Elemental Simulation Parameters for Pod Pepper Seeds. Agriculture 2024, 14, 831. [Google Scholar] [CrossRef] [Scilit]
- Zhong, P.; Jia, W.; Yang, W.; He, J.; Zhang, E.; Yu, D.; Xu, Y.; Chen, J.; Peng, F.; Zeng, G.; et al. Calibration and Testing of Parameters for the Discrete Element Simulation of Soil Particles in Paddy Fields. Agriculture 2024, 14, 118. [Google Scholar] [CrossRef] [Scilit]
- Liu, H.; Lu, Q.; Wang, J.; Zhou, W.; Wang, N. Rapid calibration method for discrete element simulation parameters of columnar granular organic fertilizer with variable moisture content. Powder Technol. 2024, 448, 120354. [Google Scholar] [CrossRef] [Scilit]
- Shan, Y.; Liao, Q.; Wan, X.; Yuan, J.; Liao, Y.; Gao, D. Calibration of bonded-particle model parameters and simulation of compression behavior for oilseed rape shoot stalks. Int. J. Agric. Biol. Eng. 2024, 17, 46–58. [Google Scholar] [CrossRef] [Scilit]
- Patel, A.; Singh, K.P.; Roul, A.K.; Nalawade, R.D.; Mahore, A.; Kumar, M.; Avilala, P.; Ramulu, C.; Kebede, B.; Patra, A. Quantitative assessment and optimization of parallel contact model for flexible paddy straw: A definitive screening and central composite design approach using discrete element method. Sci. Rep. 2024, 14, 1961. [Google Scholar] [CrossRef] [Scilit] [PubMed]

Disclaimer/Publisher’s Note: The statements, opinions and data contained in all publications are solely those of the individual author(s) and contributor(s) and not of MDPI and/or the editor(s). MDPI and/or the editor(s) disclaim responsibility for any injury to people or property resulting from any ideas, methods, instructions or products referred to in the content. |
© 2026 by the authors. Licensee MDPI, Basel, Switzerland. This article is an open access article distributed under the terms and conditions of the Creative Commons Attribution (CC BY) license.