


Abstract
Deep neural networks have demonstrated outstanding performances in agriculture production. Agriculture production is one of the most important sectors because it has a direct impact on the economy and social life of any society. Plant disease identification is a big challenge for agriculture production, for which we need a fast and accurate technique to identify plant disease. With the recent advancement in deep learning, we can develop a robust and accurate system. This research investigated the use of deep learning for accurate and fast tomato plant disease identification. In this research, we have used individual and merged datasets of tomato plants with 10 diseases (including healthy plants). The main aim of this work is to check the accuracy of the existing convolutional neural network models such as Visual Geometry Group, Residual Net, and DenseNet on tomato plant disease detection and then design a custom deep neural network model to give the best accuracy in case of the tomato plant. We have trained and tested our models with datasets containing over 18,000 and 25,000 images with 10 classes. We achieved over 99% accuracy with our custom model. This high accuracy was achieved with less training time and lower computational cost compared to other CNNs. This research demonstrates the potential of deep learning for efficient and accurate tomato plant disease detection, which can benefit farmers and contribute to improved agricultural production. The custom model’s efficient performance makes it promising for practical implementation in real-world agricultural settings.
1. Introduction
One of the most significant industries is agriculture production because it directly affects a society’s economy and social structure [1]. Agriculture production faces a significant issue in identifying plant diseases; thus, we need a quick and precise method to do so. We can create a reliable and accurate system with the most recent advancements in deep learning convolutional neural networks (CNNs) [2]. In this study, we used two (individual, combined) datasets of tomato plants with 10 illnesses, including healthy plants as well. The major objective of this study is to compare several tomato plant diseases utilizing some of the top convolutional neural network models, including Visual Geometry Group, Residual Net, and DenseNet. In addition, we have also developed our neural network architecture. Despite the complexity of datasets exceeding 18,000 and 25,000 images with 10 distinct classes each, ResNet, DenseNet, and our custom model achieved remarkable accuracy above 99%.
The quality and amount of a nation’s production determine how much agriculture it can produce [3]. Any nation’s economic and social structure is directly impacted by the production of agricultural goods [4]. Agriculture production is essential to the advancement of society and the economy [5]. This is the reason that diagnosing and treating plant diseases has drawn so much attention due to the large amount of territory that farms now cover; finding, assessing, and treating plant diseases is a tremendously difficult problem for farmers today [6]. Traditional disease detection is a highly difficult and time-consuming technique. Additionally, there is a high likelihood of errors, which might result in productivity loss. Additionally, early diagnosis and treatment of plant diseases are essential because they have a significantly higher rate of success [7].
Because the plant’s leaves are the most apparent and susceptible to disease, they are used to recognize plant diseases [8]. We require a system that can accurately identify the condition using images. For diagnosis purposes, plant diseases and their treatments have been the subject of extensive research, but each has its limitations. Researchers have employed a variety of methodologies, including deep learning, image processing, and machine learning. As a result, these studies were fruitful, and the majority of the procedures produced results that were superior to those of human specialists, especially deep learning. Although there is still debate over whether neural architecture performs better, in this study, we compared several leading neural network architectures on tomato plant diseases using two datasets with over 1800 and 2500 sample images, respectively. Additionally, we have included our neural network design, which produced test accuracy results of 99.22 and 99.24.
2. Related Works
Current research suggests some effective methods for diagnosing plant diseases. This study begins with a review of studies on the many types of plant diseases and methods to accurately identify them to better comprehend the existing literature on their identification.
Analytical research published by Punitha, Kartikeyan, Gyanesh, and Shrivastava in 2022. In their research, they have used Deep Learning architectures AlexNet, GoogLeNet, and DenseNet with different optimizers via the stochastic gradient descent (SGD) algorithm and root mean square propagation (RMSProp) for tomato plant disease identification and classification to compare their accuracies. In this research, the best performer is GoogleLeNet, with an accuracy of 99.56% [9].
Amarjeeth Singh et al. (2022) published research in which they used vegetable crops to detect diseases like Scab, Early Blight, Leaf scorch, and Bacterial spot. In this research, deep learning and CNN architecture were used, and they achieved an accuracy of 98.87%. The accuracy achieved in this research is good, but it can still be improved [10].
Vishakha Kathole Mousami Munot (2022) performed a comparative survey of different deep learning CNN architectures like the VGG, GoogleLeNet, and AlexNet to detect plant disease using their leaves. The dataset used in this research has six different diseases and a healthy class [11].
Khalil Khan, Rehan Ullah Khan, Waleed Albattah, and Ali Mustafa Qamar published a paper in 2022. In this research, semantic segmentation is used to highlight the foreground (leaf) and the background (non-leaf) and to look through each pixel for labeling. A CNN-based model is used on the Plant Village dataset. In this research, they have achieved a total of 97.6% accuracy [12].
Swati S. Wadadare and H. S. Fadewar (2022) have researched tomato plant diseases using the latest deep learning technology. In this research, Inception V3 is used for tomato plant disease detection. The transfer learning technique is used with a training accuracy of 92.19% and a test accuracy of 93.03% [13].
Chen, Hsing-Chung, Agung Mulyo Widodo, et al. (2022) published their research on plant disease detection in which they used AlexNet. They have used 18, 345 training data and 4585 test data. In their research, they have achieved an accuracy of 98% using a releasing rate of 0.0005 and 75 epochs. The accuracy can be justified, but by using new models, it can be improved further [14].
In 2022, Khan, Muhammad Attique, et al. published their research on cucumber plant disease detection. They have used multi-level deep entropy ELM feature selection. They have used VGG16, ResNet50, ResNet101, and DenseNet201 deep learning CNN models. In their research, they achieved the best accuracy of 98.4% [15].
In 2022, Xie, Yiting, Darren Plett, and Huajian Liu published research on crown rot disease in wheat plants. In their research, they used image color and machine learning techniques. They successfully distinguished between healthy and infected plants 14 days earlier. In their research, the F1 scores for most datasets were higher than 0.80 [16].
Research by Kaur, Prabhjot, et al. in 2021 shows plant disease detection using a hybrid convolutional network by applying feature reduction. They have used grape plants with Leaf blight, Black rot, stable, and Black measles diseases. In this study, the researchers analyzed the Plant Village dataset and employed logistic regression to reduce the dimensionality of the extracted features. They have used state-of-the-art classifiers and achieved an accuracy of 98.7% after 92 epochs [17].
Almadhor, Ahmad, et al. (2021) published their research in which they used machine learning techniques for guava plant disease detection. In this research, they have used different color and textual techniques for feature extraction with machine learning classifiers like Fine KNN, Complex Tree, Boosted Tree, Bagged Tree, and Cubic SVM. In their results, the Bagged Tree Classifier has the highest accuracy of 99% on all four guava plant diseases [18].
Applalanaidu, Majji V., and G. Kumaravelan (2021) performed review-based research on machine learning and deep learning for plant disease detection. In this research, they have a different comparison for both machine learning and deep learning. For machine learning, the SVM model has the best performance with an accuracy of 97.3%, followed by the Random Forest classifier with 97% accuracy. For deep learning, Inception V3 has the best accuracy of 99.76%, followed by VGG with 99.53% accuracy [19].
B. Srinivas, P. Satheesh, P. Rama Santosh Naidu, and U. Neelima (2021) used deep learning to detect guava plant diseases. In this paper, the researchers have used Flask in Python, in which they have created their own CNN model. The confusion matrix is used for obtaining the accuracy, and the accuracy archived was between 65 and 85% [20].
In 2023, Murat Tasyurek and Recep Sinan Arslan published a study on a new CNN model called Real Time-Droid (RT-Droid). RT-Droid is based on YOLO V5 and can detect malware very quickly and accurately. To create RT-Droid, the authors first extracted features from Android manifest files and converted them into RGB images similar to QR codes. Leveraging transfer learning, the researchers trained VGGNet, Faster R-CNN, YOLO V4, and YOLO V5 models on these images. Notably, the YOLO V5 model achieved exceptional object detection accuracy in real time, surpassing the efficiency of other CNN models used in the study. The authors also compared the results of RT-Droid with VGG Net, Faster R-CNN, and YOLO V4 and found that it yielded better results [21].
Existing studies have made valuable contributions to tomato plant disease detection with deep learning, typically focusing on individual datasets. Our work builds on past research by incorporating merged datasets and developing a high-performing custom model, potentially paving the way for more robust and efficient tomato plant disease detection systems. After analyzing the performance of established CNN architectures like VGG, ResNet, and DenseNet, we designed a custom model. This model achieved high accuracy, as discussed in the results section, while also offering benefits like reduced training time and computational cost.
3. Methods and Data Collection
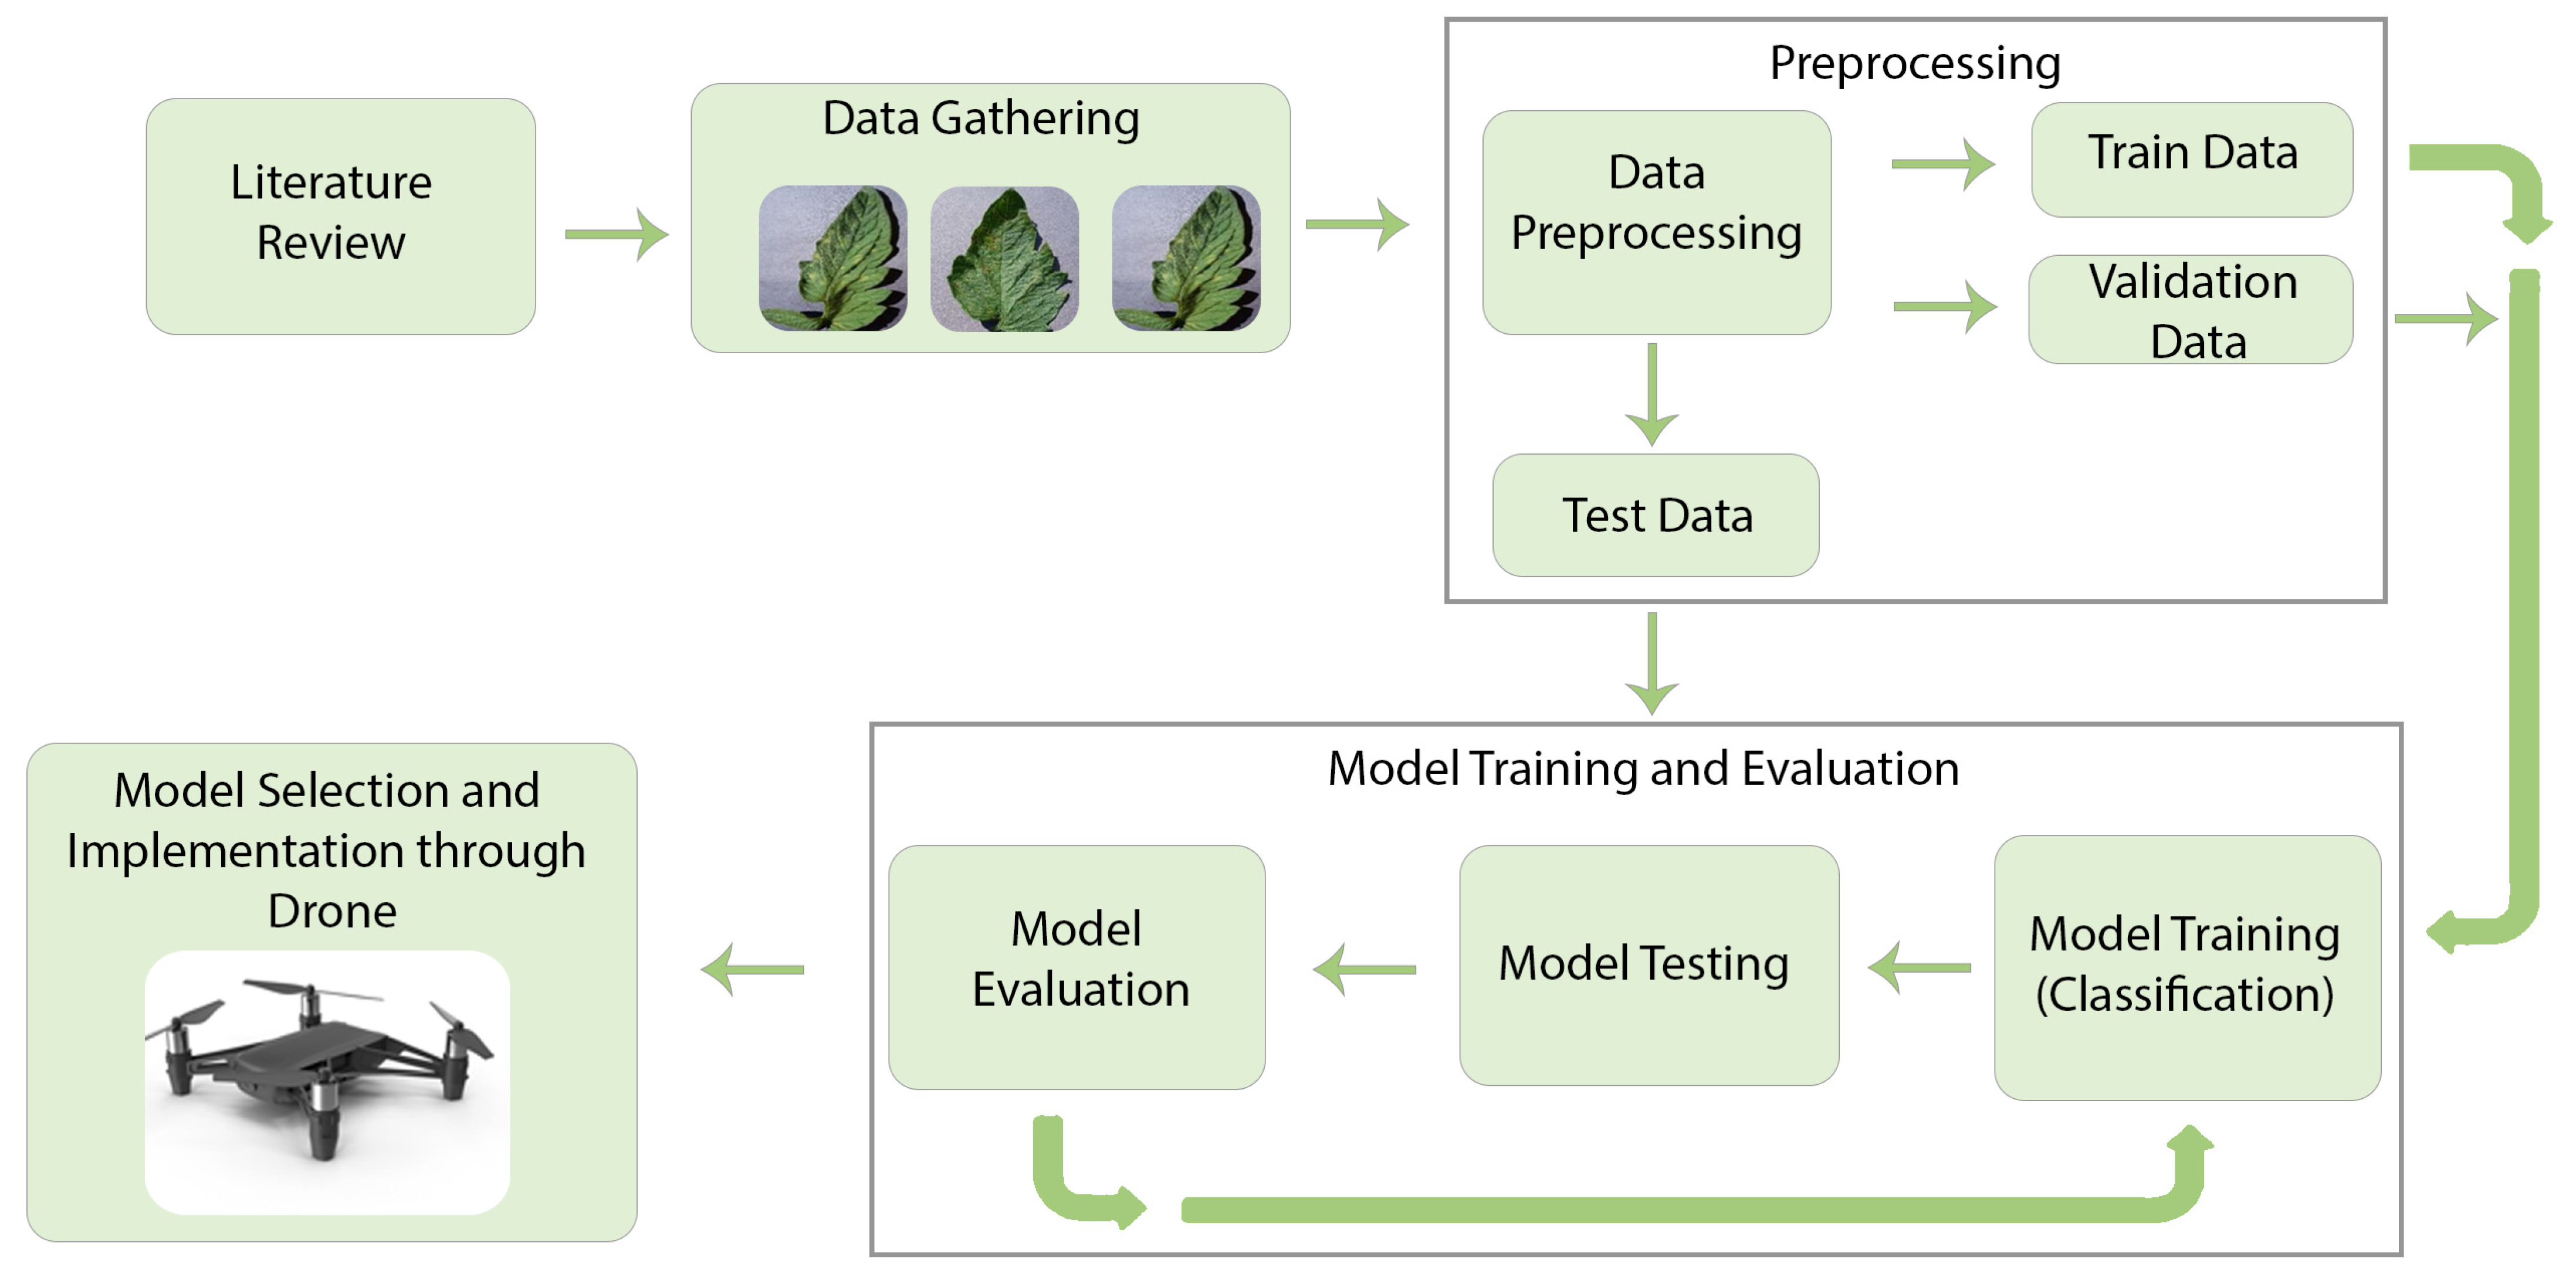
In this section, an in-depth methodology for tomato plant disease recognition is discussed. The methodology comprises four steps, as shown in Figure 1 below.
Figure 1.
Methodology.
3.1. Data Collection
Data collection might seem like the simple act of gathering information, but the path can be riddled with obstacles. From biases to inconsistencies, let us dive into some of the common challenges that can trip up even the most seasoned data gatherers.
Inaccurate data: The collected data may not address the key variables or information needed to answer the intended research question.
Missing data: Gaps in the collected data, including empty fields and missing images for specific predictions, can negatively impact model performance.
Data imbalance: Unequal distribution of samples across categories can bias the model, hampering its performance for under-represented groups.
Data bias: Hidden within the data itself, even the most well-intentioned model can inherit and amplify biases based on factors like gender, political affiliation, age, or geographical origin. These biases, often subtle and difficult to detect, can lead to unfair and inaccurate predictions.
Several techniques can be applied to address those problems:
Freely available and pre-cleaned datasets. Pre-cleaned free data can be obtained from websites or vendors. They provide almost all sorts of data, and sources like Kaggle can offer pre-processed and clean data.
Leveraging web crawling and scraping techniques, automated tools such as bots and headless browsers can efficiently extract data from websites, providing valuable resources for training machine learning models.
Private data: In cases where publicly available data is scarce or insufficient, ML engineers can resort to generating their own synthetic data. This approach is particularly advantageous for models requiring smaller datasets to achieve optimal performance.
Custom data: Agencies can create or crowdsource the data for a fee.
In this research, we have collected our data from Kaggle for disease recognition. We have collected different types of image samples from Kaggle with the range from 10,000 to 40,000 images. The models are trained and tested using different data, and the performance is closely examined to make sure the collected data is correct.
3.2. Data Preprocessing
Data preprocessing is very important for machine learning and deep learning because the performance and accuracy of ML/DL models directly depend upon the quality of the data. Before the model is trained, we need to do preprocessing on the data and make sure the data is clean, relevant, and enough.
3.3. Data Cleaning
The data used in this research is different preprocessed image data taken from Kaggle; however, the data is pre-cleaned, but different data gave different results. This is why we trained and tested models using different data with different sizes, quality, and conditions, and images were captured. The different results were then compared to specify the most suitable dataset. The model was first trained with less data from 8000 samples with good results but not satisfactory results. The model trained and tested with 20,000–38,000 looks to be the best-suited numbers for deep learning. The dataset created was cleaned of any irregularities and irrelevant data.
3.4. Data Splitting
The data were split into three groups: Training, Validation, and Testing data. The training data is used to train the model. The model uses the training data to identify patterns and improve the accuracy. The validation data is used during the training process to validate the model. The validation data is entered in batches and works as test data during each step in the training process. The test data is used to test the model, and this is data that the model has never seen before. This data is used to find the accuracy of the model on new data. The training data is 70%. The validation data is 20%. The testing data is 10%.
3.5. Data Augmentation
The data augmentation is used to generate new data for the model; this technique works best for images in deep learning. Rotation, High contrast, Bright light, Low light, and image invert augmentation are used for the models that use augmented data.
- Resize and Rescale
In this step, we resize the image to our desired size. We do resize to avoid the problem of images with different sizes because it can greatly affect the model’s overall performance. By rescaling, we change the values of the image, e.g., we can convert the image into grayscale. We do this process for performance gain because it limits the image colors from 0 to 1.
- Data Prefetch
In this step, we fetch the data into the short-term memory and fill the buffer. This is performed so that the data stays in the memory and the model can easily retrieve the data when required.
- Label Encoding
Label encoding is used to convert text data into a format that the model can understand. We use label encoding to change the text data into arrays. These arrays are used to create machine learning models for text analysis and predictions.
- Term Frequency Inverse Document Frequency
The term frequency inverse document frequency is used to filter out useless data. This technique is used to take all the important information in text data for better model performance.
3.6. Model Training
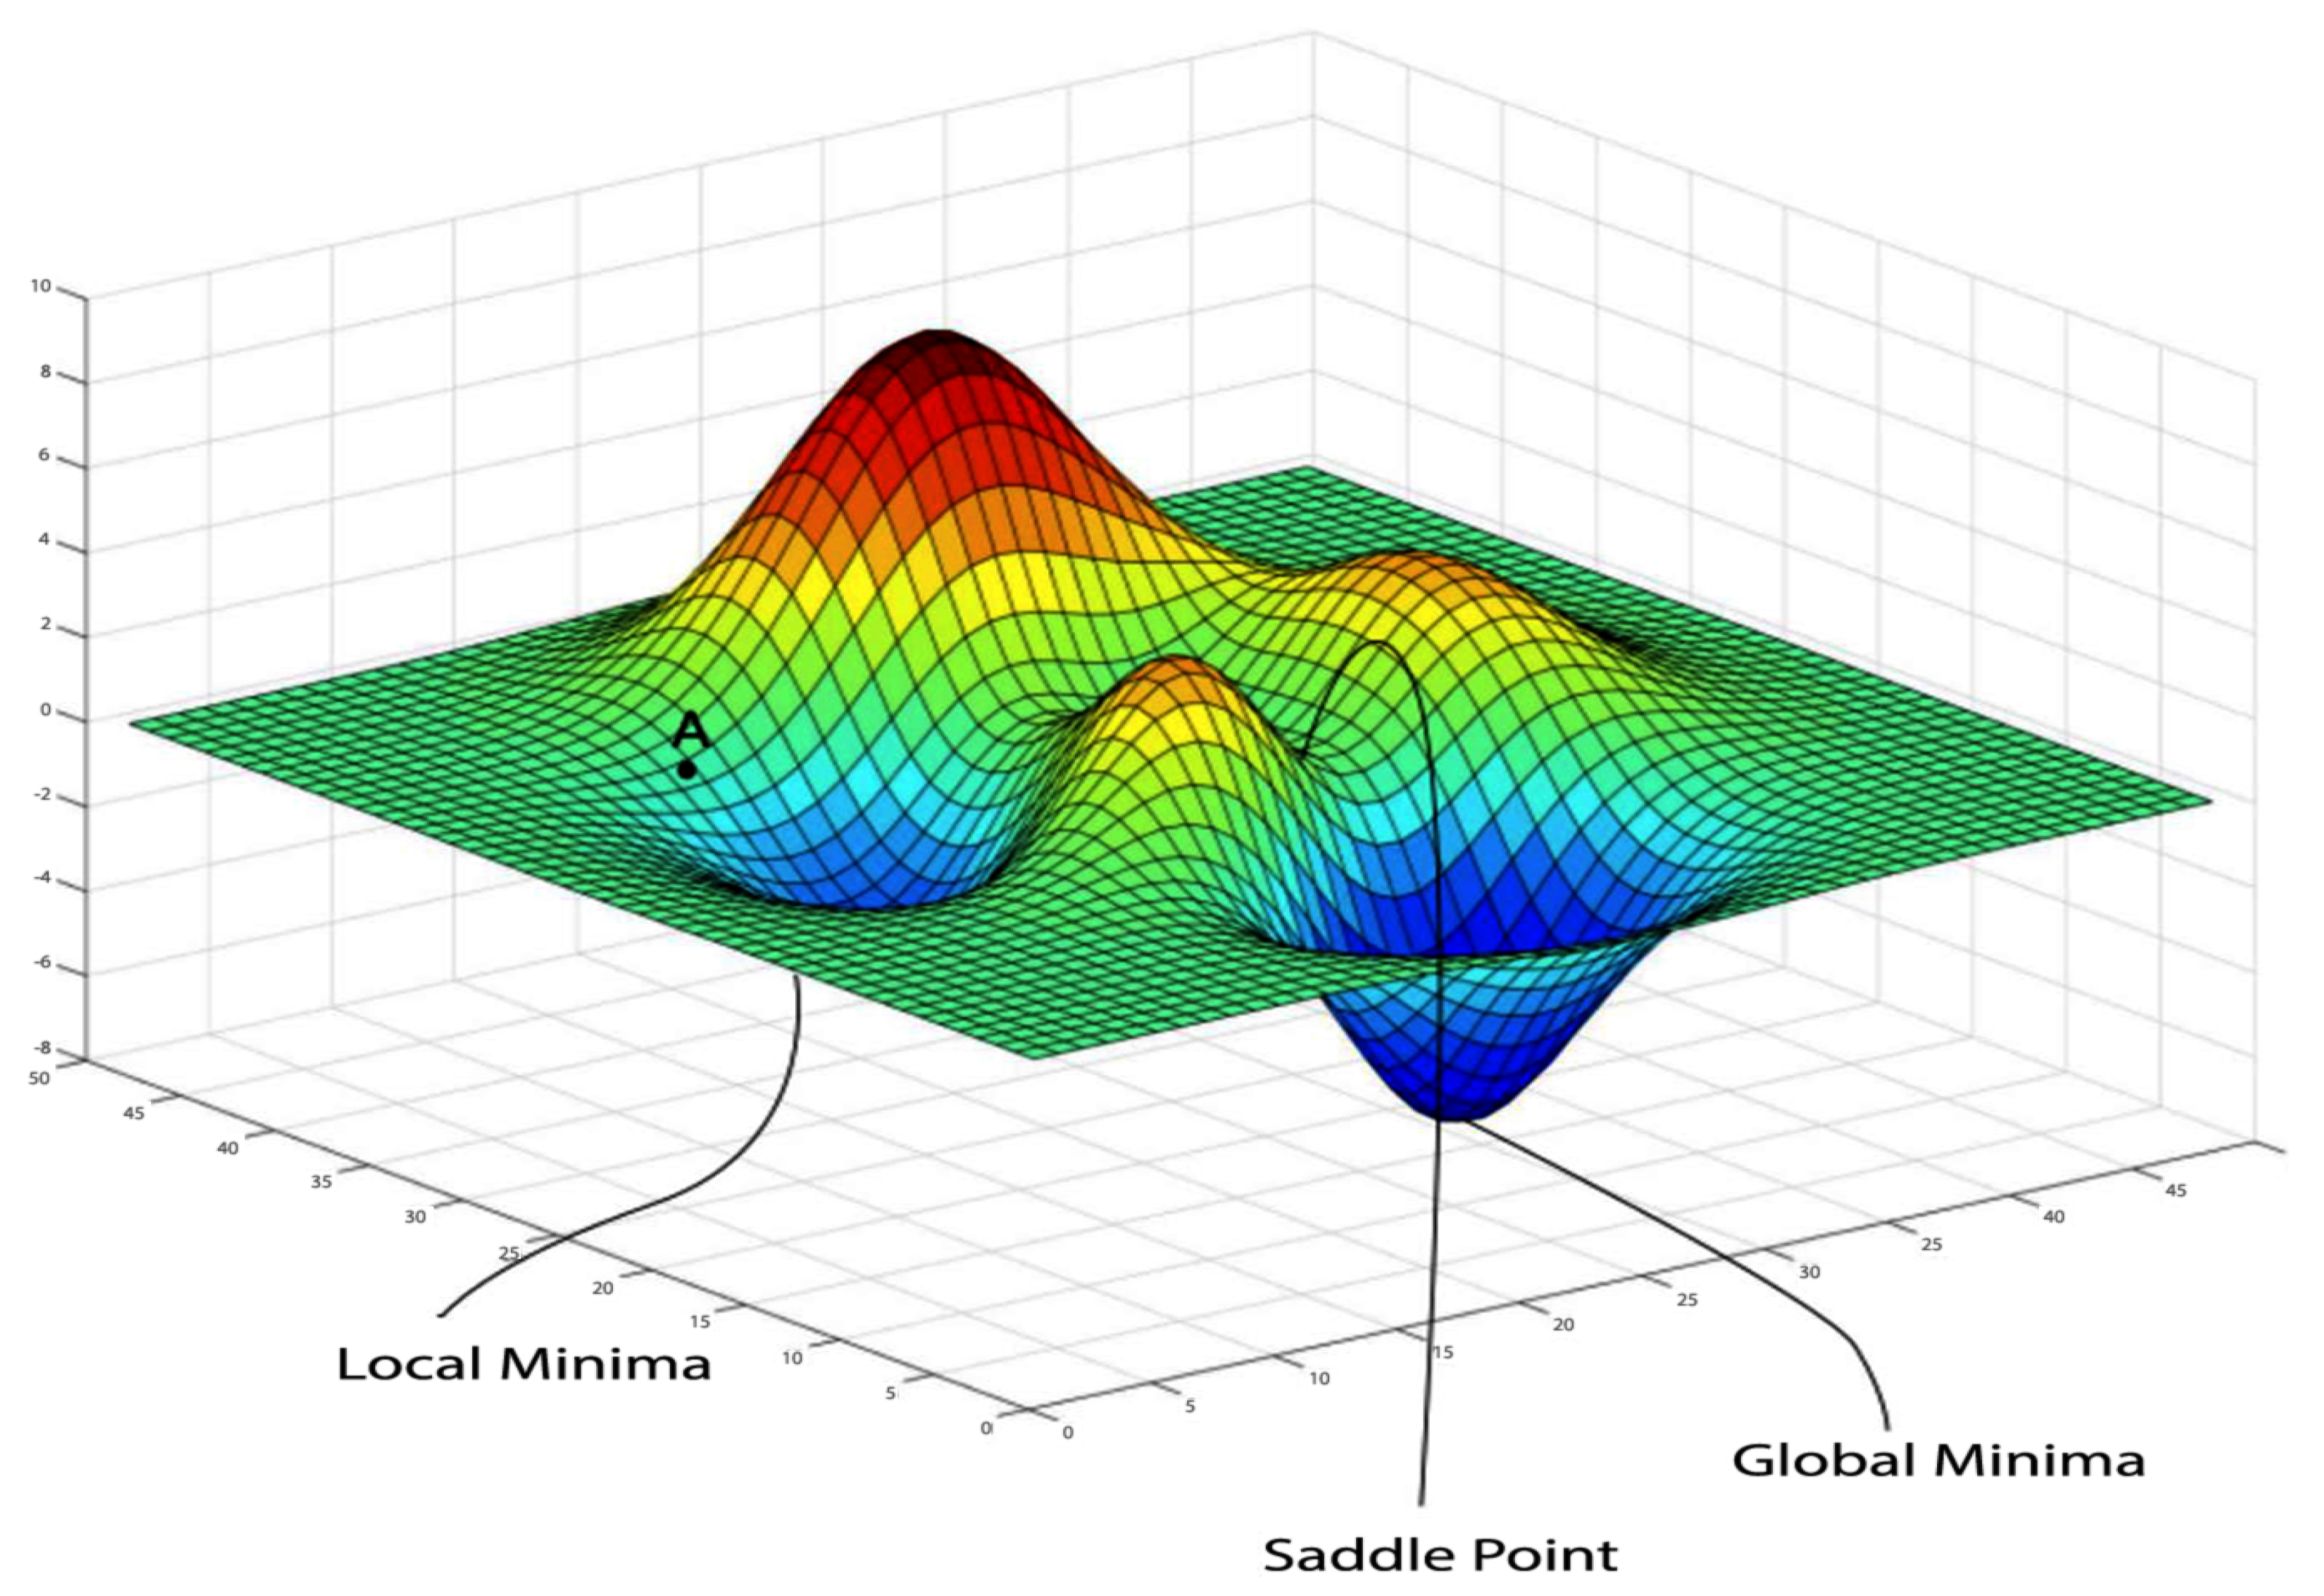
In this step, we train the model using training data. The model is a combination of statistical formulas that become optimized using numerical values. The training data is passed through to the model, and the model uses different functions such as Sigmoid, RMSE, TANH, and RELU for convergence. The model goes to global minima for the best accuracy. The model starts from low accuracy and high loss and slowly converges to the global minima to improve the accuracy and decrease the loss, as shown in Figure 2. Most of the time, the model becomes stuck at local minima because of some noise in the given data. To overcome the problem of local minima, we clean the data so it will converge to a more global minima. In this research, we have built different deep learning models and compared the accuracies to obtain the most suitable model.
Figure 2.
Model Convergence.
3.7. Model Testing
In this step, we test the model using new data that the model has not seen before. We used test data to evaluate the model’s performance. In this step, we test all the models and performances to select 31 of the most suitable models. We give the model test data to make predictions and compare it with the existing results to evaluate the actual accuracy and performance.
3.8. Model Selection
In this step, we have to select the best model amongst the VGG, ResNet 50, DenseNet 121, DenseNet169, DenseNet201, and custom model. After we train the models and test them, we can demonstrate the performance of all the models.
We will have some models that will perform better than others. Here, we will evaluate the models’ performances and choose the best-performing machine learning and deep learning model.
3.9. Implementation and Experimental Setup
Optimizing for both ease of development and performance, Python was chosen as the programming language for building the deep learning architectures. Leveraging the powerful combination of Keras, TensorFlow backend, and the CuDNN library, we achieved efficient training on an NVIDIA Quadro K2200 GPU (HP, Italy) with its 4 GB memory, 640 CUDA cores, and high bandwidth.
3.10. Deep Learning Architecture
Seeking to enhance plant disease classification accuracy, researchers explored improvements and modifications to existing deep learning architectures, demonstrating superior performance in identifying plant species ailments. Among them, we have considered VGG 16 [19], AlexNet [20], ResNet [21], and DenseNet 121 [21].
3.11. Visual Geometry Group (VGG)
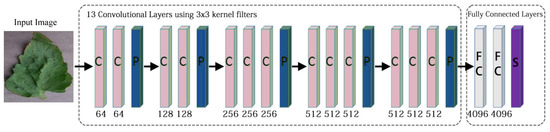
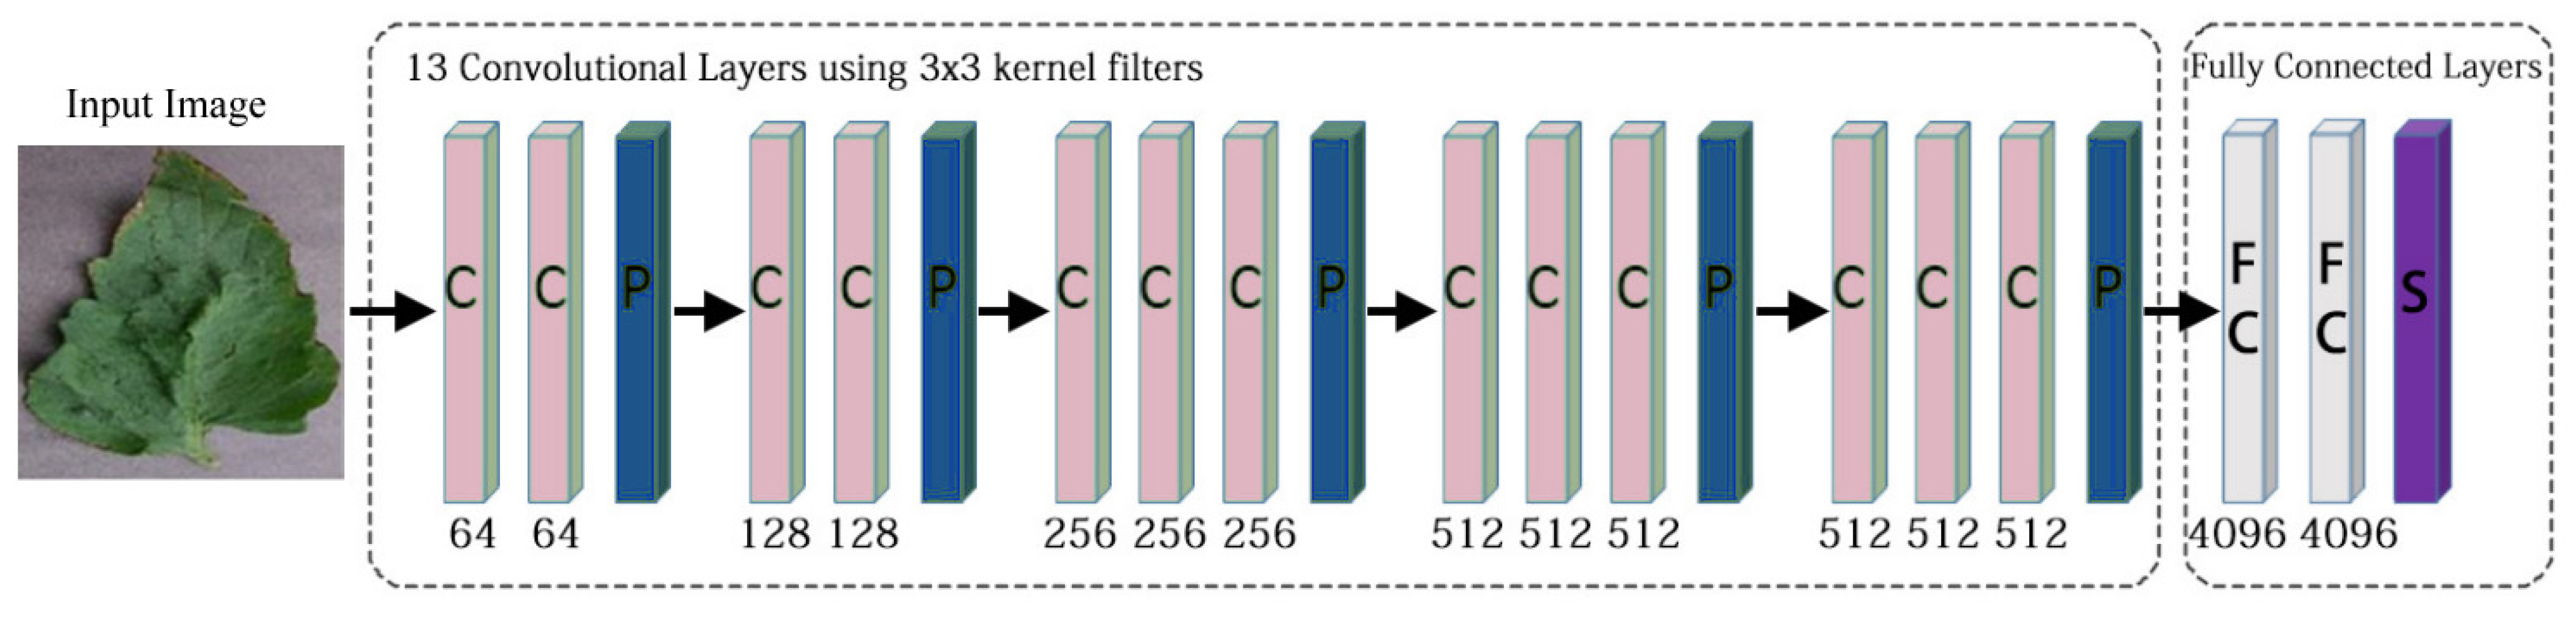
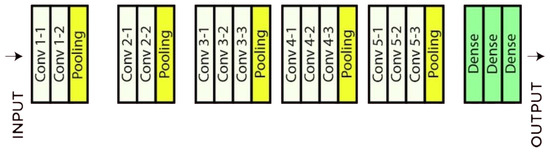
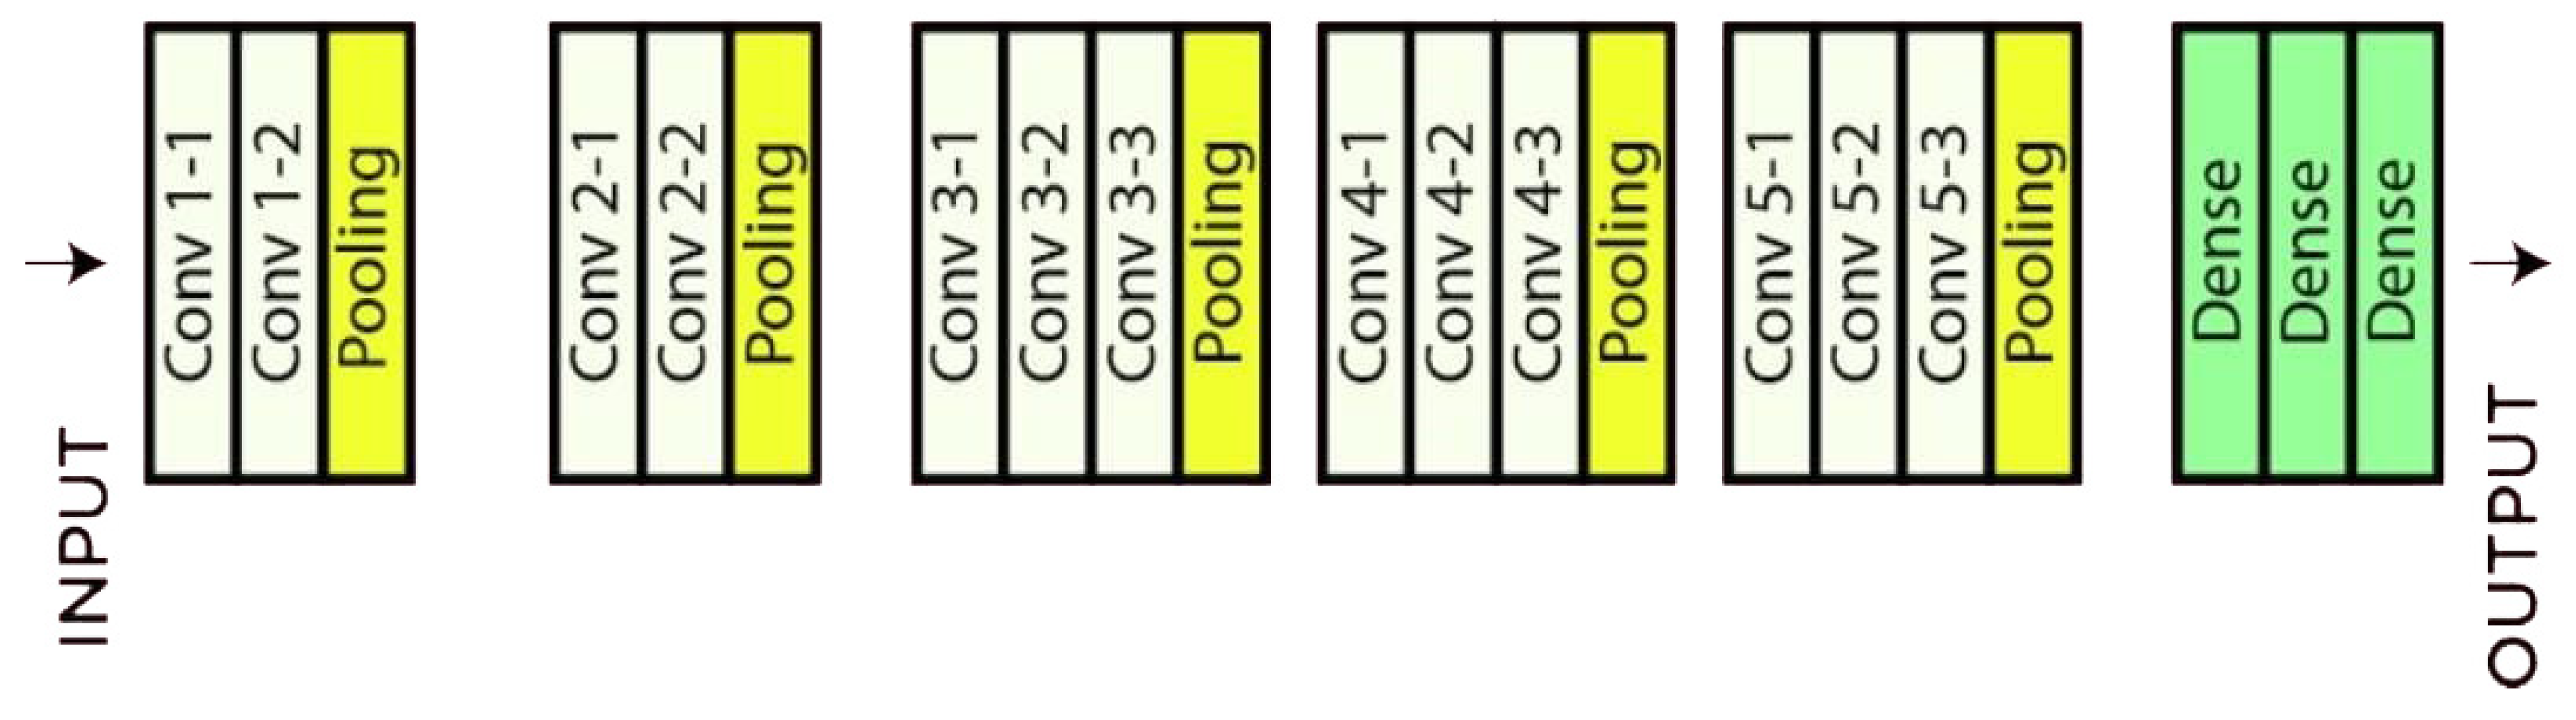
The VGG16 architecture is a deep convolutional neural network (CNN) that was originally developed for image classification. It has been shown to be very effective for a variety of image classification tasks, including plant disease detection. The VGG16 architecture consists of 16 layers, as shown in Figure 3, each of which is a convolutional layer or a max pooling layer. The convolutional layers extract features from the input image, and the max pooling layers downsample the features to reduce the size of the model. The fully connected layers at the end of the network classify the features into different classes. The VGG16 architecture has been shown to be very effective for plant disease detection. In a study published in 2018, the VGG16 architecture achieved an accuracy of 93.5% on a dataset of tomato and potato plant images.
Figure 3.
VGG Architecture.
3.12. Custom Model
This model is our own created model, as shown in Figure 4. This model has outperformed most of the models we have created with performance that is the same as VGG16.
Figure 4.
Custom Model Architecture.
- The first layer has 16 filters and a kernel size of 3 × 3.
- These layers have an average pooling of 2 × 2.
- The second and third layer has 32 filters and a kernel size of 3 ×3.
- These layers have an average pooling of 2 × 2.
- The fourth to sixth layer has 64 filters and a kernel size of 3 × 3.
- These layers have an average pooling of 2 × 2.
- The seventh to tenth layer has 512 filters and a kernel size of 3 × 3.
- These layers have an average pooling of 2 × 2.
- The first Dense layers have units of 256.
- The second Dense layers have units of 64.
- The third Dense layers have units of 32.
With total layers, ten layers, and batch normalization.
4. Results
In this research, we have built different deep learning models and compared the accuracies to obtain the most suitable model.
4.1. Visual Geometry Group 16
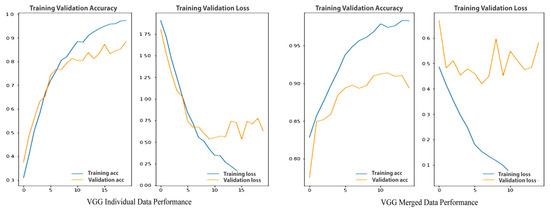
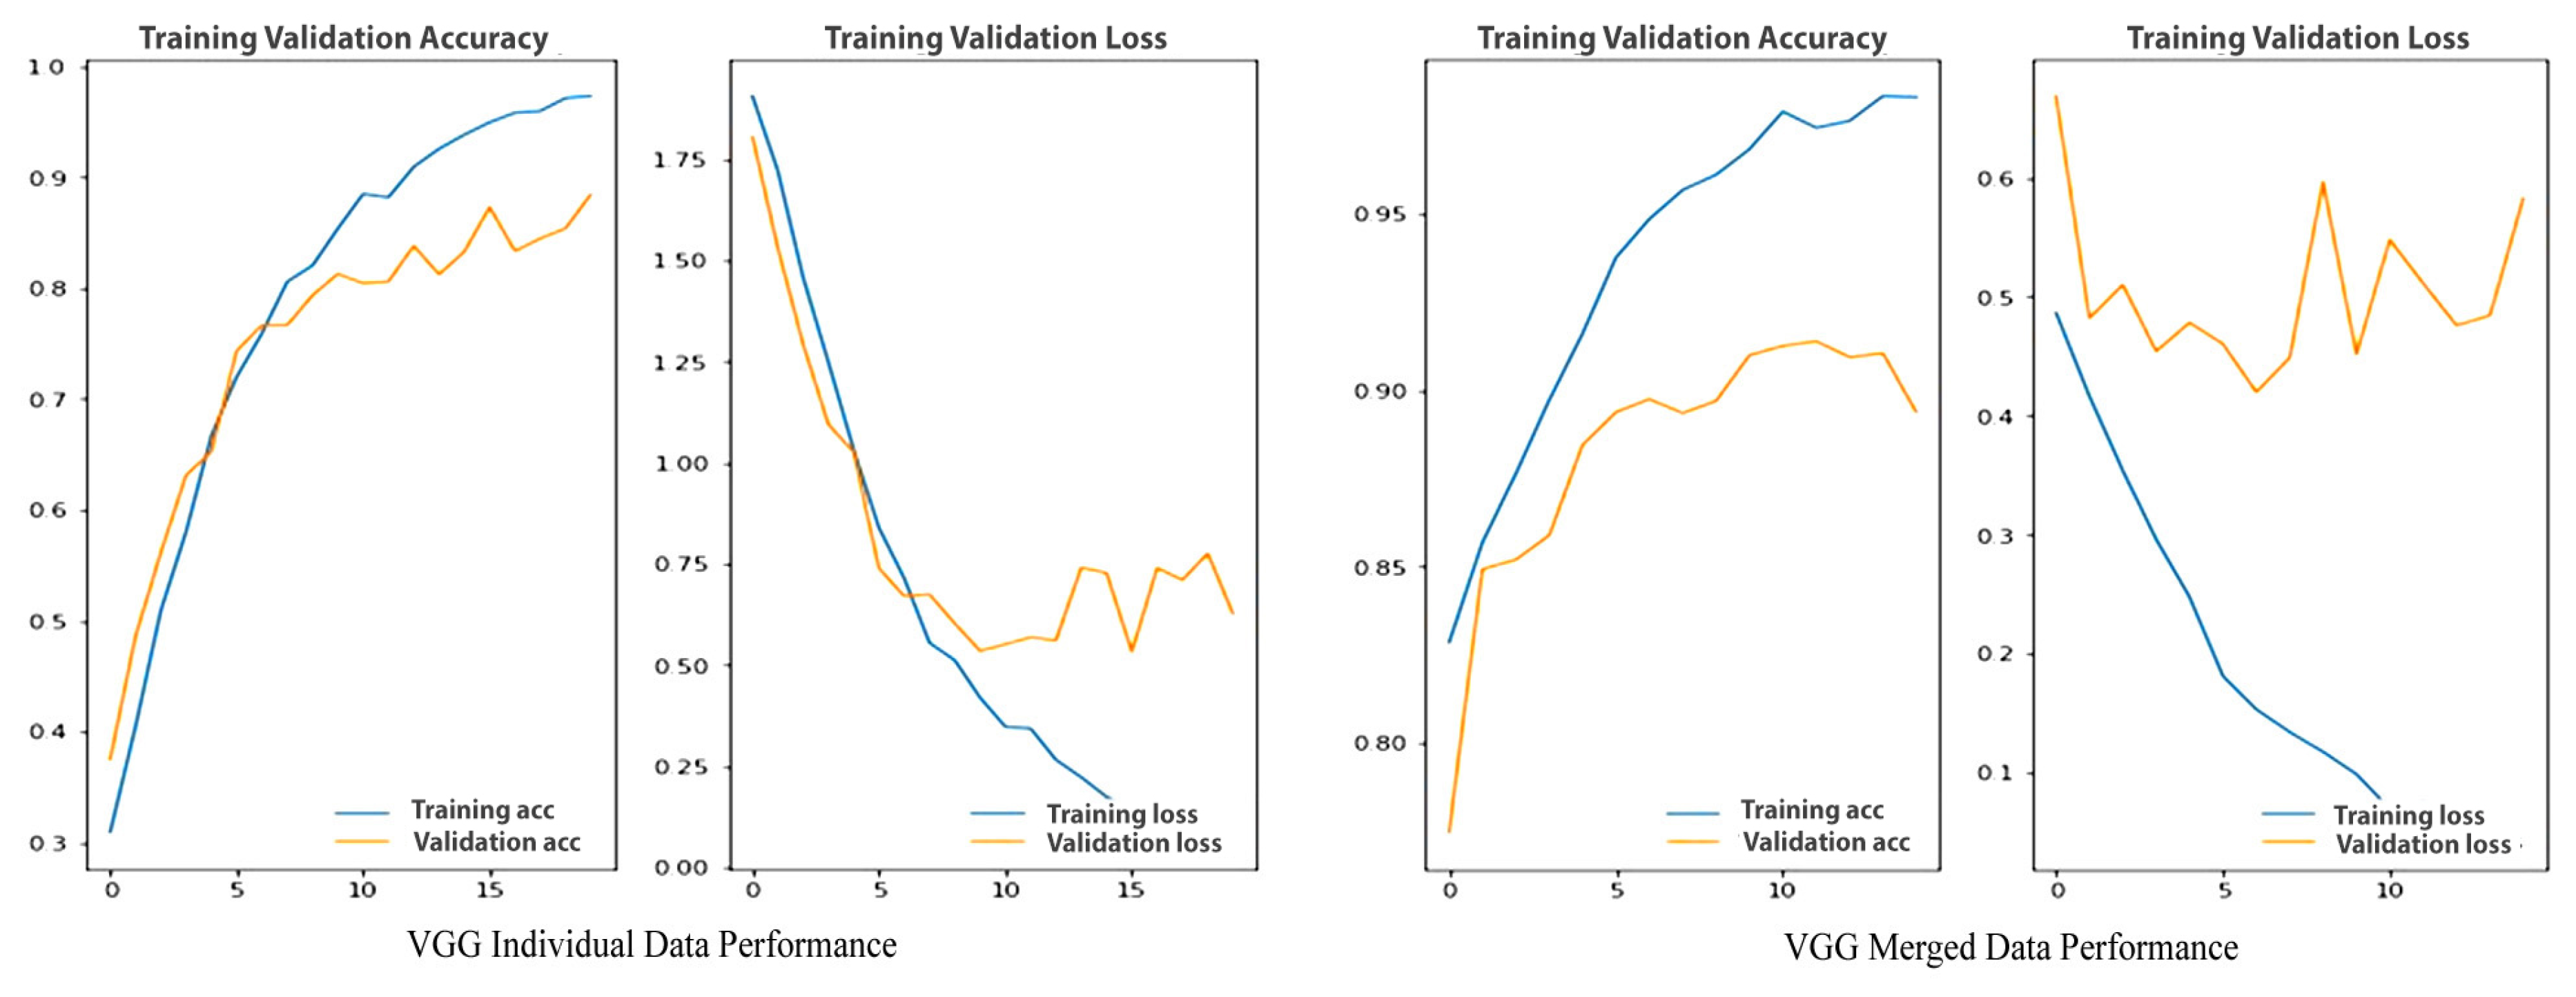
The VGG16 model has performed very well. It has a validation accuracy of 99 and a test accuracy of 98. The model’s performance is very good, but if we compare it to other models that we have used in this research, then almost all of them have outperformed the VGG16. The VGG16 has performed very poorly on the merged data set, with an accuracy of just 92%. Table 1 shows the model is fighting to maintain constant validation accuracy. The training accuracy and loss are significantly better than the validation accuracy and loss. However, the validation accuracy on the merged data is just 92.06, which is a very bad performance.
Table 1.
Visual Geometry Group 16 individual and Merged Data.
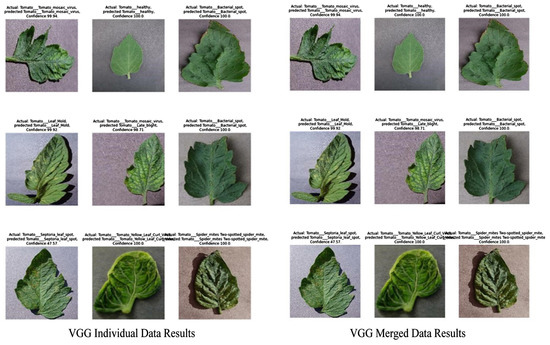
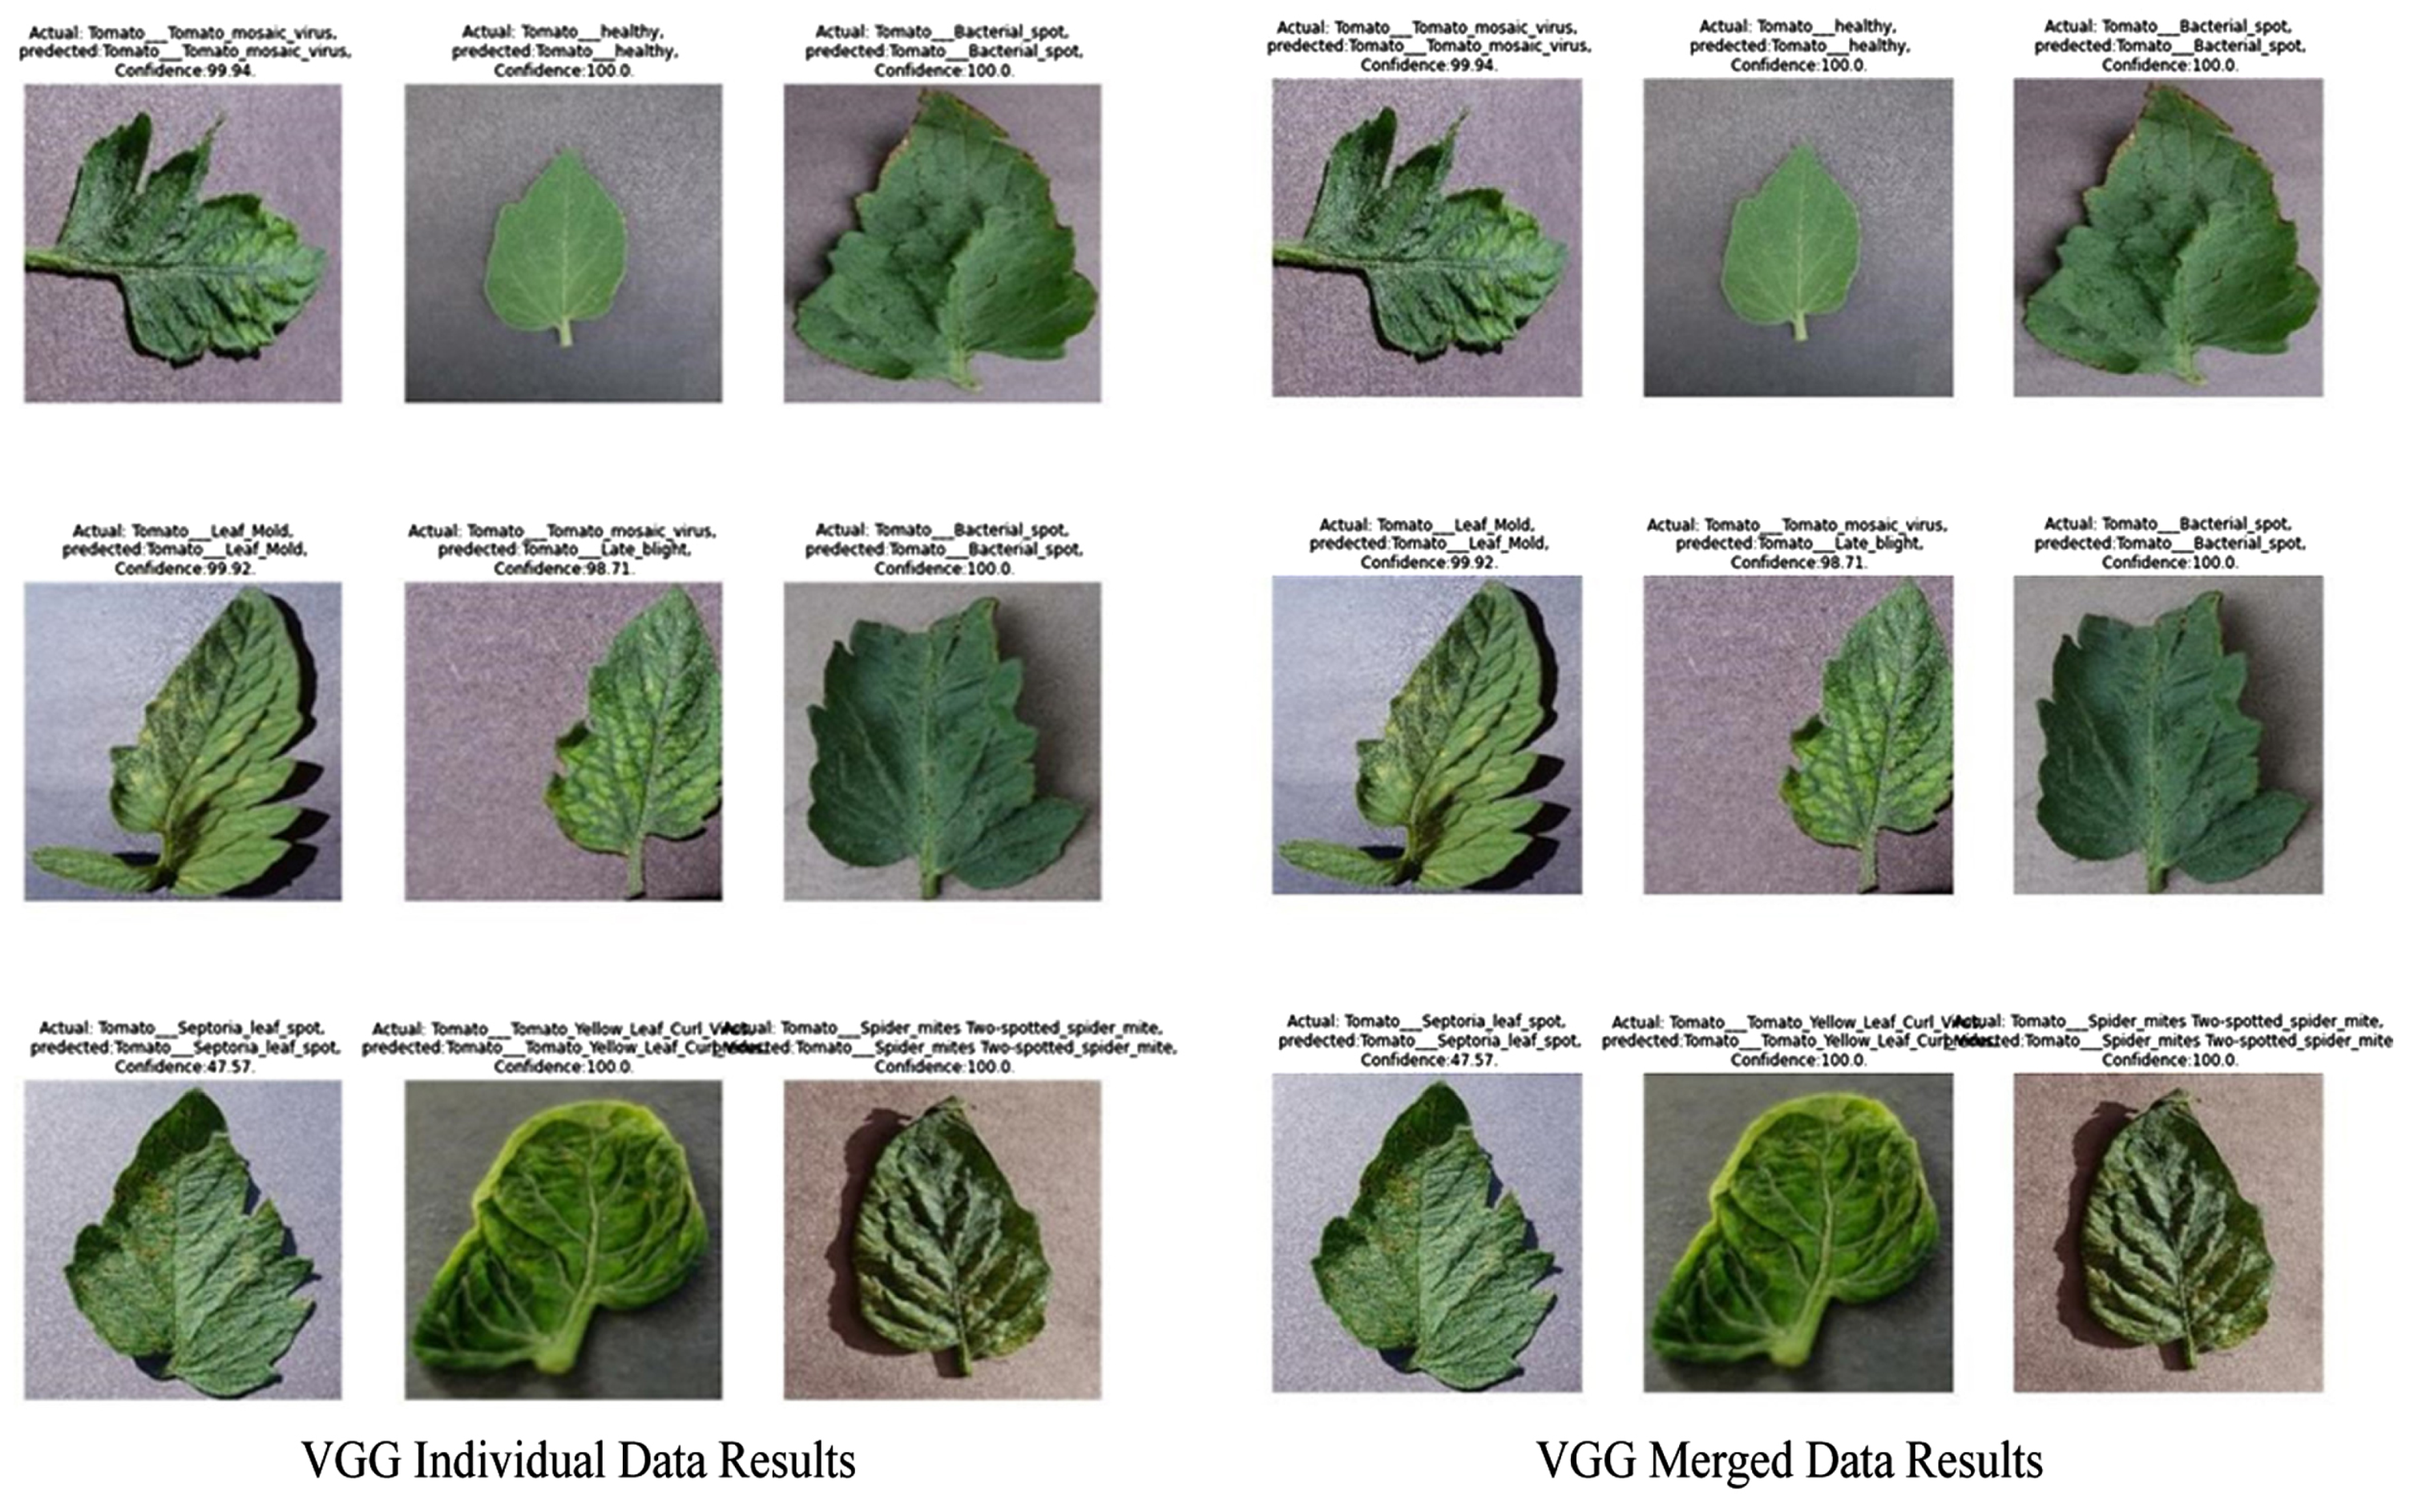
Figure 5 shows the convergence of the model. The convergence rate is not that good because the model looks stuck at the elbow rules, which state that the model should be stopped from where it starts the elbow shape. In the test result, the model successfully predicted 90% of the test subjects correctly. Only one prediction out of nine is incorrect, as shown in Figure 6. The overall confidence that the model has shown is 98 to 100%.
Figure 5.
VGG Individual and Merged Data Performance.
Figure 6.
VGG Individual and Merged Data Results.
4.2. Custom Model
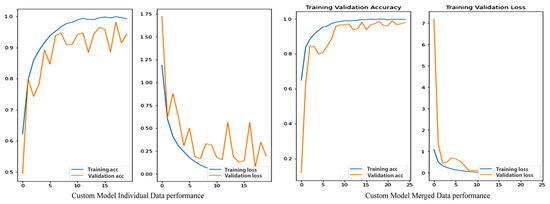
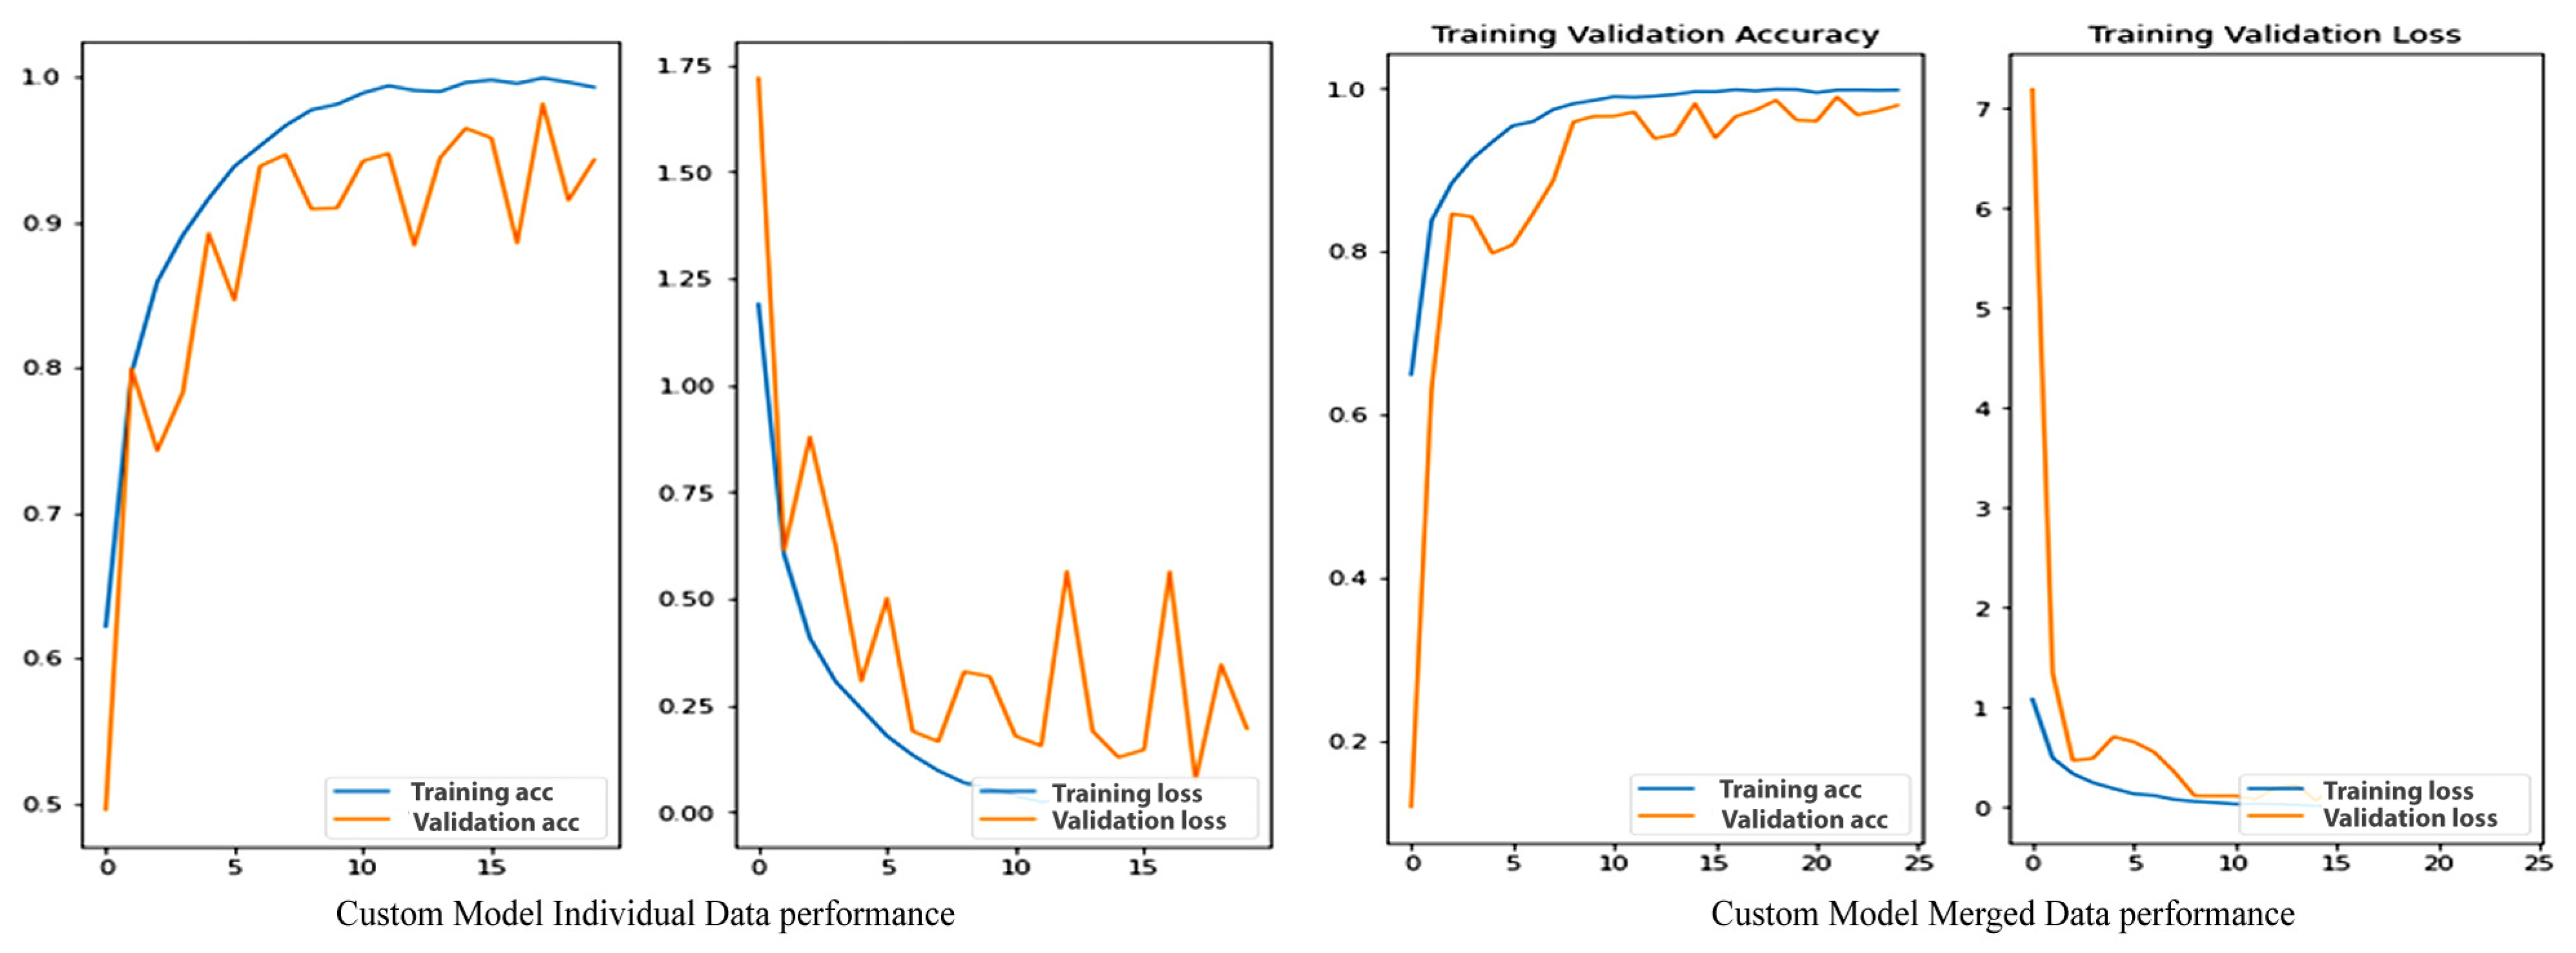
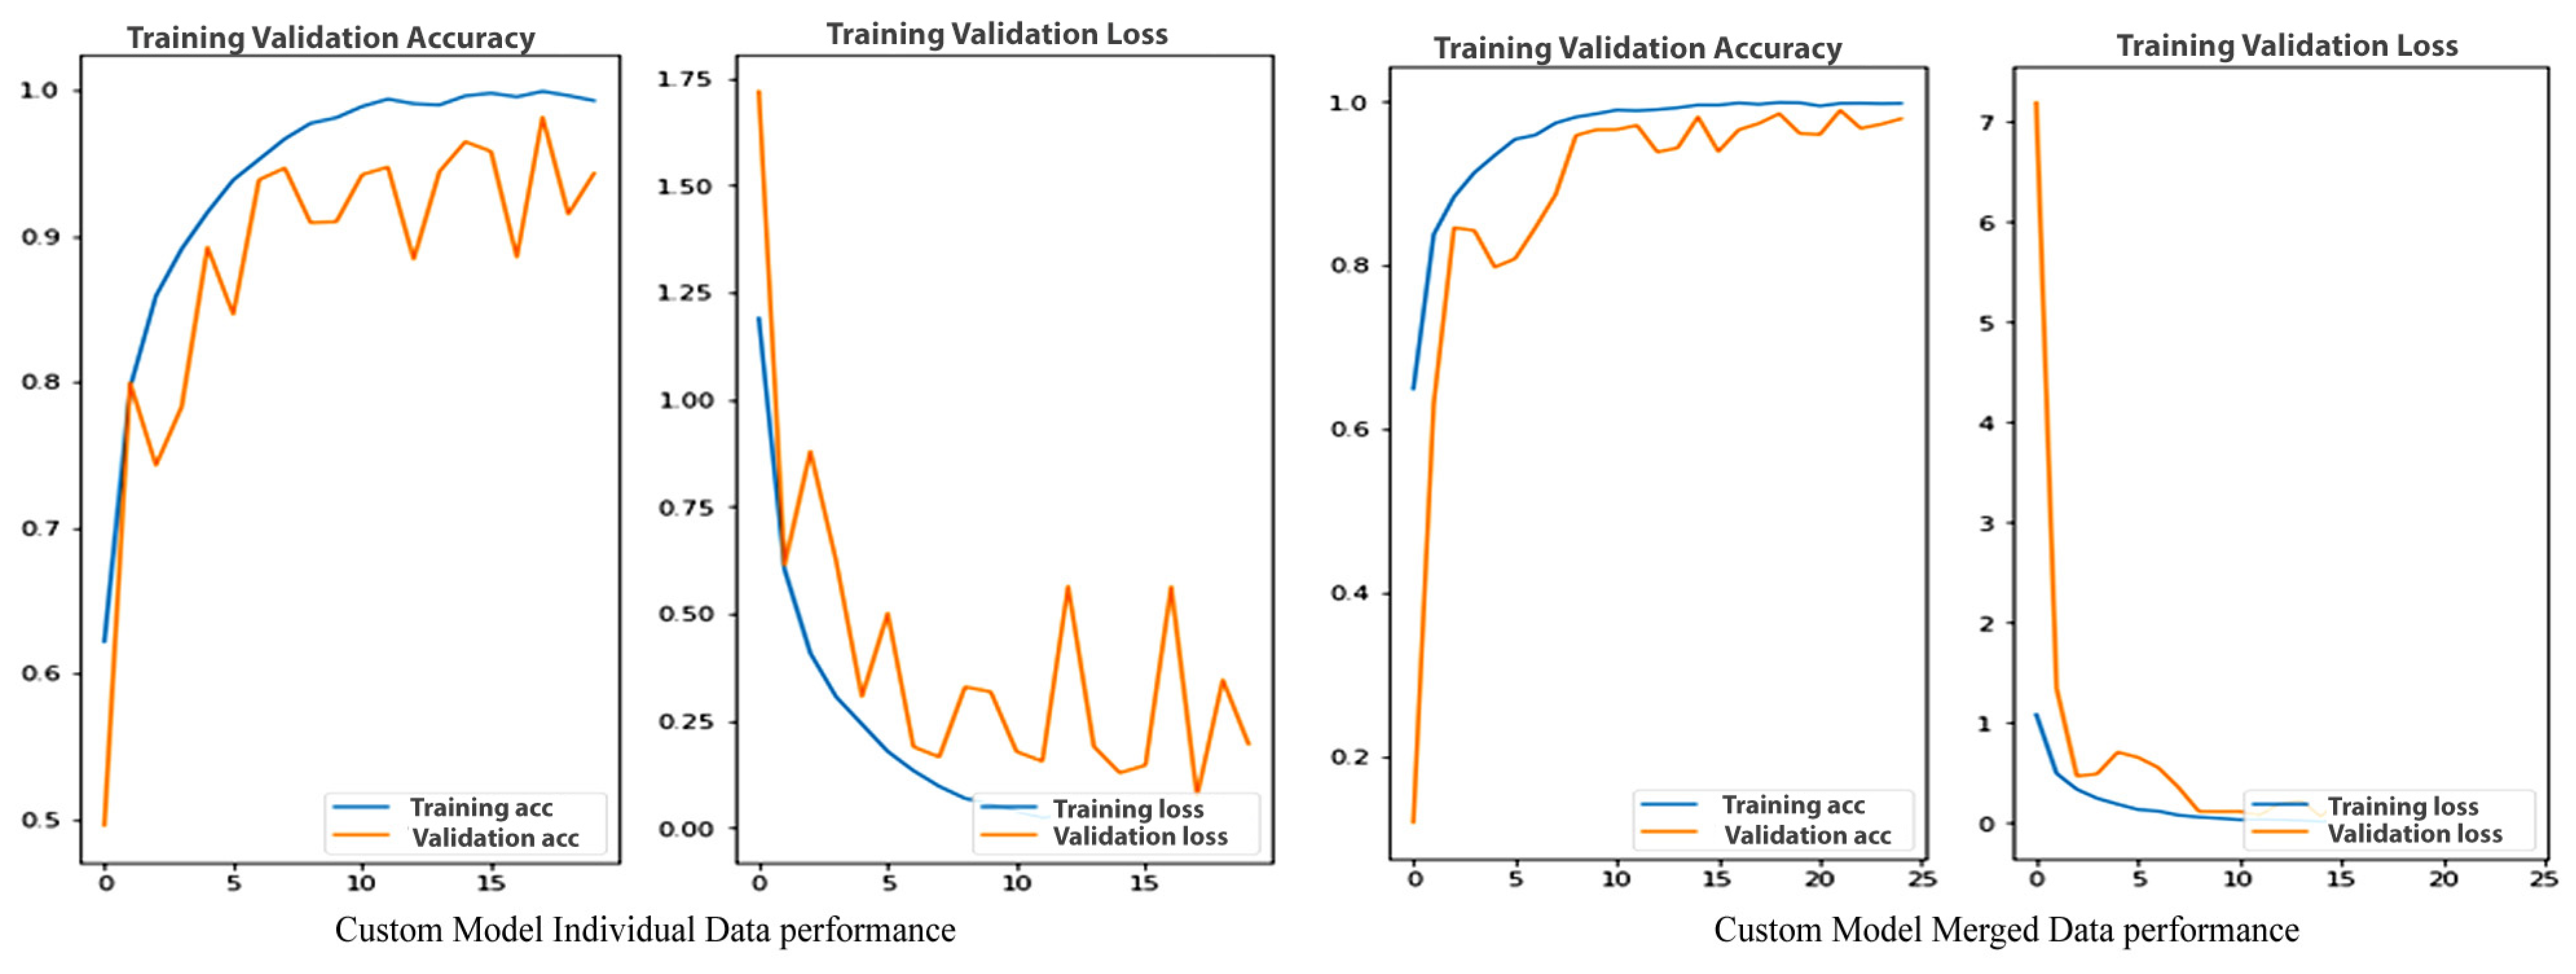
This is our custom-built model, and it has performed well. This model has outperformed the VGG16 model, but it is still not the best we have used in this research. Other models have outperformed this model. The positive point of this model is that it has a very simple network architecture and gives very good results in very little time at less computation cost. The model has a constant 100 training accuracy, and the validation accuracy changes, but this model has a more stable performance than VGG16. The model validation accuracy is very stable; the only drop occurred at the end. The validation loss performance is one of the best, as shown in Table 2.
Table 2.
Custom Model Individual and Merged Data.
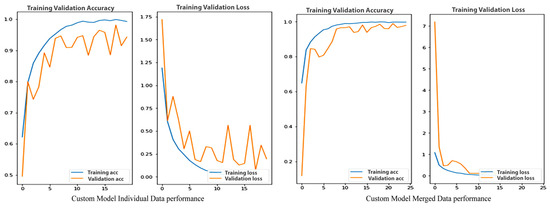
These are the performance graphs of the custom model. The graph has converged fast, but the stability is not that good compared to the other models we have used in this research. As you can see, the training accuracy and loss are very stable, but the validation accuracy and loss change rapidly. However, the model performed better on the merged dataset, as shown in Figure 7.
Figure 7.
Custom Model Individual and Merged Data performance.
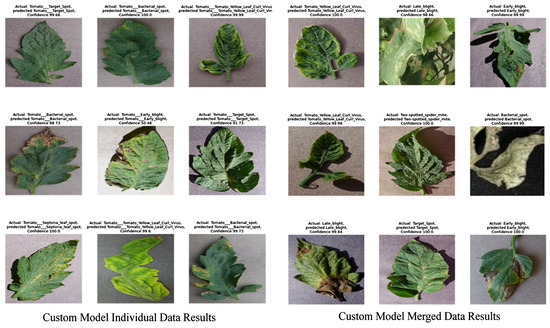
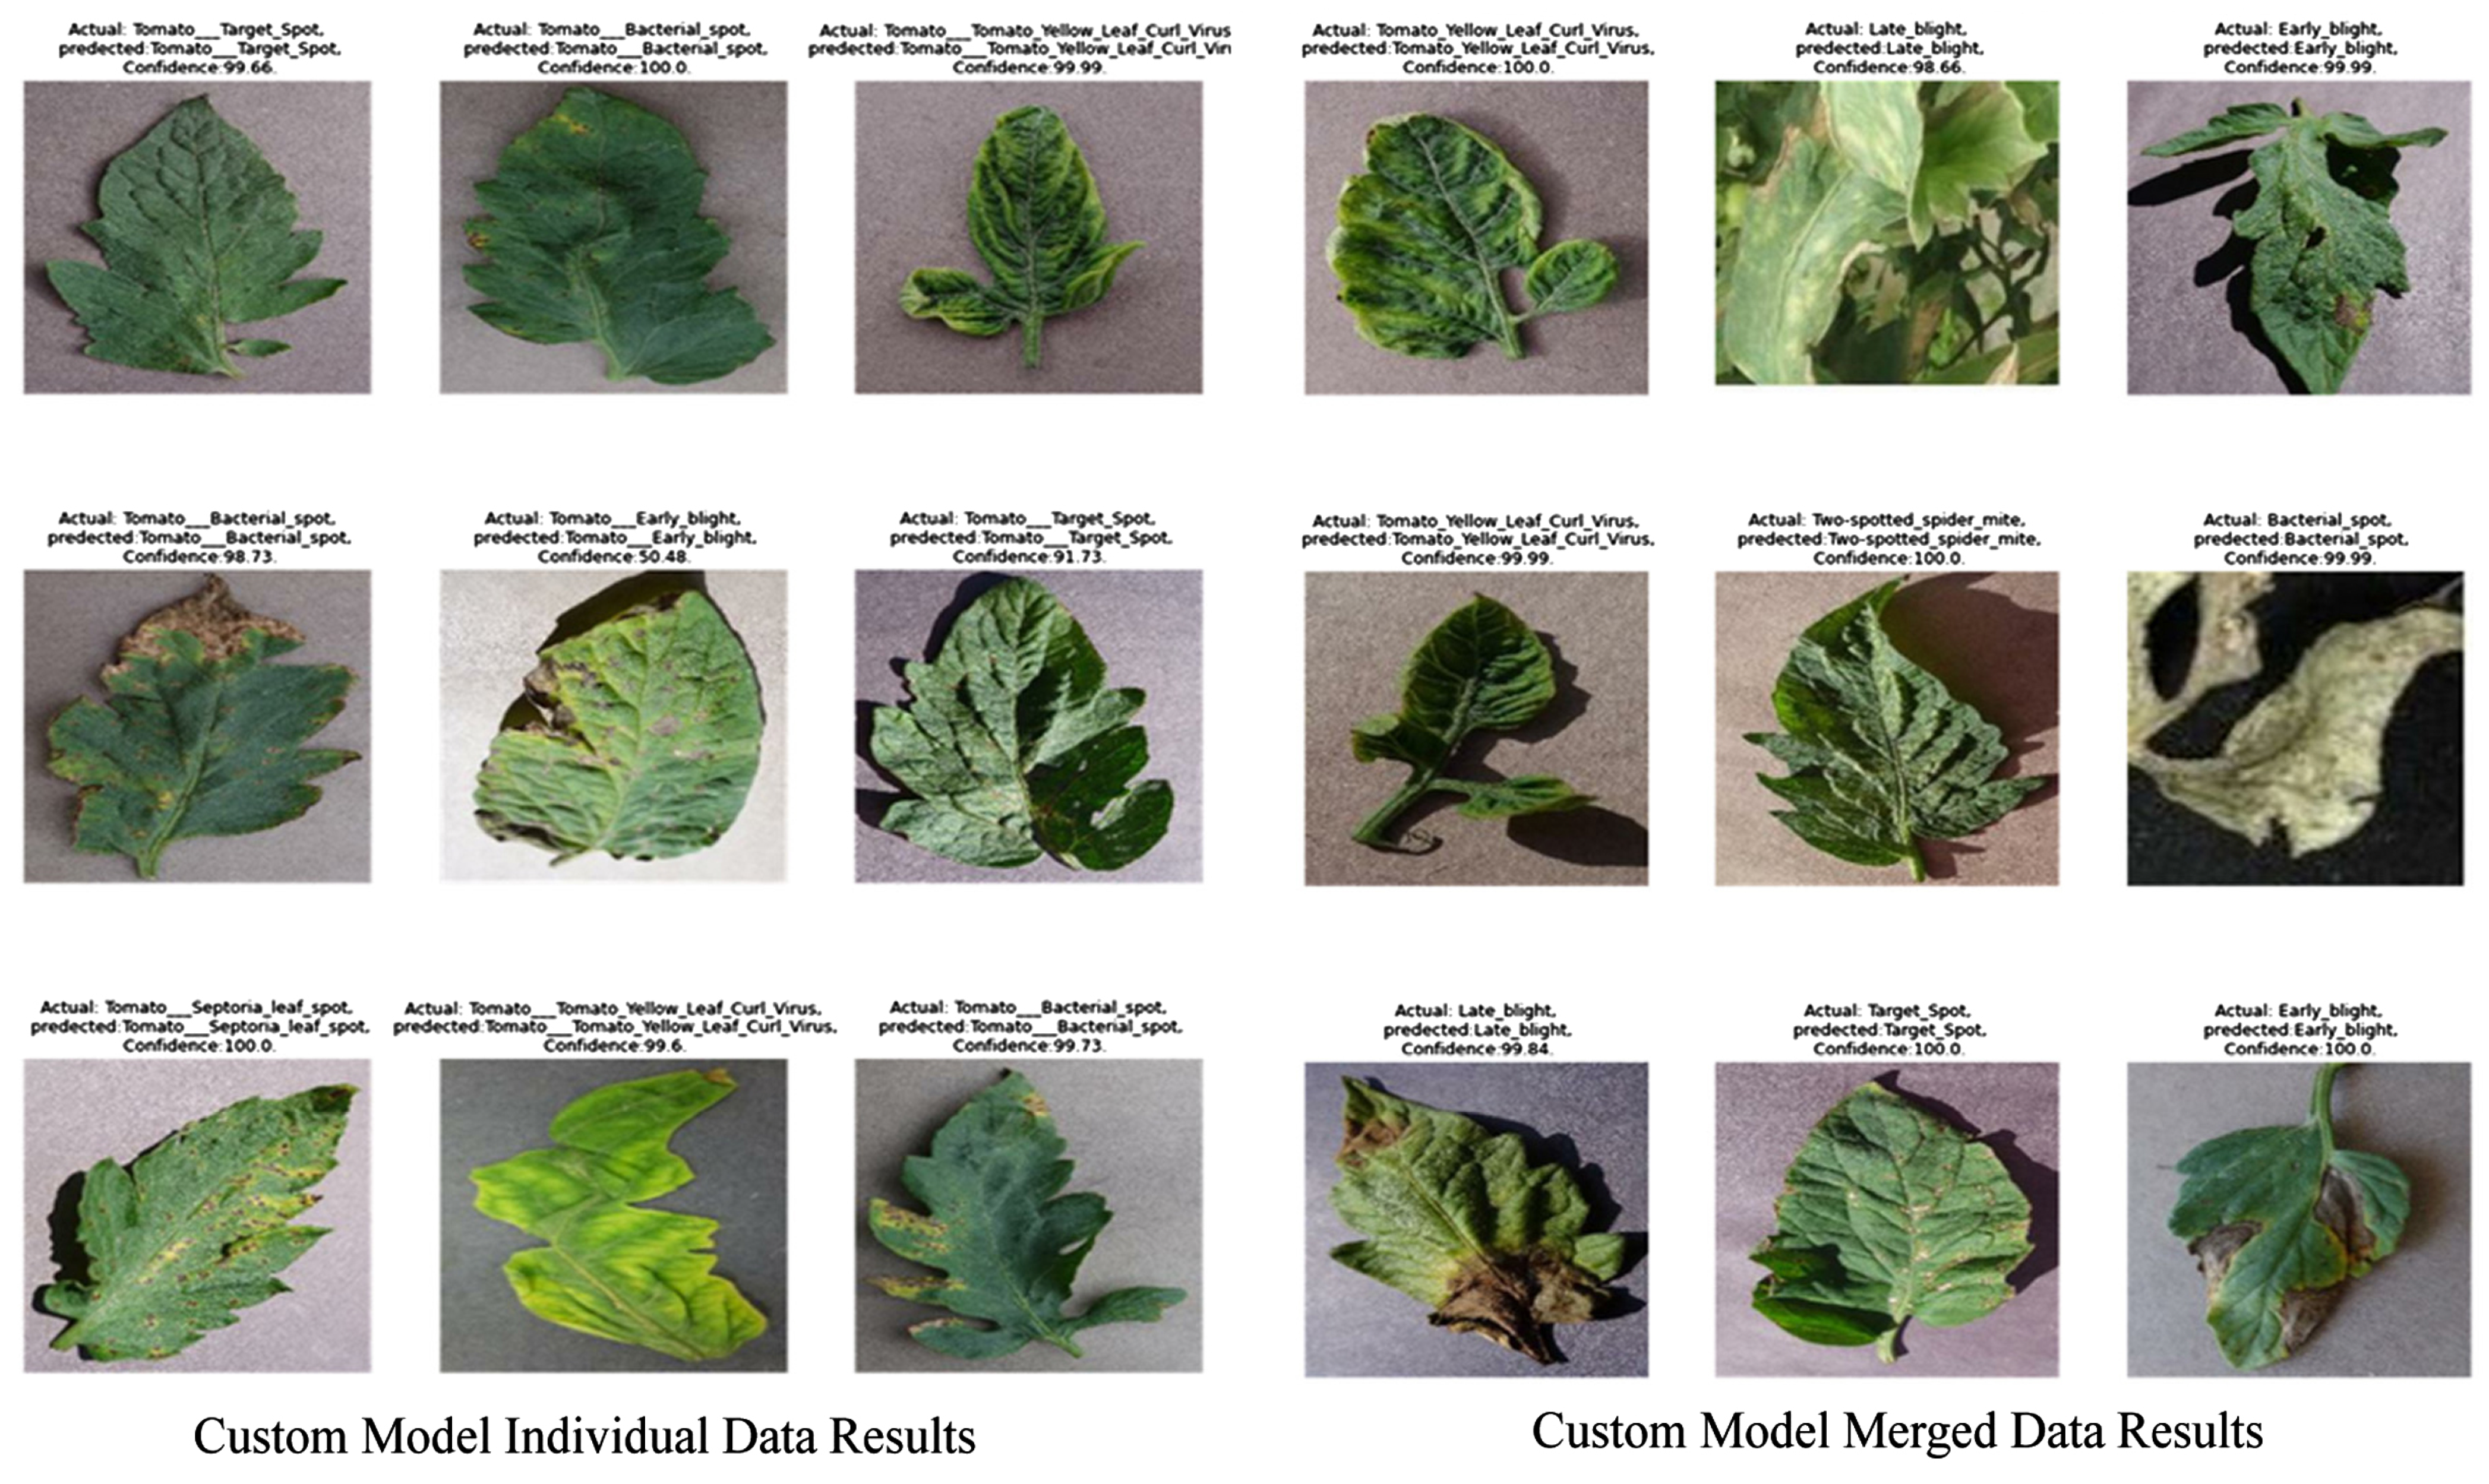
The results of nine images that we have taken from the test data are shown below. The model has successfully predicted all the diseases accurately. The confidence of the model is averaging almost 99% except for the on-test subject, where the model confidence is very low at 50%, but the prediction is correct on the individual data while keeping the accuracy and confidence to almost 100% on the merged data from Figure 8.
Figure 8.
Custom Model Individual and Merged Data Results.
4.3. Residual Net
The best-performing model we have used in this research so far has an accuracy of more than 99.50%. ResNet is the most stable model we have used. It has the best validation accuracy of 99.44% and the best test accuracy of 99.78% on individual data. On the merged dataset, ResNet50 has a very good performance with 99.34% test accuracy and is just behind Dense20, as shown in Table 3.
Table 3.
Residual Net Individual and Merged Data.
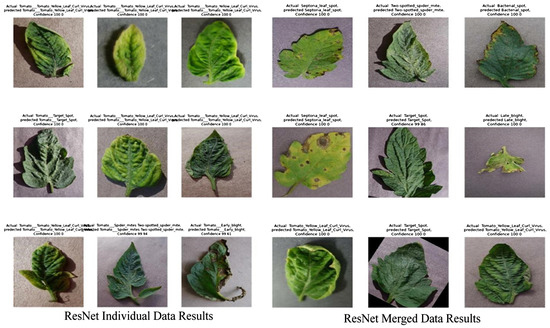
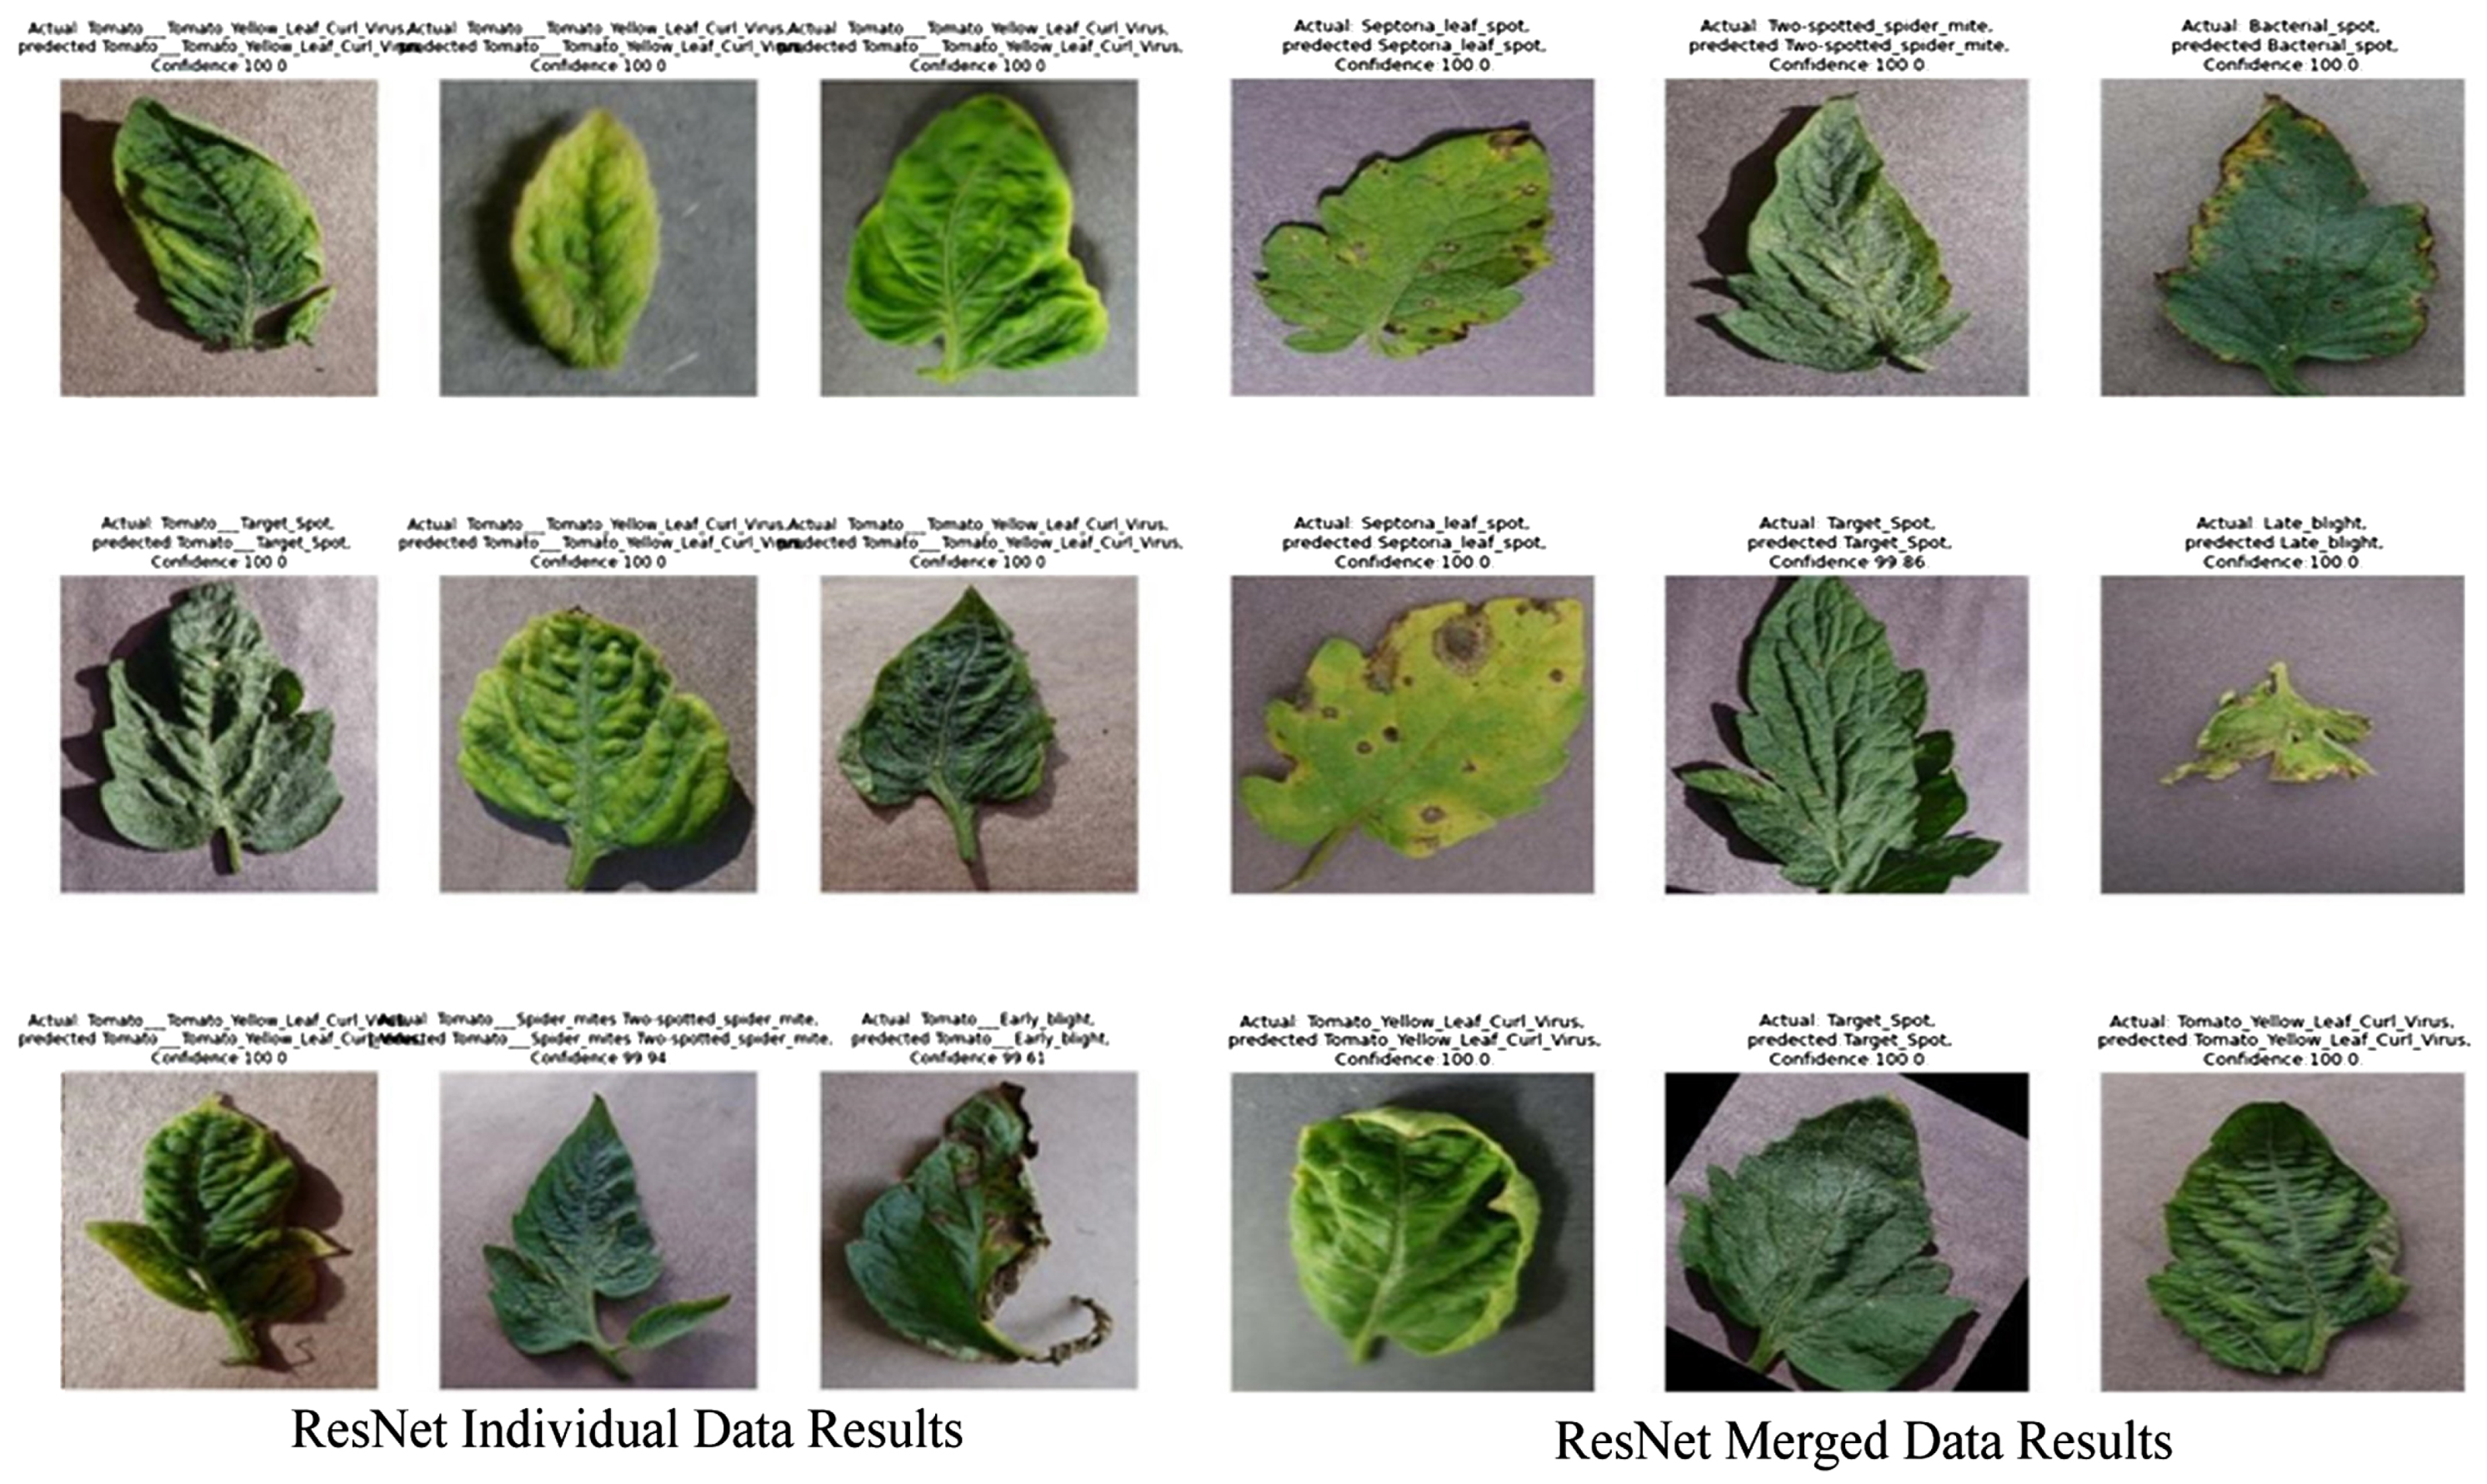
The test and validation accuracy and loss are shown here. Using these graphs, we can demonstrate the performance of the model, as shown in Figure 9. The model fully converged at epoch 4, which is extremely fast. The ResNet model has the best accuracy, as we can see in Figure 10, where the model has successfully identified all the diseases correctly. Mostly, the confidence of the model in these test cases is 100%, and the average confidence is more than 99%.
Figure 9.
ResNet Individual and Merged Data Performance.
Figure 10.
ResNet Individual and Merged Data Results.
4.4. DenseNet121
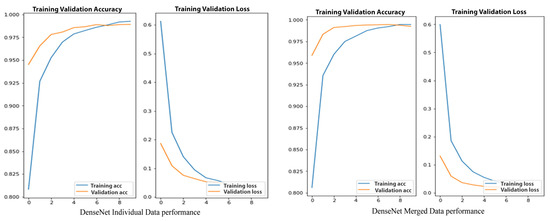
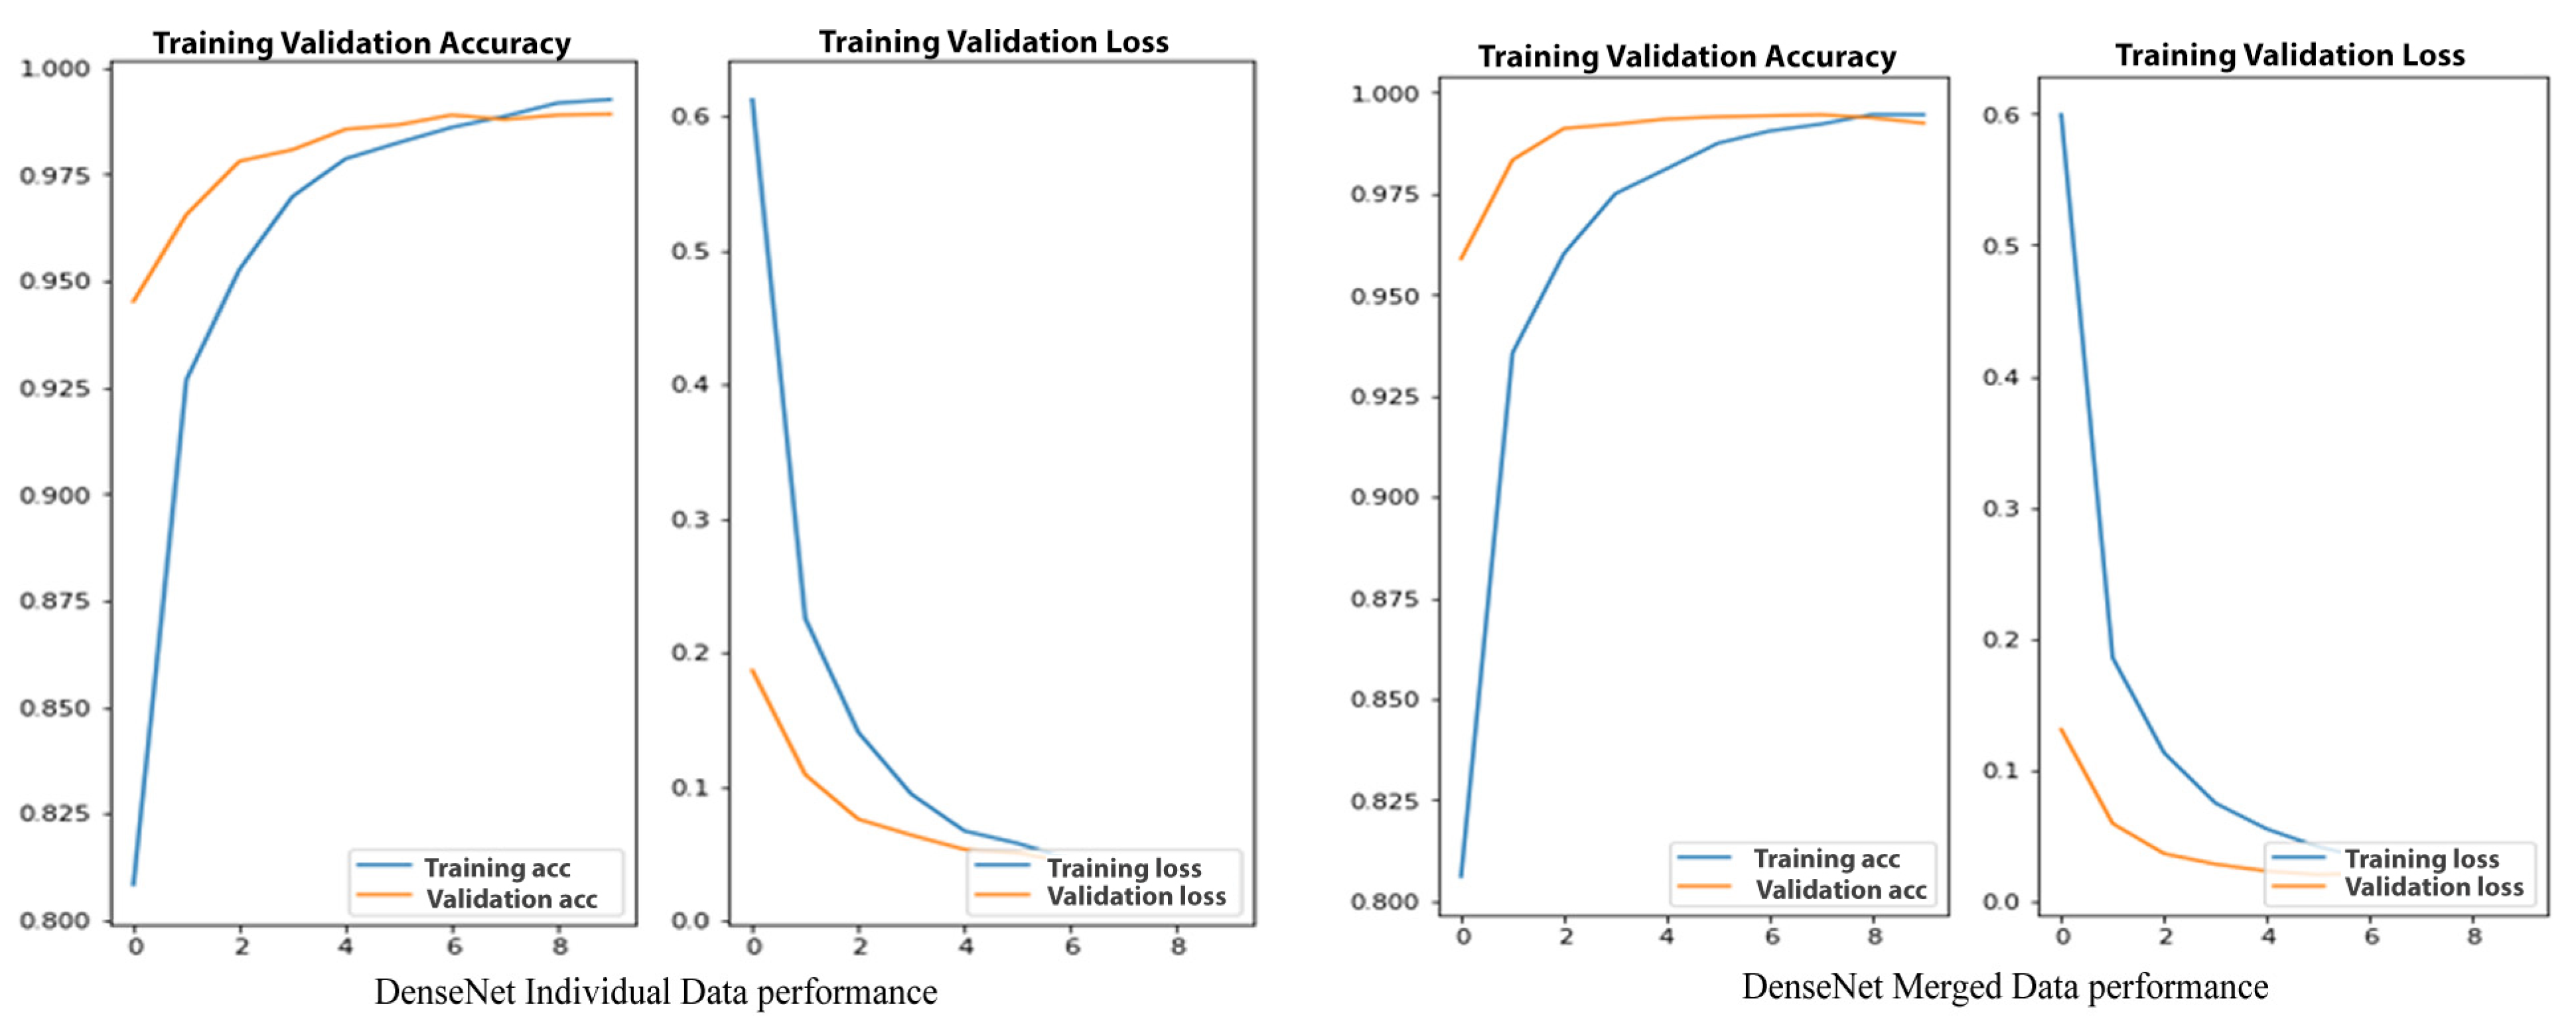
DenseNet121′s performance is also very good. This model has outperformed all the models we have used in this research; it just falls behind ResNet. The DenseNet model has a very good accuracy of 99.55% on the individual dataset. The model has not performed as well on the merged dataset. The model has a very stable validation and training accuracy and loss performance at each epoch. The model is converging, and the accuracy is better. We have stopped the models at this point because the convergence rate has dropped very low; thus, we will obtain a very low-performance gain at a high cost, as shown in Table 4.
Table 4.
DenseNet121 Individual and Merged Data.
Figure 11 shows the training validation accuracy and loss graph. The model has a very stable graph, but the problem is that the convergence drops very quickly on both datasets, as shown in the figures below.
Figure 11.
DenseNet121 Individual and Merged Data Performance.
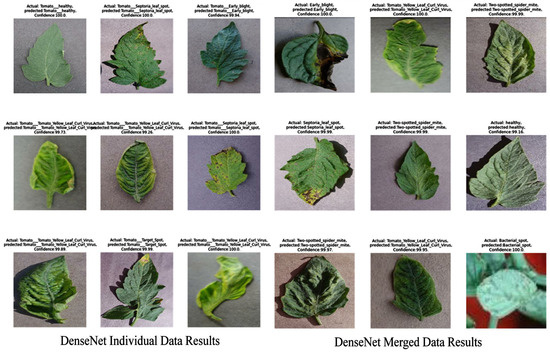
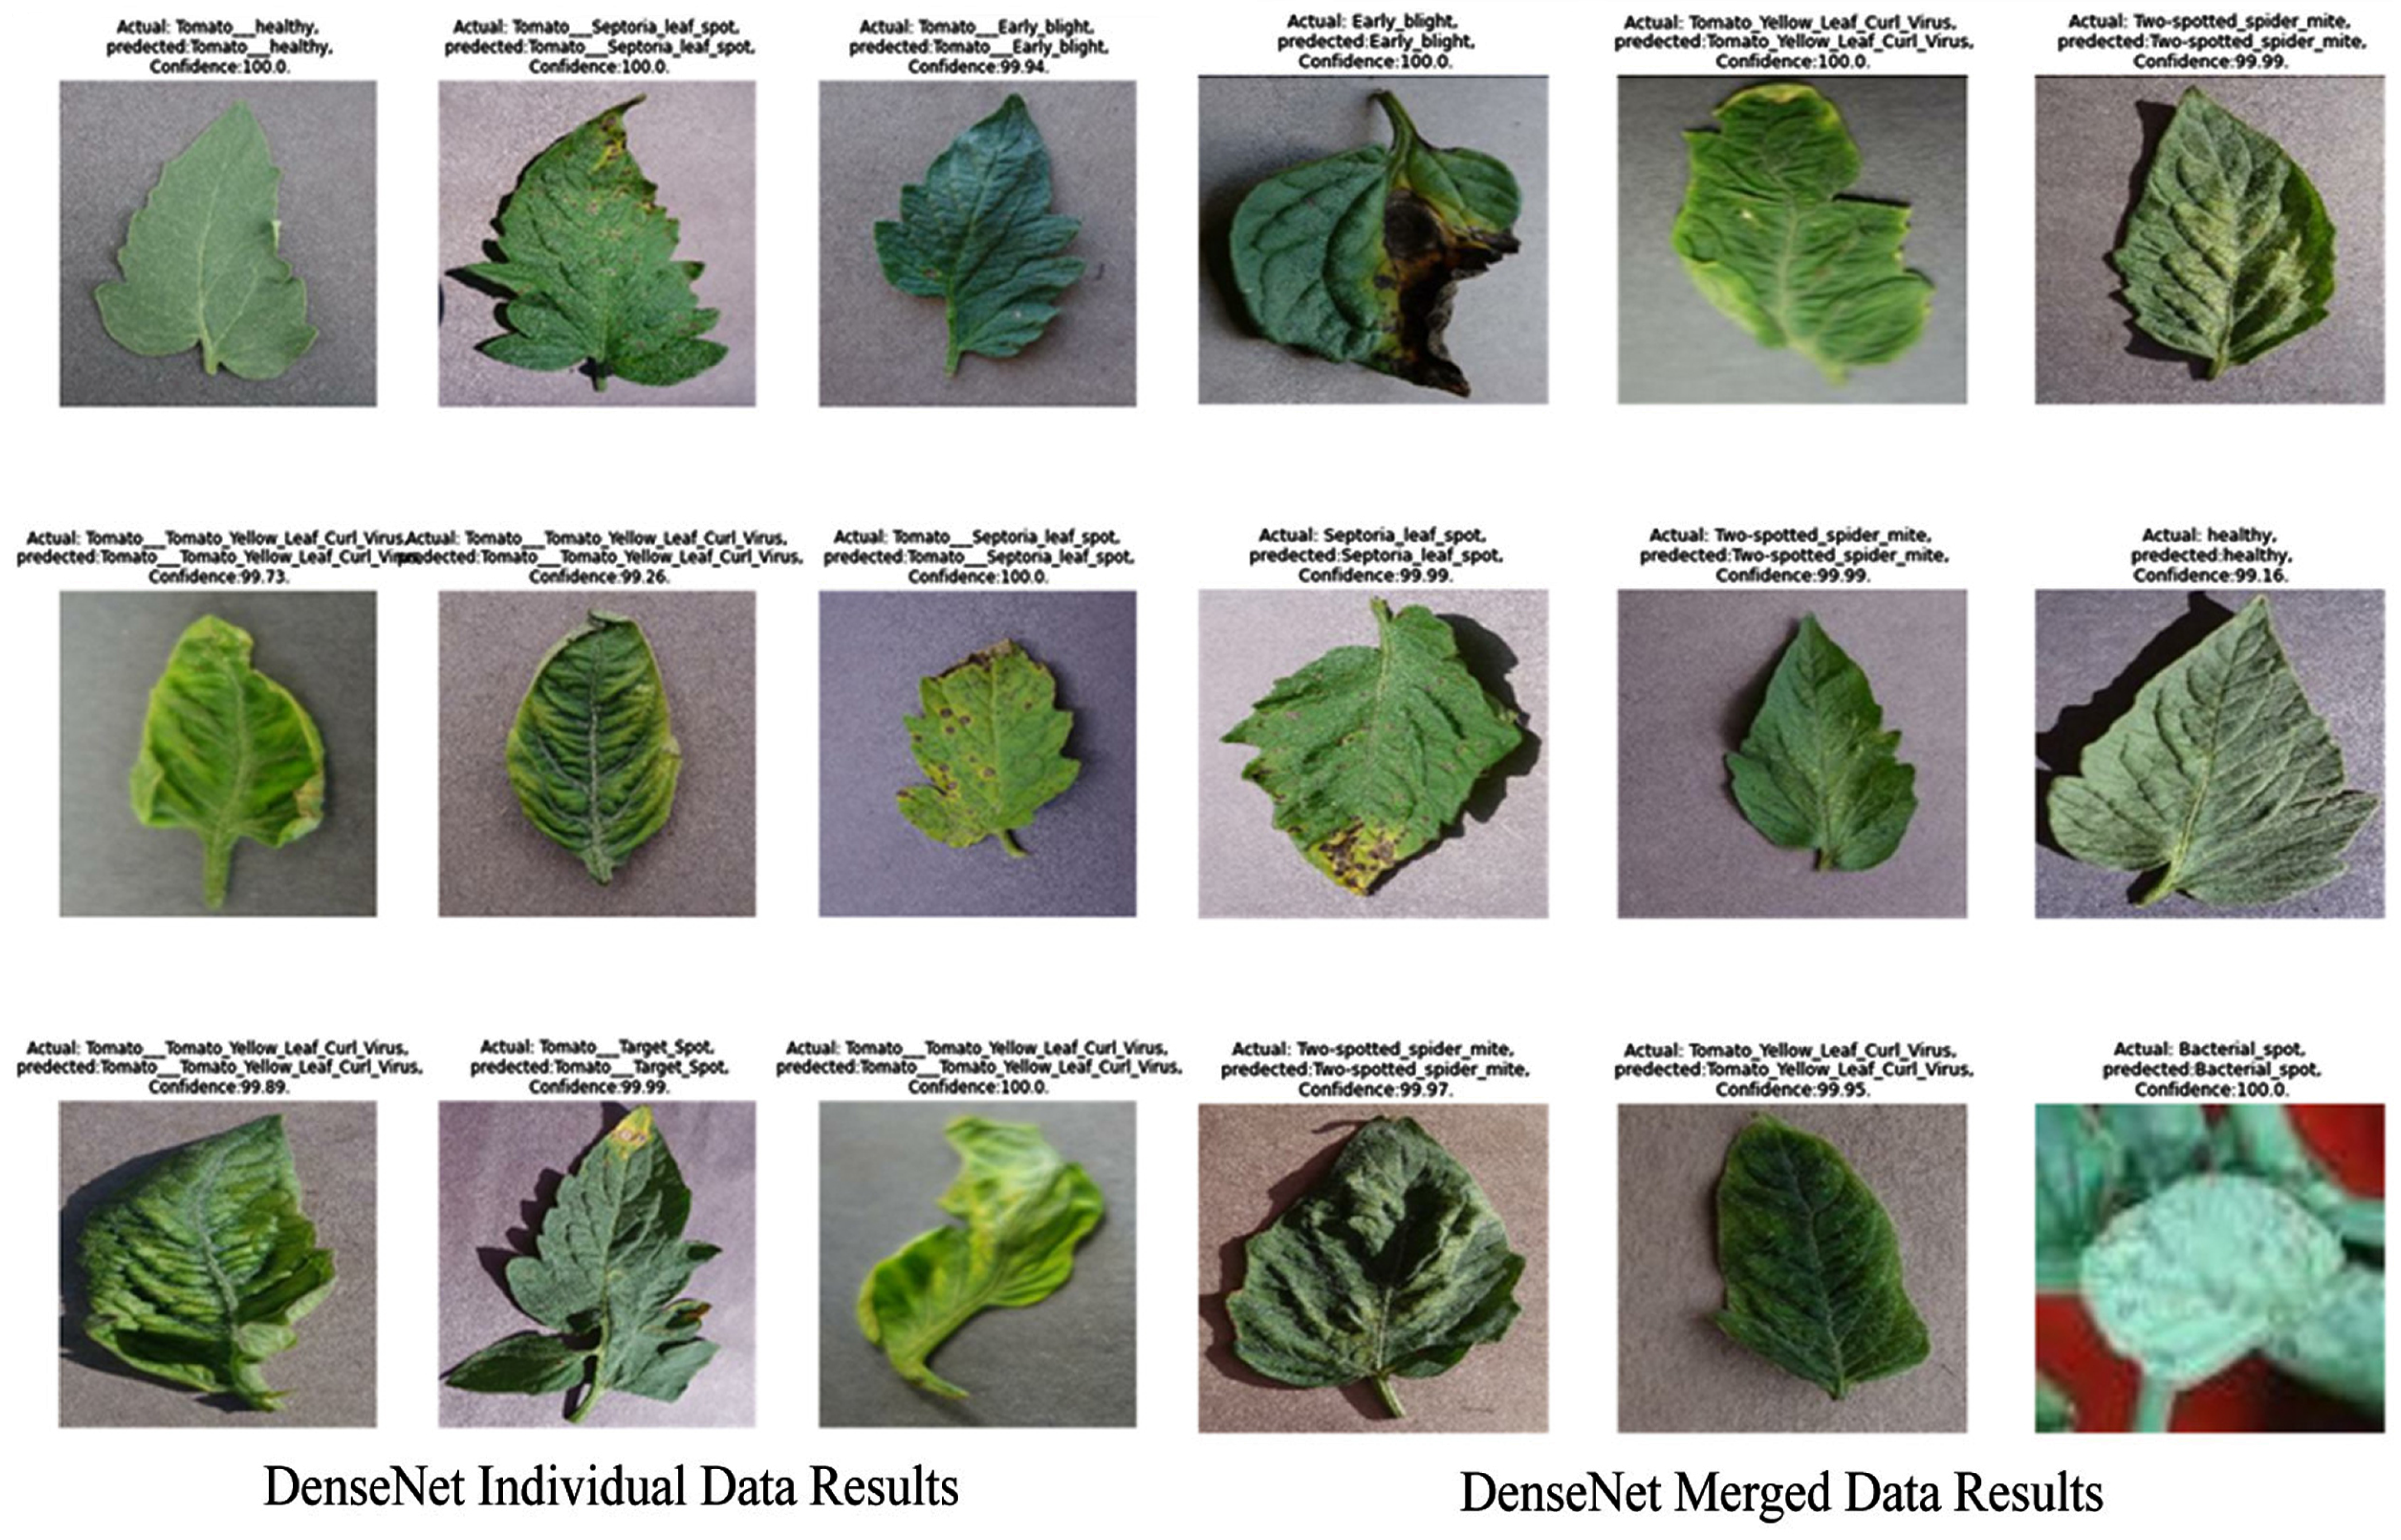
The DenseNet 121 model has the second-best accuracy, as we can see in Figure 12, where the model has successfully identified all the diseases correctly. The confidence of the model in these test cases gives an average confidence of more than 99%.
Figure 12.
DenseNet121 Individual and Merged Data Results.
4.5. DenseNet169
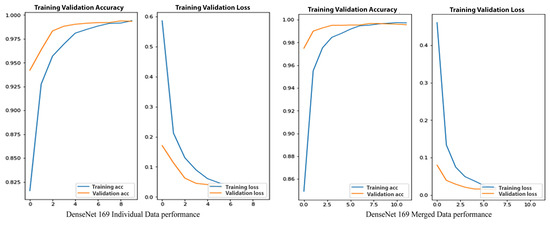
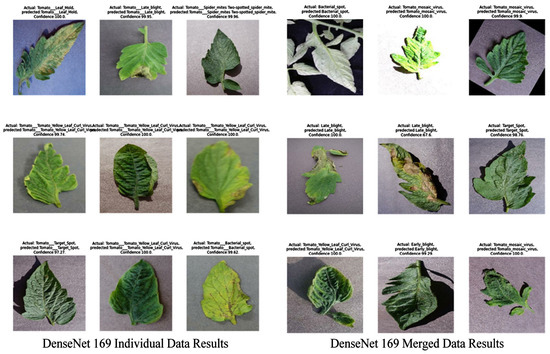
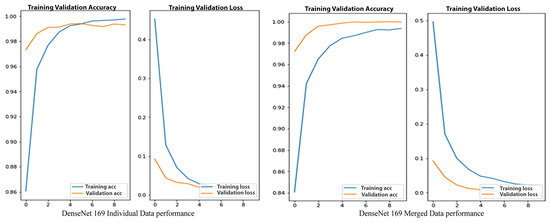
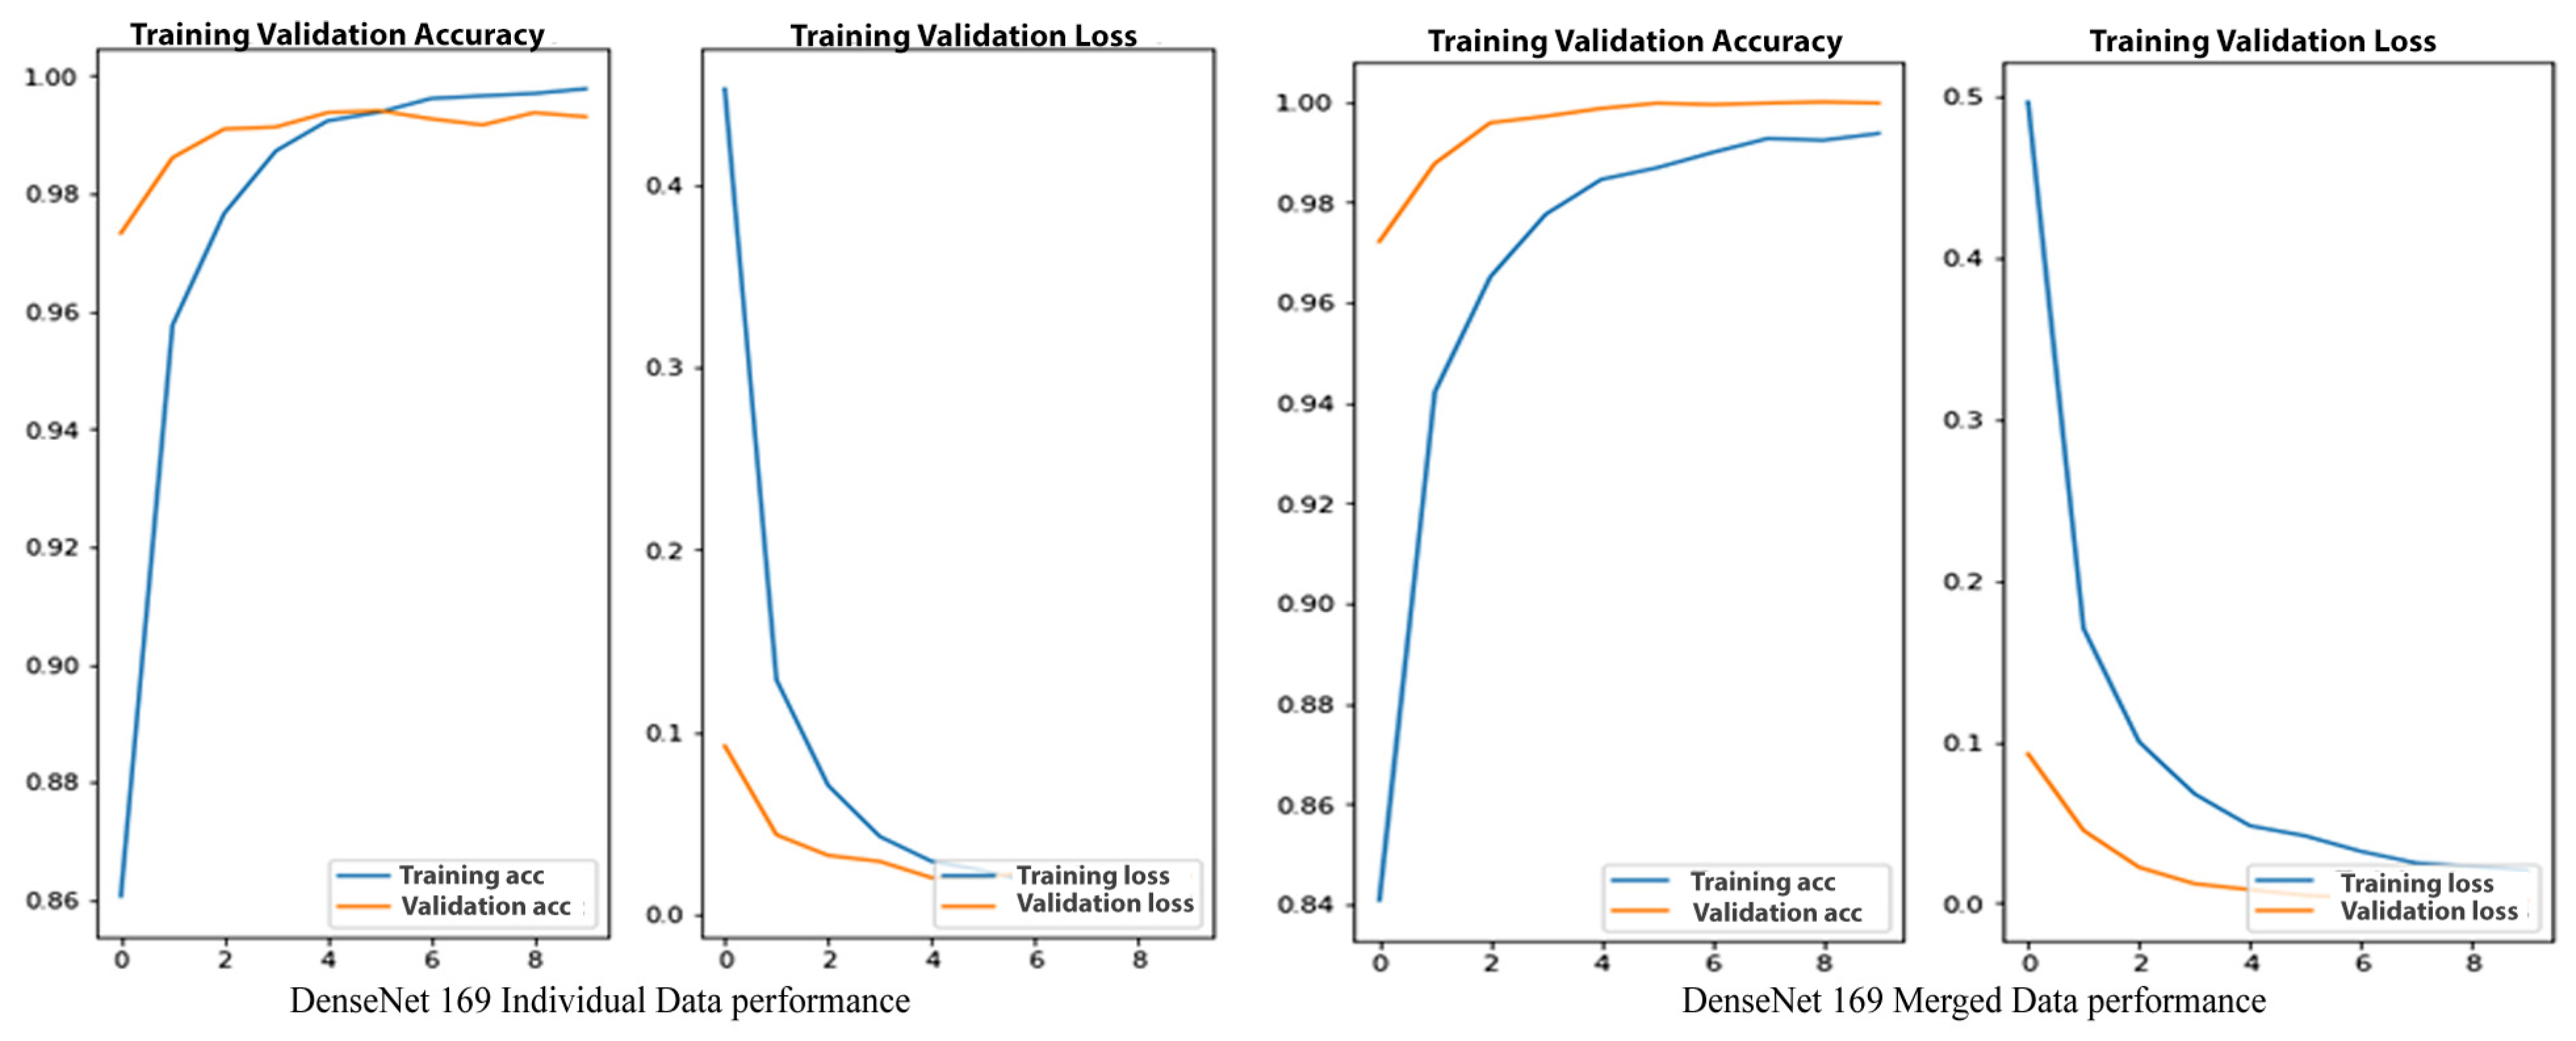
We have achieved a test accuracy of 99.78%, the same accuracy as ResNet50. The DenseNet169 performance was one of the best in this research. We believe that ResNet has performed a little better than DenseNet169 because the test accuracy is the same for both models, but the training and validation accuracy of ResNet50 is better, and also the parameters are fewer in ResNet. As we can see, models are very stale. The model has been almost fully trained because there are no more significant improvements, as shown in Table 5 below. The model has fully converged, as shown in Figure 13, and does not need any more epochs.
Table 5.
DenseNet169 Individual and Merged Data.
Figure 13.
DenseNet169 Individual and Merged Data Performance.
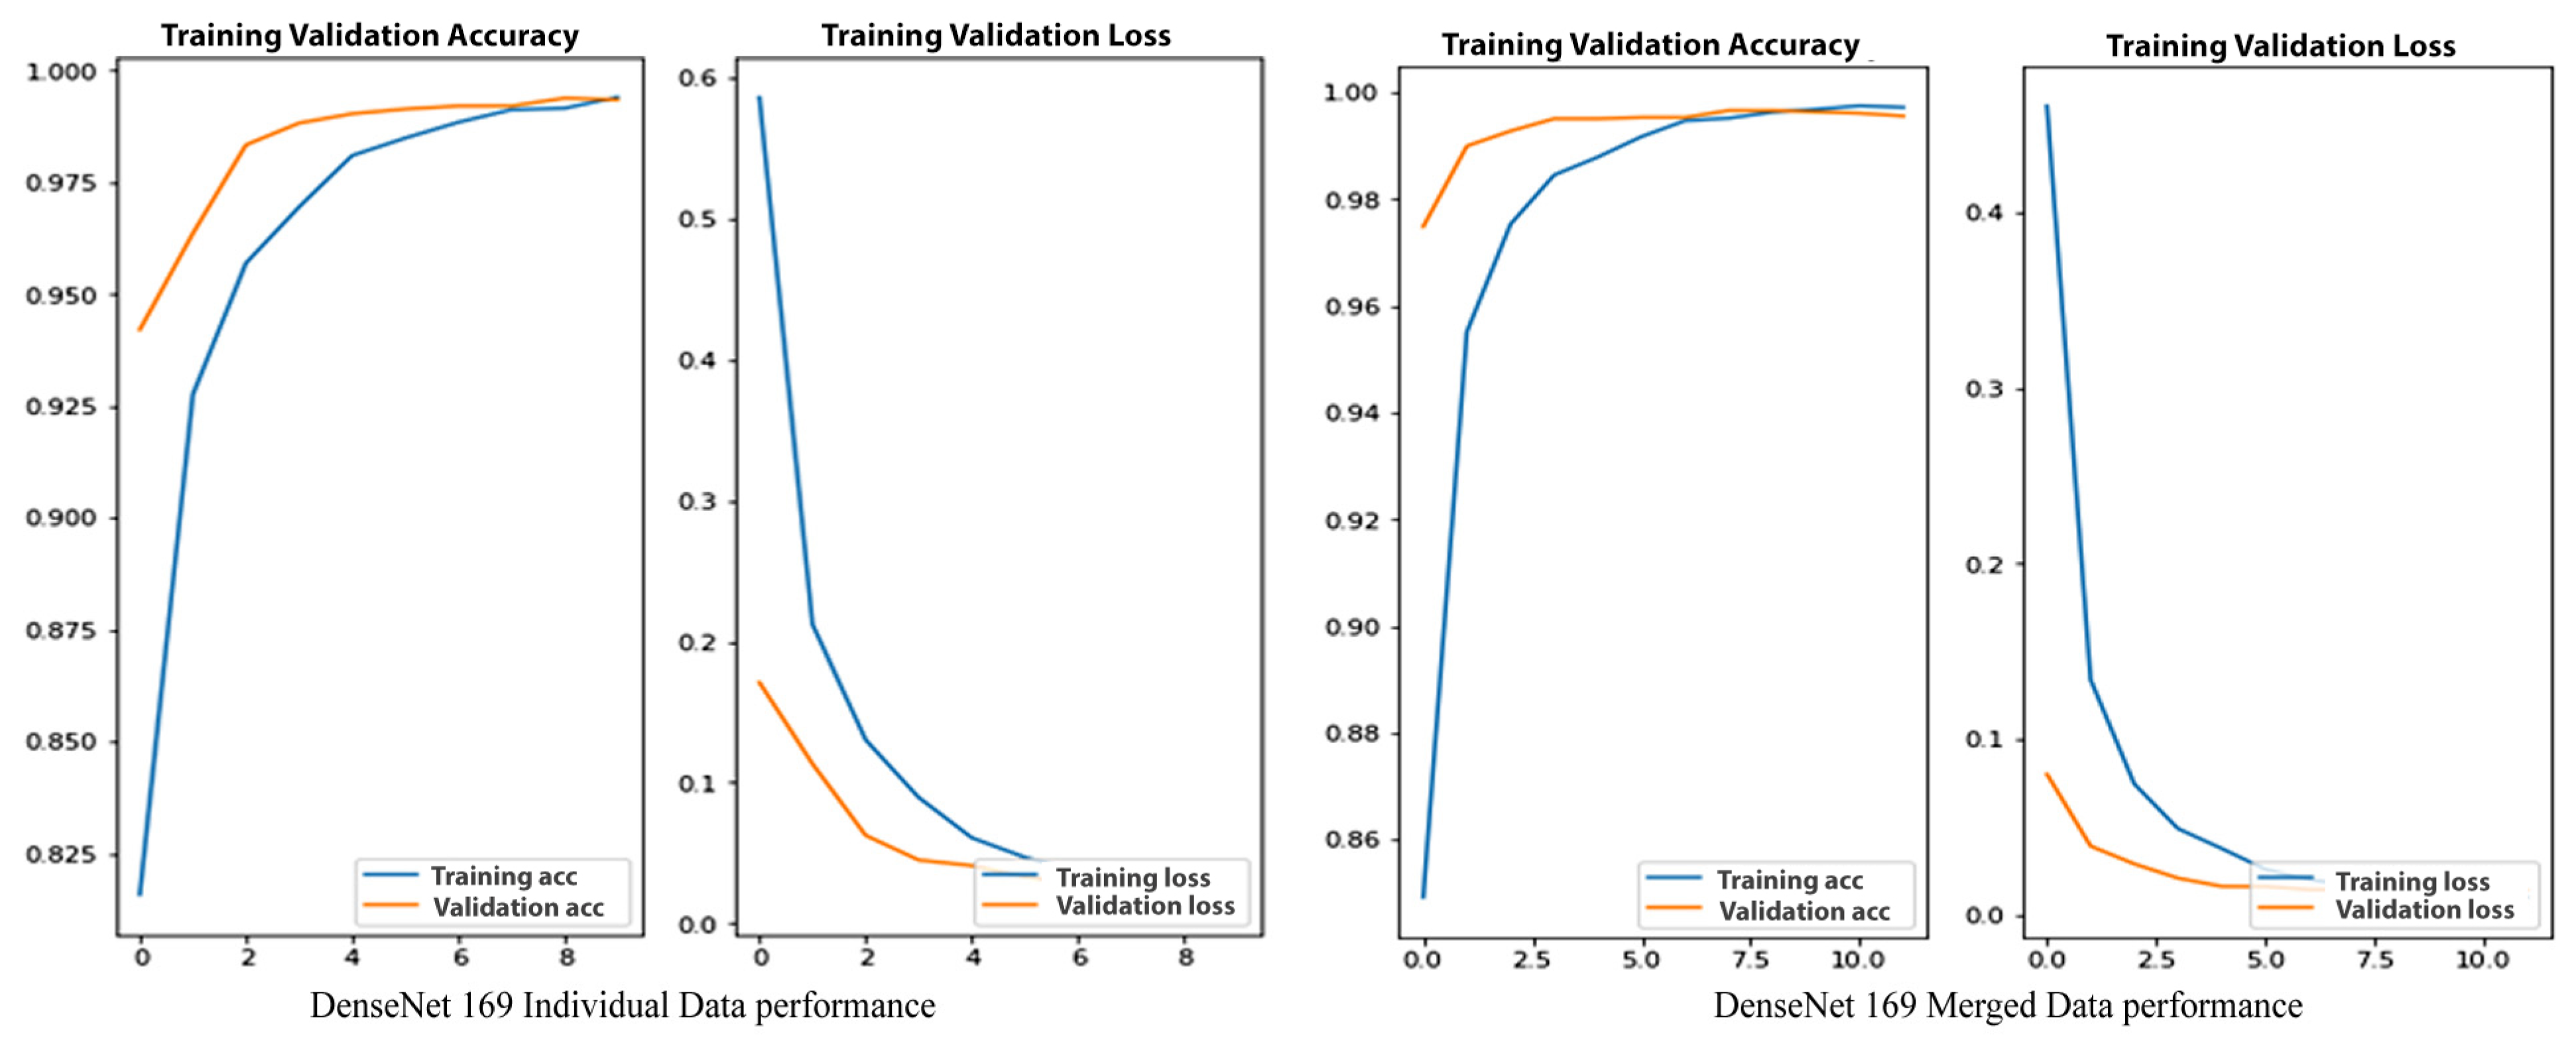
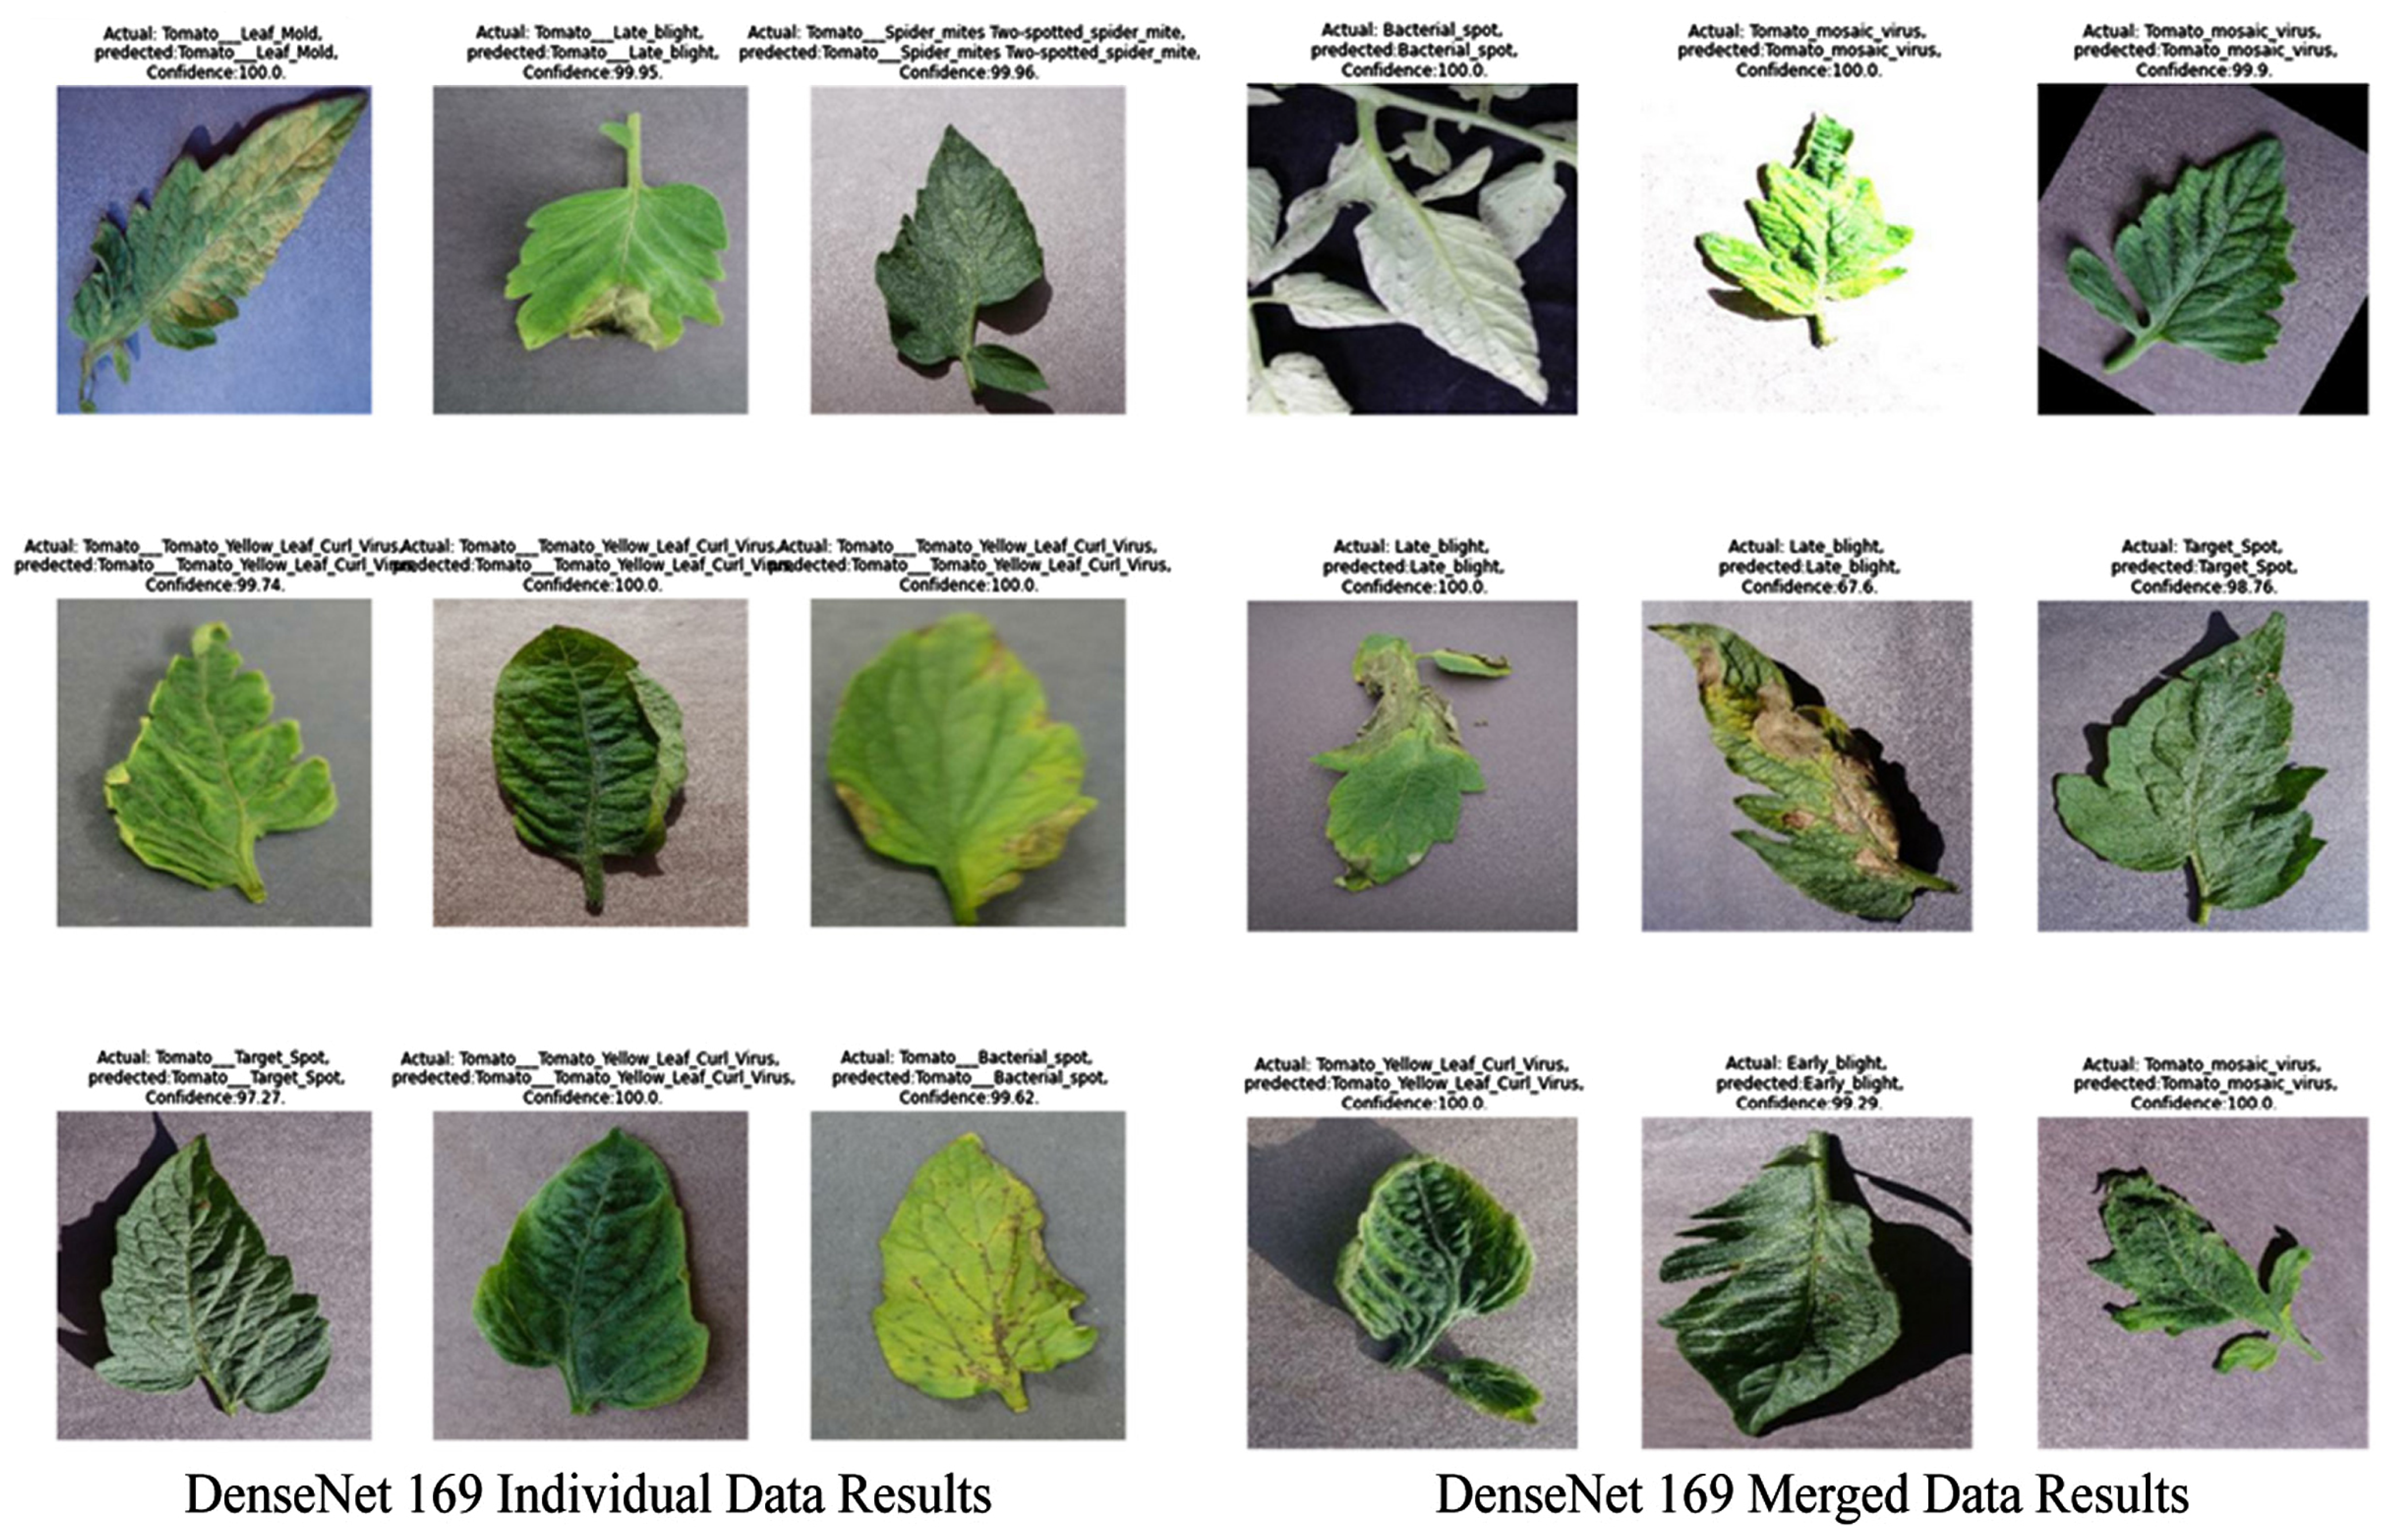
DenseNet169 has successfully identified all of the nine test subjects correctly. The confidence in the model is very high, averaging 99%. Only for one subject is the model confidence at 97%, which is below the average, but the confidence is almost 100% in most of the other subjects in Figure 14.
Figure 14.
DenseNet169 Individual and Merged Data Results.
4.6. DenseNet201
DenseNet201 is a type of DenseNet model series. In this research, the models have performed well with 99.78% training accuracy, 99.33% validation accuracy, and 99.67% test accuracy. There are only two other models that have performed better than DensNet201 in this research. Table 6 shows that the training accuracy and loss are improving at each epoch, but the main issue is that the validation accuracy and loss are not improving. For this reason, we have ended the model training.
Table 6.
DenseNet201 Individual and Merged Data.
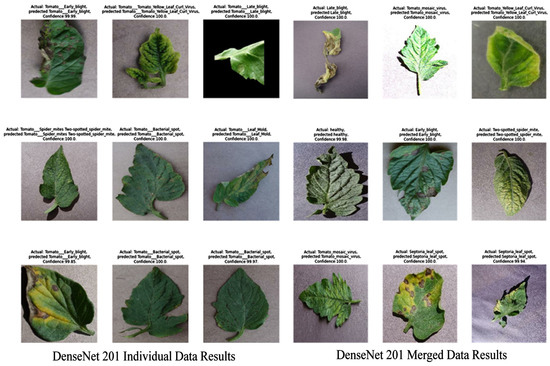
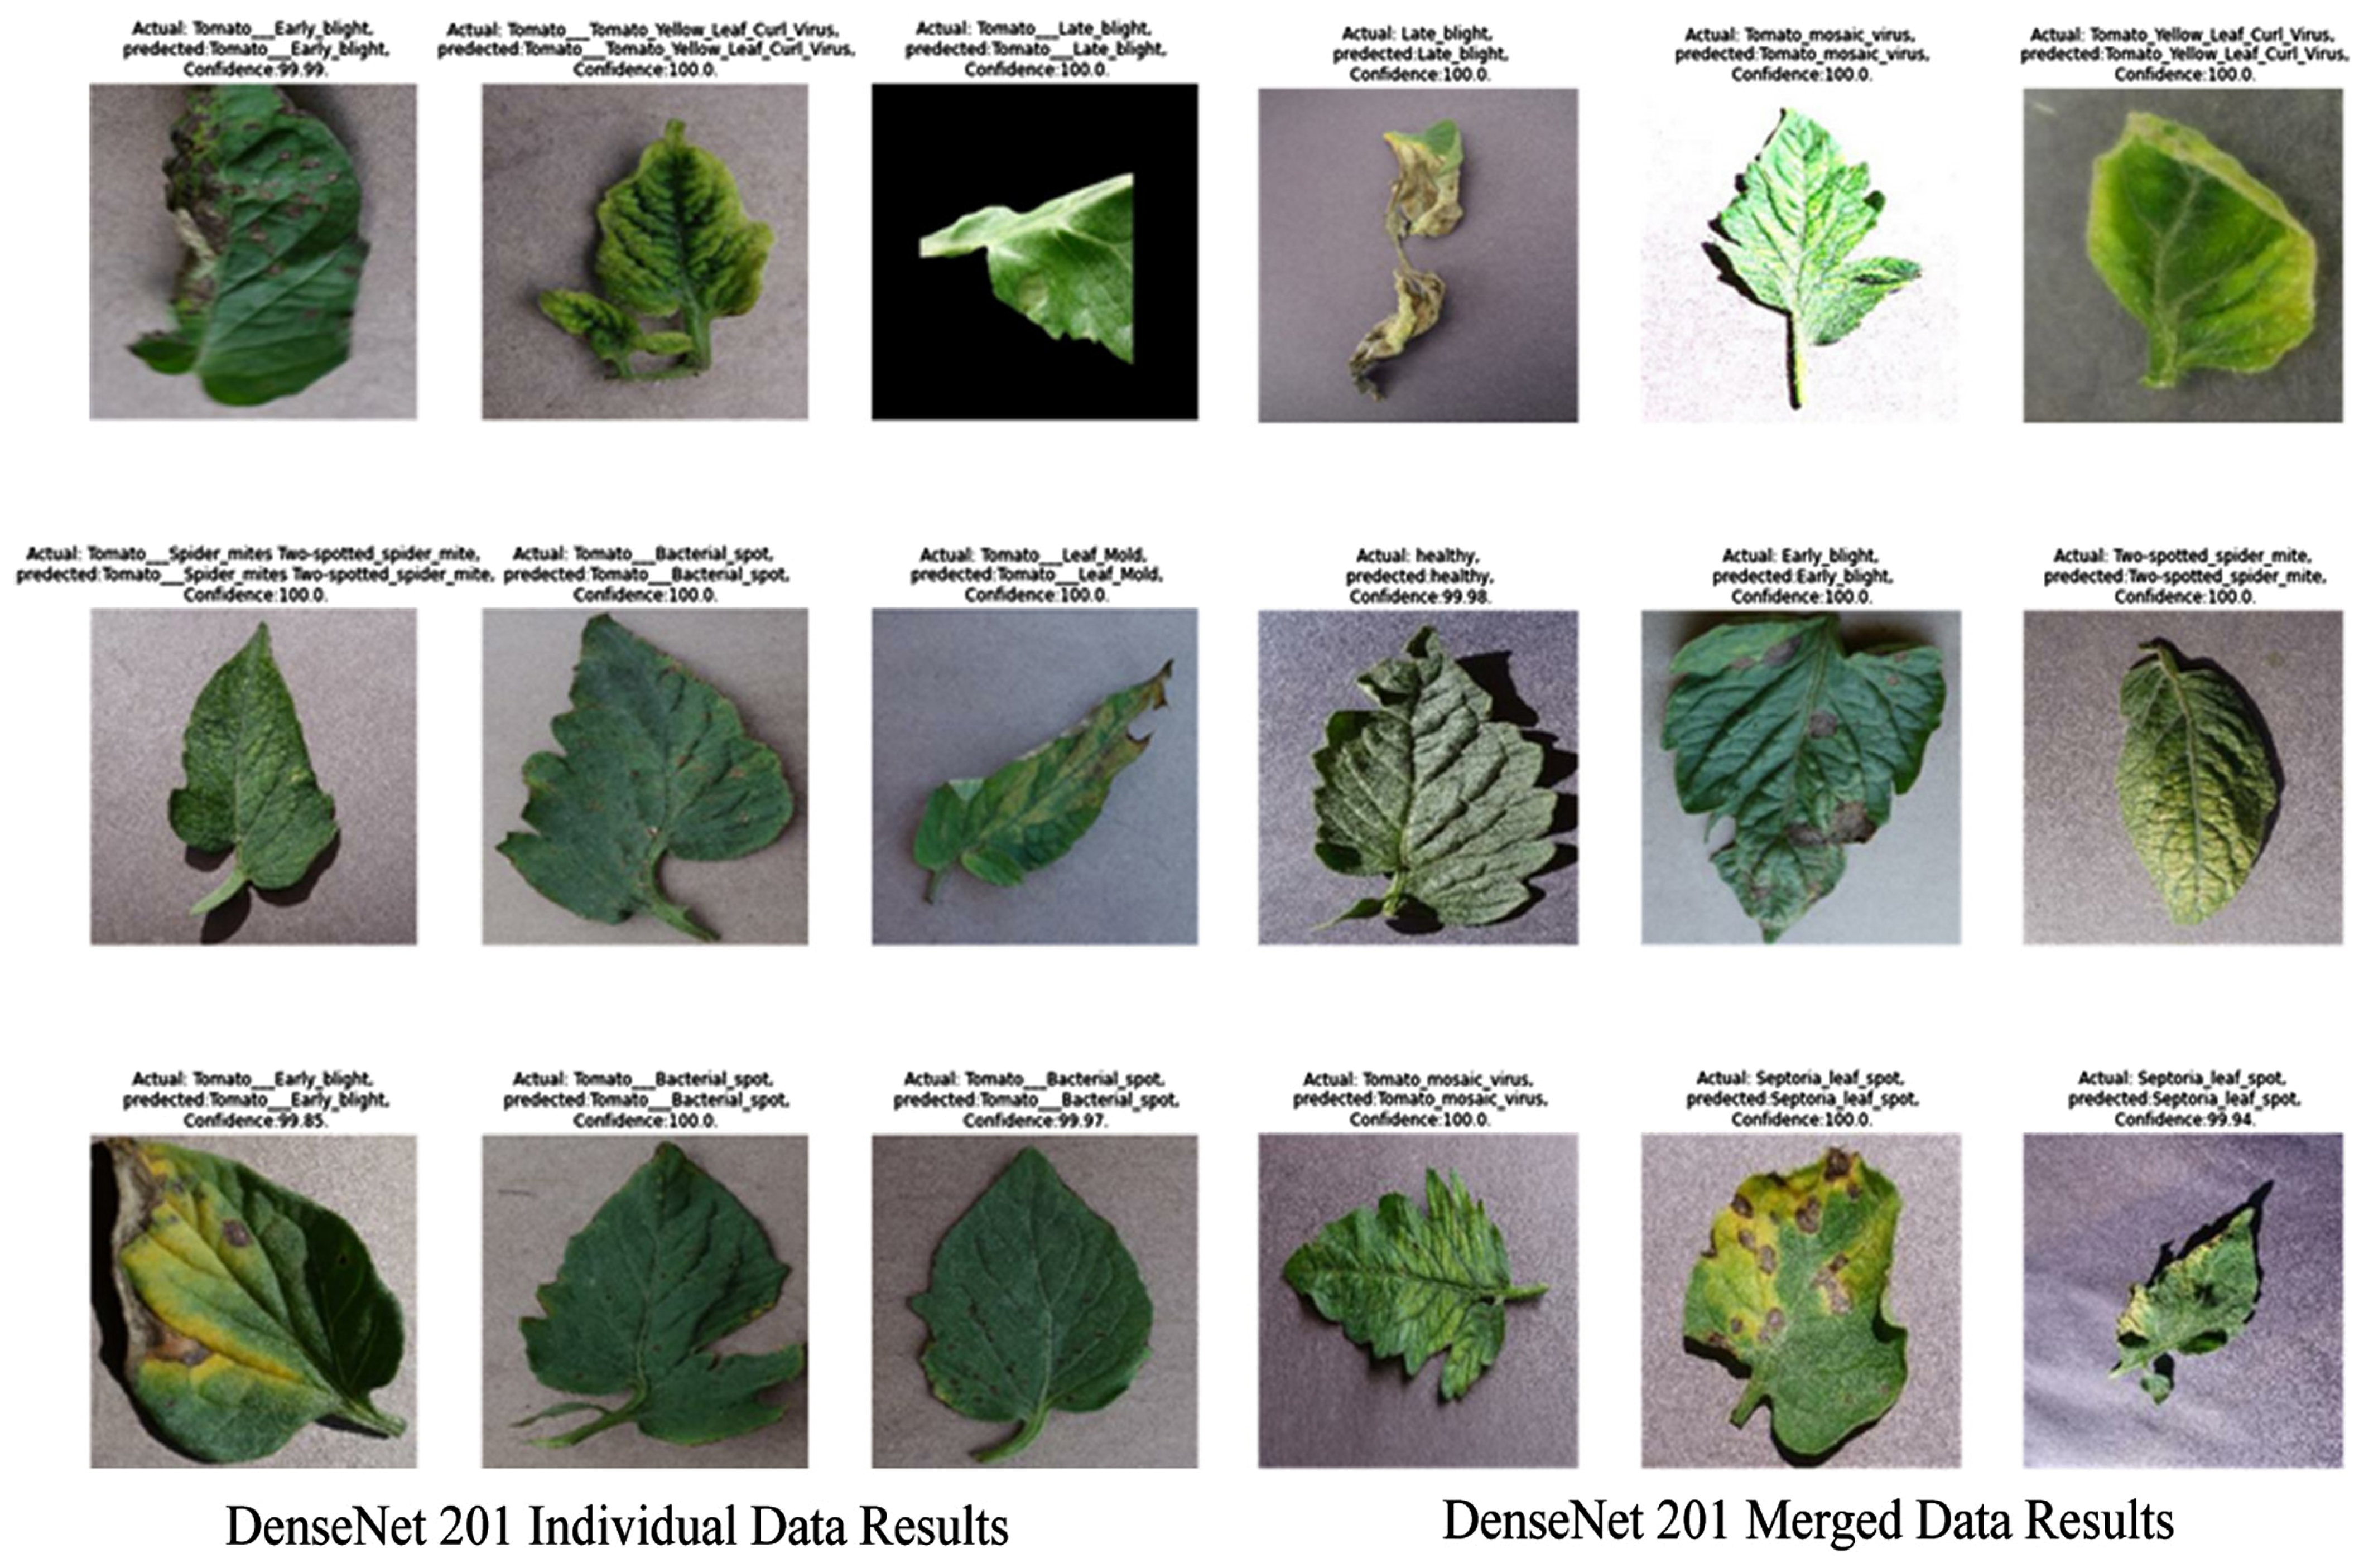
Looking at these accuracy and loss graphs, we can see that the model has stopped the convergence. By using these graphs, we can understand that the model cannot improve anymore, and further training can cause overfitting and gradient vanishing, as shown in Figure 15. These are some of the results that we have taken from testing the model. The model has successfully identified all the diseases with almost 100% confidence. There are no false–true or true–false predictions, but on more testing data, this model does not have the best accuracy, as shown in Figure 16.
Figure 15.
DenseNet201 Individual and Merged Data Performance.
Figure 16.
DenseNet201 Individual and Merged Data Results.
5. Comparative Analysis and Discussions
Unlike most prior research using transfer learning on diverse plant data, our study’s targeted focus on tomatoes enabled the development of a custom model that delivers superior accuracy while simultaneously minimizing both model complexity and computational requirements. This research investigated the use of deep learning for accurate and fast tomato plant disease identification. Existing convolutional neural networks (CNNs) like VGG, ResNet, and DenseNet were evaluated for their performance, and a custom deep learning model was developed and tested. The custom model achieved over 99% accuracy in identifying 10 tomato plant diseases (including healthy plants). This high accuracy was achieved with less training time and lower computational cost compared to other CNNs. This research demonstrates the potential of deep learning for efficient and accurate tomato plant disease detection, which can benefit farmers and contribute to improved agricultural production. The custom model’s efficient performance makes it promising for practical implementation in real-world agricultural settings. The research used large datasets of tomato plant images, which helped achieve high accuracy. Different deep learning and machine learning models have been developed in this study. This stage involves comparing all of the models. Here, we have to look at the models that were employed in this study, ranked by performance from worst to best. Table 7 and Table 8 show us the model, no. of layers, the optimizer, the no. of parameters, the no. of epochs used for training the model, the training, testing, and validation accuracies and loss for the signal dataset that we have used.
Table 7.
Comparison Table with Individual Data.
Table 8.
Comparison Table of Merged Data.
5.1. Comparison Table of Individual Data
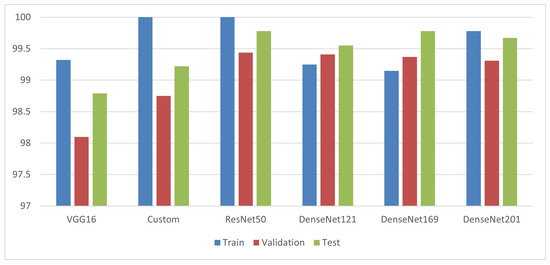
For each model created using a specific dataset, the accuracy and loss are shown in Table 7 for training, testing, and validation. ResNet50 and DenseNet169 have the highest test accuracies, according to the table, but ResNet50 is more effective. The VGG16 also has the lowest level of accuracy overall.
5.2. Comparison Chart of Individual Data
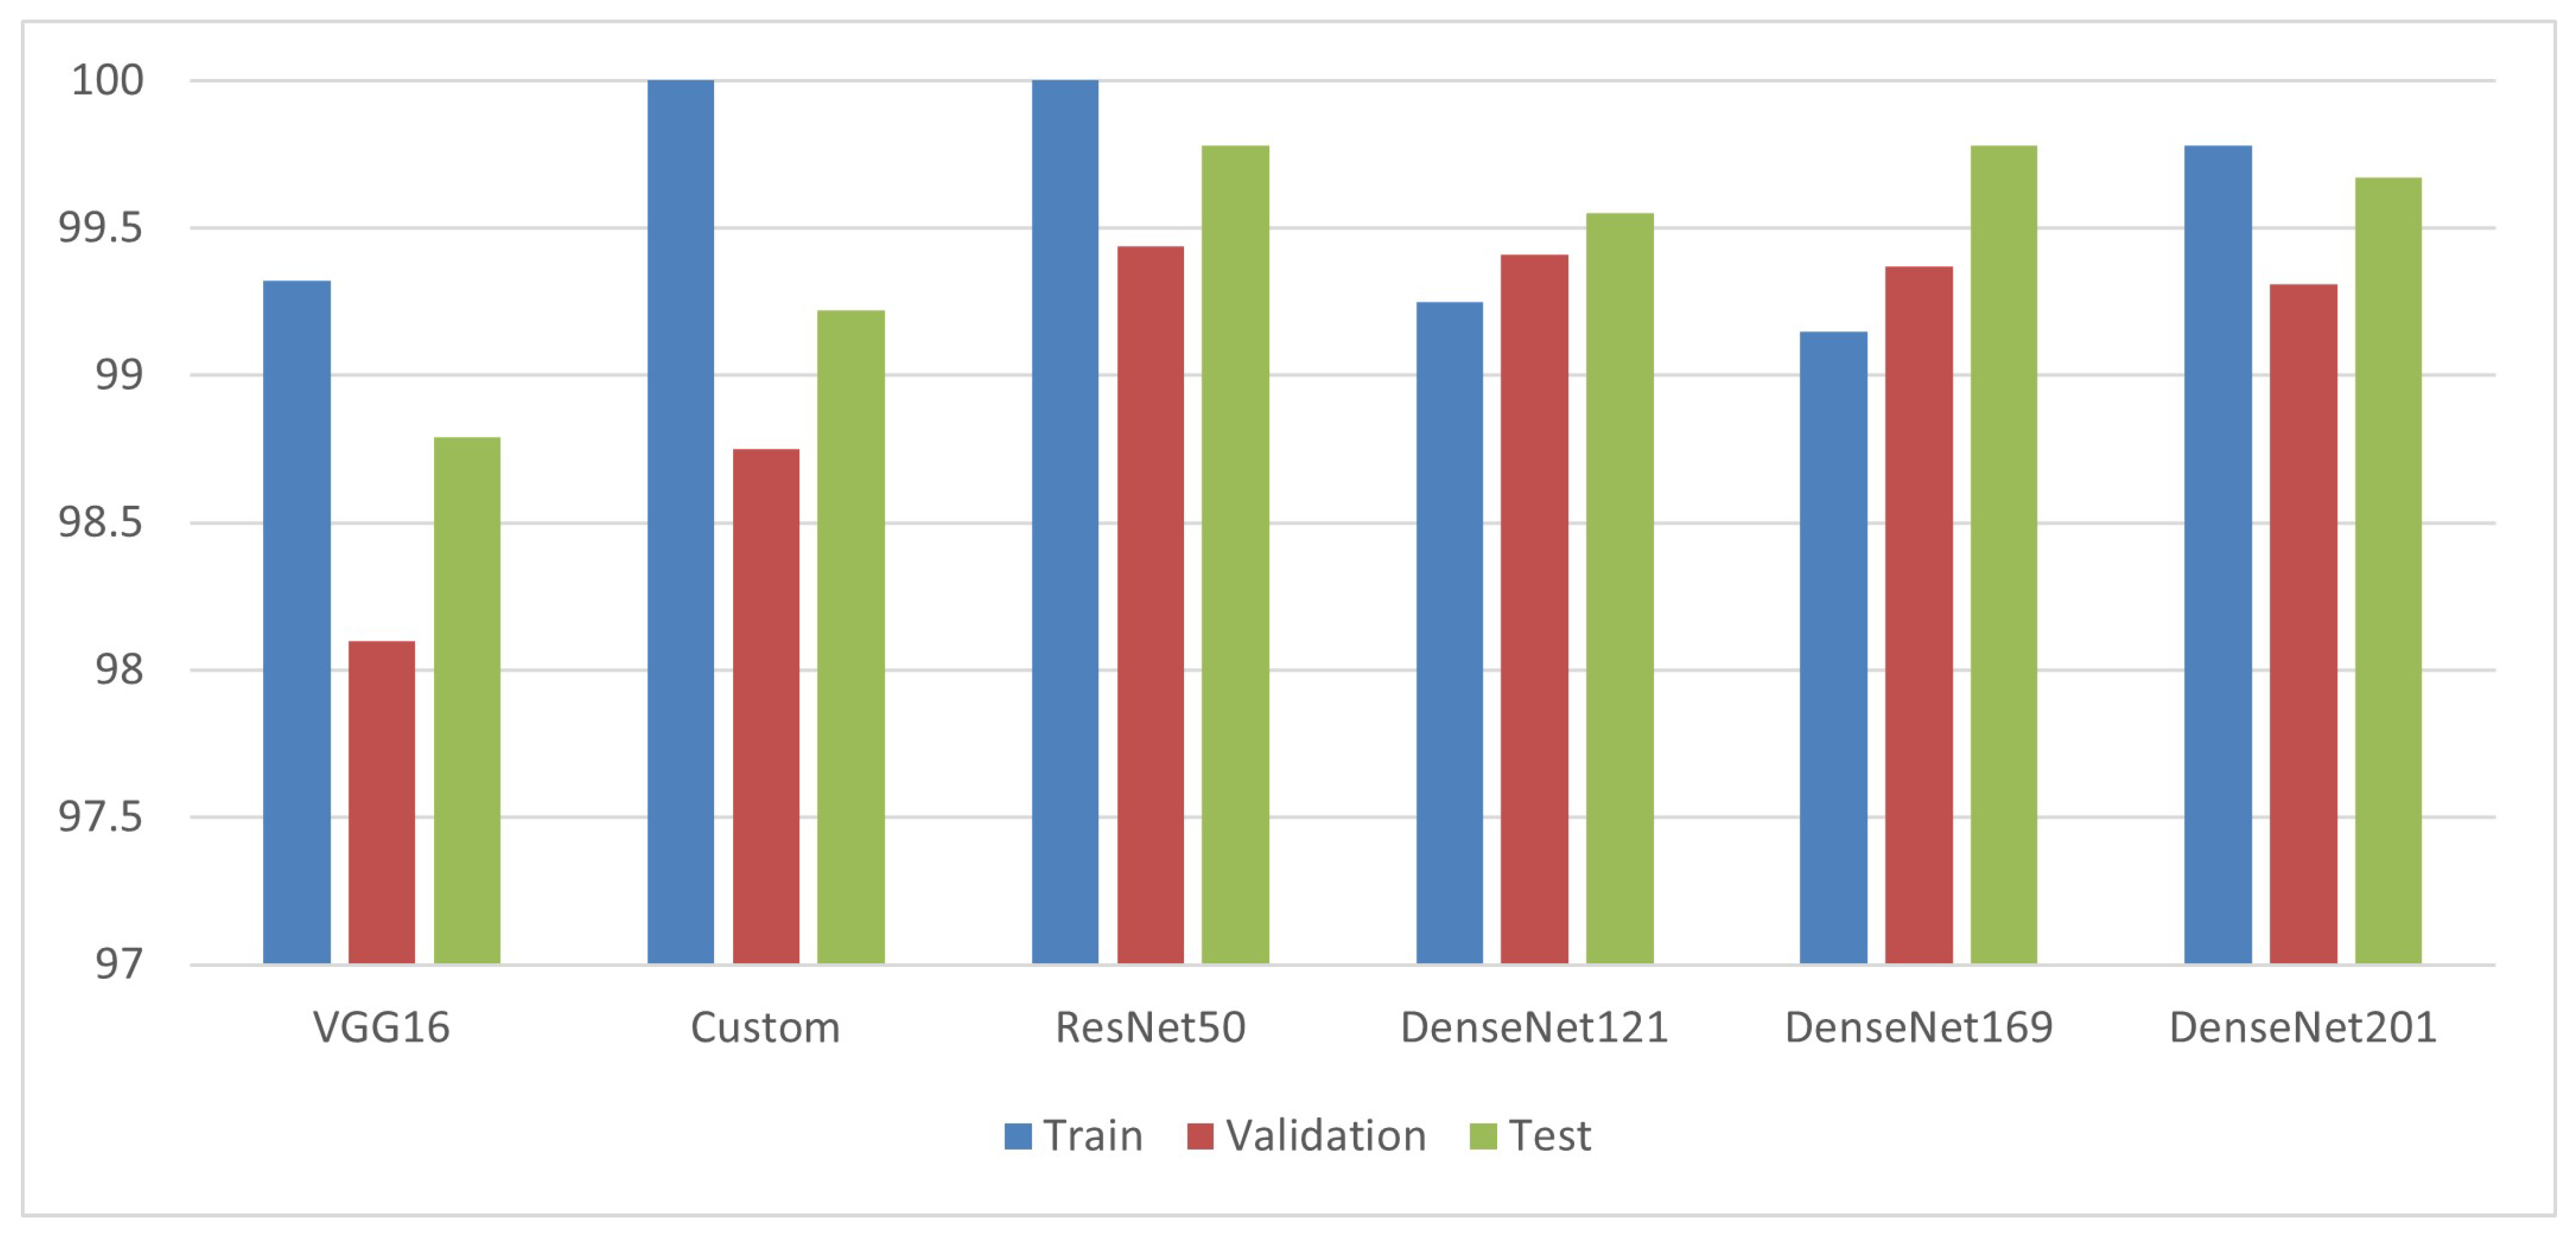
Here is a graph that shows how the models have performed. The DenseNet201 model is the best model, followed by ResNet50 in this study, as shown by the graphic. Figure 17 shows that ResNet50 has the highest overall training validation and test accuracy.
Figure 17.
Comparison Chart of Individual Data.
5.3. Comparison Table of Merged Data
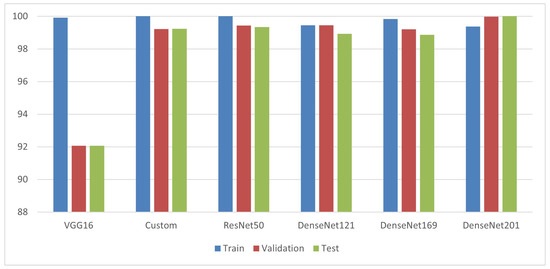
For all of the models created using the combined dataset, the training, testing, and validation accuracy and loss are shown in Table 8. According to the table, DenseNet201 and DenseNet169 have the best test accuracies, but DenseNet201 is superior. Additionally, the VGG16 once more has the lowest overall accuracy.
5.4. Comparison Chart of Merged Data
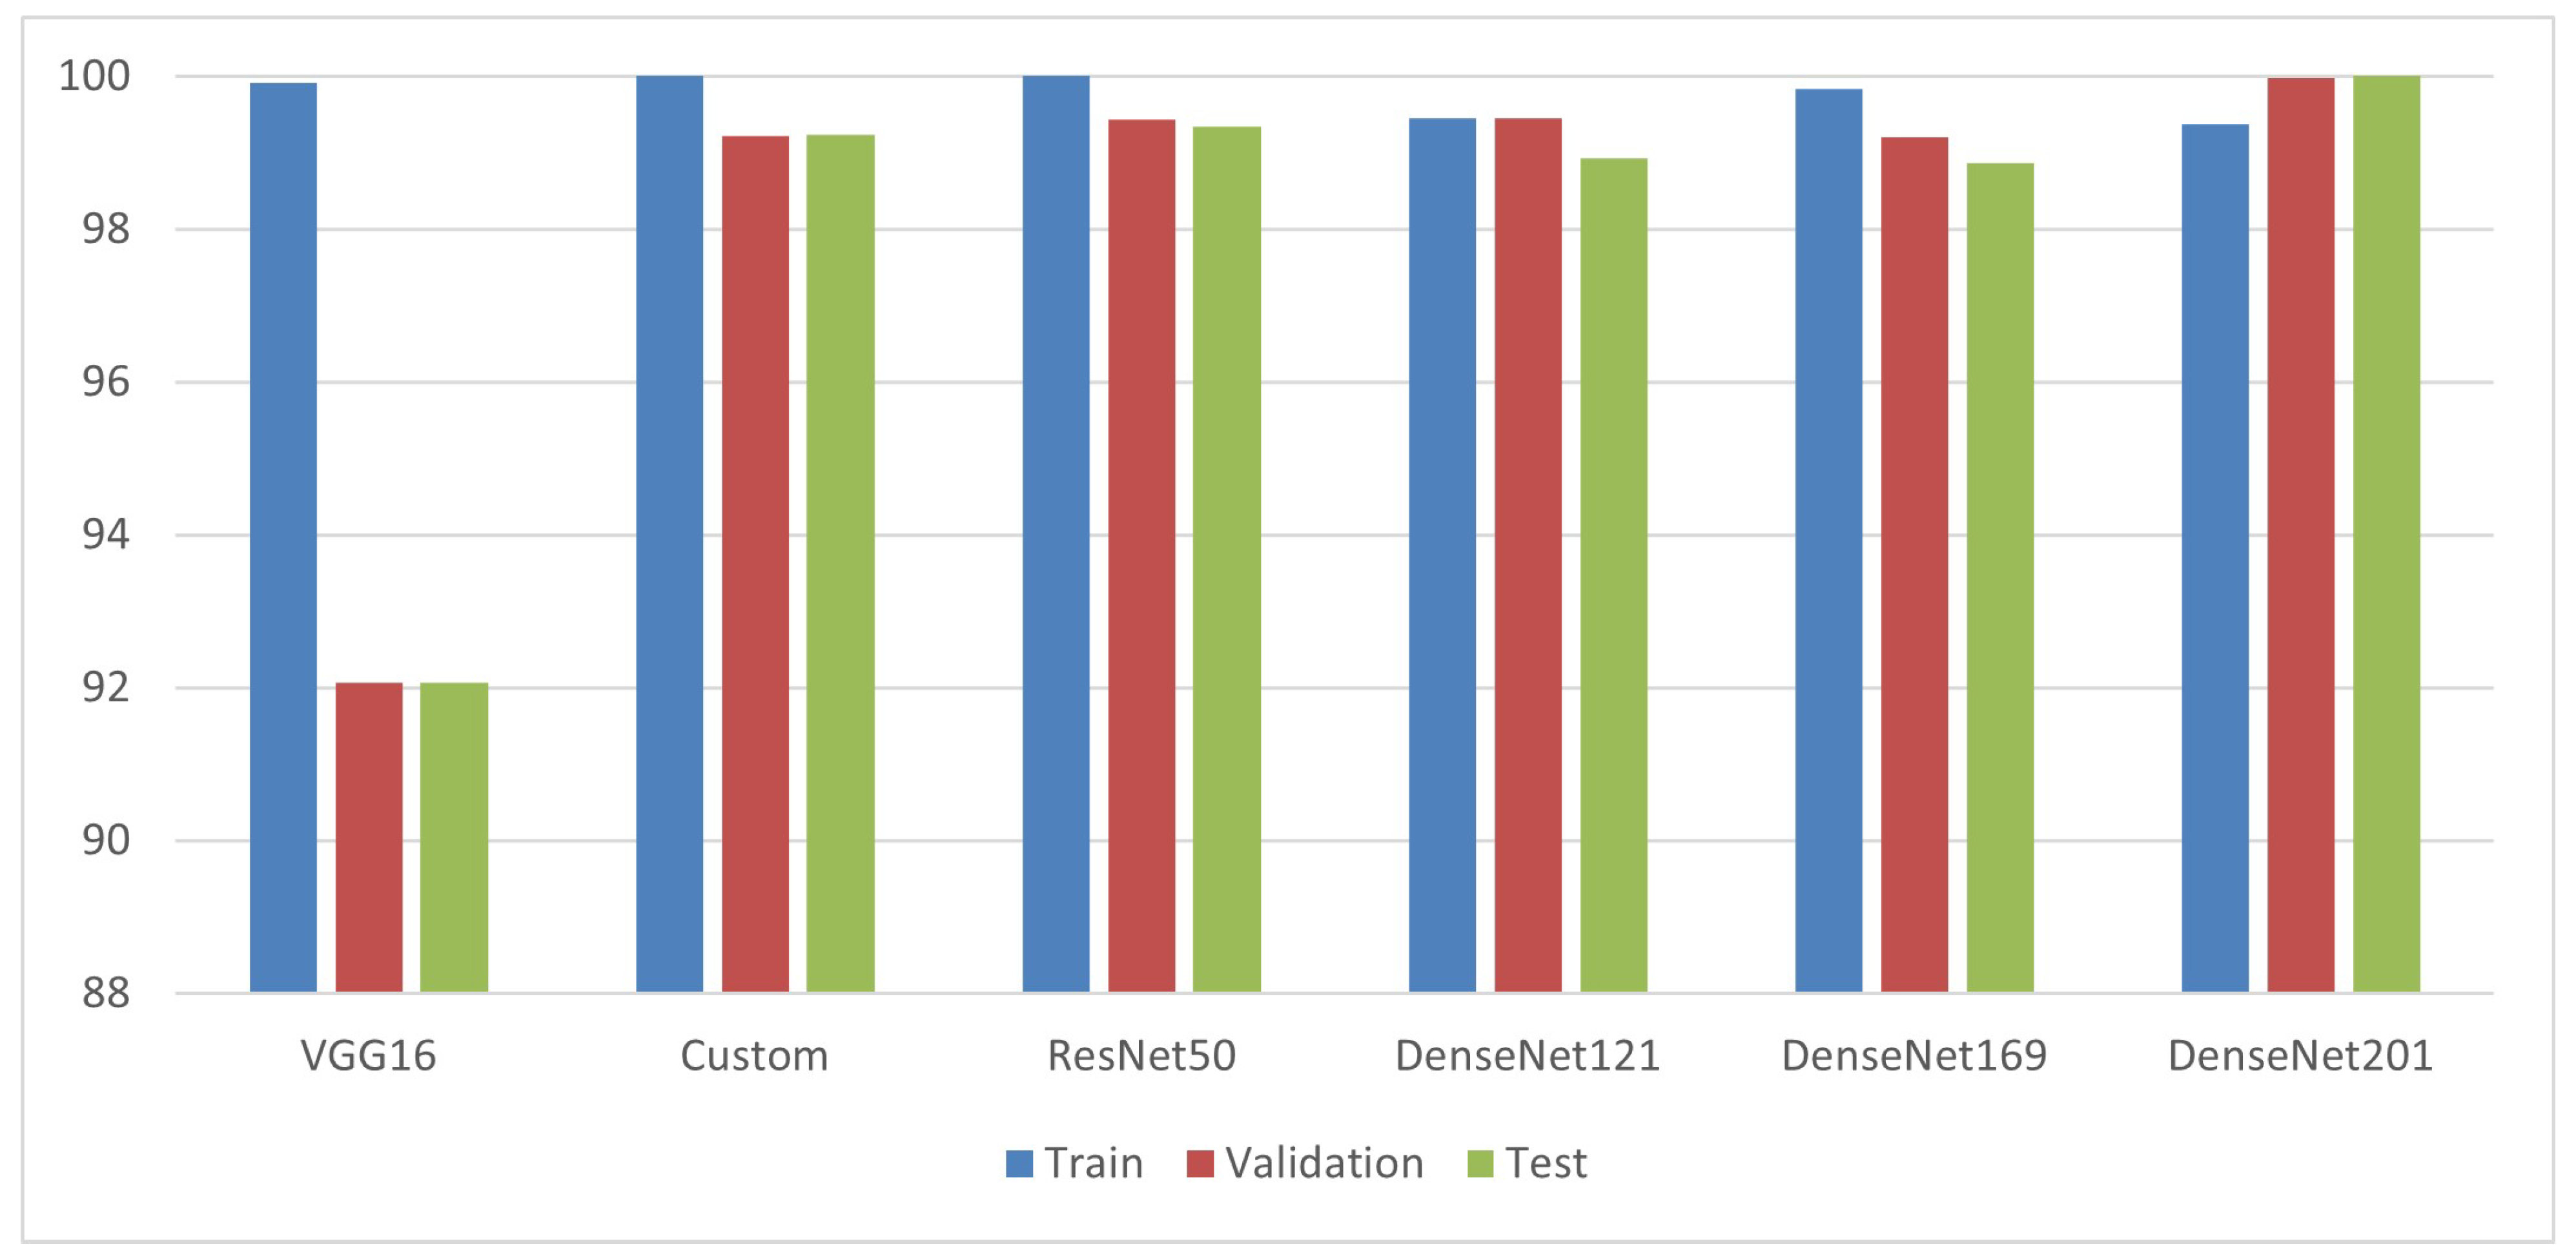
The graph below demonstrates that, except for the VGG16, most models have fared extremely well. With Dense201, the ResNet50 has performed best, and our model is closely following, as shown in Figure 18.
Figure 18.
Comparison Chart of Merged Data.
6. Conclusions and Future Work
In this research, we have used different CNN architectures developed using different datasets. When the results were compared, we concluded that all of the DenseNet models had performed better, but in comparison to both datasets, DenseNet201 has extraordinary results, followed by DenseNet169 and ResNet50. However, our own deployed model also has accuracies of over 99% on both datasets, which is a strong reason that this model can also be used for plant disease detection. In this research, we have discussed how we can detect and recognize plant disease using its leaves and treatment for these plant diseases. We have used the ResNet deep learning model and the decision tree classifier model using a Python programming language. We have achieved very high accuracy in both models. The problems we faced related to our system were data gathering and model selection. There is a lot of data available, but most of it is outdated or false data. There are also a lot of machine learning and deep learning models, and we had to build and select the best model. Models like VGG, DenseNet, and ResNet are very computationally expensive and time-consuming because we have to train on a lot of parameters. This model will be implemented on a drone device along with the object detection model, which will detect the tomato leaf, and this model will detect the disease in the tomato leaf. After the disease is detected, the system will automatically prescribe the specified spray for the detected disease.
Author Contributions
S.U.I. conceived the presented idea. S.U.I. designed and developed the model and the computational framework and analyzed the data. S.Z. and G.H. proposed training and testing the model on the merged dataset and verifying the analytical methods. V.P. encouraged the investigation of CNN architectures and supervised the findings of this work. G.F. and G.S. review this work. All authors discussed the results and contributed to the final manuscript. All authors have read and agreed to the published version of the manuscript.
Funding
This research received no external funding.
Data Availability Statement
The data underlying the results presented in the study are available within the manuscript.
Conflicts of Interest
The authors declare that they have no conflicts of interest to report regarding the present study.
References
- Punitha, K.; Shrivastava, G. Review on Emerging Trends in Detection of Plant Diseases using Image Processing with Machine Learning. Int. J. Comput. Appl. 2021, 174, 39–48. [Google Scholar]
- Andreas, K.; Prenafeta-Boldú, F.X. A review of the use of convolutional neural networks in agriculture. J. Agric. Sci. 2018, 156, 312–322. [Google Scholar]
- Sukhvir, K.; Pandey, S.; Goel, S. Plants disease identification and classification through leaf images: A survey. Arch. Comput. Methods Eng. 2019, 26, 507–530. [Google Scholar]
- Kumar, S.S.; Raghavendra, B.K. Diseases detection of various plant leaf using image processing techniques: A review. In Proceedings of the 5th International Conference on Advanced Computing & Communication Systems (ICACCS), Coimbatore, India, 15–16 March 2019; pp. 313–316. [Google Scholar]
- Arnal, B.J.G. Impact of dataset size and variety on the effectiveness of deep learning and transfer learning for plant disease classification. Comput. Electron. Agric. 2018, 153, 46–53. [Google Scholar]
- Devanur, G.; Mallikarjuna, P.B.; Manjunath, S. Segmentation and classification of tobacco seedling diseases. In Proceedings of the Fourth Annual ACM Bangalore Conference, Bangalore, India, 25–26 March 2011; pp. 1–5. [Google Scholar]
- Konstantinos, F. Deep learning models for plant disease detection and diagnosis. Comput. Electron. Agric. 2018, 145, 311–318. [Google Scholar]
- Hammad, S.M.; Potgieter, J.; Arif, K.M. Plant disease classification: A comparative evaluation of convolutional neural networks and deep learning optimizers. Plants 2020, 9, 1319. [Google Scholar]
- Punitha, K.; Shrivastava, G. Analytical study of deep learning architectures for classification of plant diseases. J. Algebr. Stat. 2022, 13, 907–914. [Google Scholar]
- Amarjeeth, S.; Jaisree, H.; Aishwarya, D.; Jayasree, J.S. Plant disease detection and diagnosis using deep learning. In Proceedings of the International Conference for Advancement in Technology (ICONAT), Goa, India, 21–22 January 2022; pp. 1–6. [Google Scholar]
- Vishakha, K.; Munot, M. Deep learning models for tomato plant disease detection. In Advanced Machine Intelligence and Signal Processing; Springer: Singapore, 2022; pp. 679–686. [Google Scholar]
- Khalil, K.; Khan, R.U.; Albattah, W.; Qamar, A.M. End-to-end semantic leaf segmentation framework for plants disease classification. Complexity 2022, 55, 1076–2787. [Google Scholar]
- Wadadare, S.S.; Fadewar, H.S. Deep learning convolution neural network for tomato leaves disease detection by inception. In Applied Computational Technologies: Proceedings of ICCET; Springer: Singapore, 2022; pp. 208–220. [Google Scholar]
- Chen, H.-C.; Widodo, A.M.; Wisnujati, A.; Rahaman, M.; Lin, J.C.-W.; Chen, L.; Weng, C.-E. AlexNet convolutional neural network for disease detection and classification of tomato leaf. Electronics 2022, 11, 951. [Google Scholar] [CrossRef] [Scilit]
- Khan, M.A.; Alqahtani, A.; Khan, A.; Alsubai, S.; Binbusayyis, A.; Ch, M.M.I.; Yong, H.-S.; Cha, J. Cucumber leaf diseases recognition using multi-level deep entropy-ELM feature selection. Appl. Sci. 2022, 12, 593. [Google Scholar] [CrossRef] [Scilit]
- Yiting, X.; Plett, D.; Liu, H. Detecting crown rot disease in wheat in controlled environment conditions using digital color imaging and machine learning. AgriEngineering 2022, 4, 141–155. [Google Scholar]
- Kaur, P.; Harnal, S.; Tiwari, R.; Upadhyay, S.; Bhatia, S.; Mashat, A.; Alabdali, A.M. Recognition of leaf disease using hybrid convolutional neural network by applying feature reduction. Sensors 2022, 22, 575. [Google Scholar] [CrossRef] [Scilit] [PubMed]
- Almadhor, A.; Rauf, H.T.; Lali MI, U.; Damaševičius, R.; Alouffi, B.; Alharbi, A. AI-driven framework for recognition of guava plant diseases through machine learning from DSLR camera sensor based high resolution imagery. Sensors 2021, 21, 3830. [Google Scholar] [CrossRef] [Scilit] [PubMed]
- Applalanaidu, M.V.; Kumaravelan, G. A review of machine learning approaches in plant leaf disease detection and classification. In Proceedings of the Third International Conference on Intelligent Communication Technologies and Virtual Mobile Networks (ICICV), Tirunelveli, India, 4–6 February 2021; pp. 716–724. [Google Scholar]
- Satheesh, S.B.P.; Naidu, P.R.S.; Neelima, U. Prediction of guava plant diseases using deep learning. In Proceedings of the 3rd International Conference on Communications and Cyber Physical Engineering (ICCCE), Hyderabad, India, 9–10 April 2021; pp. 1495–1505. [Google Scholar]
- Murat, T.; Arslan, R.S. RT-Droid: A novel approach for real-time android application analysis with transfer learning-based CNN models. J. Real-Time Image Process. 2023, 20, 55. [Google Scholar]

Disclaimer/Publisher’s Note: The statements, opinions and data contained in all publications are solely those of the individual author(s) and contributor(s) and not of MDPI and/or the editor(s). MDPI and/or the editor(s) disclaim responsibility for any injury to people or property resulting from any ideas, methods, instructions or products referred to in the content. |
© 2024 by the authors. Licensee MDPI, Basel, Switzerland. This article is an open access article distributed under the terms and conditions of the Creative Commons Attribution (CC BY) license (https://creativecommons.org/licenses/by/4.0/).