


Highlights
What are the main findings?
- From a remote sensing perspective, urban land use intensity is defined as a continuous, multidimensional and dynamic property of urban systems integrating structural, functional and socio-economic dimensions.
- A novel remote sensing- and trait-based framework operationalises urban land use intensity through six indicator families: traits, genesis, structure, taxonomy, function and socio-economic indicators.
What are the implications of the main findings?
- The proposed framework enables more consistent, scalable and internationally comparable monitoring of urban land use intensity across cities and over time.
- Integrating remote sensing, artificial intelligence and in situ data supports improved urban planning, sustainability assessment and evidence-based governance in rapidly urbanising regions.
Abstract
Urban land use intensity (U-LUI) is a widely used term for describing urban development processes, yet its conceptualisation and measurement remain inconsistent. Existing approaches focus on isolated dimensions, such as structural density, functional activity, and socio-economic indicators, resulting in limited comparability and weak integration across scales and data sources. This paper reviews and synthesises current approaches to U-LUI with a focus on remote sensing (RS), in situ data and emerging urban data sources. It analyses definitions, related concepts of urban intensity and existing monitoring frameworks at national, European and global levels, and compares methodological approaches for observing U-LUI. Based on this synthesis, U-LUI is defined as a continuous, multidimensional and spatio-temporally dynamic property of urban systems that reflects the intensity of anthropogenic use. To operationalise this concept, the paper develops an integrative, trait-based framework comprising six indicator families: traits, genesis, structure, taxonomy, function and socio-economics. The proposed framework is illustrated and supported through the synthesis of existing RS approaches, urban monitoring concepts and representative examples from the literature, demonstrating its potential for consistent and scalable U-LUI assessment. These dimensions link physically observable characteristics with functional and contextual aspects of urban systems and provide a basis for more consistent quantification and comparison. The results highlight key challenges for U-LUI monitoring, including limited conceptual harmonisation, incomplete integration of dimensions and the need for improved data integration. The proposed framework supports more coherent and scalable assessments of U-LUI in research, monitoring and planning contexts.
1. Introduction
Urbanisation is one of the key land use and transformation processes of the 21st century, profoundly impacting ecological, climatic, economic and social systems. Global analyses show that urban areas are expanding more quickly than the urban population, resulting in increased soil sealing, higher resource consumption and growing environmental pollution [1]. At the same time, cities concentrate value creation, infrastructure and innovation, but they are also hotspots for emissions, extreme weather events and social vulnerabilities [2,3]. Against this backdrop, there is a growing need for concepts that capture the spatial extent of urban areas and describe the degree of their anthropogenic use in a differentiated and comparable manner.
The urban land use intensity (U-LUI) concept addresses this challenge by viewing urban land use as a continuous, multidimensional intensity gradient rather than a discrete category [4]. U-LUI integrates the structural, functional and temporal dimensions [5] of urban land use, as well as socio-economic contexts, thus focusing on the intensity of anthropogenic use. There are different, and sometimes divergent, components of operationalisation of U-LUI. One dominant approach describes urban intensity using structural densification variables, such as the degree of sealing, building density, or floor area ratio [6]. This approach primarily focuses on physical development capacity. Remote sensing (RS) shows that the proportions of impervious surfaces can be reliably derived from multispectral and multitemporal satellite data. This can be achieved using subpixel unmixing approaches [7], or via global, long-term Landsat time-series products that consistently map impervious dynamics [8,9].
In parallel, scalable impervious estimation methods using standard sensors (e.g., Landsat) based on data-driven machine learning and deep learning have become established [10,11]. While these structural indicators are easy to observe physically and are spatially comparable [6], they mainly capture morphological capacity and remain largely blind to the functional intensity of use (e.g., activity rhythms, use mix, ad actual utilisation).
A second approach uses composite development or intensity indices that aggregate demographic, economic, and infrastructural variables, thereby operationalising U-LUI as a multidimensional measure of development. Earlier index-based studies developed comprehensive indicator systems for this purpose (e.g., land use, population, infrastructure and environmental intensity), demonstrating their compatibility with planning and climate policy target systems [12]. More recent studies have scaled such urban development intensity concepts to the global level, integrating multisource geospatial and RS data and 3D building metrics, population density, nighttime lights (NTLs), and transport and infrastructure data [13,14]. Such indices are politically compatible, but they are often sensitive to indicator selection, weighting and data availability, meaning they are only comparable between countries and their respective statistical systems to a limited extent [12].
A third strand of research focuses on functional activity and urban vitality, as measured by points of interest (POIs), mobility data, or high-resolution activity patterns over time. At the block/street block level, U-LUI is seen to be closely linked to vitality patterns, with spatially significant cluster relationships demonstrated [15,16]. Additionally, high-resolution, data-driven methods are employed to robustly model the dynamics of urban structure and use. For instance, RS data is integrated with geospatial big data sources [17], functional zoning is based on day/night data fusion [18], and 3D-based change detection workflows are used for urban objects [19].
Hybrid models that integrate the structural, functional, and socio-economic dimensions of urban use generally demonstrate greater potential for the holistic mapping of urban intensity; however, they remain methodologically heterogeneous and difficult to standardise. In particular, indicator selection, weighting and data availability vary greatly between studies and spatial contexts, which limits international comparability [14]. Overall, therefore, there is a lack of an internationally compatible, multidimensional, operationally quantifiable U-LUI concept. Alongside these conceptual developments, considerable methodological progress has been made in urban RS. Standardised satellite systems such as Landsat and Sentinel enable the comprehensive, repeatable recording of urban structures, vegetation and thermal properties over time [20,21,22,23]. Additionally, SAR- and LiDAR- and digital orthophoto-based methods provide high-resolution information on the elevation structure and three-dimensional morphology of urban areas. While SAR approaches now enable urban elevation models to be reconstructed even from individual VHR images [24], LiDAR/point cloud workflows provide detailed representations of the geometric 3D structure of urban objects and their changes [19]. Recent reviews also emphasise the potential of integrating RS data with geospatial big data sources, such as mobility flows, point-of-interest data, and social media information, to capture functional urbanity [17,25]. Since 2020, deep learning models and multimodal AI architectures have become central tools in urban RS analysis, improving the classification and semantic interpretation of urban patterns, as well as data fusion [26].
A conceptual advance in RS-based land use intensity assessment lies in the trait-based approach. Building on concepts from functional ecology, urban traits are understood as measurable biophysical, structural, and processual properties that manifest in spectral signatures, textures, thermal properties, and temporal patterns. Empirical studies demonstrate that spatio-temporal spectral traits can serve as reliable indicators of U-LUI [27,28]. Trait-based approaches are well established in the ecological [29] and agricultural context [30] and offer a sound methodological foundation for urban applications.
Despite these advances, however, there are still some key research gaps: there is no internationally compatible definition of U-LUI; the structural, functional, temporal and socio-economic dimensions are rarely integrated systematically; the methodological operationalisations are hardly comparable; the vertical dimension of urban intensity is underrepresented; robust validation frameworks between RS indicators and energy, mobility or social data are lacking; and dynamic intensity patterns have only been analysed selectively so far.
This paper therefore discusses U-LUI systematically for the first time as an RS-based, trait-founded concept. It introduces an indicator framework and an RS- and trait-based U-LUI monitoring system that distinguishes between six complementary indicator families: (1) traits, (2) genesis, (3) structure, (4) taxonomy, (5) function and (6) socio-economics. This framework combines the physical observability of urban intensity with the functional and social characteristics of urban land use, creating a consistent basis for quantification, comparison and standardisation. Against this background and in response to the conceptual and methodological gaps outlined above, this review aims to develop a more coherent and operational understanding of U-LUI from an RS perspective. Specifically, the paper (i) consolidates and differentiates existing definitions of U-LUI, (ii) compares and integrates in situ and RS–based monitoring approaches, and (iii) identifies key methodological challenges for RS-based U-LUI assessment. Building on this synthesis, we introduce an integrated indicator framework comprising six complementary indicator families (traits, genesis, structure, taxonomy, function, and socio-economics) and illustrate its application through representative examples. Finally, we discuss the relevance of the proposed framework for planning, governance, and international monitoring programmes and outline emerging opportunities for operationalising U-LUI using RS, artificial intelligence, and semantic data integration.
This paper follows a narrative review approach. Its objective is to synthesise and conceptually integrate existing knowledge on U-LUI, RS approaches and urban monitoring frameworks. In contrast to a systematic review, this study does not aim to provide an exhaustive and fully reproducible inventory of the literature but rather to identify, compare and synthesise key concepts, methodological developments and existing monitoring approaches in order to develop an RS- and trait-based U-LUI framework.
2. Definition, Standards and Programmes for Monitoring Urban-LUI
2.1. Definition of Urban-LUI
The existing literature uses the term U-LUI from different perspectives but without an internationally established, multidimensional and methodologically consistent definition. In a frequently cited definition, Xia et al. [16] describe U-LUI as the degree to which land is developed in urban areas, primarily from a structural–constructional perspective (densification/development). Wang et al. [31] use U-LUI to express the utilisation status of urban areas and as a planning-compatible control variable, but their definition is largely implicit and they do not systematically separate spatial, morphological, functional and temporal dimensions. In contrast, Yang et al. [32] focus on methodological measurement approaches (multi-objective decision logics), whereby U-LUI is primarily operationalised as an evaluation/optimisation target, rather than being treated as a generally valid definitional structure. Finally, Wellmann et al. [27] and Xie et al. [28] operationalise U-LUI on an RS basis via spatio-temporal spectral trait variations, shifting the focus to biophysically observable forms of anthropogenic use. However, here too the emphasis is on operationalisation rather than a comprehensive, multidimensional conceptual architecture. More recent work expands the spectrum of U-LUI operationalisation to include: (i) diurnal dynamics and activity rhythms (diurnal U-LUI models) [33]; (ii) digitalisation as a driver or context of urban intensification and its spatial spillover effects [34]; and (iii) socio-economic urban welfare and the distributional effects of intensity changes [35].
While these contributions broaden the thematic scope, they predominantly consist of context-specific measurement and modelling approaches and have thus far made only a limited contribution to a harmonised definition. The definitional bottleneck has both terminological and operational consequences: without conceptual consistency, indicator systems are difficult to standardise, spatial and temporal comparisons are limited, and interfaces with monitoring, policy, and planning processes remain methodologically fragile. This problem has been recognised for some time in general land use intensity research. Erb et al. [4] emphasise that intensity can only be meaningfully described as a multidimensional construct integrating input and output intensities and systemic effects/outcomes, and that there is a lack of consistent conceptual frameworks for this, or that these need further development. Additionally, framework-oriented studies (e.g., that of Diogo et al. [36] on intensity changes in Europe) demonstrate that operationalising intensity necessitates context-specific, multisectoral frameworks to achieve simultaneous comparability and sustainability references.
Against this background, and given the increasing need to link multidimensional urban intensity concepts with scalable observation systems, a consistent and operational definition of U-LUI becomes a scientific and practical prerequisite.
In this paper, U-LUI is therefore defined as a continuous, multidimensional, and spatially and temporally dynamic property of urban systems that describes the intensity of anthropogenic use, transformation and functional effectiveness of urban areas.
Importantly, U-LUI is not proposed as a replacement for established concepts such as urban density, urban morphology, urban vitality or urban metabolism. Instead, U-LUI is conceptualised as an integrative umbrella concept that combines these complementary perspectives into a unified framework for observing and quantifying the intensity of anthropogenic urban use, while related concepts predominantly focus on specific dimensions of urban systems (e.g., structural form, activity patterns or resource flows).
U-LUI is observable through the variation of urban traits in space and time and integrates biophysical, structural, functional, genetic, taxonomic and socio-economic dimensions. This definition provides the conceptual basis for a scalable and standardisable quantification of urban intensity by linking RS with complementary in situ and contextual data (see also Section 4).
The next section builds on this by providing a systematic overview of national, European and global programmes that provide relevant data for observing urban land use processes and intensities.
2.2. Existing Framework Concepts of U-LUI
Several related concepts of urban intensity are discussed. Each concept addresses specific aspects of urban use, but none provides a comprehensive, multidimensional definition of U-LUI. One frequently used approach is urban development intensity, which primarily operationalises urban intensity using spatial and structural measures of density. These include the degree of sealing and building/structure density, as well as derived density and structural measures that describe the physical capacity and structural development of urban spaces. Weng [6] systematises the requirements, methods, and trends of satellite-based detection of sealed surfaces as a core structural indicator of urban development. More recent global data from RS also provides consistent structural information at a high resolution, such as the global urban footprint, which provides a high-resolution inventory of built-up areas and is described in Esch et al. [37]. Urban development intensity primarily captures structural dimensions of urban use but only partially reflects functional and temporal aspects of U-LUI.
A second approach involves urban vitality concepts, which define urban intensity in terms of functional activity. Current research increasingly couples this perspective with RS, particularly via nighttime lights, which are used as a proxy for human activity and economic dynamics. Bennett and Smith [38] demonstrate in a fundamental review how multitemporal nighttime light time series can be employed to observe socio-economic dynamics. A combination of structure and activity proxies is often employed to link land use intensity and vitality at coarse spatial scales. Xia et al. [16] explicitly analyse the relationship between U-LUI and urban vitality at street block level, operationalising nighttime vitality using nighttime lights among other methods. More recent RS work extends vitality measurement to include temporal dynamics or pulsating activity. Tan et al. [39] integrate daily nighttime light fluctuations and demonstrate that temporal fluctuations, as well as brightness, reflect meaningful vitality patterns. Urban vitality captures functional and temporal dimensions but does not provide a comprehensive multidimensional framework for U-LUI.
A third established framework concept is urban metabolism approaches, which view cities as systems of material and energy flows, characterising intensity in terms of resource turnover, energy demand, and emissions. Kennedy et al. [40] formulate this perspective as a fundamental analytical framework for urban material and energy flows. Urban metabolism contributes resource-related perspectives but only partially represents observable urban land use intensity. However, it is only partially directly observable with RS, as many flows are not directly measurable by satellite, and they often rely on statistical input–output data or modelling.
Another relevant category is smart city key performance indicator systems, which measure urban intensity in terms of performance and governance indicators rather than physical–spatial terms. Huovila et al. [41] systematically compare standardised smart/sustainable city indicator sets (including ISO standards) and classify them according to their focus, the sectors they cover, and the types of indicators they use. Smart city indicator systems support benchmarking and governance but do not provide an RS-based measure of U-LUI. To position U-LUI conceptually, it is important to distinguish it from related concepts. Urban density and morphology primarily capture structural dimensions, urban vitality emphasises functional activity, and urban metabolism focuses on resource flows. In contrast, U-LUI integrates structural, functional, temporal and socio-economic dimensions through observable urban traits and their variation across space and time, providing a scalable RS-based observation framework. Table A1 summarises the main differences between U-LUI and related concepts frequently used to describe urban intensity and urban development.
2.3. Programmes for Monitoring U-LUI at National (Germany), European and Global Scales
Monitoring U-LUI requires multidimensional monitoring programmes that can consistently, scalably and comparably record the various dimensions of urban land use. The following sections and Table A2 and Table A3 provide an overview of the monitoring programmes at the national (Germany), European and global levels.
2.3.1. National Monitoring Programmes in Germany
Germany has a well-established infrastructure for geodata and spatial observation with high spatial precision and thematic differentiation. The Official Real Estate Cadastre Information System (ALKIS) is the central reference database for structures and enables the derivation of morphological U-LUI such as building density, degree of sealing or parcel fragmentation. Due to its accuracy, the Official Real Estate Cadastre Information System also serves as a validation basis for RS-based products. The INKAR (BBSR) indicator system provides harmonised annual time series on settlement development, infrastructure, mobility, and socio-economic structures that reflect the functional and social dimensions of U-LUI. Additionally, the Federal Environment Agency’s (UBA) land use monitoring addresses key structural intensity components from an environmental policy perspective. Furthermore, RS-based products such as the Urban Atlas (Copernicus) and the urban footprint processor (German Aerospace Center—DLR) expand this database with standardised, comprehensive structural information from multispectral and synthetic aperture radar (SAR) data. While the Urban Atlas provides differentiated land use classes, the Urban Footprint Processor extracts high-resolution building structures. Municipal monitoring platforms (e.g., open data and urban climate systems) supplement national monitoring with high-frequency, locally differentiated functional data, albeit with limited inter-municipal standardisation (see also Table A2 and Table A3).
2.3.2. European Monitoring Programmes
At the European level, monitoring of U-LUI is primarily carried out via harmonised RS programmes and standardised statistical systems. The Copernicus Land Monitoring Service (CLMS) provides high-resolution, classification-harmonised land use data for over 700 cities via its Urban Atlas, forming a central reference for structural intensity analyses in a European comparison. Furthermore, LUCAS (Land Use/Cover Area Frame Survey) serves as a Europe-wide, standardised, in situ reference dataset for validating RS-based surveys. The Joint Research Centre provides long-term consistent data sets on building density, settlement structure and urbanisation dynamics with the European settlement map and the global human settlement layer, which address genesis-related and structural U-LUI dimensions in particular. Finally, EUROSTAT’s Urban Audit complements this physical and structural information with harmonised demographic, mobility, energy, infrastructure and quality of life indicators, thereby strengthening the functional and socio-economic comparability of European cities (see also Table A2 and Table A3).
2.3.3. Global Monitoring Programmes
Global monitoring programmes are characterised by their comprehensive coverage, long-term time series and methodological standardisation. The global human settlement layer provides a central global baseline dataset of structural urban land use indicators and enables analysis of urban transformation processes over several decades. The global urban footprint [37] complements this with high-resolution, SAR-based built-up mapping (12 m), which is particularly useful for regions with limited data. Functional intensity dimensions are primarily operationalised at a global level using MODIS and VIIRS products. For example, land surface temperature (LST) and nighttime lights (NTLs) are used as proxies for energy and economic activity. The Copernicus Climate Change Service extends this data set to include a climatic impact dimension (e.g., trends in heat and cold stress), but only indirectly reflects urban intensity. The normative and governance-oriented level is addressed by UN-Habitat’s Urban Indicators Programme and SDG-11 Monitoring Framework, as well as the World Bank’s indicator systems. These programmes provide standardised indicators on land use, density, infrastructure, mobility, and economic performance, enabling the incorporation of U-LUI into international sustainability and reporting systems (see also Table A2 and Table A3).
These programmes demonstrate that U-LUI has previously been recorded in a fragmented manner along structural, functional, or socio-economic subdimensions. Therefore, an integrative, RS-based link between these levels remains a central prerequisite for consistent, internationally comparable intensity monitoring.
3. Approaches for Monitoring U-LUI
The monitoring of U-LUI combines in situ observations and RS approaches (Figure 1) to capture complementary dimensions of urban intensity. As introduced in the Introduction, in situ approaches provide information on functional, socio-economic and process-related aspects, whereas RS enables continuous and scalable observation of physically observable urban characteristics. Urban traits act as the linking concept between both approaches and provide the observational basis for the integrated U-LUI framework. The following sections summarise the methodological contribution of each approach.
Figure 1.
Monitoring urban land use intensity (U-LUI) with remote sensing (RS) and in situ approaches. (a,b) Land surface temperature, 2001 and 2014, Jakarta. (From Ramdhoni et al. [42]).
3.1. In Situ Approaches
Recording U-LUI based on in situ data sources is an essential methodological pillar of urban land use monitoring. This method enables detailed mapping of processes that are partially beyond the scope of direct observation by RS, particularly the functional, socio-economic and energy dimensions of urban activity. In situ data allows the direct quantification of resource use and frequency of use, as well as urban patterns that characterise the functional complexity of urban systems. The following section lists the relevant types and sources of in situ data:
3.1.1. Statistical and Administrative Data Sources
The most widely used in situ sources are official and statistical datasets that are collected and regularly updated by municipal, regional or national institutions. These include building, land and land use registers (e.g., the Official Real Estate Cadastre Information System, urban development plans and land use databases), which provide information on building type, land use, ownership and density. Energy and water consumption statistics serve as functional indicators of urban resource use. Their spatial aggregation allows conclusions to be drawn about neighbourhood intensity of use, density and activity profiles. Traffic and mobility data, collected via counting stations, smart traffic systems or public transport recording, provide valuable information on traffic volume, modal split and temporal usage patterns. Furthermore, population and employment statistics reflect the socio-economic dimension and enable the derivation of density and activity indicators (e.g., population per area or jobs per km2). In situ datasets are generally highly accurate but are aggregated administratively (e.g., at municipal, district or block levels). Integrating them into U-LUI analyses often requires their transformation into geostatistical raster formats (e.g., 100 m or 1 km raster sizes) to ensure compatibility with RS and modelling data.
3.1.2. Sensor and Internet of Things (IoT)-Based Systems
As urban infrastructures become increasingly digitised, continuous measurement systems that record dynamic processes in real time are being developed. These systems are summarised under the terms IoT and smart city sensor networks. Relevant categories include, among others, energy and resource monitoring: Smart meter systems in buildings provide high-frequency measurements of energy and water consumption which can be used to calculate U-LUI patterns over time (e.g., day/night or weekly schedule). Traffic and mobility sensors, such as induction loops and traffic and CO2 sensors, and GPS-based vehicle data and mobile phone data enable the analysis of urban movement flows and traffic intensity. Environmental and climate sensors, which measure air temperature, particulate matter, noise and humidity, provide indicators of functional and ecological stress in urban areas. Lighting and activity measurements, such as photometers, motion detectors and Wi-Fi signal densities, can serve as indicators of human activity in public spaces. These sensor networks are increasingly being integrated into municipal data platforms, such as urban data platforms and smart city cockpits, and enable the fine-grained analysis of urban processes over time scales ranging from minutes to days. One advantage of these systems is their high temporal resolution which allows urban dynamics to be mapped in near real time. However, spatial coverage remains limited and is heavily dependent on infrastructure and financing conditions.
3.1.3. Citizen Science and Crowd-Based Data
An innovative branch of U-LUI data collection involves crowdsourcing and citizen science. These complement traditional measurement networks by involving the population or using digital communication platforms. Relevant data sources include OpenStreetMap (OSM), which provides global coverage of vector-based information on buildings, road networks, land use areas and infrastructure. Furthermore, social media and mobile phone data can indicate temporary activity patterns, visit frequencies and socio-economic intensity. Citizens also prefer to measure environmental data using mobile sensors or apps to collect information on noise, air quality and light pollution. This allows conclusions to be drawn about functional stress [43]. This type of data is particularly relevant for functional and temporal U-LUI indicators (e.g., activity density, social interaction and the frequency with which public spaces are used). However, they are subject to methodological uncertainties regarding accuracy, representativeness, comparability and data protection, and are characterised by high dynamics and spatial resolution.
3.2. RS Approach
3.2.1. Principles of Monitoring U-LUI Using RS
All RS technologies are based on non-invasive, contactless measurement. They capture urban traits and their variations on spatial scales ranging from a few millimetres (close-range) to several thousand kilometres (airborne and spaceborne) (see Figure 2). RS sensors can be found in a variety of platforms, including wireless sensor networks (WSNs), laboratory and field platforms, stationary measuring masts, drone systems, balloon platforms (Unmanned Aerial Vehicles—UAVs), and airborne and spaceborne systems. Different RS technologies, such as RGB/photographic systems, multispectral and hyperspectral sensors, thermal infrared (TIR) sensors, lasers, radio/radar, and LiDAR, are installed individually or in combination to maximise the detection of urban traits. Since urban traits and their variations occur from the local to the global level, RS enables the objective, standardised and continuous observation of U-LUI, as well as the derivation of corresponding indicators.
Figure 2.
Different RS platforms; wireless sensor networks (WSNs); camera, video, drones, towers, balloons, and airborne and spaceborne RS platforms with different RS technologies (RGB/photography, multispectral, hyperspectral, thermal, laser, RADAR, acoustic and LiDAR) to monitor indicators of U-LUI on different spatial and temporal scales. ((a,b) From Ramdhoni et al. [42], modified after Lausch et al. [30]; graphical editing performed using OpenAI ChatGPT-5.5 (image generation). Scientific validation and final revision by Angela Lausch).
RS derives U-LUI indicators by capturing observable urban traits and their spatial and temporal variation across scales. The spectral reflection and absorption by a pixel result from the interaction between electromagnetic radiation (light and the atmosphere) and the physical, geometric, chemical and energetic properties of urban surfaces. These properties reflect the diversity of urban materials and surfaces, the morphological and functional structure of buildings, the thermal properties of sealed surfaces, and anthropogenic influences, such as energy consumption, waste heat, traffic volume and usage patterns. Similarly, RS enables the systematic monitoring of traits and trait variations in urban vegetation. Based on this, the condition, vitality and stress of urban vegetation, as well as urban use, structures, and their response to anthropogenic interventions and environmental conditions, can be quantitatively assessed.
3.2.2. Challenges of Monitoring U-LUI Using RS
Although the use of RS to capture U-LUI offers numerous advantages, it also presents specific challenges. These challenges stem from the complexity of urban structures and sensor-related limitations (e.g., spectral, spatial, and temporal resolution). As Maudet et al. [44] emphasise in a comparative study, significant differences exist between in situ indicators and usage data derived from RS. Classifications of urban land use, as shown in land cover maps, often do not provide sufficient detail to accurately reflect the actual intensity of use within urban structures. The diversity and density of urban uses require a finer distinction than many common classification systems offer. This gives rise to the following key challenges when deriving U-LUI from RS data:
- (1)
- The complexity of urban land use types: In urban areas, numerous different types of land use are found in close proximity to one another, ranging from residential, commercial and industrial areas to transport infrastructure and urban green spaces (high heterogeneity). It is only possible to a limited extent to differentiate these uses according to their intensity (e.g., dense, multi-storey residential buildings vs. single-family homes; intensive vs. extensive green space use) with RS data. It is particularly difficult to distinguish between functionally similar areas that differ in terms of the intensity of their use.
- (2)
- Vertical use and overlaps: In urban areas, land use often takes place on several levels (e.g., underground car parks, multi-storey buildings and roof gardens). This vertical use can only be captured with RS data to a limited extent. Conventional 2D classifications underestimate the actual intensity of use as they do not sufficiently take building density or floor area ratio into account. Lengths of shading, high-resolution LiDAR data or 3D city models are required to record this dimension.
- (3)
- Dynamics of urban processes: Urban land use is subject to rapid change due to factors such as new construction, renovation or conversion. RS data with insufficient temporal resolution cannot adequately record these dynamics. It is also difficult to distinguish between temporary uses (e.g., interim uses and construction sites) and long-term changes in use.
- (4)
- Limited detectability of functional intensity: Functional use (e.g., the frequency with which public spaces are used, traffic volume or energy consumption) can usually only be derived indirectly from optical RS data. Although indicators such as the degree of sealing or building density can provide some insight, the actual intensity of use (e.g., social or economic activity) remains challenging to determine. It is therefore necessary to combine this with supplementary data (e.g., mobile phone data, census data, and traffic flows).
- (5)
- Heterogeneous land use structures and patterns: Cities exhibit heterogeneous land use patterns at refined scales. Precise delineation of land uses is often problematic due to overlaps and transition zones (e.g., mixed-use areas, inner courtyards and hinterland development, and areas covered by shading). Furthermore, the spatial resolution of much RS data is insufficient (>1 m) to recognise refined urban units such as individual buildings, paths or plots. Table A4 provides an overview of RS data particularly suitable for urban issues.
- (6)
- Limited spectral significance in urban areas: In urban areas, many materials have similar spectral properties (e.g., roof surfaces, sealed paths and car parks), making differentiated analysis difficult. Hyperspectral sensors (e.g., EnMAP and DESIS) can provide more accurate information in this respect, but currently only at a spatial resolution of 30 × 30 m.
Although hyperspectral sensors such as EnMAP and DESIS provide superior spectral discrimination and enable material-specific analyses, their moderate spatial resolution remains a limiting factor in heterogeneous urban environments. Approaches such as subpixel unmixing and fusion with very high-resolution imagery may improve the interpretation of mixed urban surfaces and refine spatial representation; however, they do not fully recover fine-scale urban structures. The degree of improvement depends on sensor characteristics, urban heterogeneity and the applied processing workflow.
- (7)
- Influence of shadows, topography and building geometry: In dense urban areas, tall buildings cast shadows that can greatly affect spectral interpretation. Combined with varying topography (e.g., on slopes) or complex building shapes, this can significantly reduce the quality of RS data. This can lead to misclassifications or data gaps, especially in optical systems.
- (8)
- Scale mismatch between urban structures and sensor footprint: An additional limitation relates to scaling effects between urban object size and sensor footprint. Microscale urban structures such as courtyards, narrow street canyons, small urban green spaces or mixed-use building complexes may not be fully resolved by coarser radiometric observations. Instead, multiple urban elements are aggregated within a single pixel, potentially smoothing local intensity contrasts and reducing the detectability of fine-scale urban heterogeneity. Such scale mismatches should therefore be considered when interpreting continuous U-LUI gradients across sensors and observation scales.
4. Conceptual Definition and Operational Framework of U-LUI Using RS
4.1. Conceptual Definition of U-LUI
Following the definition introduced in Section 2.1, this section translates U-LUI into an operational RS-based framework and specifies how its dimensions can be observed and quantified using RS.
U-LUI is understood as a continuous, multidimensional and spatio-temporally dynamic property of urban systems that reflects the intensity of anthropogenic use and its functional expression in urban areas. It emerges from the interaction of biophysical, structural, functional, genetic, taxonomic and socio-economic characteristics and is observable through variations in urban traits across space and time. Rather than representing a single indicator, U-LUI constitutes an integrated system property reflecting how urban areas are organised, utilised and transformed. Urban traits form the observational units of U-LUI and are operationalised through measurable RS-based and in situ-derived indicators. Urban traits are defined here as observable and measurable characteristics of urban systems that vary across space and time and provide the observational basis for deriving U-LUI indicators. Accordingly, U-LUI is represented as a continuous intensity gradient rather than a categorical classification. This enables a consistent representation of heterogeneous and overlapping urban land use patterns and allows intensity to be analysed across spatial scales and contexts. Since not all dimensions of urban intensity are directly observable using RS—particularly functional and socio-economic aspects—RS-based information must be complemented by in situ and contextual data to achieve a comprehensive representation of U-LUI.
Importantly, RS can support the analysis of spatial proxies related to socio-economic conditions; however, RS does not directly measure income, deprivation, social inequality or individual behaviour. Interpretations of socio-economic dimensions therefore require complementary statistical, administrative and contextual information and should be treated with appropriate caution. Such interpretations may additionally be influenced by spatial bias, representativeness limitations, privacy considerations and ethical aspects of data integration.
4.2. Operational Indicator Framework
To translate the conceptual definition of U-LUI into an operational and comparable framework, this paper introduces an integrated indicator system comprising six complementary groups: traits, genesis, structure, taxonomy, function and socio-economics. These indicator families organise urban traits into semantically distinct but interrelated dimensions and provide the basis for the systematic quantification, comparison and standardisation of U-LUI. Together, they capture both the observable physical manifestation of urban use and its functional, temporal and socio-economic context.
To enhance the practical applicability of the proposed framework, each indicator family is linked to measurable variables, representative data sources and example application contexts. This operational perspective supports the translation of the conceptual U-LUI framework into reproducible monitoring workflows and demonstrates how remotely sensed and complementary in situ data can be combined across spatial and temporal scales. Table 1 summarises the measurement logic, suitable data sources and exemplary applications for each indicator family (see also Table A5).
Table 1.
Operationalisation of the six U-LUI indicator families: measurable variables, representative data sources and example application contexts.
Table 1 summarises the conceptual logic, measurable variables and representative application contexts of the six indicator families. The following sections therefore focus only on their specific contributions to operationalising U-LUI.
- Trait indicators of U-LUI: They form the elementary observation level for U-LUI. They capture the biophysical and material properties of urban surfaces derived directly from RS data, such as spectral reflection, texture, thermal emission, sealing, material composition, and vegetation status. These traits represent the direct physical expression of urban use. Their spatial heterogeneity, fragmentation, and temporal stability or dynamics reflect differences in intensity between urban spaces. At this level, U-LUI does not manifest as a single value, but rather as a gradient of spectral, thermal and structural trait variations reflecting the state of urban use.
- Genesis indicators of U-LUI: They describe the temporal emergence and development of urban traits, and thus the dynamic dimension of U-LUI. While trait indicators capture the current state, genesis indicators reconstruct how and at what speed urban intensity has developed. RS time series enable trait variations to be analysed over the course of years and decades, and processes such as urbanisation, densification, functional change and re-intensification can be visualised. Genesis indicators capture the temporal trajectory of urban intensity and reveal how urban traits evolve over time.
- Structural indicators of U-LUI: They capture the spatial–morphological organisation of urban traits and describe how urban use is physically organised in space and what form the intensity takes. These include two- and three-dimensional characteristics, such as building density, height and volume, sealing structure, block morphology, and surface roughness. Structural indicators capture the spatial organisation and physical manifestation of urban intensity across urban forms.
- Taxonomic indicators of U-LUI: Taxonomic indicators derive typologies and classes of urban intensity from urban traits. Unlike classic land use classes, these taxonomies are based on trait combinations and organisational patterns rather than administrative categories. RS-based taxonomic indicators can identify land use types such as highly dense mixed-use neighbourhoods, extensively used residential areas, and infrastructure-dominated zones. Taxonomic indicators support the systematic comparison of urban intensity patterns across cities, regions and urban typologies.
- Functional indicators of U-LUI: They describe the processes and services resulting from urban use. They record the functions that urban areas fulfil and the intensity with which these functions are performed. RS-based functional traits include energy and heat flows, emissions, mobility intensity, and the ecological functions of urban vegetation. Functional indicators reflect the processes and services associated with urban intensity beyond observable physical structures.
- Socio-economic indicators of U-LUI: They capture selected human and economic dimensions of urban intensity and reflect how urban use is distributed across space. Since socio-economic conditions are not directly observable by RS, these indicators are derived by integrating RS-derived traits with statistical, administrative and crowd-based data. This enables the approximation of population density, economic activity, infrastructure intensity and social use at aggregated spatial scales. Socio-economic indicators should be interpreted as spatial proxies rather than direct measurements of income, deprivation, social inequality or individual behaviour. Their interpretation depends on complementary contextual information and may be influenced by representativeness limitations, spatial bias, privacy considerations and ethical aspects of data integration.
This framework provides a scalable, internationally compatible RS-based definition of U-LUI, enabling standardised observation of urban intensity across cities, time periods and spatial scales.
Beyond scientific monitoring, the proposed framework supports urban planning and decision-making by integrating remotely sensed, in situ and socio-economic information into scalable and interoperable monitoring workflows. This enables a more consistent assessment of urban transformation processes across spatial and temporal scales. Operationally, the six indicator families are not intended to be applied independently but as complementary components of a modular monitoring workflow. Depending on data availability and application context, individual families may be prioritised while maintaining conceptual consistency through the common trait-based U-LUI framework.
4.2.1. Trait-Based Monitoring Approach
Building on the indicator framework introduced above, trait indicators provide the operational interface between observable surface properties and the quantification of U-LUI. In this context, RS enables a standardised and repeatable observation of spectral, thermal, structural and spatio-temporal trait variation across urban systems. Urban RS traits comprise a highly heterogeneous spectrum of material, surface, vegetation and mixed signatures, such as asphalt, concrete, brick, bitumen sheets, glass/metal, roof substrates, sealed courtyards, urban vegetation islands and transient surface states (e.g., dust films, moisture, ageing, and construction sites). RS generates spectral–radiometric patterns which, in combination with fragmentation and geometric effects (shadows and urban canyons), renders intensity visible as a spatial signal. Trait indicators therefore represent urban state traits and variation traits that capture: the technical dominance of surfaces, spectral/structural heterogeneity within blocks and neighbourhoods, vegetation stress responses, and material mixtures/surface properties acting as proxies for densification, sealing and usage pressure.
Trait indicators form the most operationalisable level of U-LUI quantification because they are: (i) globally available, (ii) temporally consistent, and (iii) methodologically standardisable. At the same time, trait indicators provide the biophysical basis for monitoring all other indicator groups (genesis, structural, taxonomic, functional and socio-economic) because they supply the measurable state and change layer on which higher-level interpretations are built.
Trait Indicators of U-LUI—Spectranometric Approach
The spectranometric approach operationalises U-LUI through spectral traits of urban surfaces and—crucially—their spatio-temporal trait organisation (trait variation in space and time). Conceptually, it draws on the spectranomics perspective from functional ecology, where functional plant traits and phylogenetic relationships are derived from spectral signatures across the visible and short-wave infrared (VIS–SWIR; 350–2500 nm) [45,46]. Imaging spectroscopy provides the physical link between chemical/structural properties of leaves/canopies and spectral reflectance, enabling the monitoring of functional patterns and processes as trait expressions.
This concept has been transferred to urban systems to map material-specific, vegetation-related and process-related urban traits [27,28]. Multispectral and hyperspectral sensors record distinct absorption and scattering features of vegetation, soils and construction materials, enabling a comprehensive and comparable characterisation of urban surface conditions as spectral trait fields. Hyperspectral missions such as DESIS [47], EnMAP [48,49] and, prospectively, CHIME [50] increase trait separability through material-specific absorption analysis, detection of ageing and moisture films, and quantification of mixed pixel fractions—supporting standardised and transferable material and vegetation typologies.
Wellmann et al. [27] introduce spatio-temporal spectral trait variations as U-LUI indicators. Within a trait framework, spectral trait variations explicitly shift the focus from discrete built-up classes to continuous intensity gradients derived from: (i) spectral surface states (trait expression) and (ii) the spatial organisation of those trait expressions. Thus, U-LUI is treated as a biophysical gradient emerging from the mosaic interplay of vegetation, technical materials and functional land use units—only partially captured by classification-based LULC.
At the spectral level, increasing U-LUI is typically associated with dominance of technical materials, dampening pigment- and water-driven absorption features in VIS/NIR while showing material-specific signatures in SWIR. Multispectral systems such as Sentinel-2 capture these contrasts via albedo differences, vegetation/soil indices and mixing ratios; hyperspectral systems enable substantially finer trait discrimination. However, for U-LUI the decisive information often lies less in absolute pixel values rather than in spatio-temporal trait organisation: urban environments are shaped by fragmentation, sharp edges, contrast zones and shadow geometry. Accordingly, texture traits (e.g., GLCM metrics), spatial autocorrelation and descriptive statistics are highly sensitive to intensity differences. Xie et al. [28] demonstrate that urban green space types (urban forests, parks, courtyard greenery, and allotments) exhibit characteristic texture signatures (variance, contrast, and entropy) reflecting internal heterogeneity, growth dynamics and management intensity—allowing differentiation of intensity regimes even within the same land use category.
A key advantage of the spectranometric approach is that it captures process-related traits in addition to structural states. In vegetation, spectranometric traits reflect pigment dynamics, water status, metabolic activity and phenology; in technical materials, spectral trait shifts can indicate ageing, contamination, surface moisture and degree of utilisation. They also exhibit seasonal and interannual variability, thereby representing temporal–processual dimensions of U-LUI [28]. Xia et al. [16] further show that combining intensity measures with spatial–statistical indicators reveals consistent patterns of urban vitality that remain concealed by purely spectral class-based approaches.
Trait Indicators of U-LUI—Urban Chlorophyll Content
Urban vegetation is a central biophysical and functional component of urban systems and closely linked to management, resource inputs and usage pressure. In a trait framework, chlorophyll-related measures represent vegetation state traits and, when analysed dynamically, stress and response traits. They are robust proxies for U-LUI because vegetation sensitively responds to irrigation, fertilisation, maintenance frequency, land use pressure and microclimatic conditions, which are reflected in spectral trait expression [51,52,53].
Chlorophyll-related vegetation indices such as NDVI, EVI, Red-Edge NDVI or Chlorophyll Index Red Edge (derived from Landsat, Sentinel-2 and EnMAP) are established indicators of plant health, biomass and physiological status. In cities, high chlorophyll trait expression typically indicates intensively maintained, regularly irrigated and nutrient-rich vegetation (e.g., high-use parks, representative green spaces, and roadside greenery). González-Marín et al. [54] emphasise that NDVI is the most commonly used index for capturing urban vegetation characteristics and that higher NDVI values correspond to denser, healthier vegetation typical of intensively maintained areas compared to extensive/neglected ones. NDVI/EVI have been used to characterise functional properties such as photosynthesis rate, leaf chlorophyll and biomass and vary significantly across green spaces with different management regimes [55]. Conversely, low values or pronounced seasonal/interannual fluctuations indicate more extensive management or neglect and are often associated with lower U-LUI.
Hyperspectral RS expands this trait approach substantially because the red-edge region is highly sensitive to chlorophyll concentration, nitrogen status, photosynthetic performance and water stress—i.e., to physiological trait gradients. EnMAP [49] allows detailed measurement of these characteristics; CHIME [50] will provide a basis for standardised repeated analyses and improved comparability across cities and regions through systematic VIS–SWIR observation.
Operationally, dense Sentinel-2 time series combined with high-resolution UAV data enable scalable quantification of vegetation traits from parcels/blocks to city scales. Time series support not only state estimation but also dynamic trait descriptors such as regenerative capacity, stress resilience and response speed to irrigation/maintenance. Such temporally resolved traits are closely linked to differences in usage intensity and maintenance practice [16]. Recent work emphasises that mapping management intensity within the same green space type requires capturing spatial heterogeneity and temporal dynamics, not only absolute chlorophyll levels; texture- and time-series-based approaches provide robust derivations [28]. The full interpretative power of chlorophyll traits typically emerges when they are integrated with spectranometric, thermal and structure-related indicators [56].
Trait Indicators of U-LUI—Thermal Emission and Land Surface Temperature
The thermal signature of urban surfaces is a highly sensitive U-LUI indicator because it directly reflects energy balance, material properties and intensity of use. In a trait framework, LST represents a thermal trait integrating surface state, energy partitioning and anthropogenic influence. It responds to sealing degree, building density, material composition and anthropogenic energy flows as an integrated variable, enabling a process-oriented representation of urban intensity [57,58].
Thermal RS systems such as Landsat-8/9 TIRS, ECOSTRESS [59], MODIS, HiVE Satellite 1 and 2 [60], and UAV-based TIR sensors provide LST fields with high spatial and temporal resolution capturing synoptic and intra-urban intensity patterns [61,62,63]. Intensively used areas with high shares of sealed dark materials (asphalt, concrete, and roof tiles) typically show elevated LST and pronounced nocturnal heat islands. Even though the emissivity of materials may sometimes yield inaccurate values—and corrugated metal roofs, in particular, tend to produce lower LST values than actual measurements show—most surface materials provide insight into temperature distribution in urban areas. Temperature differences correlate with building density, material properties, energy infrastructure and anthropogenic activity and are robust indicators of land use intensity [64]. Material-specific emissivity effects may additionally influence thermal indicator interpretation in urban environments. Highly reflective roof materials can lead to deviations between retrieved and actual land surface temperature patterns. Thermal calibration and emissivity correction approaches may improve the representation of local microclimatic gradients and urban heat hotspots; however, the magnitude of these effects depends on sensor characteristics, environmental conditions and processing workflows. Beyond absolute LST, diurnal amplitudes and measures of thermal heterogeneity serve as thermal variation traits to differentiate intensity levels, especially at block/neighbourhood scales [65].
Integrating LST time series with vegetation indices (NDVI/EVI) and coupling thermal traits with vegetation state/stress traits enables joint evaluation of biophysical activity and thermal stress. Vegetation-dominated areas with high transpiration and adequate water supply typically yield cooling effects, whereas persistent thermal hotspots reflect high sealing, low evaporation and intensive energy use [66]. This supports the identification of U-LUI hotspots and diagnosis of deficits in green/grey infrastructure, particularly for heat and climate adaptation [67].
Coupling thermal traits with emissions and energy proxies enables operationalising U-LUI as an energy–ecological parameter. Integrating LST patterns with CO2 inventories or nighttime lights (VIIRS/NPP) links structural intensity traits (sealing/development) with functional intensity proxies (activity/energy consumption), enabling multidimensional mapping [68].
Trait Indicators of U-LUI—Surface Sealing and Material Composition
Surface sealing is a key RS-based trait indicator of U-LUI because it is directly tied to development and land use density and controls hydrological, microclimatic and biogeochemical processes. In a trait framework, imaging spectral analysis represents an imperviousness trait; material differentiation adds material composition traits. Studies on impervious surface area demonstrate that sealing dynamics can be reliably derived over long periods, providing robust intensity gradients of urban development [69].
Multispectral sealing/built-up estimation is often operationalised via index-based approaches (e.g., NDBI, Urban Index, and impervious-specific index families). While scalable, their performance depends on climate, material mix and background conditions; thus index selection/combination and thresholds require context-specific calibration [70]. Consequently, recent work increasingly applies hybrid approaches (index + machine learning + subpixel/unmixing) to estimate ISA robustly in heterogeneous landscapes, including subpixel methods for mixed pixels [71]. Operationally, Sentinel-2/Landsat time series are commonly used, with PlanetScope or UAV data supplementing very fine-scale structures (courtyards, pavements, and small roofs) [71].
Material-related differentiation of sealed surfaces extends ISA from a binary trait to a continuous material trait spectrum. Hyperspectral RS captures material-specific absorption features and mixing ratios that are often ambiguous in multispectral data. PRISMA, MESMA and related unmixing approaches differentiate asphalt/bitumen, concrete, brick/terracotta, metals and glass/solar surfaces, allowing estimation not only of sealing but also of material- and energy-relevant intensity aspects [72]. Reviews confirm impervious detection and urban material mapping as key hyperspectral application fields and highlight the growing role of data fusion and spectral libraries for transferable material gradients [73,74].
Active sensing adds structural/roughness and verticality traits. SAR/InSAR products (Sentinel-1 and TanDEM-X) provide information on roughness and scattering and—combined with optical data—support building height and density estimation. This is U-LUI-relevant because intensity operates both areally (sealing) and volumetrically (building volume/verticality). Sentinel-1 derivatives support large-scale 3D building metrics and footprints [75]; products such as GLAMOUR demonstrate systematic derivation of building morphology from Sentinel data, enabling coupling of morphology traits with ISA/material traits for a form–function intensity perspective [76].
For U-LUI interpretation, integrating imperviousness traits, material traits and thermal traits is particularly powerful because sealing and material composition directly modulate thermal load and energy balance. Studies combining ISA/sealing density with LST and vegetation indicators consistently show higher temperatures and stronger urban heat island effects with increasing sealing, while vegetation mitigates thermal stress [77]. At very high spatial resolutions (<0.5 m), UAV multispectral/hyperspectral/LiDAR data support parcel-level mapping of ISA, material composition and microstructure and facilitate linkage to socio-economic variables [78]. Overall, integrating sealing and material-specific spectral traits with 3D morphology traits is regarded as one of the most accurate RS-based proxies for U-LUI, capturing structural and functional process dimensions simultaneously [73]. Table A5 presents a structured overview of U-LUI indicators, including concrete examples, the corresponding RS sensors, and the representative literature references.
4.2.2. Monitoring the Genesis Indicators of U-LUI with RS
The genesis indicators of U-LUI describe the temporal emergence, development and transformation of urban land use patterns. From a trait-based perspective, these indicators can be understood as genesis traits (also known as trajectory or memory traits). These are characteristics that can be derived from RS and that do not primarily describe the current state of a surface. Rather, they characterise the historically grown development trajectories, path dependencies and reorganisation patterns of U-LUI. Unlike state-oriented indicators (e.g., spectral/thermal traits, structural characteristics, or functional process proxies), genesis traits explicitly address why intensity patterns persist or change spatially. They provide U-LUI with an additional dimension of explanatory depth.
In the context of U-LUI, genesis traits refer to the traces of urban development shaped over time that manifest in urban morphologies, functional organisational forms, and infrastructure networks, including vertical and underground levels of use. These traces arise from the interplay of long-term urbanisation dynamics, morphological persistence, and political and institutional systems, as well as environmental and risk-related upheavals. Therefore, cities cannot be understood as static land uses, but as historically evolved and intertwined habitats, the current intensity of which is the result of cumulative development processes [79].
RS is a key method for analysing such genesis traits as it provides long-term, consistent, spatially explicit time series of urban development. The continuous archives of the Landsat mission (since 1972); the Sentinel missions of the Copernicus programme; and global urbanisation datasets, such as the global human settlement layer [80,81] and the global urban footprint [37], enable the quantitative reconstruction of urban development processes over several decades. This makes it possible to derive comparable genesis trait profiles between cities and regions [13].
Genesis Indicator—Temporal Dynamics of Urban Development
One of the key aspects of genesis indicators is the temporal dynamics of urban development. In terms of traits, these are temporal trajectory traits, describing at what velocity and in what sequence U-LUI arises, increases or is restructured, and with what disruptions. Unlike static state indicators, these trajectory traits enable current intensity patterns to be interpreted as the result of historical development processes.
Multi-decadal RS time series, especially those from the Landsat mission, form a central basis for this investigation. Using these data, urbanisation rates, phases of accelerated growth, stagnation, decline or reurbanisation, and sudden ruptures (e.g., political upheavals, economic crises, natural hazards, and disasters) can be identified. Empirical studies demonstrate that the speed and sequence of urban expansion significantly influence current U-LUI. Rapid urbanisation is often accompanied by high structural density, monofunctional use and intensive resource use, whereas slower development processes tend to produce more heterogeneous, functionally mixed structures [82]. Global analyses by Seto et al. [3] also demonstrate that rapid urbanisation establishes long-term intensity patterns that are difficult to alter later on.
Time-series-based change detection methods allow these trajectory traits to be derived quantitatively. Methods such as continuous change detection and classification [83] and LandTrendr [84] identify the timing, duration and intensity of land use changes, making transitions between development phases visible. Consequently, increases in urban intensity can be analysed as both linear trends and discontinuous, phased processes. These temporal trajectory traits are central to the genesis of U-LUI, as they explain why certain urban areas have a high or low intensity of use today. Early or particularly intense phases of urbanisation often result in persistent patterns of high structural and functional intensity, whereas urban areas that develop more gradually allow for greater functional diversity [3,22].
Genesis Indicators—Morphological Persistence and Hidden Urban Structures
Another key indicator of genesis is the persistence of historical urban morphologies. In trait-based terms, these can be understood as legacy traits—long-lasting characteristics shaped by historical development (e.g., urban layouts, street axes, block structures, and parcel patterns) that continue to structure subsequent processes of intensification and transformation as enduring framework conditions. Such elements typically emerge in early phases of urban development and tend to exhibit a high degree of morphological stability over time. They thus form a long-term spatial framework within which functional changes and intensification processes occur.
Theories of urban morphology describe cities as historically layered systems in which early morphological decisions shape subsequent development trajectories. Oliveira and Porta [85], for example, highlight the persistence of street networks and parcel structures as key elements influencing long-term patterns of density and land use. However, this persistence should not be understood as absolute. Urban neighbourhoods can undergo profound transformation—through large-scale redevelopment, demolition, or forced resettlement, as observed in parts of China or Latin America. In such cases, local morphological configurations may be substantially reconfigured or replaced. What tends to remain more stable, however, are underlying infrastructures, such as major transport corridors and technical networks, which often continue to structure urban development over longer time horizons.
As RS technologies advance, it is becoming increasingly possible to quantify such persistence traits. High-resolution satellite data, (historical) aerial photographs, and LiDAR-based city models can be used to derive morphometric indicators such as block size, street orientation, degree of fragmentation, and building density. Studies demonstrate that urban structure types are closely associated with the intensity and organisation of urban use [86,87]. Tümtürk [88] also demonstrates that historical urban morphologies have a greater impact on long-term urban density development than short-term planning interventions. Yu [25] emphasises the importance of RS data for analysing the long-term development of urban form and its link to socio-economic processes. Despite different temporal development trajectories, Yang et al. [89] demonstrate that urban forms exhibit structural convergences shaped by physical–spatial conditions such as relief or landforms.
An expanded genesis perspective also considers underground and hidden urban structures. These can be summarised as subsurface legacy traits: persistent, often invisible material layers (e.g., archaeological relics, foundation structures and technical infrastructures) that influence current densification and transformation processes, thus helping to shape the scope for action of U-LUI [90]. Geophysical RS methods are increasingly enabling the detection of such structures. Ground-penetrating radar has become a well-established, high-resolution, non-invasive method for identifying archaeological structures and technical infrastructures [91]. Combined with satellite-based RS, light detection and ranging (LiDAR), and geophysical prospecting, historical urban structures and their long-term morphological persistence can be reconstructed [92,93]. Other methods, such as airborne LiDAR, InSAR and hyperspectral analyses, enable concealed structures to be detected via micro-relief, vegetation or soil moisture signatures [94,95,96].
An additional challenge for future U-LUI assessment concerns subsurface urban structures and legacy conditions that are not directly observable via conventional surface-based monitoring approaches. Underground infrastructures, contaminated sites and buried historical structures may constrain or redirect urban densification processes and influence long-term land use trajectories. Integrating such subsurface information into urban planning and environmental assessment frameworks may support more conflict-sensitive spatial development and improve the consideration of hidden constraints in redevelopment and intensification strategies.
Genesis Indicators—Transformation and Re-Intensification Processes in Recent Urban Development
In addition to long-term persistence, genesis indicators capture the processes of transformation and re-intensification in recent urban development. In a trait-based interpretation, they correspond to transition or reconfiguration traits, which characterise typical sequences of conversion, redensification, and functional reorganisation. This reveals qualitative increases in intensity within existing areas [97].
Examples include redensification, reurbanisation, brownfield site revitalisation, the conversion of former industrial or infrastructure sites for new uses, and regreening of cities. Such developments are frequently linked to economic structural change, the shift towards knowledge- and service-based economies, and changes in planning principles through climate change. Studies show that such processes often lead to an increase in functional intensity without a significant increase in the area covered by buildings [97].
RS time series can identify such re-intensification traits through changes in building density, degree of sealing, vegetation cover, or thermal properties, for example. Combining optical, thermal and structural RS indicators makes it possible to distinguish qualitative increases in intensity from purely area-related growth [98]. Analyses of land use policy also show that functional re-intensification is a key driver of U-LUI, which traditional land area indicators does not capture sufficiently [31,99].
A prominent example is brownfield revitalisation. RS time series often exhibit characteristic sequences involving abandonment, temporary derelict land, and subsequent intensive structural and functional transformation [31,100]. Reurbanisation and inner-city development also contribute significantly to the intensification of urban use. Since the 2000s, many European and North American cities have experienced a resurgence of residential and work functions in their city centres. RS analyses demonstrate that these processes frequently coincide with an increase in functional diversity, extended activity periods and elevated energy consumption [101,102]. These transformation processes are often discontinuous and can be triggered by large-scale projects or infrastructural investments. The effects of these investments become entrenched in the urban intensity pattern in the long term [102].
Genesis Indicators—Governance and Regime-Related Influences on U-LUI
Urban genesis processes are closely linked to governance structures, political systems, and planning regimes. From the trait perspective, the resulting spatial signatures can be summarised as institutional or regime-related traits, defined as recurring, comparable patterns of density, fragmentation and organisational logic in urban spaces that can be traced back to long-term institutional frameworks.
RS offers opportunities to empirically analyse such governance-related spatial structures. Comparative RS studies demonstrate that different planning regimes significantly impact urban density, fragmentation, and intensity of use [103,104]. Planning instruments, such as land use plans, building regulations and density requirements, act as regulatory genesis mechanisms. RS time-series analyses allow the long-term effects of these instruments on building density, land use intensity and functional mix to be quantified [105]. Studies also demonstrate that different infrastructure models, such as car-oriented versus transit-oriented urban development strategies, leave consistent spatial signatures in the organisation of urban intensity [106].
Property and land regimes also play a central role. For example, fragmented property structures can hinder densification, whereas institutionalised land policies can enable targeted intensification. These effects can be indirectly observed in RS data, for instance through differences in parcel structures or building typologies [107]. Research at the intersection of RS and land administration demonstrates that property and tenure systems influence the fundamental spatial organisation of urban spaces, effectively serving as governance indicators or regime traits [108].
Genesis Indicators—Environmentally and Risk-Driven Processes of U-LUI
U-LUI genesis indicators also encompass environment- and risk-driven transformation processes. These can be conceptualised as shock and response traits: characteristics that reflect (i) disruptions caused by extreme events (shock signatures) and (ii) patterns of adaptation, displacement and reconfiguration (response signatures) in urban land use intensities. Natural hazards such as floods, heatwaves, earthquakes and storms act as exogenous shocks that alter usage patterns in the short term and trigger long-term adaptation processes. RS data enables such transformations to be analysed in a spatially and temporally differentiated manner [109].
Studies show that climate change-related risks have a lasting impact on urban development paths. Adaptation measures can have a restrictive effect, for instance through building bans in flood zones, creating retention areas, or an intensifying effect when densification is promoted in lower-risk areas [110]. RS time series enable before-and-after analyses of extreme events and the investigation of long-term reconstruction and transformation processes. For example, satellite data can be used to analyse reconstruction dynamics after disasters and visualise changes in urban land use patterns [111,112]. A key example is flood risk management. RS studies demonstrate that repeated flooding frequently results in a shift in land use away from flood-prone areas, either towards intensive use in higher-lying areas or densification in these areas [113]. Spatio-temporal analyses also demonstrate that risk and resilience patterns are being reorganised spatially in response to urbanisation and climate change [114]. Extreme heat and urban heat islands also drive structural adaptation. Measures such as green infrastructure or shading can alter local land use intensity and are increasingly being monitored by RS-based land surface temperature (LST) analyses [63,115].
Finally, disasters, i.e., catastrophic events, can trigger large-scale reconstruction processes that can be interpreted as regeneration phases of urban intensity. Reconstruction does not usually take the form of an exact restoration of previous conditions, but is often accompanied by changes in building density, new infrastructure, and functional reorganisation. RS time series enable the systematic recording of such shock/response trait trajectories and the analysis of their long-term effects on U-LUI [111,112]. Table A5 presents a structured overview of genesis indicators of U-LUI, including concrete examples, the corresponding RS sensors, and the representative literature references.
4.2.3. Monitoring the Structural Indicators of U-LUI with RS
Structural indicators capture the morphological and three-dimensional characteristics of urban land use, thereby representing the spatial–physical dimension of U-LUI in terms of density, configuration, fragmentation and verticality. From a trait-based perspective, these indicators can be understood as structural urban traits, which are comparable characteristics of urban form (e.g., building and sealing patterns, block and network structures, and height and roughness parameters). These traits can be derived from RS data, and their spatial variation serves as a proxy for intensity gradients.
RS is the key tool for observing and deriving these traits, as it can extract them objectively and consistently over time and across scales from multisensory data (e.g., optical, SAR/InSAR and LiDAR) and analyse them comparatively between cities. The methodological spectrum ranges from classification- and metrics-based approaches to object- and learning-based methods that explicitly consider geometric and contextual patterns [116,117,118]. Structural traits therefore provide a solid foundation for systematically quantifying the form dimension of U-LUI and its relationship to functional and sustainability-related effects [11,16].
Structural U-LUI Indicators—Urban Composition and Configuration
The composition and configuration of urban landscapes are key structural indicators of U-LUI because they describe the shape, size, arrangement and connectivity of urban areas. Unlike pure density measures, configuration and fragmentation indicators capture the spatial efficiency and compactness of urban use, forming a core component of structural intensity.
The assessment is methodologically based on spatial patterns derived from classified land cover and land use data. Multispectral data (e.g., Landsat and Sentinel-2), very high-resolution commercial sensors (e.g., WorldView) and derived urban products enable built-up and undeveloped areas to be identified and analysed using landscape ecology metrics. Herold et al. (2002) demonstrated that RS-based landscape metrics can consistently describe urban structure types and record changes to them [116]. However, if linear infrastructure elements (e.g., roads) are not reliably recorded in RS classifications, this can systematically distort structure and configuration patterns [119] and lead to the misclassification of urban structure types, since block geometries, density gradients, and land use patterns are not clearly defined enough [117].
Metrics that map fragmentation and spatial organisation are particularly relevant for U-LUI, including patch density, mean patch size, edge density, shape indices, connectivity, and aggregation measures. High patch density with small patch sizes typically indicates fragmented use, whereas larger contiguous patches with lower edge density can be interpreted as more compact and structurally intensive use. Studies show that such configuration metrics are sensitive to urbanisation processes and reflect differences in structural intensity [3].
One advantage of these approaches is their scalability. The global human settlement layer and global urban footprint provide uniform fragmentation indicators at regional and global scales. However, their informative value depends heavily on spatial resolution. With coarser resolution, finely structured fragmentation and land use mix patterns are lost, which can lead to fragmentation being underestimated [120]. Aggregation simplifies patterns, masks rare types of coverage, and reduces sensitivity to heterogeneity. This can lead to an underestimation of structural patterns [121].
Configuration analyses are further developed using spatial statistical methods. In addition to classic metrics, measures of spatial autocorrelation and neighbourhood relationships are employed to capture configurations in a context-sensitive manner. Xia et al. [16] demonstrate that U-LUI exhibits significant spatial autocorrelation and that configuration helps to explain patterns of intensity and vitality. Newer AI-based approaches (object-based image analysis—OBIA—and deep learning) use geometric and contextual features to recognise urban patterns [122,123]. Zhou et al. [118] demonstrate that incorporating higher-spatial-order features and neighbourhood information enhances the identification of intricate urban structures, particularly those characterised by intense, functionally integrated use. Gradient-guided structure indicators are also effective in distinguishing transitions between compact city centres, suburban areas, and peri-urban fragmentation zones [117].
Structural U-LUI Indicator—Block, Street and Infrastructure Morphology
The morphology of blocks, streets and infrastructure is a key structural indicator, as it influences the logic of development, accessibility, mixed use and the efficiency of land use. Block size, street layout, network connectivity and infrastructure density therefore describe the internal organisation of urban systems, providing a more comprehensive picture than pure land density indicators alone.
RS-based data collection relies on high- and very high-resolution optical satellite data (see Table A4), as well as LiDAR- and radar-based sensors [16,124]. This is often supplemented by fusion with vectorised infrastructure data. Very high-resolution sensors enable the delineation of buildings, blocks and street spaces, while multispectral data provide robust structural information at neighbourhood and city levels.
Object-based image analysis is particularly well suited to this task, as it enables the extraction of urban elements as coherent geometric objects. This approach yields more stable morphological parameters than pixel-based methods [125,126,127]. City blocks function as basic structural units: small, finely structured blocks with high connectivity are typically associated with intensive, functionally mixed use, while large-scale, single-use blocks indicate lower structural intensity. RS studies demonstrate significant correlations between block morphology, mobility patterns, and land use density [117].
Road networks form the spatial backbone of urban use. Metrics such as road density, intersection density, connectivity and orientation diversity can be calculated from RS-derived road data. Finely meshed, highly connected networks are often associated with higher structural and functional intensity [128]. Fusing RS images with OpenStreetMap improves robustness, as OpenStreetMap provides topological and semantic contextual information that purely image-based approaches do not capture [129].
A methodological challenge in structural U-LUI assessment concerns the representation of linear infrastructure elements such as roads, corridors and transport networks. Their reliable detection depends on the relationship between object width, sensor resolution and segmentation strategy. To improve topological consistency and reduce fragmentation artefacts, RS-derived products are increasingly combined with complementary vector datasets (e.g., OpenStreetMap), supporting the reconstruction of connectivity, adjacency and network structure. However, no universal minimum width threshold can be defined because detectability depends on the observation scales and processing workflow.
Technical infrastructures, such as transport axes, railway lines and logistics areas, structure urban areas, occupy large spaces, and influence fragmentation and accessibility. RS is well suited to their comprehensive recording, with radar-based sensors being particularly relevant due to their independence of weather conditions and sensitivity to linear objects. Studies show that the density and spatial dominance of such elements significantly influence structural intensity patterns [130].
RS data is increasingly being used in graph-based models to analyse urban networks. These representations can be used to derive indicators such as node density, accessibility and centrality, enabling a more detailed assessment of structural and functional intensity gradients [131]. Deep learning algorithms, particularly hybrid neural networks and graph-based models, have significantly improved the automatic extraction of linear and structured patterns, such as road and transport networks, from high-resolution RS images by integrating geometric and topological information [132].
Structural U-LUI Indicators—Surface Roughness and Height Structure
Surface roughness and vertical height structure are key U-LUI structural indicators, as they reflect the three-dimensional organisation and intensification of urban use. While 2D indicators primarily measure horizontal land use, roughness and height parameters capture vertical densification and utilisation capacity, particularly in densely populated cities.
RS-based detection uses a combination of active and passive systems, particularly LiDAR- and satellite-based digital surface and terrain models (DSMs and DTMs). The difference between these can be used to derive normalised elevation models (nDSMs), which quantify building heights, vegetation structures, and volumetric parameters across large areas. Multisensor approaches based on deep learning show that large-scale building height estimation is possible by integrating SAR, multispectral and elevation information [133]. To produce consistent DTM/DSM products, it is crucial to rasterise and harmonise LiDAR point clouds [134]. Based on this, robust indicators such as building volume, height variability and structural roughness can be derived [135]. Additionally, DSM-based structural information is combined with optical RGB data to accurately extract fine-scale urban patterns [136,137]. LiDAR-based change detection can quantify nDSM changes, thus enabling the analysis of densification and volumetric change processes over time.
Roughness, which describes the variability of height differences within urban areas, can be derived from LiDAR-based height statistics and aerodynamic measures (e.g., roughness length, z0) [138]. Satellite-based analyses also extract displacement height and roughness length, linking these to morphology [124]. SAR is sensitive to vertical structures, as multiple scattering and backscattering depend heavily on building height, density, and orientation [139]. For VHR SAR, sensor geometry is crucial. Recla and Schmitt [24] demonstrate that robust urban elevation models can be derived from individual SAR intensity images using SAR2Height, provided geometric effects are systematically considered.
Height structure is increasingly being operationalised using 3D city models generated from RS data (e.g., LiDAR point clouds) or fused with administrative geodata. These models can be used to derive volumetric indicators such as building volume, floor space potential, and vertical density. Studies show that 3D models describe morphology more precisely than 2D indicators and allow for a more accurate quantification of urban intensity [140,141]. Global products such as TanDEM-X (DSM) and space-based LiDAR (GEDI) support the derivation of relative building heights and provide selective height information for calibration and validation purposes. Fusing GEDI samples with multisensory RS data enables the creation of global building height maps, even in regions with limited data, and improves the comparability of structural indicators [142].
Statistical height and roughness metrics (mean, variance, quantiles and height differences) are becoming increasingly important for distinguishing between types of urban structure. These metrics allow an intensity gradient to be mapped from low-density, homogeneous settlements to highly complex, vertically differentiated centres. Wang et al. [143] demonstrate that 3D metrics, such as the standard deviation of building heights, characterise urban morphologies much more precisely than traditional 2D area measurements. This enables a more accurate quantification of structural U-LUI.
Structural U-LUI Indicators—Three-Dimensional Density and Volumetric Urban Intensity
Three-dimensional density (volumetric urban intensity) is a useful addition to 2D indicators, which primarily measure horizontal expansion, sealing or land use. It quantifies building intensity in terms of height, volume and vertical density per area, thus reflecting actual space and usage capacity—particularly in areas where urbanisation is driven by vertical densification rather than spatial expansion. Therefore, pure area indicators systematically underestimate the differences between low-rise and high-rise development forms.
Studies in RS show that 3D metrics (e.g., mean building height, standard deviation of height distribution and building volume) provide a more detailed picture of urban morphology and improve the analysis of urban processes [144]. The connection with environmental processes, such as the urban heat island effect, or regreening cities to climate adaptation is also emphasised; combining horizontal and vertical morphology leads to significantly better explanatory models [145]. Globally available datasets, such as a 150-metre dataset of urban building heights based on GEDI, also demonstrate the comparability of 3D structures between regions [142].
Advances in 3D capture are facilitating the derivation of volumetric parameters; airborne LiDAR remains the reference technology for high-precision building geometry, height and volume. Combining LiDAR with optical and SAR data enables scaling to regional and global levels [142]. Stereo-optical VHR sensors (e.g., WorldView-3 and Pléiades) allow for the creation of dense digital surface models (DSMs), particularly in compact city centres [117,146]. Radar interferometric missions, such as TanDEM-X, provide consistent elevation and structure information with near-global coverage, making them relevant for comparisons in data-poor regions [147]. Overall, studies demonstrate the potential of multisensor approaches using LiDAR, optical, and SAR data to provide robust volumetric urbanisation and density indicators [142].
Building height and morphology products that are globally available and derived from the fusion of GEDI samples with Sentinel and Landsat data are particularly relevant from a methodological perspective [142]. These products provide 150 m grids of building height and 3D morphology, complementing built-up layers such as the global human settlement layer or global urban footprint with a vertical component [148]. Studies on global 3D morphology datasets (e.g., GLAMOUR) also emphasise the usefulness of volumetric metrics in hydroclimatic and urban modelling [76].
Volumetric U-LUI indicators are operationalised by combining building height with building coverage/footprint to create metrics such as building volume density or other 3D indices such as differentiated tree height parameters [123,148,149]. Products such as WSF-3D provide building area and volume in raster form, while elevation/morphology products (GEDI + Sentinel/Landsat) support the global derivation of volumetric intensity measures [148]. Time-series analyses also demonstrate that vertical densification can be reconstructed, manifesting itself in both inner-city redensification and new suburban high-density zones [150]. To differentiate between structural types, elevation statistics (e.g., quantiles, variance and heterogeneity) are combined with SAR and optical time series in order to derive density gradients, high-rise cores and linear densification axes (e.g., along transport corridors) [146].
Current multi-source analyses also demonstrate that satellite-based activity indicators, such as nighttime lights, provide functional proxies that correlate with structural and socio-economic densities. Nighttime light statistics (e.g., variance and skewness) reflect heterogeneous structures and density clusters, and the nighttime light background value correlates more strongly with building and road density than classic mean values, making it a suitable functional proxy [101]. Thermal proxies (e.g., satellite-derived LST indices) are used to characterise heat islands, functional zones, and thermal heterogeneity, as well as to operationalise the coupling between volumetric structure and activity. Thus, 3D density indicators function as integrative measures that link morphology with functional activity, providing inputs for governance, climate and sustainability studies. Examples include analyses of heat islands, energy consumption and mobility in the context of compact city strategies and transit-oriented development [62]. Table A5 presents a structured overview of structural indicators of U-LUI indicators, including concrete examples, the corresponding RS sensors, and the representative literature references.
4.2.4. Monitoring the Taxonomic Indicators of U-LUI with RS
Taxonomic indicators offer a higher level of interpretation of U-LUI. Continuous gradients of urban traits are aggregated into distinct categories, typologies or archetypes. From a trait-based perspective, therefore, taxonomic indicators should not be understood as independent variables, but rather as classified combinations of urban traits representing characteristic configurations of urban intensity. While trait indicators describe individual, measurable properties of urban surfaces and processes, such as spectral signatures, vegetation conditions, degree of sealing, thermal properties, and structural morphologies, taxonomic indicators integrate these properties to create an interpretation of urban types. Thus, taxonomies translate multidimensional trait information into systematised categories of urban intensity patterns. Conceptually, taxonomic indicators can be understood as discrete mappings of multidimensional trait spaces. Individual traits map continuous gradients of urban properties, such as vegetation vitality, surface sealing and thermal emission. Taxonomic classifications transform these gradients into clearly defined classes by combining typical trait combinations into urban typologies. These typologies represent characteristic configurations of the intensity of urban land use, such as densely populated inner-city areas, suburban residential areas, and extensively used open spaces. Taxonomic systems can integrate different dimensions of information. Some are based primarily on land use and land cover information, while others focus more on morphological, functional, or ecological traits. In this sense, taxonomic indicators act as an interpretive layer between empirically measurable traits and urban scientific analysis, converting complex trait patterns into comparable urban categories.
RS plays a central role here, as RS data enables the consistent and continuous recording of the underlying traits over time and space. Multispectral, hyperspectral, radar-based and LiDAR-based sensor systems provide information on material properties, vegetation condition, building structure, elevation, morphology and thermal dynamics. This trait information forms the basis of taxonomic classifications that categorise urban intensity patterns and enable comparative analysis between cities and regions.
Taxonomic U-LUI Indicators—Urban Land Use/Land Cover (LULC) Classifications
LULC classification is one of the most fundamental approaches to describing U-LUI. From a trait-based perspective, LULC classes represent typical combinations of surface, vegetation, and structural characteristics that are categorised as distinct types of urban land use [151].
Previous studies have demonstrated that multispectral satellite data can be used to consistently differentiate between different levels of U-LUI [152]. As global RS datasets have become more widely available, large-scale classification systems have been developed that capture urban land use types in a comparable way worldwide. For example, these systems are based on Landsat time series [8].
Modern classification approaches combine multispectral RS data with machine learning methods to derive complex urban use patterns. Petrushevsky et al. [153] demonstrate that deep learning methods can recognise urban intensity types with much greater accuracy than classic pixel-based classifications. Elze and Banzhaf [123] also emphasise the importance of object-based image analysis for identifying urban land use units at the neighbourhood level.
Integrating high-resolution satellite data from sources such as PlanetScope or WorldView enables detailed differentiation of urban land use patterns, improving the detection of heterogeneous intensity structures within neighbourhoods [154]. Recent studies combine multispectral, radar-based, and LiDAR data to link land use classes with the structural characteristics of urban morphology [155]. The result is taxonomic systems that map the horizontal and vertical intensity characteristics of urban spaces [156,157].
Taxonomic U-LUI Indicators—Local Climate Zones as Standardised Intensity Archetypes
Local climate zones (LCZs) are one of the most widely used taxonomic typologies for urban spaces. LCZs were originally developed to systematically classify urban climate structures and enable different urban surface types to be compared [158]. From a trait-based perspective, LCZ classes can be interpreted as multidimensional trait archetypes. Each zone represents a specific combination of structural, material and thermal characteristics, including building density, height, degree of sealing, vegetation coverage and surface temperature. LCZ maps are derived by integrating various RS data. Initial automated classification approaches used multispectral Landsat data to derive urban structure types [159]. These methods were subsequently developed further and applied globally as part of the WUDAPT initiative [160]. Recent studies demonstrate that integrating radar and elevation information, for instance from Sentinel-1, TanDEM-X or GEDI, significantly enhances the precision of local climate zones classifications [161,162]. Additionally, thermal data from sensors such as MODIS or ECOSTRESS is increasingly being incorporated to better integrate the energetic properties of urban surfaces into the classification [67,163]. Current developments also demonstrate that the use of hyperspectral data and high-resolution elevation models enables the derivation of urban structure types that are even more differentiated, allowing LCZ typologies to be increasingly interpreted as comprehensive intensity archetypes of urban spaces [164,165,166].
Taxonomic U-LUI Indicators—Morphological Urban Structure Typologies
In addition to land use-based classifications, taxonomic systems exist that primarily describe urban intensity in terms of morphological traits. These approaches classify cities based on the spatial organisation of buildings, block structures, and sealing patterns and differentiate urban green infrastructure.
One such approach is urban structure types (USTs), which categorises different building patterns and block shapes as structural intensity types [167]. Such typologies are often based on high-resolution aerial images or LiDAR data, which can capture the morphological characteristics of urban structures in detail [168]. More recent work shows that object-based image analysis methods can robustly identify such structural types and thus depict urban intensity patterns in a differentiated manner [169,170].
At the European level, urban morphological zones (UMZs) have been developed that combine morphological structures with the degree of sealing in order to describe the various organisational forms of urban development intensity [171]. Subsequent research has demonstrated the suitability of this typology for analysing variations in urban densification within European cities [172,173]. Current studies use high-resolution RS data to further refine UMZ typologies and improve their spatial differentiation [174,175].
Global approaches, such as the global human settlement layer, extend this perspective to global scales. The global human settlement layer settlement typology distinguishes between urban centres, dense urban clusters, and suburban areas, for example, thus describing global intensity gradients of urban settlement structures [80]. Further research demonstrates that such global classifications facilitate the consistent analysis of urban densification patterns across regions [176,177]. The latest global human settlement layer system developments integrate additional datasets and enable an even more detailed description of urban intensity structures at a global level [81]. Another important basis for the morphological classification of urban areas is the global urban footprint. Based on TerraSAR-X and TanDEM-X data, the global urban footprint enables high-resolution global mapping of built-up areas [37]. Geiß et al. [147] and Marconcini et al. [178] demonstrate that these datasets can be utilised to derive global urban morphotypes, which facilitates a consistent analysis of intensity structures.
Taxonomic U-LUI Indicators—Three-Dimensional Morphotypes and Urban Archetypes
Recent taxonomic approaches have expanded the classification of urban intensity to include a three-dimensional perspective that takes the height and volume of buildings into account, as well as the vertical structure of urban spaces. Such 3D morphotypes describe the typical vertical patterns of urban development. These morphotypes are often derived from a combination of radar interferometry, optical satellite data, and LiDAR measurements. For instance, Yang et al. [179] demonstrate that building height data obtained from radar and optical sources can be integrated to recognise global morphotypes of urban development. Other studies use volumetric building models to systematically classify urban morphologies and identify typical urban densification patterns [87,180], demonstrating that a combination of building height, compactness and density provides robust indicators of vertical intensity patterns in urban spaces.
In parallel, urban archetype approaches are emerging, whereby cities or neighbourhoods are automatically grouped based on multidimensional feature spaces. Previous studies have shown that such archetypes can be derived from combinations of the structural and functional characteristics of urban systems [181]. More recent work uses machine learning methods to identify global city types representing typical combinations of density, growth dynamics, and infrastructure structure [182,183]. Current research demonstrates that these archetypes are being utilised more frequently to analyse urban transformation pathways and sustainability patterns [184,185].
Taxonomic U-LUI Indicators—Urban Functional Zones
Urban functional zones (UFZs) are taxonomic classifications of urban spaces based on their functional use. From a trait-based perspective, UFZs represent functional trait constellations in which activity patterns, infrastructure structures, and socio-economic functions are combined. Early studies have shown that UFZs can be identified by combining RS data with socio-economic information [186]. This usually involves combining multispectral satellite data with other sources of information, such as data on points of interest or mobility. Integrating nighttime light data, for instance from DMSP-OLS or VIIRS sensors, has proven particularly effective in visualising functional activity patterns within urban areas. Zhang et al. [187] demonstrate that combining nighttime light data with structural RS information allows for the distinct identification of functional urban zones. More recent work uses deep learning approaches and multimodal data fusion to automatically derive UFZs. For instance, Du et al. [188] demonstrate that integrating Sentinel-2 data with night-light and contextual information enables more precise classification of UFZs. Further studies demonstrate that graph-based models and multimodal learning methods can reliably capture complex urban functional patterns [189,190,191]. Functional taxonomies extend the interpretation of urban intensity beyond purely structural characteristics by considering the spatial organisation of urban activities and land uses as an integral part of U-LUI. Table A5 presents a structured overview of taxonomic indicators of U-LUI indicators, including concrete examples, the corresponding RS sensors, and the representative literature references.
4.2.5. Monitoring the Functional Indicators of U-LUI with RS
Functional indicators of U-LUI capture the biophysical, energetic, socio-technical and socio-ecological processes arising from the use, conversion and regulation of energy, water, materials and information in cities. In contrast to structural or taxonomic indicators, they describe the dynamic functioning of urban systems, including energy conversion, heat and water exchange, CO2 emissions, and ecological regulation. From a trait-based perspective, these processes can be conceptualised as functional urban traits: observable characteristics whose spatial variability and temporal dynamics reflect the intensity of urban land use. RS is central to this perspective because it enables the repeated, spatially explicit observation of thermal, hydrological, atmospheric and vegetation-related traits and thereby supports a process-oriented understanding of U-LUI.
Functional U-LUI Indicators—Energy Flows and Urban Heat Balance
The urban energy balance is a core functional indicator of U-LUI because it integrates the effects of densification, material properties, vegetation cover and anthropogenic activities within one physically consistent framework. It describes the balance of radiated, reflected, stored, transported and emitted energy and has been shown to be highly sensitive to the intensity, duration and type of urban use [192]. In trait terms, it is expressed through thermal and radiative urban traits such as surface temperature, heat storage and energy partitioning.
Thermal RS provides the methodological basis for this indicator group. Sensors such as Landsat TIRS, MODIS and ECOSTRESS, and more recently high-resolution thermal microsatellites, enable the derivation of land surface temperature (LST) from emitted long-wave radiation [59,60]. LST is a key thermal trait proxy because it responds directly to sealing, building density, material characteristics, surface moisture, green infrastructure and anthropogenic heat release. Its spatial and temporal patterns are closely related to energy consumption, infrastructure intensity and urban functional use [20,193].
On this basis, RS-supported surface energy balance models derive process-based indicators such as net radiation, sensible and latent heat fluxes, and stored heat. These models make the energetic partitioning of urban surfaces spatially explicit and allow comparison between neighbourhoods with contrasting use intensities, for example between evapotranspiratively cooled areas and energetically overloaded built-up structures [194]. From a trait-based perspective, they capture multiple energy-flow traits simultaneously.
A widely used integrative indicator is urban heat island intensity, defined as the temperature difference between urban and rural reference areas and commonly derived from satellite-based LST. RS studies consistently link elevated urban heat island intensity to dense development, high sealing and energy-intensive land use, with nocturnal urban heat island intensity being particularly informative because it reflects heat storage in built materials and continued anthropogenic energy release [195]. Urban heat island intensity can therefore be interpreted as an emergent expression of multiple thermal traits.
Thermal advection further describes the horizontal transport of heat within cities and thus the spatial connectivity of thermal patterns. RS analyses show that advection contributes to the spread of temperature surpluses and is often associated with extensive sealing and low functional diversity [196]. In a trait framework, this can be understood as a connectivity trait of urban heat flow.
A particularly direct functional indicator is anthropogenic heat flux, representing additional energy inputs from traffic, building heating and industrial processes. Although anthropogenic heat flux (Qf) cannot be measured directly from space, it can be estimated by combining LST, radiative parameters and energy balance modelling. RS-based studies show that high Qf values indicate high-intensity urban land use and significantly contribute to persistent heat islands [197,198]. A major strength of RS-based energy indicators lies in their temporal sensitivity. Multitemporal and diurnal LST series reveal use peaks, nocturnal heat storage and long-term changes in urban energy balance. ECOSTRESS represents a key methodological advance because its variable overpass times allow systematic analysis of the diurnal dynamics of urban thermal traits [59,67,199].
Functional U-LUI Indicators—Water Balance, Evapotranspiration and Infiltration
The urban water balance is another central functional indicator because it responds directly to the type and intensity of land use. It includes precipitation, runoff, infiltration, storage, evaporation and evapotranspiration (ET) and is strongly shaped by densification, sealing, green infrastructure and infrastructural control. RS is particularly suited to monitoring these processes because it provides spatially explicit, temporally consistent observations across entire urban regions.
Among the most important RS-based hydrological indicators is ET, which links the water and energy balances and responds sensitively to land use intensity. ET comprises evaporation from surfaces and transpiration from vegetation and is critical for cooling, water retention and microclimatic regulation. RS-based ET estimates combine thermal data with radiative and energy balance models such as SEBAL, METRIC and PT-JPL and integrate variables including LST, albedo, vegetation indices and meteorological forcing. Numerous studies show that ET products provide robust, spatially differentiated information on the functional performance of urban green and blue spaces. In trait terms, ET represents a key hydro-thermal trait of urban systems. Recent work with the PT-Urban model demonstrates ET at high spatial and temporal resolution in heterogeneous urban landscapes by integrating thermal RS, radiation balance models and urban morphology [200].
ECOSTRESS has substantially improved the analysis of urban ET dynamics because its varying overpass times enable systematic observation of diurnal fluctuations in water and energy exchange [59]. Recent studies show that highly densified, functionally intensive neighbourhoods tend to exhibit systematically lower ET, whereas parks, urban forests, green roofs and green walls provide measurable cooling and water retention through enhanced ET [201]. ET therefore serves as both a hydrological and a functional–ecological indicator of U-LUI.
In addition, RS-based moisture indicators are used to assess soil and surface wetness. A common example is the Surface Moisture Index (SMI), derived from the LST–VI feature space by combining multispectral vegetation information such as NDVI with thermal signatures [202]. Optical trapezoid approaches likewise enable estimation of near-surface moisture from high-resolution multispectral data such as Sentinel-2 [203]. In urban environments, such indicators are highly sensitive to sealing and land use intensity because heavily sealed areas typically show persistently low moisture values [204]. Their robustness can be improved through combination with passive microwave data; SMAP-based active–passive products merged with Sentinel-1 are particularly valuable in cloudy conditions and heterogeneous urban settings [205].
Another functional indicator is the ratio of sealed to water-bearing surfaces, often operationalised as the impervious surface–water ratio (ISWR) or related metrics. By linking impervious surface area (ISA) to hydrologically relevant water surfaces, this indicator captures runoff potential, flash flood susceptibility and the runoff–infiltration balance. RS studies show that a high share of impervious cover combined with limited green and blue space is associated with increased runoff, reduced groundwater recharge and weaker evaporative cooling [206]. Recent work further highlights ISA as a key predictor of urban runoff and flood susceptibility and shows that machine learning and high-resolution RS products improve the mapping of impervious and water-bearing surfaces, for example through super-resolution and segmentation approaches applied to Sentinel-2 data [207]. Freely available multispectral datasets such as Sentinel-2 and Landsat provide a consistent basis for operationalisation using NDWI and related classifiers [208,209].
Radar-based RS is increasingly important for monitoring urban runoff and flooding, especially during heavy rainfall events. Sentinel-1 SAR is particularly useful because it operates independently of cloud cover and daylight and supports the detection of temporary water bodies, change patterns and pre-event moisture conditions [210]. In urban applications, SAR flood masks are often combined with optical water indicators such as NDWI to better reconstruct event sequences in heterogeneous landscapes [211]. For example, Bayesian fusion of Sentinel-1 intensity and coherence has improved flood detection in Houston and Joso, while more recent work uses multitemporal SAR series, deep learning and benchmark datasets such as Urban-SARFloods to automate flood mapping in complex urban environments [212].
However, despite the weather independence of SAR observations, temporal revisit intervals remain an important limitation for operational urban flood monitoring. Although Sentinel-1 time series enable robust flood detection under cloudy conditions, short-lived rainfall peaks and rapid runoff responses may occur between acquisitions and therefore remain unresolved. As a result, peak precipitation accumulation and short-term hydrological dynamics may be only partially captured. Consequently, SAR-based approaches are particularly suitable for event documentation, post-event assessment and integration with complementary high-frequency observations and modelling approaches rather than functioning as standalone real-time monitoring systems for urban emergency planning.
Based on such observations, rainfall–runoff response time, or a lag-time proxy, can be defined as the time between a precipitation pulse and the first or maximum RS-detected surface water response. This variable reflects the speed at which urban surfaces respond to rainfall and can be interpreted as a hydrological response trait linked to sealing, storage capacity and drainage efficiency. Although its precision is limited by revisit intervals, flood monitoring based on RS data suggests that densely built and highly impervious areas often pass more rapidly to detectable flood conditions than green spaces, especially during pluvial events [210,213].
Functional U-LUI Indicators—Carbon, Air and Emission Flows
Urban areas are major nodes in the flow of carbon, energy and pollutants. They contribute disproportionately to greenhouse gas emissions and air pollution, while functioning only as limited carbon sinks via vegetation, soils and water bodies. These processes are tightly linked to U-LUI because they depend on building density, traffic, energy consumption, industrial use and the extent of green infrastructure. RS enables their consistent and scalable observation by linking urban surface characteristics to atmospheric measurements.
A central indicator is net urban carbon exchange, which describes the net carbon balance of urban areas by integrating anthropogenic CO2 emissions from transport, buildings and industry with uptake by urban vegetation. RS-based approaches combine XCO2 observations from missions such as OCO-2 with inversion and emission models. For urban applications, the joint interpretation of CO2 and NO2 has proven particularly effective. Reuter et al. [214] demonstrated that co-located CO2 and NO2 enhancements from OCO-2 and Sentinel-5P/TROPOMI can reveal localised urban emissions, while Fu et al. [215] used OCO-2 observations to compare anthropogenic CO2 emissions across cities globally. In trait terms, urban carbon exchange represents a metabolic trait of U-LUI.
Air pollutants provide complementary functional indicators. NO2 is especially sensitive to traffic- and industry-related activity, and TROPOMI-based top-down estimates have been widely used to quantify urban and power-plant emissions [216]. Aerosol optical depth products can also be translated into PM2.5 concentrations, as shown in global approaches such as that of van Donkelaar et al. [217]. Together, NO2- and aerosol-based indicators provide an integrative RS-based assessment of urban air quality as a proxy of functional U-LUI.
Nighttime light emission is another established proxy for energy use and socio-economic activity. VIIRS night-light products, including methods for filtering noise, moonlight and clouds, provide consistent observations of activity intensity gradients and temporal breaks related to crises, lockdowns or structural change [218]. Within a trait framework, nighttime lights can be interpreted as an activity trait linked to infrastructure and energy demand.
The sink side of urban carbon flows is represented by urban vegetation carbon uptake. With the increasing availability of solar-induced chlorophyll fluorescence (SIF), photosynthetic activity can now be observed more directly. The coupling between chlorophyll fluorescence and photosynthesis or gross primary production is well established [219,220], making UVCU a useful counterpoint to emission-based indicators and supporting assessments of urban carbon efficiency.
A key methodological advance lies in combining atmospheric RS with high-resolution surface observations. In particular, NO2 data can stabilise and attribute CO2 inversions by providing short-lived, source-proximal plume information. Li et al. [221] demonstrated this in an air-pollution-satellite-based CO2 inversion framework. Within U-LUI analysis, such atmospheric flux information can be linked to structural, vegetation and thermal data from Sentinel-2, Landsat or ECOSTRESS in order to better distinguish emission-intensive land use areas and functional intensity gradients.
Functional U-LUI Indicators—Ecosystem Functions and Green Infrastructure
Urban ecosystems and green infrastructure provide important regulatory functions that mediate and partly compensate for functional U-LUI. Vegetation, soils and water bodies influence urban energy, water and material balances through evapotranspirative cooling, radiation modification, water retention and the mitigation of thermal extremes. These are not merely structural properties but process-based contributions to urban system performance [222]. Their effectiveness depends on the type, condition, density and spatial configuration of green infrastructure. RS enables these functions to be quantified consistently across space and time and thus operationalised as functional U-LUI indicators [223].
A key RS-based indicator is urban cooling potential, which describes the capacity of urban vegetation to reduce surface and near-surface temperatures. Urban cooling potential is often operationalised as the LST difference between vegetated and heavily sealed areas and reflects the combined effects of shading, ET and altered radiation balance. Comparative RS studies have shown that urban heat and cool island patterns are systematically related to vegetation structures and activity and other biophysical drivers [224,225]. Urban cooling potential can therefore be interpreted as a core regulation trait of urban green infrastructure.
Beyond cooling alone, multiple ecosystem services can be integrated through composite indicators such as an ecosystem service index, which combines vegetation condition, surface properties and water- and energy-related process variables. Urban ET is particularly important in this context because it directly affects the partitioning of sensible and latent heat and thus LST and heat stress. Qiu et al. [226] provide a recent urban-focused overview of ET and its role in water and energy balance. In this sense, the ecosystem service index can be interpreted as the balance between ecological regulatory capacity and anthropogenic intensity.
Another important dimension is the resilience of urban vegetation to heat and drought [227]. A vegetation resilience index can be defined from RS time series to capture stress response, recovery and persistence. Leisenheimer et al. [52], for example, developed a Sentinel-2-based workflow to detect drought responses in urban street trees, including species-specific differences. In trait terms, the vegetation resilience index represents a response trait that reveals the limits of ecological compensation in highly sealed, high-intensity environments, where stress amplitudes tend to be larger and recovery slower.
The particular strength of RS-based ecosystem indicators lies in their integration with structural U-LUI data. In urban cooling, not only the amount but also the configuration, fragmentation and patch size of green space matters. Satellite-based analyses by Kong et al. [228] show that the spatial arrangement of green space strongly influences the strength of urban cool islands. Likewise, Paschalis et al. [229] provide process-based evidence that vegetation, especially urban forests, is a key regulator of urban heat stress through evaporative cooling. Linking functional indicators such as urban cooling potential, ecosystem service index and vegetation resilience index with structural metrics of sealing, density and morphology therefore makes it possible to identify where green infrastructure compensates for the deficits of intensive urban land use—and where this compensatory capacity reaches its limits. Table A5 presents a structured overview of functional indicators of U-LUI indicators, including concrete examples, the corresponding RS sensors, and the representative literature references.
4.2.6. Socio-Economic U-LUI Indicators with RS
Socio-economic U-LUI indicators capture selected human and economic dimensions of urban intensity and reflect how urban use is distributed across space. They extend beyond physical structures and functional classifications by approximating socio-economic patterns such as population density, economic activity, infrastructure intensity and social use. Within the U-LUI framework, these indicators are not interpreted as direct measurements of individual characteristics (e.g., income, deprivation, social inequality or behaviour), but as spatial proxies derived from observable urban patterns.
From a trait-based perspective, these variables can be conceptualised as socio-economic urban traits: observable and spatially structured proxy characteristics (e.g., activity, lighting, mobility, production and supply traits) associated with socio-economic processes. Since socio-economic conditions are not directly observable by RS, these indicators are generated through the integration of RS-derived traits with statistical, administrative and crowd-based data. In this context, RS provides globally consistent observations of spatial and temporal urban dynamics and supports objective and comparable monitoring of socio-economic dimensions within U-LUI and related sustainability frameworks such as the SDGs [99].
Socio-Economic U-LUI Indicators—Socio-Economic Activity Intensity
A central socio-economic dimension of U-LUI is activity intensity, referring to the degree to which urban spaces are actively used in terms of human presence, mobility and functional utilisation. RS captures this dimension through time-varying signals associated with energy consumption, economic processes, traffic flows and temporal patterns of human activity. Unlike static indicators such as building density or surface sealing, activity-based metrics—which rely on image-based monitoring processes—reflect the dynamic use of urban space and are particularly well suited to distinguishing between neighbourhoods with varying degrees of functional diversity. Trait-based approaches operationalise this dimension by identifying activity-related traits, such as socio-spatial behaviour, usage hotspots, and clusters of high or low intensity.
A key proxy is nighttime lights [230], particularly VIIRS-DNB. These nighttime light time series are widely used to derive socio-economic activity, the degree of urbanisation, and energy-related intensities. Zheng et al. [101] systematise applications of urban nighttime lights (e.g., activity centres, urban functions, event dynamics and crisis/lockdown signatures) and simultaneously discuss sources of error, such as saturation, stray light, sensor changes and lighting policy, which are key aspects for interpreting nighttime lights as a U-LUI indicator. Harmonised annual VIIRS products are relevant for long-term comparisons. Elvidge et al. [231] document global annual time-series products.
Additionally, thermal RS signals provide information on the intensity of energetic activity via anthropogenic heat. However, for the operationalisation of U-LUI, it is important to note that anthropogenic heat estimates from RS pose methodological challenges (e.g., heat storage in dense/high-rise structures and temporal decoupling between emission and LST). Yu et al. [232] demonstrate the problem of heat storage and thus support the correct physical interpretation of why thermal hotspots often coincide with high-activity clusters.
Current work integrates RS with social sensing (e.g., check-ins, points of interest, and mobility profiles) to derive activity patterns within morphologically similar neighbourhoods more robustly. Cao et al. [233] present a deep fusion approach combining satellite imagery and temporal social sensing signatures to better separate functional and activity patterns than RS alone, providing direct evidence for the inclusion of multimodal activity traits in the U-LUI framework. In regions with limited data, gridded population and density layers are also employed [13]; Leyk et al. [234] conducted a systematic ESSD review for this purpose. Finally, InSAR time series can serve as indirect activity/stress indicators when construction phases or infrastructure interventions become visible through coherence or deformation patterns [235].
Socio-Economic U-LUI Indicators—Economic Land Use Intensity and Value Creation Proxies
Economic land use intensity describes the extent to which urban land use is linked to production, services, logistics, and infrastructure. RS is increasingly capturing this dimension through the expansion of urban area, density and dynamics of economically used areas and their functional signatures (operation/throughput rather than just structure). Industrial, commercial and logistics areas exhibit characteristic spectral, structural and morphological patterns that can be recognised by multiple sensors (e.g., optical, SAR and nighttime lights) and operationalised via deep learning to create global products [155]. These are trait-based economic footprint traits (spatial production and infrastructure signatures) and operational activity traits (operational dynamics).
High-resolution built-up base maps are essential for the consistent recording of economic footprints. The global urban footprint features a robust 12 m settlement mask based on TerraSAR-X/TanDEM-X data and is ideal for large-scale urban economy analyses [37]. More recent work goes beyond this, mapping economic subregions directly. Yoo et al. [236], for example, provide 10-metre industrial area mapping for 1093 large cities (2017–2023) using multisource RS data, including multispectral and night-light data. This approach implements changes in industrial areas as a proxy for economic production intensity. Such products are particularly relevant for U-LUI because they spatially disaggregate economic activity, making structurally similar neighbourhoods functionally separable.
Nighttime light time series continue to be deployed for value-added proxies in regions with incomplete statistics, but increasingly they are used as part of multimodal sets. Zheng et al. [101] discuss applications and risks, while Gibson et al. [237] demonstrate that VIIRS is more suitable than DMSP for subnational economic proxies but also outline clear limitations to its use. Logistics and infrastructure areas can also be captured using SAR/optical time series and object-based approaches. Yasuda et al. [238] demonstrate that operational activity (e.g., yard congestion) can be derived from satellite image analysis in combination with AIS for ports, making economic intensity observable as throughput. Global 3D RS products are becoming increasingly important for services and tertiary economies: 3D-GloBFP offers a global building footprint scale elevation product [75], while WSF3D provides consistent volume information [148]. In summary, RS cannot directly measure socio-economic values, but multimodal fusions (nighttime lights, industrial areas, port/logistics indicators and 3D volumes) provide robust composite indicators of economic U-LUI.
Socio-Economic U-LUI Indicators—Inequality, Differentiation and Socio-Economic Differentiation
Very often, socio-economic inequality manifests itself spatially and can therefore be analysed indirectly using RS-based indicators. Differences in buildings and their qualities, infrastructure facilities and access, accessibility, green space availability and quality [15], soil sealing, and activity intensity create spatial patterns that often correspond to disadvantage or privilege. RS does not capture such patterns at the individual level but rather as spatially aggregated expressions—in the U-LUI framework, these are expressed as an unequal distribution of land use and activity intensity. These are deprivation or inequality traits (morphological, infrastructural, and activity-related proxies).
A central approach is to derive morphological and infrastructural proxies from high-resolution RS data. In a well-documented study on poverty assessment using satellite images and machine learning, Jean et al. [239] demonstrate that deprivation patterns can be accurately approximated using RS characteristics. In an urban context, RS analyses can identify polarisation between areas with high activity intensity and good equipment and underserved neighbourhoods [15]. Informal settlements are a central focus here: Ajami et al. [240] derived degrees of deprivation within slums from very high-resolution data by linking image-based features to a multidimensional deprivation index and predicting them spatially using deep/transfer learning.
In the context of U-LUI, it is important that these approaches classify spatial intensity and provision patterns rather than social groups. Nevertheless, their use requires methodological and ethical reflection. RS proxies do not provide direct information about individual living situations and may contain context-dependent distortions. Their strength lies in identifying spatial gradients or disruptions, not attributing them to individuals or households [122].
Socio-Economic U-LUI Indicators—Dynamics, Crisis Response and Resilience
A key added value of RS-based socio-economic U-LUI indicators is their ability to map temporality. Multitemporal RS makes gradual transition patterns or discontinuous transformation paths just as visible as sudden disruptions. Within the U-LUI framework, resilience can be monitored via temporal signatures, e.g., (i) the amplitude of activity increases or declines, (ii) the recovery rate (time to return) and (iii) the spatial reorganisation of hotspots. These patterns correspond to trait-based resilience traits (slump–duration–recovery; spatial shift/fragmentation).
The impact of the pandemic can be used as a reference case here: high-frequency nighttime light products (e.g., Black Marble and VIIRS-DNB) robustly reflect lockdown-induced activity slumps [241]. Additionally, traffic intensity can be quantified via vehicle detection in high-frequency planetary time series [242]. On the energy–thermal axis, Meng et al. [243] demonstrate that changes in anthropogenic heat flows and heat-associated activity intensity can be derived from RS time series. In the context of maritime logistics, Loveridge et al. [244] demonstrate the globally differentiated effects of the pandemic on the activity profiles of shipping, fishing and passenger traffic, which is important because port and supply chain functionality are key proxies for value creation.
SAR time series are particularly important in the context of conflicts and natural disasters, as coherence- and amplitude-based changes can capture destruction and functional failure. In the case of Ukraine, conflict-related destruction was mapped using Sentinel-1 coherence via Coherent Change Detection [245]. In U-LUI interpretation, structural damage (SAR) can be combined with functional activity proxies (e.g., nighttime lights and thermal signals) to distinguish between destruction, shutdowns, power outages, and the relocation of activities.
Current research on the existence and dynamics of informal settlements and habitats for refugees/internally displaced persons is shifting its focus from point mapping to scalable time series and probability indicators. Hallopeau et al. [246] use multisource RS features and robust learning strategies to improve transferability, while Büttner et al. [247] present 10-metre slum probability maps for numerous cities, revealing peripheral dynamics. Regarding refugee settlements, Friedrich and Hoek [248] demonstrate that Landsat/Sentinel time series (e.g., disturbance detection) can capture the establishment and expansion of settlements, as well as environmental changes, on a sub-annual basis. Overall, the literature supports the development of multisensory resilience metrics, in which the decisive factor is not a single proxy, but rather the fused interpretation of temporal trait signatures (break-in–duration–recovery) and spatial reorganisation.
Table A5 presents a structured overview of socio-economic indicators of U-LUI indicators, including concrete examples, the corresponding RS sensors, and the representative literature references.
4.3. Validation and Uncertainty Considerations for Monitoring U-LUI
As U-LUI indicators derived from RS partly represent indirect proxies of anthropogenic urban use, robust validation strategies and explicit consideration of uncertainty are essential prerequisites for reliable interpretation and comparability across spatial and temporal contexts.
Figure 3 summarises the proposed validation and uncertainty framework for RS-based U-LUI monitoring. Urban traits derived from RS and complementary in situ observations are translated into six indicator families and evaluated through multiple validation pathways.
Figure 3.
Validation and uncertainty framework for RS-based monitoring of urban land use intensity (U-LUI). Urban traits derived from RS and complementary in situ observations are translated into six indicator families and evaluated using multiple validation pathways. Validation combines structural, functional, socio-economic and temporal reference information, while uncertainty sources include scale effects, mixed pixels, shadow effects, temporal mismatches and sensor-related differences. The framework supports transparent, scalable and comparable assessment of U-LUI across spatial and temporal contexts. Conceptual visualisation generated using OpenAI ChatGPT-5.5 (image generation) based on concepts defined by Angela Lausch; scientific validation and final revision by Angela Lausch.
Validation approaches should be adapted to the respective indicator family. Structural indicators (e.g., building density, sealing and morphology) can be validated using cadastral information, 3D city models, LiDAR observations and official land use inventories. Functional indicators may be assessed using mobility datasets, traffic measurements, energy statistics and smart city sensor systems. Socio-economic indicators can be evaluated using census information, administrative statistics, point-of-interest data and crowd-based observations. Temporal consistency can additionally be assessed through time-series analysis and cross-date comparisons.
At the same time, uncertainty remains an inherent characteristic of RS-based U-LUI assessment. Important uncertainty sources include scale dependency and the Modifiable Areal Unit Problem (MAUP), mixed pixels and subpixel heterogeneity, shadow and illumination effects, temporal inconsistencies between RS acquisitions and reference data, and differences in spatial, spectral and temporal sensor characteristics. Urban complexity and heterogeneous land use patterns may further affect indicator stability and transferability across cities and scales.
Consequently, future operational implementations of U-LUI should combine multi-source validation, uncertainty reporting and cross-sensor harmonisation to ensure transparent, scalable and internationally comparable monitoring workflows.
5. RS Relevance for Planning, Decision-Makers and Policy
Urban transformation processes—driven by densification, climate adaptation, energy and mobility transitions, and increasing socio-ecological pressures—create a growing demand for spatially explicit, timely, and comparable evidence for decision-making. RS provides a powerful observational framework to address this demand by enabling repeated and consistent measurements of urban surface, structural and functional characteristics such as vegetation cover, imperviousness, surface temperature, urban morphology and nighttime light emissions. These observations allow urban systems to be monitored systematically across space and time and can be translated into spatial indicators supporting planning and governance processes in diagnostic (status assessment), prospective (trend and scenario analysis), and evaluative (impact assessment) capacities.
Over the past two decades, the role of RS in urban research has expanded considerably. While early applications mainly focused on land cover and land use classification, recent advances in multisensor RS, high-resolution satellite constellations and cloud-based geospatial computing platforms have significantly broadened the analytical scope of urban RS. Contemporary approaches increasingly allow the monitoring of functional urban processes such as thermal dynamics, energy exchange and infrastructure development [148,249]. At the same time, RS has become an important data source for evidence-based urban governance and sustainability monitoring, as spatially disaggregated RS data can support policy evaluation and the tracking of global sustainability targets [250,251]. As visualisation tools, RS data and ancillary local governance information serve as a meeting point as interactive walkable floor maps. Across city council departments and local stakeholder interactions, methodological innovation is needed that actively engages a range of policy makers in policy learning to address issues of climate change, urbanisation conflicts or biodiversity loss. Various workshops across Europe showed that a greater spatially explicit local context being presented on walkable floor maps supported “thinking outside of the box”. This tangible RS approach facilitated policy makers to discuss current situations and imagine/visualise preferable future scenarios [252,253].
Despite these advances, the transfer of RS-based knowledge into operational planning practice is being addressed slowly. More complex applications remain confined to academic monitoring or methodological experimentation and are only partially integrated into institutional planning processes. This policy procrastination can be attributed to several factors, including limited interfaces between research and public administration, insufficient organisational capacities within planning institutions, and the limited standardised indicator frameworks and data infrastructures [254]. Consequently, increasing attention has been directed towards strengthening RS–policy interfaces. In particular, cloud-based geospatial platforms, open RS data infrastructures and integrated decision-support systems are increasingly recognised as key mechanisms for embedding satellite-derived information within policy and governance frameworks [254,255]. Nevertheless, translating RS data into policy-relevant knowledge remains a major target, requiring stronger science–policy interfaces and co-design processes between researchers and decision-makers [256]. This issue has been tackled by the European Commission and various Western countries through transdisciplinary research projects across Europe or at the national level.
5.1. Significance of RS-Based U-LUI Indicators for Spatial Planning
5.1.1. Why U-LUI Is Compatible with Planning
Conventional planning data is usually organised in administratively defined land units and discrete land use or building categories, often updated only every few years. This makes it poorly suited to dynamic urban transformation because intra-zonal heterogeneity, transition areas, small-scale densification and environmental hotspots are often insufficiently captured. RS-based U-LUI indicators fundamentally extend this perspective by relying on continuous, scalable and spatially consistent multisensor time series. They allow urban intensity patterns to be mapped within formal land use zones and shift the analytical focus from categorical classes to continuous gradients and urban traits. Traits provide a more realistic representation of urban structures and processes because they are scale-flexible, comparable across cities and reproducible over time. For planning, this could offer added value: inner-urban gradients become visible, trade-offs such as those between densification and thermal stress can be made explicit, and evidence-based monitoring could help facilitate evidence-based decision-making through internationally standardised and repeatable RS observations.
5.1.2. RS Examples with Direct Relevance to Planning
RS-based U-LUI indicators are most useful when they can be translated into concrete planning questions. Several mature approaches already demonstrate how urban traits derived from RS support spatial planning, climate adaptation and strategic management.
- (1)
- Heat and climate adaptation planning. Thermal RS data is one of the most important information sources for analysing urban heat stress. Sensors such as Landsat TIRS, MODIS and ECOSTRESS enable consistent derivation of land surface temperature (LST), which can be interpreted as a key thermal urban trait. Coupled with vegetation indicators such as NDVI and with imperviousness measures, LST has become a standard basis for characterising urban heat islands and intensity gradients [249]. For planning, this allows thermal hotspots to be identified at neighbourhood or block level and provides an evidence base for prioritising measures such as unsealing, shading, tree-canopy expansion and the development of blue–green corridors. Because thermal time series are increasingly available, the effects of such measures can also be evaluated over time.
- (2)
- Urban morphology as a planning trait. In addition to temperature, urban morphology is central to climate-related and structural planning. The local climate zone system classifies urban areas by building form, height, surface cover and vegetation, thereby replacing conventional land use categories with a standardised morphological framework [158]. Implemented through WUDAPT (World Urban Database and Access Portal Tools), local climate zone mapping has become a globally comparable reference for urban climate and adaptation analysis [257]. Because local climate zones provide a standardised input for urban climate, air-quality and flow models, they are highly relevant for planning scenarios such as densification or greening alternatives. Their production and quality assurance using freely available RS data are well documented, which supports transferability and reproducibility [258].
- (3)
- 3D intensity and built-up volume. In dense cities, U-LUI is increasingly shaped by the third dimension. Building height and volume influence land use efficiency, shading, ventilation, infrastructure provision and microclimate. RS-based datasets such as the World Settlement Footprint 3D explicitly capture these volumetric traits by providing global information on building area, average height and building volume [148]. For planning, these indicators can support assessments of redensification potential, fresh-air corridor preservation, shading effects and infrastructure deficits. They also provide a basis for interpreting spatial inequalities, as building volume can function as a proxy for invested capital and service provision [259].
- (4)
- Anthropogenic activity and land use mix proxies. Nighttime light data from DMSP/OLS and especially VIIRS represent a further standardised RS stream for analysing urban intensity. Nighttime lights can be interpreted as an activity trait because it approximates electrification, economic activity and functional density. Levin et al. [230] provide an overview of its methodological foundations and applications, from urban mapping to resilience analysis. In combination with NDVI, LST and development indicators, nighttime light data can improve the delineation of urban intensity gradients [260]. In planning contexts, such activity traits can inform lighting strategies, identify nighttime economy hotspots and contribute to multidimensional U-LUI composites, although limitations such as saturation and LED-related changes must be considered.
- (5)
- SDG and sustainability monitoring. RS-based settlement products are increasingly relevant for indicator-driven policy and sustainability monitoring, especially for SDG 11.3.1 on land use efficiency. The global human settlement layer provides an internationally recognised basis for analysing settlement expansion and population dynamics in a comparable way [261]. For planning, this offers standardised evidence of the relationship between land consumption and urban growth, which can be integrated directly into sustainability strategies, reporting obligations and evaluations of densification policies.
5.2. Support for Decision-Makers and in Public Administration
Meanwhile most urban planners and stakeholders are aware of the added value of RS data and resulting analyses. For decision-makers and public administrations, the value of RS depends less on methodological sophistication than on operational usability. Robust workflows, transparent uncertainties, clear interpretation rules and institutional responsibilities are essential. Wellmann et al. [254] note that purely numerical RS outputs often remain of limited relevance unless they are translated into problem- and action-oriented information. In other words, abstract metrics must answer applied questions: What is the problem? Where does it occur? What measures are possible? What effects can be expected? RS-based U-LUI indicators are well suited to this translation because they condense complex spatial information into comparable and repeatable metrics that can feed directly into monitoring, reporting and operational decision systems.
- (1)
- Monitoring and enforcement. RS increasingly supports compliance-related tasks such as monitoring imperviousness, land use change, vacant land, redensification, the protection of green and open spaces, compensation measures, and informal development. Very high-resolution optical data and Sentinel-1/2 time series are especially useful for repeatedly observing such change processes. However, legally robust implementation requires close linkage with cadastral and planning data as well as clear data governance, including metadata, versioning and quality control.
- (2)
- Early warning and event management. RS time series play an important role in preventive risk management. Thermal indicators, vegetation stress, soil moisture proxies and SAR-based flood detection can identify vulnerable areas early and support prioritised action in heat, drought and flooding contexts. Examples include heat-protection routing, targeted irrigation and the identification of particularly exposed neighbourhoods. For administrative practice, the crucial step is not single-scene analysis but the integration of these indicators into operational systems such as municipal dashboards, situation rooms and early-warning platforms.
- (3)
- Urban data cubes and cloud-based workflows. A major barrier to long-term RS use in administration is that many applications remain project-based. Wellmann et al. [254] therefore propose municipal urban data cubes as persistent infrastructures for RS acquisition, storage, processing and dissemination. Such infrastructures can institutionalise regular indicator production and move RS from one-off studies to continuous administrative use. Cloud-based environments such as Google Earth Engine provide an important technical basis because they enable scalable processing of large RS archives and support the automated, reproducible and auditable generation of products such as LST mosaics, local climate zone layers or imperviousness indicators [262].
- (4)
- Urban digital twins as interfaces. Urban digital twins are increasingly discussed as integrative interfaces linking observation, modelling and planning. In such systems, RS acts as both an update stream and a validation layer [79]. RS-based U-LUI indicators can represent current urban intensity and simultaneously serve as reference variables for scenario analysis and impact assessment. Yet successful implementation depends not only on technology but also on governance. Ferré-Bigorra et al. [263] highlight challenges related to data integration, responsibilities, organisational barriers and the communication of benefits. For decision-makers, the main advantage lies in linking observed urban traits with “what-if” scenarios and making the spatial consequences of alternative interventions transparent.
5.3. Policy and Strategic Relevance
At policy and strategic levels, RS-based indicators are becoming increasingly important because they provide comparable, repeatable and transparent evidence of spatial conditions and change. Such information is essential for policy processes in which competing priorities—such as urban densification, climate adaptation and environmental justice—must be balanced and justified through evidence-based decision-making. RS-derived indicators enable spatially explicit assessments of environmental pressures, infrastructure disparities and social inequalities within cities, thereby strengthening the empirical basis of urban governance [264]. In addition, they allow policy interventions to be monitored over time and support the identification of priority areas for public investment and intervention [265].
Within this broader RS–policy context, RS-based indicators of U-LUI provide a particularly relevant framework because they translate complex spatial patterns into measurable indicators of urban development intensity. By capturing multidimensional gradients of density, infrastructure, environmental conditions and human activity, U-LUI indicators help operationalise policy objectives and link satellite-derived observations to concrete planning and governance questions.
First, RS-based U-LUI indicators support target systems, accountability and equity assessments by providing spatially differentiated baselines and monitoring data. This is particularly evident in sustainability monitoring frameworks such as the SDGs, where datasets such as the global human settlement layer serve as methodological references for indicators, including SDG 11.3.1 on land use efficiency [261]. More broadly, RS-based SDG research demonstrates that the relevance of indicators for policy target systems increases when indicators can be disaggregated below national scales and reveal spatial hotspots of environmental or social pressures within cities [266]. In trait-based terms, this enables policy frameworks to move beyond aggregated land use categories towards spatially differentiated trait distributions that reveal inequalities and intervention needs more clearly.
Second, U-LUI indicators support priority-driven investment and spatial planning decisions. Because they capture variations in built intensity, infrastructure provision and environmental conditions, such indicators can reveal spatial disparities that inform targeted investments in climate adaptation, urban greening or social infrastructure. For example, satellite-derived building heights and built-up volumes provide insights into infrastructure gaps and spatial inequalities, thereby helping to justify and prioritise investments across neighbourhoods and regions [259,267].
Third, RS-based indicators also contribute to crisis, conflict and resilience governance. Activity-related indicators such as nighttime light emissions provide internationally recognised proxies for electrification, economic activity and urban functionality. As such, they can reveal disruptions and recovery processes following disasters or during conflict situations [230]. From a trait-based perspective, these signals capture temporal changes in urban activity and system functionality under conditions of stress.
Finally, the political relevance of RS-based indicators is reinforced by their standardisation and global comparability. Classification systems such as local climate zones provide internationally standardised urban typologies that facilitate cross-city comparisons in climate and planning analyses [158]. Through initiatives such as WUDAPT, these typologies are operationalised within global, community-based data infrastructures for urban environmental modelling [257], while research on local climate zone transferability addresses issues of cross-city robustness and methodological consistency [161]. Beyond individual datasets, essential-variable frameworks increasingly define core RS observables that can serve as robust interfaces between scientific monitoring systems and policy indicators [268]. At a strategic level, such standardised variables facilitate the integration of RS-based U-LUI indicators into municipal target systems, funding programmes and international reporting frameworks. Mission-oriented RS initiatives such as SDGSAT-1 further strengthen this link by explicitly aligning satellite observation systems with global sustainability monitoring [269].
Overall, RS-based U-LUI indicators are politically most effective when they translate policy goals into verifiable spatial metrics, reveal priority areas and distributional effects, and ensure comparability across governance levels through standardised variables and typologies.
5.4. Perspectives and Recommendations for Action
Several practice-oriented recommendations follow from this discussion if RS-based U-LUI is to move from project-based analysis towards durable decision support.
First, U-LUI should be operationalised as an indicator toolkit rather than as a single metric. Urban land use intensity is inherently multidimensional and is therefore best represented by a bundle of traits combining two-dimensional land cover and imperviousness, 3D morphology, thermal conditions, green–blue infrastructure, activity proxies, and temporal dynamics. Such composite approaches make planning conflicts—such as those between densification and heat exposure—more explicit and allow spatially differentiated prioritisation.
Second, institutionalisation through urban data cubes is essential. If RS-based U-LUI indicators are to be used routinely, they must be embedded in persistent data and processing infrastructures rather than in temporary projects. UDCs, supported by cloud platforms such as Google Earth Engine, provide a practical basis for continuous data access, processing and indicator updating [262].
Third, RS-based U-LUI should be formalised in SEA/EIA procedures and municipal standards. Long-term uptake will depend on integration into existing planning and assessment routines. This requires clearly defined indicators, reference or threshold values, and minimum standards for data quality, validation and documentation.
Fourth, capacity building and translation remain critical. Technical availability alone is insufficient. RS-based trait information must be converted into understandable, action-oriented statements through co-defined problem settings, interpretation guidance, uncertainty communication and target-group-specific visualisations such as dashboards, story maps and interactive walkable floor maps [270]. Wellmann et al. [254] stress the need for demand-driven research and stable science–policy interfaces in this regard.
In sum, the future impact of RS-based U-LUI concepts will likely depend less on further methodological innovation than on institutional anchoring, standardisation and communicative translation into planning and policy practice.
6. New Approaches and Tools for the Quantification and Evaluation of U-LUI Using RS
The rapid development of RS, combined with advances in AI, has fundamentally expanded the possibilities for quantifying and evaluating U-LUI. While classic RS approaches were often based on individual indicators, static classifications or linear models, new data-driven methods allow for the integrated, nonlinear and highly scalable recording of urban intensity patterns. This opens up new perspectives for U-LUI in particular, as AI methods can capture complex relationships between spectral, thermal, structural, temporal and functional characteristics, converting them into consistent intensity metrics [271]. This improves access to planning institutions and facilitates transdisciplinary collaboration.
6.1. RS and AI for Recording U-LUI
Using AI in RS marks a shift in approach from rule-based and index-driven methods to learning-based models. This shift is particularly relevant for recording U-LUI, since urban intensity is an emergent phenomenon arising from the superimposition of different processes, which can only be described to a limited extent by individual physical variables. Although machine learning methods such as random forests, gradient boosting and support vector machines continue to be used, the methodological focus is shifting towards deep, multimodal and semi-/self-supervised learning approaches, which scales particularly well with heterogeneous urban structures. Li et al. [155] provide a current overview of model architectures, data sources, and open challenges in AI-based urban land use mapping.
In recent years, deep learning approaches in particular have expanded the range of available tools. Convolutional neural networks (CNNs) and transformer-based models can simultaneously capture spectral information, texture, and spatial context. This enables the robust modelling of key U-LUI characteristics, such as fragmentation, block structures, and building density. At the same time, self-supervised methods are becoming increasingly important because they allow for large-scale, high-resolution mapping with significantly less manual training data—an important factor for comparable U-LUI analyses across many cities. Zhu et al. [272], for example, demonstrate that a self-supervised transfer framework can reliably derive building floor plans in very different urban contexts, which is essential for structure-based intensity metrics.
Another key advance for U-LUI capture lies in modern models’ ability to explicitly consider temporal dimensions. Rather than simplifying time series through aggregation (e.g., annual averages), deep learning approaches that can reconstruct the timing, duration and nature of changes are increasingly being used. He et al. [273] demonstrate this with an approach to temporal semantic segmentation of RS time series that integrates the “where–when–what” of land cover changes. This allows for a much more process-oriented description of urban dynamics—a core requirement if U-LUI is to be understood as a dynamic process of use and transformation. At the application level, such temporally explicit concepts are increasingly being combined with multisensory or multi-perspective data to better capture functional and land use changes in cities. For example, Yang et al. [274] demonstrate that the temporal fusion of Street View information with RS data enhances the identification of changes in urban functional zones—an approach that is particularly pertinent when U-LUI is operationalised through activity and functional density.
At the same time, multimodal data fusion is becoming increasingly important for mapping functional intensity. In addition to optical and SAR data, proxy data on human activity, such as nighttime lights, are being integrated. Chen et al. [275] demonstrate that combining high-resolution optical image data with nighttime light data using a cross-modal fusion network significantly improves the classification of urban functional zones. These physical–social fusion approaches are particularly valuable for U-LUI as they can map structural density and activity intensity simultaneously.
Alongside the model architecture, the availability of large, harmonised RS datasets and scalable processing environments is crucial. Cloud-based platforms, especially Google Earth Engine, enable the processing of global time series from Landsat and Sentinel data. This forms a central basis for reproducible and transferable U-LUI analyses. Stamou and Stylianidis [276] provide a current, urban-specific inventory of GEE-based approaches and their advantages in terms of reproducibility. At the same time, the interpretability and transparency of AI-based models are coming into sharper focus. For planning and policy applications, it is essential that the derived U-LUI indicators are comprehensible and explainable. AI approaches (e.g., activation- and attention-based explanations and feature attribution) are therefore increasingly being used to reveal the contributions of individual RS features to model decisions. Warnke and Runfola [277] demonstrate how AI can be used to interpret model decisions from satellite images in complex urban contexts, an approach that can be transferred to U-LUI models to increase their acceptance and validity.
Overall, new AI-supported RS approaches demonstrate that the quantification of U-LUI is shifting from the derivation of individual indicators towards integrative, learning-based intensity models. These models can capture structural, functional, and temporal dimensions of urban use simultaneously, thus providing a robust, scalable, and comparable basis for scientific analysis, planning applications, and policy-driven decision-making processes. Furthermore, recent developments towards label-poor or zero-shot methods suggest that urban land use categories could be developed on a large scale in future with significantly less ground truth effort [278].
Despite recent advances in multimodal AI and deep learning architectures, scale-related uncertainties remain an important limitation for continuous U-LUI monitoring. Aggregation effects associated with the MAUP may alter observed intensity gradients depending on the selected spatial units, while mixed pixels and spatial degradation can reduce the separability of heterogeneous urban surfaces. These effects become particularly relevant when integrating observations across multiple sensors and resolutions. Multimodal and multi-scale fusion approaches may reduce such limitations by combining complementary spatial and temporal information; however, uncertainty propagation and scale sensitivity should remain explicit components of future U-LUI assessment frameworks.
6.2. Semantic Web and Linked Open Data for Monitoring U-LUI
The Semantic Web and the principles of Linked Open Data (LOD) open up new possibilities for linking heterogeneous data sources semantically, making them available in an interoperable manner, and enabling them to be interpreted in a machine-readable way for observing and evaluating U-LUI. As U-LUI is a multidimensional concept integrating structural, functional, socio-economic and temporal components of urban use, monitoring it requires a data infrastructure that goes beyond classic data fusion, explicitly mapping meanings, relationships and spatio-temporal dynamics. A central technical basis for this is the use of GeoSPARQL as a geospatial standard for RDF/SPARQL-based knowledge infrastructures [279].
Key components of the Semantic Web include the Resource Description Framework (RDF), which is used to describe entities and relations in a triple structure; the Web Ontology Language (OWL), which is used to model domain knowledge; and SPARQL, which is a query language for semantic databases. In combination with GeoSPARQL, these technologies can integrate RS, in situ and IoT data, as well as socio-economic statistics and administrative geodata. Until now, these have often been available in separate formats, scales and institutional contexts.
U-LUI’s semantic modelling uses ontologies or knowledge graphs to represent urban entities (e.g., areas, buildings and infrastructures), RS-based traits and indicators (e.g., degree of sealing, thermal load, and vegetation structure and intensity), urban processes (e.g., densification, decline and land conversion), and temporal dimensions. This means that RS-based intensity indicators are represented not only numerically, but also conceptually, in an unambiguous manner, and can be interpreted by machines. Examples of the systematic generation of spatial knowledge graphs and their queryability can be found in the current research of Jang et al. [280] on spatial KG generation in geo-information contexts.
Figure 4 illustrates the principle of a semantically integrated U-LUI knowledge infrastructure. It shows how heterogeneous data sources, including multisensory RS, in situ and Internet of Things (IoT) data; crowdsourced information; and AI-generated derivations, are brought together in a central U-LUI ontology through annotation, mapping, and linking. This ontology acts as a semantic mediation layer between the data and application levels, enabling interoperable analyses for planning and governance (e.g., SDG indicators/GeoSPARQL queries), research and modelling (e.g., time series and AI training), and visualisation and monitoring (e.g., dashboards). It also becomes clear that semantic integration supports interoperability, knowledge integration, automated queries, reusability and traceability.
Figure 4.
Conceptual architecture for semantic integration and application of urban land use intensity (U-LUI). Heterogeneous urban data sources—including remote sensing (RS), in situ and IoT observations; crowdsourced/citizen science data; and AI-generated derivations—are semantically integrated through a U-LUI ontology based on INSPIRE, RDF, SPARQL, and GeoSPARQL concepts. The ontology enables annotation, mapping, and linking of urban traits and other indicators and supports interoperable applications in planning and governance, research and modelling, and visualisation and monitoring dashboards. This semantic knowledge infrastructure facilitates interoperability, knowledge integration, automated querying, and reuse and traceability of U-LUI information. Graphically edited using OpenAI ChatGPT-5.5 (image generation); scientific validation and final revision by Angela Lausch.
A key advantage of semantic and LOD-based approaches is their ability to efficiently facilitate complex queries across spatial, temporal, and thematic dimensions. Current methodological work explicitly addresses the performance of geospatial–temporal semantic queries in hybrid graph/geodata setups, which is particularly relevant for scalable U-LUI monitoring [281].
However, challenges remain, particularly with regard to ontology harmonisation, annotation effort and representing dynamic processes and uncertainties. Future developments therefore aim to couple semantic technologies more closely with AI-supported RS analyses. While AI methods increasingly contribute to automatic classification and annotation, knowledge graphs and ontologies provide the conceptual framework for interpretation, validation and explainable use, as well as for large-scale, integrative knowledge infrastructures such as KnowWhereGraph [282].
7. Conclusions and Further Research
This review demonstrates that, in the context of modern RS, U-LUI should not be considered a static or categorical variable, but rather a continuous, multidimensional and dynamic process arising from the spatial and temporal variation of urban characteristics. Using RS data makes U-LUI physically observable, scalable and comparable across different spatial and temporal scales. This establishes U-LUI as a vital analytical tool for understanding urban transformation, connecting urban research, planning, governance and monitoring programmes.
This review’s central contribution lies in developing an integrated, trait-based framework that systematically brings together six complementary RS-based indicator families: trait, genesis, structural, taxonomic, functional, and socio-economic indicators. This approach overcomes the limitations of classic land use and land cover concepts by deriving urban intensity entirely from directly or indirectly observable urban traits. The trait-based RS approach reveals inner-city heterogeneities, gradual transitions, and small-scale intensity gradients, thereby more accurately reflecting the physical and functional reality of cities. Synthesising multispectral, hyperspectral, thermal, radar and LiDAR-based RS approaches shows that U-LUI can be analysed as both a momentary state and a process-driven system. High-resolution, temporally dense RS time series enable the identification of the intensification, transformation and stabilisation of urban land use paths. This creates a methodological bridge between urban morphology, functional city analyses, urban metabolism approaches, and data-driven smart city concepts, establishing U-LUI as a reliable indicator of sustainable urban development.
The trait-based RS approach offers considerable advantages for spatial planning, urban development and governance. It enables multi-scale analyses ranging from individual parcels to metropolitan areas, enhances comparability between cities and regions, and provides a robust evidence base for evaluating critical trade-offs, such as those between building density, land efficiency, green infrastructure, climate impact, and the operational performance of urban systems. By explicitly linking physical, functional and socio-economic traits, U-LUI can be directly connected to political target systems, such as SDG 11, and to operational planning and monitoring instruments.
Beyond planning and monitoring applications, the proposed trait-based U-LUI framework also provides a conceptual and operational basis for Smart City implementation. By integrating remotely sensed, in situ and socio-economic indicators across six complementary indicator families, the framework supports urban governance through evidence-based monitoring, benchmarking and policy evaluation. It can further contribute to urban digital twins by representing spatial and temporal dynamics of urban intensity, enable continuous indicator updates through urban dashboards, and support AI-assisted decision-making and adaptive planning workflows. In this way, the framework strengthens the integration of observation, analysis and decision support and establishes U-LUI as an interoperable and scalable information layer for transparent, data-driven and responsive urban management.
However, methodological challenges remain, including the indirect measurability of functional and socio-economic processes, the scale dependency of individual trait indicators, and uncertainties due to shading, vertical complexity, material mixing and rapid changes in land use in dense urban areas. The growing variety of RS-based indicators necessitates greater standardisation, harmonisation and conceptual integration, a process that the framework developed in this review can facilitate.
Future research should focus on the following aspects in particular:
Integration of multiple data sources: systematically linking RS-based U-LUI indicators with in situ, administrative, and socio-economic data to map the functional, social, and normative dimensions of urban intensity more robustly and evaluate them accurately.
- Analysis of urban dynamics: Use long-term, high-frequency RS time series to investigate the genesis, transformation, and re-intensification of urban land use, and identify stable and unstable intensity regimes.
- Vertical and three-dimensional intensity: Further development of methods for integrating vertical urban structures by combining LiDAR, SAR and 3D urban models to capture volumetric and functional intensity more effectively.
- RS–AI–semantic workflows: Development of integrated semantic–AI–RS approaches for transparent, reproducible and operational implementation of trait-based U-LUI monitoring systems across different spatial scales.
- Standardisation and comparability: The establishment of harmonised indicator sets, reference scales and validation frameworks will reduce redundancies and ensure international comparability.
- The normative dimension of urban intensity: An in-depth investigation into the relationships between U-LUI, social justice, quality of life, vulnerability, urban resilience and the transferability of RS-based intensity measures to relevant policy and planning assessment processes.
Overall, the review shows that urban traits and their spatial and temporal variations provide a robust and sustainable basis for defining and quantifying U-LUI. The RS-based approach opens up new perspectives for the integrated, comparable and policy-relevant monitoring of urban land use and creates a viable conceptual basis for future interdisciplinary research and practice-oriented applications in the context of sustainable urban development.
Author Contributions
Conceptualisation, A.L. and E.B.; methodology, A.L., P.S., M.P. and T.W.; investigation, P.S. and A.J.; resources, P.S. and A.J.; writing—original draft preparation, A.L. and E.B.; writing—review and editing, A.L., E.B., J.B., X.D., M.P., D.H., T.W., P.S., T.T. and A.J.; visualisation, A.L. and P.S.; supervision, J.B. All authors have read and agreed to the published version of the manuscript.
Funding
Supported by the Federal Ministry of Research, Technology, and Space (BMFTR) under grant number 01UU2505.
Data Availability Statement
No new data were created or analyzed in this study. Data sharing is not applicable to this article.
Acknowledgments
The authors would like to thank the Helmholtz Centre for Environmental Research—UFZ for institutional support. This research received no direct external project funding. Parts of the work benefited from institutional infrastructure and research environments supported by the German Federal Ministry for Transport (BMV; grant no. 45KI19D041, Artificial Intelligence and Mobility—AIAMO project), as well as by the Helmholtz Association and the Federal Ministry of Research, Technology and Space (BMFTR), Germany, through the DataHub initiative of the Research Field Earth and Environment. The DataHub supports overarching and comprehensive research data management according to the FAIR principles within the programme Changing Earth—Sustaining our Future. András Jung acknowledges support from project no. TKP2021-NVA-29, implemented with the support of the Hungarian Ministry of Culture and Innovation from the National Research, Development and Innovation Fund. These sources supported institutional infrastructure and/or individual authors and had no role in the design, interpretation, writing, or publication of this review. Figure 2 was edited using OpenAI ChatGPT-5.5 (image generation) for graphical refinement. Figure 3 and Figure 4 were generated using OpenAI ChatGPT (image generation) based on concepts and specifications defined by Angela Lausch. Scientific validation, expert review, and final revision of all figures were carried out exclusively by Angela Lausch. The AI system was used solely for graphical visualisation and not for scientific analysis, interpretation, or the generation of scientific conclusions.
Conflicts of Interest
The authors declare no conflicts of interest.
Abbreviations
| AI | Artificial Intelligence |
| ALKIS | Official Real Estate Cadastre Information System |
| BBSR | Federal Institute for Research on Building |
| CLMS | Copernicus Land Monitoring Service |
| DLR | German Aerospace Center |
| ET | Evapotranspiration |
| INKAR | Indicators and Maps for Spatial and Urban Development |
| IoT | Internet of Things |
| LST | Land Surface Temperature |
| LUCAS | Land Use/Cover Area Frame Survey |
| MODIS | Moderate Resolution Imaging Spectroradiometer |
| OSM | OpenStreetMap |
| OBIA | Object-Based Image Analysis |
| RS | Remote Sensing |
| SAR | Synthetic Aperture Radar |
| SDGs | Sustainable Development Goals |
| UAV | Unmanned Aerial Vehicle |
| UBA | Federal Environment Agency (Germany) |
| U-LUI | Urban Land Use Intensity |
| VIIRS | Visible Infrared Imaging Radiometer Suite |
| VHR | Very High Resolution |
Appendix A
Table A1.
Conceptual differentiation of urban land use intensity (U-LUI) from related urban concepts and dimensions. The definitional classification also clarifies that U-LUI is empirically linked to existing monitoring programmes. Section 2.3 therefore provides an overview of national, European and global data sources relevant to observing urban land use processes and intensities.
Table A2.
National (Germany), European and global monitoring programmes relevant to urban land use intensity (U-LUI), including observation scales and intended application contexts.
Table A3.
Monitoring datasets and programmes relevant for urban land use intensity (U-LUI) across German, European and global scales.
Table A4.
High-spatial-resolution satellite missions, including the sensor/type, spatial resolution, spectral bands/type, availability, launch date and mission.
Table A5.
Examples of indicators for monitoring urban land use intensity (U-LUI), remote sensing (RS) sensors and categorisation of RS detectability, along with references.
References
- Pradana, M.R.; Dimyati, M. Tracking Urban Sprawl: A Systematic Review and Bibliometric Analysis of Spatio-Temporal Patterns Using Remote Sensing and GIS. Eur. J. Geogr. 2024, 15, 190–203. [Google Scholar] [CrossRef] [Scilit]
- Grimm, N.B.; Faeth, S.H.; Golubiewski, N.E.; Redman, C.L.; Wu, J.; Bai, X.; Briggs, J.M. Global Change and the Ecology of Cities. Science 2008, 319, 756–760. [Google Scholar] [CrossRef] [Scilit] [PubMed]
- Seto, K.C.; Güneralp, B.; Hutyra, L.R. Global forecasts of urban expansion to 2030 and direct impacts on biodiversity and carbon pools. Proc. Natl. Acad. Sci. USA 2012, 109, 16083–16088. [Google Scholar] [CrossRef] [Scilit] [PubMed]
- Erb, K.H.; Haberl, H.; Jepsen, M.R.; Kuemmerle, T.; Lindner, M.; Müller, D.; Verburg, P.H.; Reenberg, A. A conceptual framework for analysing and measuring land-use intensity. Curr. Opin. Environ. Sustain. 2013, 5, 464–470. [Google Scholar] [CrossRef] [Scilit] [PubMed]
- Kuemmerle, T.; Erb, K.; Meyfroidt, P.; Mu, D.; Verburg, P.H.; Estel, S.; Haberl, H.; Hostert, P.; Jepsen, M.R.; Kastner, T.; et al. Challenges and opportunities in mapping land use intensity globally. Environ. Sustain. 2013, 5, 484–493. [Google Scholar] [CrossRef] [Scilit]
- Weng, Q. Remote sensing of impervious surfaces in the urban areas: Requirements, methods, and trends. Remote Sens. Environ. 2012, 117, 34–49. [Google Scholar] [CrossRef] [Scilit]
- Xu, F.; Cao, X.; Chen, X.; Somers, B. Mapping impervious surface fractions using automated Fisher transformed unmixing. Remote Sens. Environ. 2019, 232, 111311. [Google Scholar] [CrossRef] [Scilit]
- Gong, P.; Li, X.; Wang, J.; Bai, Y.; Chen, B.; Hu, T.; Liu, X.; Xu, B.; Yang, J.; Zhang, W.; et al. Annual maps of global artificial impervious area (GAIA) between 1985 and 2018. Remote Sens. Environ. 2020, 236, 111510. [Google Scholar] [CrossRef] [Scilit]
- Zhang, X.; Liu, L.; Zhao, T.; Gao, Y.; Chen, X.; Mi, J. GISD30: Global 30 m impervious-surface dynamic dataset from 1985 to 2020 using time-series Landsat imagery on the Google Earth Engine platform. Earth Syst. Sci. Data 2022, 14, 1831–1856. [Google Scholar] [CrossRef] [Scilit]
- Parekh, J.R.; Poortinga, A.; Bhandari, B.; Mayer, T.; Saah, D.; Chishtie, F. Automatic Detection of Impervious Surfaces from Remotely Sensed Data Using Deep Learning. Remote Sens. 2021, 13, 3166. [Google Scholar] [CrossRef] [Scilit]
- Wu, W.; Ma, J.; Banzhaf, E.; Meadows, M.E.; Yu, Z.; Guo, F.; Sengupta, D.; Cai, X.; Zhao, B. A first Chinese building height estimate at 10 m resolution (CNBH-10 m) using multi-source earth observations and machine learning. Remote Sens. Environ. 2023, 291, 113578. [Google Scholar] [CrossRef] [Scilit]
- Wang, S.; Fang, C.; Wang, Y.; Huang, Y.; Ma, H. Quantifying the relationship between urban development intensity and carbon dioxide emissions using a panel data analysis. Ecol. Indic. 2015, 49, 121–131. [Google Scholar] [CrossRef] [Scilit]
- Banzhaf, E.; Bulley, H.N.; Inkoom, J.N.; Elze, S. Mapping Open Data and Big Data to Address Climate Resilience of Urban Informal Settlements in Sub-Saharan Africa. Climate 2022, 10, 186. [Google Scholar] [CrossRef] [Scilit]
- Chen, L.; Chen, M.; Zhang, X.; Xian, Y. Evaluating inequality divides in urban development intensity between the Global North and South. Land Use Policy 2024, 145, 107291. [Google Scholar] [CrossRef] [Scilit]
- de la Barrera, F.; Reyes-Paecke, S.; Banzhaf, E. Indicators for green spaces in contrasting urban settings. Ecol. Indic. 2016, 62, 212–219. [Google Scholar] [CrossRef] [Scilit]
- Xia, C.; Yeh, A.G.-O.; Zhang, A. Analyzing spatial relationships between urban land use intensity and urban vitality at street block level: A case study of five Chinese megacities. Landsc. Urban Plan. 2020, 193, 103669. [Google Scholar] [CrossRef] [Scilit]
- Yin, J.; Dong, J.; Hamm, N.A.S.; Li, Z.; Wang, J.; Xing, H.; Fu, P. Integrating remote sensing and geospatial big data for urban land use mapping: A review. Int. J. Appl. Earth Obs. Geoinf. 2021, 103, 102514. [Google Scholar] [CrossRef] [Scilit]
- Huang, X.; Yang, J.; Li, J.; Wen, D. Urban functional zone mapping by integrating high spatial resolution nighttime light and daytime multi-view imagery. ISPRS J. Photogramm. Remote Sens. 2021, 175, 403–415. [Google Scholar] [CrossRef] [Scilit]
- Stilla, U.; Xu, Y. Change detection of urban objects using 3D point clouds: A review. ISPRS J. Photogramm. Remote Sens. 2023, 197, 228–255. [Google Scholar] [CrossRef] [Scilit]
- Voogta, J.A.; Oke, T.R. Thermal remote sensing of urban climates. Remote Sens. Environ. 2003, 86, 370–384. [Google Scholar] [CrossRef] [Scilit]
- Kabisch, N.; Selsam, P.; Kirsten, T.; Lausch, A.; Bumberger, J. A multi-sensor and multi-temporal remote sensing approach to detect land cover change dynamics in heterogeneous urban landscapes. Ecol. Indic. 2019, 99, 273–282. [Google Scholar]
- Banzhaf, E.; Wu, W.; Luo, X.; Knopp, J. Integrated Mapping of Spatial Urban Dynamics—A European-Chinese Exploration. Part 1—Methodology for Automatic Land Cover Classification Tailored towards Spatial Allocation of Ecosystem Services Features. Remote Sens. 2021, 13, 1744. [Google Scholar] [CrossRef] [Scilit]
- Wu, W.; Ma, J.; Meadows, M.E.; Banzhaf, E.; Huang, T.; Liu, Y.; Zhao, B. Spatio-temporal changes in urban green space in 107 Chinese cities (1990–2019): The role of economic drivers and policy. Int. J. Appl. Earth Obs. Geoinf. 2021, 103, 102525. [Google Scholar] [CrossRef] [Scilit]
- Recla, M.; Schmitt, M. The SAR2Height framework for urban height map reconstruction from single SAR intensity images. ISPRS J. Photogramm. Remote Sens. 2024, 211, 104–120. [Google Scholar] [CrossRef] [Scilit]
- Yu, D.; Fang, C. Urban Remote Sensing with Spatial Big Data: A Review and Renewed Perspective of Urban Studies in Recent Decades. Remote Sens. 2023, 15, 1307. [Google Scholar] [CrossRef] [Scilit]
- Li, J.; Hong, D.; Gao, L.; Yao, J.; Zheng, K.; Zhang, B.; Chanussot, J. Deep learning in multimodal remote sensing data fusion: A comprehensive review. Int. J. Appl. Earth Obs. Geoinf. 2022, 112, 102926. [Google Scholar] [CrossRef] [Scilit]
- Wellmann, T.; Haase, D.; Knapp, S.; Salbach, C.; Selsam, P.; Lausch, A. Urban land use intensity assessment: The potential of spatio-temporal spectral traits with remote sensing. Ecol. Indic. 2018, 85, 190–203. [Google Scholar] [CrossRef] [Scilit]
- Xie, C.; Wang, J.; Haase, D.; Wellmann, T.; Lausch, A. Measuring spatio-temporal heterogeneity and interior characteristics of green spaces in urban neighborhoods: A new approach using gray level co-occurrence matrix. Sci. Total Environ. 2023, 855, 158608. [Google Scholar] [PubMed]
- Lausch, A.; Selsam, P.; Pause, M.; Bumberger, J. Monitoring vegetation- and geodiversity with remote sensing and traits. Philos. Trans. R. Soc. A Math. Phys. Eng. Sci. 2024, 382, 20230058. [Google Scholar] [CrossRef] [Scilit]
- Lausch, A.; Bumberger, J.; Jung, A.; Pause, M.; Selsam, P.; Zhou, T.; Herzog, F. Monitoring Agricultural Land Use Intensity with Remote Sensing and Traits. Agriculture 2025, 15, 2233. [Google Scholar] [CrossRef] [Scilit]
- Wang, L.; Zhang, S.; Tang, L.; Lu, Y.; Liu, Y.; Liu, Y. Optimizing distribution of urban land on the basis of urban land use intensity at prefectural city scale in mainland China. Land Use Policy 2022, 115, 106037. [Google Scholar] [CrossRef] [Scilit]
- Yang, J.; Jin, G.; Huang, X.; Chen, K.; Meng, H. How to Measure Urban Land Use Intensity? A Perspective of Multi-Objective Decision in Wuhan Urban Agglomeration, China. Sustainability 2018, 10, 3874. [Google Scholar] [CrossRef] [Scilit]
- Zhou, H.; Yuan, J.; Yi, D.; Jin, S.; Zhao, Y.; Zhang, Z.; Zhao, Z.; Zhang, J. A novel dynamic quantification model for diurnal urban land use intensity. Cities 2024, 148, 104861. [Google Scholar] [CrossRef] [Scilit]
- Shen, D.; Hong, Y.; Ma, L. The spatiotemporal evolution and spatial effect of digitalization on urban land intensive use in the Yangtze River Economic Belt. Humanit. Soc. Sci. Commun. 2025, 12, 864. [Google Scholar] [CrossRef] [Scilit]
- Luo, X.; Niu, S.; Li, X.; Jing, L.; Qin, J. Urban Spatial Blessing: Effect of Land Use Intensity on Human Development Index. Land 2025, 14, 1085. [Google Scholar] [CrossRef] [Scilit]
- Diogo, V.; Helfenstein, J.; Mohr, F.; Varghese, V.; Debonne, N.; Levers, C.; Swart, R.; Sonderegger, G.; Nemecek, T.; Schader, C.; et al. Developing context-specific frameworks for integrated sustainability assessment of agricultural intensity change: An application for Europe. Environ. Sci. Policy 2022, 137, 128–142. [Google Scholar] [CrossRef] [Scilit]
- Esch, T.; Heldens, W.; Hirner, A.; Keil, M.; Marconcini, M.; Roth, A.; Zeidler, J.; Dech, S.; Strano, E. Breaking new ground in mapping human settlements from space—The Global Urban Footprint. ISPRS J. Photogramm. Remote Sens. 2017, 134, 30–42. [Google Scholar]
- Bennett, M.M.; Smith, L.C. Advances in using multitemporal night-time lights satellite imagery to detect, estimate, and monitor socioeconomic dynamics. Remote Sens. Environ. 2017, 192, 176–197. [Google Scholar] [CrossRef] [Scilit]
- Tan, X.; Zhang, J.; Chen, J.; Wei, T.; Zhu, X. Beyond static brightness: Daily nighttime light fluctuations enrich nighttime vitality evaluation for urban zones. Sustain. Cities Soc. 2026, 136, 107043. [Google Scholar]
- Kennedy, C.; Pincetl, S.; Bunje, P. The study of urban metabolism and its applications to urban planning and design. Environ. Pollut. 2011, 159, 1965–1973. [Google Scholar] [CrossRef] [Scilit] [PubMed]
- Huovila, A.; Bosch, P.; Airaksinen, M. Comparative analysis of standardized indicators for Smart sustainable cities: What indicators and standards to use and when? Cities 2019, 89, 141–153. [Google Scholar] [CrossRef] [Scilit]
- Ramdhoni, S.; Rushayati, S.B.; Prasetyo, L.B. Open Green Space Development Priority Based on Distribution of air Temperature Change in Capital City of Indonesia, Jakarta. Procedia Environ. Sci. 2016, 33, 204–213. [Google Scholar] [CrossRef] [Scilit]
- Banzhaf, E.; Bause, I.; Helbig, C.; Elze, S. Personal Exposure to Environmental Pressures in Different Urban Residential Structures Linking Fieldwork and RS Mapping. IEEE J. Sel. Top. Appl. Earth Obs. Remote Sens. 2024, 17, 2789–2799. [Google Scholar]
- Maudet, S.; Brusse, T.; Poss, B.; Caro, G.; Marrec, R. Estimating landscape intensity through farming practices: An integrative and flexible approach to modelling farming intensity from field to landscape. Ecol. Model. 2025, 501, 110975. [Google Scholar]
- Asner, G.P.; Martin, R.E.; Anderson, C.B.; Knapp, D.E. Quantifying forest canopy traits: Imaging spectroscopy versus field survey. Remote Sens. Environ. 2015, 158, 15–27. [Google Scholar] [CrossRef] [Scilit]
- Asner, G.P.; Martin, R.E. Spectranomics: Emerging science and conservation opportunities at the interface of biodiversity and remote sensing. Glob. Ecol. Conserv. 2016, 8, 212–219. [Google Scholar] [CrossRef] [Scilit]
- Aneece, I.; Thenkabail, P.S. New Generation Hyperspectral Sensors DESIS and PRISMA Provide Improved Agricultural Crop Classifications. Photogramm. Eng. Remote Sens. 2022, 88, 715–729. [Google Scholar] [CrossRef] [Scilit]
- Guanter, L.; Kaufmann, H.; Segl, K.; Foerster, S.; Rogass, C.; Chabrillat, S.; Kuester, T.; Hollstein, A.; Rossner, G.; Chlebek, C.; et al. The EnMAP Spaceborne Imaging Spectroscopy Mission for Earth Observation. Remote Sens. 2015, 7, 8830–8857. [Google Scholar] [CrossRef] [Scilit]
- Storch, T.; Honold, H.; Chabrillat, S.; Habermeyer, M.; Tucker, P.; Brell, M.; Ohndorf, A.; Wirth, K.; Betz, M.; Kuchler, M.; et al. The EnMAP imaging spectroscopy mission towards operations. Remote Sens. Environ. 2023, 294, 113632. [Google Scholar] [CrossRef] [Scilit]
- Nieke, J.; Rast, M. Towards the Copernicus Hyperspectral Imaging Mission For The Environment (CHIME). In Proceedings of the IGARSS 2019—2019 IEEE International Geoscience and Remote Sensing Symposium, Yokohama, Japan, 28 July–2 August 2018; pp. 157–159. [Google Scholar]
- Miller, D.L.; Alonzo, M.; Roberts, D.A.; Tague, C.L.; McFadden, J.P. Drought response of urban trees and turfgrass using airborne imaging spectroscopy. Remote Sens. Environ. 2020, 240, 111646. [Google Scholar] [CrossRef] [Scilit]
- Leisenheimer, L.; Wellmann, T.; Jänicke, C.; Haase, D. Monitoring drought impacts on street trees using remote sensing—Disentangling temporal and species-specific response patterns with Sentinel-2 imagery. Ecol. Inform. 2024, 82, 102659. [Google Scholar]
- Capener, A.M.; Sowby, R.B.; Williams, G.P. Pathways to Enhancing Analysis of Irrigation by Remote Sensing (AIRS) in Urban Settings. Sustainability 2023, 15, 12676. [Google Scholar] [CrossRef] [Scilit]
- González-Marín, A.; Garrido-Cumbrera, M. Assessing urban vegetation inequalities: Methodological insights and evidence. Ecol. Inform. 2025, 86, 102987. [Google Scholar] [CrossRef] [Scilit]
- Shahtahmassebi, A.R.; Li, C.; Fan, Y.; Wu, Y.; Lin, Y.; Gan, M.; Wang, K.; Malik, A.; Blackburn, G.A. Remote sensing of urban green spaces: A review. Urban For. Urban Green. 2021, 57, 126946. [Google Scholar] [CrossRef] [Scilit]
- Zaitunah, A.; Samsuri, S.; Silitonga, A.F.; Syaufina, L. Urban Greening Effect on Land Surface Temperature. Sensors 2022, 22, 4168. [Google Scholar] [CrossRef] [Scilit] [PubMed]
- Duan, X.; Haseeb, M.; Tahir, Z.; Mahmood, S.A.; Tariq, A.; Jamil, A.; Ullah, S.; Abdullah-Al-Wadud, M. A geospatial and statistical analysis of land surface temperature in response to land use land cover changes and urban heat island dynamics. Sci. Rep. 2025, 15, 4943. [Google Scholar] [CrossRef] [Scilit] [PubMed]
- Chang, Y.; Xiao, J.; Li, X.; Weng, Q. Monitoring diurnal dynamics of surface urban heat island for urban agglomerations using ECOSTRESS land surface temperature observations. Sustain. Cities Soc. 2023, 98, 104833. [Google Scholar] [CrossRef] [Scilit]
- Fisher, J.B.; Lee, B.; Purdy, A.J.; Halverson, G.H.; Dohlen, M.B.; Cawse-Nicholson, K.; Wang, A.; Anderson, R.G.; Aragon, B.; Arain, M.A.; et al. ECOSTRESS: NASA’s Next Generation Mission to Measure Evapotranspiration From the International Space Station. Water Resour. Res. 2020, 56, e2019WR026058. [Google Scholar]
- Spengler, D.; Benvenuto, R.; Tempel, B.; Leismann, T.; Mittermaier, C.; Bierdel, M.; Menne, T.; Tanouti, I.; Welling, C.; Gulde, M. constellr High-precision Versatile Ecosphere (HiVE) Thermal Mission:Technical Overview and Application Insights. Remote Sens. Commun. 2025, 1, 1–3. [Google Scholar]
- Bird, D.N.; Banzhaf, E.; Knopp, J.; Wu, W.; Jones, L. Combining Spatial and Temporal Data to Create a Fine-Resolution Daily Urban Air Temperature Product from Remote Sensing Land Surface Temperature (LST) Data. Atmosphere 2022, 13, 1152. [Google Scholar] [CrossRef] [Scilit]
- Cetin, M.; Ozenen Kavlak, M.; Senyel Kurkcuoglu, M.A.; Bilge Ozturk, G.; Cabuk, S.N.; Cabuk, A. Determination of land surface temperature and urban heat island effects with remote sensing capabilities: The case of Kayseri, Türkiye. Nat. Hazards 2024, 120, 5509–5536. [Google Scholar] [CrossRef] [Scilit]
- Zhao, L.; Fan, X.; Hong, T. Urban Heat Island Effect: Remote Sensing Monitoring and Assessment—Methods, Applications, and Future Directions. Atmosphere 2025, 16, 791. [Google Scholar] [CrossRef] [Scilit]
- Yuan, Y.; Santamouris, M.; Xu, D.; Geng, X.; Li, C.; Cheng, W.; Su, L.; Xiong, P.; Fan, Z.; Wang, X.; et al. Surface urban heat island effects intensify more rapidly in lower income countries. npj Urban Sustain. 2025, 5, 11. [Google Scholar] [CrossRef] [Scilit]
- Zhang, X.; Zhang, J. Exploring the Impact of Urban Characteristics on Diurnal Land Surface Temperature Based on LCZ and Machine Learning. Land 2025, 14, 1813. [Google Scholar] [CrossRef] [Scilit]
- Fang, T.; Hu, W.; Yan, C.; Zhang, C.; Wang, B.; Hayat, M.; Qiu, G.Y. Observed evaporative cooling of urban trees and lawns during heatwaves. Nat. Cities 2025, 2, 1183–1193. [Google Scholar] [CrossRef] [Scilit]
- Wu, W.; Guo, F.; Elze, S.; Knopp, J.; Banzhaf, E. Deciphering the effects of 2D/3D urban morphology on diurnal cooling efficiency of urban green space. Build. Environ. 2024, 266, 112047. [Google Scholar] [CrossRef] [Scilit]
- Román, M.O.; Wang, Z.; Sun, Q.; Kalb, V.; Miller, S.D.; Molthan, A.; Schultz, L.; Bell, J.; Stokes, E.C.; Pandey, B.; et al. NASA’s Black Marble nighttime lights product suite. Remote Sens. Environ. 2018, 210, 113–143. [Google Scholar]
- Dermosinoglou, A.; Petropoulos, G.P. Exploring long term Impervious Surface Areas (ISA) dynamics using Landsat imagery, Μachine Learning and GEE: The case of Attica, Greece. Remote Sens. Appl. Soc. Environ. 2024, 36, 101338. [Google Scholar] [CrossRef] [Scilit]
- Almohamad, H.; Alshwesh, I.O. Evaluation of Index-Based Methods for Impervious Surface Mapping from Landsat-8 to Cities in Dry Climates; A Case Study of Buraydah City, KSA. Sustainability 2023, 15, 9704. [Google Scholar] [CrossRef] [Scilit]
- He, S.; Zhu, L.; Li, Y.; Xia, Q.; Zheng, Q.; Wang, Z.; Zou, X. A comparative analysis of machine learning-based methods for impervious surface mapping using SAR and optical data. Geocarto Int. 2025, 40, 2521833. [Google Scholar] [CrossRef] [Scilit]
- De Luca, G.; Pancorbo, J.L.; Carotenuto, F.; Gioli, B.; Modica, G.; Genesio, L. PRISMA imaging for land covers and surface materials composition in urban and rural areas adopting multiple endmember spectral mixture analysis (MESMA). ISPRS J. Photogramm. Remote Sens. 2025, 225, 196–220. [Google Scholar] [CrossRef] [Scilit]
- Gámez García, J.A.; Lazzeri, G.; Tapete, D. Airborne and Spaceborne Hyperspectral Remote Sensing in Urban Areas: Methods, Applications, and Trends. Remote Sens. 2025, 17, 3126. [Google Scholar] [CrossRef] [Scilit]
- Cavalli, R.M. Capability of Remote Sensing Images to Distinguish the Urban Surface Materials: A Case Study of Venice City. Remote Sens. 2021, 13, 3959. [Google Scholar] [CrossRef] [Scilit]
- Che, Y.; Li, X.; Liu, X.; Wang, Y.; Liao, W.; Zheng, X.; Zhang, X.; Xu, X.; Shi, Q.; Zhu, J.; et al. 3D-GloBFP: The first global three-dimensional building footprint dataset. Earth Syst. Sci. Data 2024, 16, 5357–5374. [Google Scholar]
- Li, R.; Sun, T.; Ghaffarian, S.; Tsamados, M.; Ni, G. GLAMOUR: GLobAl building MOrphology dataset for URban hydroclimate modelling. Sci. Data 2024, 11, 618. [Google Scholar] [CrossRef] [Scilit] [PubMed]
- Gümüş, M.G.; Gümüş, K. Assessment of the impact of impervious surface increase on urban heat island and vegetation by remote sensing and statistical analysis: The case of Türkiye/Niğde city center (2013–2024). Turk. J. Remote Sens. 2025, 7, 69–90. [Google Scholar] [CrossRef] [Scilit]
- Suran, N.A.; Shafri, H.Z.M.; Shaharum, N.S.N.; Radzali, N.A.W.M.; Kumar, V. UAV-BASED HYPERSPECTRAL DATA ANALYSIS FOR URBAN AREA MAPPING. Int. Arch. Photogramm. Remote Sens. Spat. Inf. Sci. 2019, XLII-4/W16, 621–626. [Google Scholar] [CrossRef] [Scilit]
- Batty, M. The New Science of Cities; MIT Press: Cambridge, MA, USA; London, UK, 2013; ISBN 978-0-262-01952-1. [Google Scholar]
- Pesaresi, M.; Ehrlich, D.; Florczyk, A.J.; Freire, S.; Julea, A.; Kemper, T.; Syrris, V. The global human settlement layer from landsat imagery. In Proceedings of the 2016 IEEE International Geoscience and Remote Sensing Symposium (IGARSS); IEEE: Piscataway, NJ, USA, 2016; pp. 7276–7279. [Google Scholar]
- Pesaresi, M.; Schiavina, M.; Politis, P.; Freire, S.; Krasnodębska, K.; Uhl, J.H.; Carioli, A.; Corbane, C.; Dijkstra, L.; Florio, P.; et al. Advances on the Global Human Settlement Layer by joint assessment of Earth Observation and population survey data. Int. J. Digit. Earth 2024, 17, 2366862. [Google Scholar] [CrossRef] [Scilit]
- Coeurdacier, N.; Oswald, F.; Teignier, M. Structural Change, Land Use and Urban Expansion. Rev. Econ. Stud. 2025, 1–41. [Google Scholar] [CrossRef] [Scilit]
- Zhu, Z.; Woodcock, C.E. Continuous change detection and classification of land cover using all available Landsat data. Remote Sens. Environ. 2014, 144, 152–171. [Google Scholar] [CrossRef] [Scilit]
- Kennedy, R.E.; Yang, Z.; Cohen, W.B. Detecting trends in forest disturbance and recovery using yearly Landsat time series: 1. LandTrendr—Temporal segmentation algorithms. Remote Sens. Environ. 2010, 114, 2897–2910. [Google Scholar] [CrossRef] [Scilit]
- Oliveira, V.; Porta, S. Quantitative and qualitative analysis in urban morphology: Systematic legacy and latest developments. Proc. Inst. Civ. Eng.-Urban Des. Plan. 2025, 178, 75–87. [Google Scholar] [CrossRef] [Scilit]
- Zhu, X.X.; Qiu, C.; Hu, J.; Shi, Y.; Wang, Y.; Schmitt, M.; Taubenböck, H. The urban morphology on our planet—Global perspectives from space. Remote Sens. Environ. 2022, 269, 112794. [Google Scholar] [PubMed]
- Li, K.; Zeng, H. Multidisciplinary parameters for characterizing the 3D urban morphology: An overview based on the relational perspective. Sustain. Cities Soc. 2024, 106, 105364. [Google Scholar] [CrossRef] [Scilit]
- Tümtürk, O. Multiple pathways to urban density: A comparative diachronic analysis of building type transitions across three city centers. Cities 2025, 167, 106308. [Google Scholar] [CrossRef] [Scilit]
- Yang, C.; Huang, Q.; Xian, Q.; Yuan, M.; Cong, X.; Xun, L.; Cheng, J.; Pan, H. Evolution paths of urban forms influenced by landforms: Asynchrony but convergence. Ecol. Indic. 2025, 170, 113127. [Google Scholar] [CrossRef] [Scilit]
- Lois González, R.C.; Ulloa, B.M.; Otón, M.P. The underground of European cities in planning documents: The case of A Coruña (Spain). Procedia Eng. 2017, 209, 42–48. [Google Scholar] [CrossRef] [Scilit]
- Hou, F.; Rui, X.; Fan, X.; Zhang, H. Review of GPR Activities in Civil Infrastructures: Data Analysis and Applications. Remote Sens. 2022, 14, 5972. [Google Scholar] [CrossRef] [Scilit]
- Lombardi, F.; Podd, F.; Solla, M. From Its Core to the Niche: Insights from GPR Applications. Remote Sens. 2022, 14, 3033. [Google Scholar] [CrossRef] [Scilit]
- Morley, A.M.; Mather, T.A.; Pyle, D.M.; Kendall, J. Detecting shallow subsurface anomalies with airborne and spaceborne remote sensing: A review. Sci. Remote Sens. 2025, 11, 100187. [Google Scholar]
- Masini, N.; Gizzi, F.T.; Biscione, M.; Fundone, V.; Sedile, M.; Sileo, M.; Pecci, A.; Lacovara, B.; Lasaponara, R. Medieval Archaeology Under the Canopy with LiDAR. The (Re)Discovery of a Medieval Fortified Settlement in Southern Italy. Remote Sens. 2018, 10, 1598. [Google Scholar]
- Chen, F.; Ma, P.; Chen, S.; Hu, Q.; Guo, H. Remote sensing for cultural heritage: A systematic review. Int. J. Appl. Earth Obs. Geoinf. 2026, 146, 105039. [Google Scholar] [CrossRef] [Scilit]
- Pasternak, K.; Fryśkowska-Skibniewska, A. Automated analysis of Slavic buried settlements based on LiDAR point cloud, UAV and image processing. J. Cult. Herit. 2025, 73, 305–316. [Google Scholar] [CrossRef] [Scilit]
- Meng, Y.; Sing Wong, M.; Kwan, M.; Pearce, J.; Feng, Z. Assessing multi-spatial driving factors of urban land use transformation in megacities: A case study of Guangdong–Hong Kong–Macao Greater Bay Area from 2000 to 2018. Geo-Spat. Inf. Sci. 2024, 27, 1090–1106. [Google Scholar]
- Huo, K.; Qin, R.; Zhao, J.; Ma, X. Long-term tracking of urban structure and analysis of its impact on urban heat stress: A case study of Xi’an, China. Ecol. Indic. 2025, 174, 113418. [Google Scholar] [CrossRef] [Scilit]
- Wu, W.; Luo, X.; Knopp, J.; Jones, L.; Banzhaf, E. A European-Chinese Exploration: Part 2—Urban Ecosystem Service Patterns, Processes, and Contributions to Environmental Equity under Different Scenarios. Remote Sens. 2022, 14, 3488. [Google Scholar] [CrossRef] [Scilit]
- Petit, S.; Stasolla, M.; Wyard, C.; Swinnen, G.; Neyt, X.; Hallot, E. A New Earth Observation Service Based on Sentinel-1 and Sentinel-2 Time Series for the Monitoring of Redevelopment Sites in Wallonia, Belgium. Land 2022, 11, 360. [Google Scholar] [CrossRef] [Scilit]
- Zheng, Q.; Seto, K.C.; Zhou, Y.; You, S.; Weng, Q. Nighttime light remote sensing for urban applications: Progress, challenges, and prospects. ISPRS J. Photogramm. Remote Sens. 2023, 202, 125–141. [Google Scholar] [CrossRef] [Scilit]
- Jin, D.; Choi, S. Evaluating Small-Scale Urban Regeneration Using Nighttime Lights and Sentinel-2: Evidence from Republic of Korea. Urban Sci. 2026, 10, 36. [Google Scholar] [CrossRef] [Scilit]
- Jurkowski, W.; Latocha-Wites, A.; Grochowska, A. Landscape effects of urbanisation in a post-socialist city. A case study of Wrocław (Poland). Cities 2024, 145, 104730. [Google Scholar] [CrossRef] [Scilit]
- Gerten, C.; Boyko, D.; Fina, S. Patterns of Post-socialist Urban Development in Russia and Germany. Front. Sustain. Cities 2022, 4, 875176. [Google Scholar] [CrossRef] [Scilit]
- Zhang, Y.; Zhao, L.; Zhao, H.; Gao, X. Urban development trend analysis and spatial simulation based on time series remote sensing data: A case study of Jinan, China. PLoS ONE 2021, 16, e0257776. [Google Scholar] [CrossRef] [Scilit] [PubMed]
- Tomkiewicz, P.; Jaworski, J.; Zielonka, P.; Wilinski, A. K-means Enhanced Density Gradient Analysis for Urban and Transport Metrics Using Multi-Modal Satellite Imagery. arXiv 2025, arXiv:2504.1112. [Google Scholar]
- Koroso, N.H. Urban land policy and urban land use efficiency: An analysis based on remote sensing and institutional credibility thesis. Land Use Policy 2023, 132, 106827. [Google Scholar] [CrossRef] [Scilit]
- Bennett, R.; Van Oosterom, P.; Lemmen, C.; Koeva, M. Remote Sensing for Land Administration. Remote Sens. 2020, 12, 2497. [Google Scholar] [CrossRef] [Scilit]
- Manapragada, N.V.S.K.; Mandelmilch, M.; Roitberg, E.; Kizel, F.; Natanian, J. Remote Sensing Applications: Society and Environment Remote sensing for environmentally responsive urban built environment: A review of tools, methods and gaps. Remote Sens. Appl. Soc. Environ. 2025, 38, 101529. [Google Scholar]
- Wu, H.; Qin, Y.; Dunchev, D.; Che, S.; Ivanova, B. Urban climate risk assessment under climate and land use changes impact: A multi-dimensional approach. Urban Clim. 2025, 61, 102379. [Google Scholar] [CrossRef] [Scilit]
- Gong, Y.; Li, X.; Li, D.; Zhang, X. Urban recovery patterns after the 2023 Turkey-Syria earthquake revealed by SDGSAT-1 nighttime light data. Remote Sens. Environ. 2025, 328, 114888. [Google Scholar] [CrossRef] [Scilit]
- Yang, J.; Chen, S.; Wang, Z.; Zhang, Y.; Suo, Y.; Zhu, J.; Wu, M.; Zhang, A.; Li, Q. Post-Earthquake Damage and Recovery Assessment Using Nighttime Light Data: A Case Study of the Turkey–Syria Earthquake. Remote Sens. 2025, 17, 3431. [Google Scholar] [CrossRef] [Scilit]
- Ali, Y.; Afnan, J.; Jannat, M.; Uddin, M.M. Assessing alteration of urban floodplains using remote sensing and GIS: A three decade analysis (1992–2022). Geol. Ecol. Landsc. 2025, 1–16. [Google Scholar] [CrossRef] [Scilit]
- Chen, W.; Lei, Y.; Qi, L.; Zheng, J.; Huang, G.; Wang, H. Understanding the evolution trend of urban flood risk and resilience for better flood management. Ecol. Indic. 2024, 169, 112829. [Google Scholar] [CrossRef] [Scilit]
- Sánchez-Cordero, F.; Nanía, L.; Hidalgo-García, D.; López-Chacón, S.R. Assessing the Spatial Benefits of Green Roofs to Mitigate Urban Heat Island Effects in a Semi-Arid City: A Case Study in Granada, Spain. Remote Sens. 2025, 17, 2073. [Google Scholar] [CrossRef] [Scilit]
- Herold, M.; Scepan, J.; Clarke, K.C. The Use of Remote Sensing and Landscape Metrics to Describe Structures and Changes in Urban Land Uses. Environ. Plan. A Econ. Space 2002, 34, 1443–1458. [Google Scholar] [CrossRef] [Scilit]
- Braun, A.; Warth, G.; Bachofer, F.; Schultz, M.; Hochschild, V. Mapping Urban Structure Types Based on Remote Sensing Data—A Universal and Adaptable Framework for Spatial Analyses of Cities. Land 2023, 12, 1885. [Google Scholar] [CrossRef] [Scilit]
- Zhou, H.; Wang, K.; Bai, Y.; Yuan, J.; Zhao, Y.; Zhang, J. Identifying urban land use through higher-order spatial interactions. Int. J. Digit. Earth 2024, 17, 2330664. [Google Scholar] [CrossRef] [Scilit]
- Lausch, A.; Menz, G. Bedeutung der Integration linearer Elemente in Fernerkundungsdaten zur Berechnung von Landschaftsstrukturmaßen. Photogramm. Fernerkund. Geoinf. 1999, 3, 185–194. [Google Scholar]
- Saura, S. Effects of remote sensor spatial resolution and data aggregation on selected fragmentation indices. Landsc. Ecol. 2004, 19, 197–209. [Google Scholar] [CrossRef] [Scilit]
- Markham, K.; Frazier, A.E.; Singh, K.K.; Madden, M. A review of methods for scaling remotely sensed data for spatial pattern analysis. Landsc. Ecol. 2023, 38, 619–635. [Google Scholar]
- Banzhaf, E.; Kollai, H.; Kindler, A. Mapping urban grey and green structures for liveable cities using a 3D enhanced OBIA approach and vital statistics. Geocarto Int. 2020, 35, 623–640. [Google Scholar]
- Elze, S.; Banzhaf, E. High-precision monitoring of urban structures to understand changes in multiple ecosystem services. Urban For. Urban Green. 2022, 73, 127616. [Google Scholar] [CrossRef] [Scilit]
- Stamou, A.; Karachaliou, E.; Tavantzis, I.; Bakousi, A.; Dosiou, A.; Tsifodimou, Z.-E.; Stylianidis, E. Satellite Imagery for Comprehensive Urban Morphology and Surface Roughness Analysis: Leveraging GIS Tools and Google Earth Engine for Sustainable Urban Planning. Urban Sci. 2025, 9, 213. [Google Scholar] [CrossRef] [Scilit]
- Blaschke, T. Object based image analysis for remote sensing. ISPRS J. Photogramm. Remote Sens. 2010, 65, 2–16. [Google Scholar] [CrossRef] [Scilit]
- Selsam, P.; Bumberger, J.; Wellmann, T.; Pause, M.; Gey, R.; Borg, E.; Lausch, A. Ecosystem Integrity Remote Sensing—Modelling and Service Tool—ESIS/Imalys. Remote Sens. 2024, 16, 1139. [Google Scholar] [CrossRef] [Scilit]
- Lausch, A.; Selsam, P.; Bumberger, J. Conceptual framework for hybrid landscape modelling: The pixel–zone–object approach and its theoretical foundations. Ecol. Indic. 2026, 183, 114679. [Google Scholar] [CrossRef] [Scilit]
- Boeing, G. OSMnx: New methods for acquiring, constructing, analyzing, and visualizing complex street networks. Comput. Environ. Urban Syst. 2017, 65, 126–139. [Google Scholar] [CrossRef] [Scilit]
- Bai, L.; Zhang, X.; Wang, H.; Du, S. Integrating remote sensing with OpenStreetMap data for comprehensive scene understanding through multi-modal self-supervised learning. Remote Sens. Environ. 2025, 318, 114573. [Google Scholar]
- Gagliardi, V.; Tosti, F.; Bianchini Ciampoli, L.; Battagliere, M.L.; D’Amato, L.; Alani, A.M.; Benedetto, A. Satellite Remote Sensing and Non-Destructive Testing Methods for Transport Infrastructure Monitoring: Advances, Challenges and Perspectives. Remote Sens. 2023, 15, 418. [Google Scholar] [CrossRef] [Scilit]
- Xie, Z.; Yuan, M.; Zhang, F.; Chen, M.; Shan, J.; Sun, L.; Liu, X. Using Remote Sensing Data and Graph Theory to Identify Polycentric Urban Structure. IEEE Geosci. Remote Sens. Lett. 2023, 20, 5500205. [Google Scholar] [CrossRef] [Scilit]
- Liu, R.; Wu, J.; Lu, W.; Miao, Q.; Zhang, H.; Liu, X.; Lu, Z.; Li, L. A Review of Deep Learning-Based Methods for Road Extraction from High-Resolution Remote Sensing Images. Remote Sens. 2024, 16, 2056. [Google Scholar]
- Yadav, R.; Nascetti, A.; Ban, Y. How high are we? Large-scale building height estimation at 10 m using Sentinel-1 SAR and Sentinel-2 MSI time series. Remote Sens. Environ. 2025, 318, 114556. [Google Scholar]
- Pons, X.; González-Guerrero, O.; Masó, J.; Zabala, A.; Serral, I.; Ninyerola, M. LidarTeam: A remote sensing driven method for massive lidar data to regional DHM refined through user feedback. Int. J. Digit. Earth 2025, 18, 2474084. [Google Scholar] [CrossRef] [Scilit]
- Tarsha Kurdi, F.; Lewandowicz, E.; Gharineiat, Z.; Shan, J. High-Resolution Building Indicator Mapping Using Airborne LiDAR Data. Electronics 2025, 14, 1821. [Google Scholar]
- Knopp, J.M.; Levin, G.; Banzhaf, E. Aerial Data Analysis for Integration Into a Green Cadastre—An Example From Aarhus, Denmark. IEEE J. Sel. Top. Appl. Earth Obs. Remote Sens. 2023, 16, 6545–6555. [Google Scholar] [CrossRef] [Scilit]
- Mutreja, G.; Schuegraf, P.; Bittner, K. HiRes-FusedMIM: A High-Resolution RGB-DSM Pre-trained Model for Building-Level Remote Sensing Applications. arXiv 2025, arXiv:2503.18540. [Google Scholar]
- An, S.M.; Kim, B.; Yi, C.; Eum, J.; Woo, J.; Wende, W. Study on Morphometrical Urban Aerodynamic Roughness Multi-Scale Exploration Using LiDAR Remote Sensing. Remote Sens. 2024, 16, 2418. [Google Scholar]
- Kakooei, M.; Baleghi, Y. Mapping Building Heights at Large Scales Using Sentinel-1 Radar Imagery and Nighttime Light Data. Remote Sens. 2024, 16, 3371. [Google Scholar] [CrossRef] [Scilit]
- Hu, D.; Minner, J. UAVs and 3D City Modeling to Aid Urban Planning and Historic Preservation: A Systematic Review. Remote Sens. 2023, 15, 5507. [Google Scholar] [CrossRef] [Scilit]
- Chajaei, F.; Bagheri, H. LOD1 3D city model from LiDAR: The impact of segmentation accuracy on quality of urban 3D modeling and morphology extraction. Remote Sens. Appl. Soc. Environ. 2025, 38, 101534. [Google Scholar] [CrossRef] [Scilit]
- Ma, X.; Zheng, G.; Xu, C.; Moskal, L.M.; Gong, P.; Guo, Q.; Huang, H.; Li, X.; Liang, X.; Pang, Y.; et al. A global product of 150-m urban building height based on spaceborne lidar. Sci. Data 2024, 11, 1387. [Google Scholar] [CrossRef] [Scilit] [PubMed]
- Wang, X.; Zhou, L.; Song, Y.; López-Carr, D.; Wang, S.; Chen, H.; Gao, H.; Lyu, R.; Sun, Q.; Guo, Z.; et al. Beyond flat cities: Dramatic 2D/3D differences in urban gray–green space configurations and the nonlinear thermal regulation mechanisms. GIScience Remote Sens. 2025, 62, 2505931. [Google Scholar]
- Han, T.; Du, C.; Xie, Y.; Xian, X.; Zhang, X.; Yang, B.; Chen, Y. A 3D perspective for understanding the mechanisms of urban heat island and urban morphology using multi-modal geospatial data and interpretable machine learning. Build. Environ. 2025, 282, 113184. [Google Scholar] [CrossRef] [Scilit]
- Wang, Y.; He, Z.; Zhai, W.; Wang, S.; Zhao, C. How do the 3D urban morphological characteristics spatiotemporally affect the urban thermal environment? A case study of San Antonio. Build. Environ. 2024, 261, 111738. [Google Scholar] [CrossRef] [Scilit]
- Frantz, D.; Schug, F.; Okujeni, A.; Navacchi, C.; Wagner, W.; van der Linden, S.; Hostert, P. National-scale mapping of building height using Sentinel-1 and Sentinel-2 time series. Remote Sens. Environ. 2021, 252, 112128. [Google Scholar] [CrossRef] [Scilit] [PubMed]
- Geis, C.; Leichtle, T.; Wurm, M.; Pelizari, P.A.; Standfus, I.; Zhu, X.X.; So, E.; Siedentop, S.; Esch, T.; Taubenbock, H. Large-Area Characterization of Urban Morphology—Mapping of Built-Up Height and Density Using TanDEM-X and Sentinel-2 Data. IEEE J. Sel. Top. Appl. Earth Obs. Remote Sens. 2019, 12, 2912–2927. [Google Scholar]
- Esch, T.; Brzoska, E.; Dech, S.; Leutner, B.; Palacios-Lopez, D.; Metz-Marconcini, A.; Marconcini, M.; Roth, A.; Zeidler, J. World Settlement Footprint 3D—A first three-dimensional survey of the global building stock. Remote Sens. Environ. 2022, 270, 112877. [Google Scholar] [CrossRef] [Scilit]
- Owen, D.; Fitch, A.; Fletcher, D.; Knopp, J.; Levin, G.; Farley, K.; Banzhaf, E.; Zandersen, M.; Grandin, G.; Jones, L. Opportunities and constraints of implementing the 3–30–300 rule for urban greening. Urban For. Urban Green. 2024, 98, 128393. [Google Scholar] [CrossRef] [Scilit]
- Chen, T.-H.K.; Qiu, C.; Schmitt, M.; Zhu, X.X.; Sabel, C.E.; Prishchepov, A.V. Mapping horizontal and vertical urban densification in Denmark with Landsat time-series from 1985 to 2018: A semantic segmentation solution. arXiv 2020, arXiv:2012.12957. [Google Scholar]
- Anees, M.M.; Mann, D.; Sharma, M.; Banzhaf, E.; Joshi, P.K. Assessment of urban dynamics to understand spatiotemporal differentiation at various scales using remote sensing and geospatial tools. Remote Sens. 2020, 12, 1306. [Google Scholar] [CrossRef] [Scilit]
- Haas, J.; Ban, Y. Sentinel-1A SAR and sentinel-2A MSI data fusion for urban ecosystem service mapping. Remote Sens. Appl. Soc. Environ. 2017, 8, 41–53. [Google Scholar]
- Petrushevsky, N.; Manzoni, M.; Monti-Guarnieri, A. Fast Urban Land Cover Mapping Exploiting Sentinel-1 and Sentinel-2 Data. Remote Sens. 2021, 14, 36. [Google Scholar] [CrossRef] [Scilit]
- Kuras, A.; Brell, M.; Liland, K.H.; Burud, I. Multitemporal Feature-Level Fusion on Hyperspectral and LiDAR Data in the Urban Environment. Remote Sens. 2023, 15, 632. [Google Scholar] [CrossRef] [Scilit]
- Li, Z.; Chen, B.; Wu, S.; Su, M.; Chen, J.M.; Xu, B. Deep learning for urban land use category classification: A review and experimental assessment. Remote Sens. Environ. 2024, 311, 114290. [Google Scholar] [CrossRef] [Scilit]
- Al Mazroa, A.; Maashi, M.; Kouki, F.; Othman, K.M.; Salih, N.; Elfaki, M.A.; S, S.B. An analysis of urban sprawl growth and prediction using remote sensing and machine learning techniques. J. S. Am. Earth Sci. 2024, 142, 104988. [Google Scholar] [CrossRef] [Scilit]
- Xiong, S.; Zhang, X.; Wang, H.; Lei, Y.; Tan, G.; Du, S. Mapping the first dataset of global urban land uses with Sentinel-2 imagery and POI prompt. Remote Sens. Environ. 2025, 327, 114824. [Google Scholar] [CrossRef] [Scilit]
- Stewart, I.D.; Oke, T.R. Local Climate Zones for Urban Temperature Studies. Bull. Am. Meteorol. Soc. 2012, 93, 1879–1900. [Google Scholar] [CrossRef] [Scilit]
- Bechtel, B.; Daneke, C. Classification of Local Climate Zones Based on Multiple Earth Observation Data. IEEE J. Sel. Top. Appl. Earth Obs. Remote Sens. 2012, 5, 1191–1202. [Google Scholar] [CrossRef] [Scilit]
- Bechtel, B.; Alexander, P.; Böhner, J.; Ching, J.; Conrad, O.; Feddema, J.; Mills, G.; See, L.; Stewart, I. Mapping Local Climate Zones for a Worldwide Database of the Form and Function of Cities. ISPRS Int. J. Geo-Inf. 2015, 4, 199–219. [Google Scholar] [CrossRef] [Scilit]
- Demuzere, M.; Bechtel, B.; Middel, A.; Mills, G. Mapping Europe into local climate zones. PLoS ONE 2019, 14, e0214474. [Google Scholar] [CrossRef] [Scilit] [PubMed]
- Demuzere, M.; Bechtel, B.; Mills, G. Global transferability of local climate zone models. Urban Clim. 2019, 27, 46–63. [Google Scholar] [CrossRef] [Scilit]
- Demuzere, M.; Kittner, J.; Martilli, A.; Mills, G.; Moede, C.; Stewart, I.D.; van Vliet, J.; Bechtel, B. A global map of local climate zones to support earth system modelling and urban-scale environmental science. Earth Syst. Sci. Data 2022, 14, 3835–3873. [Google Scholar] [CrossRef] [Scilit]
- Wang, R.; Wang, M.; Ren, C.; Chen, G.; Mills, G.; Ching, J. Mapping local climate zones and its applications at the global scale: A systematic review of the last decade of progress and trend. Urban Clim. 2024, 57, 102129. [Google Scholar] [CrossRef] [Scilit]
- Vavassori, A.; Oxoli, D.; Venuti, G.; Brovelli, M.A.; Siciliani de Cumis, M.; Sacco, P.; Tapete, D. A combined Remote Sensing and GIS-based method for Local Climate Zone mapping using PRISMA and Sentinel-2 imagery. Int. J. Appl. Earth Obs. Geoinf. 2024, 131, 103944. [Google Scholar] [CrossRef] [Scilit]
- Li, W.; Liu, X.; Samat, A.; Gamba, P. Automated Local Climate Zone Mapping via Multi-Parameter Synergistic Optimization and High-Resolution GIS-RS Fusion. Remote Sens. 2025, 17, 2038. [Google Scholar]
- Banzhaf, E.; Hofer, R. Monitoring Urban Structure Types as Spatial Indicators With CIR Aerial Photographs for a More Effective Urban Environmental Management. IEEE J. Sel. Top. Appl. Earth Obs. Remote Sens. 2008, 1, 129–138. [Google Scholar] [CrossRef] [Scilit]
- Heiden, U.; Heldens, W.; Roessner, S.; Segl, K.; Esch, T.; Mueller, A. Urban structure type characterization using hyperspectral remote sensing and height information. Landsc. Urban Plan. 2012, 105, 361–375. [Google Scholar] [CrossRef] [Scilit]
- Jilge, M.; Heiden, U.; Neumann, C.; Feilhauer, H. Gradients in urban material composition: A new concept to map cities with spaceborne imaging spectroscopy data. Remote Sens. Environ. 2019, 223, 179–193. [Google Scholar] [CrossRef] [Scilit]
- Lehner, A.; Blaschke, T. A Generic Classification Scheme for Urban Structure Types. Remote Sens. 2019, 11, 173. [Google Scholar] [CrossRef] [Scilit]
- Guerois, M.; Bretagnolle, A.; Giraud, T.; Mathian, H. A New Database for the Cities of Europe? Exploration of the Urban Morphological Zones (CLC2000) from Three National Database Comparisons (Denmark, France, Sweden). Environ. Plan. B Plan. Des. 2012, 39, 439–458. [Google Scholar] [CrossRef] [Scilit]
- Altieri, L.; Cocchi, D.; Pezzi, G.; Scott, E.M.; Ventrucci, M. Urban sprawl scatterplots for Urban Morphological Zones data. Ecol. Indic. 2014, 36, 315–323. [Google Scholar] [CrossRef] [Scilit]
- Oueslati, W.; Alvanides, S.; Garrod, G. Determinants of urban sprawl in European cities. Urban Stud. 2015, 52, 1594–1614. [Google Scholar] [CrossRef] [Scilit] [PubMed]
- Czyża, S.; Szuniewicz, K.; Cieślak, I.; Biłozor, A.; Bajerowski, T. An Analysis of the Spatial Development of European Cities Based on Their Geometry and the CORINE Land Cover (CLC) Database. Int. J. Environ. Res. Public Health 2023, 20, 2049. [Google Scholar] [CrossRef] [Scilit] [PubMed]
- Droin, A.; Wurm, M.; Weigand, M.; Gawlas, C.; Manuel, K.; Taubenböck, H. How does pedestrian permeability vary in and across cities ? A fine-grained assessment for all large cities in Germany. Comput. Environ. Urban Syst. 2024, 110, 102103. [Google Scholar]
- Ehrlich, D.; Freire, S.; Melchiorri, M.; Kemper, T. Open and Consistent Geospatial Data on Population Density, Built-Up and Settlements to Analyse Human Presence, Societal Impact and Sustainability: A Review of GHSL Applications. Sustainability 2021, 13, 7851. [Google Scholar] [CrossRef] [Scilit]
- Melchiorri, M. The global human settlement layer sets a new standard for global urban data reporting with the urban centre database. Front. Environ. Sci. 2022, 10, 1003862. [Google Scholar] [CrossRef] [Scilit]
- Marconcini, M.; Metz-marconcini, A.; Üreyen, S.; Palacios-lopez, D.; Hanke, W.; Bachofer, F.; Zeidler, J.; Esch, T.; Gorelick, N.; Kakarla, A.; et al. Outlining where humans live, the World Settlement Footprint 2015. Sci. Data 2020, 7, 242. [Google Scholar] [CrossRef] [Scilit] [PubMed]
- Yang, L.; Yang, X.; Zhang, H.; Ma, J.; Zhu, H.; Huang, X. Urban morphological regionalization based on 3D building blocks—A case in the central area of Chengdu, China. Comput. Environ. Urban Syst. 2022, 94, 101800. [Google Scholar] [CrossRef] [Scilit]
- Labetski, A.; Vitalis, S.; Biljecki, F.; Arroyo Ohori, K.; Stoter, J. 3D building metrics for urban morphology. Int. J. Geogr. Inf. Sci. 2023, 37, 36–67. [Google Scholar]
- Bai, X.; Surveyer, A.; Elmqvist, T.; Gatzweiler, F.W.; Güneralp, B.; Parnell, S.; Prieur-Richard, A.-H.; Shrivastava, P.; Siri, J.G.; Stafford-Smith, M.; et al. Defining and advancing a systems approach for sustainable cities. Curr. Opin. Environ. Sustain. 2016, 23, 69–78. [Google Scholar] [CrossRef] [Scilit]
- Joshi, M.Y.; Rodler, A.; Musy, M.; Guernouti, S.; Cools, M.; Teller, J. Identifying urban morphological archetypes for microclimate studies using a clustering approach. Build. Environ. 2022, 224, 109574. [Google Scholar] [CrossRef] [Scilit]
- von Behren, S.; Turek, M.; Barthelmes, L.; Scholta, H.; Hansen, F.; Kagerbauer, M.; Eisenmann, C. Decoding Urban Archetypes: Exploring Mobility-Related Homogeneity among Cities. Sustainability 2023, 15, 14231. [Google Scholar] [CrossRef] [Scilit]
- Debray, H.; Gassilloud, M.; Lemoine-Rodríguez, R.; Wurm, M.; Zhu, X.; Taubenböck, H. Universal patterns of intra-urban morphology: Defining a global typology of the urban fabric using unsupervised clustering. Int. J. Appl. Earth Obs. Geoinf. 2025, 141, 104610. [Google Scholar] [CrossRef] [Scilit]
- Rinaldi, V.; Ghandehari, M. Characterizing urban form archetypes through landscape and morphology parameterization and dimensionality reduction. Int. J. Digit. Earth 2026, 19, 2616955. [Google Scholar] [CrossRef] [Scilit]
- Qin, Q.; Xu, S.; Du, M.; Li, S. Identifying urban functional zones by capturing multi-spatial distribution patterns of points of interest. Int. J. Digit. Earth 2022, 15, 8947–8967. [Google Scholar] [CrossRef] [Scilit]
- Zhang, K.; Ming, D.; Du, S.; Xu, L.; Ling, X.; Zeng, B.; Lv, X. Distance Weight-Graph Attention Model based High Resolution Remote Sensing Urban Functional Zone Identification. IEEE Trans. Geosci. Remote Sens. 2022, 60, 5601018. [Google Scholar]
- Du, S.; Zhang, X.; Lei, Y.; Huang, X.; Tu, W.; Liu, B.; Meng, Q.; Du, S. Mapping urban functional zones with remote sensing and geospatial big data: A systematic review. GISci. Remote Sens. 2024, 61, 2338028. [Google Scholar] [CrossRef] [Scilit]
- Zhang, Y.; Xu, Y.; Gao, J.; Zhao, Z.; Sun, J.; Mu, F. Urban Functional Zone Identification Based on Multimodal Data Fusion: A Case Study of Chongqing ’ s Central Urban Area. Remote Sens. 2025, 17, 990. [Google Scholar]
- Chen, J.; Fan, R.; Niu, H.; Xu, Z.; Yan, J.; Song, W.; Feng, R. A unified multimodal learning method for urban functional zone identification by fusing inner-street visual–textual information from street-view and satellite images. Int. J. Appl. Earth Obs. Geoinf. 2025, 142, 104685. [Google Scholar]
- Tao, Y.; Liu, W.; Chen, J.; Gao, J.; Li, R.; Wang, X.; Zhang, Y.; Ren, J.; Yin, S.; Zhu, X.; et al. A graph-based multimodal data fusion framework for identifying urban functional zone. Int. J. Appl. Earth Obs. Geoinf. 2025, 136, 104353. [Google Scholar] [CrossRef] [Scilit]
- Tsirantonakis, D.; Chrysoulakis, N. Earth Observation Data Exploitation in Urban Surface Modelling: The Urban Energy Balance Response to a Suburban Park Development. Remote Sens. 2022, 14, 1473. [Google Scholar] [CrossRef] [Scilit]
- Mashhoodi, B.; Stead, D.; van Timmeren, A. Land surface temperature and households’ energy consumption: Who is affected and where? Appl. Geogr. 2020, 114, 102125. [Google Scholar] [CrossRef] [Scilit]
- Back, Y.; Bach, P.M.; Santamouris, M.; Rauch, W.; Kleidorfer, M. Role of Surface Energy Fluxes in Urban Overheating Under Buoyancy-Driven Atmospheric Conditions. J. Geophys. Res. Atmos. 2024, 129, e2024JD040123. [Google Scholar]
- Gupta, R.; Kumar, A. Urban Heat Island research using remote sensing: A bibliometric review with special reference to India. Urban Clim. 2025, 61, 102403. [Google Scholar] [CrossRef] [Scilit]
- Bassett, R.; Cai, X.; Chapman, L.; Heaviside, C.; Thornes, J.E.; Muller, C.L.; Young, D.T.; Warren, E.L. Observations of urban heat island advection from a high-density monitoring network. Q. J. R. Meteorol. Soc. 2016, 142, 2434–2441. [Google Scholar] [CrossRef] [Scilit]
- Wu, H.; Huang, B.; Zheng, Z.; Sun, R.; Hu, D.; Zeng, Y. Urban anthropogenic heat index derived from satellite data. Int. J. Appl. Earth Obs. Geoinf. 2023, 118, 103261. [Google Scholar] [CrossRef] [Scilit]
- Siddiqui, A.; Maske, A.B.; Khan, A.; Kar, A.; Bhatt, M.; Bharadwaj, V.; Kant, Y.; Hamdi, R. An Urban Climate Paradox of Anthropogenic Heat Flux and Urban Cool Island in a Semi-Arid Urban Environment. Atmosphere 2025, 16, 151. [Google Scholar] [CrossRef] [Scilit]
- Wei, L.; Sobrino, J.A. Surface urban heat island analysis based on local climate zones using ECOSTRESS and Landsat data: A case study of Valencia city (Spain). Int. J. Appl. Earth Obs. Geoinf. 2024, 130, 103875. [Google Scholar] [CrossRef] [Scilit]
- Zhou, L.; Cheng, L.; Qin, S.; Mai, Y.; Lu, M. Estimation of Urban Evapotranspiration at High Spatiotemporal Resolution and Considering Flux Footprints. Remote Sens. 2023, 15, 1327. [Google Scholar] [CrossRef] [Scilit]
- Obriejetan, M.; Krexner, T. Remote sensing-based evapotranspiration modeling for urban green spaces: A case study in Vienna. Urban Clim. 2024, 58, 102192. [Google Scholar] [CrossRef] [Scilit]
- Sandholt, I.; Rasmussen, K.; Andersen, J. A simple interpretation of the surface temperature/vegetation index space for assessment of surface moisture status. Remote Sens. Environ. 2002, 79, 213–224. [Google Scholar] [CrossRef] [Scilit]
- Sadeghi, M.; Babaeian, E.; Tuller, M.; Jones, S.B. The optical trapezoid model: A novel approach to remote sensing of soil moisture applied to Sentinel-2 and Landsat-8 observations. Remote Sens. Environ. 2017, 198, 52–68. [Google Scholar] [CrossRef] [Scilit]
- Przeździecki, K.; Zawadzki, J. Assessing Moisture Content and Its Mitigating Effect in an Urban Area Using the Land Surface Temperature–Vegetation Index Triangle Method. Forests 2023, 14, 578. [Google Scholar] [CrossRef] [Scilit]
- Das, N.N.; Entekhabi, D.; Dunbar, R.S.; Chaubell, M.J.; Colliander, A.; Yueh, S.; Jagdhuber, T.; Chen, F.; Crow, W.; O’Neill, P.E.; et al. The SMAP and Copernicus Sentinel 1A/B microwave active-passive high resolution surface soil moisture product. Remote Sens. Environ. 2019, 233, 111380. [Google Scholar]
- Islam, T.; Zeleke, E.B.; Afroz, M.; Melesse, A.M. A Systematic Review of Urban Flood Susceptibility Mapping: Remote Sensing, Machine Learning, and Other Modeling Approaches. Remote Sens. 2025, 17, 524. [Google Scholar] [CrossRef] [Scilit]
- Deng, J.; Hong, D.; Li, C.; Yokoya, N. Joint Super-Resolution and Segmentation for 1-m Impervious Surface Area Mapping in China’s Yangtze River Economic Belt. GISci. Remote Sens. 2025, 63, 2610548. [Google Scholar]
- Chen, J.; Chen, S.; Yang, C.; He, L.; Hou, M.; Shi, T. A comparative study of impervious surface extraction using Sentinel-2 imagery. Eur. J. Remote Sens. 2020, 53, 274–292. [Google Scholar] [CrossRef] [Scilit]
- Ahmad, M.N.; Shao, Z.; Javed, A. Mapping impervious surface area increase and urban pluvial flooding using Sentinel Application Platform (SNAP) and remote sensing data. Environ. Sci. Pollut. Res. 2023, 30, 125741–125758. [Google Scholar] [CrossRef] [Scilit]
- Tazmul Islam, M.; Meng, Q. An exploratory study of Sentinel-1 SAR for rapid urban flood mapping on Google Earth Engine. Int. J. Appl. Earth Obs. Geoinf. 2022, 113, 103002. [Google Scholar] [CrossRef] [Scilit]
- Tavus, B.; Kocaman, S.; Nefeslioglu, H.A.; Gokceoglu, C. A fusion approach for flood mapping using sentinel-1 and sentinel-2 datasets. Int. Arch. Photogramm. Remote Sens. Spat. Inf. Sci. 2020, XLIII-B3-2, 641–648. [Google Scholar] [CrossRef] [Scilit]
- Zhao, J.; Xiong, Z.; Zhu, X.X. UrbanSARFloods: Sentinel-1 SLC-Based Benchmark Dataset for Urban and Open-Area Flood Mapping. In Proceedings of the IEEE/CVF Conference on Computer Vision and Pattern Recognition, Seattle, WA, USA, 17–21 June 2024. [Google Scholar]
- Al Mehedi, M.A.; Smith, V.; Kremer, P. A comparative analysis of urban and peri-urban flood identification using SAR imagery. PLoS Water 2025, 4, e0000269. [Google Scholar] [CrossRef] [Scilit]
- Reuter, M.; Buchwitz, M.; Schneising, O.; Krautwurst, S.; O’Dell, C.W.; Richter, A.; Bovensmann, H.; Burrows, J.P. Towards monitoring localized CO2 emissions from space: Co-located regional CO2 and NO2 enhancements observed by the OCO-2 and S5P satellites. Atmos. Chem. Phys. 2019, 19, 9371–9383. [Google Scholar]
- Fu, P.; Xie, Y.; Moore, C.E.; Myint, S.W.; Bernacchi, C.J. A Comparative Analysis of Anthropogenic CO2 Emissions at City Level Using OCO-2 Observations: A Global Perspective. Earth’s Futur. 2019, 7, 1058–1070. [Google Scholar]
- Goldberg, D.L.; Lu, Z.; Streets, D.G.; de Foy, B.; Griffin, D.; McLinden, C.A.; Lamsal, L.N.; Krotkov, N.A.; Eskes, H. Enhanced Capabilities of TROPOMI NO2: Estimating NO X from North American Cities and Power Plants. Environ. Sci. Technol. 2019, 53, 12594–12601. [Google Scholar] [PubMed]
- van Donkelaar, A.; Martin, R.V.; Brauer, M.; Hsu, N.C.; Kahn, R.A.; Levy, R.C.; Lyapustin, A.; Sayer, A.M.; Winker, D.M. Global Estimates of Fine Particulate Matter using a Combined Geophysical-Statistical Method with Information from Satellites, Models, and Monitors. Environ. Sci. Technol. 2016, 50, 3762–3772. [Google Scholar] [CrossRef] [Scilit] [PubMed]
- Elvidge, C.D.; Baugh, K.; Zhizhin, M.; Hsu, F.C.; Ghosh, T. VIIRS night-time lights. Int. J. Remote Sens. 2017, 38, 5860–5879. [Google Scholar] [CrossRef] [Scilit]
- Zhang, Y.; Guanter, L.; Berry, J.A.; van der Tol, C.; Yang, X.; Tang, J.; Zhang, F. Model-based analysis of the relationship between sun-induced chlorophyll fluorescence and gross primary production for remote sensing applications. Remote Sens. Environ. 2016, 187, 145–155. [Google Scholar]
- Guanter, L.; Zhang, Y.; Jung, M.; Joiner, J.; Voigt, M.; Berry, J.A.; Frankenberg, C.; Huete, A.R.; Zarco-Tejada, P.; Lee, J.-E.; et al. Global and time-resolved monitoring of crop photosynthesis with chlorophyll fluorescence. Proc. Natl. Acad. Sci. USA 2014, 111, E1327–E1333. [Google Scholar] [CrossRef] [Scilit] [PubMed]
- Li, H.; Qiu, J.; Zheng, B. Air-pollution-satellite-based CO2 emission inversion: System evaluation, sensitivity analysis, and future research direction. Atmos. Chem. Phys. 2025, 25, 1949–1963. [Google Scholar]
- de la Barrera, F.; Rubio, P.; Banzhaf, E. The value of vegetation cover for ecosystem services in the suburban context. Urban For. Urban Green. 2016, 16, 110–122. [Google Scholar] [CrossRef] [Scilit]
- Weng, Q. Thermal infrared remote sensing for urban climate and environmental studies: Methods, applications, and trends. ISPRS J. Photogramm. Remote Sens. 2009, 64, 335–344. [Google Scholar] [CrossRef] [Scilit]
- Imhoff, M.L.; Zhang, P.; Wolfe, R.E.; Bounoua, L. Remote sensing of the urban heat island effect across biomes in the continental USA. Remote Sens. Environ. 2010, 114, 504–513. [Google Scholar] [CrossRef] [Scilit]
- Peng, S.; Piao, S.; Ciais, P.; Friedlingstein, P.; Ottle, C.; Bréon, F.-M.; Nan, H.; Zhou, L.; Myneni, R.B. Surface Urban Heat Island Across 419 Global Big Cities. Environ. Sci. Technol. 2012, 46, 696–703. [Google Scholar] [CrossRef] [Scilit] [PubMed]
- Qiu, G.Y.; Yan, C.; Liu, Y. Urban evapotranspiration and its effects on water budget and energy balance: Review and perspectives. Earth-Sci. Rev. 2023, 246, 104577. [Google Scholar] [CrossRef] [Scilit]
- Palliwoda, J.; Banzhaf, E.; Priess, J.A. How do the green components of urban green infrastructure influence the use of ecosystem services? Examples from Leipzig, Germany. Landsc. Ecol. 2020, 35, 1127–1142. [Google Scholar] [CrossRef] [Scilit]
- Kong, F.; Yin, H.; James, P.; Hutyra, L.R.; He, H.S. Effects of spatial pattern of greenspace on urban cooling in a large metropolitan area of eastern China. Landsc. Urban Plan. 2014, 128, 35–47. [Google Scholar] [CrossRef] [Scilit]
- Paschalis, A.; Chakraborty, T.; Fatichi, S.; Meili, N.; Manoli, G. Urban Forests as Main Regulator of the Evaporative Cooling Effect in Cities. AGU Adv. 2021, 2, e2021AV00043. [Google Scholar] [CrossRef] [Scilit]
- Levin, N.; Kyba, C.C.M.; Zhang, Q.; Sánchez de Miguel, A.; Román, M.O.; Li, X.; Portnov, B.A.; Molthan, A.L.; Jechow, A.; Miller, S.D.; et al. Remote sensing of night lights: A review and an outlook for the future. Remote Sens. Environ. 2020, 237, 111443. [Google Scholar] [CrossRef] [Scilit]
- Elvidge, C.D.; Zhizhin, M.; Ghosh, T.; Hsu, F.; Taneja, J. Annual Time Series of Global VIIRS Nighttime Lights Derived from Monthly Averages: 2012 to 2019. Remote Sens. 2021, 13, 922. [Google Scholar] [CrossRef] [Scilit]
- Yu, Z.; Hu, L.; Sun, T.; Albertson, J.; Li, Q. Impact of heat storage on remote-sensing based quantification of anthropogenic heat in urban environments. Remote Sens. Environ. 2021, 262, 112520. [Google Scholar] [CrossRef] [Scilit]
- Cao, R.; Tu, W.; Yang, C.; Li, Q.; Liu, J.; Zhu, J.; Zhang, Q.; Li, Q.; Qiu, G. Deep learning-based remote and social sensing data fusion for urban region function recognition. ISPRS J. Photogramm. Remote Sens. 2020, 163, 82–97. [Google Scholar] [CrossRef] [Scilit]
- Leyk, S.; Gaughan, A.E.; Adamo, S.B.; de Sherbinin, A.; Balk, D.; Freire, S.; Rose, A.; Stevens, F.R.; Blankespoor, B.; Frye, C.; et al. The spatial allocation of population: A review of large-scale gridded population data products and their fitness for use. Earth Syst. Sci. Data 2019, 11, 1385–1409. [Google Scholar] [CrossRef] [Scilit]
- Mohamadi, B.; Balz, T.; Pirasteh, S.; Li, H.; Younes, A. Detecting and monitoring urban project development from space: An unsupervised learning model based on InSAR coherence time series. Geo-Spat. Inf. Sci. 2025, 1–25. [Google Scholar] [CrossRef] [Scilit]
- Yoo, C.; Zhou, Y.; Weng, Q. Mapping 10-m Industrial Lands across 1000+ Global Large Cities, 2017–2023. Sci. Data 2025, 12, 278. [Google Scholar] [CrossRef] [Scilit] [PubMed]
- Gibson, J.; Boe-Gibson, G. Nighttime Lights and County-Level Economic Activity in the United States: 2001 to 2019. Remote Sens. 2021, 13, 2741. [Google Scholar] [CrossRef] [Scilit]
- Yasuda, K.; Shibasaki, R.; Yasuda, R.; Murata, H. Terminal Congestion Analysis of Container Ports Using Satellite Images and AIS. Remote Sens. 2024, 16, 1082. [Google Scholar] [CrossRef] [Scilit]
- Jean, N.; Burke, M.; Xie, M.; Davis, W.M.; Lobell, D.B.; Ermon, S. Combining satellite imagery and machine learning to predict poverty. Science 2016, 353, 790–794. [Google Scholar] [CrossRef] [Scilit] [PubMed]
- Ajami, A.; Kuffer, M.; Persello, C.; Pfeffer, K. Identifying a Slums’ Degree of Deprivation from VHR Images Using Convolutional Neural Networks. Remote Sens. 2019, 11, 1282. [Google Scholar] [CrossRef] [Scilit]
- Xu, G.; Xiu, T.; Li, X.; Liang, X.; Jiao, L. Lockdown induced night-time light dynamics during the COVID-19 epidemic in global megacities. Int. J. Appl. Earth Obs. Geoinf. 2021, 102, 102421. [Google Scholar] [CrossRef] [Scilit] [PubMed]
- Chen, Y.; Qin, R.; Zhang, G.; Albanwan, H. Spatial Temporal Analysis of Traffic Patterns during the COVID-19 Epidemic by Vehicle Detection Using Planet Remote-Sensing Satellite Images. Remote Sens. 2021, 13, 208. [Google Scholar] [CrossRef] [Scilit]
- Meng, Q.; Qian, J.; Schlink, U.; Zhang, L.; Hu, X.; Gao, J.; Wang, Q. Anthropogenic heat variation during the COVID-19 pandemic control measures in four Chinese megacities. Remote Sens. Environ. 2023, 293, 113602. [Google Scholar] [CrossRef] [Scilit] [PubMed]
- Loveridge, A.; Elvidge, C.D.; Kroodsma, D.A.; White, T.D.; Evans, K.; Kato, A.; Ropert-Coudert, Y.; Sommerfeld, J.; Takahashi, A.; Patchett, R.; et al. Context-dependent changes in maritime traffic activity during the first year of the COVID-19 pandemic. Glob. Environ. Change 2024, 84, 102773. [Google Scholar]
- Scher, C.; Van Den Hoek, J. Nationwide conflict damage mapping with interferometric synthetic aperture radar: A study of the 2022 Russia–Ukraine conflict. Sci. Remote Sens. 2025, 11, 100217. [Google Scholar] [CrossRef] [Scilit]
- Hallopeau, T.; Fouzai, Y.; Demagistri, L.; Guérin, J.; de Matos, V.P.; Gracie, R.; Gurgel, H.; Barcellos, C.; Dessay, N. Addressing data imbalance in urban informal settlement mapping from earth observation using ensemble learning: A case study in Rio de Janeiro. Sci. Remote Sens. 2025, 12, 100273. [Google Scholar] [CrossRef] [Scilit]
- Büttner, N.; Stalder, S.; Volpi, M.; Suel, E.; Harttgen, K. Large-scale slum mapping in sub-Saharan Africa’s major cities: Remote sensing and deep learning reveal strong slum growth in the urban periphery between 2016 and 2022. Habitat Int. 2025, 161, 103403. [Google Scholar]
- Friedrich, H.K.; Van Den Hoek, J. Breaking ground: Automated disturbance detection with Landsat time series captures rapid refugee settlement establishment and growth in North Uganda. Comput. Environ. Urban Syst. 2020, 82, 101499. [Google Scholar] [CrossRef] [Scilit]
- Zhou, D.; Xiao, J.; Bonafoni, S.; Berger, C.; Deilami, K.; Zhou, Y.; Frolking, S.; Yao, R.; Qiao, Z.; Sobrino, J.A. Satellite Remote Sensing of Surface Urban Heat Islands: Progress, Challenges, and Perspectives. Remote Sens. 2018, 11, 48. [Google Scholar] [CrossRef] [Scilit]
- Kuffer, M.; Pfeffer, K.; Persello, C. Special Issue “Remote-Sensing-Based Urban Planning Indicators”. Remote Sens. 2021, 13, 1264. [Google Scholar]
- Persello, C.; Wegner, J.A.N.D.; Hänsch, R.; Tuia, D.; Ghamisi, P.; Koeva, M.; Camps-Valls, G. Deep Learning and Earth Observation to Support the Sustainable Development Goals. IEEE Geosci. Remote Sens. Mag. 2022, 10, 172–181. [Google Scholar] [CrossRef] [Scilit]
- Petersen, C.J.; Russel, D.J.; Jensen, A.; Pedersen, A.B.; Banzhaf, E.; Kaltenegger, I. Walkable Maps and Policy Innovation for Nature: A Novel Methodology for Understanding Policy Learning. Int. J. Qual. Methods 2024, 23, 1–13. [Google Scholar] [CrossRef] [Scilit]
- Petersen, C.; Læssøe, J.; Russel, D.; Elze, S.; Banzhaf, E. Interactive walkable floor maps as a science-policy-interface tool for nature-based solutions. Nat.-Based Solut. 2025, 8, 100262. [Google Scholar]
- Wellmann, T.; Lausch, A.; Andersson, E.; Knapp, S.; Cortinovis, C.; Jache, J.; Scheuer, S.; Kremer, P.; Mascarenhas, A.; Kraemer, R.; et al. Remote sensing in urban planning: Contributions towards ecologically sound policies? Landsc. Urban Plan. 2020, 204, 103921. [Google Scholar] [CrossRef] [Scilit]
- Mihály, S.; Remetey-Fülöpp, G.; Kristóf, D.; Czinkóczky, A.; Palya, T.; Pásztor, L.; Rudan, P.; Szabó, G.; Zentai, L. Earth observation and geospatial big data management and engagement of stakeholders in Hungary to support the SDGs. Big Earth Data 2021, 5, 306–351. [Google Scholar] [CrossRef] [Scilit]
- Berger, K.; Hostert, P.; Schlerf, M.; Immitzer, M.; Szantoi, Z.; Okujeni, A.; Foerster, S.; Colditz, R.; Giardino, C.; Machwitz, M.; et al. Advancing optical earth observation for EU policies: Needs, opportunities, recommendations. Environ. Sci. Eur. 2026, 38, 52. [Google Scholar] [CrossRef] [Scilit]
- Ching, J.; Mills, G.; Bechtel, B.; See, L.; Feddema, J.; Wang, X.; Ren, C.; Brousse, O.; Martilli, A.; Neophytou, M.; et al. WUDAPT: An Urban Weather, Climate, and Environmental Modeling Infrastructure for the Anthropocene. Bull. Am. Meteorol. Soc. 2018, 99, 1907–1924. [Google Scholar] [CrossRef] [Scilit]
- Bechtel, B.; Alexander, P.J.; Beck, C.; Böhner, J.; Brousse, O.; Ching, J.; Demuzere, M.; Fonte, C.; Gál, T.; Hidalgo, J.; et al. Generating WUDAPT Level 0 data—Current status of production and evaluation. Urban Clim. 2019, 27, 24–45. [Google Scholar]
- Zhou, Y.; Lia, X.; Chena, W.; Menga, L.; Wub, Q.; Gongc, P.; Seto, K.C. Satellite mapping of urban built-up heights reveals extreme infrastructure gaps and inequalities in the Global South. Proc. Natl. Acad. Sci. USA 2022, 119, e2120943119. [Google Scholar] [CrossRef] [Scilit]
- Dou, Y.; Liu, Z.; He, C.; Yue, H. Urban Land Extraction Using VIIRS Nighttime Light Data: An Evaluation of Three Popular Methods. Remote Sens. 2017, 9, 175. [Google Scholar] [CrossRef] [Scilit]
- Melchiorri, M.; Pesaresi, M.; Florczyk, A.J.; Corbane, C.; Kemper, T. Principles and Applications of the Global Human Settlement Layer as Baseline for the Land Use Efficiency Indicator—SDG 11.3.1. ISPRS Int. J. Geo-Inf. 2019, 8, 96. [Google Scholar] [CrossRef] [Scilit]
- Gorelick, N.; Hancher, M.; Dixon, M.; Ilyushchenko, S.; Thau, D.; Moore, R. Google Earth Engine: Planetary-scale geospatial analysis for everyone. Remote Sens. Environ. 2017, 202, 18–27. [Google Scholar] [CrossRef] [Scilit]
- Ferré-Bigorra, J.; Casals, M.; Gangolells, M. The adoption of urban digital twins. Cities 2022, 131, 103905. [Google Scholar] [CrossRef] [Scilit]
- Bielecka, E.; Markowska, A.; Wiatkowska, B.; Calka, B. Sustainable Urban Land Management Based on Earth Observation Data—State of the Art and Trends. Remote Sens. 2025, 17, 1537. [Google Scholar] [CrossRef] [Scilit]
- Binci, D. Earth observation and sustainable development: A systematic literature review and content analysis about the New Space Economy. Environ. Innov. Soc. Transit. 2026, 59, 101088. [Google Scholar]
- Maso, J.; Zabala, A. Earth Observations for Sustainable Development Goals. Remote Sens. 2023, 15, 2570. [Google Scholar] [CrossRef] [Scilit]
- Anees, M.M.; Banzhaf, E.; Wang, J.; Joshi, P.K. Quality Index Approach for Analysis of Urban Green Infrastructure in Himalayan Cities. Land 2023, 12, 279. [Google Scholar] [CrossRef] [Scilit]
- Lehmann, A.; Mazzetti, P.; Santoro, M.; Nativi, S.; Masò, J.; Serral, I.; Spengler, D.; Niamir, A.; Lacroix, P.; Ambrosone, M.; et al. Essential earth observation variables for high-level multi-scale indicators and policies. Environ. Sci. Policy 2022, 131, 105–117. [Google Scholar]
- Guo, H.; Dou, C.; Liang, D.; Fu, B.; Chen, H.; Zou, Z.; Huang, P.; Li, X.; Chen, F.; Han, C.; et al. The SDGSAT-1 mission and its role in monitoring SDG indicators. Remote Sens. Environ. 2025, 328, 114885. [Google Scholar] [CrossRef] [Scilit]
- Elze, S.; Petersen, C.; Læssøe, J.; Banzhaf, E.; Jensen, A.; Russel, D.; Anderson, S. Meeting on the Map: Innovative Platform for Stakeholder Learning, Dialogue and Engagement with Nature-Based Solutions (NbS). REGREEN Policy Brief 12/12; REGREEN—Fostering Nature-Based Solutions for Smart, Green and Healthy Urban Transitions in Europe and China: Aarhus, Denmark, 2024. [Google Scholar] [CrossRef]
- Kazanskiy, N.; Khabibullin, R.; Nikonorov, A.; Khonina, S. A Comprehensive Review of Remote Sensing and Artificial Intelligence Integration: Advances, Applications, and Challenges. Sensors 2025, 25, 5965. [Google Scholar] [CrossRef] [Scilit] [PubMed]
- Zhu, Q.; Li, Z.; Song, T.; Yao, L.; Guan, Q.; Zhang, L. Unrestricted region and scale: Deep self-supervised building mapping framework across different cities from five continents. ISPRS J. Photogramm. Remote Sens. 2024, 209, 344–367. [Google Scholar] [CrossRef] [Scilit]
- He, H.; Yan, J.; Liang, D.; Sun, Z.; Li, J.; Wang, L. Time-series land cover change detection using deep learning-based temporal semantic segmentation. Remote Sens. Environ. 2024, 305, 114101. [Google Scholar]
- Yang, C.; Fang, H.; Guo, S.; Tang, P.; Xia, Z.; Zhang, X.; Du, P. Detecting urban functional zones changes via multi-source temporal fusion of street view and remote sensing imagery. Int. J. Appl. Earth Obs. Geoinf. 2025, 144, 104933. [Google Scholar] [CrossRef] [Scilit]
- Chen, J.; Chen, Y.; Zheng, Z.; Ling, Z.; Meng, X.; Kuang, J.; Shi, X.; Yang, Y.; Chen, W.; Wu, Z. Urban Functional Zone Classification Based on High-Resolution Remote Sensing Imagery and Nighttime Light Imagery. Remote Sens. 2025, 17, 1588. [Google Scholar] [CrossRef] [Scilit]
- Stamou, A.; Stylianidis, E. Urban Monitoring from the Cloud: A Review of Google Earth Engine (GEE)-Based Approaches for Assessing Urban Environmental Indices. Geographies 2025, 5, 68. [Google Scholar] [CrossRef] [Scilit]
- Warnke, S.; Runfola, D. From Prediction to Explanation: Using Explainable AI to Understand Satellite-Based Riot Forecasting Models. Remote Sens. 2025, 17, 313. [Google Scholar] [CrossRef] [Scilit]
- Li, Y.; Wang, Y.; Yu, L.; Dang, B.; Xu, G.; Zhong, Z.; Wu, Y.; Guo, X.; Wu, K.; Li, Z.; et al. Learning to reason over multi-granularity knowledge graph for zero-shot urban land-use mapping. Remote Sens. Environ. 2025, 330, 114961. [Google Scholar] [CrossRef] [Scilit]
- Car, N.J.; Homburg, T. GeoSPARQL 1.1: Motivations, Details and Applications of the Decadal Update to the Most Important Geospatial LOD Standard. ISPRS Int. J. Geo-Inf. 2022, 11, 117. [Google Scholar] [CrossRef] [Scilit]
- Jang, H.; Yu, K.; Kim, J. Generating Spatial Knowledge Graphs with 2D Indoor Floorplan Data: A Case Study on the Jeonju Express Bus Terminal. ISPRS Int. J. Geo-Inf. 2024, 13, 52. [Google Scholar] [CrossRef] [Scilit]
- Yue, Z.; Zhu, W.; Mei, X.; Zhong, S. An integrated graph-spatial method for high-performance geospatial-temporal semantic query. Int. J. Appl. Earth Obs. Geoinf. 2025, 137, 104437. [Google Scholar] [CrossRef] [Scilit]
- Mai, G.; Hu, Y.; Gao, S.; Cai, L.; Martins, B.; Scholz, J.; Gao, J.; Janowicz, K. Symbolic and subsymbolic GeoAI: Geospatial knowledge graphs and spatially explicit machine learning. Trans. GIS 2022, 26, 3118–3124. [Google Scholar]
- Torresani, M.; Rossi, C.; Perrone, M.; Hauser, L.T.; Baptiste, F.; Simova, P.; Ricotta, C.; Foody, G.M.; Kacic, P.; Feilhauer, H.; et al. Reviewing the Spectral Variation Hypothesis: Twenty years in the tumultuous sea of biodiversity estimation by remote sensing. Ecol. Inform. 2024, 82, 102688. [Google Scholar] [CrossRef] [Scilit]
- Sun, H.; Hu, J.; Wang, J.; Zhou, J.; Lv, L.; Nie, J. RSPD: A Novel Remote Sensing Index of Plant Biodiversity Combining Spectral Variation Hypothesis and Productivity Hypothesis. Remote Sens. Environ. 2021, 263, 112559. [Google Scholar]
- Afrasiabian, Y.; Contiz, F.; Van Cleemput, E.; Egerer, M.; Yu, K. Biodiversity monitoring in urban community gardens using proximal sensing and drone remote sensing. Remote Sens. Appl. Soc. Environ. 2025, 39, 101685. [Google Scholar] [CrossRef] [Scilit]
- Ji, C.; Heiden, U.; Lakes, T.; Feilhauer, H. Are urban material gradients transferable between areas? Int. J. Appl. Earth Obs. Geoinf. 2021, 100, 102332. [Google Scholar] [CrossRef] [Scilit]
- Ji, C.; Bachmann, M.; Esch, T.; Feilhauer, H.; Heiden, U.; Heldens, W.; Hueni, A.; Lakes, T.; Metz-Marconcini, A.; Schroedter-Homscheidt, M.; et al. Solar photovoltaic module detection using laboratory and airborne imaging spectroscopy data. Remote Sens. Environ. 2021, 266, 112692. [Google Scholar] [CrossRef] [Scilit] [PubMed]
- Zhang, Y.; Yang, Z.; Li, W. Analyses of urban ecosystem based on information entropy. Ecol. Model. 2006, 197, 1–12. [Google Scholar] [CrossRef] [Scilit]
- Chen, Y. Modeling Urban Growth and Form with Spatial Entropy. Complexity 2020, 2020, 8821057. [Google Scholar] [CrossRef] [Scilit]
- Lin, J.; Liu, X.; Li, K.; Li, X. A maximum entropy method to extract urban land by combining MODIS reflectance, MODIS NDVI, and DMSP-OLS data. Int. J. Remote Sens. 2014, 35, 6708–6727. [Google Scholar] [CrossRef] [Scilit]
- Shah, D.; Zaveri, T.; Trivedi, Y.N.; Plaza, A. Entropy-Based Convex Set Optimization for Spatial–Spectral Endmember Extraction From Hyperspectral Images. IEEE J. Sel. Top. Appl. Earth Obs. Remote Sens. 2020, 13, 4200–4213. [Google Scholar]
- Zhang, H.; Liu, Y.; Li, X.; Feng, R.; Gong, Y.; Jiang, Y.; Guan, X.; Li, S. Combing remote sensing information entropy and machine learning for ecological environment assessment of Hefei-Nanjing-Hangzhou region, China. J. Environ. Manag. 2023, 325, 116533. [Google Scholar]
- Tu, B.; Yang, X.; Ou, X.; Zhang, G.; Li, J.; Plaza, A. Ensemble Entropy Metric for Hyperspectral Anomaly Detection. IEEE Trans. Geosci. Remote Sens. 2022, 60, 5501317. [Google Scholar]
- Javed, A.; Cheng, Q.; Peng, H.; Altan, O.; Li, Y.; Ara, I.; Huq, E.; Ali, Y.; Saleem, N. Review of Spectral Indices for Urban Remote Sensing. Photogramm. Eng. Remote Sens. 2021, 87, 513–524. [Google Scholar] [CrossRef] [Scilit]
- Zhou, X.; Zhang, J.; Chen, D.; Huang, Y.; Kong, W.; Yuan, L.; Ye, H.; Huang, W. Assessment of Leaf Chlorophyll Content Models for Winter Wheat Using Landsat-8 Multispectral Remote Sensing Data. Remote Sens. 2020, 12, 2574. [Google Scholar] [CrossRef] [Scilit]
- Zolotukhina, A.; Machikhin, A.; Guryleva, A.; Gresis, V.; Kharchenko, A.; Dekhkanova, K.; Polyakova, S.; Fomin, D.; Nesterov, G.; Pozhar, V. Evaluation of Leaf Chlorophyll Content from Acousto-Optic Hyperspectral Data: A Multi-Crop Study. Remote Sens. 2024, 16, 1073. [Google Scholar]
- Tasnim, M.; Simic, A.; Verrelst, J.; Tian, Q.; Soleil, A.; Poku, H.; Rahman, A.; Processing, I.; Científic, P.; Val, U. De Optimizing Empirical and Hybrid Modeling for Advanced Canopy Chlorophyll and Nitrogen Retrieval Technique Using EnMAP Data. Environ. Chall. 2025, 18, 101114. [Google Scholar]
- Gitelson, A.A.; Viña, A.; Solovchenko, A. Spectral response of gross primary production to in situ canopy light absorption coefficient of chlorophyll. Photosynth. Res. 2025, 163, 20. [Google Scholar] [CrossRef] [Scilit] [PubMed]
- Gitelson, A.; Arkebauer, T.; Solovchenko, A.; Nguy-Robertson, A.; Inoue, Y. An insight into spectral composition of light available for photosynthesis via remotely assessed absorption coefficient at leaf and canopy levels. Photosynth. Res. 2022, 151, 47–60. [Google Scholar]
- Abdelbaki, A.; Schlerf, M.; Retzlaff, R.; Machwitz, M.; Verrelst, J.; Udelhoven, T. Comparison of crop trait retrieval strategies using UAV-based VNIR hyperspectral imaging. Remote Sens. 2021, 13, 1748. [Google Scholar] [CrossRef] [Scilit]
- Picado, E.F.; Romero, K.F. Mapping Spatial Variability of Sugarcane Foliar Nitrogen, Phosphorus, Potassium and Chlorophyll Concentrations Using Remote Sensing. Geomatics 2025, 5, 3. [Google Scholar] [CrossRef] [Scilit]
- Blackburn, G.A. Hyperspectral remote sensing of plant pigments. J. Exp. Bot. 2007, 58, 855–867. [Google Scholar] [PubMed]
- Lee, S.; Ghimire, A.; Kim, Y.; Lee, J.D. Automatic optimization of regions of interest in hyperspectral images for detecting vegetative indices in soybeans. Front. Plant Sci. 2025, 16, 1632690. [Google Scholar] [CrossRef] [Scilit] [PubMed]
- Gitelson, A.; Solovchenko, A.; Viña, A. Foliar absorption coefficient derived from reflectance spectra: A gauge of the efficiency of in situ light-capture by different pigment groups. J. Plant Physiol. 2020, 254, 153273. [Google Scholar] [CrossRef] [Scilit]
- Lausch, A.; Borg, E.; Bumberger, J.; Dietrich, P.; Heurich, M.; Huth, A.; Jung, A.; Klenke, R.; Knapp, S.; Mollenhauer, H.; et al. Understanding Forest Health with Remote Sensing, Part III: Requirements for a Scalable Multi-Source Forest Health Monitoring Network Based on Data Science Approaches. Remote Sens. 2018, 10, 1120. [Google Scholar] [CrossRef] [Scilit]
- Lausch, A.; Erasmi, S.; King, D.; Magdon, P.; Heurich, M. Understanding Forest Health with Remote Sensing -Part I—A Review of Spectral Traits, Processes and Remote-Sensing Characteristics. Remote Sens. 2016, 8, 1029. [Google Scholar] [CrossRef] [Scilit]
- Cheng, J.; Yang, H.; Qi, J.; Sun, Z.; Han, S.; Feng, H.; Jiang, J.; Xu, W.; Li, Z.; Yang, G.; et al. Estimating canopy-scale chlorophyll content in apple orchards using a 3D radiative transfer model and UAV multispectral imagery. Comput. Electron. Agric. 2022, 202, 107401. [Google Scholar] [CrossRef] [Scilit]
- Lausch, A.; Bastian, O.; Klotz, S.; Leitão, P.J.; Jung, A.; Rocchini, D.; Schaepman, M.E.; Skidmore, A.K.; Tischendorf, L.; Knapp, S. Understanding and assessing vegetation health by in situ species and remote-sensing approaches. Methods Ecol. Evol. 2018, 9, 1799–1809. [Google Scholar]
- Lausch, A.; Erasmi, S.; King, D.J.; Magdon, P.; Heurich, M. Understanding forest health with Remote sensing-Part II-A review of approaches and data models. Remote Sens. 2017, 9, 129. [Google Scholar] [CrossRef] [Scilit]
- Haboudane, D.; Miller, J.R.; Tremblay, N.; Zarco-Tejada, P.J.; Dextraze, L. Integrated narrow-band vegetation indices for prediction of crop chlorophyll content for application to precision agriculture. Remote Sens. Environ. 2002, 81, 416–426. [Google Scholar] [CrossRef] [Scilit]
- Qian, B.; Ye, H.; Huang, W.; Xie, Q.; Pan, Y.; Xing, N.; Ren, Y.; Guo, A.; Jiao, Q.; Lan, Y. A sentinel-2-based triangular vegetation index for chlorophyll content estimation. Agric. For. Meteorol. 2022, 322, 109000. [Google Scholar] [CrossRef] [Scilit]
- Holtgrave, A.K.; Röder, N.; Ackermann, A.; Erasmi, S.; Kleinschmit, B. Comparing Sentinel-1 and -2 data and indices for agricultural land use monitoring. Remote Sens. 2020, 12, 2919. [Google Scholar] [CrossRef] [Scilit]
- Wu, Q.; Zhang, Y.; Zhao, Z.; Xie, M.; Hou, D. Estimation of Relative Chlorophyll Content in Spring Wheat Based on Multi-Temporal UAV Remote Sensing. Agronomy 2023, 13, 211. [Google Scholar] [CrossRef] [Scilit]
- Brewer, K.; Clulow, A.; Sibanda, M.; Gokool, S.; Naiken, V.; Mabhaudhi, T. Predicting the Chlorophyll Content of Maize over Phenotyping as a Proxy for Crop Health in Smallholder Farming Systems. Remote Sens. 2022, 14, 518. [Google Scholar] [CrossRef] [Scilit]
- Candiani, G.; Tagliabue, G.; Panigada, C.; Verrelst, J.; Picchi, V.; Rivera Caicedo, J.P.; Boschetti, M. Evaluation of Hybrid Models to Estimate Chlorophyll and Nitrogen Content of Maize Crops in the Framework of the Future CHIME Mission. Remote Sens. 2022, 14, 1792. [Google Scholar] [CrossRef] [Scilit]
- Delloye, C.; Weiss, M.; Defourny, P. Retrieval of the canopy chlorophyll content from Sentinel-2 spectral bands to estimate nitrogen uptake in intensive winter wheat cropping systems. Remote Sens. Environ. 2018, 216, 245–261. [Google Scholar] [CrossRef] [Scilit]
- De Grave, C.; Verrelst, J.; Morcillo-Pallarés, P.; Pipia, L.; Rivera-Caicedo, J.P.; Amin, E.; Belda, S.; Moreno, J. Quantifying vegetation biophysical variables from the Sentinel-3/FLEX tandem mission: Evaluation of the synergy of OLCI and FLORIS data sources. Remote Sens. Environ. 2020, 251, 112101. [Google Scholar] [CrossRef] [Scilit] [PubMed]
- Mohammed, G.H.; Colombo, R.; Middleton, E.M.; Rascher, U.; van der Tol, C.; Nedbal, L.; Goulas, Y.; Pérez-Priego, O.; Damm, A.; Meroni, M.; et al. Remote sensing of solar-induced chlorophyll fluorescence (SIF) in vegetation: 50 years of progress. Remote Sens. Environ. 2019, 231, 111177. [Google Scholar] [CrossRef] [Scilit] [PubMed]
- Geng, G.; Gu, Q.; Zhou, H.; Zhang, B.; He, Z.; Zheng, R. Random forest model that incorporates solar-induced chlorophyll fluorescence data can accurately track crop yield variations under drought conditions. Ecol. Inform. 2025, 85, 102972. [Google Scholar]
- Wu, Y.; Zhang, Z.; Wu, L.; Zhang, Y. Solar-induced chlorophyll fluorescence and its relationship with photosynthesis during waterlogging in a maize field. Agric. For. Meteorol. 2025, 363, 110404. [Google Scholar] [CrossRef] [Scilit]
- Li, Z.; Zhang, Q.; Li, J.; Yang, X.; Wu, Y.; Zhang, Z.; Wang, S.; Wang, H.; Zhang, Y. Solar-induced chlorophyll fluorescence and its link to canopy photosynthesis in maize from continuous ground measurements. Remote Sens. Environ. 2020, 236, 111420. [Google Scholar] [CrossRef] [Scilit]
- Song, L.; Cai, J.; Wu, K.; Li, Y.; Hou, G.; Du, S.; Duan, J.; He, L.; Guo, T.; Feng, W. Early diagnosis of wheat powdery mildew using solar-induced chlorophyll fluorescence and hyperspectral reflectance. Eur. J. Agron. 2025, 162, 127614. [Google Scholar]
- Galle, N.J.; Brinton, W.; Vos, R.; Basu, B.; Duarte, F.; Collier, M.; Ratti, C.; Pilla, F. Correlation of WorldView-3 spectral vegetation indices and soil health indicators of individual urban trees with exceptions to topsoil disturbance. City Environ. Interact. 2021, 11, 100068. [Google Scholar] [CrossRef] [Scilit]
- Wei, S.; Yin, T.; Yuan, B.; Lai Fern Ow, G.; Lokman Mohd, Y.M.; Gastellu-Etchegorry, J.-P.; Whittle, A.J. Estimation of chlorophyll content for urban trees from UAV hyperspectral images. Int. J. Appl. Earth Obs. Geoinf. 2024, 126, 103617. [Google Scholar]
- Conzen, M.P. Thinking About Urban Form: Papers on Urban Morphology, 1932–1998; Peter Lang: Oxford, UK; Bern, Switzerland; Berlin, Germany; Bruxeless, Belgium; Frankfurt am Main, Germany; New York, NY, USA; Wien, Austria, 2004; ISBN 3-03910-276-1. [Google Scholar]
- Masini, N.; Abate, N.; Gizzi, F.; Vitale, V.; Minervino Amodio, A.; Sileo, M.; Biscione, M.; Lasaponara, R.; Bentivenga, M.; Cavalcante, F. UAV LiDAR Based Approach for the Detection and Interpretation of Archaeological Micro Topography under Canopy—The Rediscovery of Perticara (Basilicata, Italy). Remote Sens. 2022, 14, 6074. [Google Scholar]
- Wang, Z.; Chen, X.; Huang, N.; Yang, Y.; Wang, L.; Wang, Y. Spatial Identification and Redevelopment Evaluation of Brownfields in the Perspective of Urban Complex Ecosystems: A Case of Wuhu City, China. Int. J. Environ. Res. Public Health 2022, 19, 478. [Google Scholar] [CrossRef] [Scilit] [PubMed]
- Hafner, S.; Fang, H.; Azizpour, H.; Ban, Y. Continuous Urban Change Detection From Satellite Image Time Series With Temporal Feature Refinement and Multitask Integration. IEEE Trans. Geosci. Remote Sens. 2025, 63, 5604518. [Google Scholar] [CrossRef] [Scilit]
- Alphan, H.; Karamanli, E.; Derse, M.A.; Uslu, C. Analyzing pattern features of urban/rural residential land use change: The case of the southern coast of Turkey. Land Use Policy 2022, 122, 106348. [Google Scholar] [CrossRef] [Scilit]
- Xie, J.; Xie, B.; Zhou, K.; Li, J.; Xiao, J.; Liu, C. Impacts of landscape pattern on ecological network evolution in Changsha-Zhuzhou-Xiangtan Urban Agglomeration, China. Ecol. Indic. 2022, 145, 109716. [Google Scholar]
- Cengiz, S.; Görmüş, S.; Oğuz, D. Analysis of the urban growth pattern through spatial metrics; Ankara City. Land Use Policy 2022, 112, 105812. [Google Scholar] [CrossRef] [Scilit]
- Hu, C.; Wu, W.; Zhou, X.; Wang, Z. Spatiotemporal changes in landscape patterns in karst mountainous regions based on the optimal landscape scale: A case study of Guiyang City in Guizhou Province, China. Ecol. Indic. 2023, 150, 110211. [Google Scholar] [CrossRef] [Scilit]
- Ge, S.; Zhan, W.; Wang, S.; Du, H.; Liu, Z.; Wang, C.; Wang, C.; Jiang, S.; Dong, P. Spatiotemporal heterogeneity in global urban surface warming. Remote Sens. Environ. 2024, 305, 114081. [Google Scholar] [CrossRef] [Scilit]
- Cilek, A.; Unal, M.; Middel, A. The effects of 2-D and 3-D urban landscape metrics on mean radiant temperature in hot-arid Phoenix and Tempe, Arizona, USA. Sustain. Cities Soc. 2024, 101, 105116. [Google Scholar] [CrossRef] [Scilit]
- Dong, X.; Ye, Y.; Su, D.; Haase, D.; Lausch, A. Optimizing urban tree species composition to maximize nature-based solutions. npj Urban Sustain. 2026, 6, 15. [Google Scholar] [CrossRef] [Scilit]
- Gazal, C.; Kross, A.; Donnini, J.; Turner, S.E. Assessing urban herbaceous plant biodiversity using drone remote sensing: The trade-offs of spatial resolution. Urban Ecosyst. 2026, 29, 41. [Google Scholar] [CrossRef] [Scilit]
- Wang, J.; Xu, C.; Pauleit, S.; Kindler, A.; Banzhaf, E. Spatial patterns of urban green infrastructure for equity: A novel exploration. J. Clean. Prod. 2019, 238, 117858. [Google Scholar] [CrossRef] [Scilit]
- Hill, M.O.; Roy, D.B.; Thompson, K. Hemeroby, urbanity and ruderality: Bioindicators of disturbance and human impact. J. Appl. Ecol. 2002, 39, 708–720. [Google Scholar] [CrossRef] [Scilit]
- McKinney, M.L. Urbanization as a major cause of biotic homogenization. Biol. Conserv. 2006, 127, 247–260. [Google Scholar] [CrossRef] [Scilit]
- Rocchini, D.; Luque, S.; Pettorelli, N.; Bastin, L.; Doktor, D.; Faedi, N.; Feilhauer, H.; Féret, J.; Foody, G.M.; Gavish, Y.; et al. Measuring β-diversity by remote sensing: A challenge for biodiversity monitoring. Methods Ecol. Evol. 2018, 9, 1787–1798. [Google Scholar]
- Féret, J.; de Boissieu, F. biodivMapR: An R package for α- and β-diversity mapping using remotely sensed images. Methods Ecol. Evol. 2020, 11, 64–70. [Google Scholar]
- Rossi, C.; Kneubühler, M.; Schütz, M.; Schaepman, M.E.; Haller, R.M.; Risch, A.C. Remote sensing of spectral diversity: A new methodological approach to account for spatio-temporal dissimilarities between plant communities. Ecol. Indic. 2021, 130, 108106. [Google Scholar] [CrossRef] [Scilit]
- Fukano, Y.; Uchida, K.; Tachiki, Y. Urban-rural gradients: How landscape changes drive adaptive evolution of plant competitive traits. Evol. Ecol. 2023, 37, 215–232. [Google Scholar]
- Chen, X.; Wang, Z. Distribution pattern and composition difference of urban spontaneous plants of multi-mountainous city. Glob. Ecol. Conserv. 2025, 59, e03564. [Google Scholar] [CrossRef] [Scilit]
- Abunnasr, Y.; Mhawej, M.; Chrysoulakis, N. SEBU: A novel fully automated Google Earth Engine surface energy balance model for urban areas. Urban Clim. 2022, 44, 101187. [Google Scholar] [CrossRef] [Scilit]
- Fariha, J.N.; Miah, M.T.; Limon, Z.A.; Alsulamy, S.; Kafy, A.A.; Rahman, S.N. Quantifying spatial dynamics of urban sprawl for climate resilience sustainable natural resource management by utilizing geostatistical and remote sensing techniques. Theor. Appl. Climatol. 2024, 155, 6307–6349. [Google Scholar] [CrossRef] [Scilit]
- Ahmadi, K.; Sahak, A.S.; Sahak, A.T. Evaluation of Urban Sprawl and Land Use/Cover Variation Patterns through Remote Sensing Data: A Case Study in Kabul City, Afghanistan. Eur. J. Environ. Earth Sci. 2023, 4, 10–20. [Google Scholar] [CrossRef] [Scilit]
- Shao, Z.; Sumari, N.S.; Portnov, A.; Ujoh, F.; Musakwa, W.; Mandela, P.J. Urban sprawl and its impact on sustainable urban development: A combination of remote sensing and social media data. Geo-Spat. Inf. Sci. 2021, 24, 241–255. [Google Scholar]
- Ranagalage, M.; Morimoto, T.; Simwanda, M.; Murayama, Y. Spatial Analysis of Urbanization Patterns in Four Rapidly Growing South Asian Cities Using Sentinel-2 Data. Remote Sens. 2021, 13, 1531. [Google Scholar] [CrossRef] [Scilit]
- Das, S.; Angadi, D.P. Land use land cover change detection and monitoring of urban growth using remote sensing and GIS techniques: A micro-level study. GeoJournal 2022, 87, 2101–2123. [Google Scholar]
- Fontana, A.G.; Nascimento, V.F.; Ometto, J.P.; do Amaral, F.H.F. Analysis of past and future urban growth on a regional scale using remote sensing and machine learning. Front. Remote Sens. 2023, 4, 1186388. [Google Scholar] [CrossRef] [Scilit]
- Zou, Y.; Shen, J.; Chen, Y.; Zhang, B. Monitoring Urban Expansion (2000–2020) in Yangtze River Delta Using Time-Series Nighttime Light Data and MODIS NDVI. Sustainability 2023, 15, 9764. [Google Scholar] [CrossRef] [Scilit]
- Yaagoubi, R.; Lakber, C.-E.; Miky, Y. A comparative analysis on the use of a cellular automata Markov chain versus a convolutional LSTM model in forecasting urban growth using sentinel 2A images. J. Land Use Sci. 2024, 19, 258–277. [Google Scholar] [CrossRef] [Scilit]
- Srivastava, S.; Ahmed, T.; Kumar, R. Urban Growth Estimation of Moradabad City Using Sentinel-2 Images. In Proceedings of the 2024 International Conference on Artificial Intelligence and Emerging Technology (Global AI Summit); IEEE: Greater Noida, India, 2024; pp. 1212–1216. [Google Scholar]
- Rocchini, D.; Dadalt, L.; Delucchi, L.; Neteler, M.; Palmer, M.W. Disentangling the role of remotely sensed spectral heterogeneity as a proxy for North American plant species richness. Community Ecol. 2014, 15, 37–43. [Google Scholar] [CrossRef] [Scilit]
- Rocchini, D.; Marcantonio, M.; Ricotta, C. Measuring Rao’s Q diversity index from remote sensing: An open source solution. Ecol. Indic. 2017, 72, 234–238. [Google Scholar]
- Rocchini, D.; Bacaro, G.; Chirici, G.; Da Re, D.; Feilhauer, H.; Foody, G.M.; Galluzzi, M.; Garzon-Lopez, C.X.; Gillespie, T.W.; He, K.S.; et al. Remotely sensed spatial heterogeneity as an exploratory tool for taxonomic and functional diversity study. Ecol. Indic. 2018, 85, 983–990. [Google Scholar] [CrossRef] [Scilit]
- Bhatt, M.M.; Gupta, K.; Danodia, A.; Chakroborty, S.D.; Patel, N.R. Detailed urban roughness parametrization for anthropogenic heat flux estimation using earth observation data. Heliyon 2023, 9, e18361. [Google Scholar] [CrossRef] [Scilit] [PubMed]
- Li, M.; Wang, Y.; Rosier, J.F.; Verburg, P.H.; van Vliet, J. Global maps of 3D built-up patterns for urban morphological analysis. Int. J. Appl. Earth Obs. Geoinf. 2022, 114, 103048. [Google Scholar] [CrossRef] [Scilit]
- He, T.; Cao, S.; Lu, Y.; Zhang, M.; Guo, A.; Liu, B. From Density to Efficiency: Exploring Urban Building Use Efficiency in 35 Large Chinese Cities. Buildings 2025, 15, 1803. [Google Scholar] [CrossRef] [Scilit]
- Liu, X.; Wu, X.; Li, X.; Xu, X.; Liao, W.; Jiao, L.; Zeng, Z.; Chen, G.; Li, X. Global Mapping of Three-Dimensional Urban Structures Reveals Escalating Utilization in the Vertical Dimension and Pronounced Building Space Inequality. Engineering 2025, 47, 86–99. [Google Scholar]
- Schreyer, J.; Geis, C.; Lakes, T. TanDEM-X for Large-Area Modeling of Urban Vegetation Height: Evidence from Berlin, Germany. IEEE J. Sel. Top. Appl. Earth Obs. Remote Sens. 2016, 9, 1876–1887. [Google Scholar]
- Yu, Q.; Acheampong, M.; Pu, R.; Landry, S.M.; Ji, W.; Dahigamuwa, T. Assessing effects of urban vegetation height on land surface temperature in the City of Tampa, Florida, USA. Int. J. Appl. Earth Obs. Geoinf. 2018, 73, 712–720. [Google Scholar] [CrossRef] [Scilit]
- Kothencz, G.; Kulessa, K.; Anyyeva, A.; Lang, S. Urban vegetation extraction from VHR (tri-)stereo imagery—A comparative study in two central European cities. Eur. J. Remote Sens. 2018, 51, 285–300. [Google Scholar] [CrossRef] [Scilit] [PubMed]
- Schreyer, J.; Byron Walker, B.; Lakes, T. Implementing urban canopy height derived from a TanDEM-X-DEM: An expert survey and case study. ISPRS J. Photogramm. Remote Sens. 2022, 187, 345–361. [Google Scholar]
- Wu, J.; Meng, Q.; Gao, L.; Zhang, L.; Zhao, M.; Su, C. A deep learning framework for 3D vegetation extraction in complex urban environments. Int. J. Appl. Earth Obs. Geoinf. 2024, 129, 103798. [Google Scholar] [CrossRef] [Scilit]
- Li, R.; Bai, Z.; Ye, C.; Ablameyko, S.; Ye, S. Urban green space vegetation height modeling and intelligent classification based on UAV multi-spectral and oblique high-resolution images. Urban For. Urban Green. 2025, 107, 128785. [Google Scholar]
- Jovanović, D.; Milovanov, S.; Ruskovski, I.; Govedarica, M.; Sladić, D.; Radulović, A.; Pajić, V. Building Virtual 3D City Model for Smart Cities Applications: A Case Study on Campus Area of the University of Novi Sad. ISPRS Int. J. Geo-Inf. 2020, 9, 476. [Google Scholar] [CrossRef] [Scilit]
- Esch, T.; Zeidler, J.; Palacios-lopez, D.; Marconcini, M.; Roth, A.; Mönks, M.; Leutner, B.; Brzoska, E.; Metz-marconcini, A.; Bachofer, F.; et al. Towards a Large-Scale 3D Modeling of the Built Environment—Joint Analysis of TanDEM-X, Sentinel-2 and Open Street Map Data. Remote Sens. 2020, 12, 3579. [Google Scholar]
- Chen, Z.; Yu, B.; Yang, C.; Zhou, Y.; Yao, S.; Qian, X.; Wang, C.; Wu, B.; Wu, J. An extended time series (2000–2018) of global NPP-VIIRS-like nighttime light data from a cross-sensor calibration. Earth Syst. Sci. Data 2021, 13, 889–906. [Google Scholar] [CrossRef] [Scilit]
- Jing, Q.; Marino, A.; Ji, Y.; Zhao, H.; Huang, G.; Wang, L. Spatial and Temporal Change Analysis of Urban Built-Up Area via Nighttime Lighting Data—A Case Study with Yunnan and Guizhou Provinces. Land 2024, 13, 1677. [Google Scholar] [CrossRef] [Scilit]
- Catalán, G.; Di Bella, C.; Meli, P.; de la Barrera, F.; Vargas-Gaete, R.; Reyes-Riveros, R.; Reyes-Packe, S.; Altamirano, A. Every Pixel You Take: Unlocking Urban Vegetation Insights Through High- and Very-High-Resolution Remote Sensing. Urban Sci. 2025, 9, 385. [Google Scholar] [CrossRef] [Scilit]
- Wang, S.; Liu, C.; Wei, S.; Tang, H. Urban tree species classification using multisource satellite remote sensing data and street view imagery. Geo-Spat. Inf. Sci. 2025, 28, 164–184. [Google Scholar] [CrossRef] [Scilit]
- Jiang, Y.; Li, X.; Peng, L.; Li, C.; Song, T. Assessing the potential of multi-seasonal Sentinel-2 satellite imagery combined with airborne LiDAR for urban tree species identification. Sci. Rep. 2025, 15, 25107. [Google Scholar] [CrossRef] [Scilit] [PubMed]
- Gardossi, A.L.; Tomao, A.; Choudhury, M.A.M.; Marcheggiani, E.; Sigura, M. Semi-Automatic Extraction of Hedgerows from High-Resolution Satellite Imagery. Remote Sens. 2025, 17, 1506. [Google Scholar] [CrossRef] [Scilit]
- Singh, R.; Bhadouria, R.; Tripathi, S.; Kumar, R.; Hema, K. Invasive Alien Plants in Urban Ecosystems; Springer: Cham, Switzerland, 2025; ISBN 9783032009968. [Google Scholar]
- Tigges, J.; Lakes, T.; Hostert, P. Urban vegetation classification: Benefits of multitemporal RapidEye satellite data. Remote Sens. Environ. 2013, 136, 66–75. [Google Scholar] [CrossRef] [Scilit]
- Alonzo, M.; Mcfadden, J.P.; Nowak, D.J.; Roberts, D.A. Mapping urban forest structure and function using hyperspectral imagery and lidar data. Urban For. Urban Green. 2016, 17, 135–147. [Google Scholar] [CrossRef] [Scilit]
- Pu, R.; Landry, S. Mapping urban tree species by integrating multi-seasonal high resolution pléiades satellite imagery with airborne LiDAR data. Urban For. Urban Green. 2020, 53, 126675. [Google Scholar]
- Neyns, R.; Canters, F. Mapping of Urban Vegetation with High-Resolution Remote Sensing: A Review. Remote Sens. 2022, 14, 1031. [Google Scholar] [CrossRef] [Scilit]
- Sicard, P.; Coulibaly, F.; Lameiro, M.; Araminiene, V.; Marco, A.D.; Sorrentino, B.; Anav, A.; Manzini, J.; Hoshika, Y.; Baesso, B.; et al. Object-based classification of urban plant species from very high-resolution satellite imagery. Urban For. Urban Green. 2023, 81, 127866. [Google Scholar]
- Tiwari, A.; Kira, O.; Bamah, J.; Boneh, H.; Karnieli, A. Multi-Sensor Classification Framework of Urban Vegetation for Improving Ecological Services Management. Remote Sens. 2024, 16, 1110. [Google Scholar] [CrossRef] [Scilit]
- Perretta, M.; Delogu, G.; Funsten, C.; Patriarca, A.; Caputi, E.; Boccia, L. Testing the Impact of Pansharpening Using PRISMA Hyperspectral Data: A Case Study Classifying Urban Trees in Naples, Italy. Remote Sens. 2024, 16, 3730. [Google Scholar] [CrossRef] [Scilit]
- Pirbasti, M.A.; McArdle, G.; Akbari, V. Hedgerows Monitoring in Remote Sensing: A Comprehensive Review. IEEE Access 2024, 12, 156184–156207. [Google Scholar] [CrossRef] [Scilit]
- Allory, V.; Cambou, A.; Moulin, P.; Schwartz, C.; Cannavo, P.; Vidal-Beaudet, L.; Barthès, B.G. Quantification of soil organic carbon stock in urban soils using visible and near infrared reflectance spectroscopy (VNIRS) in situ or in laboratory conditions. Sci. Total Environ. 2019, 686, 764–773. [Google Scholar] [CrossRef] [Scilit] [PubMed]
- Mohamed, M. Classification of Landforms for Digital Soil Mapping in Urban Areas Using LiDAR Data Derived Terrain Attributes: A Case Study from Berlin, Germany. Land 2020, 9, 319. [Google Scholar] [CrossRef] [Scilit]
- Hong, Y.; Chen, Y.; Chen, S.; Shen, R.; Hu, B.; Peng, J.; Wang, N.; Guo, L.; Zhuo, Z.; Yang, Y.; et al. Data mining of urban soil spectral library for estimating organic carbon. Geoderma 2022, 426, 116102. [Google Scholar] [CrossRef] [Scilit]
- Angelopoulou, T.; Chabrillat, S.; Pignatti, S.; Milewski, R.; Karyotis, K.; Brell, M.; Ruhtz, T.; Bochtis, D.; Zalidis, G. Evaluation of Airborne HySpex and Spaceborne PRISMA Hyperspectral Remote Sensing Data for Soil Organic Matter and Carbonates Estimation. Remote Sens. 2023, 15, 1106. [Google Scholar] [CrossRef] [Scilit]
- Oberholzer, S.; Summerauer, L.; Steffens, M.; Ifejika Speranza, C. Best performances of visible–near-infrared models in soils with little carbonate—A field study in Switzerland. Soil 2024, 10, 231–249. [Google Scholar]
- Lausch, A.; Schaepman, M.E.; Skidmore, A.K.; Catana, E.; Bannehr, L.; Bastian, O.; Borg, E.; Bumberger, J.; Dietrich, P.; Glässer, C.; et al. Remote Sensing of Geomorphodiversity Linked to Biodiversity—Part III: Traits, Processes and Remote Sensing Characteristics. Remote Sens. 2022, 14, 2279. [Google Scholar] [CrossRef] [Scilit]
- Li, W. Mapping Urban Impervious Surfaces by Using Spectral Mixture Analysis and Spectral Indices. Remote Sens. 2019, 12, 94. [Google Scholar] [CrossRef] [Scilit]
- Shao, Z.; Zhang, Y.; Zhang, C.; Huang, X.; Cheng, T. Mapping impervious surfaces with a hierarchical spectral mixture analysis incorporating endmember spatial distribution. Geo-Spat. Inf. Sci. 2022, 25, 550–567. [Google Scholar] [CrossRef] [Scilit]
- Peroni, F.; Pappalardo, S.E.; Facchinelli, F.; Crescini, E.; Munafò, M.; Hodgson, M.E.; De Marchi, M. How to map soil sealing, land take and impervious surfaces? A systematic review. Environ. Res. Lett. 2022, 17, 053005. [Google Scholar] [CrossRef] [Scilit]
- Xu, S.; Fina, S. National-scale imperviousness mapping and detection of urban land changes. ISPRS J. Photogramm. Remote Sens. 2023, 202, 369–384. [Google Scholar] [CrossRef] [Scilit]
- Shao, Z.; Cheng, T.; Fu, H.; Li, D.; Huang, X. Emerging Issues in Mapping Urban Impervious Surfaces Using High-Resolution Remote Sensing Images. Remote Sens. 2023, 15, 2562. [Google Scholar] [CrossRef] [Scilit]
- Guo, S.; Wu, W.; Shao, Z.; Teng, J.; Li, D. Extracting urban impervious surface based on optical and SAR images cross-modal multi-scale features fusion network. Int. J. Digit. Earth 2024, 17, 2361410. [Google Scholar]
- Xu, L.; Sun, G.; Zhang, A.; Han, Z.; Li, Z.; Zhao, Y. Automatic mapping of high-resolution impervious surfaces driven by hierarchical adaptive features. Sci. Remote Sens. 2025, 12, 100300. [Google Scholar] [CrossRef] [Scilit]
- Lin, Y.; Zhang, H.; Li, G.; Wan, L.; Wang, F.; Ma, P.; Lin, H. Improving urban impervious surface extraction by synergizing hyperspectral and polarimetric radar data using sparse representation. Egypt. J. Remote Sens. Space Sci. 2022, 25, 1045–1056. [Google Scholar] [CrossRef] [Scilit]
- Shen, Y.; Kong, W.; Fei, F.; Chen, X.; Xu, Y.; Huang, C.; Yao, J. Stereoscopic urban morphology metrics enhance the nonlinear scale heterogeneity modeling of UHI with explainable AI. Urban Clim. 2024, 56, 102006. [Google Scholar] [CrossRef] [Scilit]
- Dong, X.; Yang, R.; Ye, Y.; Yi, S.; Haase, D.; Lausch, A. Planning for green infrastructure by integrating multi-driver: Ranking priority based on accessibility equity. Sustain. Cities Soc. 2024, 114, 105767. [Google Scholar] [CrossRef] [Scilit]
- Yin, Z.; Liu, Z.; Liu, X.; Zheng, W.; Yin, L. Urban heat islands and their effects on thermal comfort in the US: New York and New Jersey. Ecol. Indic. 2023, 154, 110765. [Google Scholar] [CrossRef] [Scilit]
- Pattnaik, N.; Rahman, M.A.; Pauleit, S. Urban vegetation structure and composition influence pedestrian thermal comfort in public spaces: A case study in Munich. Urban For. Urban Green. 2025, 114, 129162. [Google Scholar] [CrossRef] [Scilit]
- Chunming, H.; Shuaiqi, L.; Xi, D. A new method for evaluate the cold island effect in cities. Urban Clim. 2024, 54, 101846. [Google Scholar] [CrossRef] [Scilit]
- Briegel, F.; Pinto, J.G.; Christen, A. Is satellite land surface temperature an appropriate proxy for intra-urban variability of daytime heat stress ? Remote Sens. Environ. 2025, 331, 115045. [Google Scholar]
- Lin, Z.; Xu, H.; Hu, X.; Liu, Z.; Yao, X.; Zhu, Z. Characterizing the seasonal relationships between urban heat island and surface energy balance fluxes considering the impact of three-dimensional urban morphology. Build. Environ. 2024, 265, 112017. [Google Scholar] [CrossRef] [Scilit]
- Guo, B.; Hu, D.; Wang, S.; Lin, A.; Kuang, H. Estimation of gridded anthropogenic heat flux at the optimal scale by integrating SDGSAT-1 nighttime lights and geospatial data. Int. J. Appl. Earth Obs. Geoinf. 2023, 125, 103596. [Google Scholar] [CrossRef] [Scilit]
- Guo, F.; Sun, J.; Hu, D. Surface energy balance-based surface urban heat island decomposition at high resolution. Remote Sens. Environ. 2024, 315, 114447. [Google Scholar] [CrossRef] [Scilit]
- Guo, B.; Hu, D.; Liu, Y.; Wang, Y.; Zhou, Y.; Kuang, H. Mapping time-series anthropogenic heat flux using the top-down inventory and temporal downscaling in Beijing-Tianjin-Hebei megaregion of China. Int. J. Digit. Earth 2024, 8947, 2391190. [Google Scholar]
- Yang, M.; Cao, S.; Zhang, D.; Liu, R.; Cui, L.; Cai, Y. Seasonal anthropogenic heat fluxes over 200 cities in China: An investigation of driving factors with three-dimensional building forms. Sustain. Cities Soc. 2024, 107, 105312. [Google Scholar] [CrossRef] [Scilit]
- Patel, M.; Desai, D.; Shah, Z. Decadal Assessment of Urbanization Impacts on Surface Energy Balance and Thermal Dynamics using Remote Sensing data: A Case Study of Ahmedabad, India. Indian J. Sci. Technol. 2025, 18, 2608–2619. [Google Scholar] [CrossRef] [Scilit]
- Lin, Y. Improving Impervious Surface Extraction With Shadow-Based Sparse Representation From. IEEE J. Sel. Top. Appl. EARTH Obs. Remote Sens. 2019, 12, 2417–2428. [Google Scholar] [CrossRef] [Scilit]
- Diem, J.E.; Carlton, D.K.; Pangle, L.A. Evapotranspiration From Developed Land and Urban Watersheds in a Humid Subtropical Climate. Water Resour. Res. 2023, 59, e2023WR034216. [Google Scholar] [CrossRef] [Scilit]
- Vulova, S.; Duarte, A.; Meier, F.; Nouri, H.; Schulz, C.; Soulsby, C.; Tetzlaff, D.; Kleinschmit, B. City-wide, high-resolution mapping of evapotranspiration to guide climate-resilient planning. Remote Sens. Environ. 2023, 287, 113487. [Google Scholar]
- Wei, Z.; Liu, J.; Gao, X.; Wu, Y.; Liu, Z.; Yao, J. Diurnal variations in cooling effects of urban parks based on ECOSTRESS data: A case study of Beijing. Urban Clim. 2024, 58, 102229. [Google Scholar] [CrossRef] [Scilit]
- Sigopi, M.; Shoko, C.; Dube, T. Advancements in remote sensing technologies for accurate monitoring and management of surface water resources in Africa: An overview, limitations, and future directions. Geocarto Int. 2024, 39, 2356714. [Google Scholar] [CrossRef] [Scilit]
- Taloor, A.K.; Sharma, S.; Sharma, D.; Chib, R.; Jasrotia, R.; Gupta, S.; Kothyari, G.C.; Mehta, P.; Kale, R.V. Estimation of MFFPI for flood hazards assessment using geospatial technology in the Tawi Basin, India. Geosyst. Geoenviron. 2024, 3, 100235. [Google Scholar]
- Diriba, D.; Takele, T.; Karuppannan, S.; Husein, M. Flood hazard analysis and risk assessment using remote sensing, GIS, and AHP techniques: A case study of the Gidabo Watershed, main Ethiopian. Geomat. Nat. Hazards Risk 2024, 15, 2367803. [Google Scholar] [CrossRef] [Scilit]
- Dong, X.; Ye, Y.; Su, D.; Yi, S.; Yang, R.; Haase, D.; Lausch, A. Adaptive ranking of specific tree species for targeted green infrastructure intervention in response to urban hazards. Urban For. Urban Green. 2025, 107, 128776. [Google Scholar] [CrossRef] [Scilit]
- Zhang, A.; Han, Z.; Sun, G.; Chen, X.; Cheng, J.; Zhang, H. An impervious surfaces extraction method based on optical, ascending and descending SAR remote sensing imagery in high-density urban core areas. Int. J. Appl. Earth Obs. Geoinf. 2025, 140, 104595. [Google Scholar] [CrossRef] [Scilit]
- Ahn, D.Y.; Goldberg, D.L.; Liu, F.; Anderson, D.C.; Loughner, C.P.; Kiel, M.; Chatterjee, A. Special Collection: Satellite-Based Analysis of CO2 Emissions From Global Cities: Regional, Economic, and Demographic Attributes. AGU Adv. 2025, 6, e2025AV001452. [Google Scholar]
- Che, K.; Lauvaux, T.; Taquet, N.; Stremme, W.; Xu, Y.; Alberti, C.; Lopez, M.; Reynoso, A.G.; Ciais, P.; Liu, Y.; et al. CO2 Emissions Estimate From Mexico City Using Ground- and Space-Based Remote Sensing. J. Geophys. Res. Atmos. 2024, 129, e2024JD041278. [Google Scholar]
- Brazidec, J.D.L.; Vanderbecken, P.; Farchi, A.; Broquet, G.; Kuhlmann, G.; Bocquet, M. Quantification of CO2 hotspot emissions from OCO-3 SAM CO2 satellite images using deep learning methods. Geosci. Model Dev. 2025, 18, 3607–3622. [Google Scholar] [CrossRef] [Scilit]
- Liu, Z.; Li, J.; Chen, H.; Wang, L.; Plaza, A. Monitoring changes in nighttime lights and anthropogenic CO2 emissions during geopolitical conflicts from a remote sensing perspective. Humanit. Soc. Sci. Commun. 2025, 12, 612. [Google Scholar] [CrossRef] [Scilit]
- Shetty, S.; Schneider, P.; Stebel, K.; Hamer, P.D.; Kylling, A.; Berntsen, T.K. Estimating surface NO2 concentrations over Europe using Sentinel-5P TROPOMI observations and Machine Learning. Remote Sens. Environ. 2024, 312, 114321. [Google Scholar] [CrossRef] [Scilit]
- Wang, C.; Wang, T.; Cai, Z.; Zhao, X.; Wang, W.; Liu, Y.; Wang, P. Analysis of Tropospheric NO2 Observation Using Pandora and MAX-DOAS Instrument in Xianghe, North China. Remote Sens. 2025, 17, 1695. [Google Scholar] [CrossRef] [Scilit]
- Huber, D.E.; Kerr, G.H.; Nawaz, M.O.; Runkel, S.; Anenberg, S.C.; Goldberg, D.L. TROPOMI NO2 for urban and polluted areas globally from 2019 to 2024. EGUsphere 2025, 2025, 1–33. [Google Scholar]
- Ojeda-Castillo, V.; Murillo-Tovar, M.A.; Hernández-Mena, L.; Saldarriaga-Noreña, H.; Vargas-Amado, M.E.; Herrera-López, E.J.; Díaz, J. Tropospheric NO2: Anthropogenic Influence, Global Trends, Satellite Data, and Machine Learning Application. Remote Sens. Environ. 2025, 17, 49. [Google Scholar]
- Cui, Y.; Xiao, X.; Zhang, Y.; Dong, J.; Qin, Y.; Doughty, R.B.; Zhang, G.; Wang, J.; Wu, X.; Qin, Y.; et al. Temporal consistency between gross primary production and solar-induced chlorophyll fluorescence in the ten most populous megacity areas over years. Sci. Rep. 2017, 7, 14963. [Google Scholar] [CrossRef] [Scilit] [PubMed]
- Wang, J.; Lu, S.; Wang, W.; Tang, L.; Ma, S.; Wang, Y. Estimating vegetation productivity of urban regions using sun-induced chlorophyll fluorescence data derived from the OCO-2 satellite. Phys. Chem. Earth Parts A/B/C 2019, 114, 102783. [Google Scholar] [CrossRef] [Scilit]
- Wu, D.; Lin, J.C.; Duarte, H.F.; Yadav, V.; Parazoo, N.C.; Oda, T.; Kort, E.A. A model for urban biogenic CO2 fluxes: Solar-Induced Fluorescence for Modeling Urban biogenic Fluxes (SMUrF v1). Geosci. Model Dev. 2021, 14, 3633–3661. [Google Scholar]
- Cui, Y.; Xiao, X.; Dong, J.; Zhang, Y.; Qin, Y.; Doughty, R.B.; Wu, X.; Liu, X.; Joiner, J.; Moore, B. Continued Increases of Gross Primary Production in Urban Areas during 2000–2016. J. Remote Sens. 2022, 2022, 9835624. [Google Scholar] [CrossRef] [Scilit]
- Uniyal, S.; Purohit, S.; Chaurasia, K.; Rao, S.S.; Amminedu, E. Quantification of carbon sequestration by urban forest using Landsat 8 OLI and machine learning algorithms in Jodhpur, India. Urban For. Urban Green. 2022, 67, 127445. [Google Scholar] [CrossRef] [Scilit]
- Chang, J.; Shao, Z.; Wang, J.; Mao, Z.; Cheng, T.; Xu, X.; Zhuang, Q. Estimation of carbon sequestration capacity of urban green infrastructure by fusing multi-source remote sensing data. Int. J. Appl. Earth Obs. Geoinf. 2025, 141, 104643. [Google Scholar] [CrossRef] [Scilit]
- Fang, W.; Fan, Z.; Cai, Y.; Wang, Y.; Bai, Y.; Feng, Q. A remote sensing-based assessment of biomass carbon global temporal trends in urban forests. Sustain. Prod. Consum. 2025, 58, 267–276. [Google Scholar] [CrossRef] [Scilit]
- Li, J.; Chen, J.; Glauch, T.; Brunner, D.; Marshall, J.; Ponomarev, N.; Tang, H.; Stagakis, S. Fine-Scale Estimation of Urban Biogenic CO2 Fluxes: A Novel Framework Integrating Multiple Versions of Vegetation Photosynthesis and Respiration Models and In Situ Measurements. Earth’s Future 2026, 14, e2025EF006214. [Google Scholar]
- Trinder, J.C. Remote Sensing for Ecosystem Services and Urban Sustainability. Am. Soc. Photogramm. Remote Sens. 2021, 87, 188–194. [Google Scholar] [CrossRef] [Scilit]
- Río-Mena, T.d.; Willemen, L.; Vrieling, A.; Nelson, A. How remote sensing choices influence ecosystem services monitoring and evaluation results of ecological restoration interventions. Ecosyst. Serv. 2023, 64, 101565. [Google Scholar] [CrossRef] [Scilit]
- Rahman, M.M.; Hasan, J. Evaluating the Impact of Green Spaces on Urban Heat Reduction. Land 2024, 13, 1284. [Google Scholar] [CrossRef] [Scilit]
- Dong, X.; Li, X.; Ye, Y.; Su, D.; Yang, R.; Lausch, A. Measuring urban thermal environment from accessibility-based perspective: A case study in a populous city. Geogr. Sustain. 2024, 5, 329–342. [Google Scholar] [CrossRef] [Scilit]
- Sharma, G.; Morgenroth, J.; Richards, D.R.; Ye, N. Advancing urban forest and ecosystem service assessment through the integration of remote sensing and i-Tree Eco: A systematic review. Urban For. Urban Green. 2025, 104, 128659. [Google Scholar] [CrossRef] [Scilit]
- Dong, X.; Ye, Y.; Zhou, T.; Haase, D.; Angela, L. Effectiveness Trade-Off Between Green Spaces and Built-Up Land: Evaluating Trade-Off Efficiency and Its Drivers in an Expanding City. Remote Sens. 2025, 17, 212. [Google Scholar]
- Poreba, L.; Glowienka, E.; Siebielec, G. Soil ecosystem services in urban areas and methods for their assessment using remote sensing. Front. Environ. Sci. 2026, 13, 1734143. [Google Scholar] [CrossRef] [Scilit]
- Nabikandi, B.V.; Hami, A.; Kamran, K.V.; Russo, A. Evaluating urban ecosystem services and resilience using remote sensing and InVEST model: A case study of flood risk control and urban cooling in Tabriz. Sustain. Cities Soc. 2025, 130, 106654. [Google Scholar] [CrossRef] [Scilit]
- Bachmann, M.; Storch, T. First Nighttime Light Spectra by Satellite—By EnMAP. Remote Sens. 2023, 15, 4025. [Google Scholar] [CrossRef] [Scilit]
- Levin, N. Challenges in remote sensing of night lights—A research agenda for the next decade. Remote Sens. Environ. 2025, 328, 114869. [Google Scholar]
- Zhang, Z.; Liu, J.; Zhao, Y.; Zhou, Q.; Song, L.; Xu, S. Community-Level Urban Vitality Intensity and Diversity Analysis Supported by Multisource Remote Sensing Data. Remote Sens. 2025, 17, 1056. [Google Scholar] [CrossRef] [Scilit]
- Amer, A.A.; Moneim, N.M.A.; Allah, H.; Khalil, E.E. What deep learning can (and can’t) see: A systemic review assessing applicability for quantifying qualities of urban vitality. Comput. Urban Sci. 2025, 5, 67. [Google Scholar] [CrossRef] [Scilit]
- Noufe, S.C.; Belaroussi, R.; Dupin, F.; Vandanjon, P.-O. Mapping Urban Vitality: Geospatial Analysis of Commercial Diversity and Tourism. Urban Sci. 2026, 10, 21. [Google Scholar] [CrossRef] [Scilit]
- Kattenborn, T.; Fassnacht, F.E.; Pierce, S.; Lopatin, J.; Grime, J.P.; Schmidtlein, S. Linking plant strategies and plant traits derived by radiative transfer modelling. J. Veg. Sci. 2017, 28, 717–727. [Google Scholar] [CrossRef] [Scilit]
- Wetherley, E.B.; McFadden, J.P.; Roberts, D.A. Megacity-scale analysis of urban vegetation temperatures. Remote Sens. Environ. 2018, 213, 18–33. [Google Scholar] [CrossRef] [Scilit]
- Degerickx, J.; Hermy, M.; Somers, B. Mapping Functional Urban Green Types Using High Resolution Remote Sensing Data. Sustainability 2020, 12, 2144. [Google Scholar] [CrossRef] [Scilit]
- Di Giulio, M.; Lososová, Z.; Carboni, M.; Ricotta, C. Measuring plant functional specialization in urban environments with Grime’s CSR strategies. Appl. Veg. Sci. 2024, 27, e12803. [Google Scholar]
- Jian, M.; Yang, J. Enhancing understanding of ecological niche and CSR strategies of woody plants in remnant forests: Exploring the impact of surrounding spatiotemporal urban expansion. Glob. Ecol. Conserv. 2024, 50, e02825. [Google Scholar] [CrossRef] [Scilit]
- Sjöman, H.; Hirons, A.; Watkins, H. Using the CSR Theory when Selecting Woody Plants for Urban Forests: Evaluation of 342 Trees and Shrubs. Arboric. Urban For. 2025, 51, 329–354. [Google Scholar]
- Bino, G.; Levin, N.; Darawshi, S.; Van Der Hal, N.; Reich-Solomon, A.; Kark, S. Accurate prediction of bird species richness patterns in an urban environment using Landsat-derived NDVI and spectral unmixing. Int. J. Remote Sens. 2008, 29, 3675–3700. [Google Scholar]
- Finizio, M.; Pontieri, F.; Bottaro, C.; Febbraro, M.D.; Innangi, M.; Sona, G.; Carranza, M.L. Remote Sensing for Urban Biodiversity: A Review and Meta-Analysis. Remote Sens. 2024, 16, 4483. [Google Scholar] [CrossRef] [Scilit]
- Ziliaskopoulos, K.; Laspidou, C. Using remote-sensing and citizen-science data to assess urban biodiversity for sustainable cityscapes: The case study of Athens, Greece. Landsc. Ecol. 2024, 39, 9. [Google Scholar] [CrossRef] [Scilit]
- Kontsiotis, V.J.; Chatzigiovanakis, S.; Valsamidis, E.; Nalmpantis, E.; Xofis, P.; Liordos, V. Remotely Sensed Spectral Indices as Proxies of the Structure of Urban Bird Communities. Land 2025, 14, 308. [Google Scholar] [CrossRef] [Scilit]
- Twohig-Bennett, C.; Jones, A. The health benefits of the great outdoors: A systematic review and meta- analysis of greenspace exposure and health outcomes. Environ. Res. 2018, 166, 628–637. [Google Scholar] [CrossRef] [Scilit] [PubMed]
- Chakraborty, T.; Hsu, A.; Manya, D.; Sheriff, G. Disproportionately higher exposure to urban heat in lower-income neighborhoods: A multi-city perspective Disproportionately higher exposure to urban heat in lower-income neighborhoods: A multi-city perspective. Environ. Res. Lett. 2019, 14, 105003. [Google Scholar]
- Sogno, P.; Traidl-ho, C.; Kuenzer, C. Earth Observation Data Supporting Non-Communicable Disease Research: A Review. Remote Sens. 2020, 12, 2541. [Google Scholar] [CrossRef] [Scilit]
- Vicedo-Cabrera, A.M.; Scovronick, N.; Sera, F.; Royé, D.; Schneider, R.; Tobias, A.; Astrom, C.; Guo, Y.; Honda, Y.; Hondula, D.M.; et al. The burden of heat-related mortality attributable to recent human-induced climate change. Nat. Clim. Change 2021, 11, 492–500. [Google Scholar]
- Holloway, T.; Miller, D.; Anenberg, S.; Diao, M.; Duncan, B.; Fiore, A.M.; Henze, D.K.; Hess, J.; Kinney, P.L.; Liu, Y.; et al. Satellite Monitoring for Air Quality and Health. Annu. Rev. 2021, 4, 417–447. [Google Scholar] [CrossRef] [Scilit]
- Bhattarai, D.; Lucieer, A.; Lovell, H.; Aryal, J. Remote sensing of night-time lights and electricity consumption: A systematic literature review and meta-analysis. Geogr. Compass 2023, 17, e12684. [Google Scholar]
- Sheehan, A.; Beddows, A.; Gulliver, J.; Green, D.C.; Beevers, S. Estimating road vehicle speed from high-resolution satellite imagery for environmental applications: A case study of Barcelona. Remote Sens. Appl. Soc. Environ. 2025, 37, 101507. [Google Scholar] [CrossRef] [Scilit]
- Zhang, Y.; Kwan, M.; Cai, J.; Wang, J.; Ma, P. CrossGraphNet: A cross-spatiotemporal graph-based method for traffic speed reconstruction using remote sensing vehicle detection. Int. J. Digit. Earth 2025, 18, 2528640. [Google Scholar]
- Liu, H.; He, X.; Bai, Y.; Liu, X.; Wu, Y.; Zhao, Y.; Yang, H. Nightlight as a Proxy of Economic Indicators: Fine-Grained GDP Inference around Chinese Mainland via Attention-Augmented CNN from Daytime Satellite Imagery. Remote Sens. 2021, 13, 2067. [Google Scholar]
- Li, W.; Wu, M.; Niu, Z. Spatialization and Analysis of China’s GDP Based on NPP/VIIRS Data from 2013 to 2023. Appl. Sci. 2024, 14, 8599. [Google Scholar]
- Chang, T.-C.; Tang, J.-H.; Chan, T.-C. Spatiotemporal impact of urban development on nighttime light intensity and its hotspot distribution. PLoS ONE 2025, 20, e0325696. [Google Scholar] [CrossRef] [Scilit] [PubMed]
- Gao, C.; Li, J.; Wu, T.; Wang, R.; Wang, J.; Chen, H.; Jiang, Y. Spatialisation of GDP based on NPP-VIIRS night lighting and urban utilization. In Atlantis Highlights in Computer Sciences; Subramaniyam, K., Leng, L., Li, J., Wheeb, A.H., Eds.; Atlantis Press International BV: Dordrecht, The Netherlands, 2024; Volume 21, pp. 173–179. ISBN 978-94-6463-418-1. [Google Scholar]
- Metzger, N.; Daudt, R.C.; Tuia, D.; Schindler, K. High-resolution population maps derived from Sentinel-1 and Sentinel-2. Remote Sens. Environ. 2024, 314, 114383. [Google Scholar] [CrossRef] [Scilit]
- Yagoub, M.M.; Tesfaldet, Y.T.; AlSumaiti, T.; Al Hosani, N.; Elmubarak, M.G. Estimating population density using open-access satellite images and geographic information system: Case of Al Ain city, UAE. Remote Sens. Appl. Soc. Environ. 2024, 33, 101122. [Google Scholar]
- Woods, D.; McKeen, T.; Cunningham, A.; Priyatikanto, R.; Tatem, A.J.; Sorichetta, A.; Bondarenko, M. Global gridded multi-temporal datasets to support human population distribution modelling. Gates Open Res. 2025, 9, 72. [Google Scholar] [CrossRef] [Scilit] [PubMed]
- Maneepong, K.; Yamanotera, R.; Akiyama, Y.; Miyazaki, H.; Miyazawa, S.; Akiyama, C.M. Towards High-Resolution Population Mapping: Leveraging Open Data, Remote Sensing, and AI for Geospatial Analysis in Developing Country Cities—A Case Study of Bangkok. Remote Sens. 2025, 17, 1204. [Google Scholar] [CrossRef] [Scilit]
- Lu, X.; Weng, Q. Deep learning-based road extraction from remote sensing imagery: Progress, problems, and perspectives. ISPRS J. Photogramm. Remote Sens. 2025, 228, 122–140. [Google Scholar] [CrossRef] [Scilit]
- Fontes, M.; Bakoň, M.; Cunha, A.; Sousa, J.J. Deep Learning Meets InSAR for Infrastructure Monitoring: A Systematic Review of Models, Applications, and Challenges. Sensors 2025, 25, 7169. [Google Scholar] [CrossRef] [Scilit] [PubMed]
- Hoque, O.B.; Adiga, A.; Adiga, A.; Chaudhary, S.; Marathe, M.V.; Ravi, S.S.; Rajagopalan, K.; Wilson, A.; Swarup, S. IGraSS: Learning to Identify Infrastructure Networks from Satellite Imagery by Iterative Graph-constrained Semantic Segmentation. arXiv 2025, arXiv:2506.08137. [Google Scholar]
- Dai, H.; Fu, Z.; Zhang, T.; Wang, G.; Miao, L.; Liu, T.; Zou, Y. Research of multimodal transport potential of major cities in China based on the satellite remote sensing. Int. Arch. Photogramm. Remote Sens. Spat. Inf. Sci. 2024, XLVIII, 13–17. [Google Scholar]
- Chang, Y.; Xiao, J.; Li, X.; Zhou, D.; Wu, Y. Combining GOES-R and ECOSTRESS land surface temperature data to investigate diurnal variations of surface urban heat island. Sci. Total Environ. 2022, 823, 153652. [Google Scholar] [CrossRef] [Scilit] [PubMed]
- Wurm, M.; Taubenböck, H. Detecting social groups from space—Assessment of remote sensing-based mapped morphological slums using income data. Remote Sens. Lett. 2018, 9, 41–50. [Google Scholar]
- Ivan, K.; Holobâcă, I.-H.; Benedek, J.; Török, I. Potential of Night-Time Lights to Measure Regional Inequality. Remote Sens. 2019, 12, 33. [Google Scholar] [CrossRef] [Scilit]
- Kuffer, M.; Thomson, D.R.; Boo, G.; Mahabir, R.; Grippa, T.; Vanhuysse, S.; Engstrom, R.; Ndugwa, R.; Makau, J.; Darin, E.; et al. The Role of Earth Observation in an Integrated Deprived Area Mapping “System” for Low-to-Middle Income Countries. Remote Sens. 2020, 12, 982. [Google Scholar]
- Weidmann, N.B.; Theunissen, G. Estimating Local Inequality from Nighttime Lights. Remote Sens. 2021, 13, 4624. [Google Scholar] [CrossRef] [Scilit]
- Wu, S.; Yu, W.; An, J.; Lin, C.; Chen, B. Remote sensing of urban greenspace exposure and equality: Scaling effects from greenspace and population mapping. Urban For. Urban Green. 2023, 90, 128136. [Google Scholar] [CrossRef] [Scilit]
- Luo, E.; Kuffer, M.; Wang, J. Urban poverty maps—From characterising deprivation using geo-spatial data to capturing deprivation from space. Sustain. Cities Soc. 2022, 84, 104033. [Google Scholar] [CrossRef] [Scilit]
- Karasov, O.; Uuemaa, E.; Järv, O.; Kuffer, M.; Tammaru, T. Predicting Household Income with Sentinel and Street View Imagery: A Comparative Study across Amsterdam, Sydney, and New York. Int. J. Appl. Earth Obs. Geoinf. 2025, 143, 104828. [Google Scholar] [CrossRef] [Scilit]
- Yu, J.; Liu, L.; Ban, Y.; Zhang, Q. Evaluating urban development and socio-economic disparity in India through nighttime light data. J. Geogr. Sci. 2024, 34, 2440–2456. [Google Scholar] [CrossRef] [Scilit]
- Chen, Z.; Glasscoe, M.; Eguchi, R.; Huyck, C.; Kar, B. Roles of Remote Sensing Technologies for Disaster Resilience. In Objective Resilience; American Society of Civil Engineers: Reston, VA, USA, 2022; pp. 121–159. [Google Scholar]
- Rezvani, S.M.; Falcão, M.J.; Komljenovic, D.; de Almeida, N.M. A Systematic Literature Review on Urban Resilience Enabled with Asset and Disaster Risk Management Approaches and GIS-Based Decision Support Tools. Appl. Sci. 2023, 13, 2223. [Google Scholar] [CrossRef] [Scilit]
- Uckardesler, S.; Yomralioglu, T. Multi-Source Geospatial Analysis for Disaster Risk Management in Smart Cities: Integration of GIS & Remote Sensing. Int. Arch. Photogramm. Remote Sens. Spat. Inf. Sci. 2025, XLVIII-5/W, 137–145. [Google Scholar] [CrossRef] [Scilit]
- Wang, Y.; Li, Y.; Zhang, S. Automatic Detection of War-Destroyed Buildings from High-Resolution Remote Sensing Images. Remote Sens. 2025, 17, 509. [Google Scholar]
- Suleiman, H. Illuminating the Nile: Estimating subnational GDP in Egypt using nighttime lights and machine learning. GeoJournal 2024, 89, 117. [Google Scholar] [CrossRef] [Scilit]
- Millán López, A.J.; González Olivares, D. Satellite Nighttime Lights as a Measurement of Economic Growth in Mexico’s Municipalities. Ens. Rev. Econ. 2024, 43, 1–18. [Google Scholar] [CrossRef] [Scilit]
- Suleiman, H.; Nguyen, M.-T.T.; Mendez, C. Predicting subnational GDP in Vietnam with remote sensing data: A machine learning approach. Lett. Spat. Resour. Sci. 2025, 18, 5. [Google Scholar] [CrossRef] [Scilit]
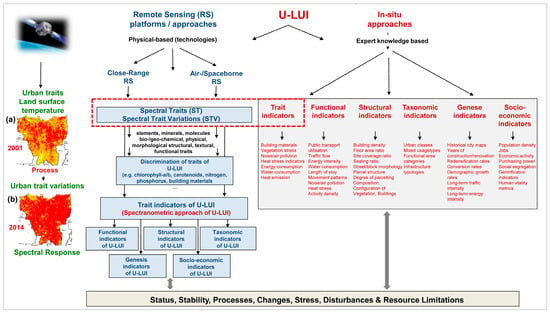
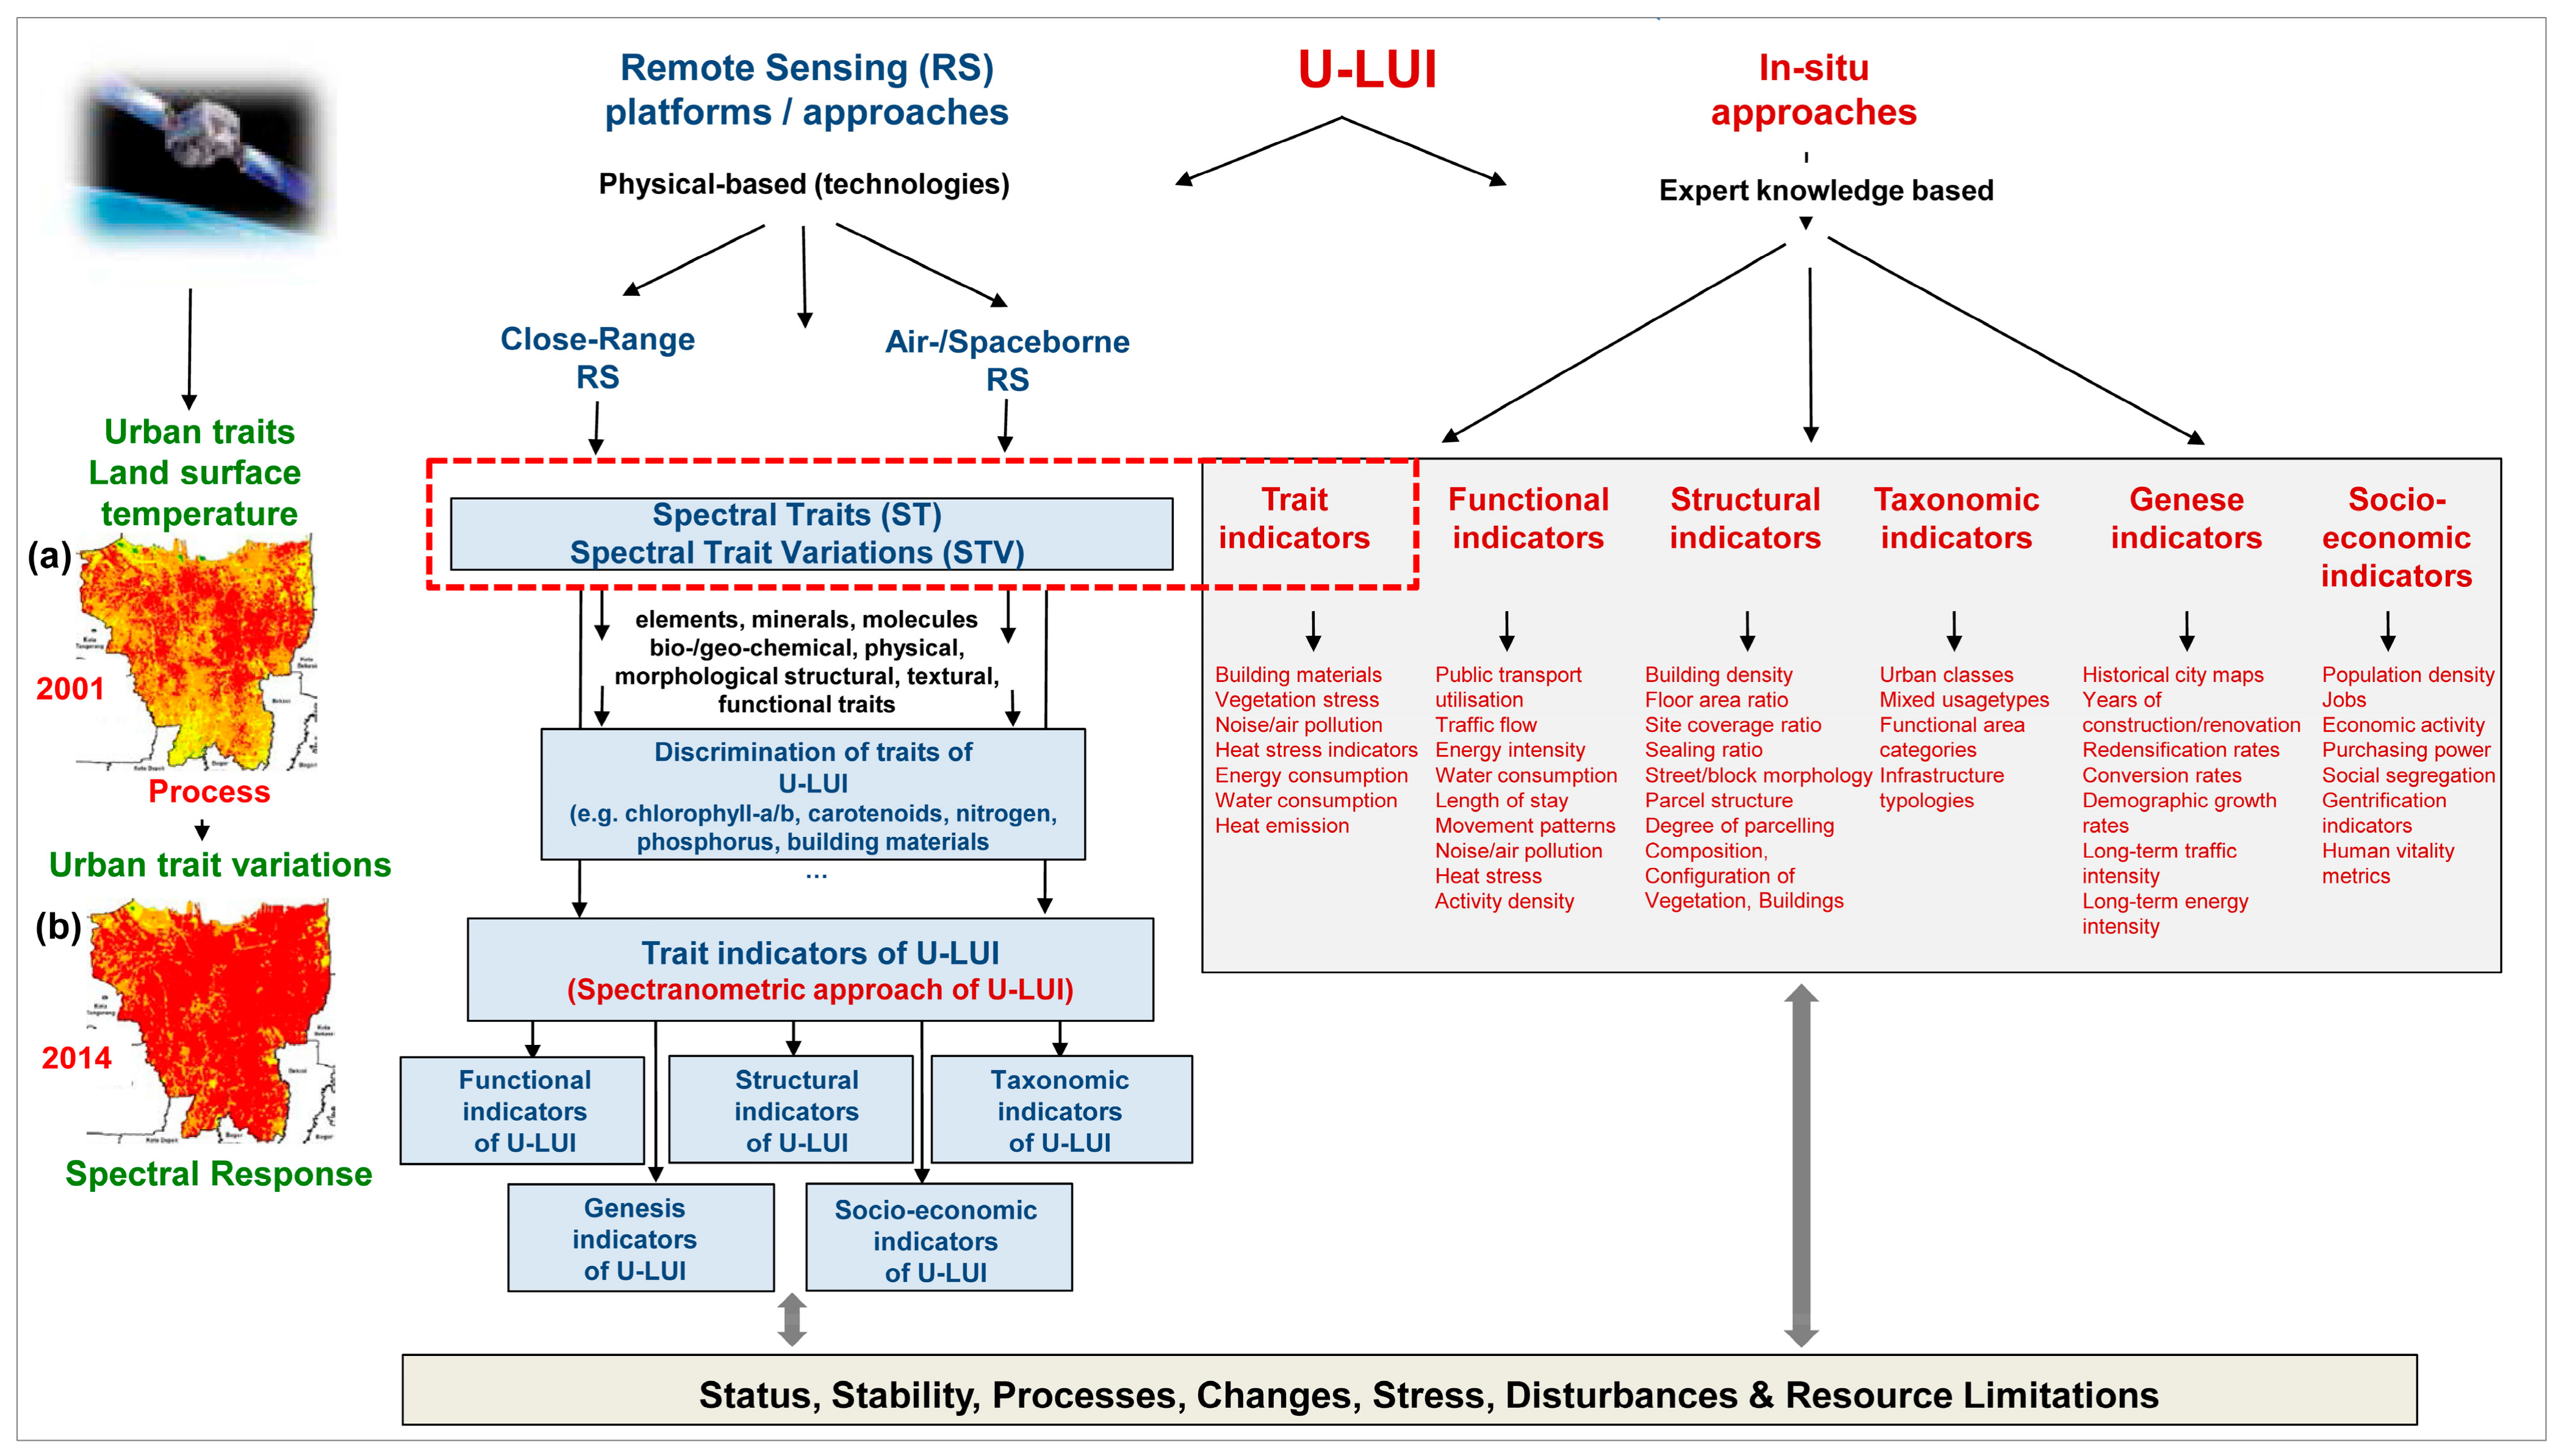
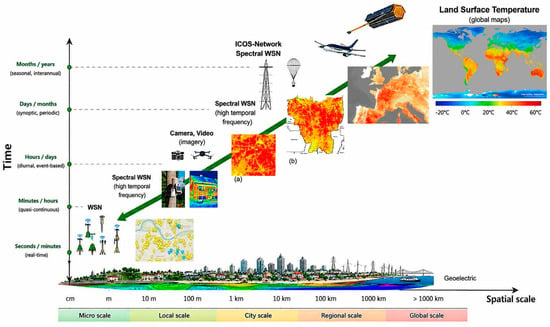
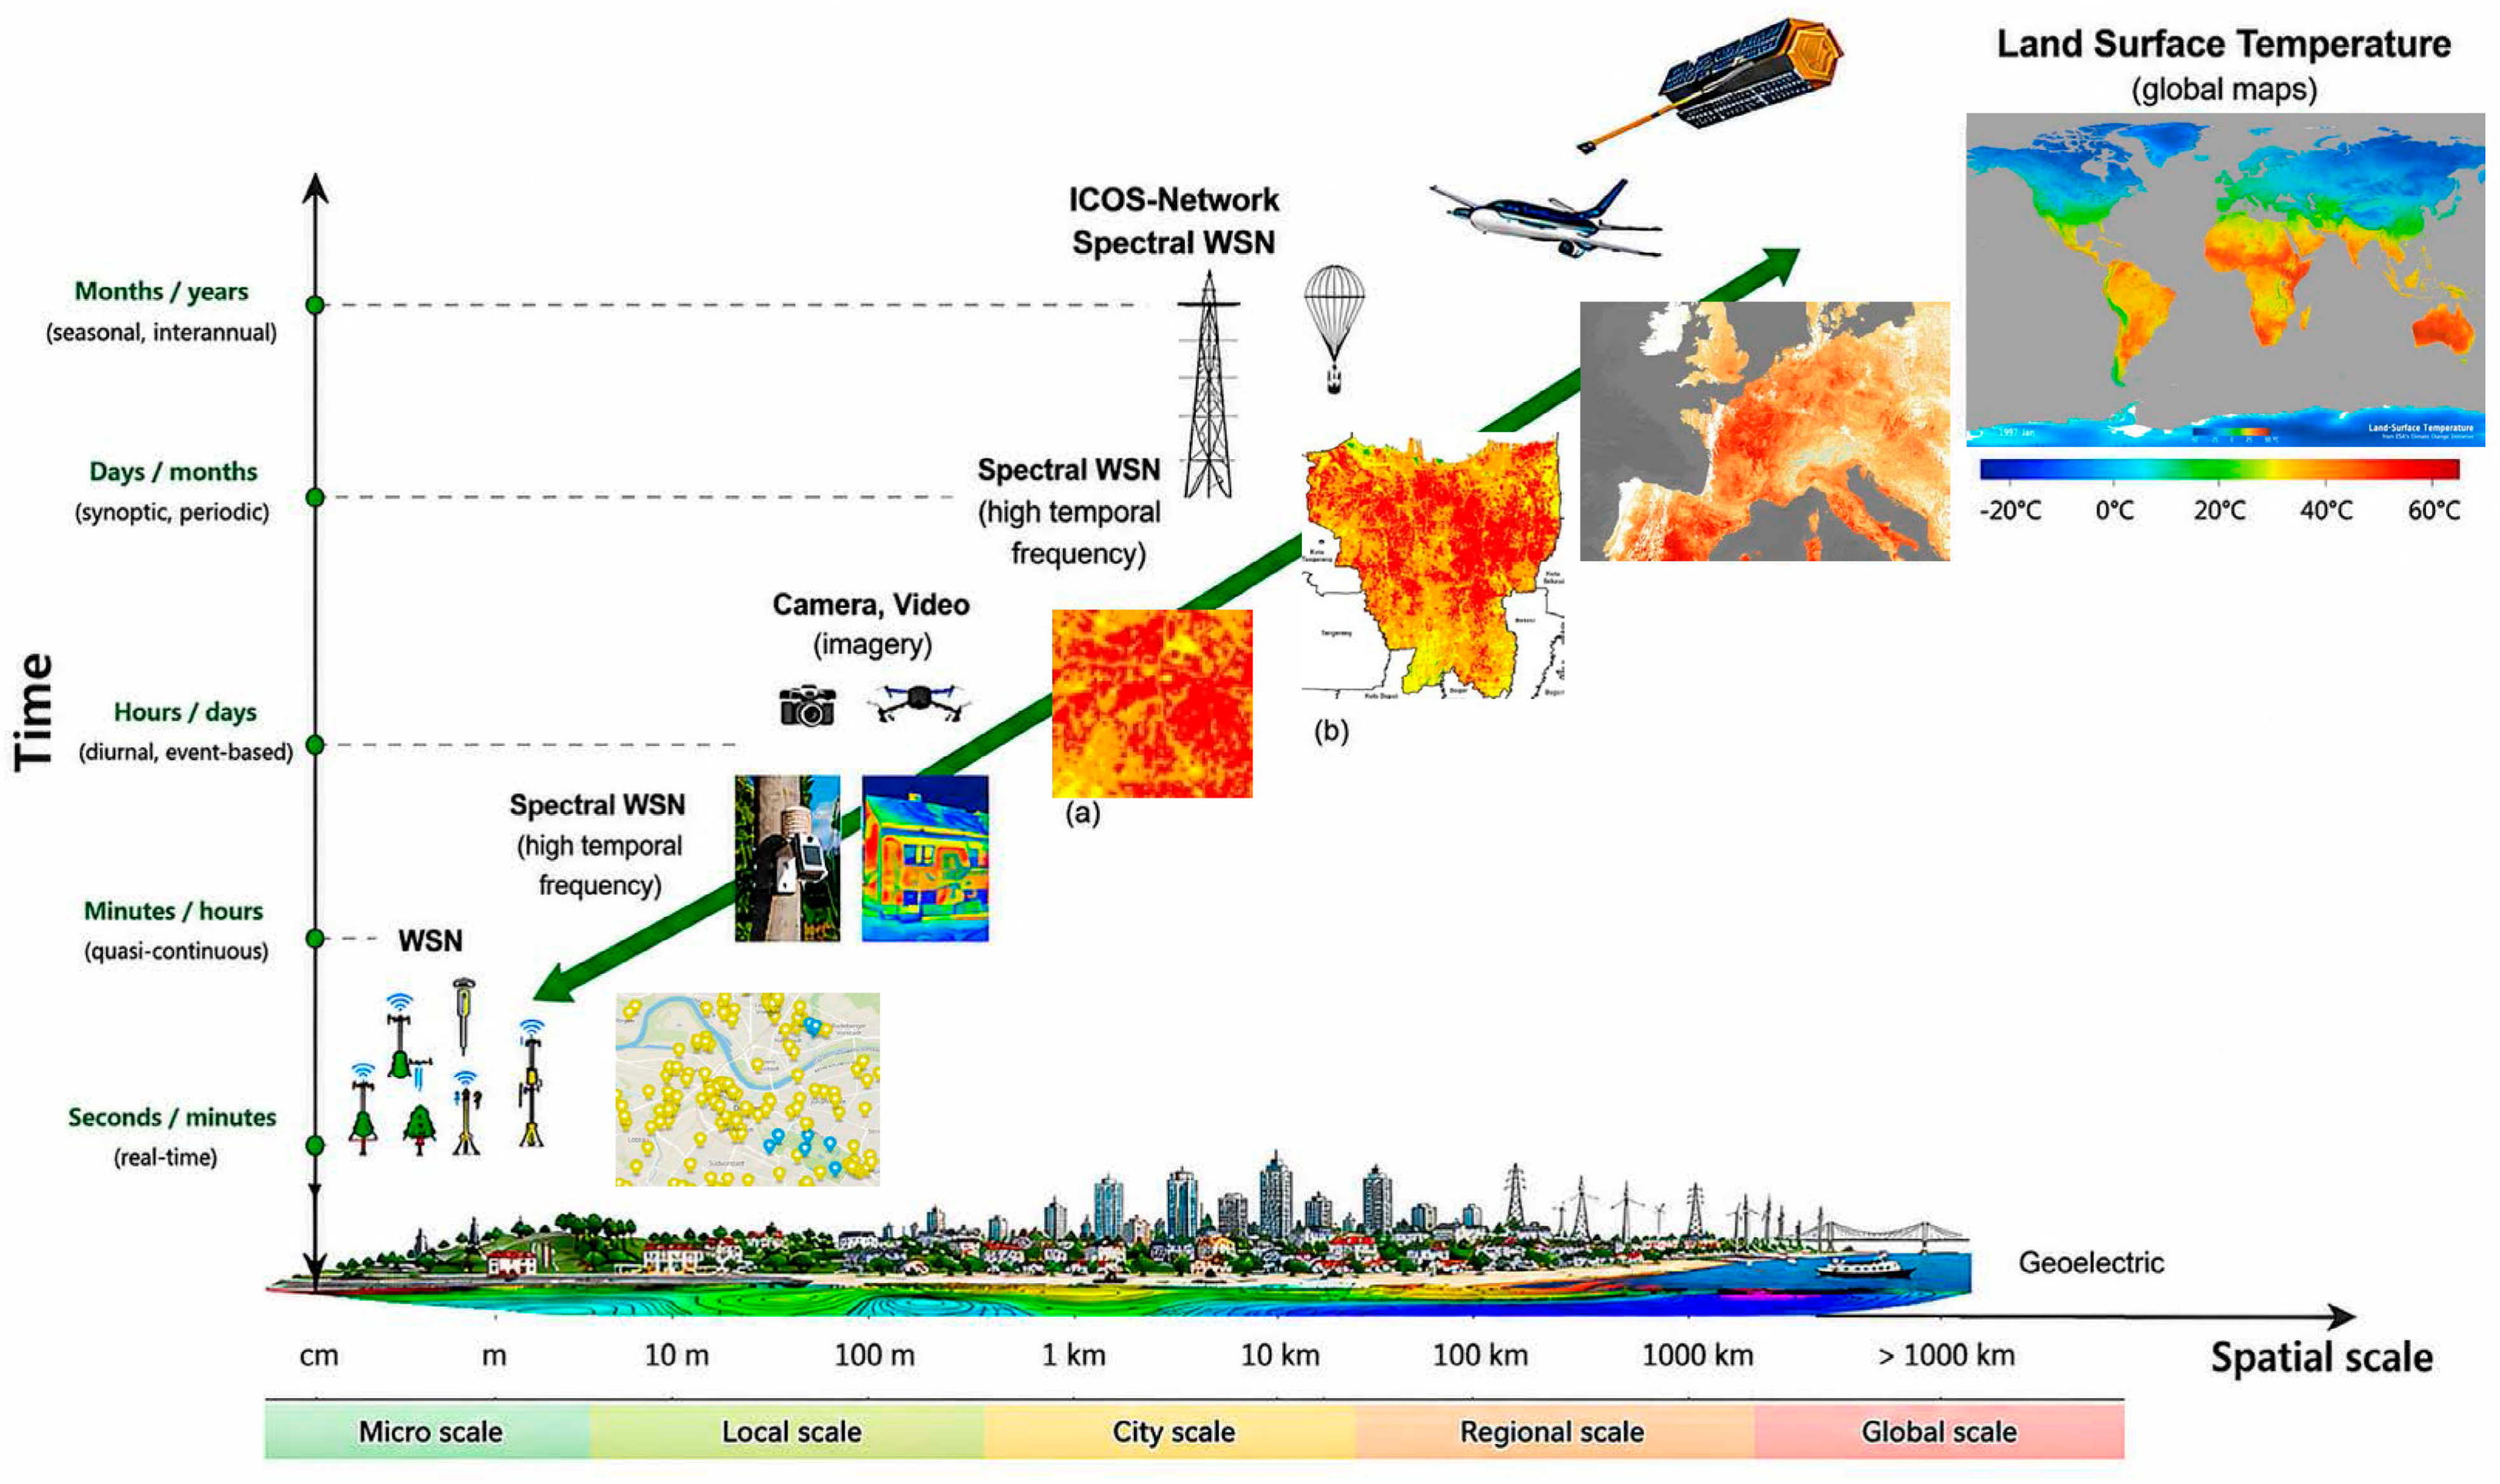
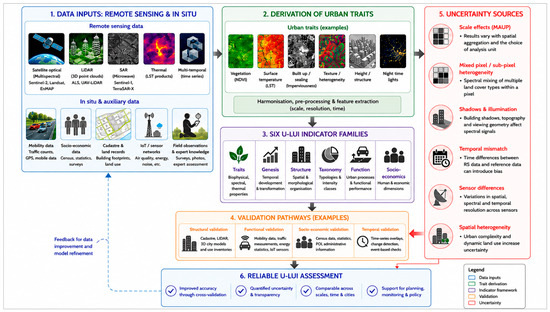
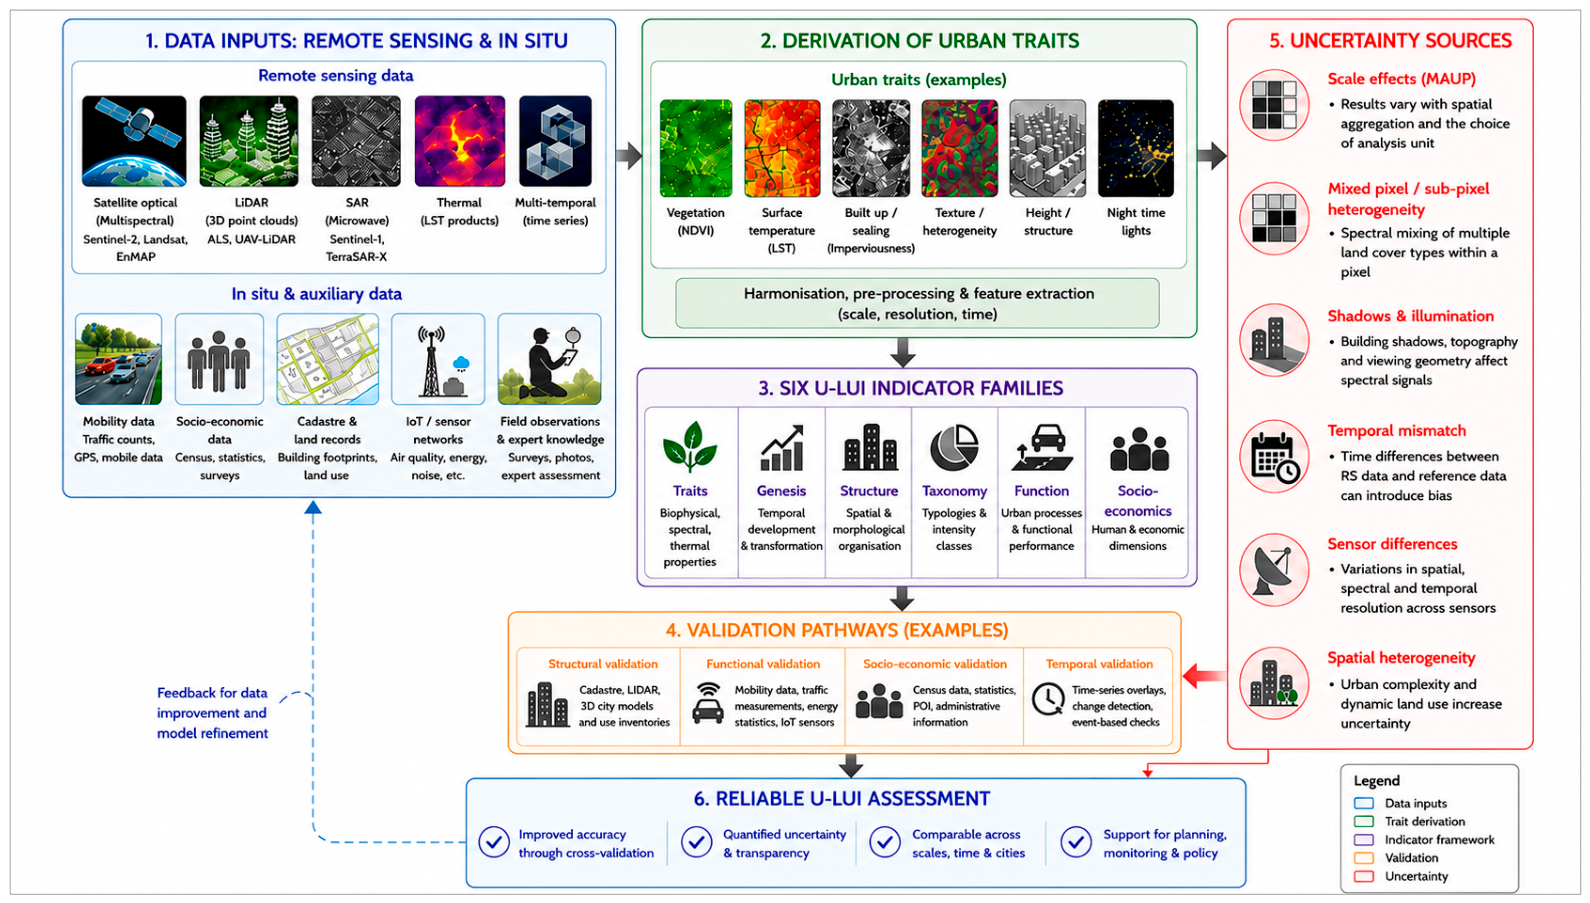
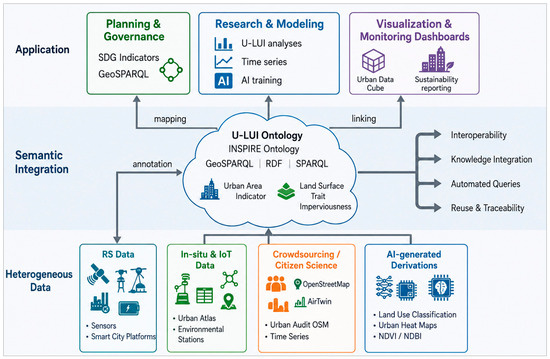
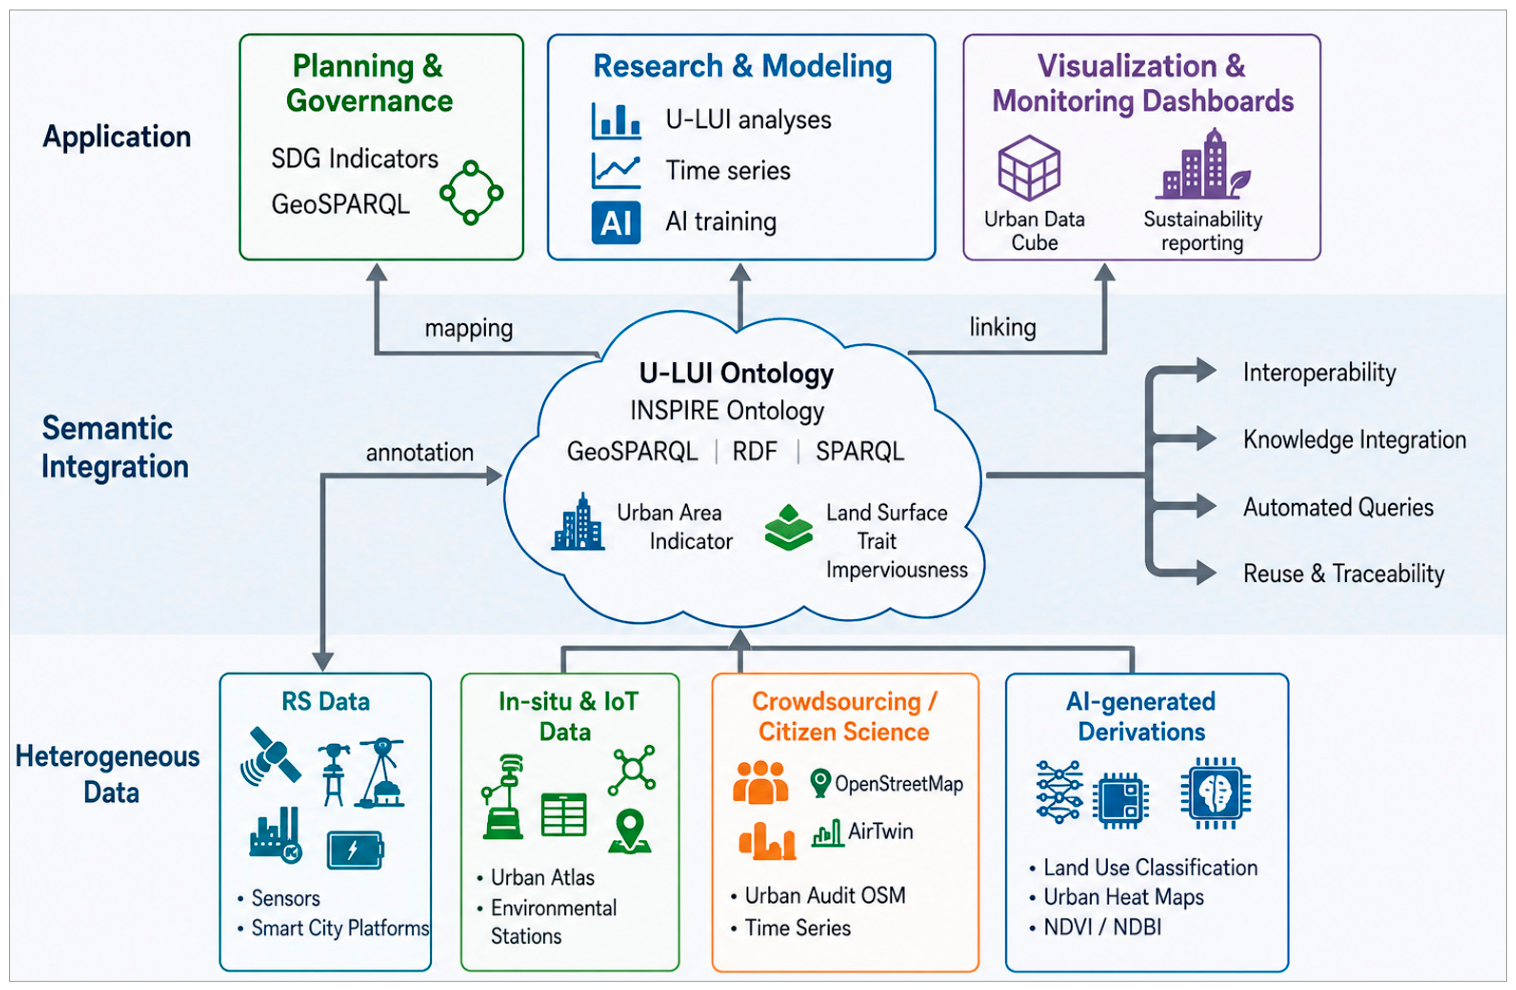

Disclaimer/Publisher’s Note: The statements, opinions and data contained in all publications are solely those of the individual author(s) and contributor(s) and not of MDPI and/or the editor(s). MDPI and/or the editor(s) disclaim responsibility for any injury to people or property resulting from any ideas, methods, instructions or products referred to in the content. |
© 2026 by the authors. Licensee MDPI, Basel, Switzerland. This article is an open access article distributed under the terms and conditions of the Creative Commons Attribution (CC BY) license.