


Highlights
What are the main findings?
- A unified framework for optimizing nanogrid-based street lighting systems was established.
- Voltage drop behavior was analyzed across cable, load, and system parameters.
- Centralized vs. decentralized configurations were systematically compared.
What are the implications of the main findings?
- Electrical constraints were identified as key drivers of system design.
- Partially centralized systems were shown to be most the cost-effective solution.
Abstract
Street lighting systems are essential for ensuring nighttime road safety and visibility. The integration of solar photovoltaic (PV) systems into street lighting infrastructure improves energy efficiency and sustainability; however, the mismatch between daytime energy generation and nighttime lighting demand requires effective energy management solutions. In addition, long-distance electrical connections introduce voltage drop constraints, which are often overlooked in conventional design approaches. This study addresses the integration of lighting design, electrical constraints, and techno-economic performance in nanogrid-based LED street lighting systems for secondary roads. A unified framework is developed to evaluate lighting performance, PV–battery sizing, voltage drop behavior, and lifecycle cost under different system architectures. Optimal pole spacing and luminaire ratings are determined using DIALux, while PV–battery configurations are optimized using HOMER Pro based on site-specific solar irradiance. The analysis focuses on voltage drop as the key electrical constraint and examines its impact under decentralized and centralized nanogrid configurations (25%, 50%, and 100%) in both stand-alone and grid-connected modes. The results show that increasing centralization reduces component redundancy but significantly increases cable length, conductor sizing, and infrastructure cost. A techno-economic assessment with lifecycle cost and sensitivity analysis indicates that a 25% centralized configuration reduces total system cost by approximately 23% compared to fully decentralized systems while avoiding excessive cabling costs. These findings demonstrate that voltage drop and electrical infrastructure constraints play a decisive role in determining optimal system design, highlighting the importance of system-level integration rather than isolated optimization of lighting or energy components.
1. Introduction
Street lighting systems are essential for ensuring nighttime safety for road users. Inadequate lighting or substandard illumination quality can significantly increase the risk of traffic accidents. While enhancing lighting levels can improve visibility, it often results in higher energy consumption, raising concerns about sustainability and long-term operational costs.
To address these issues, renewable energy technologies—particularly solar PV power—have been increasingly integrated into street lighting systems. The integration of solar PV systems into LED street lighting has been widely recognized as a viable solution from technical, economic, environmental, and social perspectives. Many research studies consistently affirm its potential to enhance energy efficiency, reduce emissions, and support sustainable urban infrastructure [1,2,3,4,5,6,7,8,9,10]. However, a key limitation of standalone solar street lighting systems is their sensitivity to temporal variations in solar irradiance. Seasonal fluctuations in temperate regions and short-term variability due to cloud cover can significantly affect energy generation, leading to potential reliability issues. These challenges often require oversizing of PV panels and battery storage, which increases system cost and reduces overall economic efficiency.
In this context, nanogrid-based configurations offer a more flexible solution by enabling energy sharing among multiple lighting units and, when applicable, integration with the utility grid. This approach enhances system reliability and mitigates the impact of irradiation variability compared to fully standalone systems.
Several studies have underscored the importance of holistic optimization models in solar PV street lighting design. Integrated models considering simultaneous calculations of pole placement, luminaire selection, and renewable energy sizing have proven to be more efficient and sustainable than traditional methods. For instance, integrated optimization methodologies developed in Oman demonstrated that focusing exclusively on luminaire power minimization might not yield overall cost-effectiveness, reinforcing the necessity for system-wide design approaches [1]. Similarly, the Italian case [2] highlighted the benefits of integrating high-efficiency PV cells and optimized scheduling strategies to enhance system performance, proving reliable under diverse environmental conditions.
Economic analyses from multiple geographic contexts—including Oman, Italy, Egypt, and Indonesia—indicate that while larger PV panel/battery configurations initially have higher upfront costs, they significantly reduce cost per kWh and lifecycle costs, presenting a viable option for large-scale applications [3]. Studies in Italy [4] and Egypt [5] further substantiate these economic advantages, demonstrating considerable savings and relatively short payback periods, thus confirming financial feasibility. Conversely, the Indonesian context revealed challenges in economic viability without substantial subsidies or increased electricity tariffs, indicating regional disparities in economic feasibility [6].
Transitioning from conventional High-Pressure Sodium (HPS) lamps to solar PV-powered LED systems consistently demonstrates substantial energy conservation and environmental benefits. Data-driven methodologies using high-resolution satellite imagery in China [7] and empirical studies in Thailand [8,9] have illustrated notable reductions in energy consumption, CO2 emissions, and pollutants over extended periods. Such implementations align with global sustainability initiatives like “Clean Power” and “Vision Zero,” further highlighting solar PV LED systems’ roles in enhancing road safety and urban sustainability. Social acceptance emerges as a significant factor influencing the widespread adoption of solar PV street lighting. The Spanish case study [10] reported general public acceptance but also revealed concerns about system reliability and continuous operation, emphasizing the necessity for reliable, uninterrupted service to foster broader community support. Economic constraints observed in Indonesia further highlight the critical role of supportive policies or alternative funding models to facilitate successful deployment.
In recent years, solar-powered street lighting systems have experienced significant global growth, driven by increasing demand for sustainable and energy-efficient urban infrastructure. According to the International Energy Agency (IEA), solar PV deployment continues to expand rapidly worldwide due to declining costs and supportive policy frameworks [11]. In addition, reports from the World Bank highlight the rapid expansion of off-grid solar technologies, including solar lighting systems, particularly in regions with limited grid access [12]. The global solar street lighting market has also shown steady growth, supported by smart city initiatives and rural electrification programs [13].
Despite this increasing adoption, challenges related to system design, cost optimization, and long-term reliability remain critical, highlighting the need for optimized configurations such as nanogrid-based systems.
Solar PV energy enables decentralized power generation during the day; however, street lighting operates primarily at night. This mismatch between energy generation and consumption necessitates the use of reliable energy storage systems to ensure sustainable operation. This mismatch between energy generation and consumption, particularly under seasonal and climatic variability, represents a key constraint in standalone solar PV street lighting systems and necessitates the use of reliable energy storage or alternative system architectures to ensure sustainable operation. One promising solution is the integration of nanogrid technology into solar PV-powered street lighting. The integration of nanogrid systems into decentralized energy management networks has emerged as a robust solution addressing contemporary challenges related to energy efficiency, sustainability, economic feasibility, and reliability. This synthesis consolidates key findings from recent research [14,15,16,17,18,19,20,21,22,23,24,25,26,27,28,29,30,31,32] to present a comprehensive overview of the current state and future potential of nanogrid technologies. However, these studies primarily focus on residential or building-scale applications and do not explicitly address the design and electrical constraints of nanogrid integration in street lighting systems.
Numerous studies highlight the critical role of optimization methodologies in enhancing nanogrid system performance. Joint optimization of prosumer nanogrids (PNGs) and dynamic pricing tariffs (DPTs) ensures flexibility in investment planning and market adaptability [14]. Hierarchical frameworks employing reinforcement learning and auction mechanisms facilitate efficient energy management and trading, enhancing coordination and system efficiency within decentralized networks [15]. Additionally, dynamic programming and stochastic modeling, including Markov-based solar prediction methods, effectively optimize battery storage and energy utilization, demonstrating superior results over traditional rule-based approaches [16]. Advanced metaheuristic algorithms, such as the Improved Pelican Optimization Algorithm (IPOA), optimize grid-connected nanogrids’ economic and environmental performance, successfully reducing operational costs and CO2 emissions [17]. Coordinated control strategies that integrate DC microgrids (DCMG) with nanogrids have also been shown to significantly enhance system resilience and reliability [18,19].
Predictive management techniques further bolster nanogrid capabilities. Employing machine learning, particularly long short-term memory (LSTM) networks, allows for proactive management strategies, significantly enhancing indoor comfort and reducing operational costs by anticipating environmental fluctuations [20,21]. Decentralized energy management, crucial for preserving user privacy and addressing uncertainties, has been effectively realized through frameworks such as Mean Field (MF) games. These strategies demonstrate robustness, convergence, and scalability, optimizing energy consumption, battery health, and user comfort without necessitating direct user interaction [22]. Similarly, distributed approaches employing quasi-consensus and incremental loss consensus algorithms facilitate efficient power sharing, significantly reducing power losses and ensuring operational stability within multi-household nanogrids [23]. Innovative optimization techniques, such as multiobjective Gray Wolf optimization and Honey Badger Algorithm (HBA), have demonstrated notable advantages in system sizing and configuration, effectively balancing cost, reliability, emissions, and operational resilience [24,25]. Comprehensive frameworks for nanogrid clusters (NGCs) improve energy transfer efficiency and self-sufficiency, offering significant performance enhancements suitable for future low-voltage distribution networks [26].
Hybrid and flexible architectures further enhance nanogrid applicability and performance. AC–DC hybrid configurations offer adaptability for grid-connected and standalone applications, employing reconfigurable bus systems that support diverse appliances and mitigate shading effects in solar installations [27]. In particular, grid-connected hybrid configurations can effectively mitigate the impact of seasonal and short-term solar irradiance variability by utilizing the utility grid as a supplementary energy source during periods of insufficient solar generation. This improves system reliability and reduces dependence on oversized energy storage systems. Centralized control algorithms address power losses effectively, while distributed price-based power management (d-PBPM) strategies significantly improve scalability and flexibility by eliminating reliance on droop control and enhancing DER integration [23,28].
Collectively, these studies illustrate that optimized, flexible, and technologically integrated nanogrid systems represent a sustainable, economically viable, and socially acceptable solution for decentralized energy management, paving the way for widespread implementation in diverse urban and rural contexts. In line with this direction, the author has also explored the integration of nanogrids into street lighting systems through several key investigations. These include evaluating energy storage options for solar street lighting [29], assessing adaptive lighting controls to improve energy efficiency [30], developing sustainable nanogrid-based lighting systems [31], and analyzing the feasibility of nanogrid infrastructure based on energy output and economic performance [32].
Nanogrid-based street lighting systems, while offering numerous advantages, pose several design challenges due to their varying configurations. Furthermore, the integration of solar PV systems into electrical grids, although pivotal for advancing renewable energy deployment, introduces significant issues related to power quality and voltage stability. Many research articles have extensively explored these aspects, aiming to develop effective solutions to ensure system reliability and operational efficiency [33,34,35,36,37,38,39,40,41,42,43,44,45,46,47,48,49].
Power quality issues are significantly accentuated with increased solar PV system integration, primarily due to the extensive use of electronic converters, leading to harmonic distortions, reactive power issues, and load imbalances [33,34,35]. Novel strategies, such as adaptive current regulators for inverter applications, distributed static compensators (DSTATCOM), and adaptive generalized maximum Versoria criterion (AGMVC) controllers, have been introduced to effectively mitigate these power quality problems [36,37,38]. Additionally, investigations have identified thresholds for maximum allowable solar PV system integration levels to prevent adverse power quality effects on the electrical grid [39]. Voltage stability remains a persistent concern with solar PV system integration, particularly due to natural variability and excess generation. Research emphasizes the critical implications of solar energy fluctuations, which can destabilize the grid by causing voltage drops, reactive power imbalances, and equipment malfunctions [40,41,42,43]. Solutions focusing on enhanced voltage stability and loss minimization have been explored extensively, including approaches for optimal sizing and site selection of solar PV installations to mitigate detrimental grid impacts [44].
Advanced control strategies have emerged as critical tools for addressing dynamic active and reactive power regulation in grid-connected solar PV systems. Techniques such as the anti-windup feedback second-order generalized integrator (AWFSOGI) and interweaved generalized integrators ensure optimal power injection, voltage regulation, and system stability, even under distorted and adverse grid conditions [45,46]. These methods support critical grid functionalities, including low-voltage ride-through (LVRT) capabilities and continuous power delivery at unity power factor, contributing significantly to enhanced grid compliance and power quality. Enhanced control methods employing high-degree-of-freedom DC-link voltage loops, optimized using advanced algorithms such as gravitational search algorithms (GSAs) coupled with second-order generalized integrator–quadrature signal generators (SOGI-QSG), demonstrate substantial improvements in dynamic response and power quality [47]. These innovations effectively minimize voltage oscillations and settling times, comply with IEEE-519-2014 harmonic standards, and enhance multifunctional voltage source inverter (VSI) operations, including harmonic elimination and power factor correction. Studies have also addressed uncertainties and fluctuations inherent in solar PV generation. Monte Carlo simulations using modified IEEE bus systems reveal how variations in solar PV penetration levels significantly impact voltage stability indices, emphasizing the necessity of detailed contingency analysis for enhanced grid reliability [48]. Complementary research underscores the importance of strategic placement and sizing of distributed solar PV generators, employing hybrid optimization techniques such as Particle Swarm Optimization and Gray Wolf Optimization (PSO-GWO). These approaches effectively reduce power losses, enhance voltage stability, and confirm economic viability through short payback periods [49].
Despite the extensive body of research on solar PV-powered street lighting systems, most existing studies focus on isolated aspects such as lighting design, PV–battery sizing, or economic evaluation. Limited attention has been given to the integrated analysis of these factors within a unified framework. In particular, the impact of electrical design constraints—especially voltage drop caused by long cable connections in distributed street lighting systems—remains insufficiently investigated. Furthermore, although nanogrid technologies have been widely studied in residential and microgrid applications, their implementation in street lighting systems—particularly in comparing decentralized and centralized configurations—has not been comprehensively explored. The relationship between system architecture, voltage drop, cable sizing, and overall infrastructure cost therefore remains unclear. In practical solar PV-powered street lighting systems, where PV modules are installed along extended roadways, long-distance electrical connections are required to interconnect system components. This configuration introduces significant voltage drop issues, which directly affect power quality, system reliability, and infrastructure cost. Despite its practical importance, this challenge has not been adequately addressed in the existing literature. Table 1 summarizes prior studies on solar PV street lighting systems and highlights their primary focus and limitations. In contrast, this work establishes a unified framework that links nanogrid architecture, voltage drop behavior, cable sizing, and techno-economic performance.
Table 1.
Comparison of solar PV street lighting system configurations in previous studies and this work.
To address these gaps, this study presents a comprehensive design and evaluation of nanogrid-based LED street lighting systems tailored for secondary road applications. The proposed framework integrates lighting design, solar PV–battery system sizing, voltage drop analysis, and techno-economic assessment within a unified approach. This study determines optimal pole spacing and luminaire power ratings to satisfy standardized lighting requirements, while optimizing PV and battery configurations to ensure reliable year-round operation.
The main contributions of this work are summarized as follows:
- A unified design framework is developed that integrates lighting performance, PV–battery sizing, voltage drop constraints, and techno-economic evaluation, enabling system-level optimization of nanogrid-based street lighting systems under realistic deployment conditions.
- A systematic analysis of voltage drop behavior is conducted, establishing quantitative relationships between cable length, conductor size, current levels, system voltage, and allowable transmission distance in distributed street lighting networks.
- A comprehensive comparison of decentralized and centralized nanogrid configurations at multiple levels of centralization under both stand-alone and grid-connected modes is performed, revealing their impacts on DC and AC power distribution, voltage regulation, and overall system performance.
- Critical engineering trade-offs between system centralization, cable length, conductor sizing, and voltage drop are identified, demonstrating that electrical infrastructure constraints play a dominant role in determining feasible system design.
- An extended techno-economic assessment incorporating lifecycle cost and sensitivity analysis is conducted, showing that cabling becomes the dominant cost factor in highly centralized systems and confirming that partially centralized nanogrid configurations provide the most cost-effective and robust solution for long-distance street lighting applications.
The remainder of this paper is structured as follows. Section 2 discusses the challenges of implementing nanogrid solar PV street lighting systems in Thailand, focusing on lighting quality assessment, solar PV system design, and the conceptual framework of nanogrid integration. Section 3 identifies key factors influencing voltage drop, including solar panel configurations, cable component characteristics, and the relationship between PV ratings and cable sizing. Section 4 analyzes voltage drop behavior under different operating modes of nanogrid LED street lighting systems—stand-alone and grid-connected. Section 5 presents the results and discussion, emphasizing the effects of voltage drop on cable sizing and length constraints, alongside a techno-economic evaluation. Finally, Section 6 concludes the study with key findings and recommendations for future implementation.
2. Challenges in Nanogrid Solar PV Street Lighting Systems in Thailand
Secondary roads in Thailand form an essential subnetwork within the national highway system. Their primary function is to connect major highways with local communities, including villages and agricultural zones. These roads typically traverse suburban or rural areas and possess physical characteristics that distinguish them from urban roads, particularly in terms of street lighting design.
Managed by the Department of Highways, secondary roads usually comprise two to four traffic lanes and lack large median strips. Their role is crucial in providing transportation services to local populations and serving as transit routes between sub-districts and districts. To ensure nighttime driving safety while avoiding excessive glare, the Department of Highways has specified standard average illuminance levels for secondary roads [50], as presented in Table 2. These standards specify that the average illuminance levels for secondary roads are set at 13.0 lux in urban areas, 9.7 lux in suburban areas, and 6.5 lux in rural areas. In addition to these illuminance values, uniformity requirements are also applied to ensure consistent lighting distribution. The overall uniformity (U0) must be at least 0.4, while the longitudinal uniformity should not be less than 0.167. These criteria aim to provide consistent visibility and enhance road safety across varying area types.
Table 2.
Illuminance standards and uniformity requirements for street lighting in Thailand [50].
In recent years, traditional high-pressure sodium (HPS) lamps have been progressively replaced with light-emitting diode (LED) systems due to their higher luminous efficacy, extended lifespan, and improved energy efficiency. Furthermore, solar PV-powered street lighting systems have been increasingly adopted in practice, particularly in remote and rural areas where grid electricity is inaccessible. This trend is supported by government initiatives and rural electrification programs in Thailand, although comprehensive statistical data on deployment remains limited. These systems typically consist of solar panels, battery storage units, and LED luminaires. This transition toward energy-efficient and renewable-powered street lighting reflects Thailand’s ongoing commitment to sustainable infrastructure development, particularly in underserved and rural areas.
2.1. Street Lighting System
The design of street lighting systems for secondary highways in Thailand was carried out considering a single-side pole arrangement to fulfill the national standards for road illumination. Specifically, the lighting quality was required to achieve an average illuminance (Eav) of at least 13 lux, an overall uniformity (Uo) equal to or greater than 0.4, and a longitudinal uniformity (U1) of at least 0.167. These criteria correspond to the lighting requirements for secondary roads, denoted as “S-road” in this study, and are used as reference thresholds. The key design parameters and performance requirements considered in this study are summarized in Table 3.
Table 3.
Parameters used for street lighting design and performance evaluation.
Figure 1 illustrates the geometrical configuration used in the simulation analysis. The key parameters influencing lighting quality include the boom angle (the tilt angle of the luminaire arm), mounting height (the vertical distance from the road surface to the luminaire), overhang (horizontal offset distance from the pole to the center of the road lane), pole spacing (distance between consecutive luminaires), street width, and lane width. The calculation grid used for evaluating lighting quality is automatically generated based on the road width and spacing between luminaires. Additionally, Figure 1 provides the LED polar curve, which represents the distribution of luminous intensity emitted by the LED luminaire and is essential in assessing lighting uniformity and efficiency.
Figure 1.
Geometrical parameters and configuration of LED street lighting for simulation analysis.
For the lighting simulations conducted using DIALux evo 14.0 software, standard parameters were set, including a mounting height of 9 m, a boom angle of 15 degrees, and an overhang distance of 1 m. The road configuration consisted of two lanes, each 3.5 m wide, with an additional shoulder width of 1 m on each side, resulting in a total road width of 9 m. To evaluate lighting quality under various conditions, the pole spacing was systematically varied from 20 m to 55 m. Given the absence of a median, the single-sided arrangement of poles was applied to simplify installation and reduce infrastructure costs.
LED luminaires were selected due to their high energy efficiency, long lifespan, and superior lighting performance. The study considers a range of luminaire power ratings from 60 W to 160 W, corresponding to luminous flux values between 8700 lm and 22,000 lm, as summarized in Table 3. This range enables a comprehensive evaluation of the relationship between luminaire power, pole spacing, and lighting quality, facilitating the identification of optimal design configurations that meet the required standards.
The lighting performance of the LED street lighting system was evaluated using DIALux simulations, considering variations in pole spacing from 20 to 55 m and LED power ratings ranging from 60 W to 160 W, as shown in Figure 2. The analysis focuses on three key parameters: average illuminance (Eav), overall uniformity (Uo), and longitudinal uniformity (U1).
Figure 2.
Lighting quality evaluation of LED street lighting systems under single-sided pole configuration for a 2-lane secondary road. The red line (S-road) represents the minimum required lighting performance thresholds (Eav ≥ 13 lux, Uo ≥ 0.4, and U1 ≥ 0.167).
The results indicate that average illuminance decreases significantly as pole spacing increases. At shorter spacings (20–30 m), lower-power luminaires (60–85 W) are sufficient to satisfy the minimum illuminance requirement (Eav ≥ 13 lux). However, beyond approximately 35 m, higher-power luminaires (105–160 W) are required to maintain compliance. In particular, the 160 W LED maintains adequate illuminance even at extended spacings of 50–55 m, demonstrating greater flexibility in spacing design. In contrast, both overall uniformity (Uo) and longitudinal uniformity (U1) decrease consistently with increasing pole spacing, largely independent of luminaire power. The minimum requirement for overall uniformity (Uo ≥ 0.4) is satisfied up to approximately 30–35 m, while longitudinal uniformity (U1 ≥ 0.167) is maintained up to around 38 m. Beyond these limits, both uniformity metrics decline rapidly below acceptable thresholds, indicating that pole spacing is the dominant factor governing lighting uniformity.
It is also observed that the uniformity curves in Figure 2b,c overlap for different LED power ratings. This behavior is expected, as uniformity metrics are primarily determined by the geometrical configuration of the lighting system—such as pole spacing, mounting height, and luminaire arrangement—rather than the absolute luminous flux. Increasing LED power proportionally scales illuminance levels but does not significantly alter the spatial distribution of light, resulting in nearly identical uniformity values across different wattages.
Based on these results, an optimal pole spacing of approximately 30–35 m is recommended to satisfy all lighting performance criteria. While increasing luminaire power improves illuminance, it provides limited benefit in extending allowable spacing due to uniformity constraints. Therefore, lighting design should prioritize geometric configuration to achieve uniformity requirements, while luminaire power selection should be optimized primarily to meet illuminance thresholds and energy efficiency considerations.
2.2. Solar PV Systems for Street Lighting Applications
The design of solar PV-powered street lighting systems involves careful consideration of solar irradiance, battery storage capacity, and energy consumption patterns. Solar PV energy generation inherently occurs during daytime hours, whereas street lighting systems operate at night, necessitating the integration of effective energy storage solutions.
As illustrated in Figure 3, the system architecture consists of both DC and AC subsystems. The DC bus connects the solar PV array and battery storage, while the AC bus supplies power to the street lighting loads and, in grid-connected mode, interfaces with the utility grid. An inverter is used to convert DC power from the PV system and batteries into AC power suitable for lighting applications, ensuring operational reliability under varying solar conditions.
Figure 3.
Schematic diagram of solar PV street lighting system.
The performance of the PV system is strongly influenced by solar irradiance variability. As shown in Figure 4, Thailand experiences significant seasonal variation in solar radiation, with an annual average of approximately 5.19 kWh/m2/day. Higher irradiance levels typically occur during the dry season (March–April), whereas reduced solar availability is observed during the rainy season (June–October) due to cloud coverage. These variations necessitate appropriate system sizing to maintain reliable operation throughout the year.
Figure 4.
The daily solar radiation intensity in Thailand throughout the year.
To account for these conditions, the solar PV and battery system configurations are optimized using HOMER Pro. The simulation assumes a project lifetime of 25 years, a discount rate of 5%, and an inflation rate of 3%. Key system parameters, including component costs, efficiencies, and replacement characteristics, are summarized in Table 4. Solar irradiance data are obtained from the NASA POWER database with hourly resolution, where time-series data are used for system simulation and annual averages for resource assessment.
Table 4.
HOMER Pro Input Parameters Used in Simulation.
Considering the variability of solar resources, the PV and battery capacities must be adequately sized to support continuous nighttime operation. Larger PV arrays and battery capacities are required to compensate for prolonged periods of low solar irradiance, particularly during the rainy season. However, this increases both capital and operational costs, highlighting the need for optimal system design that balances reliability and economic performance.
The system operates under a load-following dispatch strategy, where PV generation is prioritized for immediate load supply, followed by battery charging. During nighttime, the battery supplies the load, while grid support is utilized in grid-connected mode when battery capacity is insufficient. This strategy ensures efficient energy utilization and stable system operation.
Table 5 illustrates the optimal solar PV and battery storage system sizing for a 2-lane secondary road street lighting system over a distance of 1 km, evaluated using HOMER Pro 3.18.4 software. The analysis varied LED street lighting luminaire power ratings, ranging from 60 W to 160 W, assessing their impacts on solar PV and battery system sizing. The findings indicate that increasing the wattage of street lighting luminaires results in higher total energy consumption and consequently requires larger PV arrays and battery storage capacities. The system designed using the lowest luminaire wattage (60 W) demonstrates the lowest total power requirement (1980 W), leading to the smallest optimal solar power PV (15.1 kW) and battery storage capacity (72 kWh). This configuration provides sufficient illumination (Eav = 13 lux) and maintains acceptable overall uniformity (U0 = 0.48) and longitudinal uniformity (Ul = 0.28).
Table 5.
Optimal lighting quality and solar PV system sizing for 2-Lane secondary road street lighting over 1 km.
Conversely, employing luminaires rated above 60 W, although increasing average illuminance (Eav), does not significantly improve lighting uniformity (U0 and Ul). Consequently, higher-powered luminaires do not allow for increased pole spacing, resulting in similar infrastructure requirements as lower-powered luminaires. Thus, the increased luminaire wattage primarily escalates energy consumption without yielding substantial benefits in lighting uniformity or infrastructure optimization. This leads directly to larger and costlier solar PV and battery storage systems. In addition, selecting lower wattage luminaires (such as 60 W) can substantially minimize energy requirements and associated solar PV and battery capacities, making it economically advantageous for installations with stringent budget constraints. However, the choice of higher wattage luminaires could be justified when higher illuminance levels are necessary for specific safety or regulatory standards, albeit at increased energy and investment costs.
For this reason, the optimal design, as evidenced by this study, advocates a balanced approach, recommending the use of 60 W LED luminaires for secondary road lighting systems due to their efficient energy utilization, effective illumination quality, and minimal solar PV and battery storage requirements.
2.3. Innovative Concept for Nanogrid-Integrated Street Lighting Systems
Nanogrids are small-scale electrical systems that integrate renewable energy generation, storage, and energy management within localized networks. These systems are especially suitable for solar PV-powered LED street lighting due to their capability to operate efficiently in either stand-alone or grid-connected modes.
Integrating solar panels individually on street lighting poles can result in significant voltage drops, especially when electrical cables extend over considerable distances with insufficient cable sizing. Voltage drop adversely impacts system efficiency, making it crucial to adopt medium-level voltages, such as 48 V DC, or increase cable sizes to mitigate this issue.
The proposed nanogrid systems for street lighting can be categorized into two configurations, as illustrated in Figure 5:
Figure 5.
Nanogrid LED street lighting systems.
- Single Nanogrid System (Figure 5a): Each street light pole has its dedicated solar panel and battery, independently storing and utilizing energy. Due to their isolated energy management, energy cannot be transferred between poles.
- Centralized Nanogrid System (Figure 5b): Energy generated by solar panels on individual poles is collected and stored in a centralized battery system. Energy is subsequently distributed to each street light through interconnected utility grids, optimizing overall energy management. However, the increased distance of electrical grids necessitates careful attention to potential voltage drop.
Figure 6a demonstrates the connection diagram of a hybrid inverter system, capable of operating in both stand-alone and grid-connected modes. Its components include the following:
Figure 6.
Hybrid on/off-grid inverter for nanogrid LED street lighting systems connected to utility grid.
- DC to AC Converter (no. 1): Converts DC power from batteries to AC power for LED street light loads.
- DC to AC Grid-connected Converter (no. 2): Converts DC power from solar panels into AC power feeding into the utility grid.
- DC to DC Charge/Discharge Converter (no. 3): Manages battery charging from solar panels and discharging to loads.
- Batteries (no. 4): Stores electrical energy produced by solar panels.
Figure 6b illustrates the stand-alone mode, where energy generated by solar panels during the day is stored in batteries and used to power street lights at night. Figure 6c depicts the grid-connected mode, which reflects a key operational concept of nanogrid systems. During daytime, excess solar PV energy can be exported to the utility grid through the grid-connected converter. During nighttime, when solar generation is unavailable or insufficient, electrical power can be imported from the grid to supply street lighting loads. This bidirectional energy exchange enables the nanogrid system to operate flexibly, reducing reliance on battery storage while enhancing overall system reliability and energy utilization, particularly in areas with stable grid infrastructure.
3. Determinants of Voltage Drop in Nanogrid Street Lighting Systems
3.1. Solar Panel Connection
In a series connection, the positive pole of one solar panel is linked to the negative pole of another, and so forth, until the desired voltage is achieved as per the system design. This series connection raises the voltage while maintaining a consistent current within the system. In a parallel connection, the positive pole of one solar panel is linked to the positive pole of another, and similarly, the negative terminal of one panel is connected to the negative terminal of the other. This configuration increases the current while maintaining a constant voltage in the system.
3.2. Components of Electrical Cable
The resistance of an electrical cable depends on the type of material used to make the electrical wire. When an electrical wire exhibits high resistance, it induces a significant voltage drop across the cable, consequently diminishing the voltage drop across the load. This reduction may lead to the load operating below its full capacity. The resistance of the cable varies depending on factors such as the material used, cross-sectional area, length, and temperature of the cable. To determine the voltage drop of a solar PV system, it is calculated based on the resistance of electrical cables listed in the catalog, as illustrated in Table 6.
Table 6.
Electrical resistance of stranded tin-plated copper electrical cables at 60 °C for various cross-sectional.
In solar PV-powered street lighting systems, especially those where solar panels are mounted directly on lighting poles, the total length of electrical cables required becomes a significant design factor. Variations in luminaire height, pole spacing, and configuration (stand-alone vs. centralized) influence the total cable length needed for both power transmission and system interconnection.
As depicted in Figure 7, cable lengths must account for vertical segments (from ground level to luminaire height) and horizontal segments (between adjacent poles). Therefore, to ensure accurate planning and cost estimation, a mathematical model for cable length calculation is proposed as presented in Equation (1). This model incorporates pole height (h(m)), spacing between poles (S(m)), and the total number of poles (n), and it can be adapted for different installation types such as single and centralized solar PV stand-alone systems with localized wiring.
Figure 7.
Schematic layout and cable length components for solar PV-powered street lighting systems.
When designing nanogrid-based solar PV street lighting systems, a critical factor to consider is the voltage drop that occurs during the transmission of electrical power from the solar PV system to the energy storage unit. Given that these systems typically operate on a single-phase direct current (DC) basis, the voltage drop can directly impact energy efficiency and overall system performance, particularly in extended cable runs along roadways. The voltage drop occurs due to the resistance of the electrical cables and is proportional to both the magnitude of current flowing through the conductor and the resistance of the wire. This relationship is mathematically expressed in Equation (2) as follows:
Equation (2) is revised based on using the cable resistance catalog as follows:
According to electrical installation standards for Thailand, the voltage drop in the designed system must not exceed 5% [51]. Therefore, when the solar PV system is designed, the voltage drop should not exceed 5% of the system voltage, as indicated in Equation (4).
Equation (4) is rearranged by comparing it to the voltage of solar PV system as follows:
The voltage drop in a solar PV street lighting system is fundamentally influenced by the current output from the solar array and the electrical resistance of the cable through which it flows. As shown in Equations (3) and (5), this voltage drop is the product of the current and the resistance of the cable. Importantly, the magnitude of current is not fixed: it varies depending on the rated output power and voltage of the solar PV system. This makes the evaluation of voltage drop a critical step in cable sizing and layout design.
By combining Equations (3) and (5), the maximum permissible cable length can be derived to ensure that the voltage drop remains within acceptable limits. Equation (6) presents this relationship mathematically:
In this expression, the allowable voltage drop is limited to 5% of the system voltage, which is a commonly accepted design criterion in low-voltage DC distribution systems such as nanogrid-based solar PV applications.
3.3. Electric Cable Sizing Versus Solar PV Ratings
The selection of solar panels significantly influences the voltage rating and performance of solar PV systems, especially in nanogrid and LED street lighting applications. The electrical characteristics of solar panels, including maximum power output, voltage, and current, are typically evaluated under standard test conditions (STC) of 1000 W/m2 solar irradiance and a cell temperature of 25 °C, as outlined in Table 7.
Table 7.
Technical specifications of commercially available high-efficiency solar panels in Thailand.
According to Table 7, commercially available solar panels exhibit rated power in the range of 590–670 Wp. The data indicate that as the rated power of solar modules increases, both voltage and current outputs generally increase. This leads to enhanced power generation capability per unit area, which can improve overall system efficiency, particularly in applications with limited installation space such as pole-mounted street lighting systems. However, the selection of higher-rated solar modules should not be based solely on maximizing power output. Practical design considerations must also be taken into account, including physical installation constraints, electrical limitations, and overall system cost. In street lighting applications, the available mounting area and structural capacity of poles impose clear limits on module size. Therefore, the selection of solar PV modules involves a design trade-off between maximizing energy generation and ensuring feasible system integration. An optimal configuration must balance module rating, electrical performance, and installation constraints to achieve reliable and cost-effective operation.
Choosing higher-efficiency solar panels provides more electrical energy output within a constrained physical area. However, the increase in current output necessitates careful sizing and selection of cables and protective devices to mitigate potential voltage drop and maintain optimal system performance. When solar panels are connected in series, the cumulative voltage significantly increases, thus reducing the adverse effects of voltage drops across lengthy cables typically found in street lighting systems. This configuration is beneficial for extended-length nanogrid systems, as it ensures voltage stability and improved power delivery efficiency.
The data presented in Figure 8 illustrates the relationship between cable length and the resulting voltage drop when employing solar panels of varying rated capacities (590 Wp to 670 Wp) using the same cable size of 2.5 mm2. Although the general behavior of voltage drop is well established, these results provide application-specific insight for nanogrid-based street lighting systems, where long cable distances and distributed generation significantly influence system performance.
Figure 8.
Comparison of voltage drop characteristics across different solar panel ratings as cable length increases, based on equal conductor size, highlighting the design trade-off between PV rating and voltage drop in extended nanogrid layouts.
In this context, the results show that higher-rated solar panels lead to increased current flow, which in turn results in greater voltage drop along extended cable runs. For example, at a cable length of 1000 m, the voltage drop associated with a 670 Wp panel is noticeably higher than that of a 590 Wp panel. This highlights a critical design trade-off between maximizing power generation and maintaining acceptable voltage levels in nanogrid configurations.
Figure 9 further extends this analysis by evaluating the maximum permissible cable length under voltage drop constraints for different cable sizes and solar panel ratings. The results demonstrate that cable cross-sectional area plays a dominant role in limiting system performance for small cable sizes (2.5–10 mm2), where high resistance leads to similar maximum cable lengths regardless of panel rating. In such cases, increasing PV capacity does not effectively extend the feasible transmission distance. However, for larger cable sizes (≥16 mm2), the influence of panel rating becomes more pronounced. Higher-rated panels produce greater current, leading to increased voltage drop and reduced allowable cable length. Conversely, lower-rated panels (e.g., 590 Wp) enable longer transmission distances under the same voltage drop constraint.
Figure 9.
The influence of cable cross-sectional area and solar module rating on maximum permissible cable length under voltage drop constraints, providing practical limits for cable sizing and PV selection in nanogrid street lighting systems.
These findings are particularly relevant for nanogrid street lighting design, where system layout involves extended linear configurations along roadways. The results indicate that both PV module selection and cable sizing must be jointly optimized to balance energy generation, voltage regulation, and infrastructure cost. Therefore, Figure 8 and Figure 9 provide practical design guidance rather than merely illustrating fundamental electrical relationships.
4. Voltage Drop Behavior in Nanogrid LED Street Lighting Systems
4.1. Nanogrid LED Street Lighting System
This analysis evaluates the voltage drop impact and optimal cable sizing for nanogrid-based LED street lighting systems over a 1 km stretch of a secondary two-lane road. Each LED street luminaire (60 W) is mounted at a height of 9 m with a spacing of 32 m between poles, totaling 32 poles. A solar PV system size of approximately 15.1 kW was determined necessary for this configuration, averaging approximately 472 W per street pole. However, for practical optimization, 590 W solar panels are selected, given minimal cost differences and favorable voltage drop characteristics. Voltage drop is critical in street lighting systems to maintain efficient performance and avoid unnecessary power losses. The analysis includes two operational modes for the nanogrid LED street lighting system: stand-alone and grid-connected, as presented in Figure 10.
Figure 10.
Nanogrid LED street lighting system diagram.
Two primary configurations of nanogrid systems, as illustrated in Figure 10, are assessed in this study: the single nanogrid system and the central nanogrid system. In the single nanogrid configuration (Figure 10a), each street lighting pole is equipped with its own solar panel, energy storage (battery), and hybrid on/off-grid inverter. This setup minimizes voltage drop due to the short distances between power generation, storage, and the lighting load. However, it presents limitations in terms of flexibility, scalability, and redundancy. In contrast, the central nanogrid configuration (Figure 10b) consolidates solar panels and energy storage into a centralized system that supplies power to multiple LED luminaires. This configuration was analyzed at different levels of centralization—25%, 50%, and 100% of the total system length. The 25% centralized system offers moderate flexibility and manageable voltage drop, while the 50% centralized system provides an effective balance between shared resource efficiency and acceptable voltage drop levels. At full centralization (100%), the system achieves the highest efficiency in terms of battery and inverter utilization; however, it suffers from increased voltage drop due to the longer cable lengths required, thereby necessitating the use of cables with larger cross-sectional areas to maintain performance.
4.2. Nanogrid LED Street Lighting System Under Stand-Alone Mode
This analysis examines the integration of nanogrid technology into street lighting systems based on stand-alone operational modes, specifically evaluating voltage drop impacts related to DC generation from solar panels and AC distribution to street luminaires.
4.2.1. Single Stand-Alone Nanogrid System
In the single stand-alone nanogrid system (Figure 11), each street light pole independently generates and stores energy using dedicated solar panels, battery storage, and hybrid on/off-grid inverters. Solar PV-generated DC power is routed through the inverter, serving as a battery charge controller (Figure 11a). This arrangement ensures minimal voltage drop on the DC side due to short cable distances between generation and storage components. When energy distribution to LED luminaires is required, stored DC power is converted to AC at 230 V and 50 Hz via individual inverters located at each street pole (Figure 11b). The decentralized nature of this configuration significantly reduces voltage drops on the AC distribution side, as each pole supplies only its load, minimizing cable length and current.
Figure 11.
A single stand-alone nanogrid LED street lighting systems.
4.2.2. Central Stand-Alone Nanogrid System
The central stand-alone nanogrid system (Figure 12) consolidates solar PV-generated DC power from multiple poles to a central battery storage unit through a hybrid inverter operating in DC charging mode (Figure 12a). The study assesses the impact of centralization at 25%, 50%, and 100% distances along a 1 km stretch of roadway. During periods of illumination demand, stored energy is converted to AC power (230 V, 50 Hz) and distributed from the central storage to multiple street lights (Figure 12b). The centralized configuration increases cable lengths on the DC collection side and AC distribution side, thus introducing potentially significant voltage drops.
Figure 12.
A central stand-alone nanogrid LED street lighting systems.
4.3. Nanogrid LED Street Lighting System Under Grid-Connected Mode
This analysis investigates the integration of nanogrid technology into street lighting systems under grid-connected operational modes. It specifically evaluates the impact of voltage drops and system efficiency in terms of alternating current (AC) power supplied to and from an external electrical grid.
4.3.1. Single Grid-Connected Nanogrid System
In the single grid-connected nanogrid system (Figure 13), each street light pole independently produces electrical energy through dedicated solar panels. Generated direct current (DC) energy is converted to AC (230 V, 50 Hz) by a hybrid on/off-grid inverter operating in on-grid mode, allowing excess energy to be individually fed into the electrical grid (Figure 13a). This decentralized arrangement ensures minimal voltage drop due to short cable lengths between power generation and grid connection points. During energy consumption periods, street lighting demands are fulfilled directly from the electrical grid, providing reliable and stable energy distribution at standardized voltage levels (Figure 13b). This configuration, however, reduces flexibility in resource sharing and could lead to underutilized inverter capacities.
Figure 13.
A single grid-connected nanogrid LED street lighting systems.
4.3.2. Central Grid-Connected Nanogrid System
The central grid-connected nanogrid system (Figure 14) consolidates the solar PV-generated energy from multiple poles into a centralized inverter system before grid injection. This approach enables efficient conversion from DC to AC at a unified point, optimizing inverter usage and facilitating easier grid management (Figure 14a). During lighting operation periods, the central configuration provides stable and reliable power from the electrical grid directly to each street light pole (Figure 14b). This configuration introduces greater cable lengths for both DC energy collection and AC grid interconnection, potentially increasing voltage drops. The study examines centralization impacts at intervals of 25%, 50%, and 100% over a 1 km roadway.
Figure 14.
A central grid-connected nanogrid LED street lighting systems.
5. Results and Discussion
This section presents a discussion on the feasibility of various nanogrid-based LED street lighting configurations, including single nanogrid systems, 25% centralization, 50% centralization, and 100% centralization. The analysis considers the impact of voltage drop factors on cable sizing and allowable cable length. Furthermore, a comparative economic evaluation is conducted to assess the trade-offs between system redundancy, cabling infrastructure costs, and overall investment efficiency for each nanogrid configuration.
5.1. Voltage Drop Effects on Cable Size and Length Limitations
Based on the information in Table 8, the infrastructure parameters and electrical characteristics of various nanogrid LED street lighting systems over a one-kilometer road segment can be analyzed in terms of cable requirements, voltage levels, and current demands. The table contrasts different configurations, including a fully distributed system and progressively centralized architectures (25%, 50%, and 100%). In solar PV-powered systems, the DC-side voltage can be flexibly designed by connecting solar panels in series, allowing for scalable voltage levels. In contrast, the AC-side voltage, used for LED street lighting and grid connection, must conform to standard utility specifications—in this case, 230 V at 50 Hz, which is standard in Thailand.
Table 8.
Infrastructure parameters and electrical characteristics of various nanogrid LED street lighting systems over a 1 km.
Cable length per system is calculated using Equation (6), and the values vary substantially depending on the nanogrid configuration. In the single nanogrid system, each street light pole is independently powered, requiring only 18 m of cable per system, resulting in the shortest total cable length of 576 m over a one-kilometer stretch. Each solar PV unit operates at 43.9 V and 13.4 A, representative of a typical single panel configuration. On the AC side, the power demand per 60 W LED luminaire is 0.26 A at 230 V. In contrast, the 25% central nanogrid system groups 8 poles per system, increasing the cable length per system to 578 m, with a total of 2312 m per kilometer. The system voltage on the solar PV side rises to 351.2 V while maintaining the same current level of 13.4 A, reflecting the consistent energy production requirement. The combined AC for 8 luminaires reaches 2.09 A. The 50% central nanogrid system, consisting of 16 poles per cluster, further extends the cable length per system to 1218 m, resulting in a total length of 2436 m. The system voltage increases to 746.3 V, which enhances transmission efficiency by reducing the current per unit power. The AC load for this configuration rises to 4.17 A, supplying 16 luminaires. Finally, the 100% central nanogrid system integrates all 32 poles into a single centralized setup, leading to the highest DC voltage of 1448.7 V and the longest cable length—2498 m—which is nearly five times greater than the single nanogrid case. The AC side draws 8.35 A, accounting for the total load of all luminaires. This centralized approach improves component sharing but introduces more significant voltage drop and cable sizing considerations.
From a design perspective, increasing centralization significantly reduces the number of inverters and energy storage systems, thereby potentially lowering capital costs and improving system maintainability. However, this comes at the expense of increased cable length, which introduces higher voltage drops, especially on the DC side where lower voltages and longer cable runs are more susceptible to line losses. While centralized systems offer better component efficiency (e.g., shared battery capacity), the higher DC voltages and longer cable distances require larger conductor sizes to keep voltage drops within acceptable limits, increasing material and installation costs. Conversely, the single nanogrid system offers minimal cable losses and lower voltage stress, but at the cost of higher component redundancy and reduced operational flexibility. Therefore, an optimal nanogrid LED street lighting design must balance electrical efficiency, infrastructure cost, and system reliability, with centralization levels tailored to the specific context, including street length, layout, and local grid conditions.
Under the design constraint that limits the voltage drop to a maximum of 5% over a 1 km distance, Table 9 presents the maximum allowable cable lengths for various nanogrid LED street lighting system configurations. The analysis considers both the solar PV generation systems (DC side) and the street lighting systems (AC side) across different cable sizes, providing insights into the engineering trade-offs required to maintain voltage drop and system reliability.
Table 9.
Maximum allowable cable lengths for various nanogrid LED street lighting system configurations based on cable size and 5% voltage drop constraints over a 1 km span.
For analysis of solar PV systems, in the single solar PV system, each pole integrates one solar panel with a relatively low DC voltage of 43.9 V. Due to the minimal distance between the panel and the energy storage unit (approximately 18 m), even with a low system voltage, a small cable size of 6 mm2 is sufficient to maintain the voltage drop within the acceptable limit. In the 25% central solar PV system, eight poles share a single energy hub, increasing the average cable length per system to 578 m. To accommodate the longer transmission distance while maintaining the 5% voltage drop limit, the cable size must be increased to 16 mm2. The 50% central solar PV system, which aggregates energy from 16 poles, further increases the cable length to 1218 m. However, the system benefits from a higher operating voltage of 746.3 V, achieved by series-connecting more solar panels. This higher voltage reduces the current for the same power level, thereby mitigating voltage drop. As a result, a cable size of 25 mm2 remains acceptable. In the 100% central solar PV system, the longest transmission distance of 2498 m is required to interconnect 32 poles. Despite this, the elevated system voltage of 1448.7 V allows for the use of a 25 mm2 cable, thanks to the significantly reduced current, which minimizes resistive voltage loss across the cable span.
For analysis of street lighting systems, in the single street lighting system, each luminaire (60 W, 230 V) draws only 0.26 A, resulting in a low current demand. Therefore, even small cable sizes such as 2.5 mm2 are acceptable, as the voltage drop is minimal over the short distribution distance from the battery to the luminaire. In the 25% central street lighting system, which supplies power to eight luminaires per system, the aggregated current rises to 2.09 A. To ensure compliance with the 5% voltage drop constraint over the increased cable length, a minimum cable size of 4 mm2 is required. As the system scales to the 50% and 100% central street lighting systems, the total current increases substantially to 4.17 A and 8.35 A, respectively. Given the longer distribution paths and higher current, larger cable sizes of 25 mm2 and 70 mm2 are necessary to limit voltage drops within the permissible range.
Centralized nanogrid configurations provide notable advantages, particularly through the sharing of inverters and energy storage systems, which contribute to reduced equipment costs and enhanced operational efficiency. However, these benefits come at the expense of requiring significantly longer cable runs and larger conductor sizes to accommodate higher current flows and ensure proper voltage regulation across the system. In contrast, single systems offer simpler wiring schemes and allow for the use of smaller cable sizes due to their localized energy distribution. Nevertheless, these systems involve duplicated components and offer limited flexibility in energy sharing among poles. To address the challenges posed by voltage drops in centralized solar PV systems, increasing the DC system voltage emerges as an effective approach. This strategy reduces the current in the system, thereby minimizing voltage loss and enabling the use of smaller cable sizes even over extended distances.
5.2. Economic Evaluation
Table 10 presents a detailed comparative breakdown of the major cost components for various nanogrid-based LED street lighting configurations, including solar panels, battery storage systems, solar chargers, on-grid and off-grid inverters, and both DC and AC cabling. The analysis reflects the total capital investment required for single and centralized system architectures.
Table 10.
Comparative cost breakdown and component details of different nanogrid LED street lighting system configurations.
The cost of solar panels and battery storage scales proportionally with the number of connected lighting units. As shown in Table 10, centralized configurations require a significantly larger number of PV modules and batteries to supply aggregated loads. For instance, the total solar panel cost increases from 81.7 USD in the single system to 2613.4 USD in the 100% centralized system, while battery cost rises from 144 USD to 4608 USD. This demonstrates that energy storage constitutes a substantial portion of the total system cost and becomes increasingly dominant as system scale increases.
In single nanogrid systems, each pole is equipped with an individual PV module, battery, and low-rated solar charger (30 A, 720 W), which simplifies system design but introduces component redundancy. In contrast, centralized systems utilize higher-capacity solar chargers with increased voltage levels (up to 192 V) and power ratings (up to 19.2 kW), enabling efficient aggregation of power but increasing equipment cost per unit. However, centralized architectures benefit from shared infrastructure, requiring only one solar charger per system, thereby reducing duplication.
A similar trend is observed for inverter systems. Single configurations employ small off-grid inverters (100 W), whereas centralized systems require higher-capacity inverters (up to 20 kW for on-grid and 2 kW for off-grid operation). Although the unit cost of these components increases significantly with system size, the total number of inverters remains constant (one unit per system), improving cost efficiency at the system level.
Cabling represents the most critical cost factor in centralized configurations. As system centralization increases, both cable length and conductor size must be expanded to satisfy voltage drop constraints. For example, the solar cable length increases from 18 m in the single system to 2498 m in the 100% centralized system, while conductor size increases from 6 mm2 to 25 mm2. Consequently, the total solar cable cost rises dramatically from 27.0 USD to 19,484.4 USD. A similar trend is observed in AC cabling, where costs escalate from 10.4 USD to 39,143.7 USD due to increased transmission distance and higher current requirements.
These results highlight a critical trade-off between system architectures. Centralized nanogrid configurations reduce redundancy in key components such as solar chargers and inverters, but incur significantly higher costs in battery storage scaling and, more importantly, cabling infrastructure. Conversely, decentralized single systems minimize cable length and associated costs while maintaining simpler electrical design, but suffer from higher component redundancy. Therefore, the optimal configuration depends on balancing energy storage requirements, voltage regulation constraints, infrastructure cost, and system scalability.
Based on the data presented in Table 11, a comprehensive engineering and economic assessment reveals clear trade-offs between nanogrid configurations and total system cost. As the level of centralization increases, the total cost of the solar PV subsystem decreases. Specifically, the solar PV system costs are reduced from USD 18,183.68 in the single system to USD 11,926.77, USD 11,236.77, and USD 9716.44 for the 25%, 50%, and 100% centralized systems, respectively. This reduction is attributed to shared infrastructure, where fewer solar chargers and inverters are required, thereby lowering overall equipment redundancy and capital cost per kilometer.
Table 11.
Comparative cost analysis of single and centralized nanogrid LED street lighting systems for a 1 km layout (all costs are expressed in USD).
However, these cost savings are significantly offset by the substantial increase in electrical cable costs. As shown in Table 11, the total cable cost rises sharply from USD 1198.08 in the single system to USD 12,068.64, USD 33,007.80, and USD 58,628.06 for the 25%, 50%, and 100% centralized systems, respectively. This increase is primarily driven by longer transmission distances and higher current aggregation, which necessitate larger conductor sizes to maintain acceptable voltage drop limits. In centralized configurations, DC cable sizes increase from 6 mm2 in the single system to 16 mm2 and 25 mm2, while AC cable sizes expand significantly up to 70 mm2 in the fully centralized system. These requirements lead to a disproportionate rise in infrastructure costs, making cabling the dominant cost component in highly centralized layouts.
As a result, the total system cost increases with centralization, reaching USD 23,995.41, USD 44,244.57, and USD 68,344.50 for the 25%, 50%, and 100% centralized systems, respectively, compared to USD 19,381.76 for the single system. Despite higher component redundancy, the single nanogrid system remains the most cost-effective solution due to its minimal cable length, smaller conductor requirements, and simplified electrical layout.
In summary, while centralized nanogrid configurations benefit from reduced solar PV subsystem costs through component sharing, the rapid escalation of cable infrastructure costs—driven by distance and voltage drop constraints—dominates the overall economic outcome. Therefore, for a 1 km street lighting deployment, decentralized single systems offer the most economically efficient configuration, particularly in applications where minimizing wiring complexity and infrastructure cost is critical.
It should be noted that the present economic analysis focuses primarily on capital investment. When lifecycle costs, maintenance requirements, and system reliability are considered, decentralized configurations may offer additional advantages due to their modularity and reduced system-level risk.
5.3. Lifecycle Cost and Reliability Analysis
To provide a more comprehensive economic assessment beyond initial capital expenditure, the lifecycle cost (LCC) of each nanogrid configuration over a 25-year project lifetime is evaluated in Table 12. The LCC analysis incorporates initial investment cost, annual operation and maintenance (O&M) cost, and component replacement cost based on realistic service-life assumptions. In this study, the annual O&M cost is assumed to be 10% of the initial solar PV system cost, while batteries, solar chargers, and inverters are replaced according to their respective lifetimes of 7 years, 10 years, and 10 years. Electrical cables are assumed to have a service lifetime longer than 25 years and therefore incur negligible maintenance and no replacement cost.
Table 12.
Lifecycle cost assessment of nanogrid-based LED street lighting systems over a 25-year project lifetime (all costs are expressed in USD).
As shown in Table 12, the inclusion of O&M and replacement costs significantly alters the economic comparison among different nanogrid configurations. The results indicate that the 25% central system provides the lowest total lifecycle cost at USD 77,046.94 per kilometer, followed by the 50% central system (USD 94,191.21), the single system (USD 100,589.44), and the 100% central system (USD 111,413.60). A key observation from Table 12 is that the lifecycle cost of the solar PV subsystem decreases with increasing centralization. The 100% central system exhibits the lowest solar PV lifecycle cost (USD 52,785.54), followed by the 50% central system (USD 61,183.41), the 25% central system (USD 64,978.30), and the single system (USD 99,391.36). This trend is primarily attributed to the reduction in the number of required components. In the single system configuration, each lighting pole is equipped with its own solar charger, inverter, and on-grid inverter, resulting in a large number of duplicated components per kilometer. Consequently, both O&M costs and replacement costs increase significantly due to the higher number of units requiring maintenance and periodic replacement.
In contrast, centralized configurations reduce component redundancy by sharing major equipment among multiple lighting poles. This leads to lower cumulative O&M and replacement costs, despite the higher capacity of individual components. As a result, the solar PV subsystem lifecycle cost decreases as the level of centralization increases. However, this cost advantage is offset by the behavior of electrical cable costs. Unlike the solar PV subsystem, electrical cable costs remain unchanged in the lifecycle analysis, as no replacement or maintenance is considered over the 25-year period. Nevertheless, the initial cable cost increases substantially with centralization due to longer transmission distances and larger conductor sizes required to satisfy voltage drop constraints. In particular, the 100% central system exhibits the highest cable cost (USD 58,628.06), which becomes the dominant contributor to the total system cost.
Therefore, although the 100% central system achieves the lowest solar PV lifecycle cost, this benefit is outweighed by the excessive cabling cost, resulting in the highest overall lifecycle cost. Similarly, the 50% central system offers reduced solar PV costs compared to the single system but still incurs a significant cable cost penalty. The 25% central system, however, achieves the most balanced trade-off between reduced component redundancy and manageable cable infrastructure cost.
Overall, the results demonstrate that optimal system configuration depends on a balance between component-related lifecycle costs and infrastructure costs. While higher centralization improves efficiency in terms of equipment utilization and reduces replacement-related expenses, it simultaneously increases cabling costs. Consequently, the 25% central nanogrid configuration emerges as the most economically favorable solution when considering long-term lifecycle performance over a 25-year project horizon. These findings emphasize the importance of lifecycle-based design rather than relying solely on initial capital cost in nanogrid planning.
From a reliability perspective, decentralized (single-pole) systems offer higher resilience, as the failure of a single unit does not affect the entire system. In contrast, centralized configurations introduce greater dependency on shared components, which may increase the risk of system-wide failure in the event of component malfunction.
5.4. Sensitivity and Robustness Analysis
To further strengthen the economic evaluation, a sensitivity and robustness analysis was conducted to examine how variations in key parameters affect the total lifecycle cost (LCC) of different nanogrid configurations. As illustrated in Figure 15, Figure 16, Figure 17 and Figure 18, the analysis considers four critical factors, namely solar PV system cost, electrical cable cost, annual operation and maintenance (O&M) cost, and road segment length. These parameters represent major sources of uncertainty in practical deployment and provide insight into the stability of the economic conclusions under varying conditions.
Figure 15.
Sensitivity of total lifecycle cost to variations in solar PV system cost for different nanogrid configurations.
Figure 16.
Sensitivity of total lifecycle cost to variations in electrical cable cost for different nanogrid configurations.
Figure 17.
Sensitivity of total lifecycle cost to variations in annual O&M cost (% of initial solar PV system cost) for different nanogrid configurations.
Figure 18.
Sensitivity of total lifecycle cost to road segment length for different nanogrid configurations.
Figure 15 shows that the total lifecycle cost increases almost linearly with the solar PV system cost factor for all configurations. This trend is expected, as variations in solar system cost directly affect all major components, including solar modules, batteries, solar chargers, on-grid inverters, and inverters. Consequently, not only the initial investment cost but also the replacement cost increases proportionally over the project lifetime. Among the configurations, the single system exhibits the highest sensitivity to solar PV cost variations. This is primarily because it requires a larger number of duplicated components per kilometer, resulting in higher cumulative investment, O&M, and replacement costs. In contrast, centralized systems (25%, 50%, and 100%) demonstrate lower sensitivity due to component sharing. The 25% central system consistently maintains the lowest LCC across the entire cost range, indicating strong robustness against fluctuations in solar PV system prices.
Figure 16 illustrates that the impact of electrical cable cost varies significantly across configurations. In the single system, the total lifecycle cost remains nearly constant despite changes in cable cost. This is because the system uses relatively short cable lengths with small conductor sizes, resulting in minimal cable-related expenses. In contrast, centralized systems show a clear dependence on electrical cable cost. As cable prices increase, the total lifecycle cost of the 25%, 50%, and especially the 100% central systems rises noticeably. This effect is most pronounced in the 100% central configuration, where long transmission distances and large conductor sizes (e.g., up to 70 mm2 for AC cables) lead to substantial cable investment. Therefore, variations in cable cost significantly influence the economic performance of highly centralized systems, making them more sensitive to infrastructure cost uncertainty.
Figure 17 presents the sensitivity of lifecycle cost to variations in annual O&M cost, expressed as a percentage of the initial solar PV system cost. As expected, increasing the O&M rate leads to a proportional increase in total lifecycle cost for all configurations. The single system shows the highest sensitivity to O&M variations due to the large number of distributed components requiring maintenance. Each pole operates as an independent system, resulting in higher cumulative maintenance effort. In contrast, centralized configurations benefit from reduced component redundancy, leading to lower overall O&M requirements. Among them, the 25% central system again demonstrates the lowest lifecycle cost across all O&M scenarios, confirming its economic robustness.
Figure 18 demonstrates that the total lifecycle cost increases linearly with road segment length for all configurations. This behavior is driven by the scaling of both equipment and infrastructure requirements as the system expands. Although all configurations exhibit similar linear trends, centralized systems show a steeper cost increase due to their dependence on long-distance power transmission. In particular, the 100% central system experiences the highest cost growth rate, as longer cable runs and larger conductor sizes are required to maintain acceptable voltage drop limits. Conversely, the single system scales more moderately, as each lighting unit operates independently with minimal cabling requirements.
Overall, the results confirm that the 25% central nanogrid configuration provides the most robust and stable economic performance under a wide range of parameter variations. It effectively balances the trade-off between reducing component redundancy and limiting excessive cabling costs. These findings demonstrate that system design decisions should not rely solely on nominal conditions but must account for uncertainties in cost parameters and deployment scale to ensure long-term economic viability.
6. Conclusions
This study presents a comprehensive system-level evaluation of nanogrid-based LED street lighting systems by integrating lighting design, solar PV–battery sizing, voltage drop analysis, and techno-economic assessment within a unified framework. Unlike conventional approaches that treat these aspects independently, this work explicitly links electrical infrastructure constraints with system architecture and economic performance for extended street lighting applications.
The results show that optimal lighting performance for secondary roads is achieved with pole spacing in the range of 32–35 m using LED luminaires rated between 60 W and 85 W. Increasing luminaire power beyond this range yields only marginal improvements in illuminance uniformity while significantly increasing system energy demand and PV–battery capacity requirements. This confirms that lighting design alone is insufficient to determine optimal system configuration. From an electrical design perspective, the analysis establishes quantitative relationships between cable length, conductor size, current levels, and allowable transmission distance. The results indicate that for small conductor sizes (≤10 mm2), voltage drop exceeds acceptable limits within relatively short distances (typically below 100–150 m), regardless of PV rating. For larger conductors (≥16 mm2), allowable cable length can be extended beyond 300–500 m, depending on system configuration. Furthermore, higher PV ratings (e.g., 670 Wp) result in higher operating current levels, leading to increased voltage drop, which significantly constrains feasible transmission distances in long feeder lines.
The comparative evaluation of decentralized and centralized nanogrid configurations shows that increasing centralization significantly reduces the number of PV–battery subsystems (e.g., from 32 units in decentralized systems to 8 units in 25% centralized configurations), improving component utilization efficiency. However, this benefit is offset by a substantial increase in cable length (approximately four times) and corresponding conductor sizing requirements. As a result, cabling cost increases significantly in fully centralized configurations compared to decentralized systems. The findings demonstrate that cabling becomes the dominant cost component in highly centralized layouts. An extended techno-economic analysis incorporating lifecycle cost and sensitivity considerations reveals that partially centralized configurations (e.g., 25% centralization) provide the most balanced solution, reducing total system cost by approximately 23% compared to fully decentralized systems while avoiding excessive cabling costs associated with high centralization levels. These results confirm that optimal system design is governed by the interaction between electrical constraints and network architecture, rather than by component-level optimization alone.
Despite these contributions, several limitations should be acknowledged. The analysis is based on a 1 km secondary road case study under specific climatic conditions, which may influence the generalizability of the results to other geographic regions or road classifications. In addition, this study focuses primarily on voltage drop as the key electrical constraint, while other power quality aspects, such as harmonics, reactive power, and dynamic system behavior, are not explicitly considered. Furthermore, system operation is evaluated under steady-state conditions, without incorporating real-time control strategies or stochastic variations in load and solar generation.
Future research should extend this work by incorporating advanced voltage regulation techniques, dynamic system modeling, and broader case studies across different environments and network scales. Expanding the analysis to include additional power quality factors and control strategies will further enhance the applicability of nanogrid-based street lighting systems in real-world deployments.
Author Contributions
S.B.: Conceptualization, Validation, H.W.: Investigation, Software. Y.H.: Investigation, Methodology. P.S.: Resources, Visualization. S.Y.: Funding acquisition, Software, Project administration, Formal Analysis, Writing—Original Draft. S.A.: Project administration, Supervision, Writing—review & editing. All authors have read and agreed to the published version of the manuscript.
Funding
The work presented in this paper is part of a research project sponsored (No. 2566-02-01-031) by King Mongkut’s Institute of Technology Ladkrabang Research Fund.
Data Availability Statement
The original contributions presented in this study are included in the article. Further inquiries can be directed to the corresponding author.
Acknowledgments
The authors would like to thank them for their financial support in this work from King Mongkut’s Institute of Technology Ladkrabang Research Fund (No. 2566-02-01-031).
Conflicts of Interest
The authors declare no conflicts of interest.
Nomenclature
| Average illuminance (lux) | |
| Overall uniformity | |
| longitudinal uniformity | |
| LED | Light emitting diode |
| PV | Photovoltaic |
| Solar PV cable length used in the designed LED solar PV street lighting systems (m) | |
| Pole spacing (m) | |
| Street light pole height (m) | |
| Number of street light poles | |
| Voltage drop across electrical cables (V) | |
| Current through cable (A) | |
| Resistance of the cable () | |
| Resistance of the cable from the catalog () | |
| Cable length (m) | |
| Voltage of solar PV system (V) | |
| Maximum cable length (m) |
References
- Rabaza, O.; Pérez-Ocón, F.; Aznar-Dols, F.; Gómez-Lorente, D. Development of a comprehensive model for the design of photovoltaic solar public lighting systems in rural and urban areas. Clean. Eng. Technol. 2025, 27, 101012. [Google Scholar] [CrossRef] [Scilit]
- Belloni, E.; Massaccesi, A.; Moscatiello, C.; Martirano, L. Stand-alone LED lighting system powered by PV and battery: Electrical overall performance analysis of a case study. IEEE Trans. Ind. Appl. 2024, 60, 5142–5149. [Google Scholar] [CrossRef] [Scilit]
- Allwyn, R.G.; Al-Hinai, A.; Al-Abri, R.; Malik, A. Optimization and techno-economic analysis of PV/battery system for street lighting using genetic algorithm—A case study in Oman. Clean. Eng. Technol. 2022, 8, 100475. [Google Scholar] [CrossRef] [Scilit]
- Belloni, E.; Massaccesi, A.; Moscatiello, C.; Martirano, L. Implementation of a new solar-powered street lighting system: Optimization and technical-economic analysis using artificial intelligence. IEEE Access 2024, 12, 46657–46667. [Google Scholar] [CrossRef] [Scilit]
- Ibrahim, M.M.; Elwany, A.M.; Elansary, L.K. Sustainable technical design and economic–environmental analysis of SMART solar street lighting system in Giza City, Egypt. Int. J. Energy Environ. Eng. 2021, 12, 739–750. [Google Scholar] [CrossRef] [Scilit]
- Padang, B.R.S.; Mulyadi, R.; Yusran, Y. Evaluating and analyzing the solar public street lighting utilization: A case study in Manokwari. Indones. J. Multidiscip. Sci. 2023, 2, 2967–2982. [Google Scholar] [CrossRef]
- Cheng, B.; Chen, Z.; Yu, B.; Li, Q.; Wang, C.; Li, B.; Wu, B.; Li, Y.; Wu, J. Automated extraction of street lights from JL1-3B nighttime light data and assessment of their solar energy potential. IEEE J. Sel. Top. Appl. Earth Obs. Remote Sens. 2020, 13, 675–684. [Google Scholar] [CrossRef] [Scilit]
- Passago, S.; Yodying, C.; Monatrakul, W.; Santiboon, T.T. Research and development of renewable energy: Prototype of LED street lighting from solar energy. Syst. Rev. Pharm. 2020, 11, 765–776. [Google Scholar]
- Yoomak, S.; Jettanasen, C.; Ngaopitakkul, A.; Bunjongjit, S.; Leelajindakrairerk, M. Comparative study of lighting quality and power quality for LED and HPS luminaires in a roadway lighting system. Energy Build. 2018, 159, 542–557. [Google Scholar] [CrossRef] [Scilit]
- Orejon-Sanchez, R.D.; Andres-Diaz, J.R.; Gago-Calderon, A. Autonomous photovoltaic LED urban street lighting: Technical, economic, and social viability analysis based on a case study. Sustainability 2021, 13, 11746. [Google Scholar] [CrossRef] [Scilit]
- International Energy Agency (IEA). Renewables 2023: Analysis and Forecast to 2028; IEA: Paris, France, 2023. [Google Scholar]
- World Bank. Off-Grid Solar Market Trends Report 2022: State of the Sector; Energy Sector Management Assistance Program (ESMAP): Washington, DC, USA, 2022. [Google Scholar]
- Allied Market Research. Solar Street Lighting Market Size, Share, and Forecast; Allied Market Research: Portland, OR, USA, 2023. [Google Scholar]
- Parizy, E.S.; Bahrami, H.R.; Loparo, K.A. A decentralized three-level optimization scheme for optimal planning of a prosumer nano-grid. IEEE Trans. Power Syst. 2020, 35, 3421–3432. [Google Scholar] [CrossRef] [Scilit]
- Latifi, M.; Rastegarnia, A.; Khalili, A.; Bazzi, W.M.; Sanei, S. A self-governed online energy management and trading for smart micro/nano-grids. IEEE Trans. Ind. Electron. 2020, 67, 7484–7498. [Google Scholar] [CrossRef] [Scilit]
- Salazar, A.; Berzoy, A.; Song, W.; Velni, J.M. Energy management of islanded nanogrids through nonlinear optimization using stochastic dynamic programming. IEEE Trans. Ind. Appl. 2020, 56, 2129–2137. [Google Scholar] [CrossRef] [Scilit]
- Jamal, S.; Pasupuleti, J.; Rahmat, N.A.; Tan, N.M.L. Multi-objective optimal energy management of nanogrid using improved pelican optimization algorithm. IEEE Access 2024, 12, 41954–41966. [Google Scholar] [CrossRef] [Scilit]
- Faraji, H.; Hemmati, R.; Siano, P. Resilience control of DC microgrid integrated with multi-nanogrids considering connected-islanded states. CSEE J. Power Energy Syst. 2024, 10, 786–796. [Google Scholar] [CrossRef] [Scilit]
- Keerthana, M.S.; Uma, G.; Sowmmiya, U. A study of a solar PV and wind-based residential DC nanogrid with dual energy storage system under islanded/interconnected/grid-tied modes. Int. J. Electr. Power Energy Syst. 2022, 143, 108473. [Google Scholar] [CrossRef] [Scilit]
- Lee, S.; Vecchietti, L.F.; Jin, H.; Hong, J.; Har, D. Power management by LSTM network for nanogrids. IEEE Access 2020, 8, 24081–24097. [Google Scholar] [CrossRef] [Scilit]
- Lee, S.; Jin, H.; Vecchietti, L.F.; Hong, J.; Har, D. Short-term predictive power management of PV-powered nanogrids. IEEE Access 2020, 8, 147839–147857. [Google Scholar] [CrossRef] [Scilit]
- Farzaneh, H.; Shokri, M.; Kebriaei, H.; Aminifar, F. Robust energy management of residential nanogrids via decentralized mean field control. IEEE Trans. Sustain. Energy 2020, 11, 1995–2002. [Google Scholar] [CrossRef] [Scilit]
- Samende, C.; Bhagavathy, S.M.; McCulloch, M. Power loss minimization of off-grid solar DC nano-grids—Part I: Centralized control algorithm. IEEE Trans. Smart Grid 2021, 12, 4715–4725. [Google Scholar] [CrossRef] [Scilit]
- Kumar, S.; Krishnasamy, V.; Kaur, R.; Kandasamy, N.K. Virtual energy storage-based energy management algorithm for optimally sized DC nanogrid. IEEE Syst. J. 2022, 16, 231–239. [Google Scholar] [CrossRef] [Scilit]
- Bansal, A.K.; Sangtani, V.S.; Bhukya, M.N. Optimal configuration and sensitivity analysis of hybrid nanogrid for futuristic residential application using honey badger algorithm. Energy Convers. Manag. 2024, 315, 118784. [Google Scholar] [CrossRef] [Scilit]
- Li, J.; Luo, Q.; Mou, D.; Wei, Y.; Sun, P.; Du, X.; Liserre, M. Energy optimization management strategy for DC nano-grid cluster with high comprehensive energy efficiency. IEEE Trans. Smart Grid 2023, 14, 4439–4450. [Google Scholar] [CrossRef] [Scilit]
- Dutta, S.; Chatterjee, K. An AC–DC hybrid nanogrid system for PV and battery storage based futuristic buildings. IEEE J. Emerg. Sel. Top. Ind. Electron. 2021, 2, 314–323. [Google Scholar] [CrossRef] [Scilit]
- Carvalho, E.L.; Bellinaso, L.V.; Cardoso, R.; Michels, L. Distributed price-based power management for multibuses DC nanogrids EEMS. IEEE J. Emerg. Sel. Top. Power Electron. 2022, 10, 5509–5521. [Google Scholar] [CrossRef] [Scilit]
- Yoomak, S.; Ngaopitakkul, A. Feasibility analysis of different energy storage systems for solar road lighting systems. IEEE Access 2019, 7, 101992–102001. [Google Scholar] [CrossRef] [Scilit]
- Chiradeja, P.; Yoomak, S.; Ngaopitakkul, A. Economic analysis of improving the energy efficiency of nanogrid solar road lighting using adaptive lighting control. IEEE Access 2020, 8, 202623–202638. [Google Scholar] [CrossRef] [Scilit]
- Yoomak, S.; Ngaopitakkul, A. Development of sustainable nanogrid road lighting systems. IEEE Trans. Intell. Transp. Syst. 2021, 22, 6682–6699. [Google Scholar] [CrossRef] [Scilit]
- Ngaopitakkul, A.; Yoomak, S. Investigating the feasibility of nano-grid infrastructure integration into street lighting systems based on energy production and economic evaluation. Sci. Rep. 2024, 14, 29833. [Google Scholar] [CrossRef] [Scilit]
- Nandini, K.K.; Jayalakshmi, N.S.; Jadoun, V.K. A combined approach to evaluate power quality and grid dependency by solar photovoltaic-based electric vehicle charging station using hybrid optimization. J. Energy Storage 2024, 84, 110967. [Google Scholar] [CrossRef] [Scilit]
- Munkhchuluun, E.; Meegahapola, L.; Vahidnia, A. Long-term voltage stability with large-scale solar photovoltaic generation. Int. J. Electr. Power Energy Syst. 2020, 117, 105663. [Google Scholar] [CrossRef] [Scilit]
- Mahela, O.P.; Shaik, A.G.; Gupta, N.; Khosravy, M.; Khan, B.; Alhelou, H.H.; Padmanaban, S. Recognition of power quality issues associated with grid integrated solar photovoltaic plant in experimental framework. IEEE Syst. J. 2021, 15, 3740–3748. [Google Scholar] [CrossRef] [Scilit]
- Badoni, M.; Singh, A.; Singh, A.K.; Saxena, H.; Kumar, R. Grid tied solar PV system with power quality enhancement using adaptive generalized maximum versoria criterion. CSEE J. Power Energy Syst. 2023, 9, 722–732. [Google Scholar] [CrossRef] [Scilit]
- Kumar, A.; Kumar, P. Power quality improvement for grid-connected PV system based on distribution static compensator with fuzzy logic controller and UVT/ADALINE-based least mean square controller. J. Mod. Power Syst. Clean Energy 2021, 9, 1289–1299. [Google Scholar] [CrossRef] [Scilit]
- Kumar, V.N.; Babu, N.P.; Kiranmayi, R.; Siano, P.; Panda, G. Improved power quality in a solar PV plant integrated utility grid by employing a novel adaptive current regulator. IEEE Syst. J. 2020, 14, 4308–4319. [Google Scholar] [CrossRef] [Scilit]
- Chathurangi, D.; Jayatunga, U.; Perera, S. Recent investigations on the evaluation of solar PV hosting capacity in LV distribution networks constrained by voltage rise. Renew. Energy 2022, 199, 11–20. [Google Scholar] [CrossRef] [Scilit]
- Michael, A.A.; Kehinde, O.P.; Olawale, O.B.; Adebayo, O.E.; Samuel, A.O. Dynamic impact of hybrid wind-solar photovoltaic power injection on small signal stability of Nigerian 11 kV power system using self-organizing map neural network. Sci. Afr. 2024, 24, e02214. [Google Scholar] [CrossRef] [Scilit]
- Alhmoud, L.; Shloul, M. Impact of wheeling photovoltaic system on distribution low voltage feeder. Results Eng. 2023, 19, 101378. [Google Scholar] [CrossRef] [Scilit]
- Gokbayrak, K.; Avci, H. A voltage drop limited decentralized electric power distribution network. Comput. Oper. Res. 2020, 118, 104907. [Google Scholar] [CrossRef] [Scilit]
- Rahman, S.; Saha, S.; Islam, S.N.; Arif, M.T.; Mosadeghy, M.; Haque, M.E.; Oo, A.M.T. Analysis of power grid voltage stability with high penetration of solar PV systems. IEEE Trans. Ind. Appl. 2021, 57, 2245–2257. [Google Scholar] [CrossRef] [Scilit]
- Kazemi-Robati, E.; Sepasian, M.S.; Hafezi, H.; Arasteh, H. PV-hosting-capacity enhancement and power-quality improvement through multiobjective reconfiguration of harmonic-polluted distribution systems. Int. J. Electr. Power Energy Syst. 2022, 140, 107972. [Google Scholar] [CrossRef] [Scilit]
- Saxena, V.; Kumar, N.; Singh, B.; Panigrahi, B.K. A spontaneous control for grid integrated solar photovoltaic energy conversion systems with voltage profile considerations. IEEE Trans. Sustain. Energy 2021, 12, 2159–2168. [Google Scholar] [CrossRef] [Scilit]
- Saxena, V.; Kumar, N.; Singh, B.; Panigrahi, B.K. A voltage support control strategy for grid integrated solar PV system during abnormal grid conditions utilizing interweaved GI. IEEE Trans. Ind. Electron. 2021, 68, 8149–8157. [Google Scholar] [CrossRef] [Scilit]
- Jalan, S.K.; Babu, B.C.; Kolhe, M.L. High-flexibility DC-link voltage control for grid-tied solar PV systems: Maximizing performance and power quality. IEEE Trans. Consum. Electron. 2025, 71, 1672–1684. [Google Scholar] [CrossRef] [Scilit]
- Rahman, S.; Saha, S.; Haque, M.E.; Islam, S.N.; Arif, M.T.; Mosadeghy, M.; Oo, A.M.T. A framework to assess voltage stability of power grids with high penetration of solar PV systems. Int. J. Electr. Power Energy Syst. 2022, 139, 107815. [Google Scholar] [CrossRef] [Scilit]
- Abera, A.G.; Yetayew, T.T.; Alyu, A.B. Optimized solar PV integration for voltage enhancement and loss reduction in the Kombolcha distribution system using hybrid grey wolf-particle swarm optimization. Results Eng. 2025, 26, 105484. [Google Scholar] [CrossRef] [Scilit]
- Department of Highways. Department of Highways Within the Geographical Boundary of Thailand. Available online: http://www.doh.go.th (accessed on 13 May 2024).
- The Engineering Institute of Thailand. Thai Electrical Code 2013; The Engineering Institute of Thailand Under H.M. The King’s Patronage: Bangkok, Thailand, 2013. [Google Scholar]
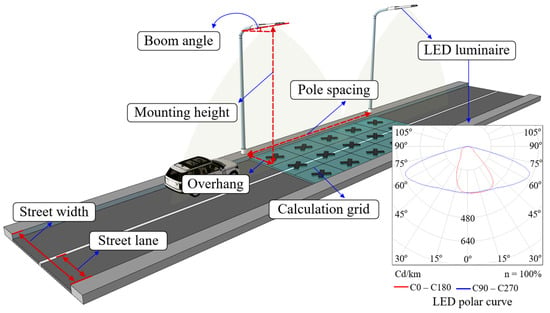
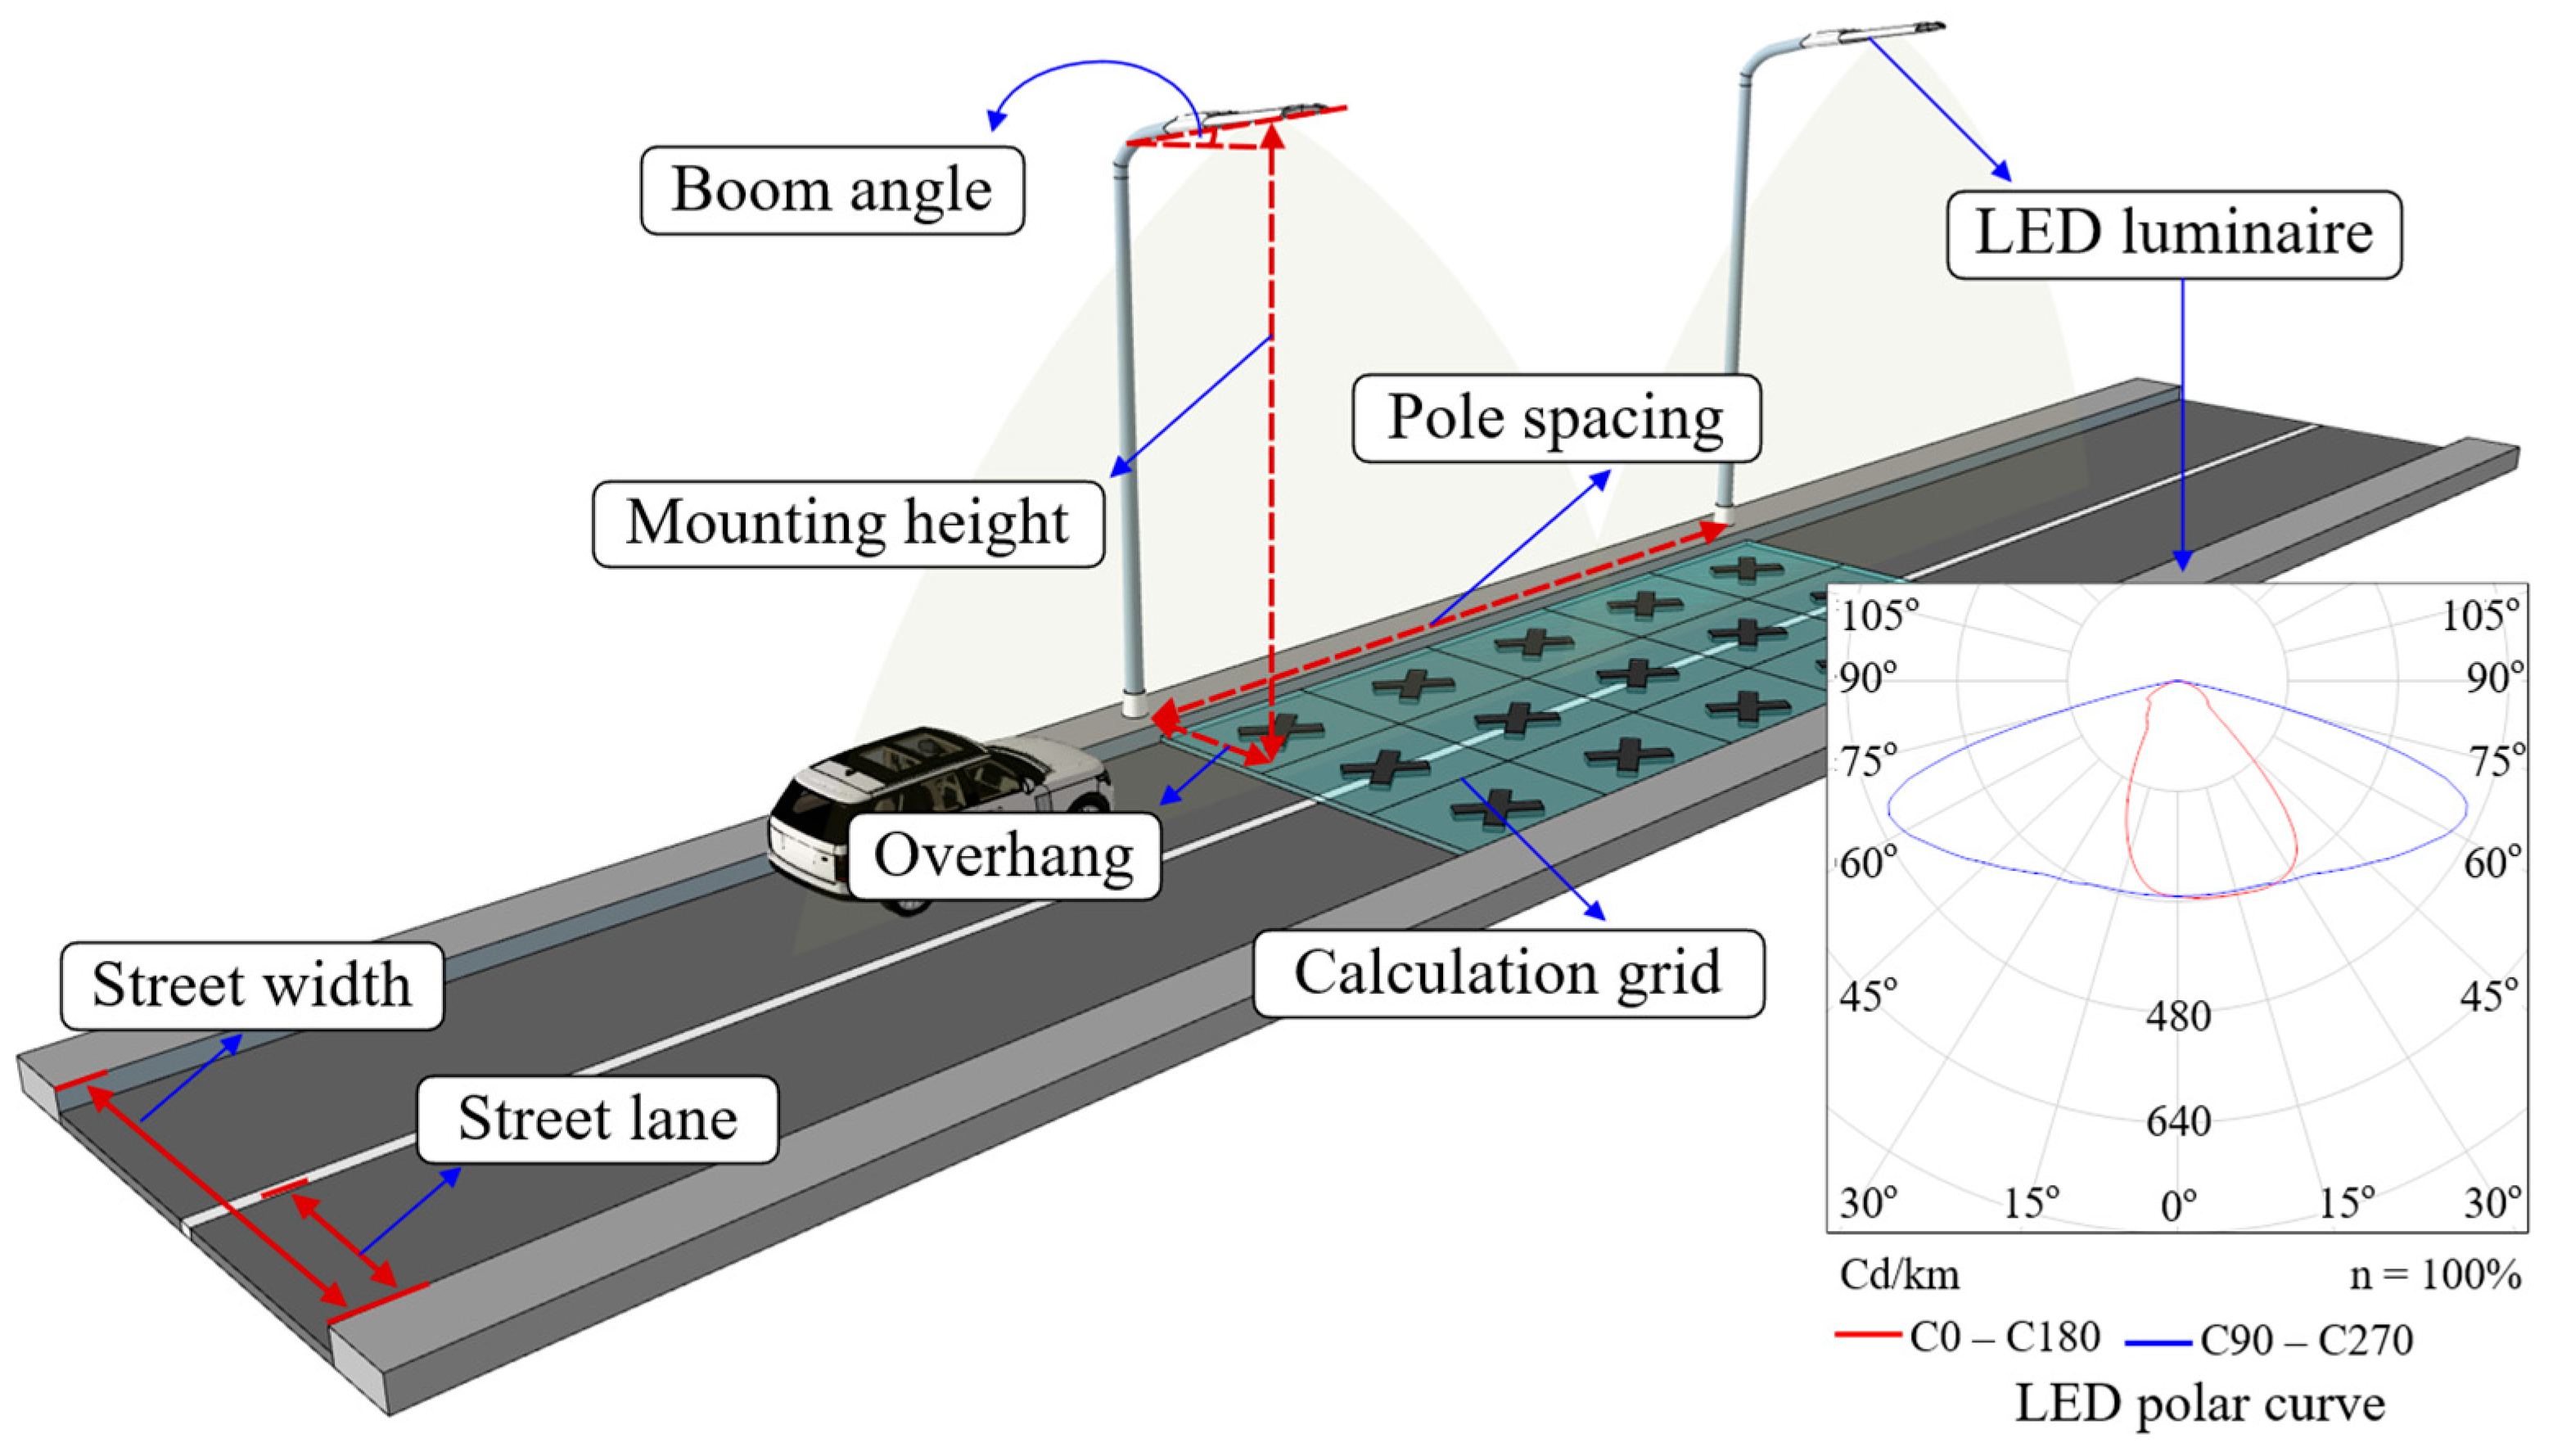
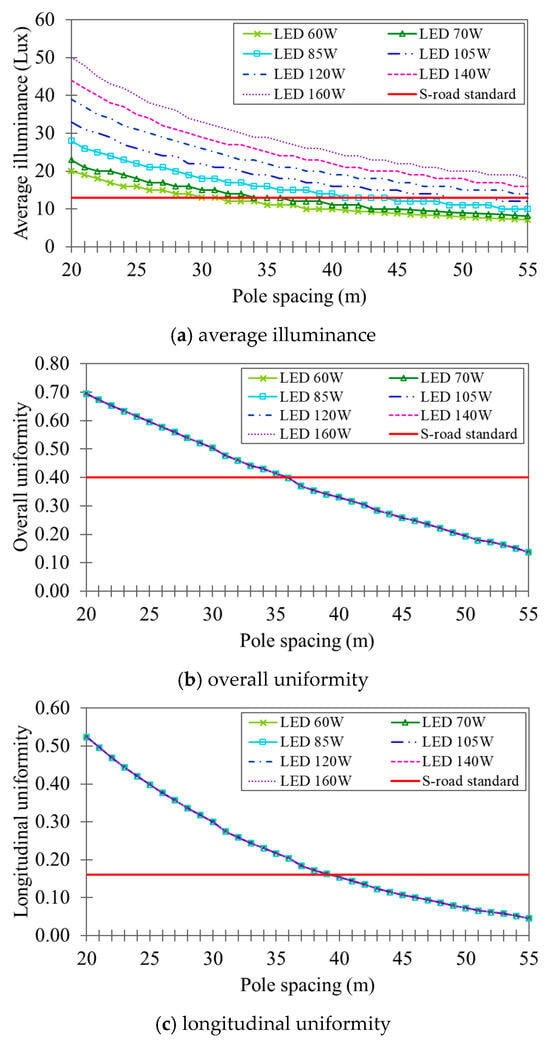
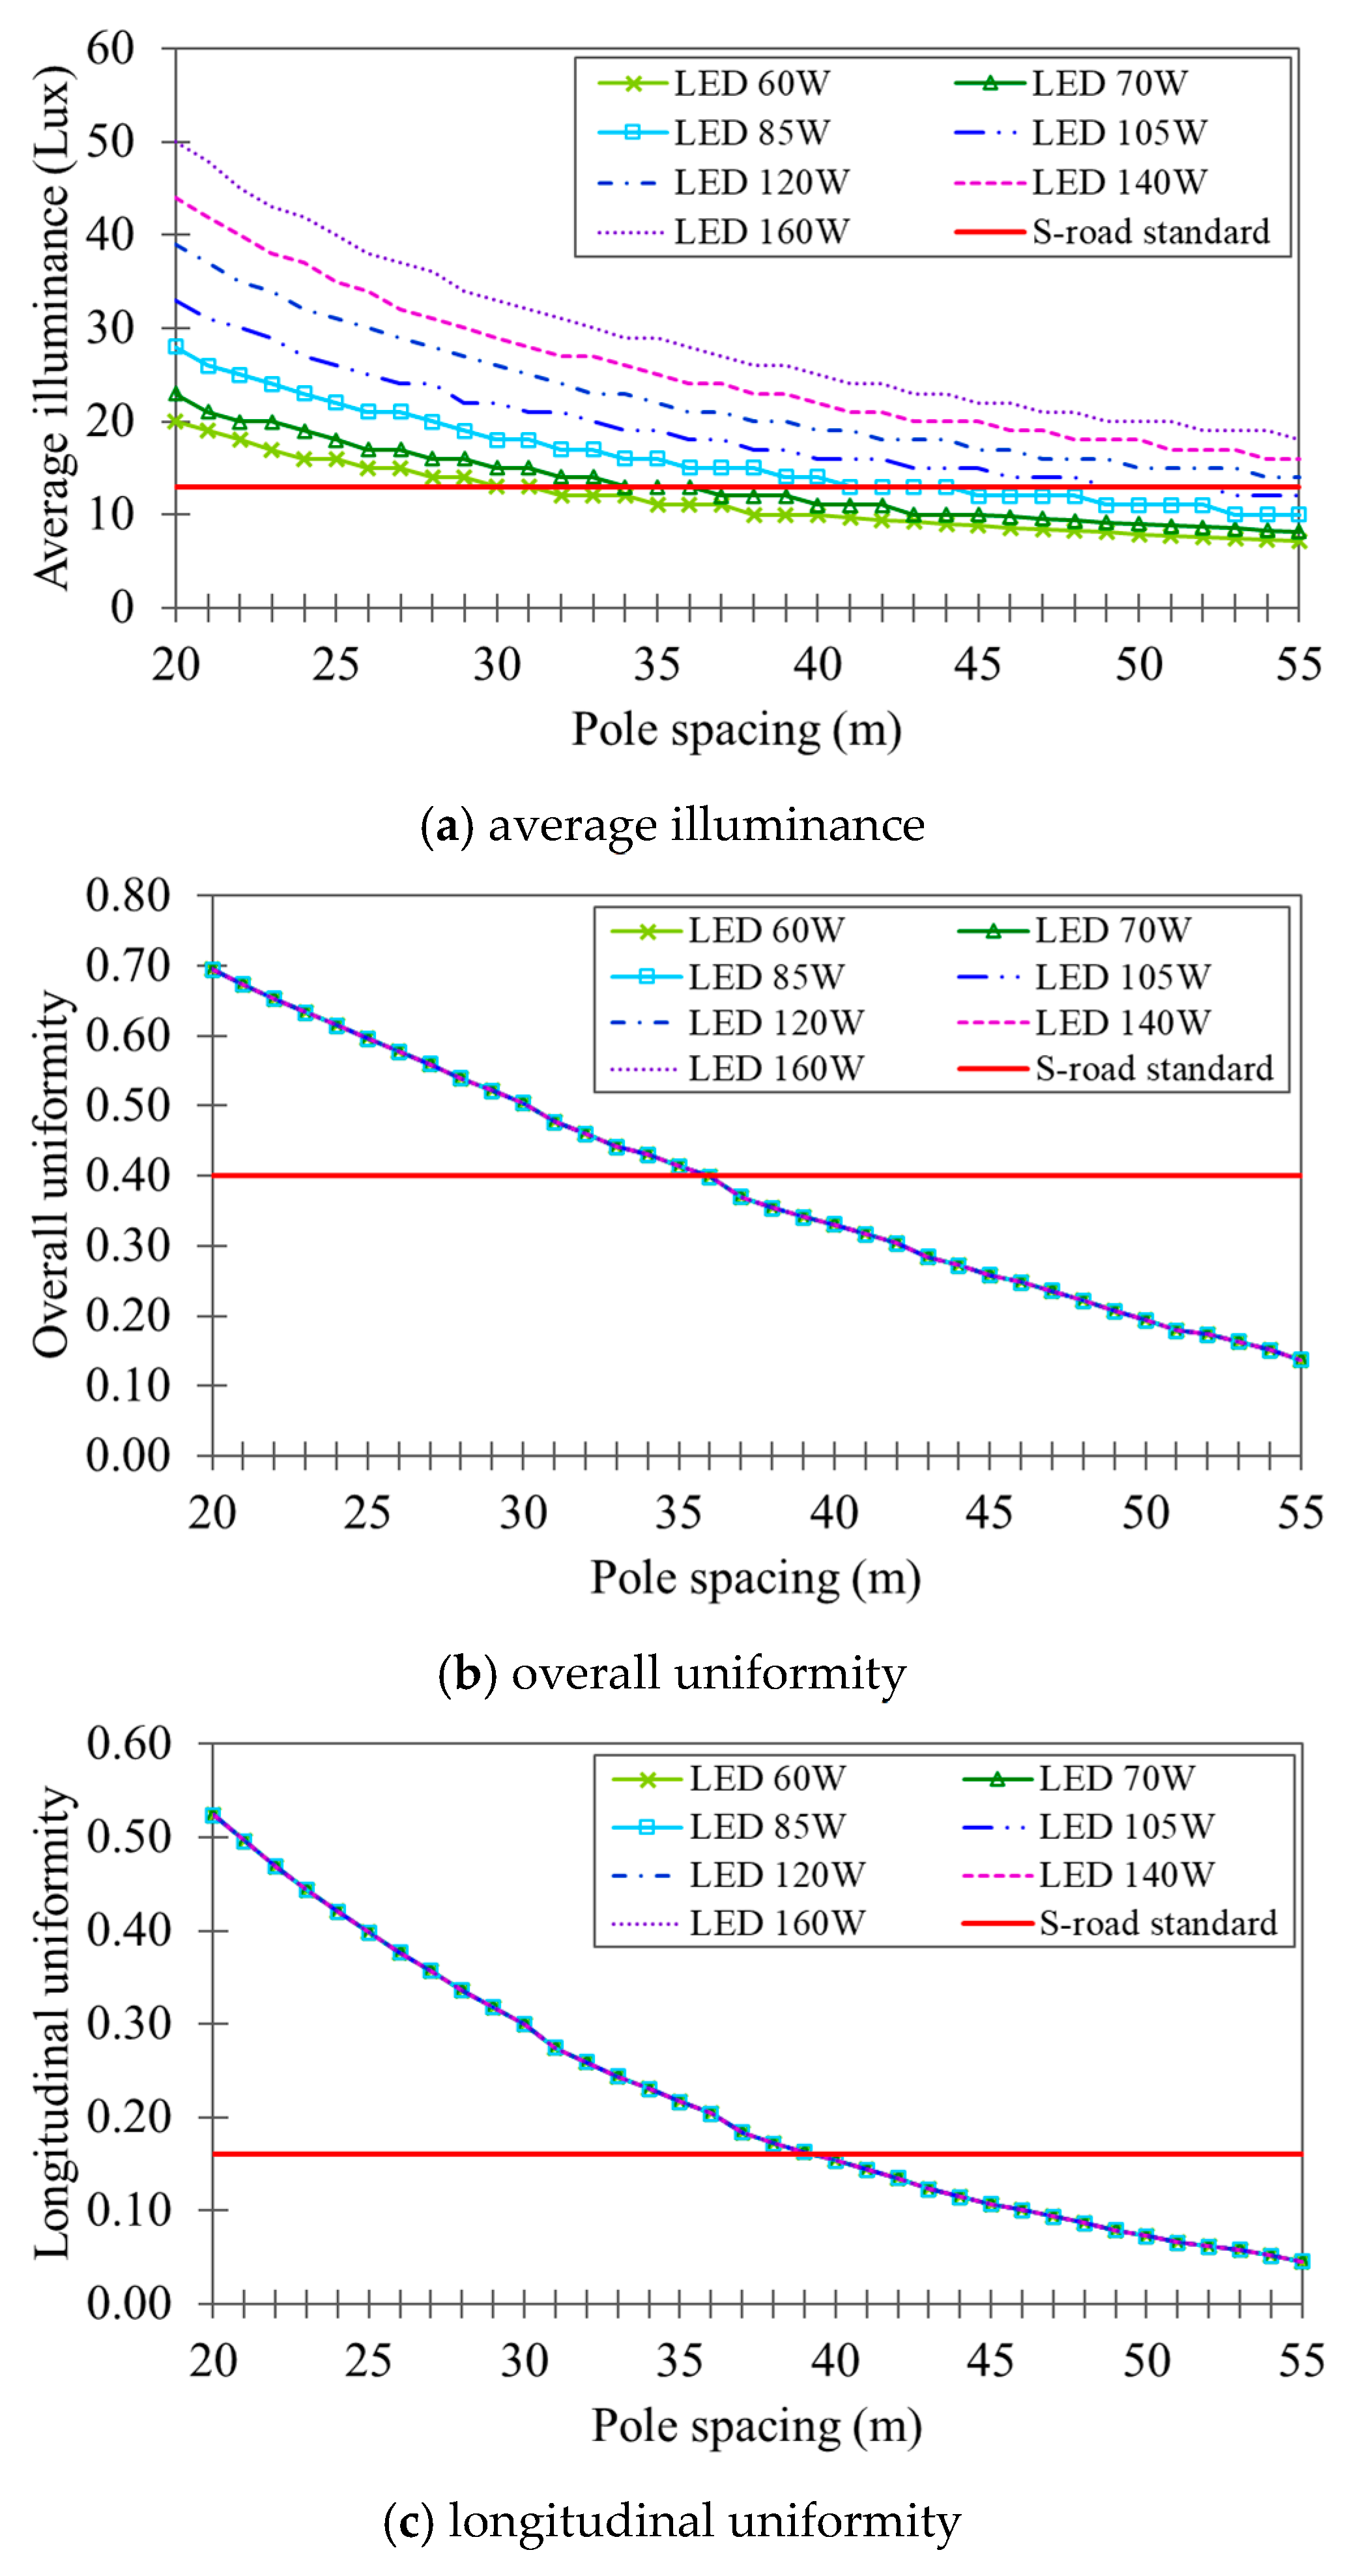
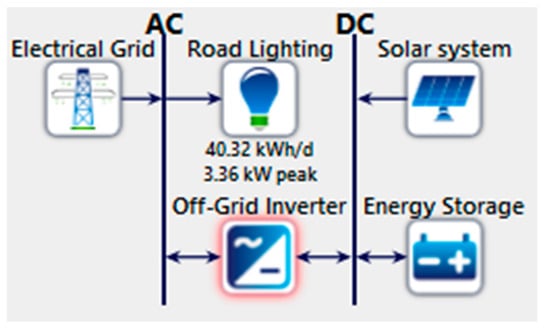
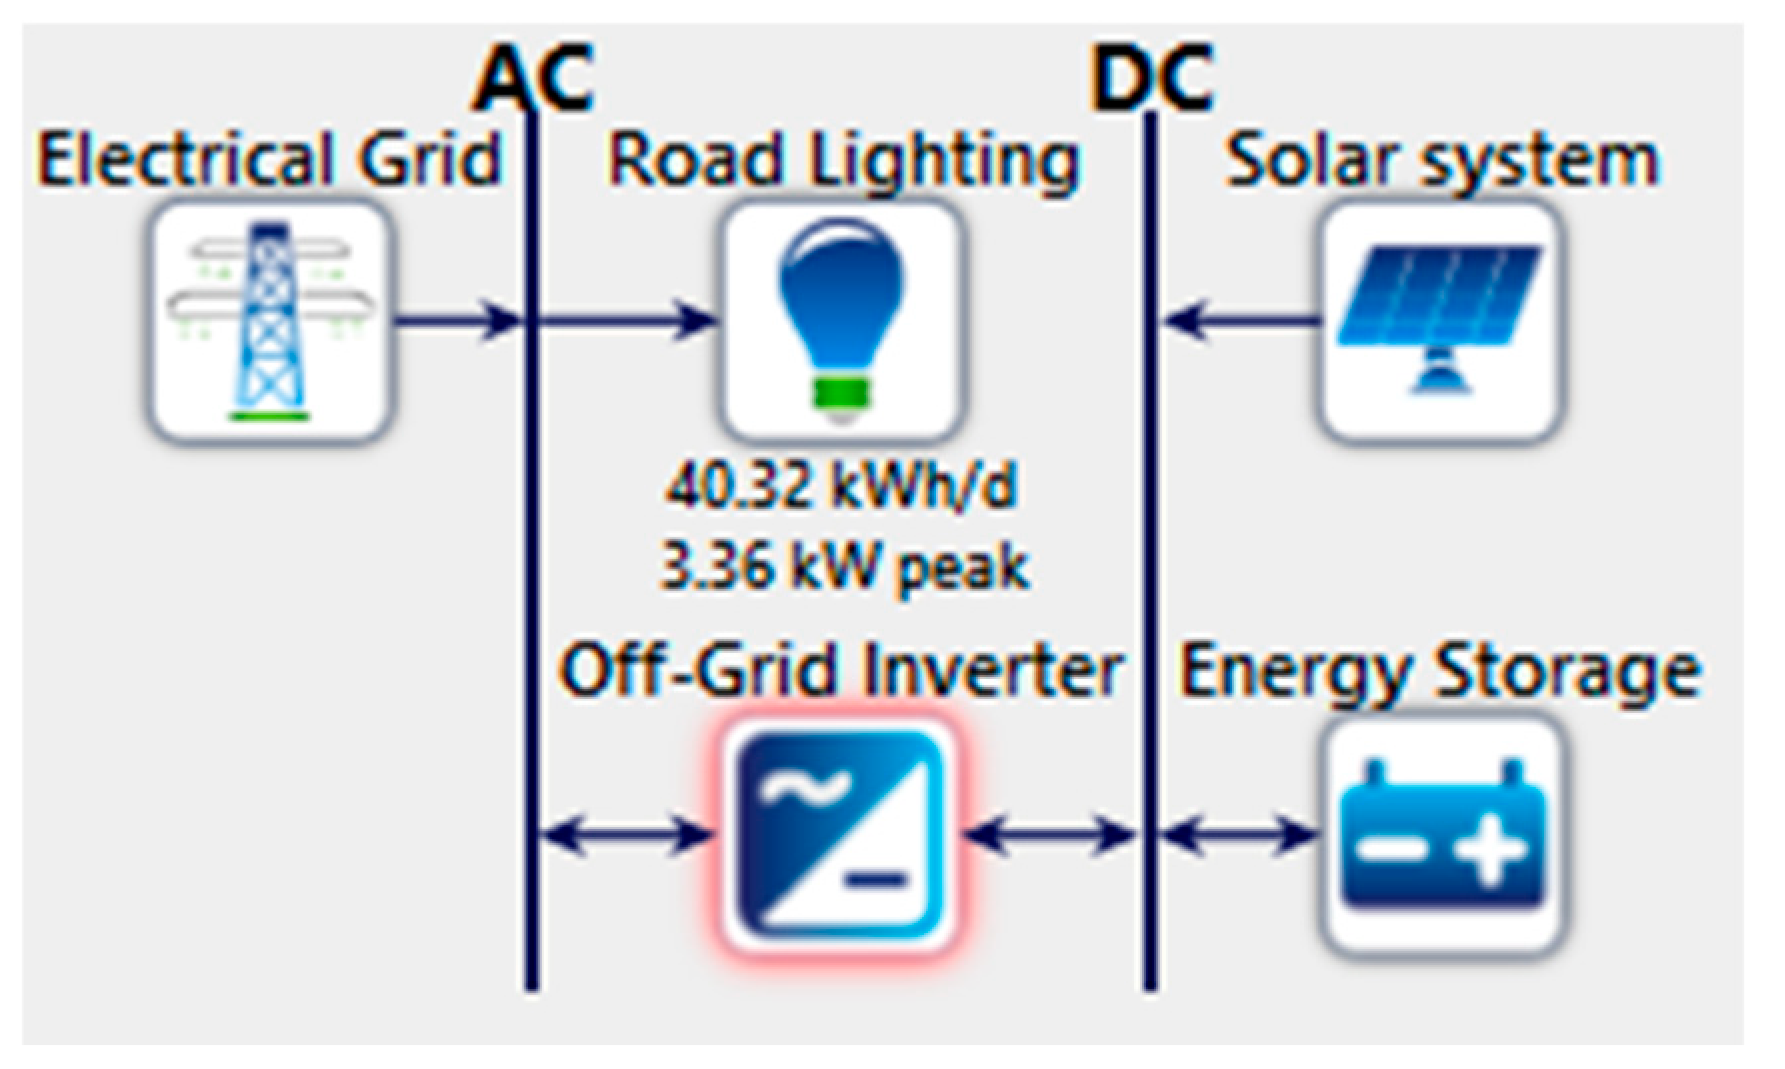
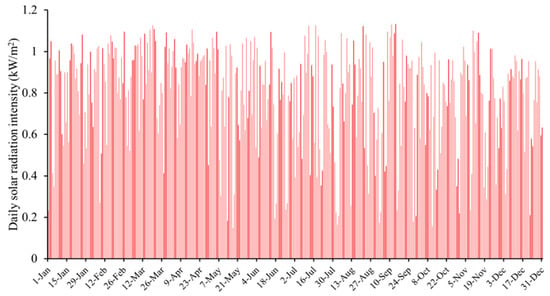
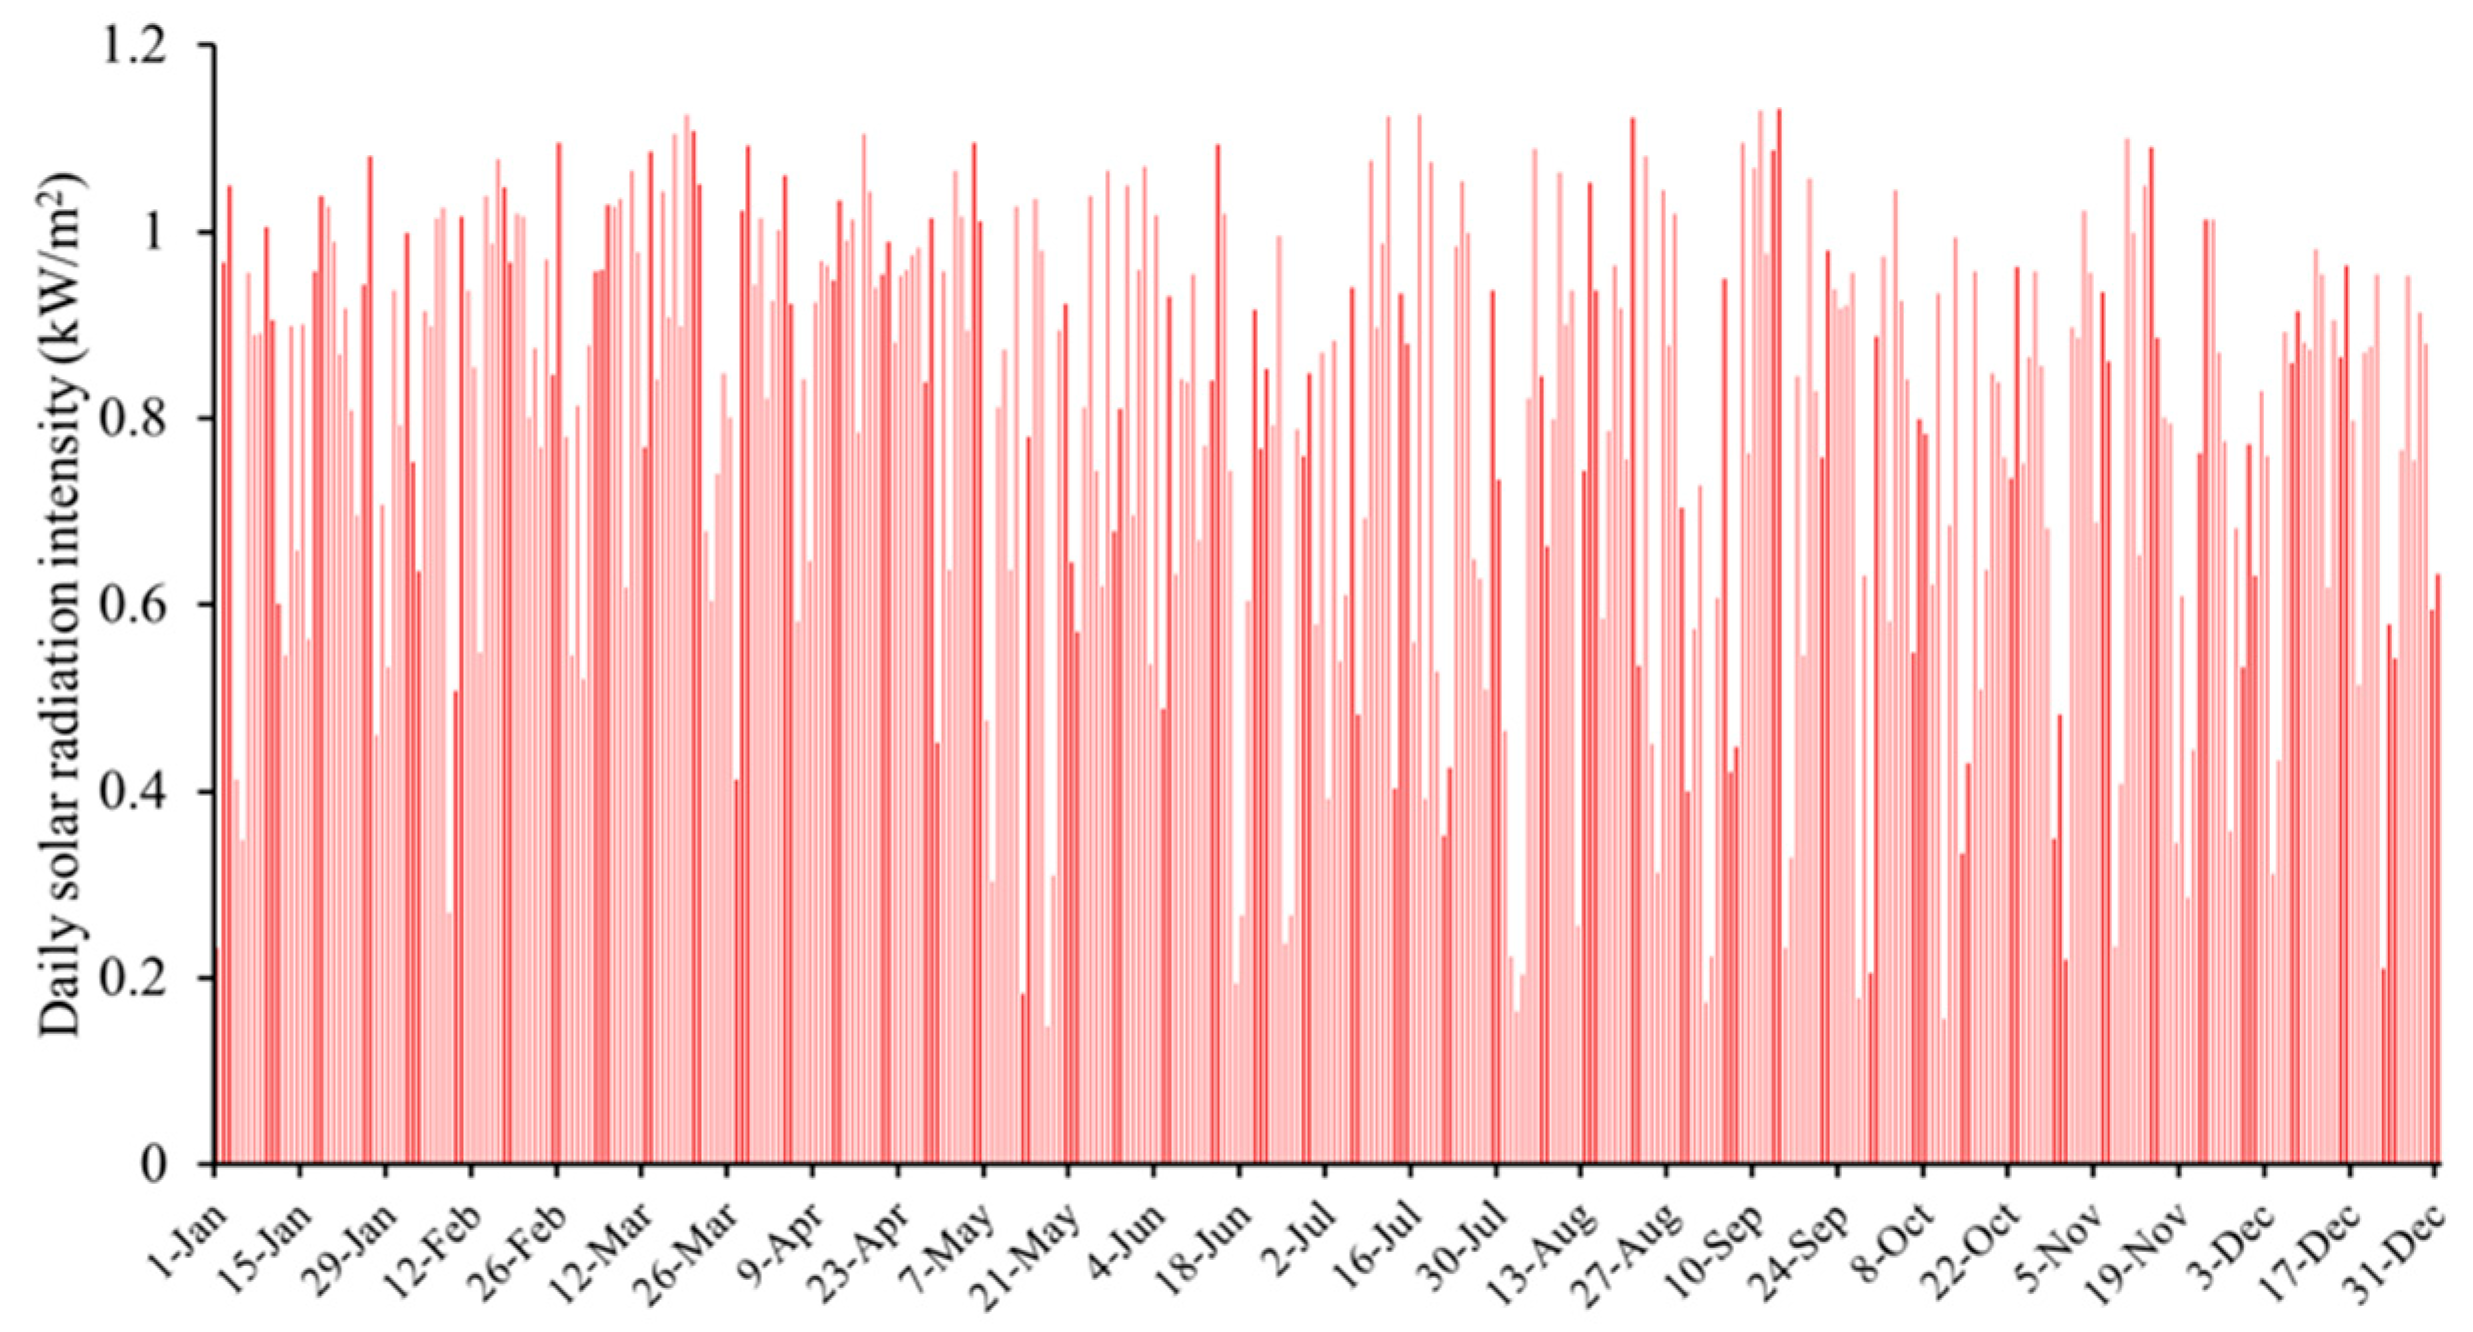
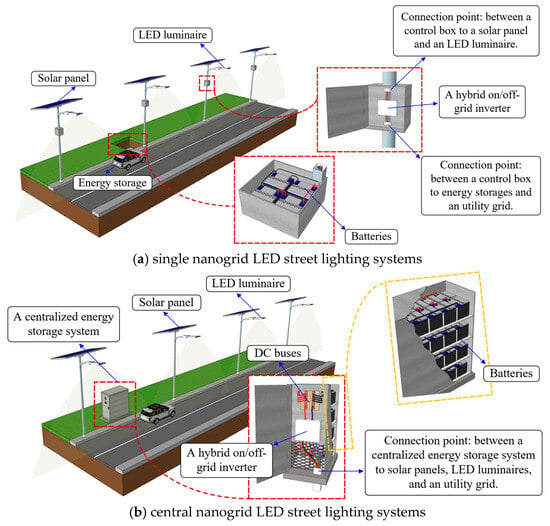
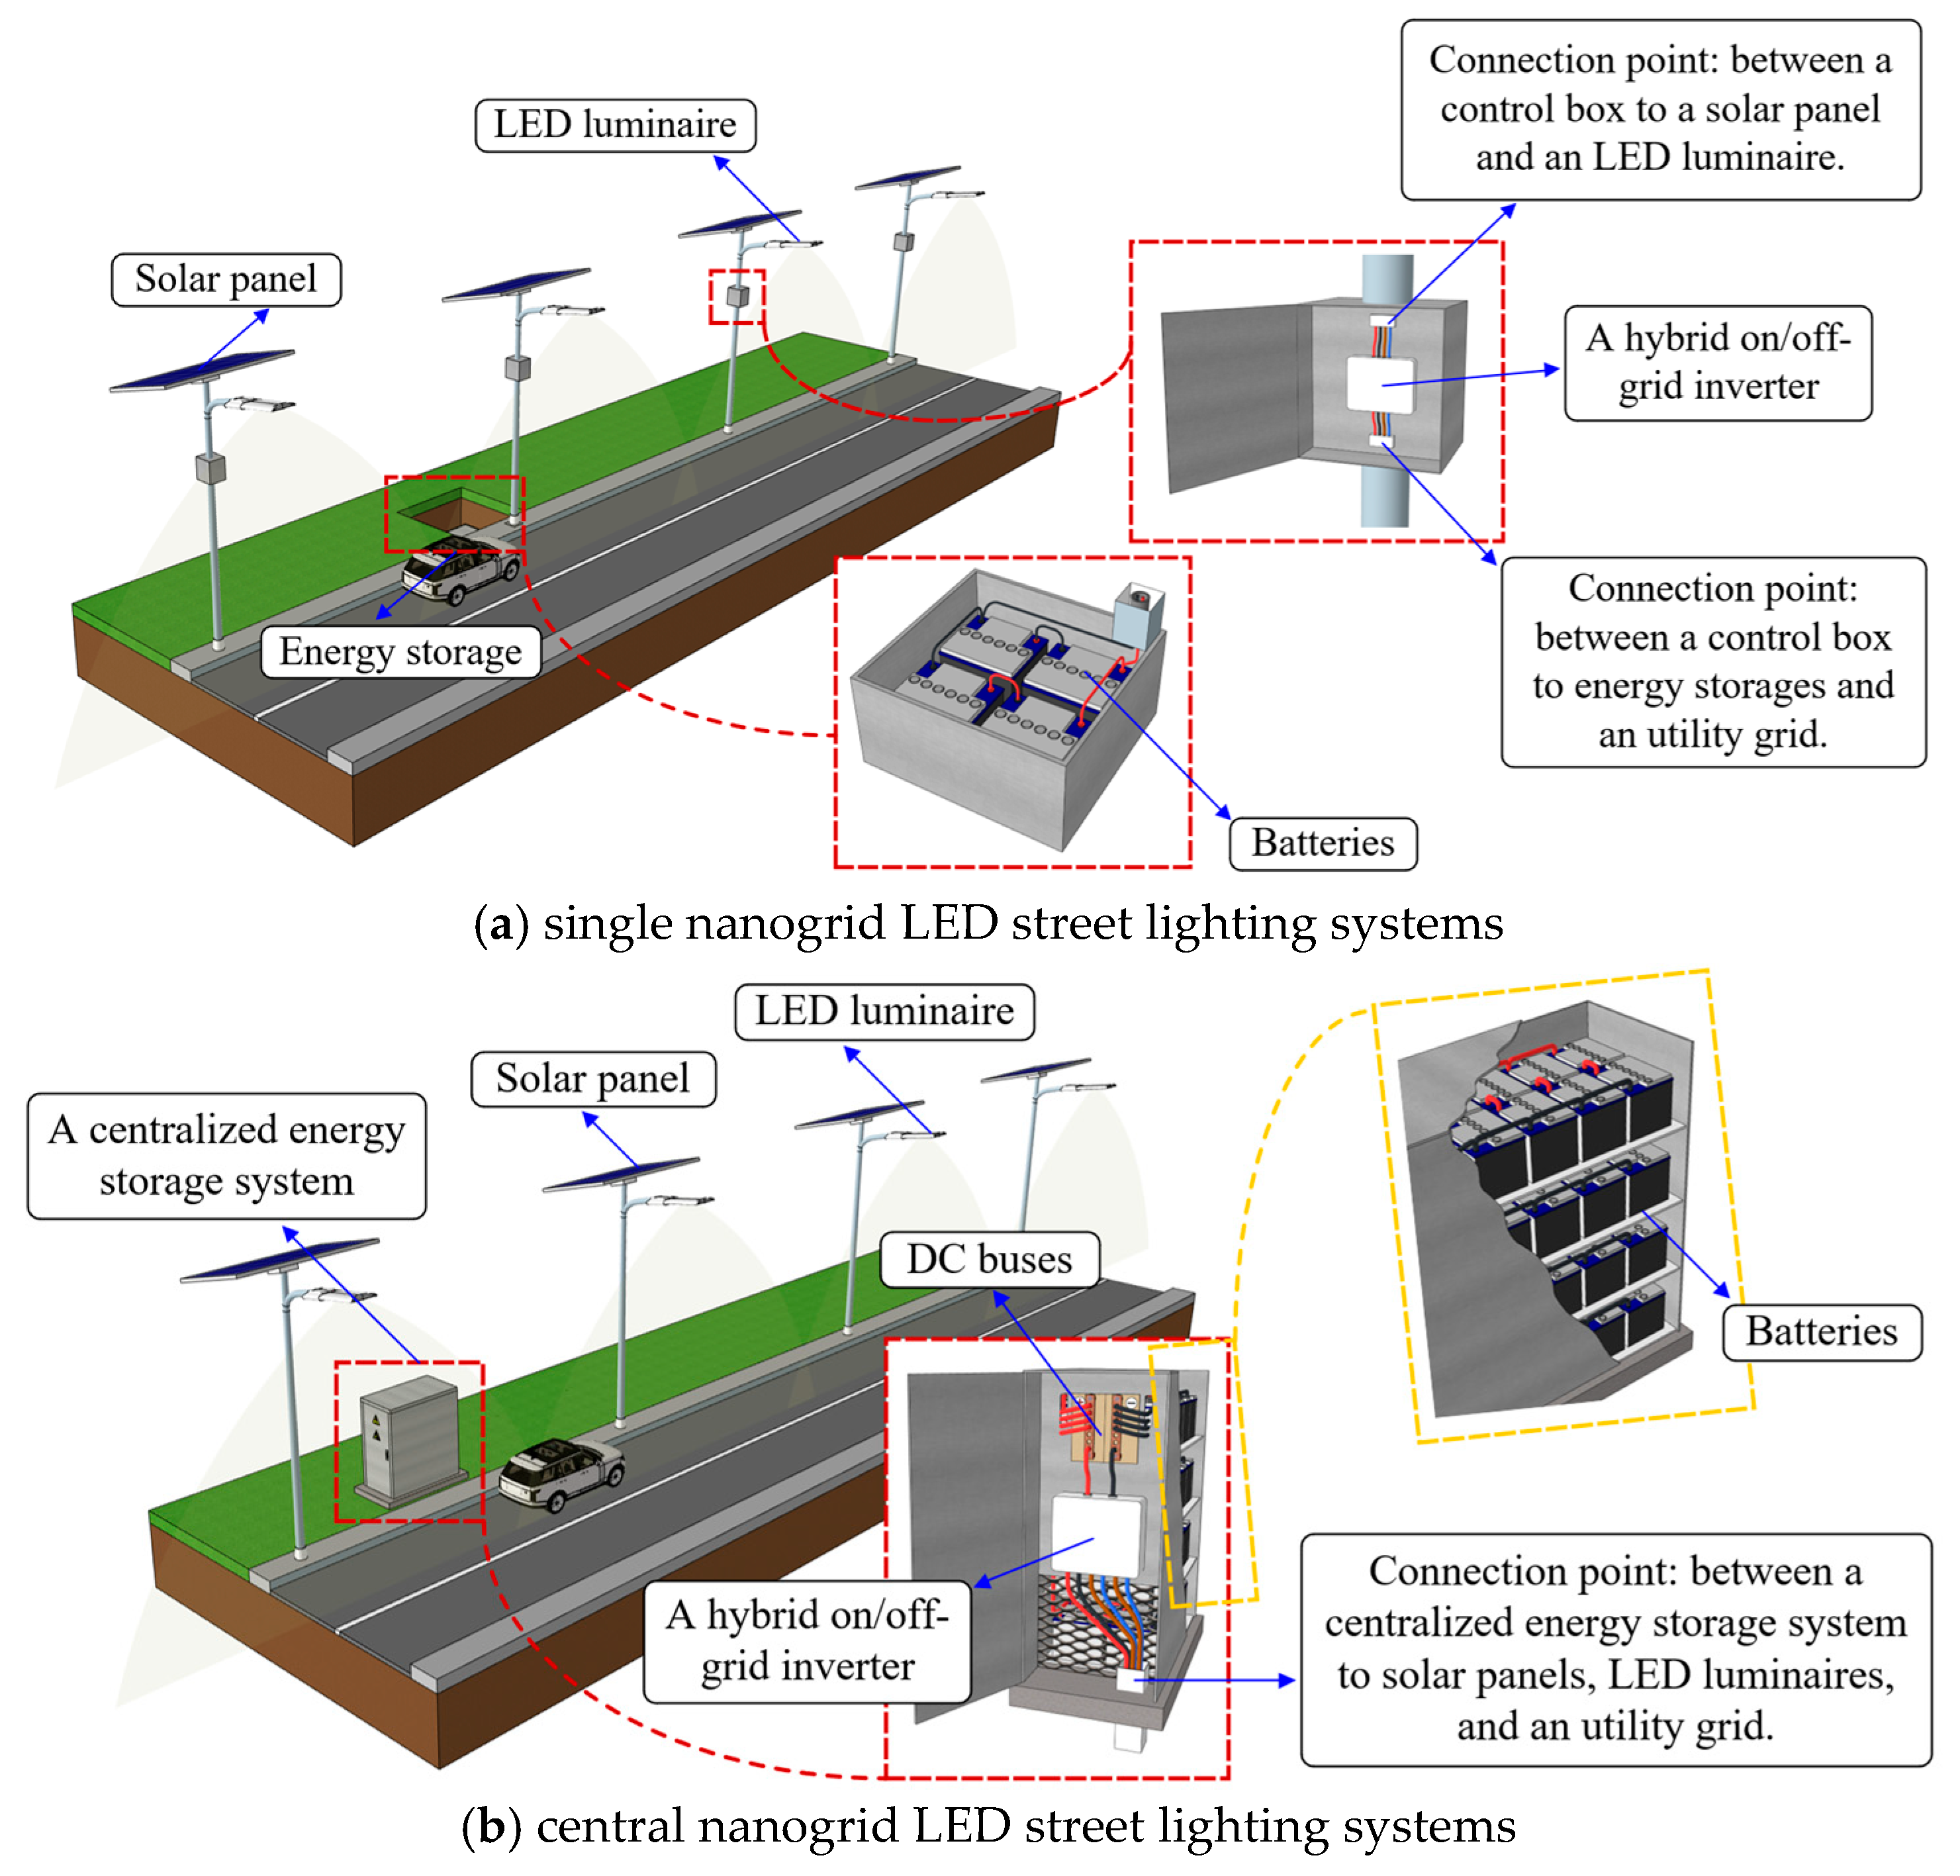
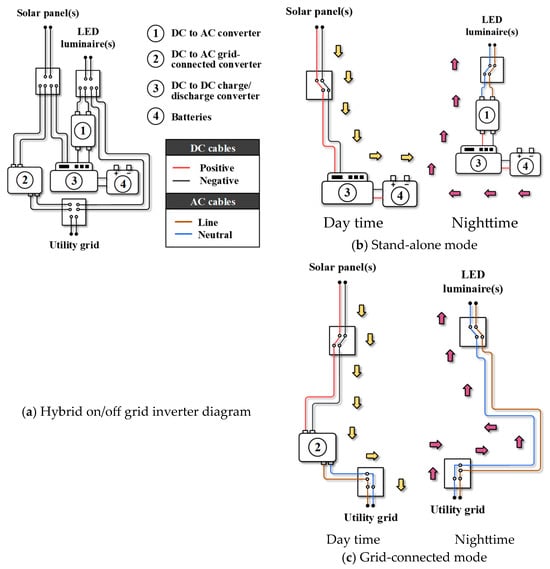
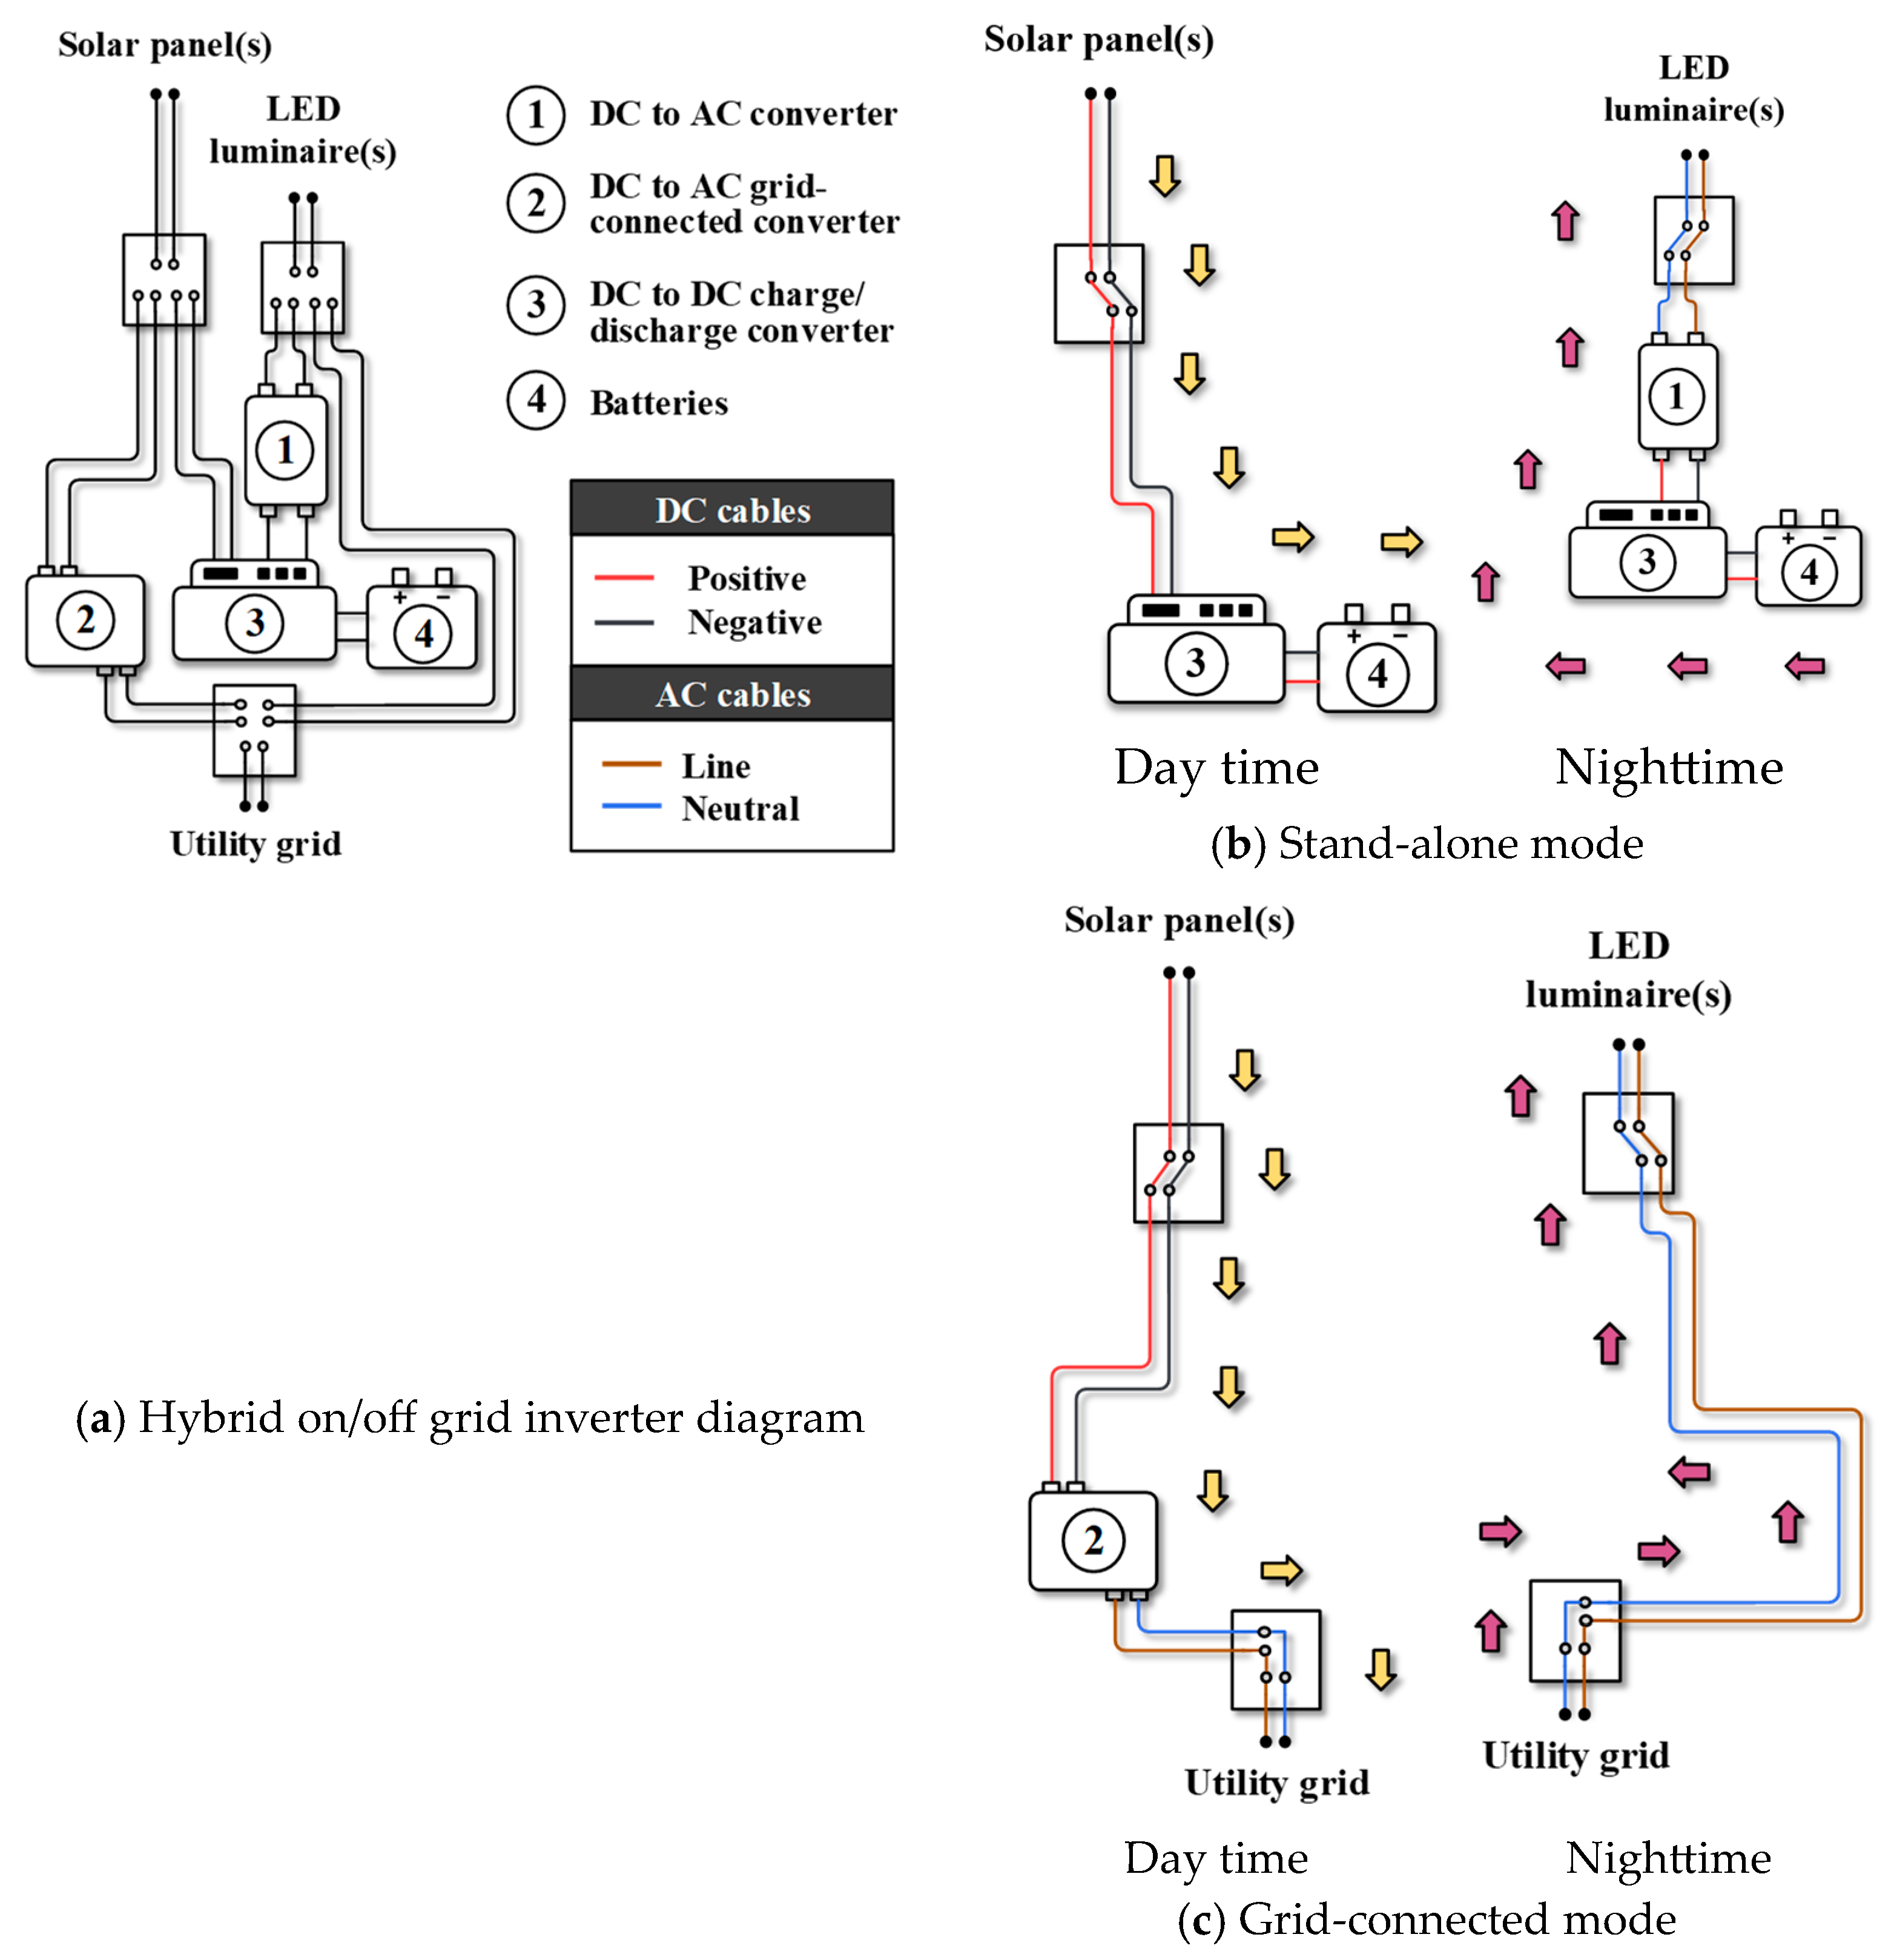
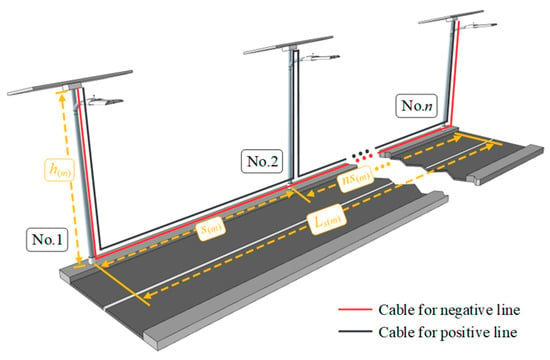
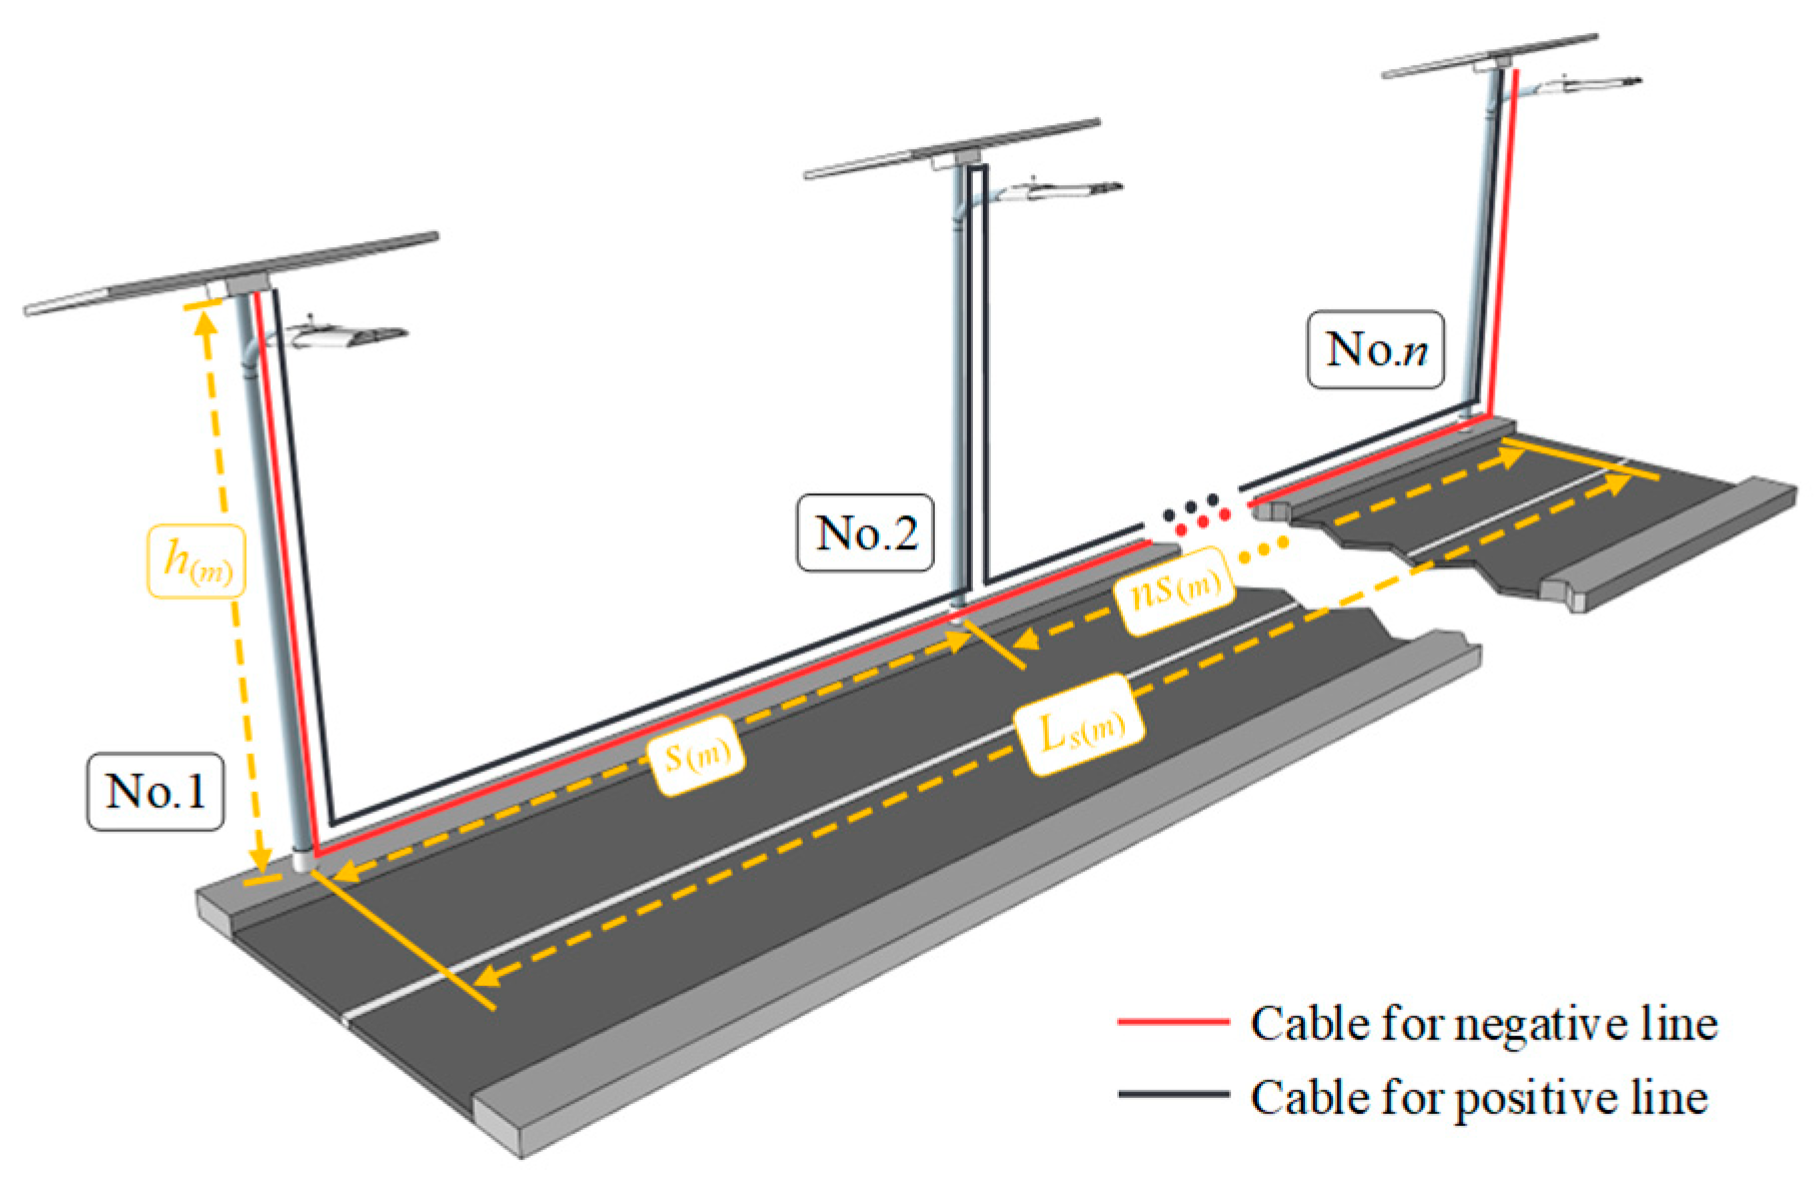
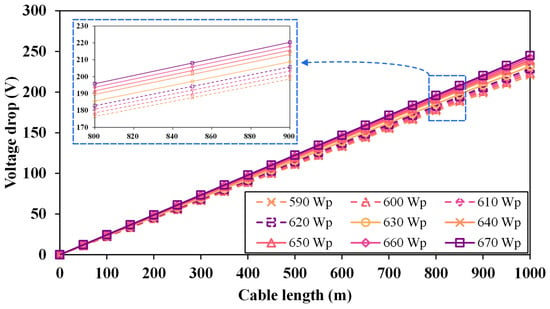
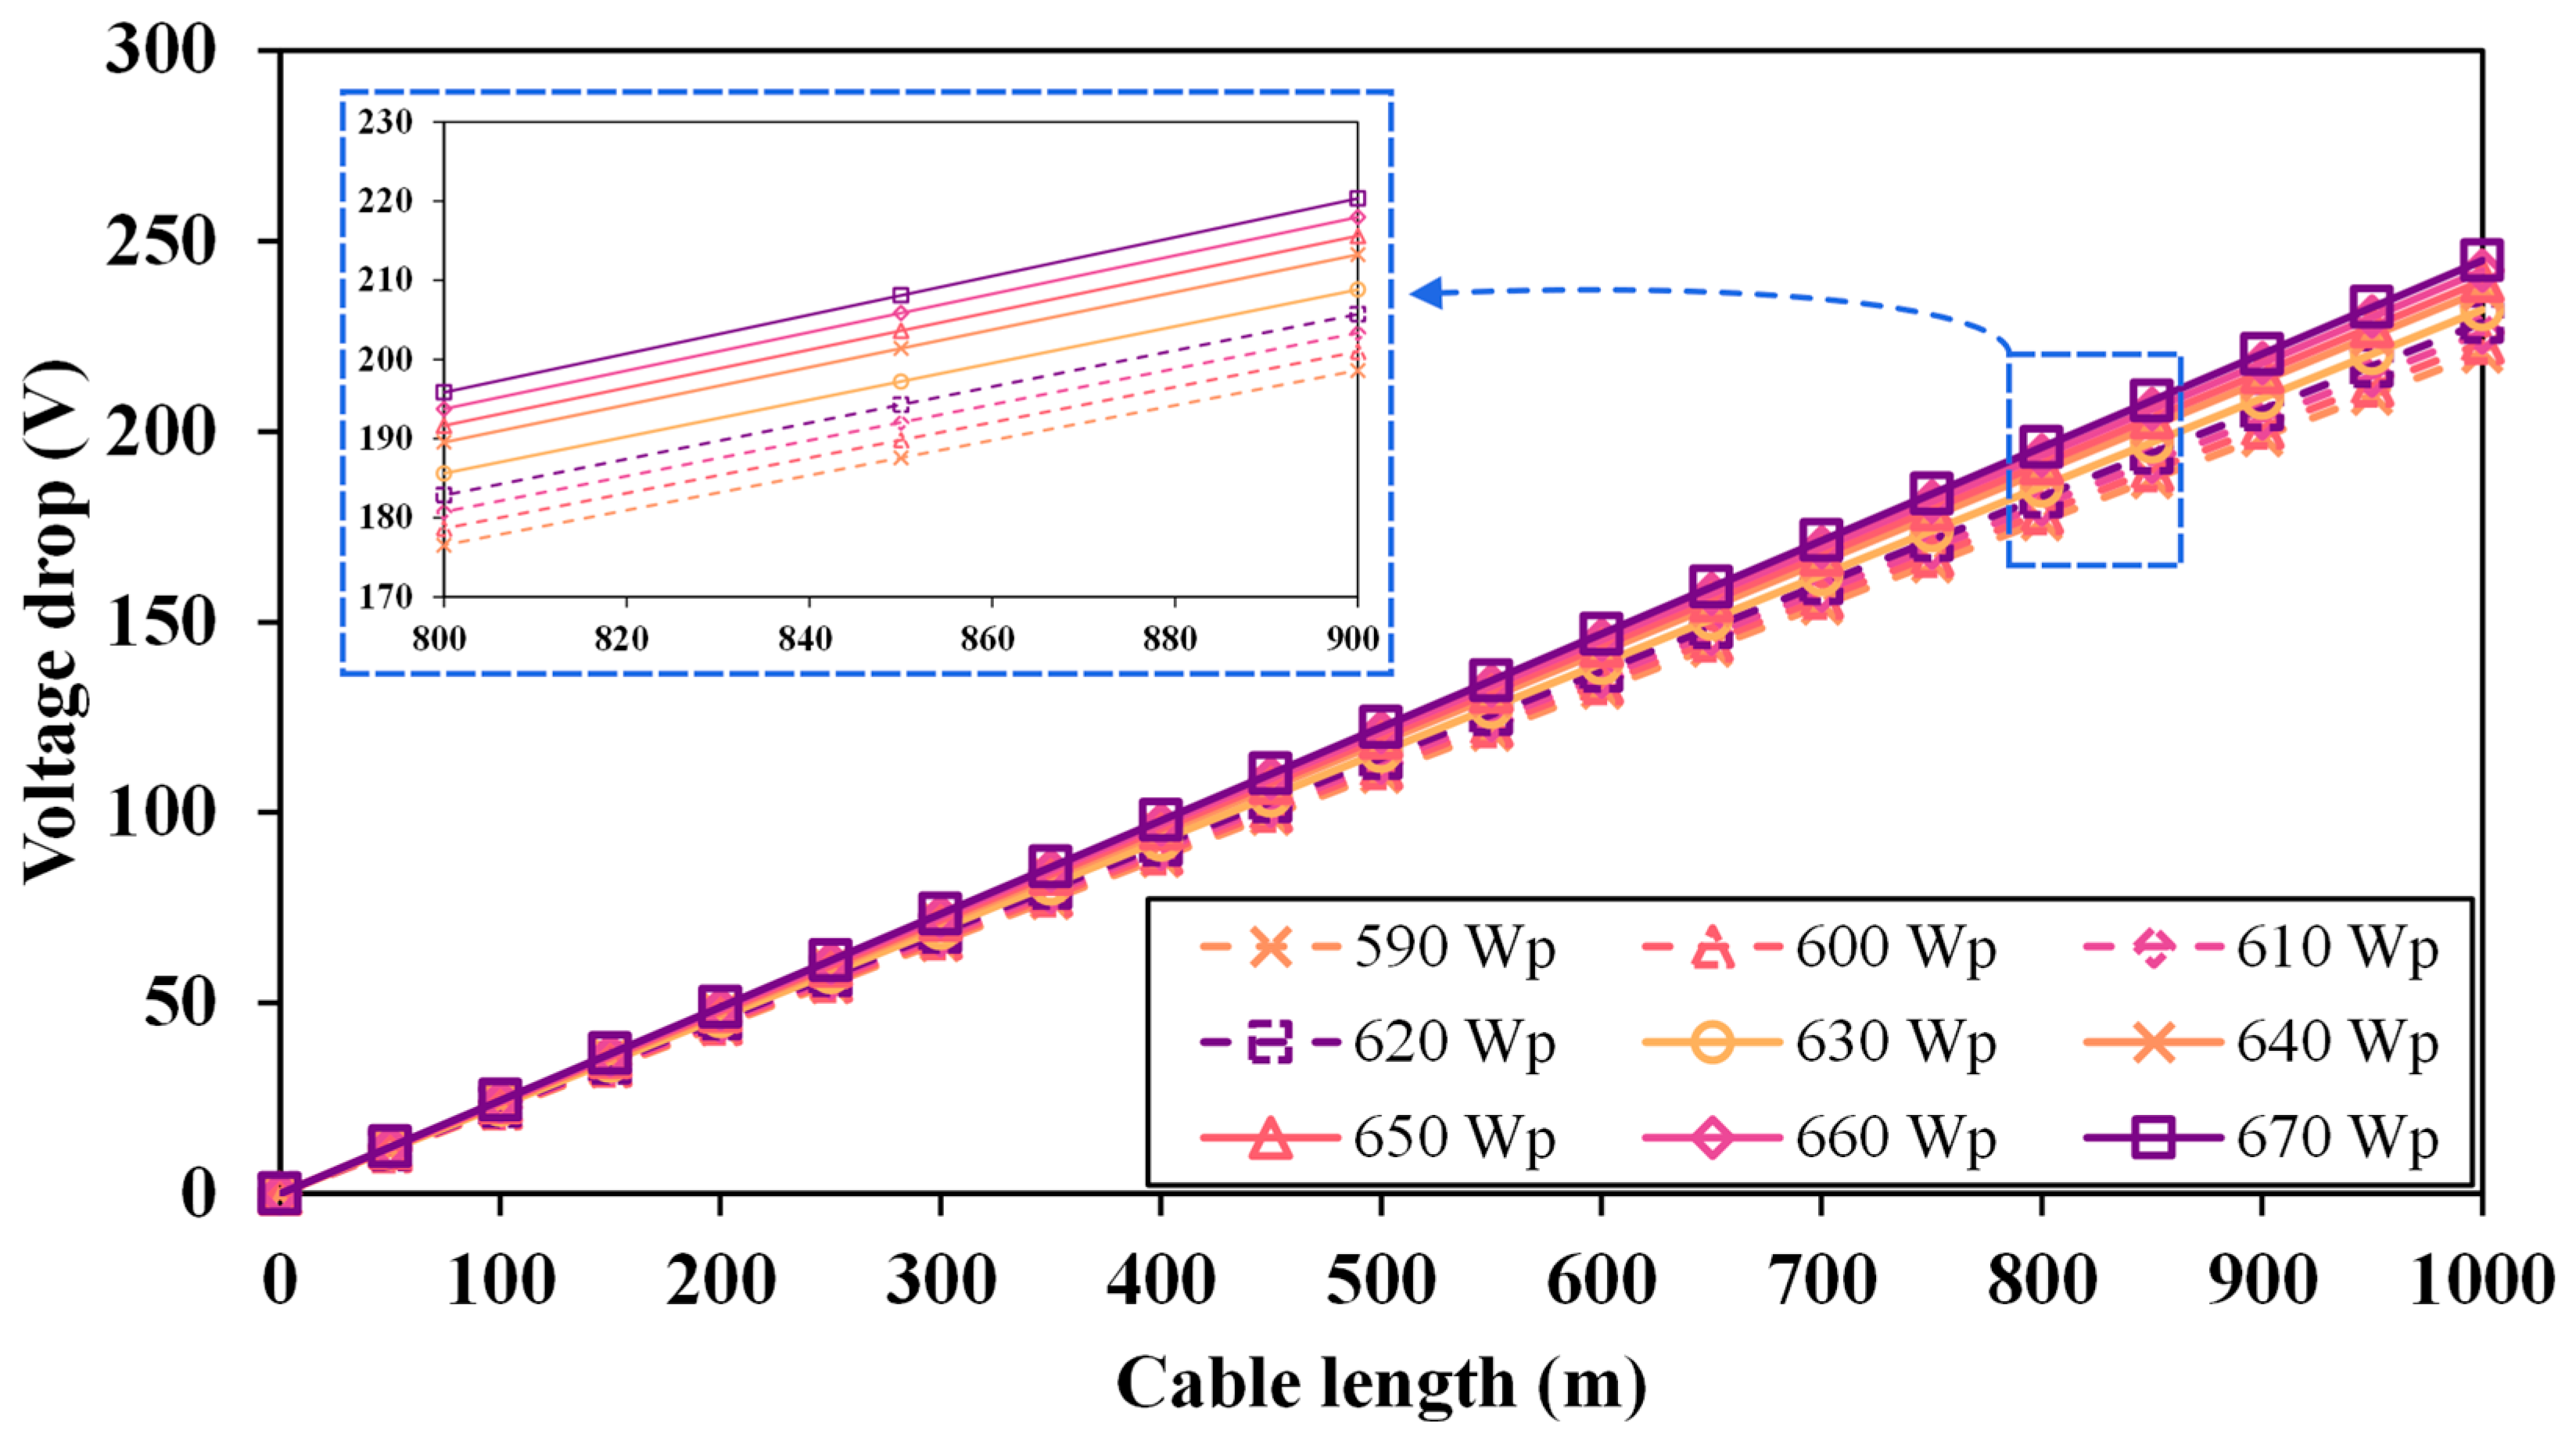
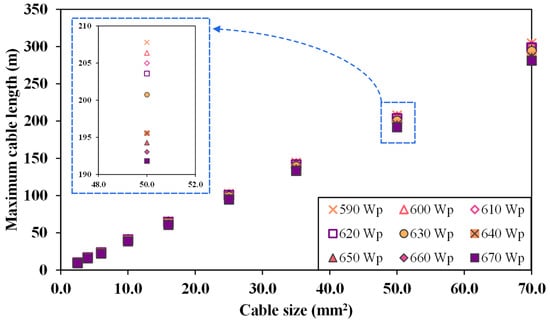
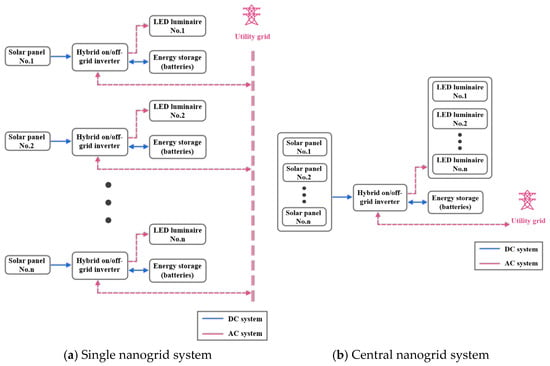
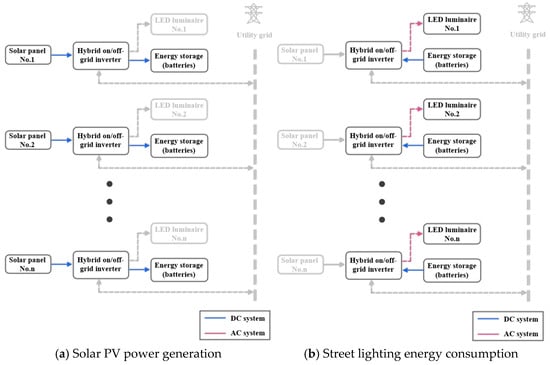
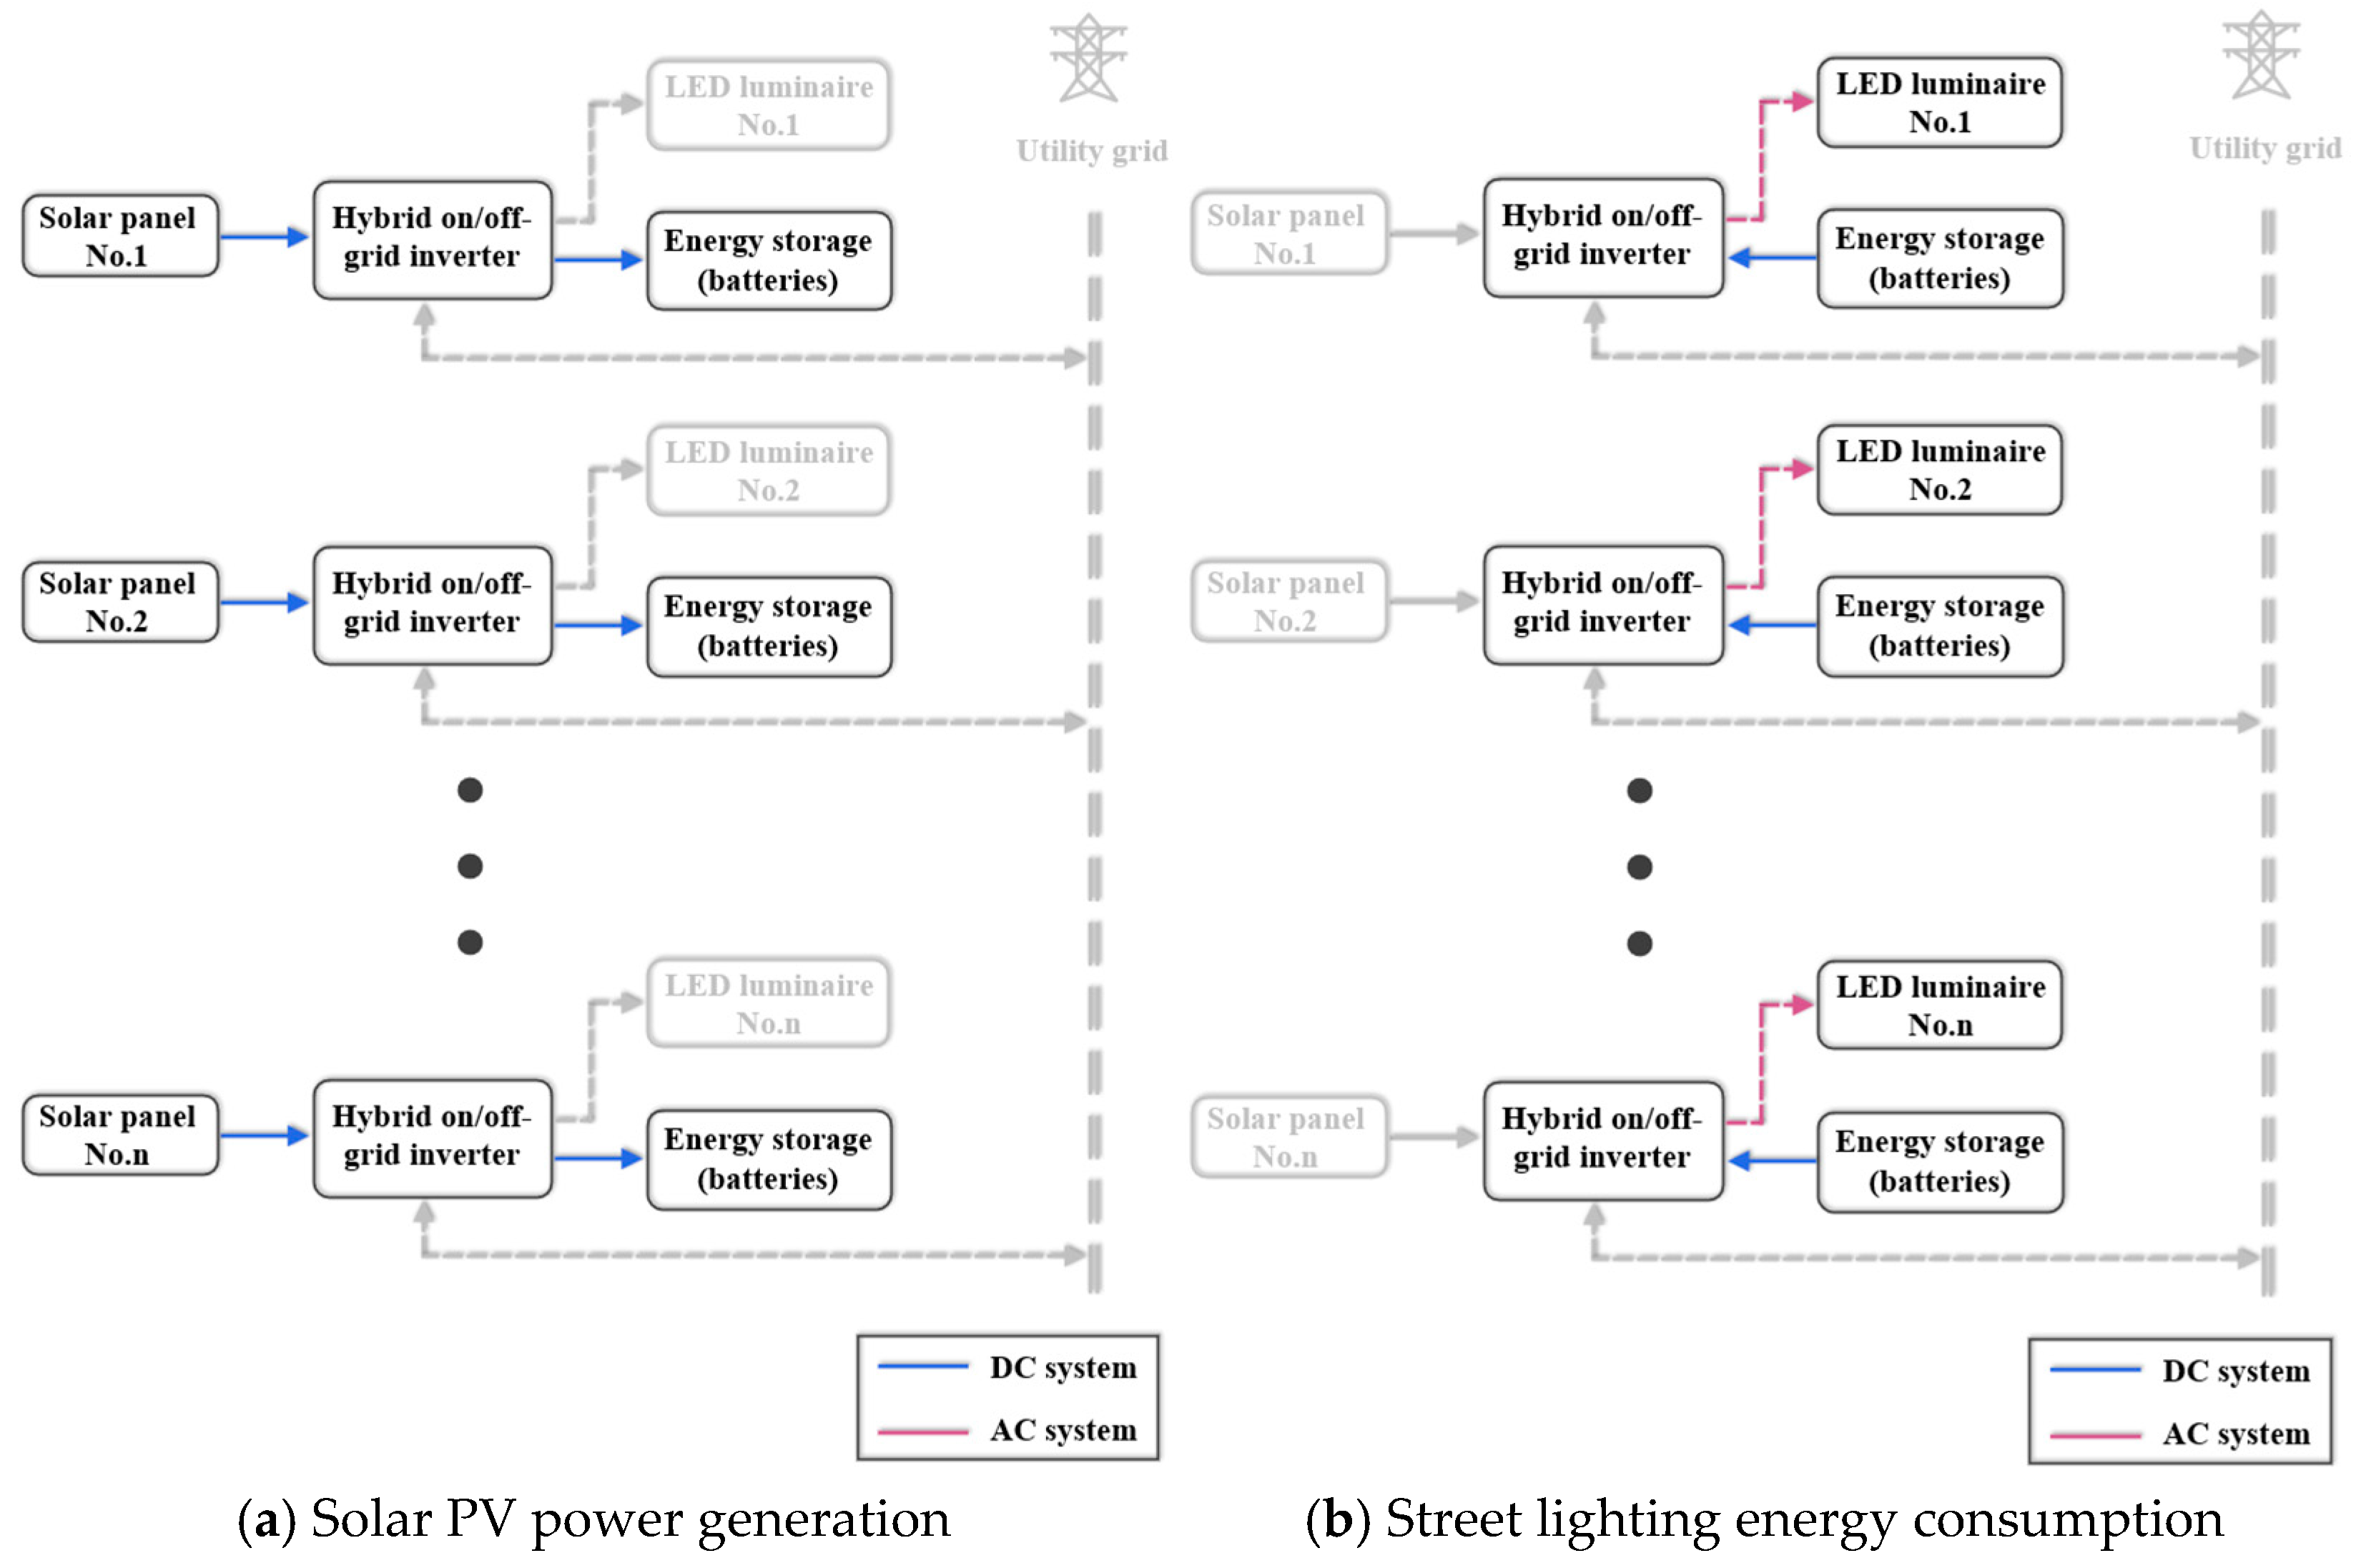
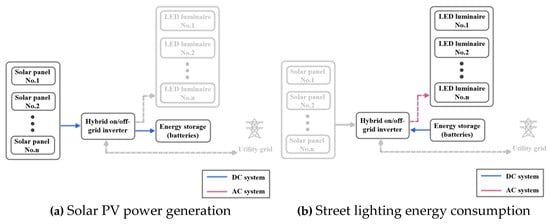
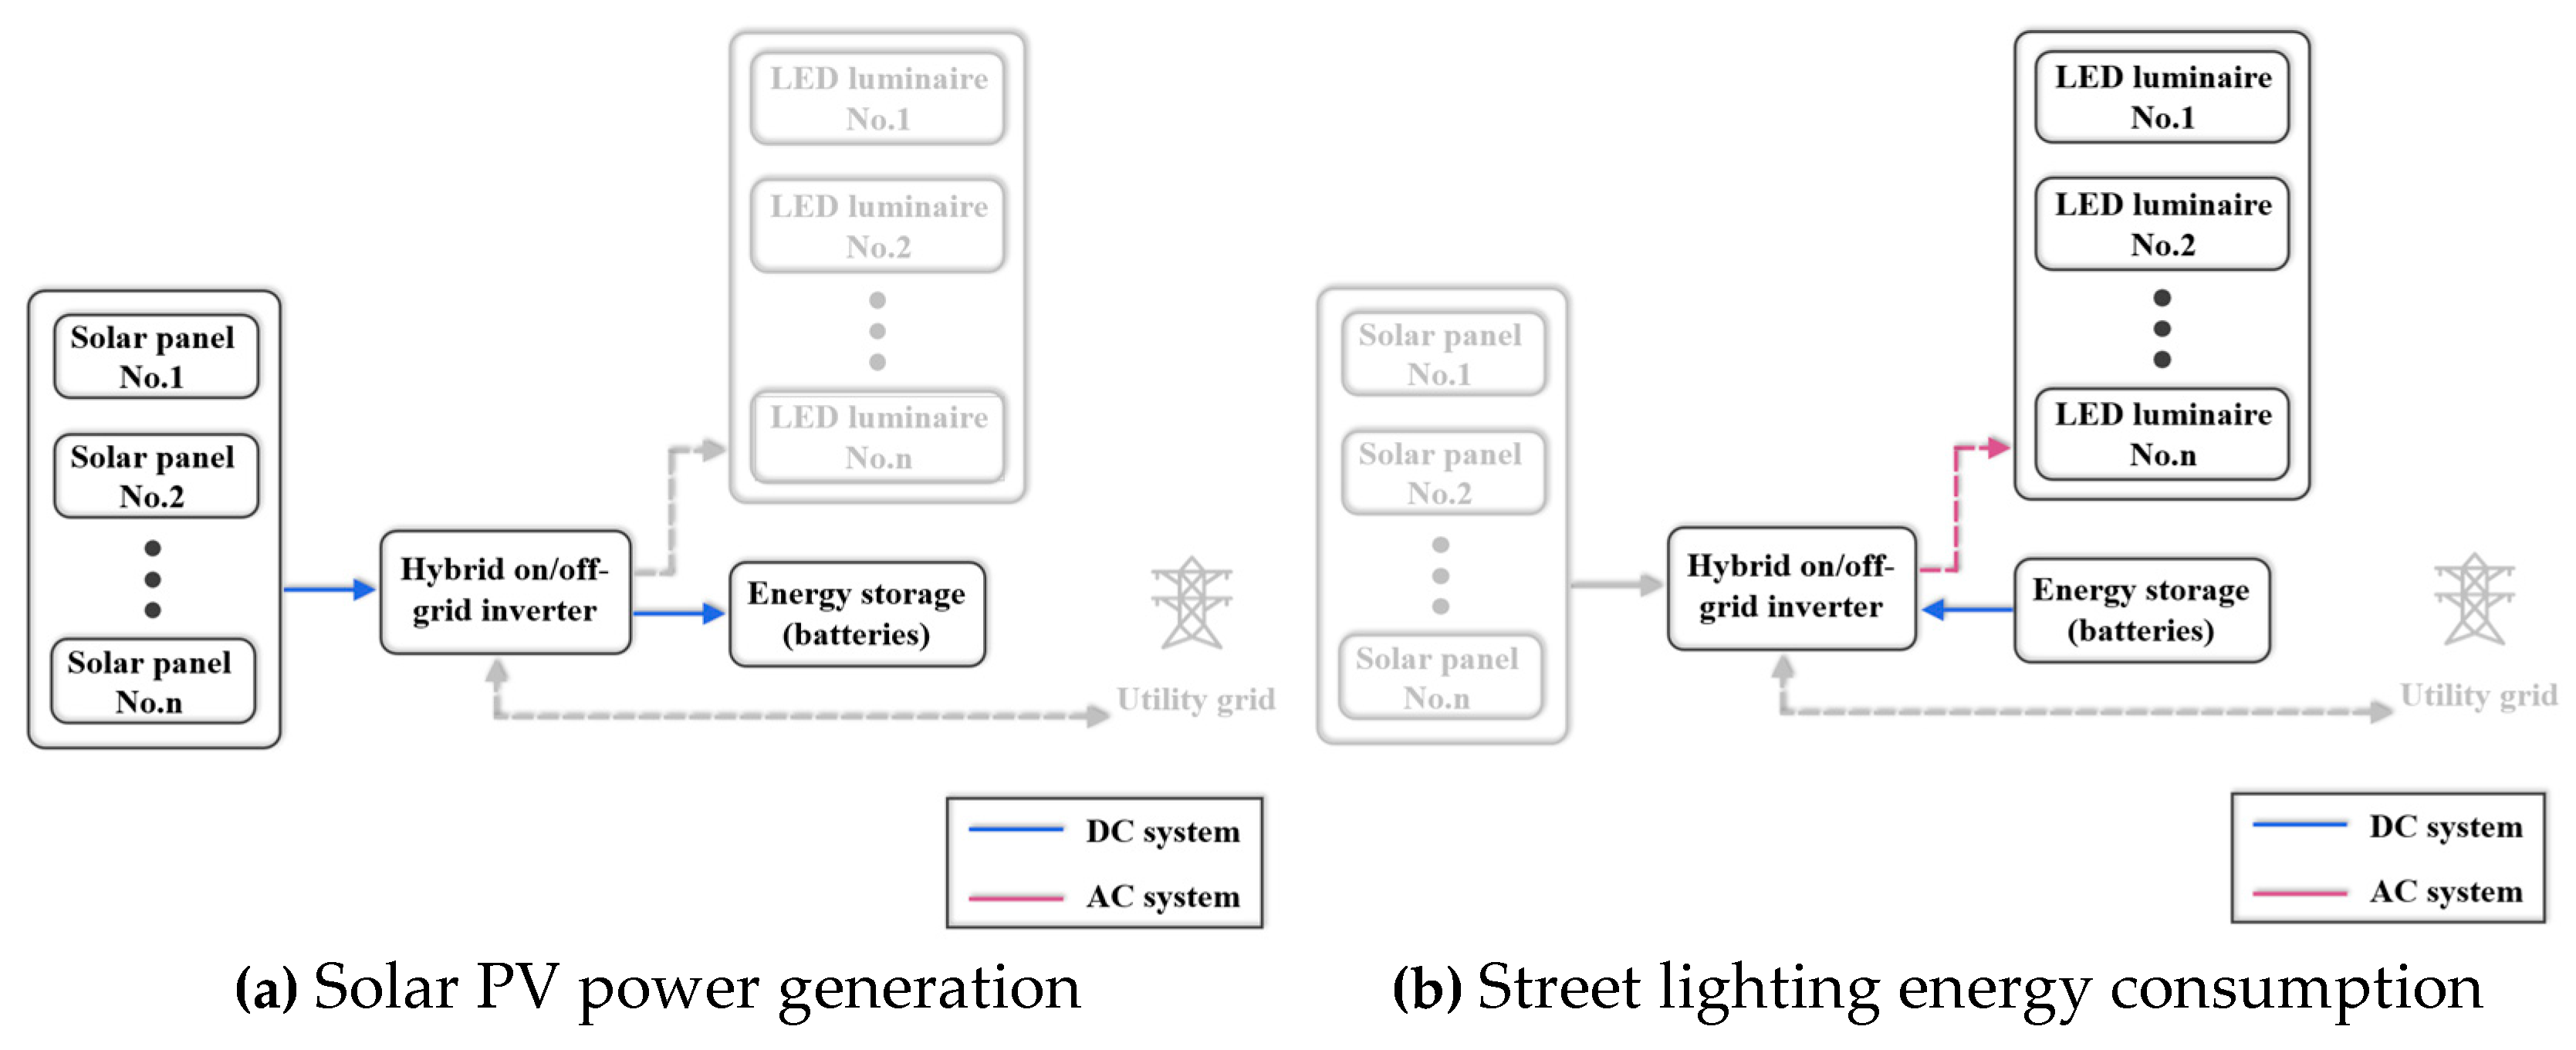
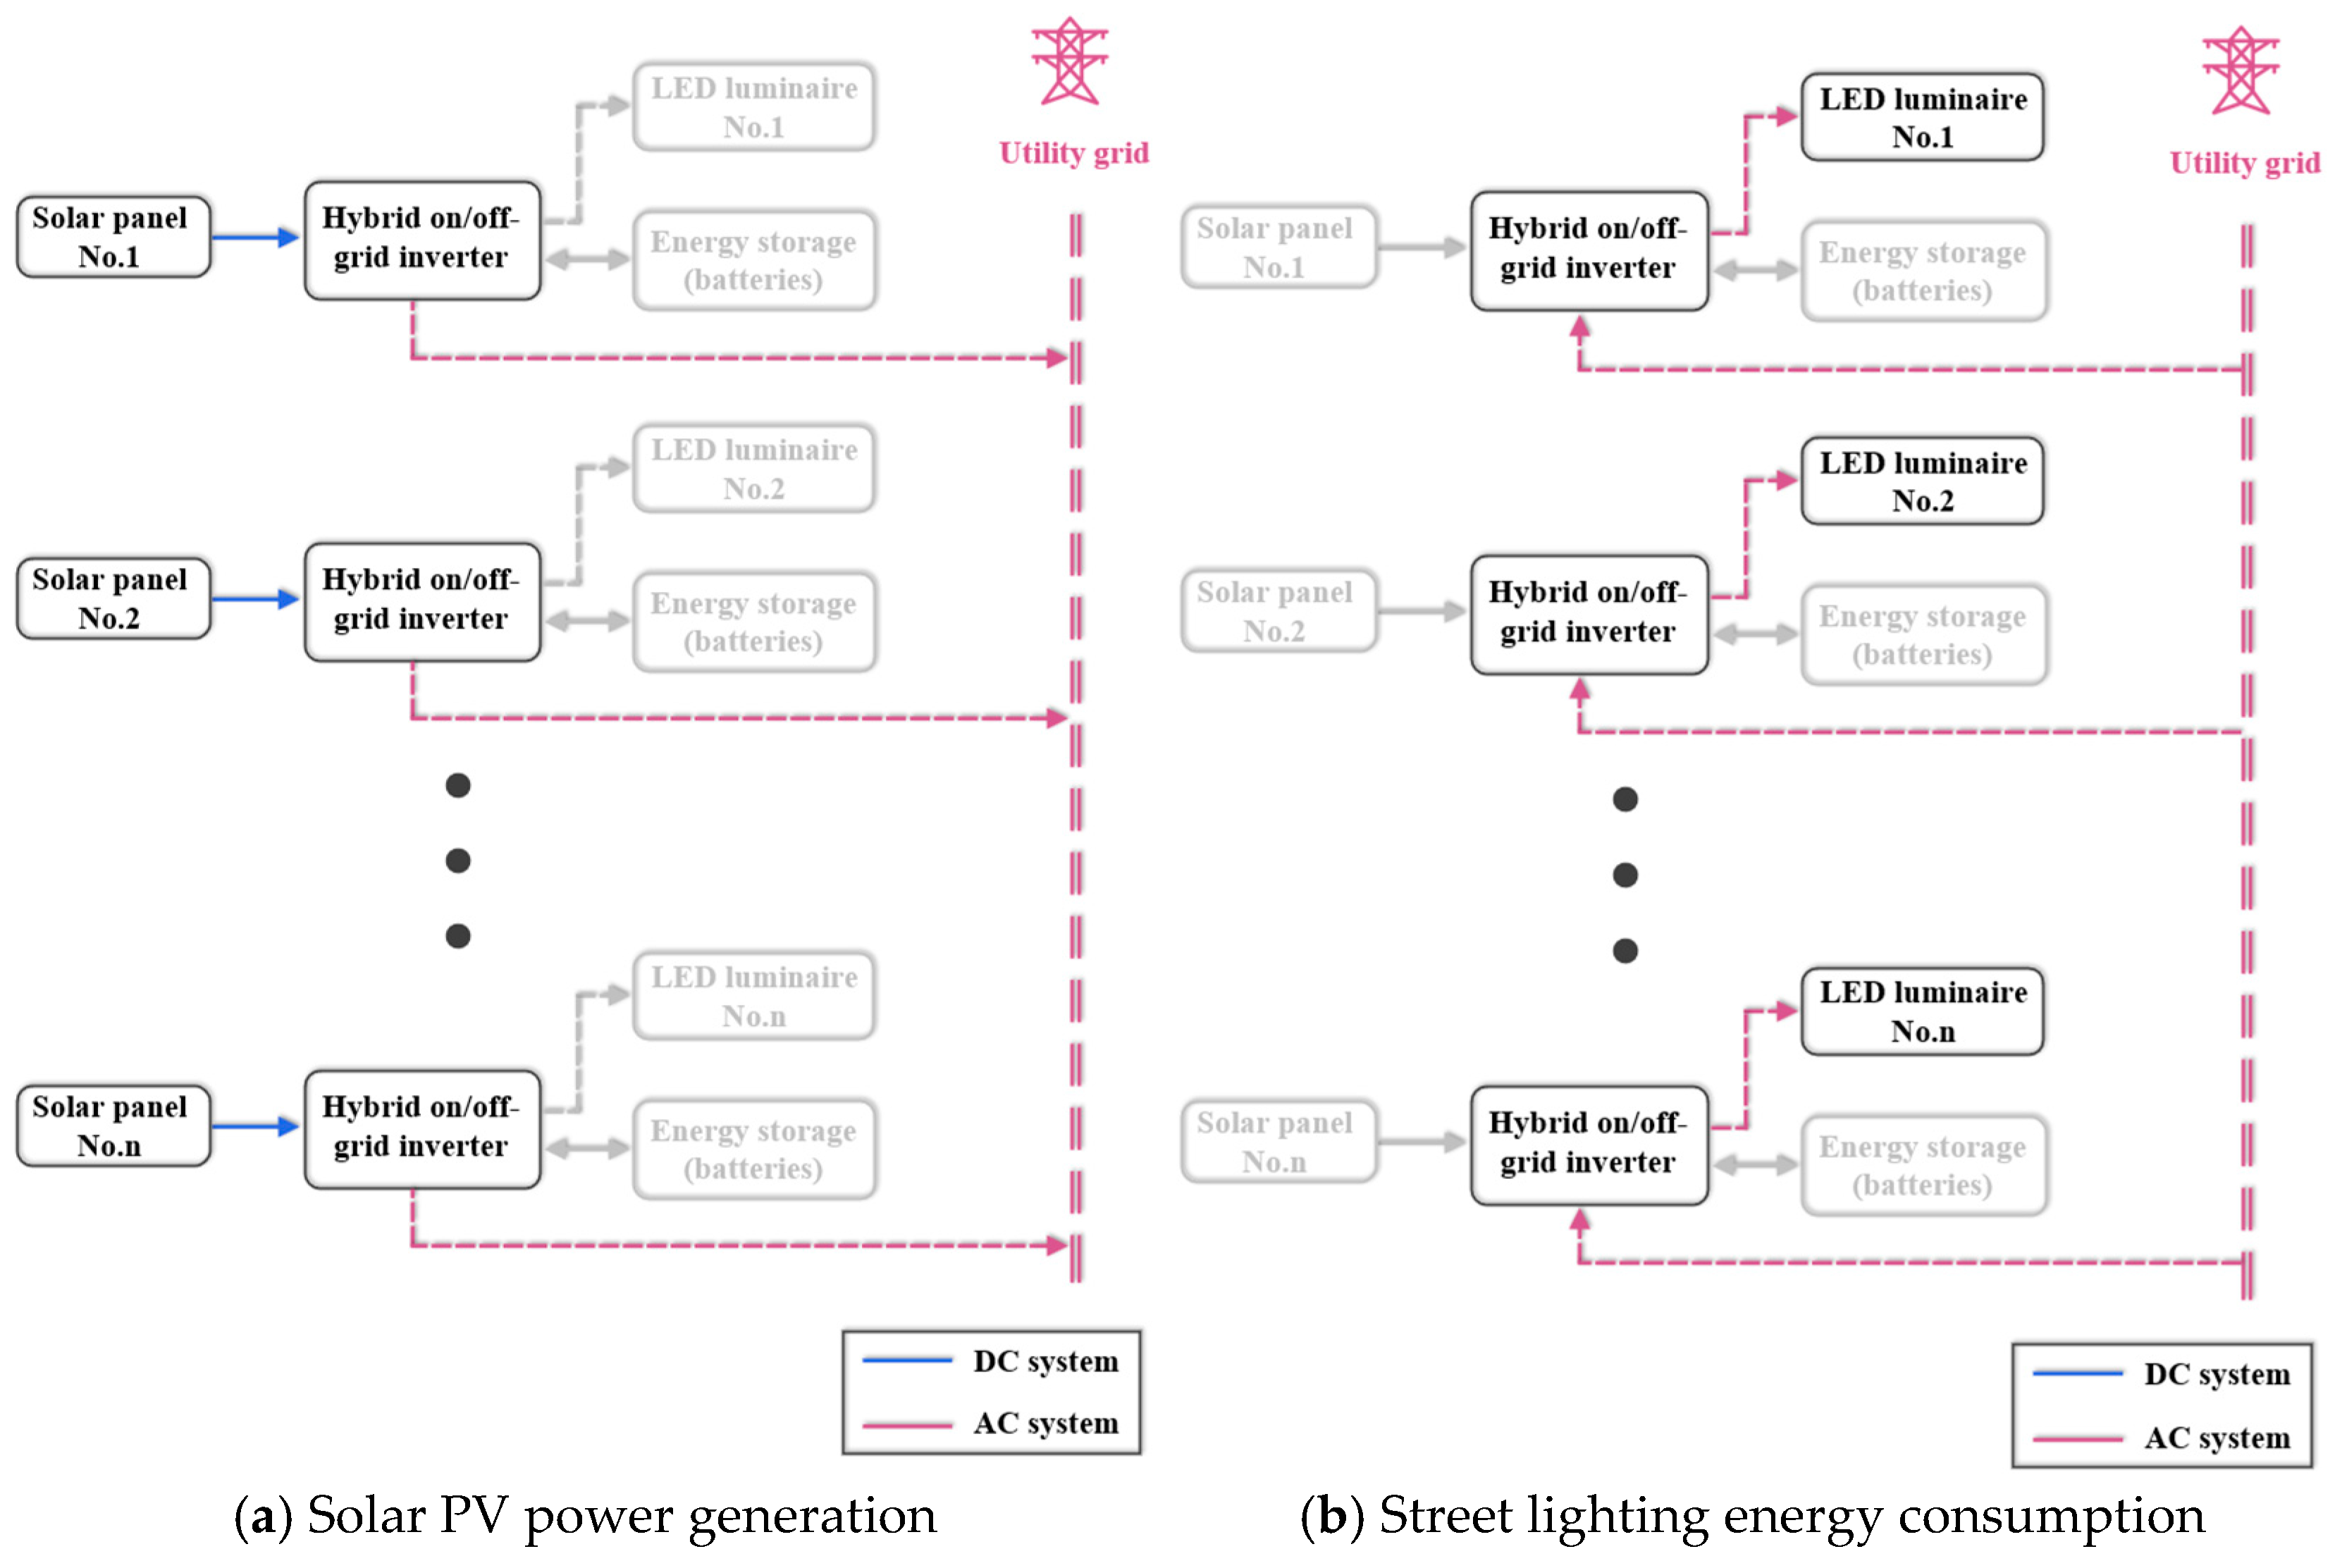
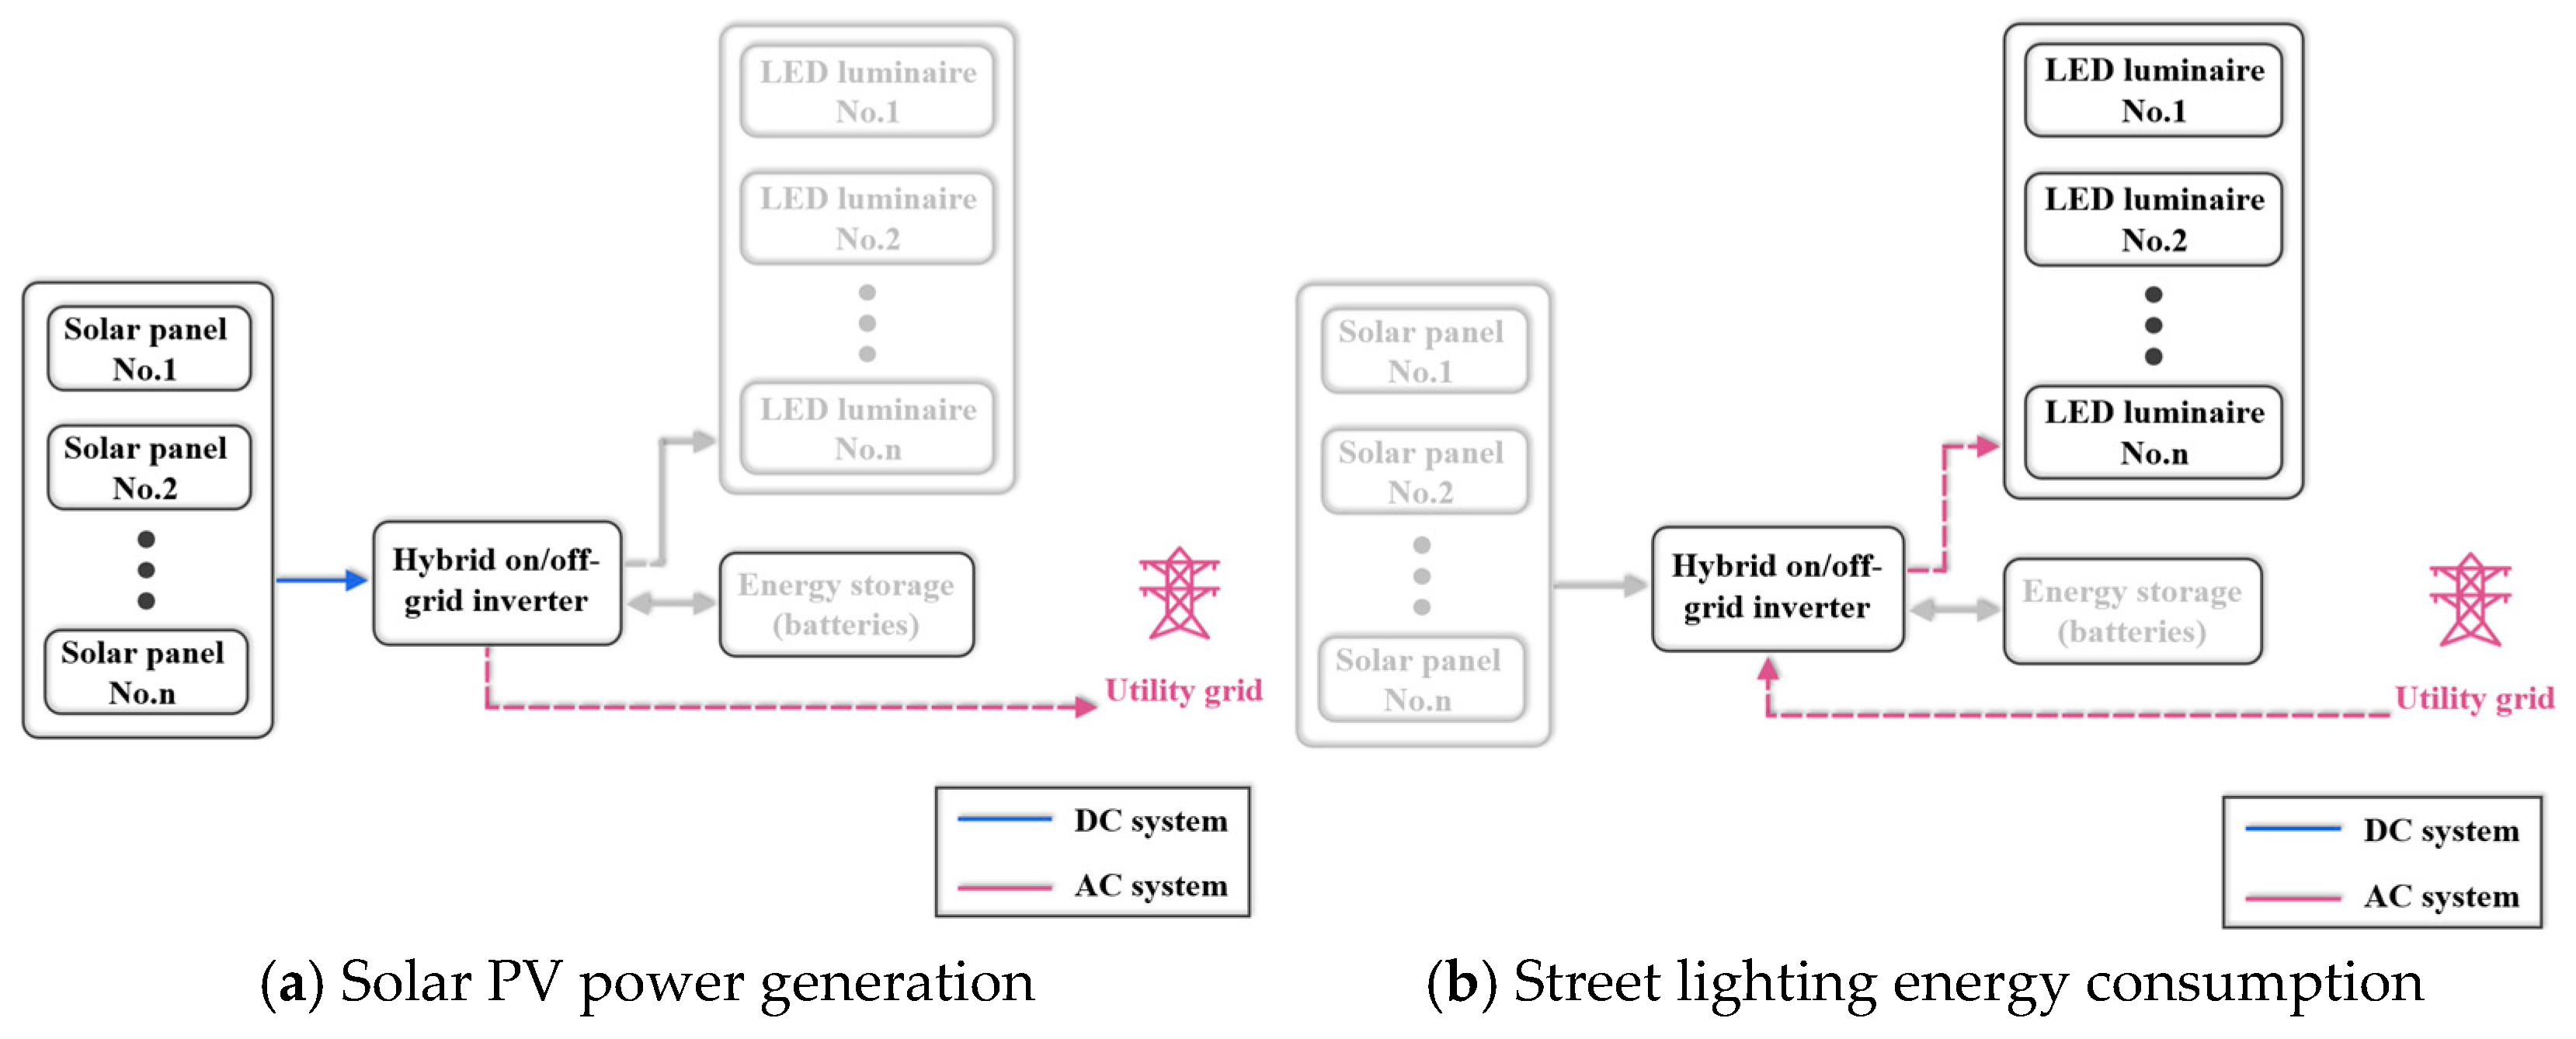
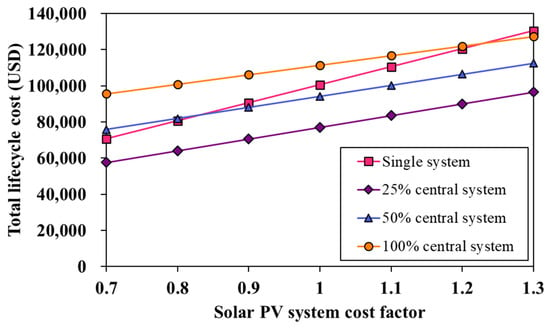
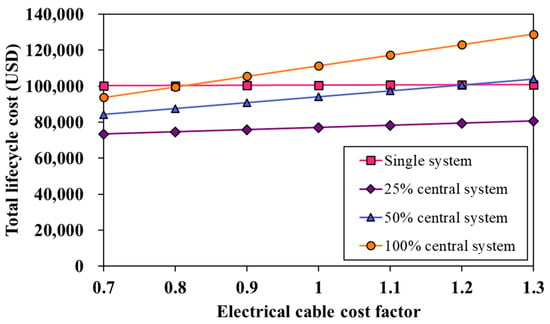
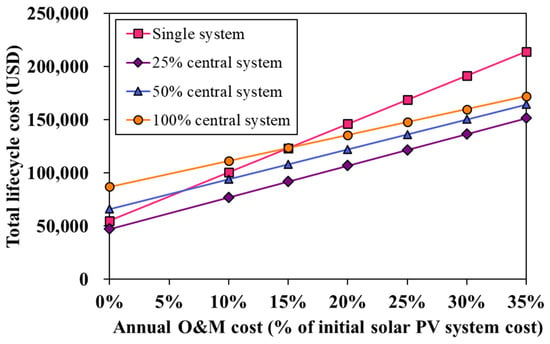
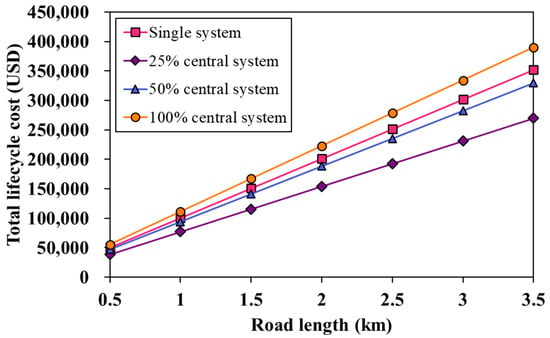



Disclaimer/Publisher’s Note: The statements, opinions and data contained in all publications are solely those of the individual author(s) and contributor(s) and not of MDPI and/or the editor(s). MDPI and/or the editor(s) disclaim responsibility for any injury to people or property resulting from any ideas, methods, instructions or products referred to in the content. |
© 2026 by the authors. Licensee MDPI, Basel, Switzerland. This article is an open access article distributed under the terms and conditions of the Creative Commons Attribution (CC BY) license.