


Highlights
What are the main findings?
- The proposed parallel-series PV configuration achieves mismatch loss mitigation comparable to power optimizers (17.1% average loss vs. 18.7% for power optimizers across urban shading patterns) while maintaining hardware simplicity comparable to multi-string converters, requiring only one shared LC filter instead of individual filters per module.
- Hardware validation with mismatched PV panels (20 W and 10 W modules) demonstrates that the configuration maintains optimal performance across all tested shading scenarios, with power loss closely matching only the shaded panel contributions, confirming theoretical predictions.
What are the implications of the main findings?
- The proposed configuration enables cost-effective building-integrated photovoltaic (BIPV) systems for smart buildings by reducing mismatch losses by approximately 40% compared to multi-string configurations while avoiding the hardware complexity and cost of power optimizers, making urban solar installations more economically viable.
- The architecture’s consistent performance across diverse urban shading patterns and compatibility with different panel ratings within the system enhances BIPV system reliability and facilitates seamless integration with building energy management systems, supporting smart city sustainability objectives.
Abstract
Building-integrated photovoltaic systems are essential components of smart buildings and sustainable urban infrastructure, contributing to energy efficiency and carbon footprint reduction in smart cities. Mismatch loss, particularly under partial shading, is one of the concerns in photovoltaic (PV) systems, especially in urban environments where buildings, trees, and other structures create complex shading patterns. It leads to significant power loss and poor efficiency. Several methods, such as string converters, multi-string converters, central converters, and micro-inverters/power optimizers, have been widely employed to address this issue. These methods suffer from hardware complexity and are good in certain shading patterns only; they remain ineffective otherwise. Power optimizers lead in efficiency under all the shading patterns, whereas string converters lead in hardware simplicity. We propose a novel parallel-series converter to mitigate mismatch losses in smart building applications that is as efficient as power optimizers and as simple as converters. In the proposed parallel-series converter design, multiple PV modules are connected in parallel to a very simple converter, and many such converters are then connected in series to get the final output. The proposed converter is rigorously evaluated for various shading patterns using MATLAB/SIMULINK. A prototype system of PV panels is also developed for hardware evaluation. The simulation and hardware results show that the proposed parallel-series converter dominantly competes with power optimizers with much simpler hardware and outperforms the other converters, making it particularly suitable for smart building energy systems where cost-effectiveness and reliability are critical.
1. Introduction
Smart cities are leveraging advanced technologies and sustainable infrastructure to improve urban living quality, reduce environmental impact, and optimize resource utilization. Building-integrated photovoltaic (BIPV) systems have emerged as a critical component of smart buildings, enabling on-site renewable energy generation and contributing to the overall energy efficiency of urban environments [1]. In the context of smart cities, PV systems not only provide clean energy but also support grid stability, reduce peak demand, and enhance building energy management systems.
A large portion of electrical energy is still produced by fossil fuels, causing environmental concerns [2]. With time, these resources are depleting, and soon they will vanish completely [3,4]. Therefore, it is a need of the hour to find reliable and sustainable alternatives [5,6]. Recent advances in renewable energy resources, such as wind, solar, biomass, and ocean energy, have demonstrated great potential as reliable alternative energy resources [1]. With advances in semiconductor fabrication processes, PV systems have gained significant recognition among alternative renewable energy resources in recent years [7]. PV systems fall in the category of green energy because they do not emit harmful gases, such as oxides of Carbon , Nitrogen , and Sulfur [8]. For having no moving parts, PV systems require low maintenance and are long-lasting with an expected life span of 25 to 30 years [9]. PV systems are equally attractive for large-scale power generation and small independent or grid-connected systems to electrify houses and small businesses, making them particularly suitable for integration into smart building infrastructure [10,11].
PV systems suffer from some challenges as well. The installation of PV systems has been costly due to the high price of PV panels; however, advancements in semiconductor fabrication over the last few years have significantly reduced the cost [12,13]. Intermittency and irregularity of solar power are also major concerns. The performance of a PV system is dependent on many factors, such as solar irradiance, temperature, solar incident angle, dust, and shading [14,15]. Partial shading, being non-systematic, is one of the most challenging problems in PV systems, particularly in urban environments where smart buildings face complex shading patterns from neighboring structures. Partial shading causes PV systems to suffer from mismatch, hotspots, multiple peaks in the PV power curve, and material degradation [16]. All these problems adversely affect the efficiency of the PV systems. Partial shading occurs when a portion of a single PV panel or multiple PV panels is/are shaded by nearby trees, buildings, other infrastructures, dust accumulation, bird drops, uneven aging, and clouds [17,18,19]. In smart cities, where building density is high and solar access varies throughout the day, addressing partial shading becomes critical for maximizing the energy contribution of BIPV systems.
To mitigate partial shading and harvest the maximum power, many different configurations of PV panels and power electronic converters were proposed [20]. Such PV configurations are broadly classified as static configurations and dynamic configurations. In static configurations [21], PV panels and power electronic converters are connected in a matrix in a fixed, predetermined manner, whereas dynamic configurations [22], also known as reconfigurable PV systems, offer changes in the connections of the PV panels’ matrix at runtime. In simulations, dynamic configurations have shown superiority over static configurations. However, the computational and hardware costs of such dynamic configurations pose challenges of hardware complexity, high cost, and high maintenance demands; hence, they make the reconfigurable PV systems very unattractive for real implementations. The work proposed in this paper focuses on a practical solution, so it falls in the category of static configurations. The placement of this work with respect to the existing literature is discussed in Section 2.
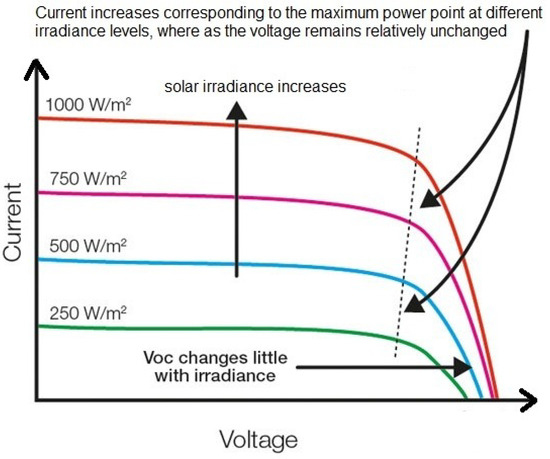
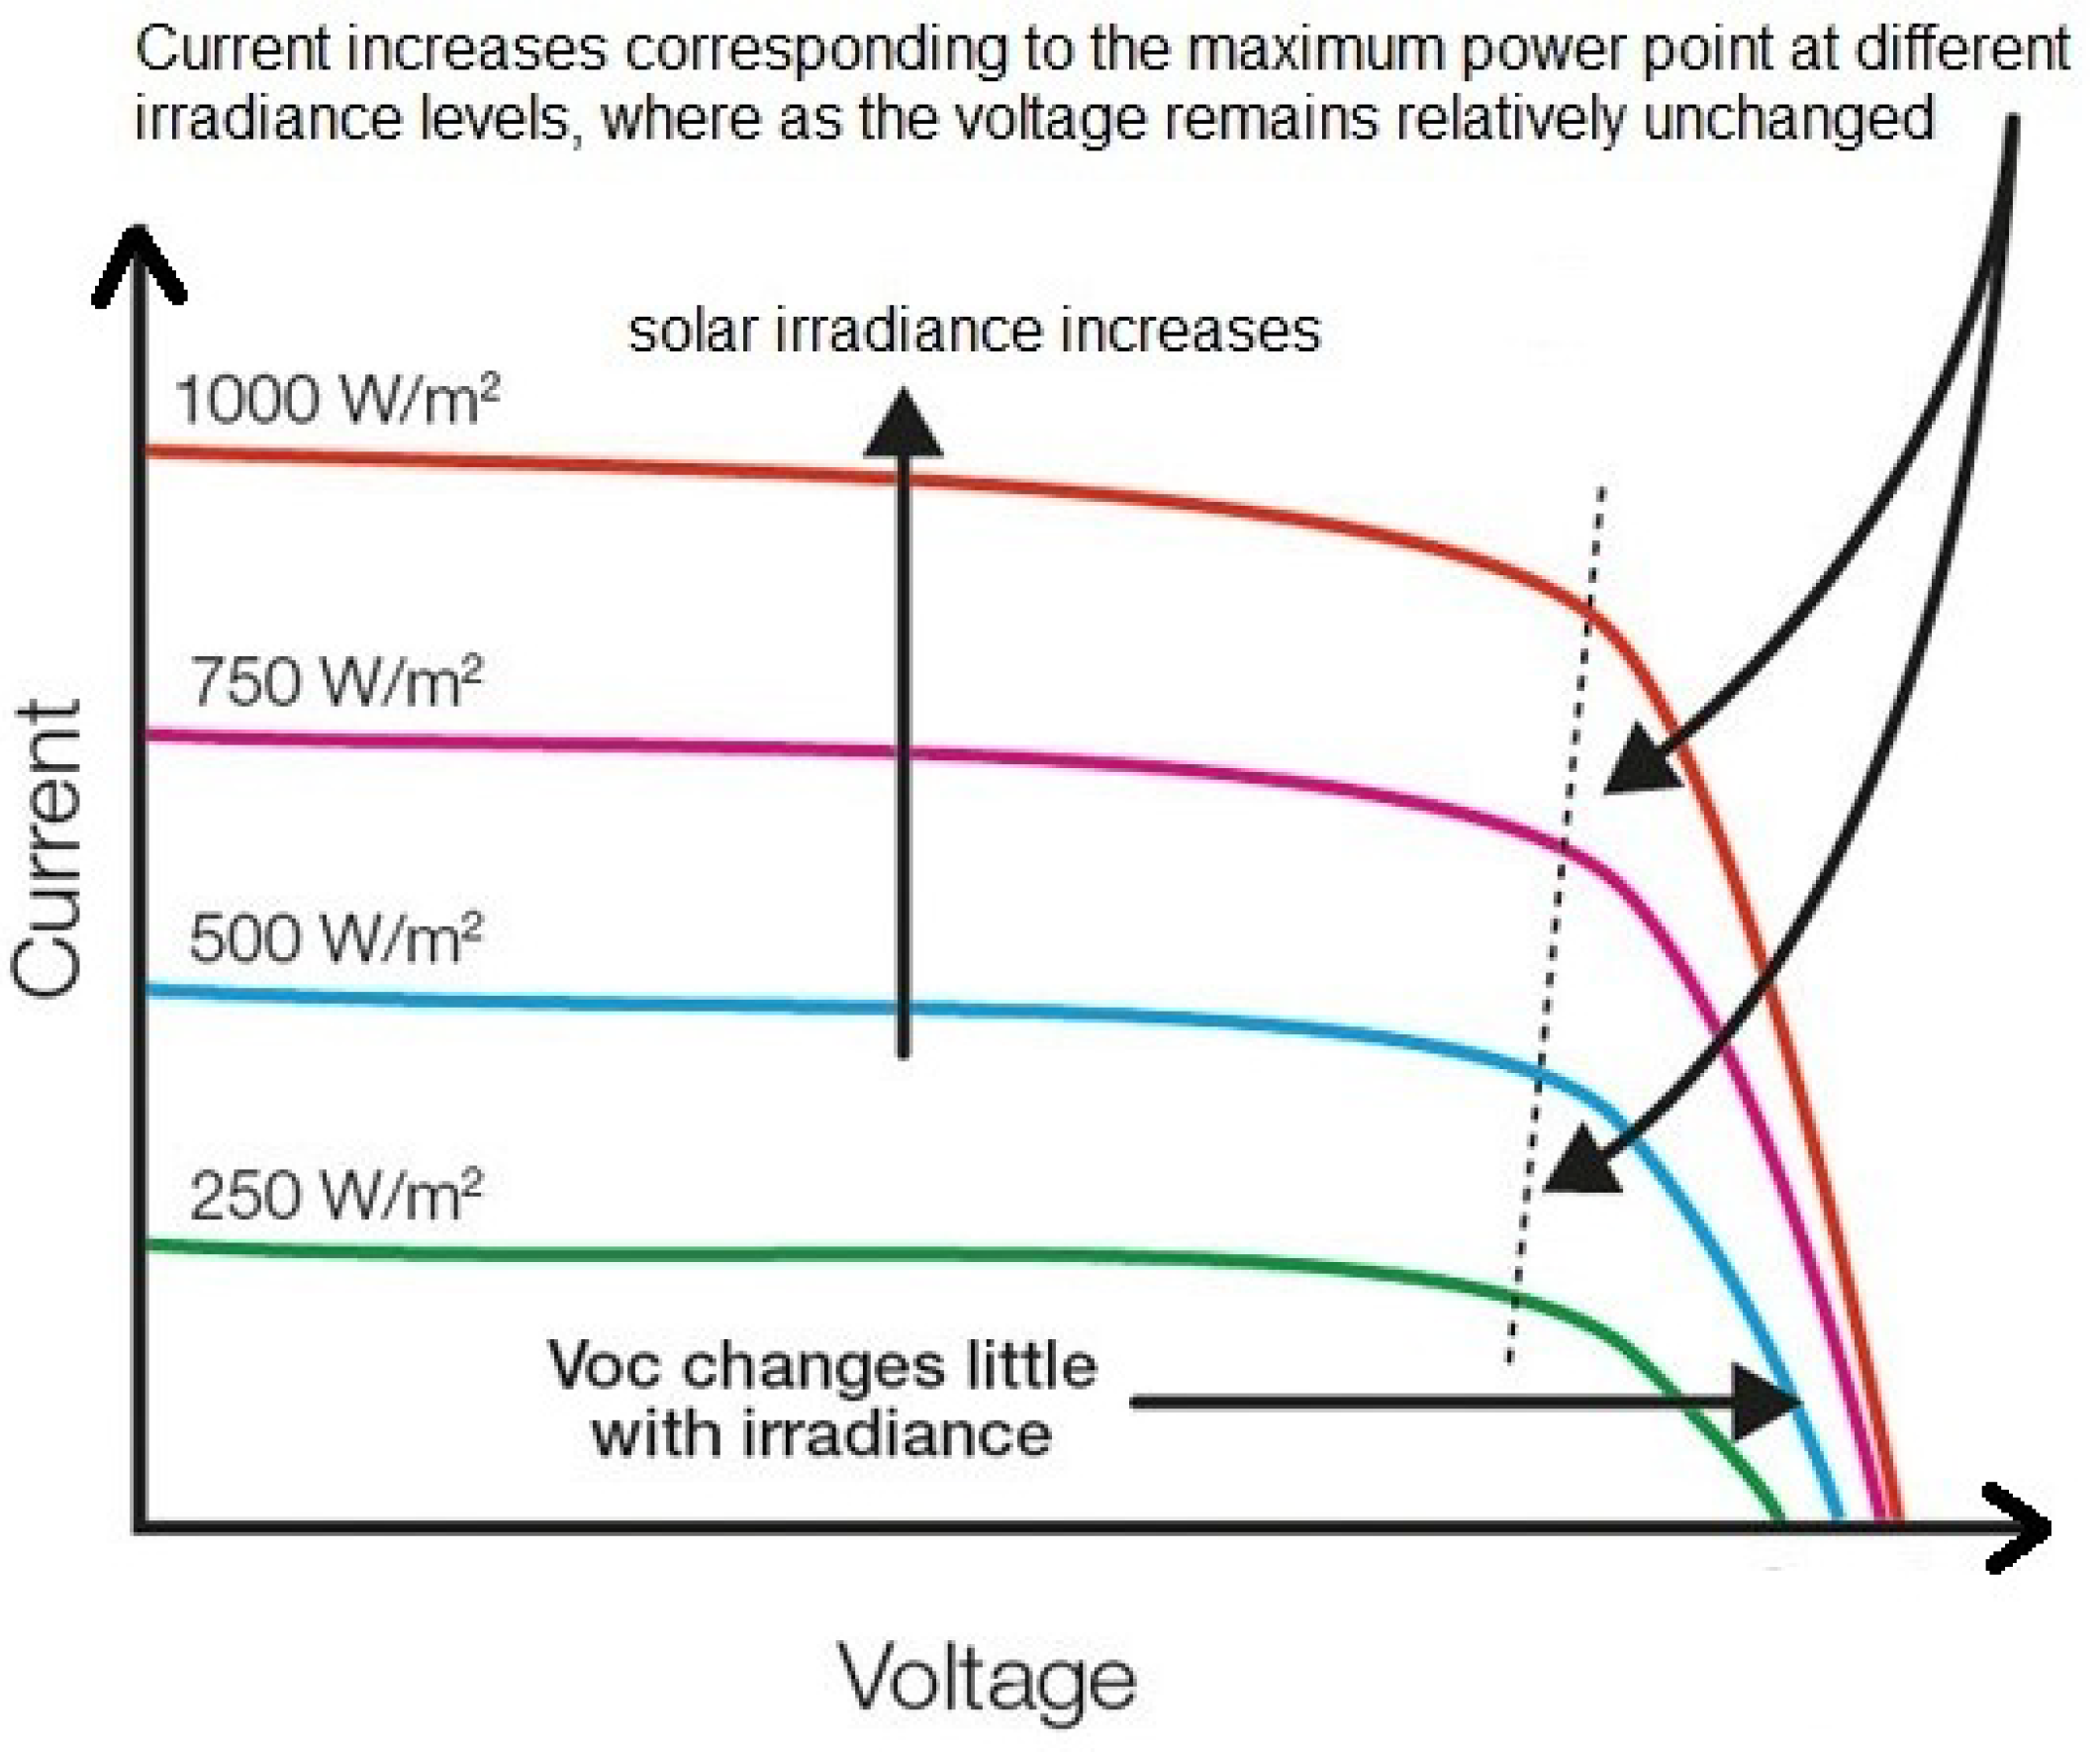
PV cells are composed of semiconductor junctions that are stimulated by the sun to act as current sources [23]. A typical V-I characteristic curve of a PV cell is shown in Figure 1. As shown in the figure, the current of a PV cell is significantly affected by solar irradiance, while the knee-point of the V-I curve (corresponding to the maximum power point) does not suffer from a significant change in terms of optimal terminal voltage. This fact is exploited by our work, and we propose a PV configuration that considers multiple PV panels in parallel with a parallel converter. The PV panels in the proposed parallel-connected configuration have the same terminal voltage, and their currents sum up directly to the common nodes regardless of the difference in irradiance/shading on the panels. The parallel connection intrinsically maximizes power harvesting as all the panels operate near the terminal voltage that corresponds to the maximum power point, despite their different current contributions in the case of partial shading. Several such units may be connected in series for higher output voltage. This idea leads to our proposed parallel-series configuration, which is the focus of this paper. Our proposed configuration has shown near optimal performance with a hardware arrangement much simpler than power optimizers and micro-inverters.
Figure 1.
Typical V-I characteristics of a PV cell.
Despite significant research in this area, a clear gap persists in the literature. To the best of the authors’ knowledge, no existing static PV configuration simultaneously achieves near-optimal energy harvesting performance across all partial shading patterns while maintaining hardware simplicity comparable to conventional string or multi-string converters. String and central converter topologies are cost-effective in hardware but suffer substantial efficiency degradation under many shading patterns. Power optimizers and micro-inverters achieve near-optimal performance but require dedicated converters for each panel, resulting in N-fold increases in hardware cost and control complexity. This is particularly important for BIPV deployment in smart city environments, where economic viability is critical for widespread adoption. This work addresses this gap by proposing a parallel-series configuration that uniquely bridges the two extremes by using minimal converter stages (an input capacitor, a single switch, and a bypass diode per row, with only one shared output LC filter for the entire stack) to achieve power-optimizer-level performance across all shading patterns with multi-string-level hardware count. The major novelty lies not in the series distributed maximum power point tracking (MPPT) concept itself but in the specific minimal converter realization and the single shared filter, which enables simpler hardware for near-optimal BIPV performance, validated across ten standardized shading patterns in both simulation and hardware experiments.
The rest of the paper is organized as follows. Section 2 presents a review of the related literature. Section 3 presents our proposed novel parallel-series configuration. Section 4 presents a thorough evaluation of the proposed configuration and its comparison with other static configurations. Section 5 presents a hardware prototype and practical evaluation on a configuration. Section 6 discusses the application of the proposed configuration in smart building energy systems. Section 7 concludes the paper and Section 8 presents the limitations and future research directions.
2. Literature Review
This section introduces different shading patterns that are used to evaluate PV configurations and a set of performance metrics for a quick reference, and then it presents a review of different PV configurations to mitigate partial shading.
2.1. Shading Patterns and Performance Metrics
This subsection introduces the standardized shading patterns and performance metrics that serve as the evaluation framework throughout the rest of the paper. These metrics are standard definitions adopted from the literature and are presented here for the convenience and quick reference of the readers to appreciate the comparative results in Section 4.
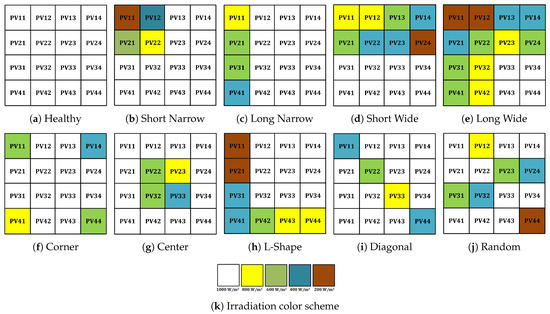
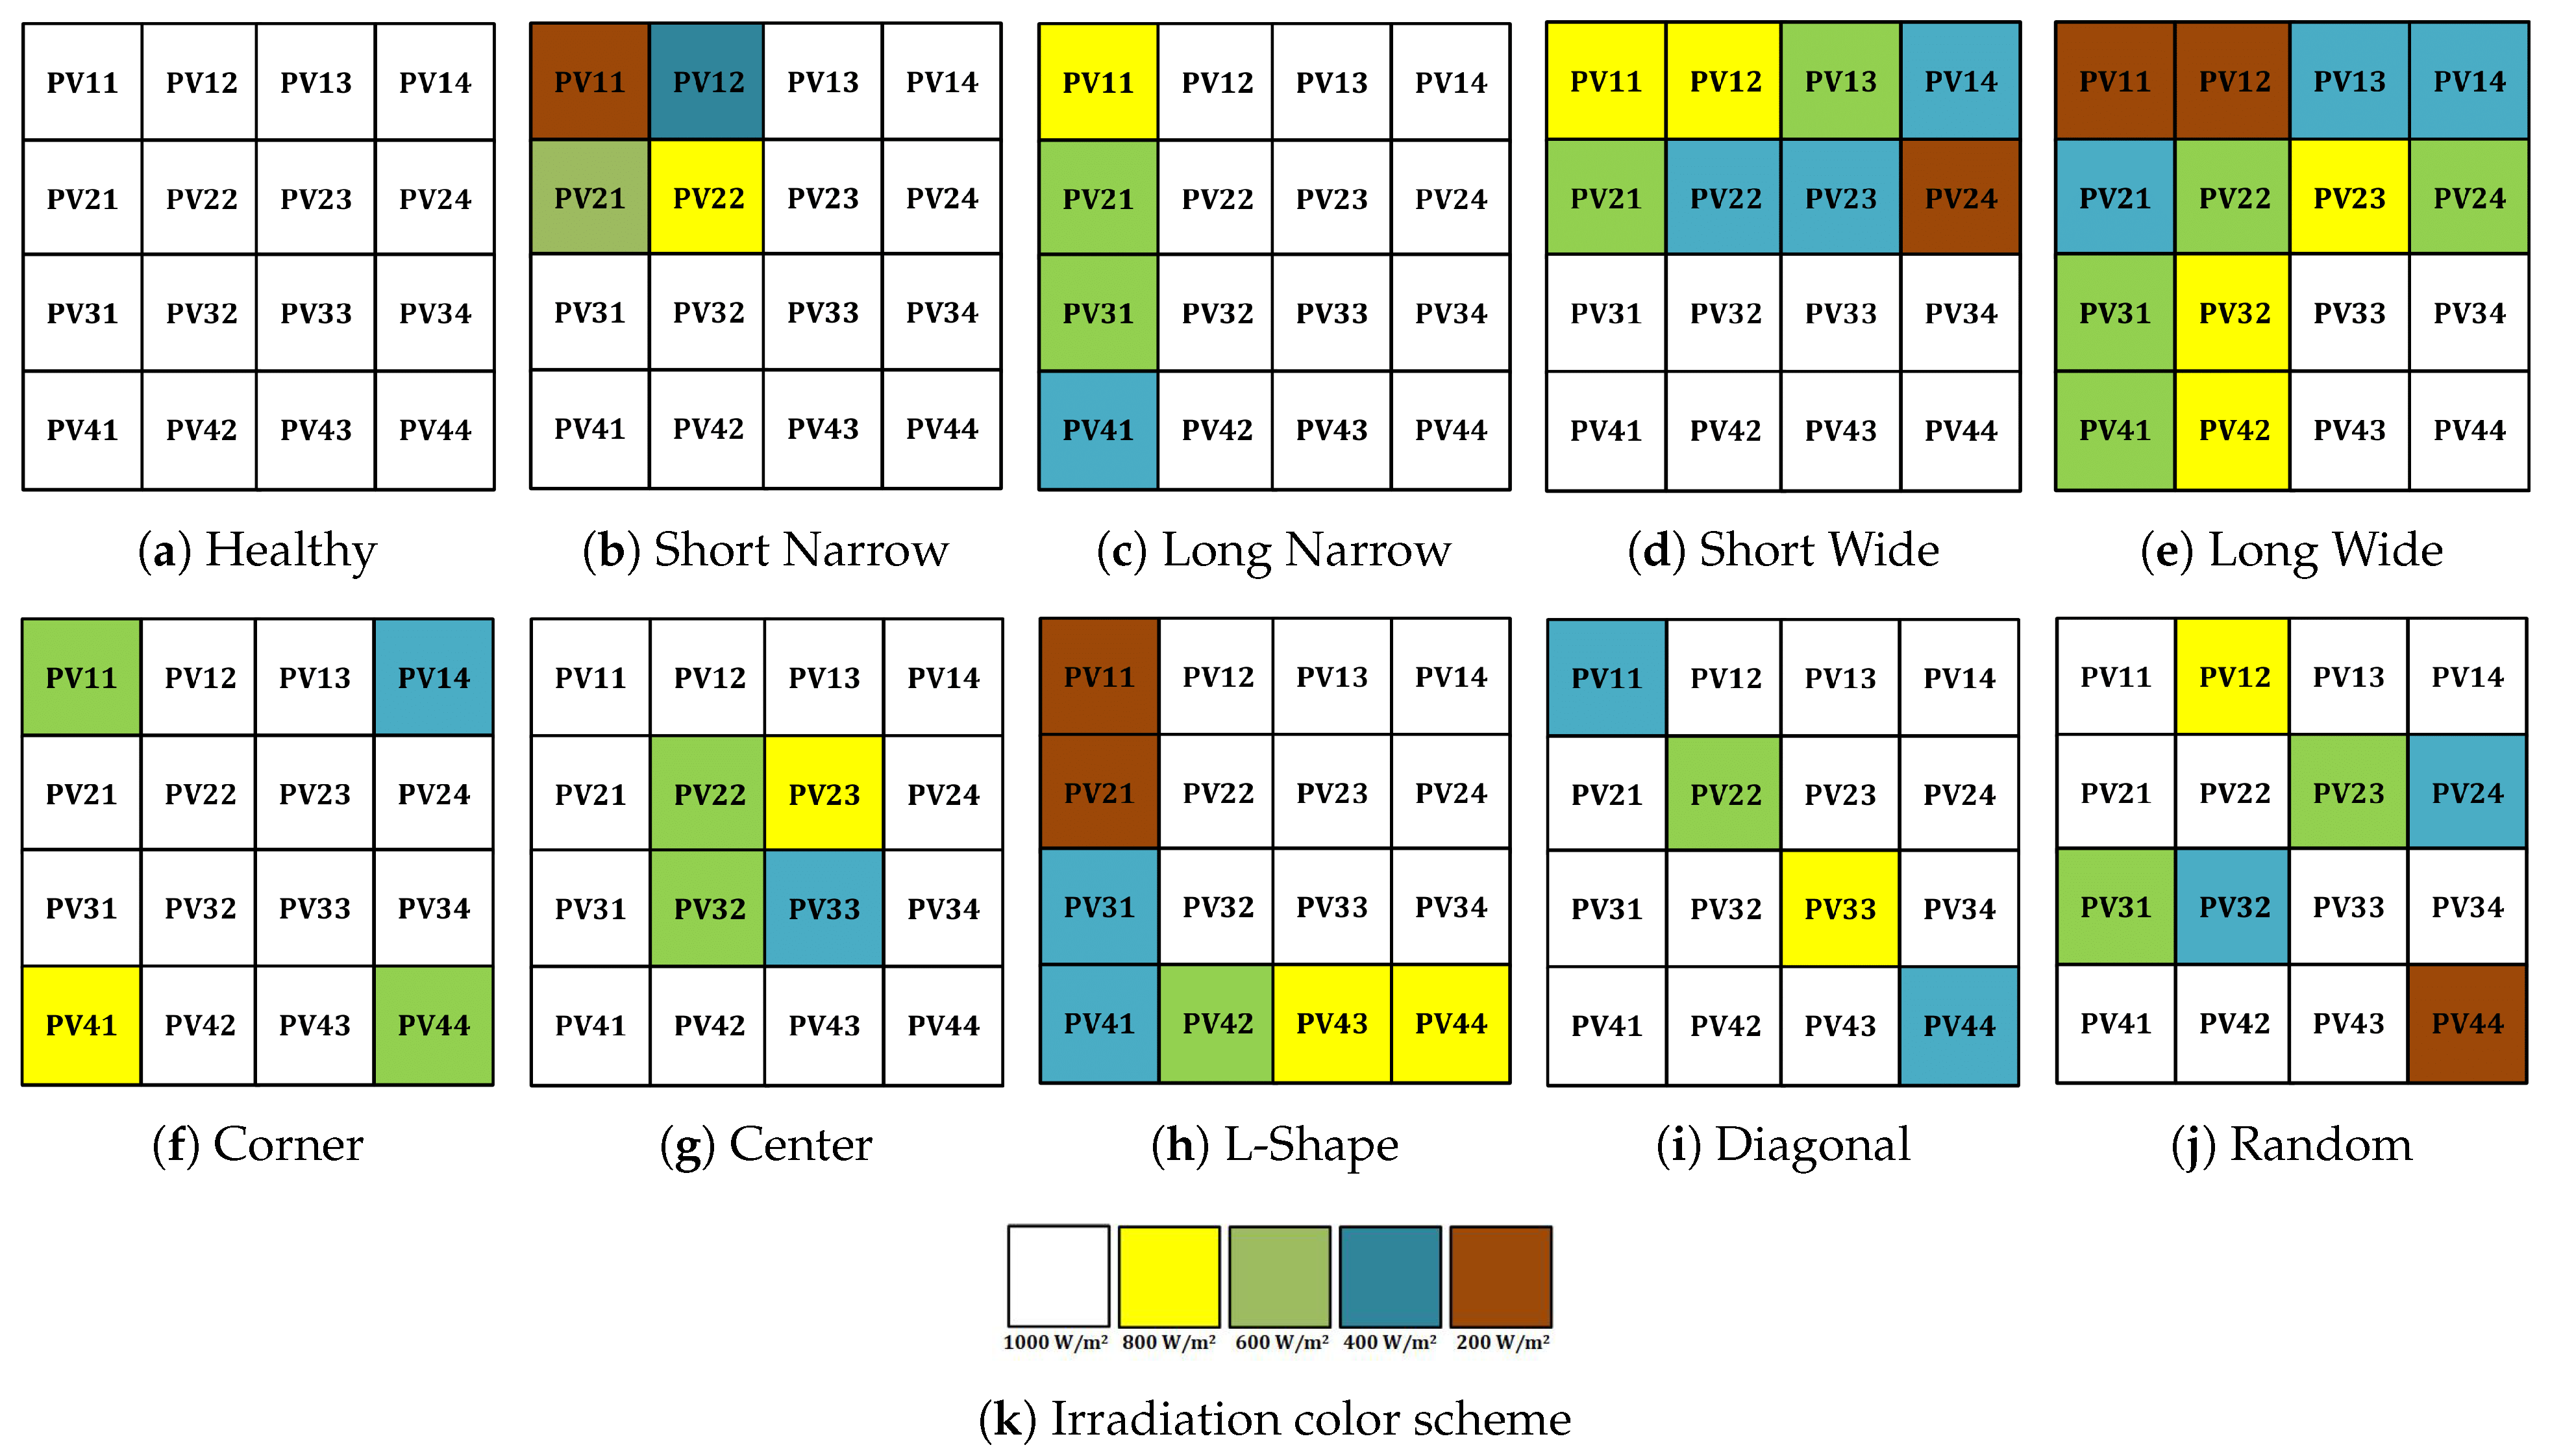
The power output of a PV system in any configuration depends upon the shading pattern. Shading on the same number of panels in different directions on the PV array results in different output power. Certain converters perform well under specific shading patterns but performs poorly under other shading patterns. A good converter must perform well in all the shading patterns. Although the shading patterns can be random, however, for analysis and ease of study, there are a few commonly used shading patterns in the literature [24]. These shading patterns are shown in Figure 2. These shading patterns include healthy or no shade, short narrow, long narrow, short wide, long wide, corner, center, L-shape, diagonal, and random. These shading patterns are considered for the comparison of different PV configurations.
Figure 2.
Common partial shading patterns used for PV system evaluation.
The commonly used performance metrics for PV systems are briefly described as follows.
- (i)
- Output Power: The output power () refers to the real power delivered by a PV system to the load [25].
- (ii)
- Mismatch Loss: It is the power difference between the output power under standard test conditions () and the output power under partially shaded conditions () [26]. It is mathematically presented as
- (iii)
- % Power Loss: The percentage power loss for the system is defined as the ratio of mismatch loss and () [27]. So,
- (iv)
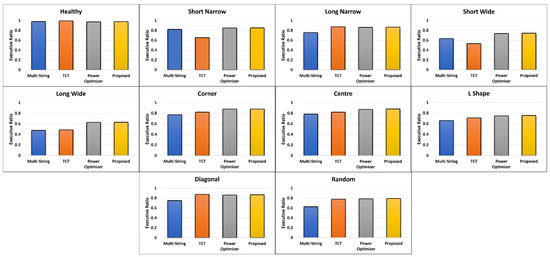
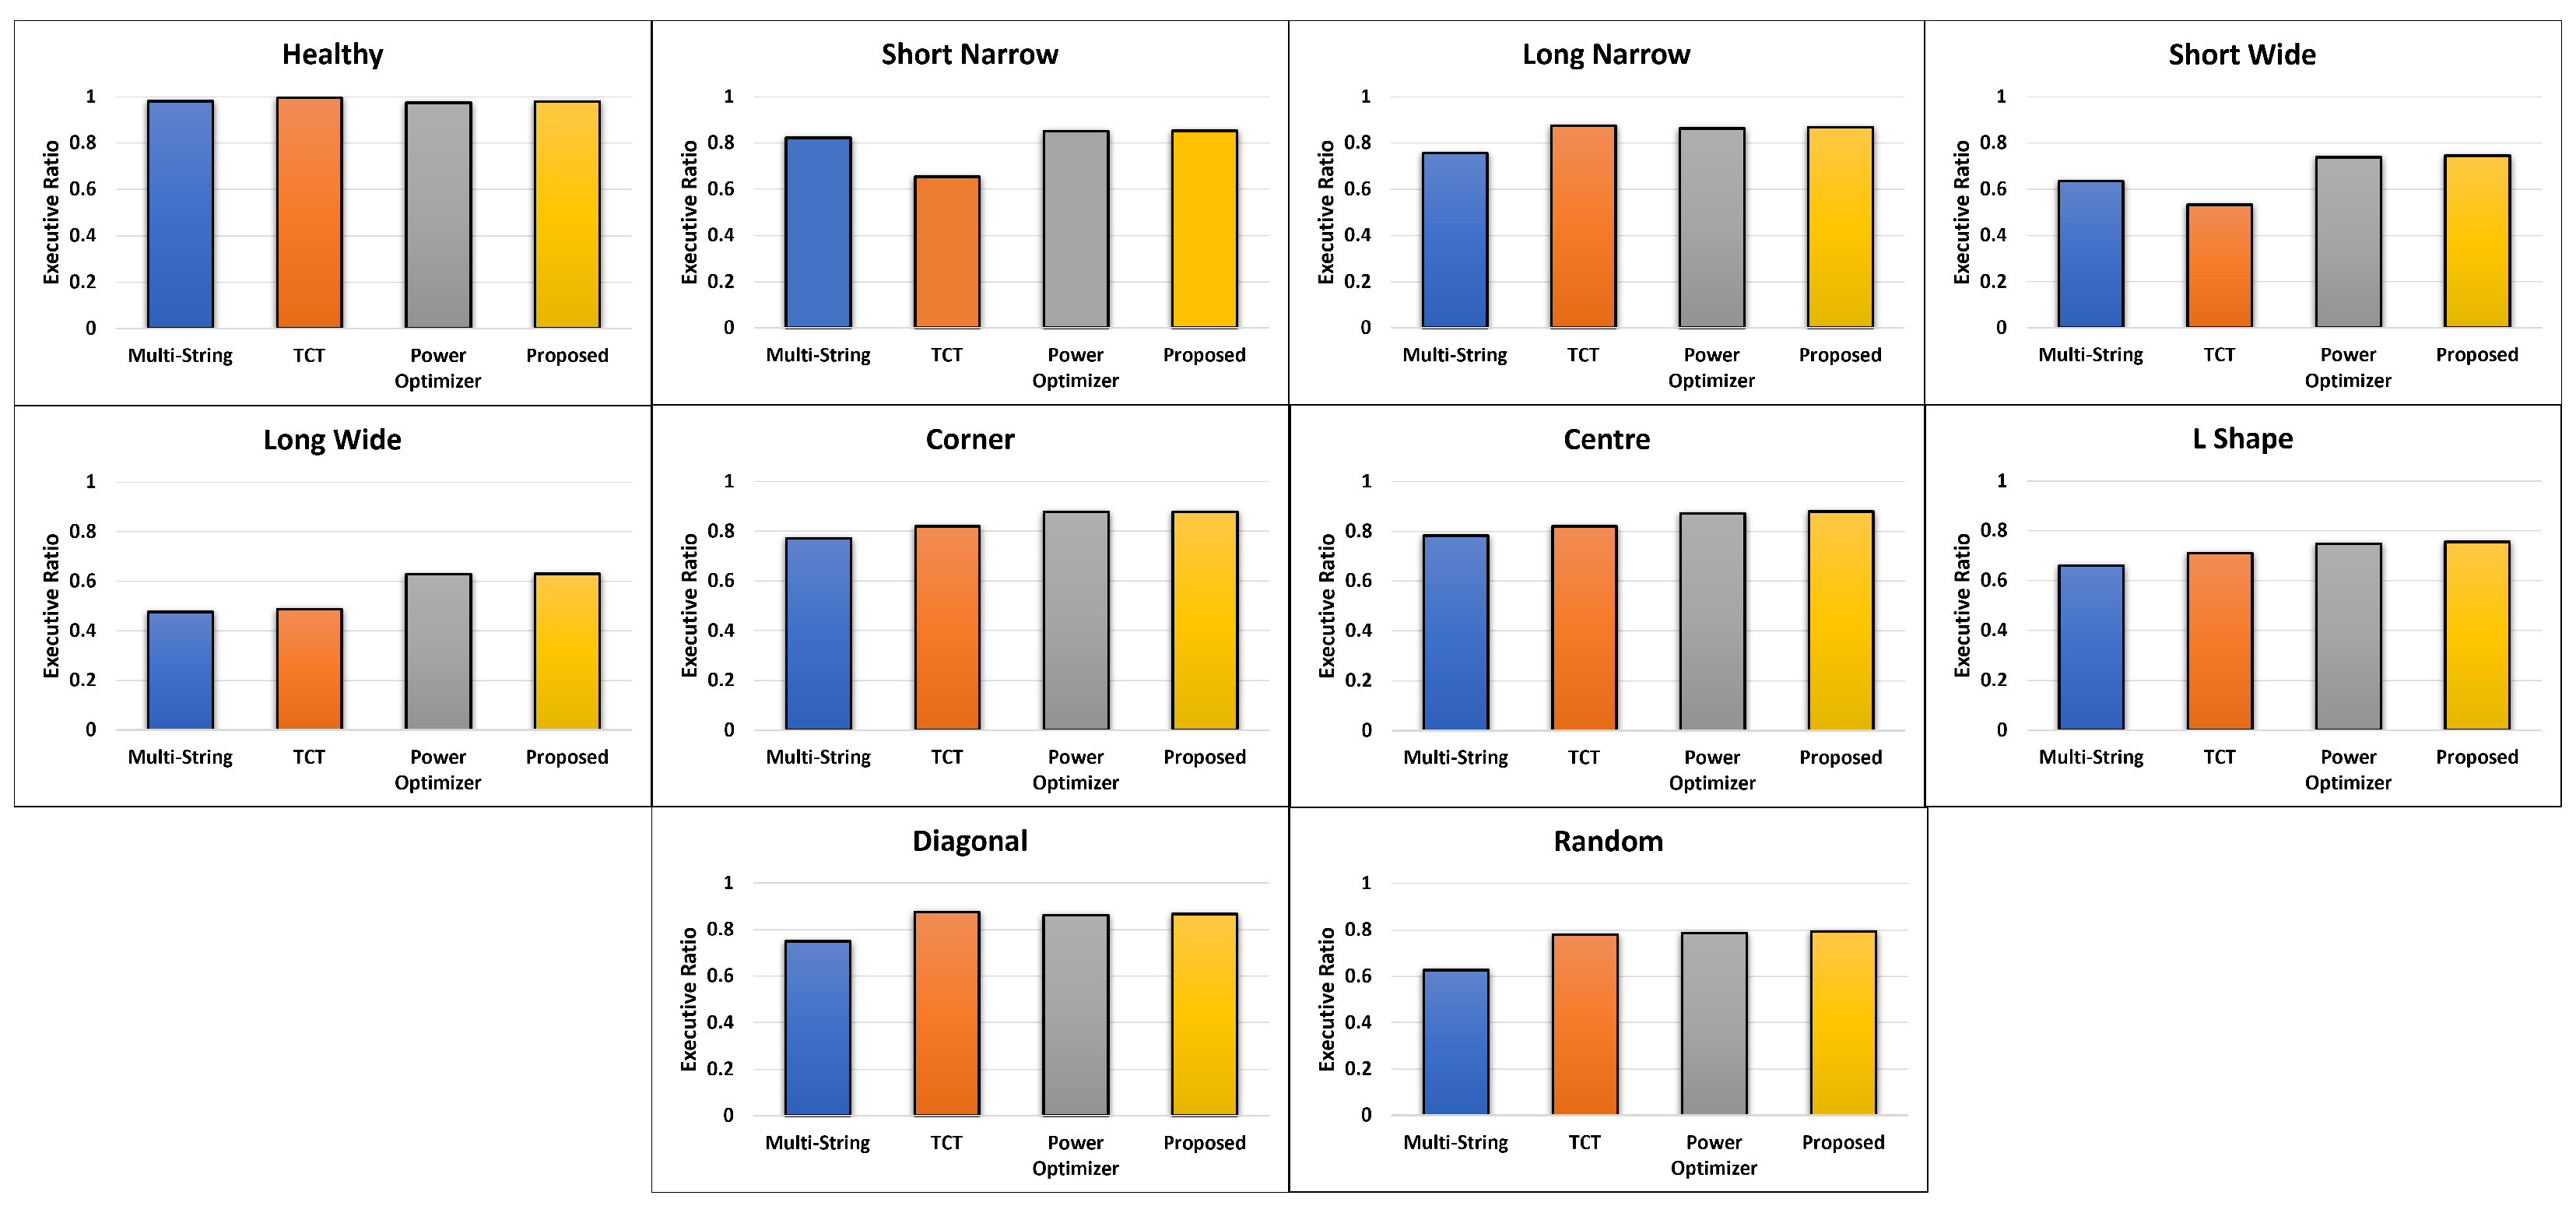
- Executive Ratio: The executive ratio (ER) is defined as the ratio of () to () [28]. This ratio shows the measure of the severity of partial shading that will help us understand the performance under different shading conditions. This metric is equivalent to what some authors refer to as harvested power fraction or power extraction ratio. The term executive ratio as used in this paper follows the terminology used in [28] for consistency with the referenced work. A value of ER closer to 1 indicates better performance under partial shading.
- (v)
- Form Factor: This is the ratio of the maximum power output to the product of open circuit voltage and short circuit current. This parameter tells the utilization of PV performance [29].
- (vi)
- Efficiency: The efficiency of a PV system is defined as the ratio of the electrical power output per unit time to the solar power input per unit time. Efficiency is an inherent property of PV cells that can vary from panel to panel. It depends on the type of PV cell as well, such as monocrystalline, polycrystalline, and thin film. For different PV panels, the efficiency varies between 13 and 25% [30].
2.2. PV Configurations
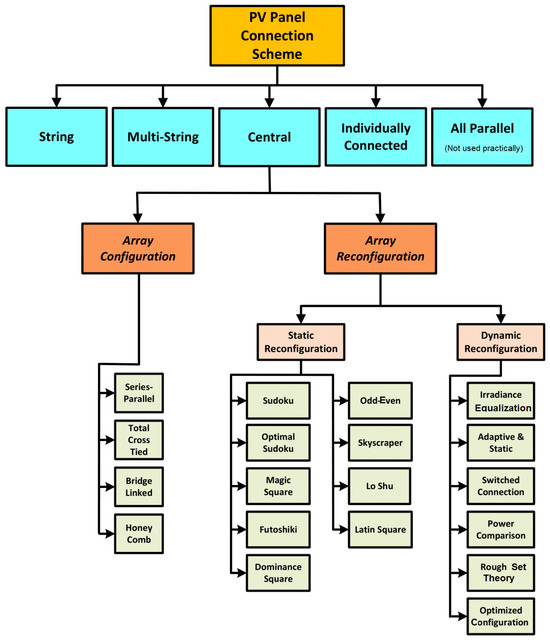
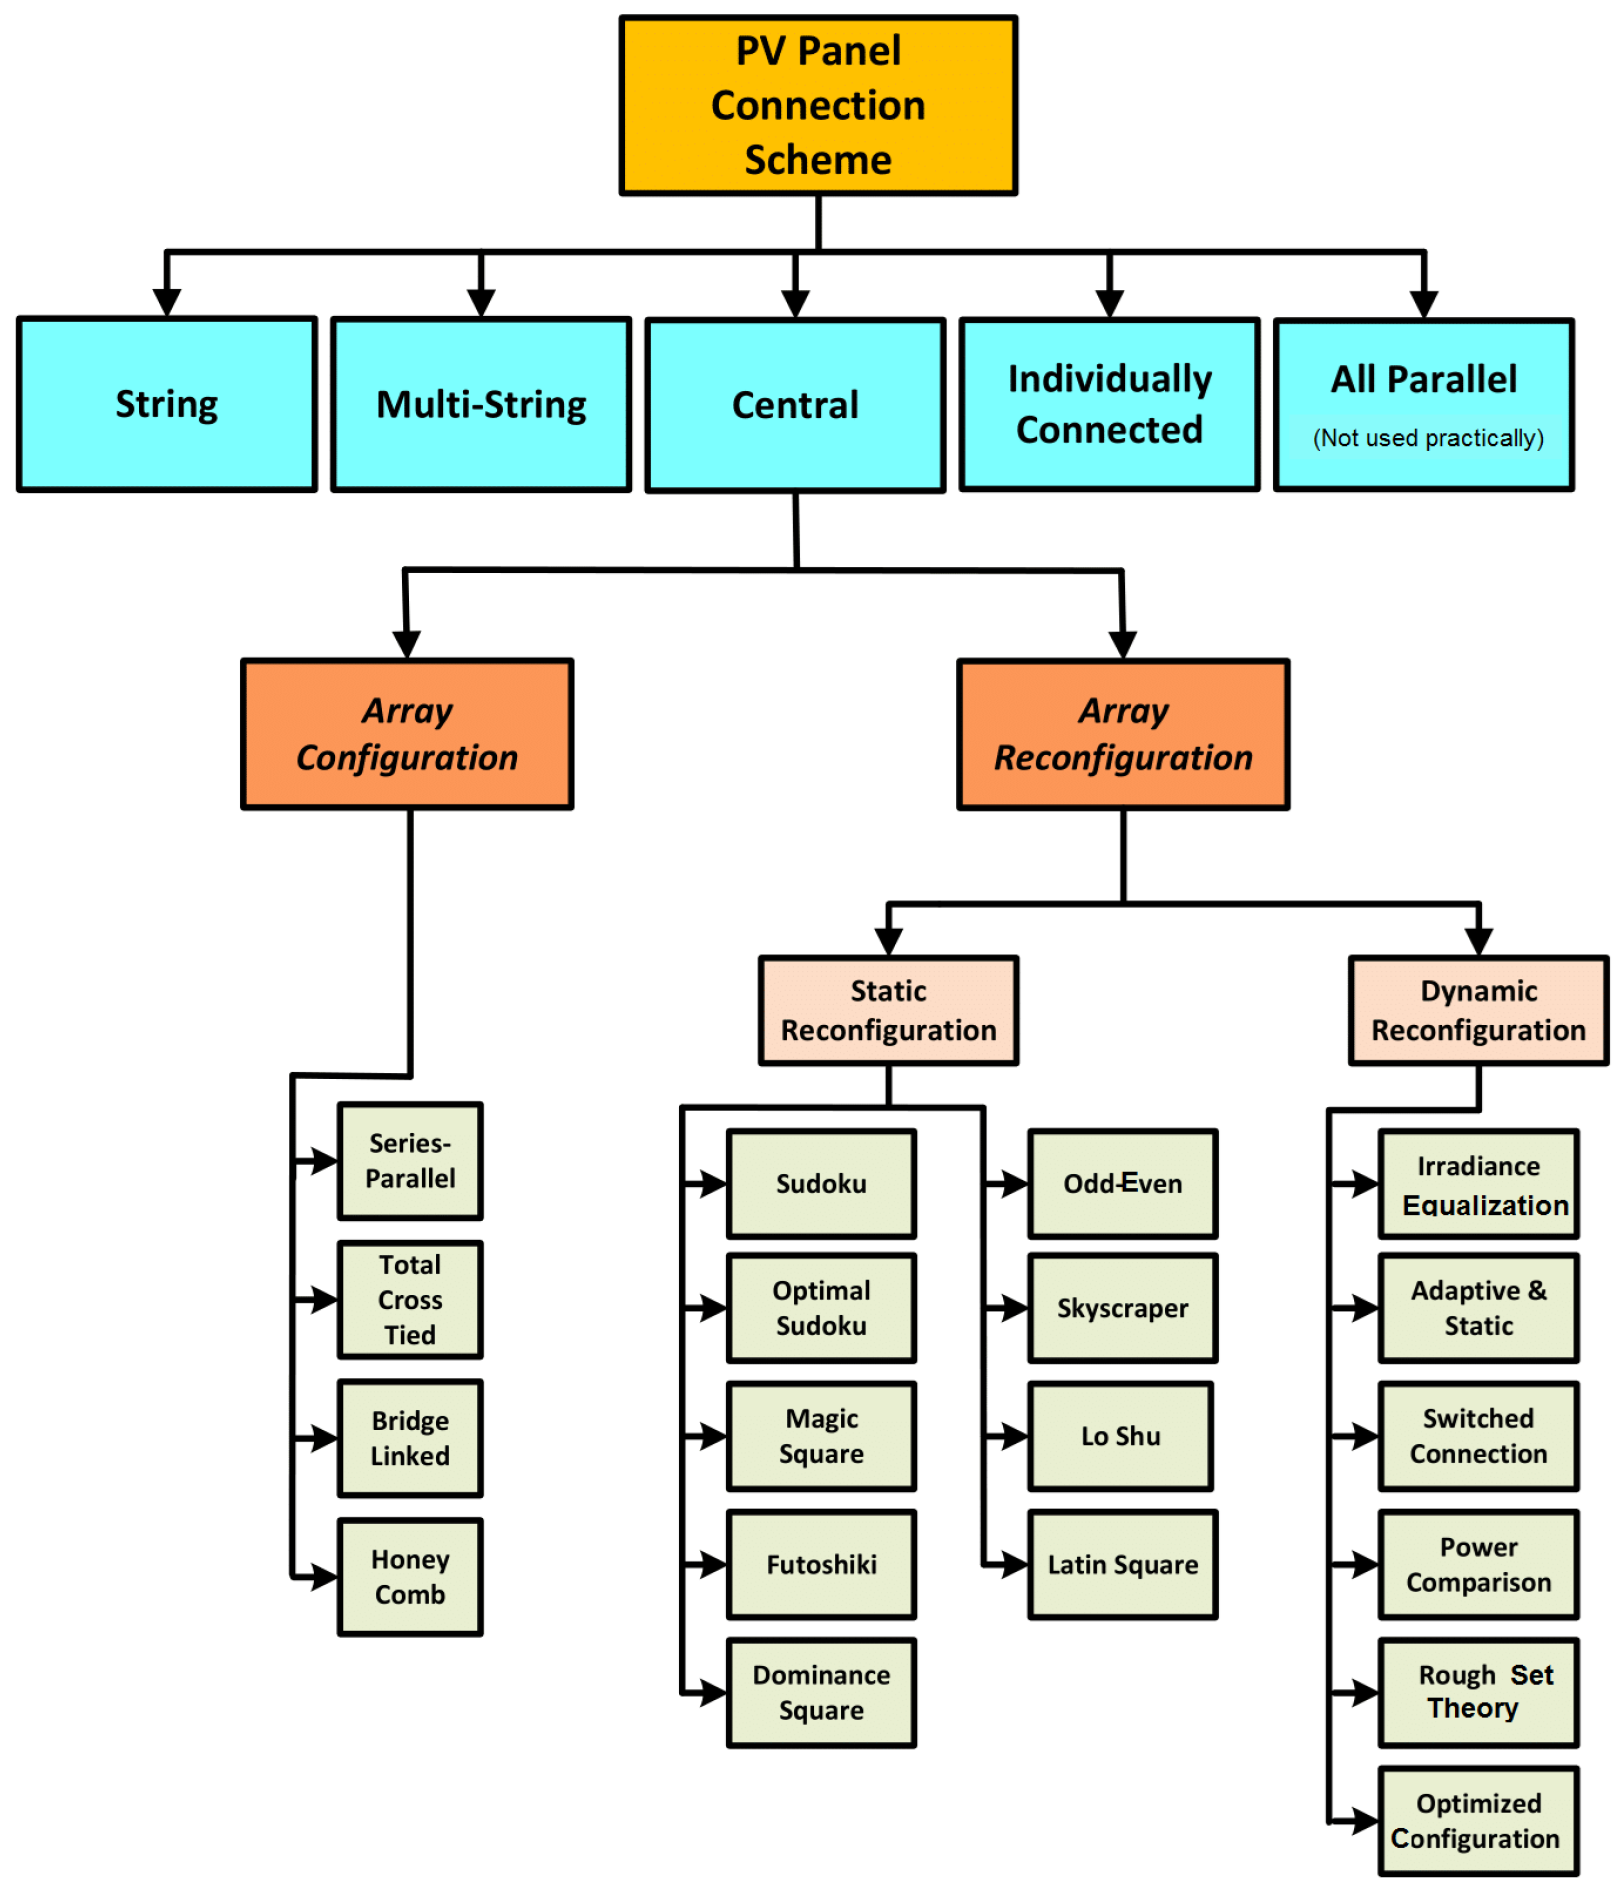
The configuration of the PV panels is a critical choice for the performance of the overall PV system [31]. Opting for the right configuration by assessing different factors, such as weather, nearby trees, other obstructions, and the sun’s orientation, leads to significant saving in terms of cost, energy, and space [32]. A variety of configurations are found in the literature in this regard. Dynamic configurations (also known as reconfigurable PV systems) [33] are less attractive for practical realization because of their high cost, hardware complexity, and maintenance requirements. So, we focus here on static configurations only. Static configurations can be classified into five categories: string converters, multi-string converters, central converters, individual converters, and parallel converters, as shown in Figure 3. Each configuration has its own advantages and limitations, which are discussed as follows.
Figure 3.
Classification of PV configurations for partial shading mitigation.
- (i)
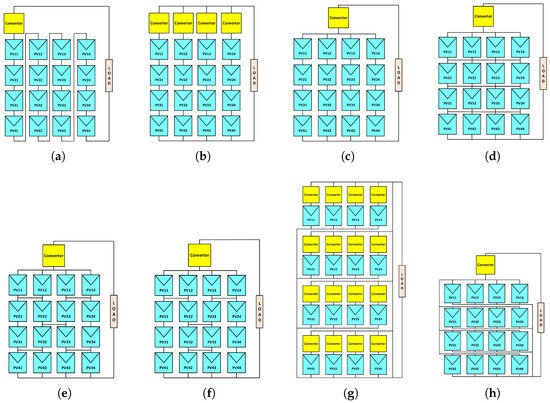
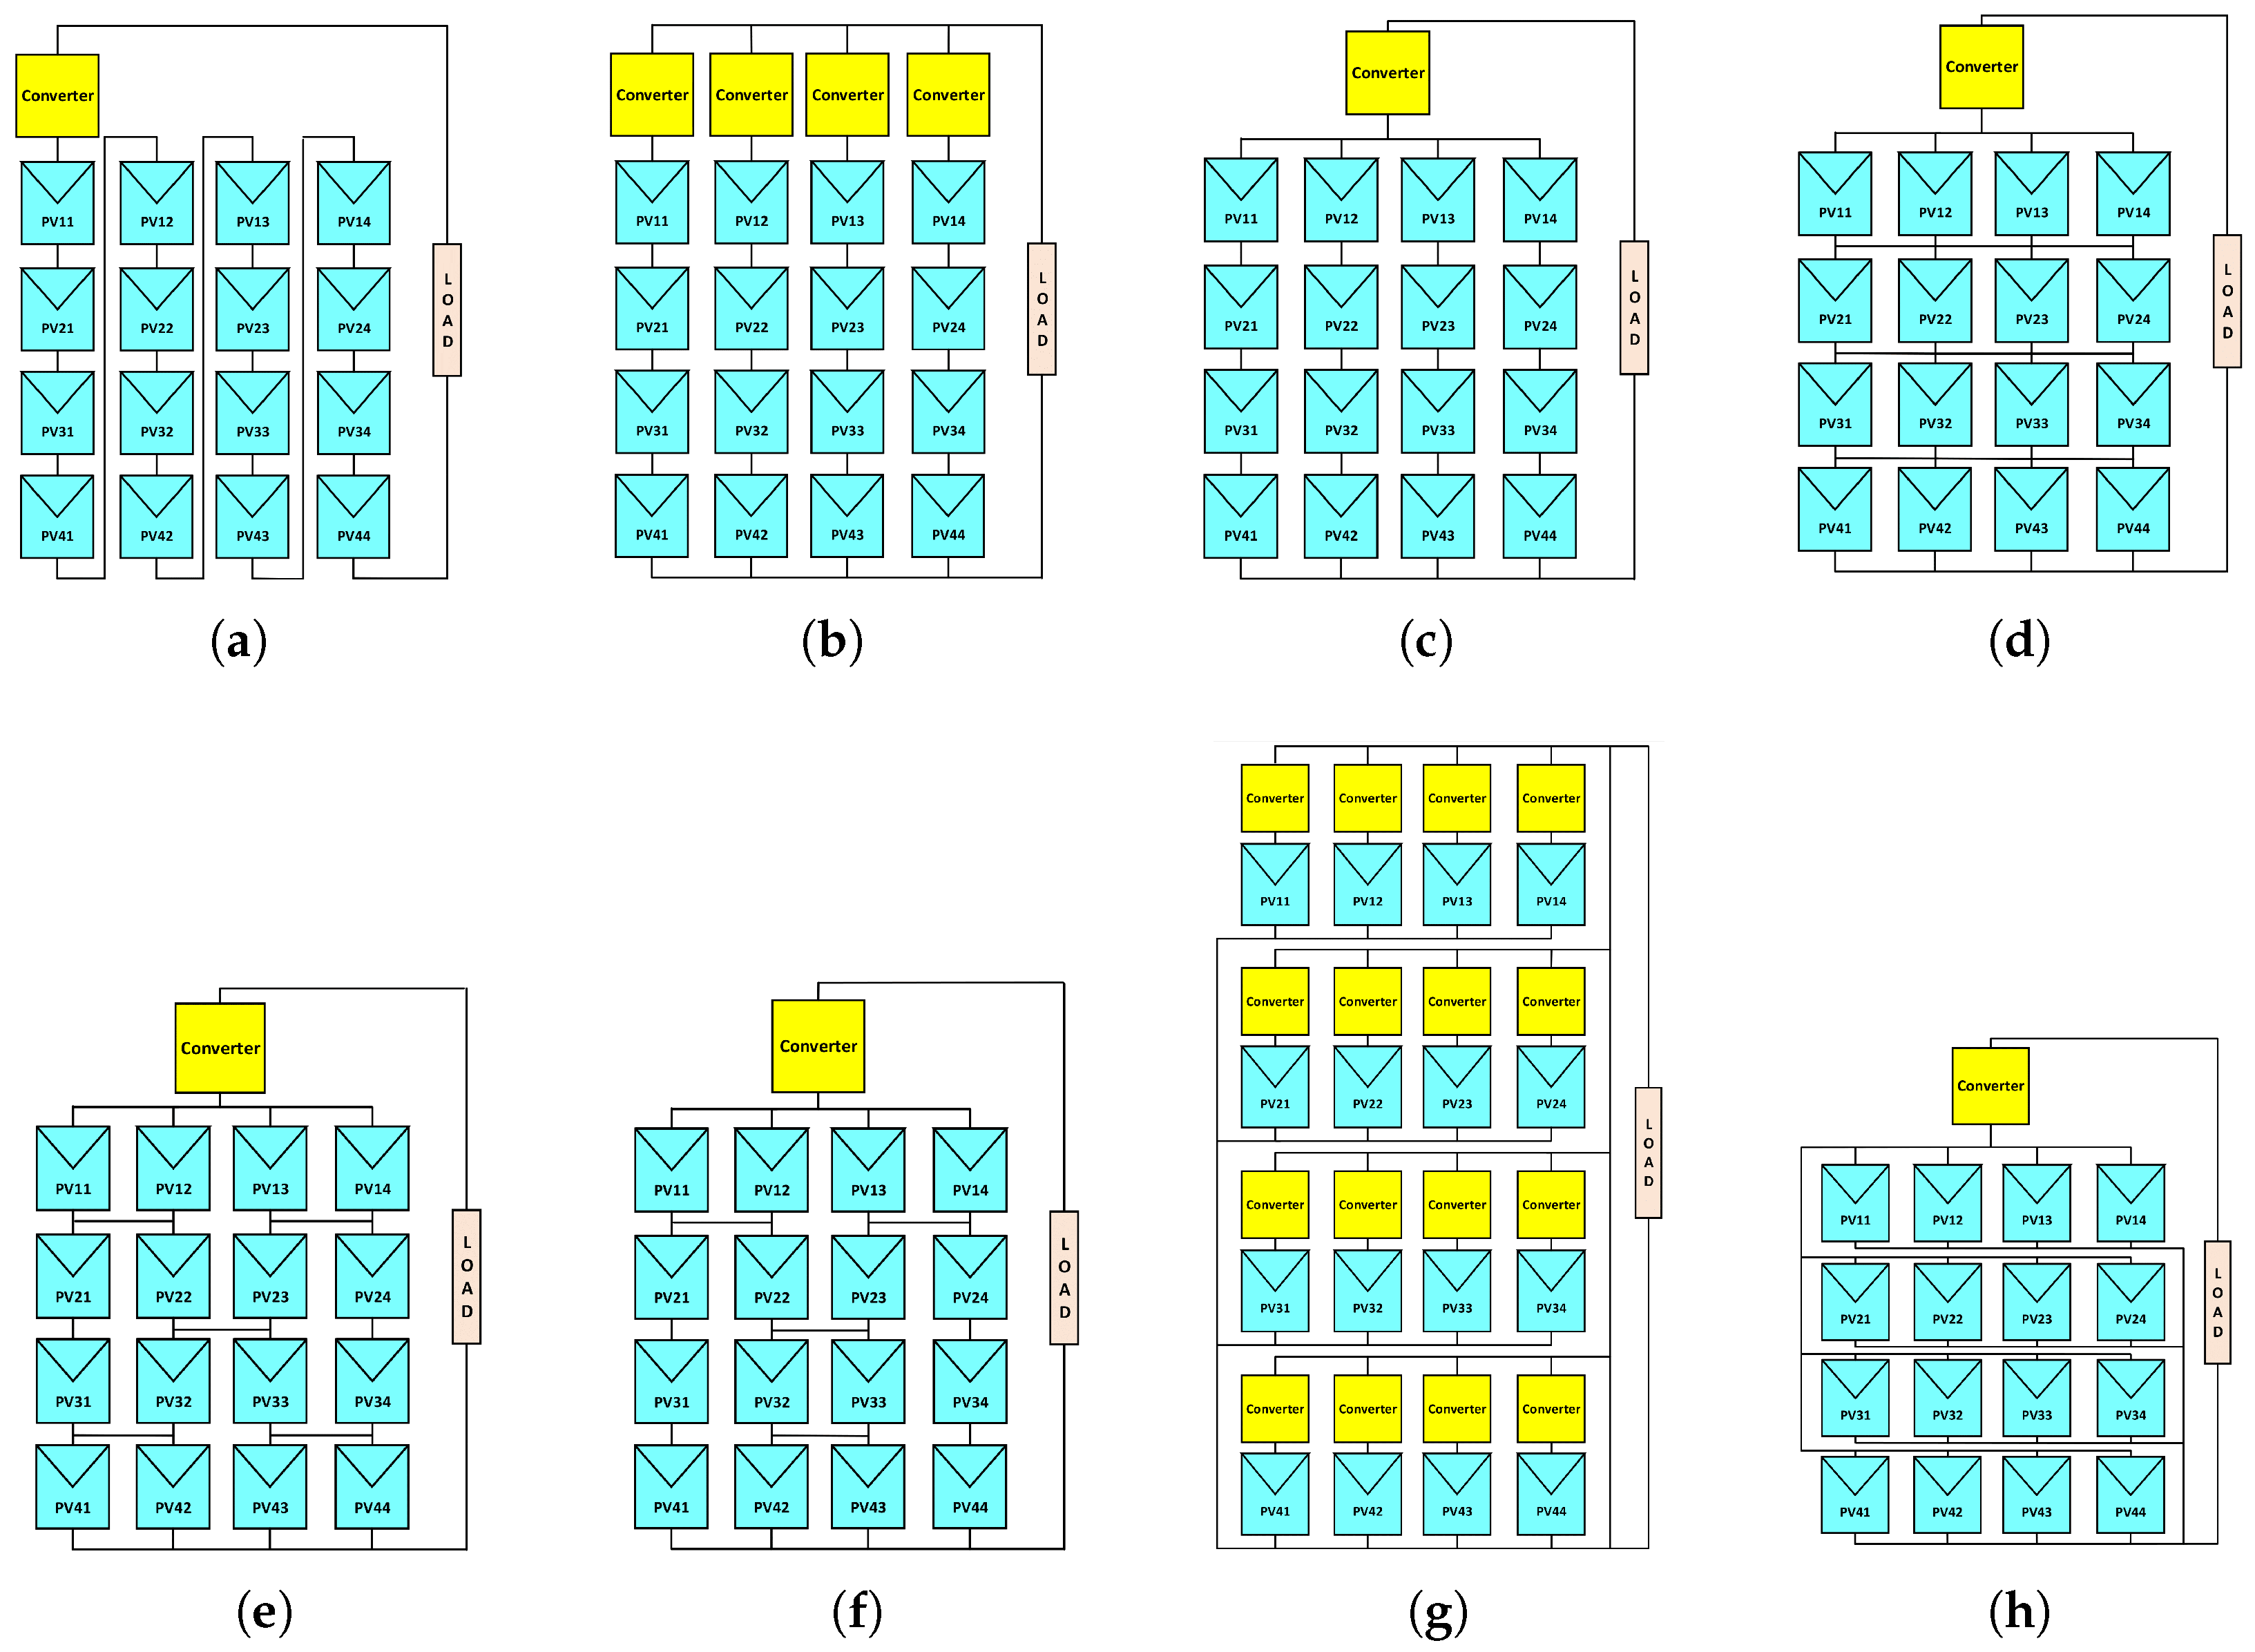
- String Converter: A schematic diagram of a string-connected converter is shown in Figure 4a. In this type of configuration, all PV panels are connected in series [34,35]. In this configuration, the overall output power is strictly dependent on the lowest of the individual contributions of the panels connected to the string. If any of the panels in the array is shaded, it will restrict the overall current flow in the string, and hence adversely affect the output of the overall system. The shaded panel suffers from power dissipation, resulting in the formation of hot spots. To prevent these hot spots, bypass diodes are used for the current to bypass a certain panel [36]. However, the output remains well below the optimal level. String-connected converters are typically used when elevated voltage levels are needed [37] and are better suited in situations without shading.Figure 4. Illustrations of different PV array configurations with converters. (a) String Converter. (b) Multi-String Converter. (c) Series-Parallel Central Converter. (d) Total-Cross-Tied Central Converter. (e) Bridge-Linked Central Converter. (f) Honey-Comb Central Converter. (g) Individually Connected Converter. (h) All Parallel Connected Converter.
- (ii)
- Multi-String Converter: The schematic of a multi-string converter is shown in Figure 4b. It can be seen that panels are connected in series, similar to the string converter [38], but the difference is that there are multiple strings with their converters. Partial shading of one of the panels affects the output of a string. Multi-string configuration offers improvement but does not completely resolve the issue. As compared to the string converter, multi-string has higher hardware and control complexity, leading to higher cost. In order to improve the performance of a multi-string converter, a centralized control with a multi-dimensional MPPT algorithm is presented in [39]. It improves the power efficiency of the multi-string converter to some extent, but in the case of partial shading, no major improvement is recorded.
- (iii)
- Central Converters: This configuration has a single converter like the string converter. But unlike the string connection, all the panels are not connected in series. PV panels are arranged in a matrix with different series parallel connections [40]. In the literature, there are four common variants of configurations with a central converter: series-parallel (SP), bridge-linked (BL), honeycomb (HC), and total-cross-tied (TCT), as shown in Figure 4c–f. In the SP configuration shown in Figure 4c, a certain number of panels are connected in series, and then multiple series-connected strings are connected in parallel [41]. In the TCT configuration shown in Figure 4d, all the panels are interconnected in the matrix form [42]. In the BL configuration shown in Figure 4e, a bridge-like linkage of the panels is used [43]. The HC configuration shown in Figure 4f is a variant of BL configuration [44]. The central converter configuration is simple and practical for a variety of situations. Its different variants perform well in certain shading situations but may perform poorly in others. They are much better than multi-string configurations, but they may not be treated as universally optimal solutions.
To improve the performance of these aforementioned central converter configurations, the literature has suggested reconfiguration schemes as shown in Figure 3. In the reconfiguration schemes, all the panels are interconnected using switches. The panels are then electrically connected in different configurations based on predefined algorithms. The implementation of most of these reconfigurations are not practically feasible because of hardware complexity and resource requirements. The reconfiguration schemes are broadly categorized into static reconfiguration schemes and dynamic reconfiguration schemes. Static reconfiguration schemes involve creating a configuration that remains fixed and cannot be altered once established, such as sudoku [45], optimal sudoku [46], magic square [47], futoshiki [48], dominance square [49], odd–even [50], skycraper [51], loshu [52], latin square [53]. On the other hand, dynamic reconfiguration schemes employ switches or connections that can be adjusted or changed as per the specific requirements at run time. Examples of dynamic reconfiguration schemes include irradiance equilization [54], rough set theory [55], and optimized configuration [56]. However, these reconfiguration approaches are not practically opted because of hardware complexity.
- (iv)
- Individually Connected Converters: The schematic of an individually connected converter is shown in Figure 4g. In this configuration, each panel has its own dedicated converter. Therefore, each panel optimizes its power independently [57,58,59]. This scheme provides the best performance to harvest the maximum power. Moreover, the configuration is scalable, and the maintenance of each module is independent of the others. The main drawback of this individually connected converter is hardware and control complexity leading to high cost [60]. Power optimizers [57,58] and micro-inverters [59] fall in the category of individually connected converter. Under partial shading, these individually connected converters perform better than all other configurations [58].
- (v)
- All Parallel Converters: The schematic of an all-parallel connected converter is shown in Figure 4h. In this configuration, there is only one converter, and all panels are connected in parallel [61]. In this configuration, each panel operates independently and contributes its current to a common node. Hence, shading on one panel does not affect the performance of other panels. However, this configuration is rarely seen in practice because all the currents from the parallel-connected panels are summed up to a high total current. It causes significant Joule loss in the conductors and requires thick conductors resulting in high cost.
Table 1 summarizes the advantages and disadvantages of the four commonly used PV configurations. The string converter is cost-effective but very susceptible to partial shading. The central converter performs well under some shading patterns, like long narrow and diagonal, but it is still not a universally optimal solution. Power optimizers and micro-inverters give optimal performance in terms of efficiency under partial shading; however, they come with increased hardware complexity and cost. To address these issues, a novel parallel-series converter topology is proposed in the next section.
Table 1.
Advantages and disadvantages of four common PV configurations for partial shading conditions.
3. Proposed Methodology
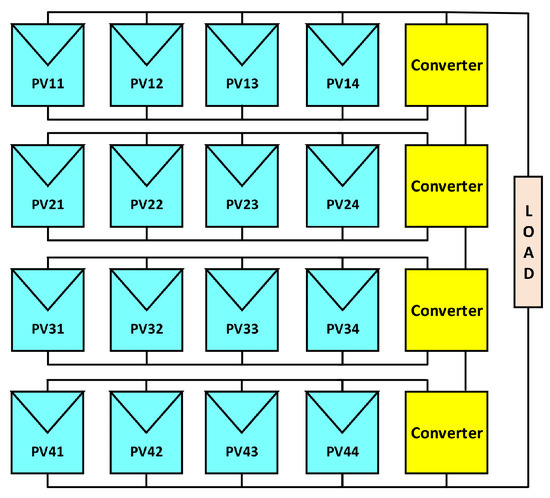
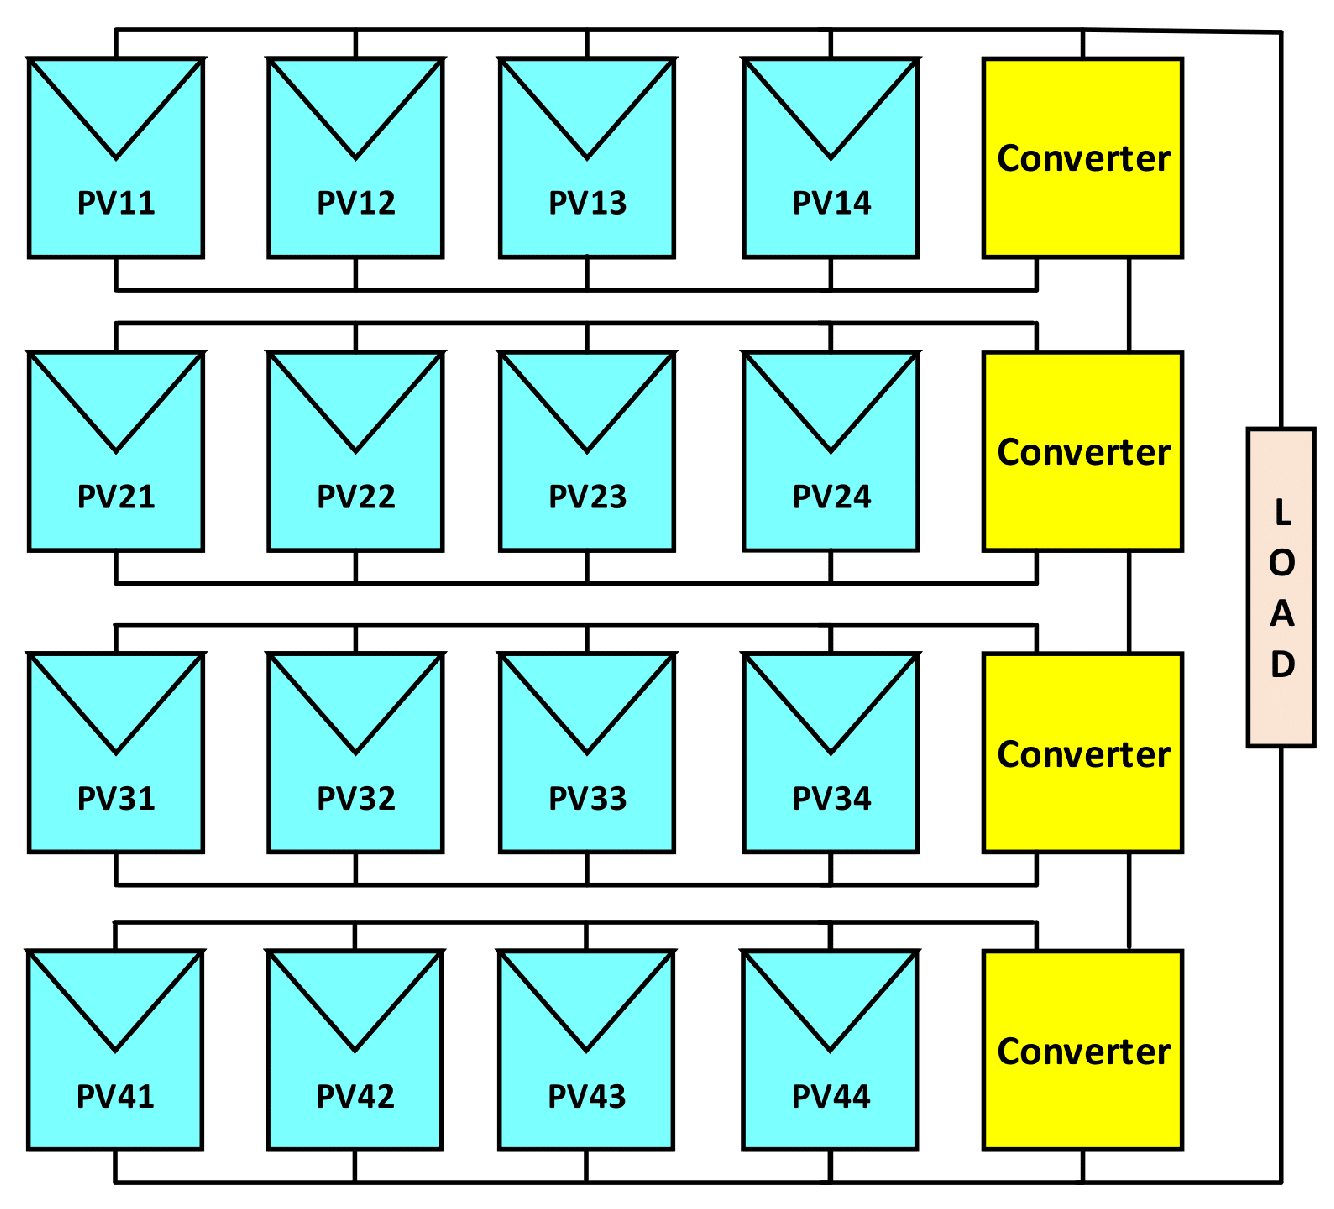
This section presents the proposed parallel-series PV configuration. The main idea exploits the inherent property of PV cells that the maximum power point (MPP) voltage changes very little with irradiance, while the MPP current scales proportionally to the irradiance. Connecting multiple PV panels in parallel, therefore, ensures that each panel in a row operates at a common near-optimal terminal voltage despite receiving different levels of irradiance, completely eliminating the series current-blocking mismatch that degrades string-connected configurations. This idea leads to our proposed parallel-series configuration shown in Figure 5. Multiple such parallel rows are then connected in series through minimal DC-DC converter stages (each comprising only an input capacitor, a MOSFET switch, and a bypass diode), and a single shared LC output filter serves the entire series stack. This arrangement achieves near power-optimizer performance with a hardware count that matches multi-string converters in all respects except the number of inductors—the proposed topology requires only one inductor regardless of the array size. Hence, this makes the proposed topology superior to the existing methods.
Figure 5.
Schematic diagram of the proposed parallel-series PV configuration for improved mismatch loss mitigation.
A row of parallel-connected PV panels is the building block of the proposed parallel-series configuration. In the case of parallel-connected PV panels, shading of a PV panel does not impact the performance of other panels. Each panel operates independently in parallel, similar to the operation of power optimizers. Thus, shading affects only the panel that is shaded, while the others continue to perform optimally. Hence, the proposed parallel-series configuration offers the efficiency equal to the power optimizers, however, with a reduced hardware complexity and cost.
Compared to an all-parallel PV configuration, the proposed parallel-series configuration offers a practical solution with reduced power losses while retaining high efficiency. In the case of an all-parallel PV configuration, all the PV modules are connected in parallel, resulting in a large current and, in turn, a high cost of conductors. This issue is mitigated by a series connection of multiple converters to increase the overall output voltage and reduce current for a lower cost of conductors and lower Joule losses.
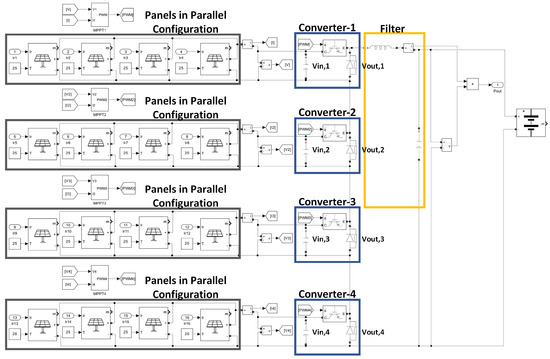
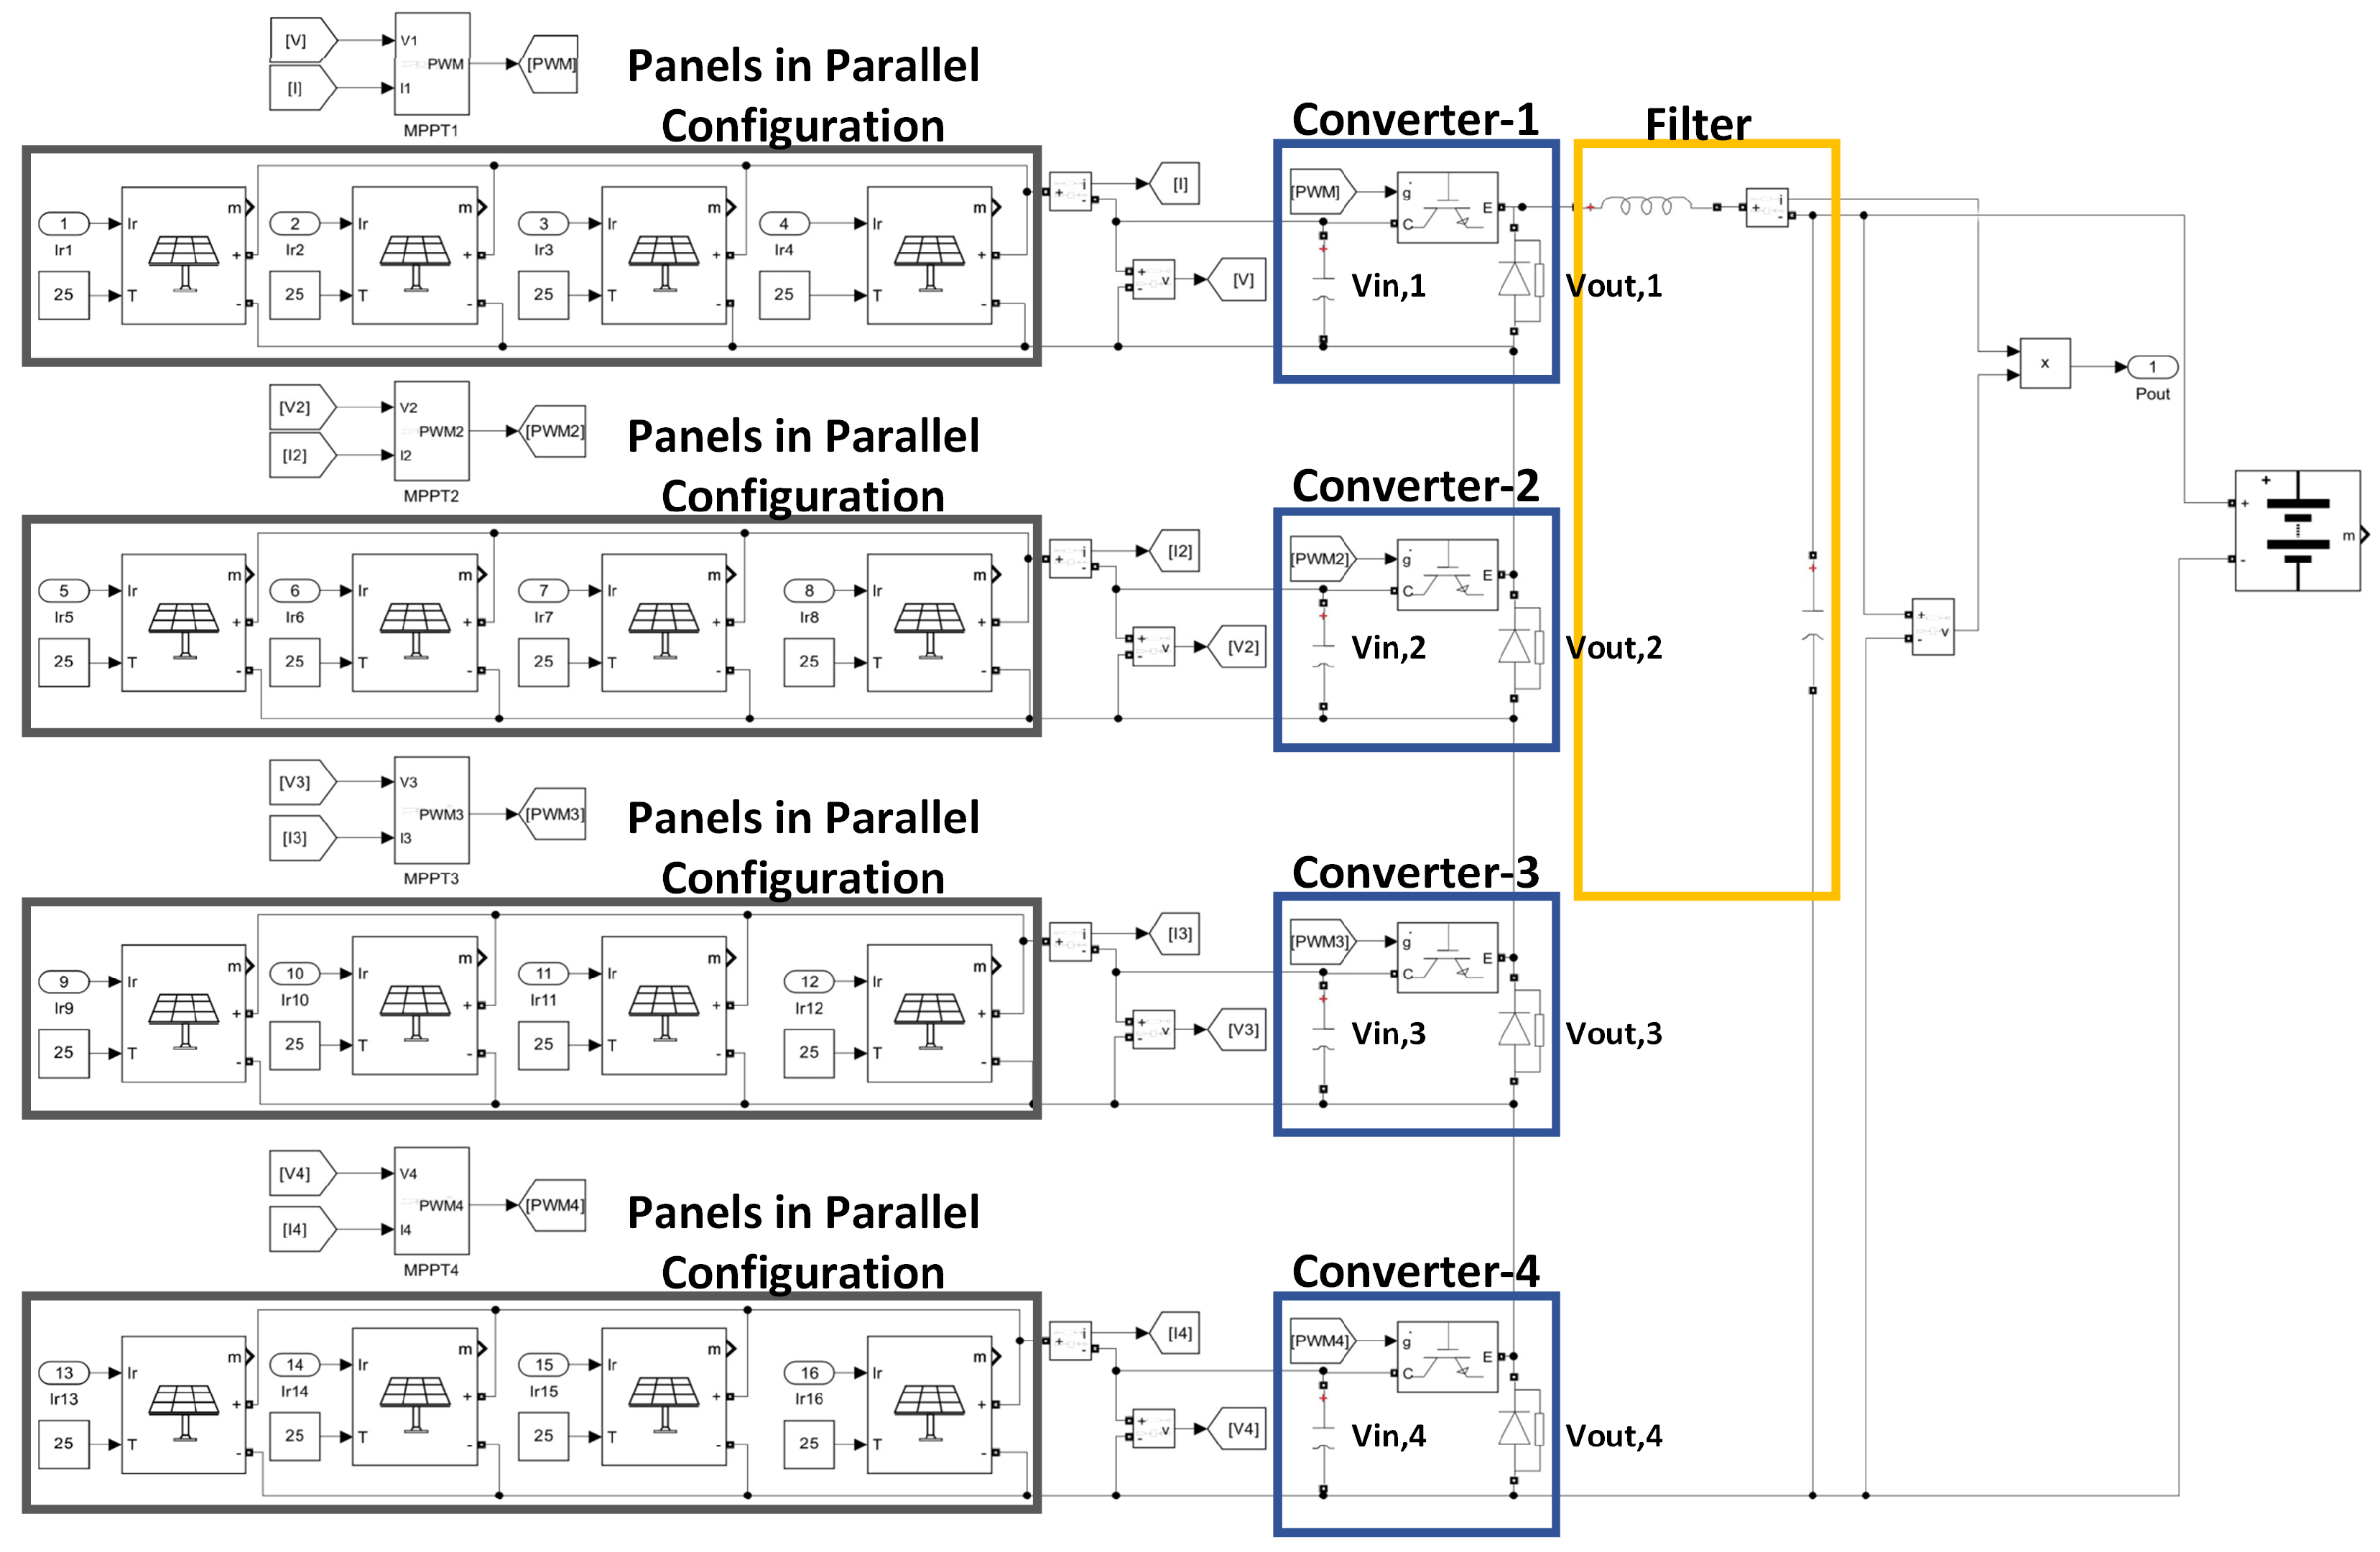
The proposed configuration uses multiple converters, like multi-string converters; however, each converter is connected in parallel to a set of parallel-connected PV modules. As shown in Figure 6, each converter stage operates as a buck-type DC-DC converter. During the ON state of the MOSFET switch, the parallel-connected PV panels and the capacitor contribute current into the series stack while the bypass diode is reverse-biased. During the ON time of the MOSFET switch, the capacitor discharges, and the terminal voltage across the parallel-connected PV row decreases. During the OFF state, the capacitor is charged by the PV panels, and the PV terminal voltage increases. Meanwhile, the bypass diode provides a freewheeling current path for the series stack current, maintaining continuity. The capacitor with its terminal voltage (named as as shown in Figure 6) appears in parallel to the MOSFET switch or the diode (the one that is OFF while the other is ON). Hence, the maximum voltage across the MOSFET and the diode is . The maximum value of the capacitor voltage is bounded by of the PV panels, irrespective of the switching state, irradiance, the control algorithm’s performance, and the load. Hence, the MOSFET and the diode with a voltage rating greater than are safe and will not suffer from overvoltage breakdown. The simulation results under dynamic shading conditions are presented in the next section to validate this fact.
Figure 6.
SIMULINK diagram of the proposed configuration for a 4 × 4 PV array.
The charging and discharging rates are determined by the current produced by the PV row and the load current, respectively. The duty cycle is controlled by the MPPT algorithm to adjust the effective terminal voltage of the parallel PV row to its maximum power point. In steady-state continuous conduction mode (CCM), the voltage gain of each single stage is , where is the duty cycle set by the MPPT; consequently, the total series-stack output voltage is , where N is the number of converter stages. The shared LC filter at the series stack output smooths the combined voltage and current waveforms to supply a stable DC output. This arrangement enables each converter stage to operate independently under its own MPPT controller while sharing a single common filter, which is a significant hardware simplification relative to multi-string and power-optimizer architectures. In this way, the proposed parallel-series PV configuration combines the benefits of parallel connection and shared converters. The proposed configuration provides an efficient and cost-effective solution that mitigates the effects of partial shading while maintaining high performance.
For MPPT, each converter is controlled separately and independently. As there is no bypass diode in the row of parallel-connected PV panels, and since all panels within a row share the same terminal voltage, the combined P-V curve of each parallel row is smooth and unimodal. This holds because partial shading of one panel in the row reduces its current contribution without introducing step discontinuities in the P-V characteristic; the latter are caused specifically by bypass diodes in series-connected strings that are absent here. Therefore, a simple single-peak MPPT controller, such as the standard perturb-and-observe (P&O) method, is fully adequate for each converter stage without any need for global MPPT algorithms. It should be noted that this argument is valid when all panels within a row are of the same type and rating, as specified for the proposed configuration.
4. Performance Analysis of PV Configurations in Simulations
This section evaluates the proposed parallel-series configuration compared to other common PV configurations. For the evaluation/comparison, a 4 × 4 PV array is considered as shown in Figure 5. Initially, the evaluation is performed in simulations, and the circuit diagram implemented in MATLAB/Simulink R2022b is shown in Figure 6. Each PV module has a power rating of 50 W. The panels’ specifications are given in Table 2. The total of all the panels is 800 W. The switching frequency for all simulations is 10 kHz. The P&O MPPT algorithm uses a perturbation of 0.39% in the duty cycle (using an 8-bit register in hardware) with a sampling interval of 50 ms. All simulated configurations use the identical component models within MATLAB/Simulink, ensuring that switching losses, conduction losses, and diode forward voltage drops are modeled symmetrically across all configurations for a fair and unbiased comparison. Simulations are conducted at standard test condition (STC). The irradiance distribution applied to each module under each shading pattern is as depicted in Figure 2 using the color coding in the legend. The performance metrics and the commonly used shading patterns discussed in Section 2.1 and shown in Figure 2 are considered in the evaluation. Moreover, the simulation complexity (equivalent to hardware complexity) in terms of components’ count is summarized in Table 3.
Table 2.
Electrical specifications of PV panels used in the simulation studies.
Table 3.
List of components and their parameters used in the Simulink simulations of the proposed PV configuration.
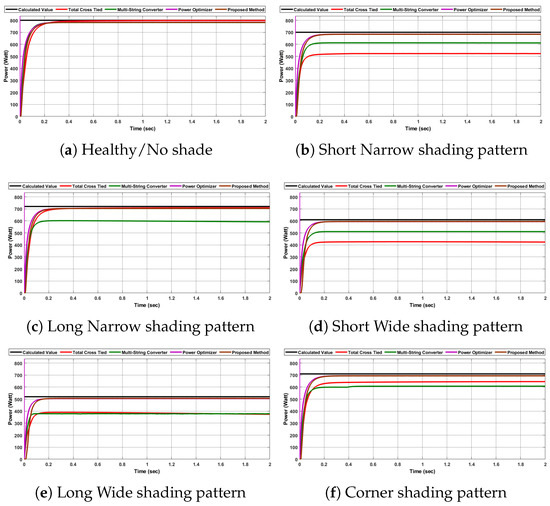
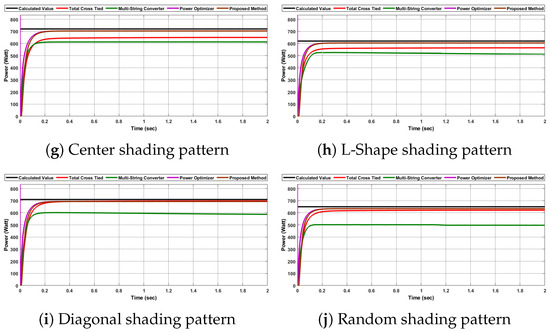
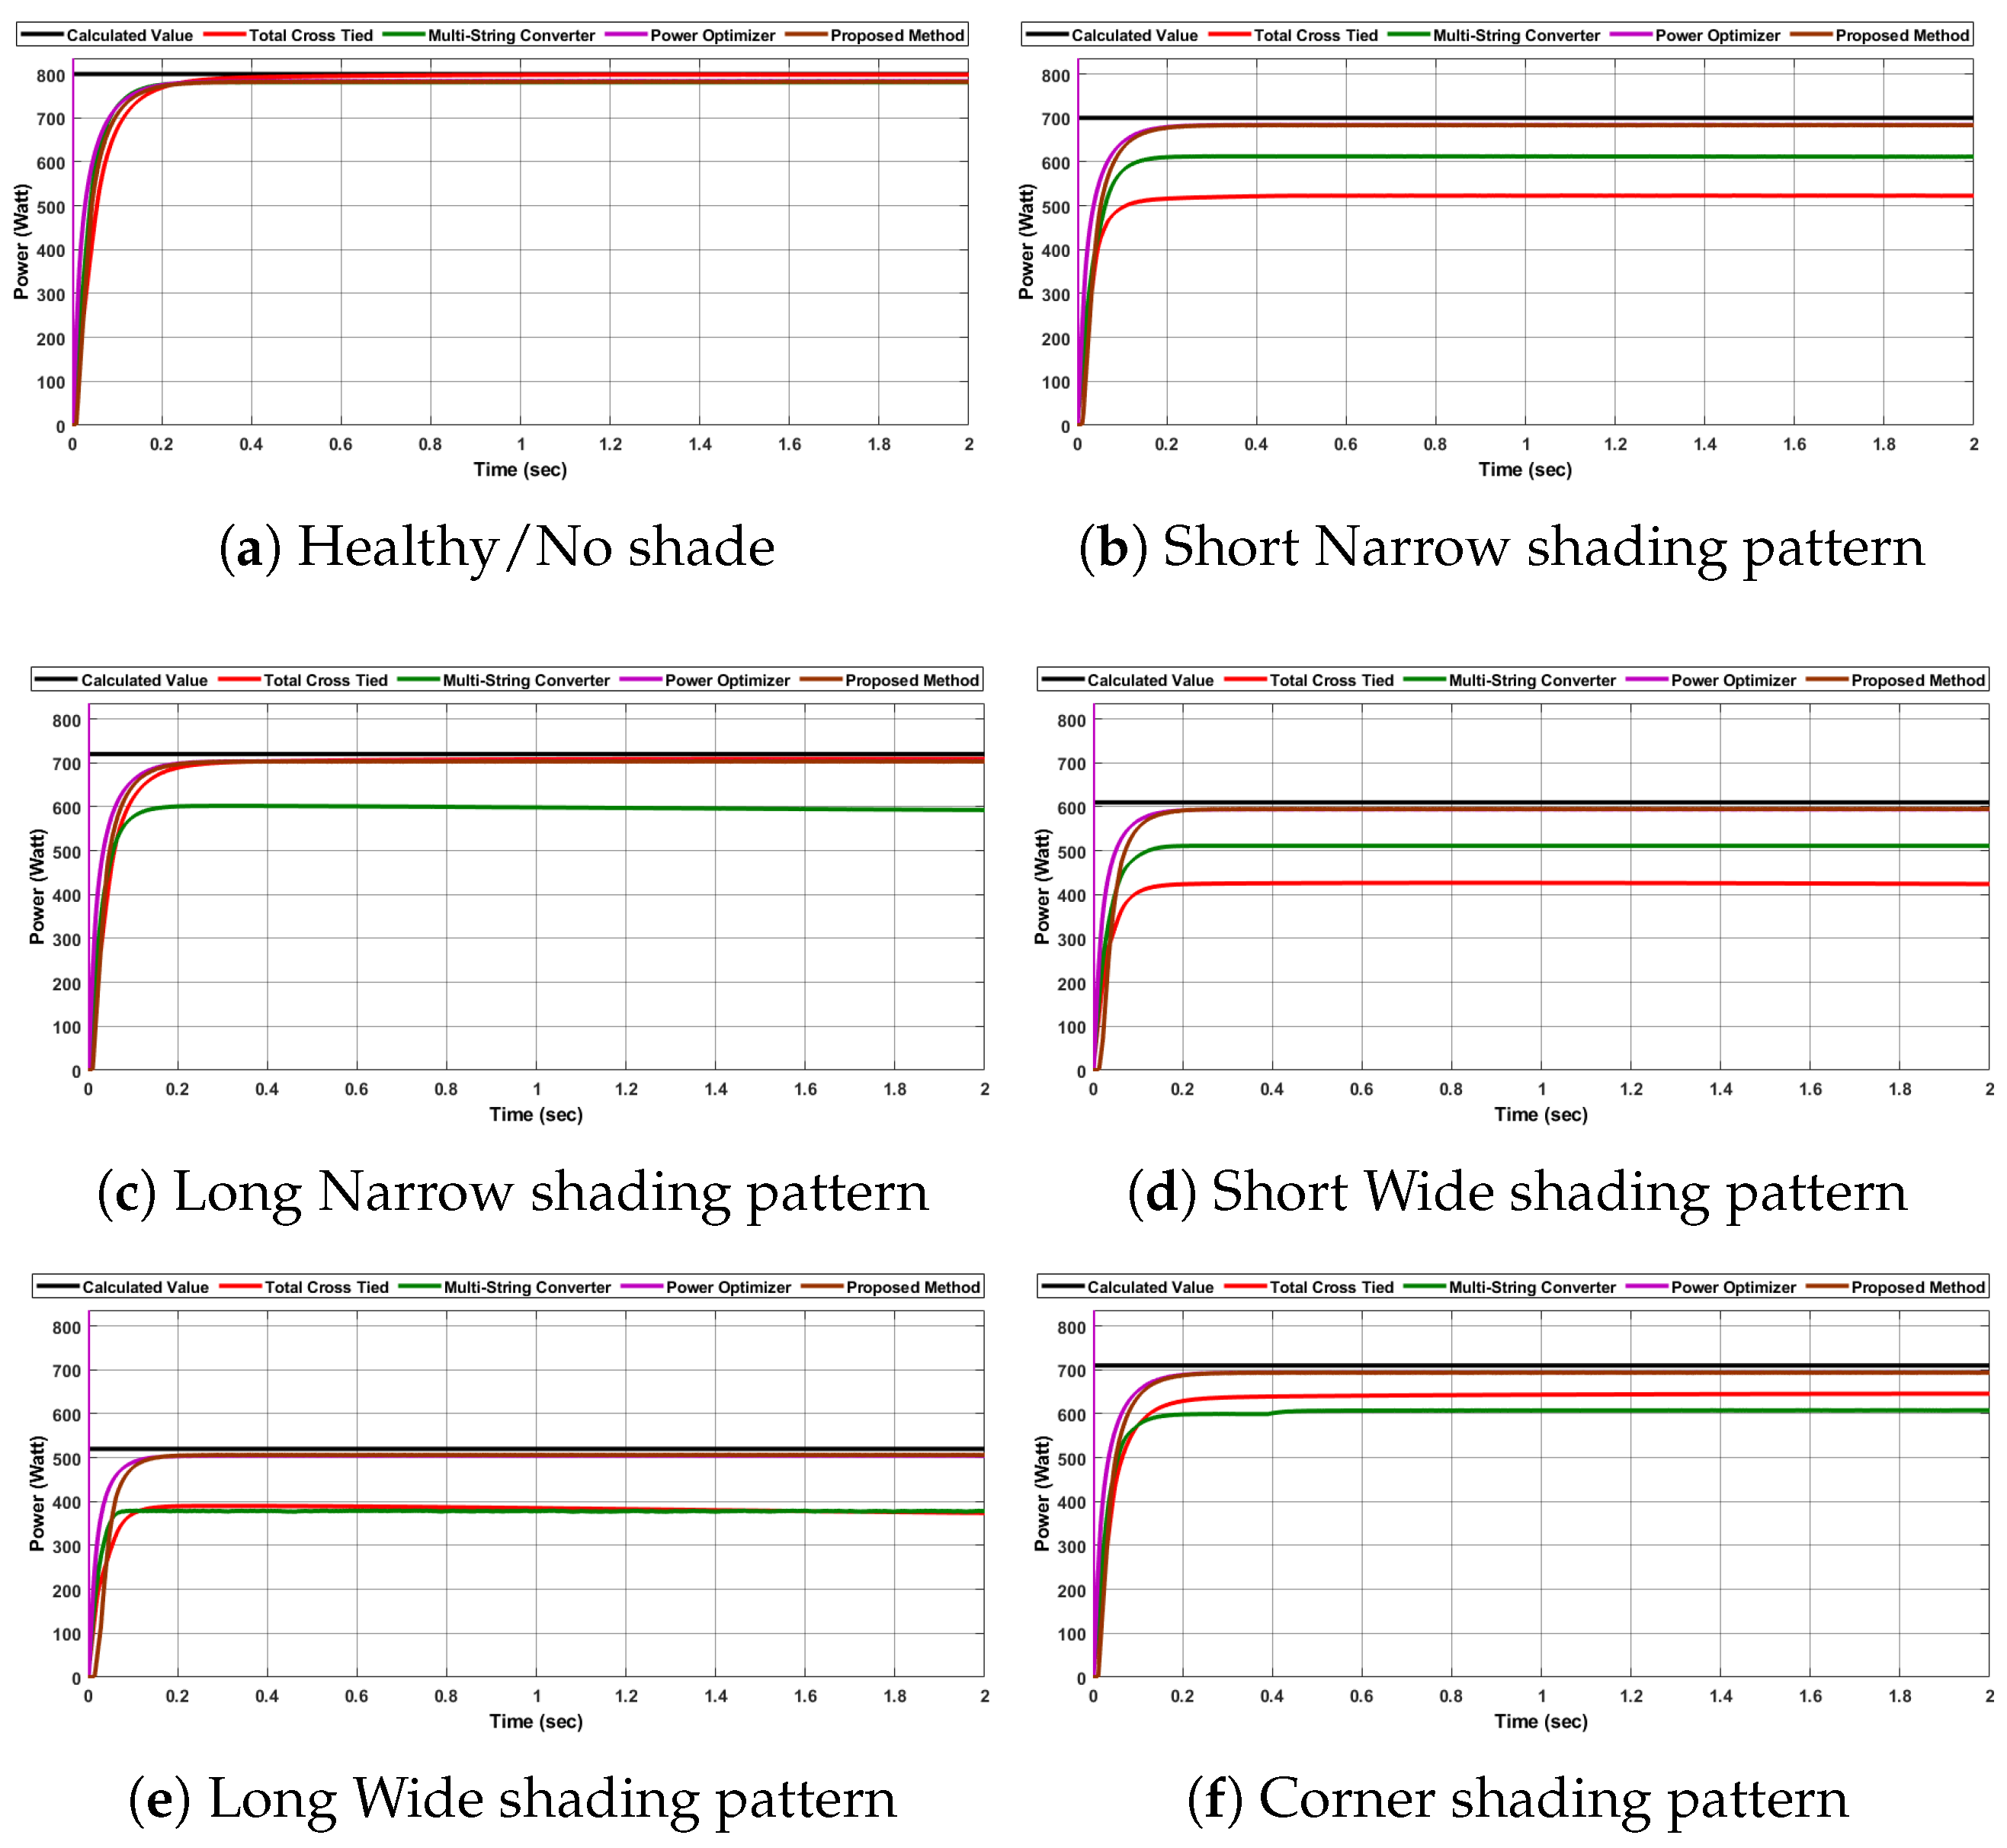
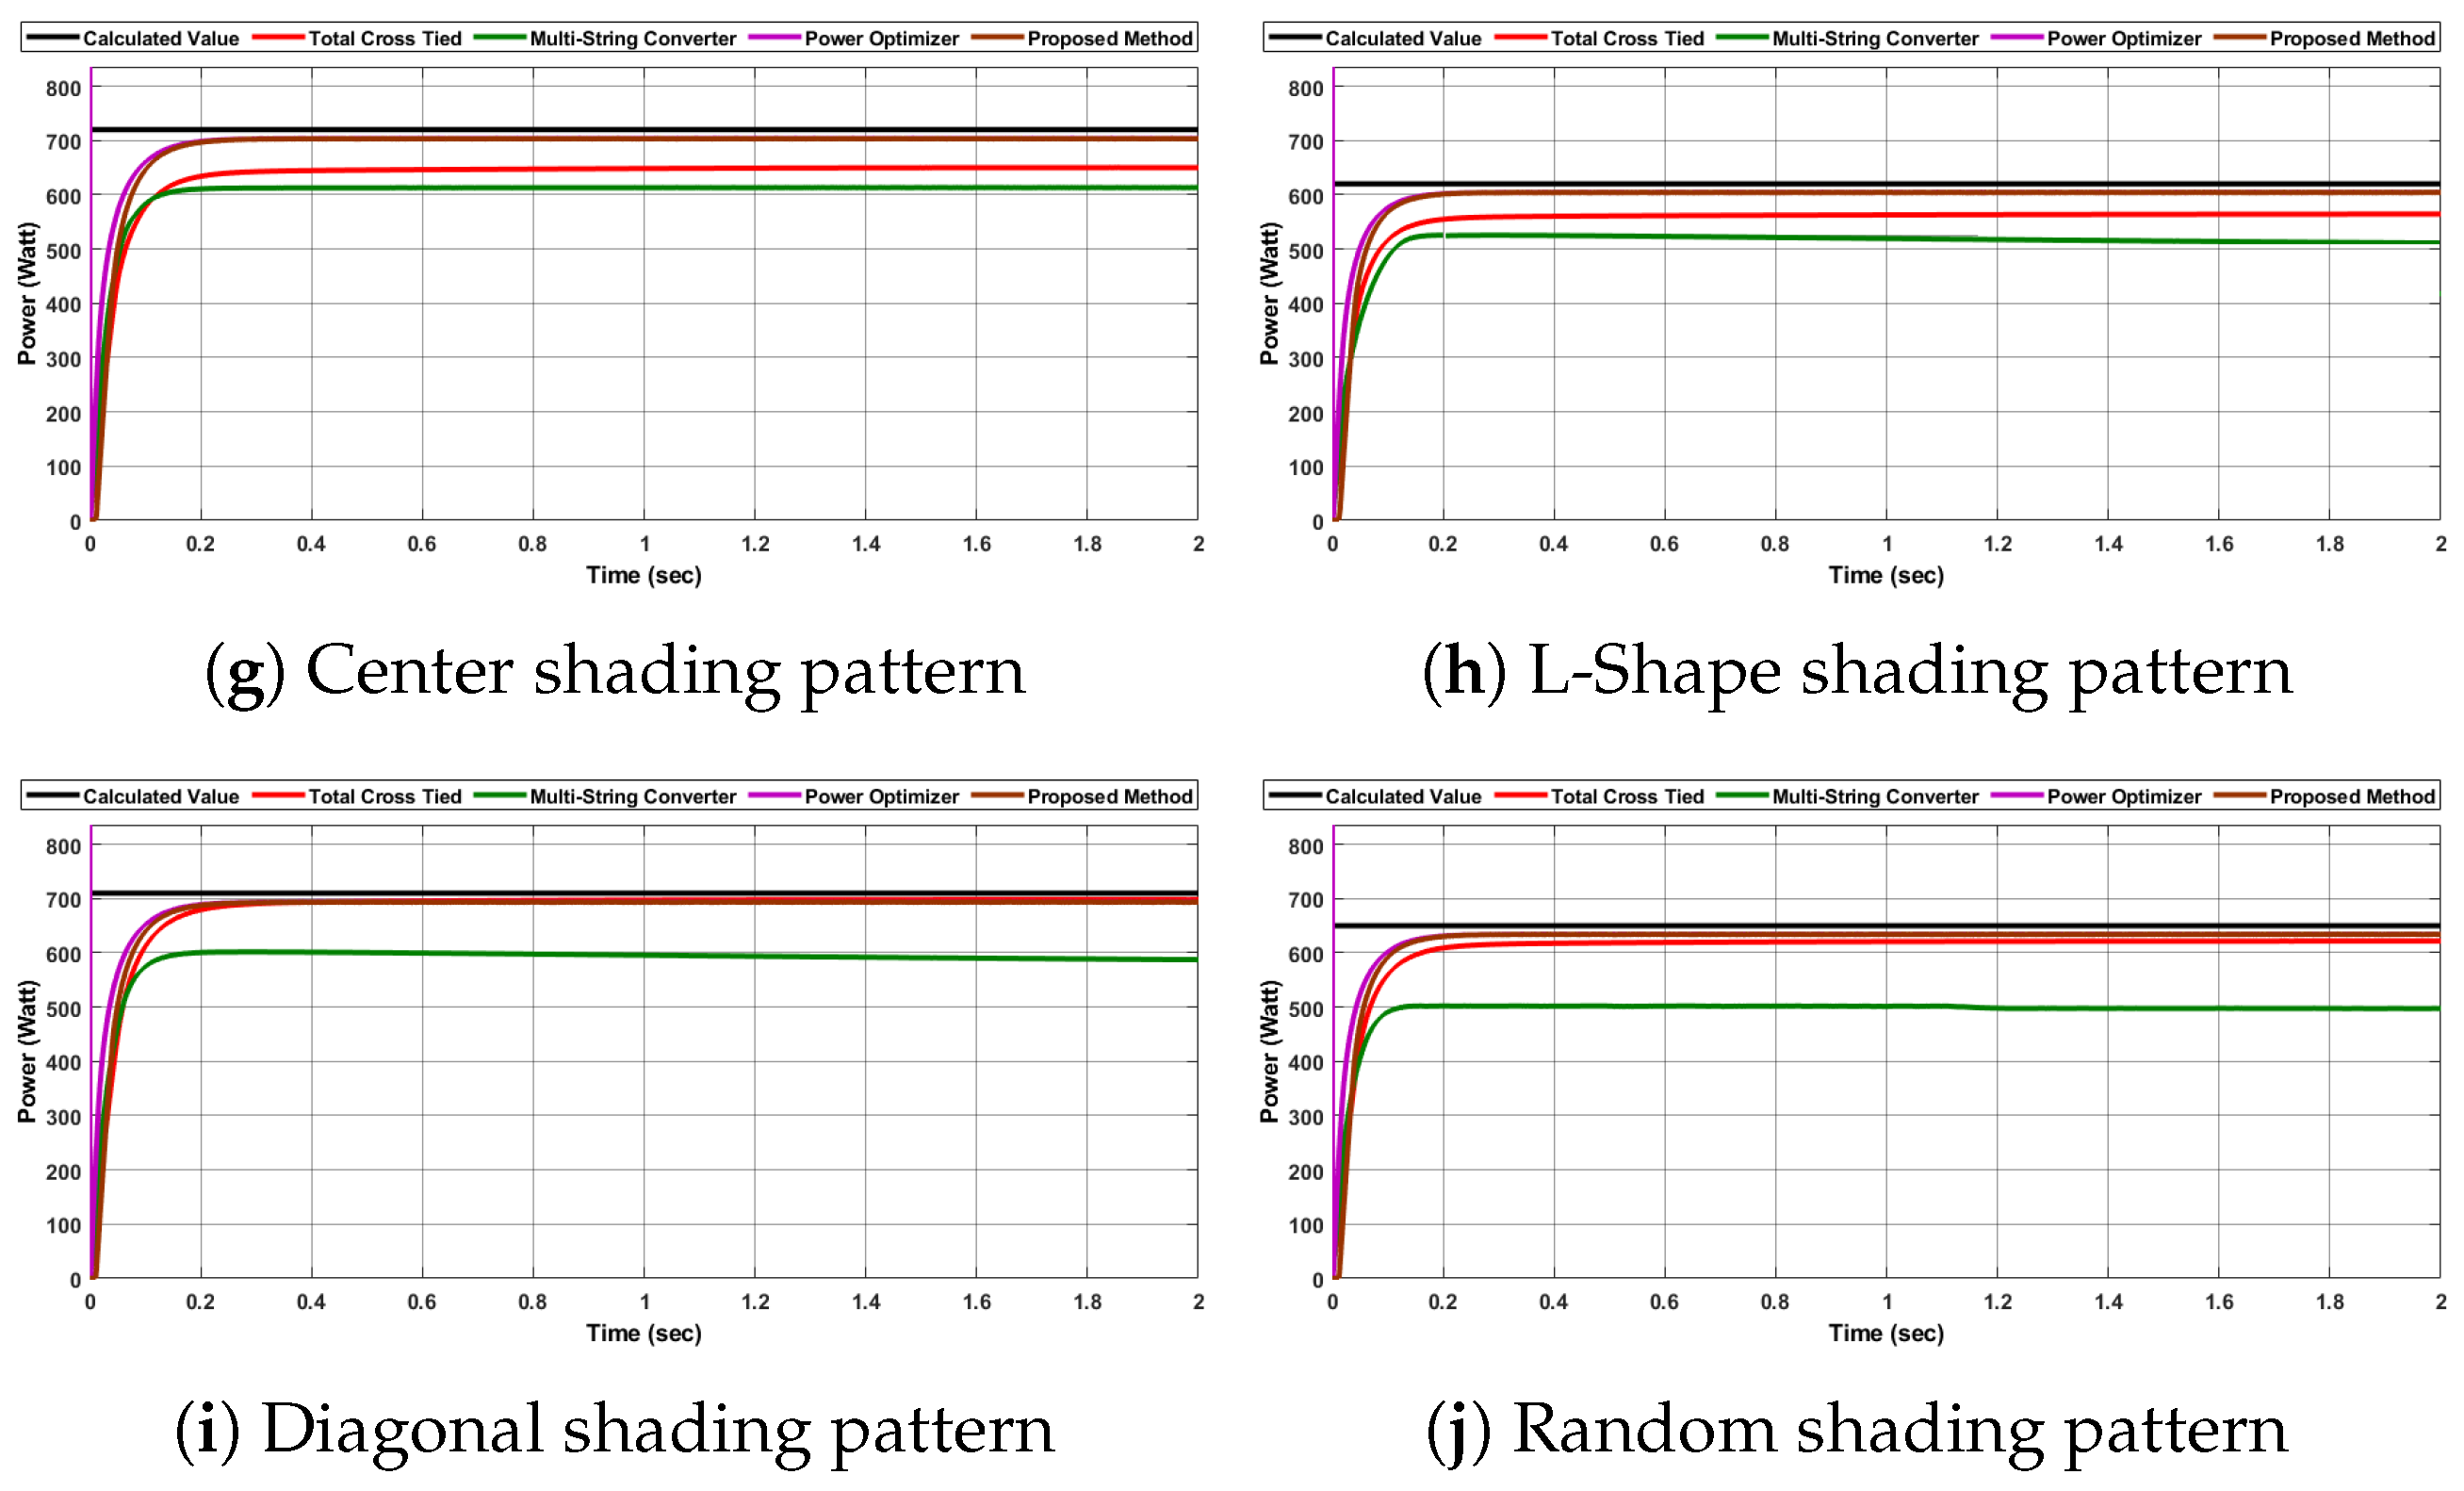
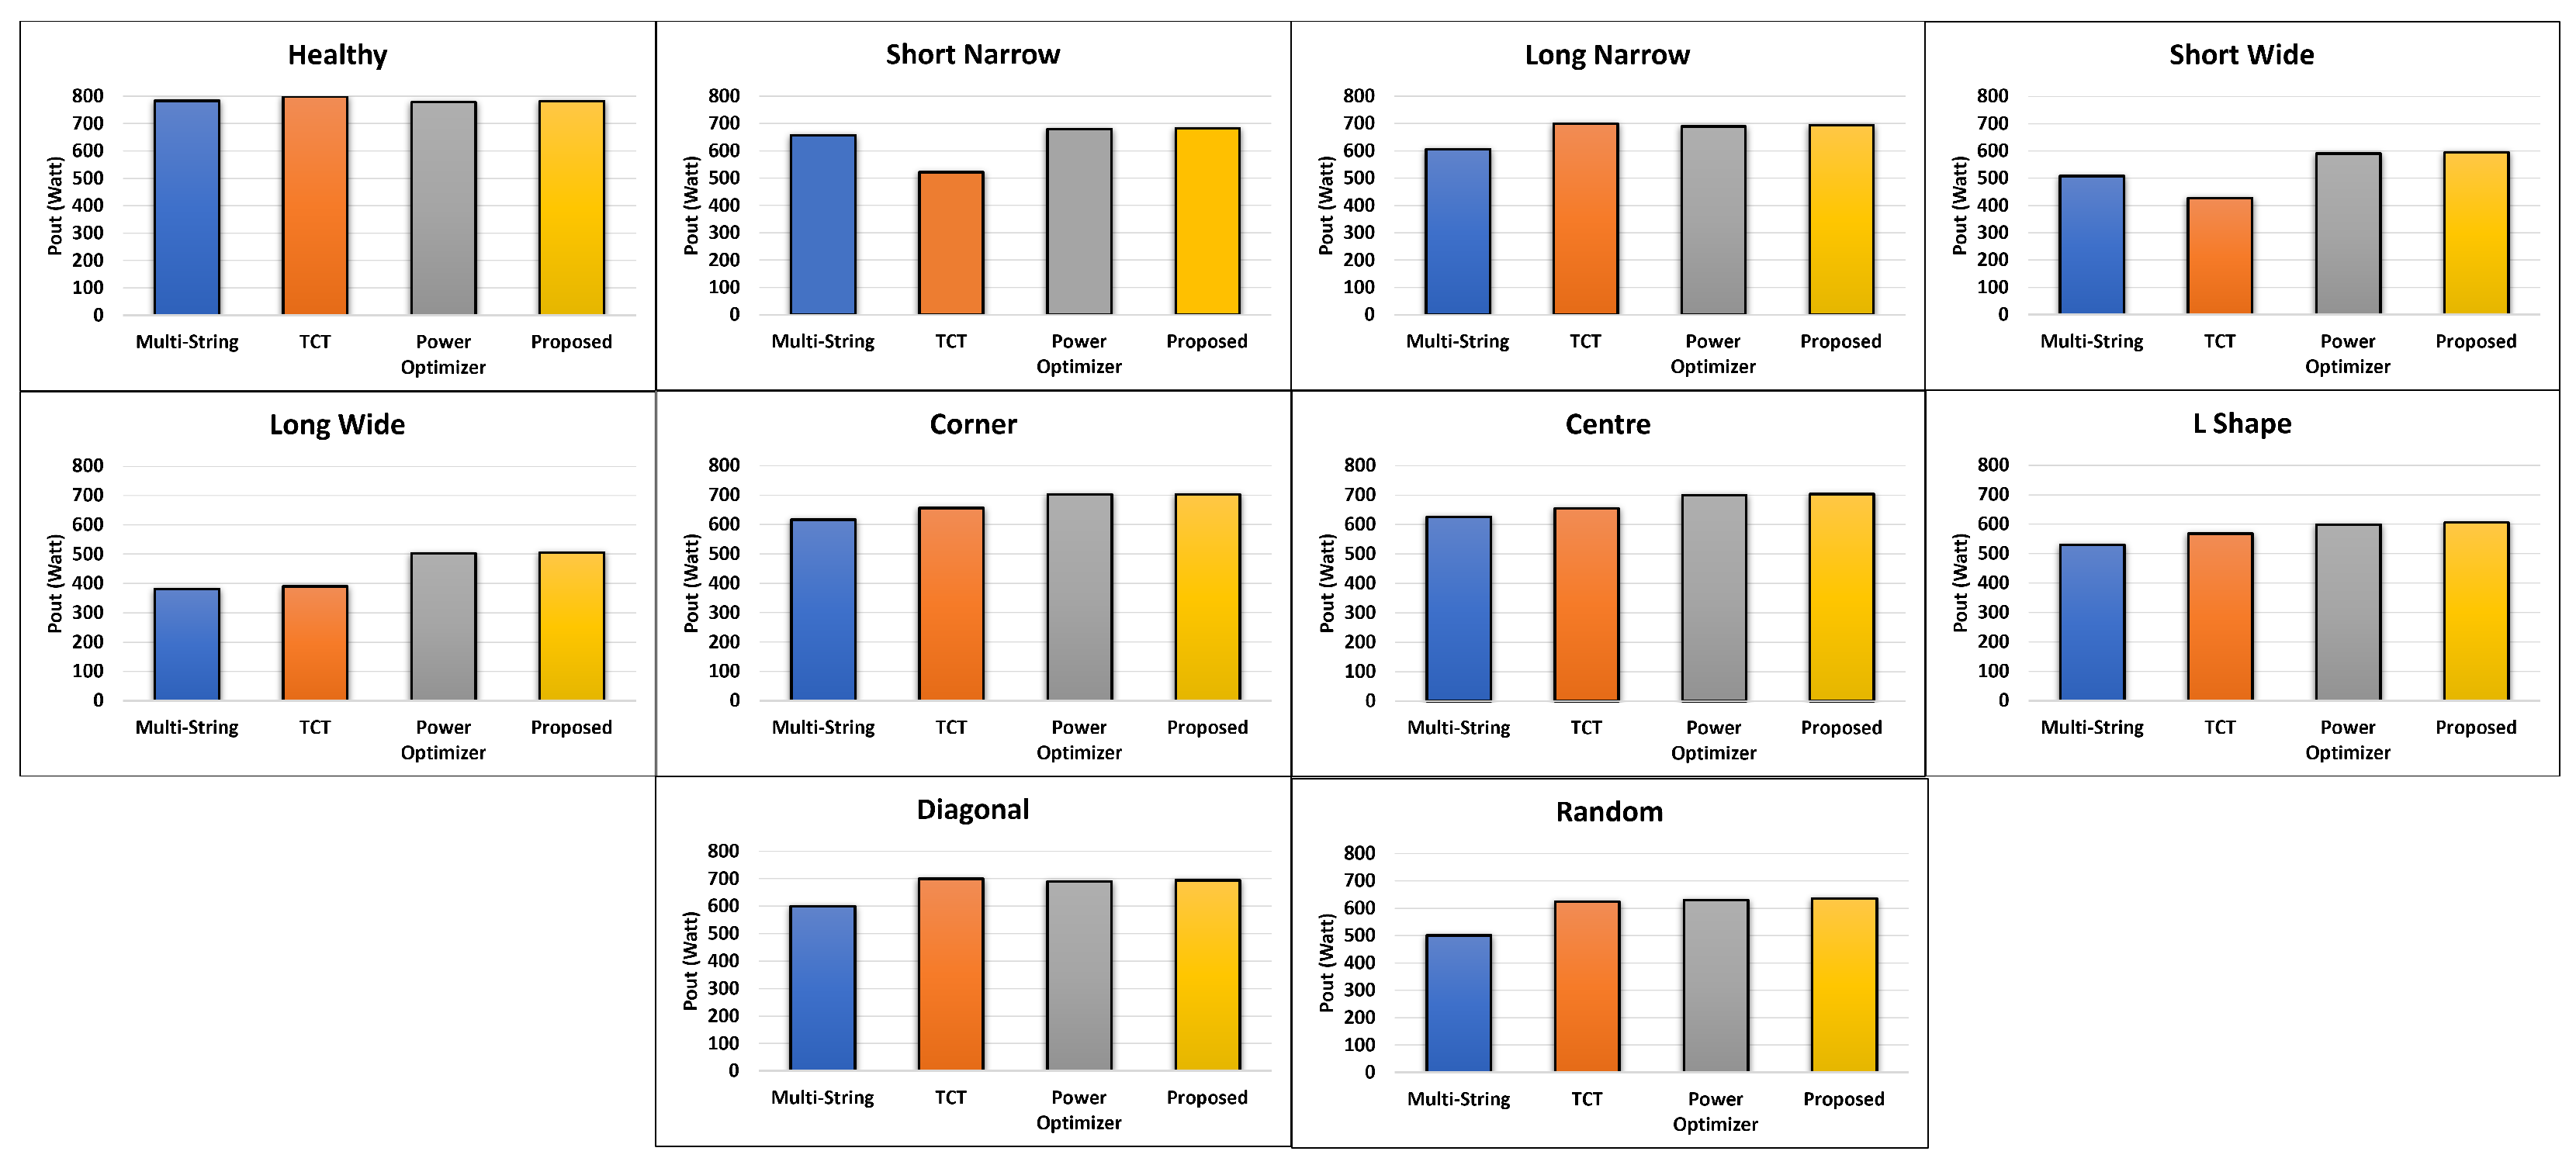
For the proposed comparative evaluation, we considered three PV configurations: multi-string configuration (which is equivalent to the proposed configuration in terms of hardware complexity), total-cross-tied configuration (which is the simplest in terms of hardware with good efficiency), and power optimizers (which result in the best performance at the cost of hardware complexity). Figure 7 shows the time profile of the harvested power according to the simulations’ results for the proposed PV configuration in comparison to the above-mentioned three PV configurations under 10 different shading patterns. The black horizontal line in each graph shows the maximum power generated by the PV array, which is the sum of the individual power generated by each module in the array. In these simulations, the focus is the maximum output power that can be harvested in different PV configurations using an MPPT controller. So the comparison of the best values is presented in Figure 8.
Figure 7.
Simulated output power profiles of different PV configurations under multiple shading patterns.
Figure 8.
Bar chart comparing simulated output power of various PV configurations across multiple shading patterns.
Firstly, healthy or no shaded conditions are considered. All four configurations provide power close to their rated power of 800 W as shown in Figure 7a. Under all the shading patterns as shown in Figure 7, the proposed PV configuration and power-optimizer configuration perform equally good, while multi-string and total-cross-tied configurations perform poorly in most shading patterns.
The performance of the total-cross-tied configuration under long narrow, diagonal, and random shading patterns is close to the proposed and power-optimizer configuration as shown in Figure 7c, Figure 7i, and Figure 7j, respectively. This shows that when shading is evenly distributed among all the rows, the performance of the total-cross-tied configuration is near optimal; otherwise, it fails to mitigate the shading issues effectively. Although the performance of total-cross-tied configurations is better than multi-string configuration under most shading patterns, in short wide shading patterns, multi-string performs better than total-cross-tied configuration as shown in Figure 7d. These simulation results strengthen the argument that total-cross-tied is simple and superior to other PV configurations under many shading patterns; however, it is neither optimal nor the best under all different shading patterns. Contrarily, the power-optimizer PV configuration is the best to give optimal performance under all the shading patterns; however, its hardware complexity and cost make it less attractive. The proposed parallel-series PV configuration is equally good in its performance as compared to the power-optimizer configuration, but it offers much simpler hardware and a lower cost.
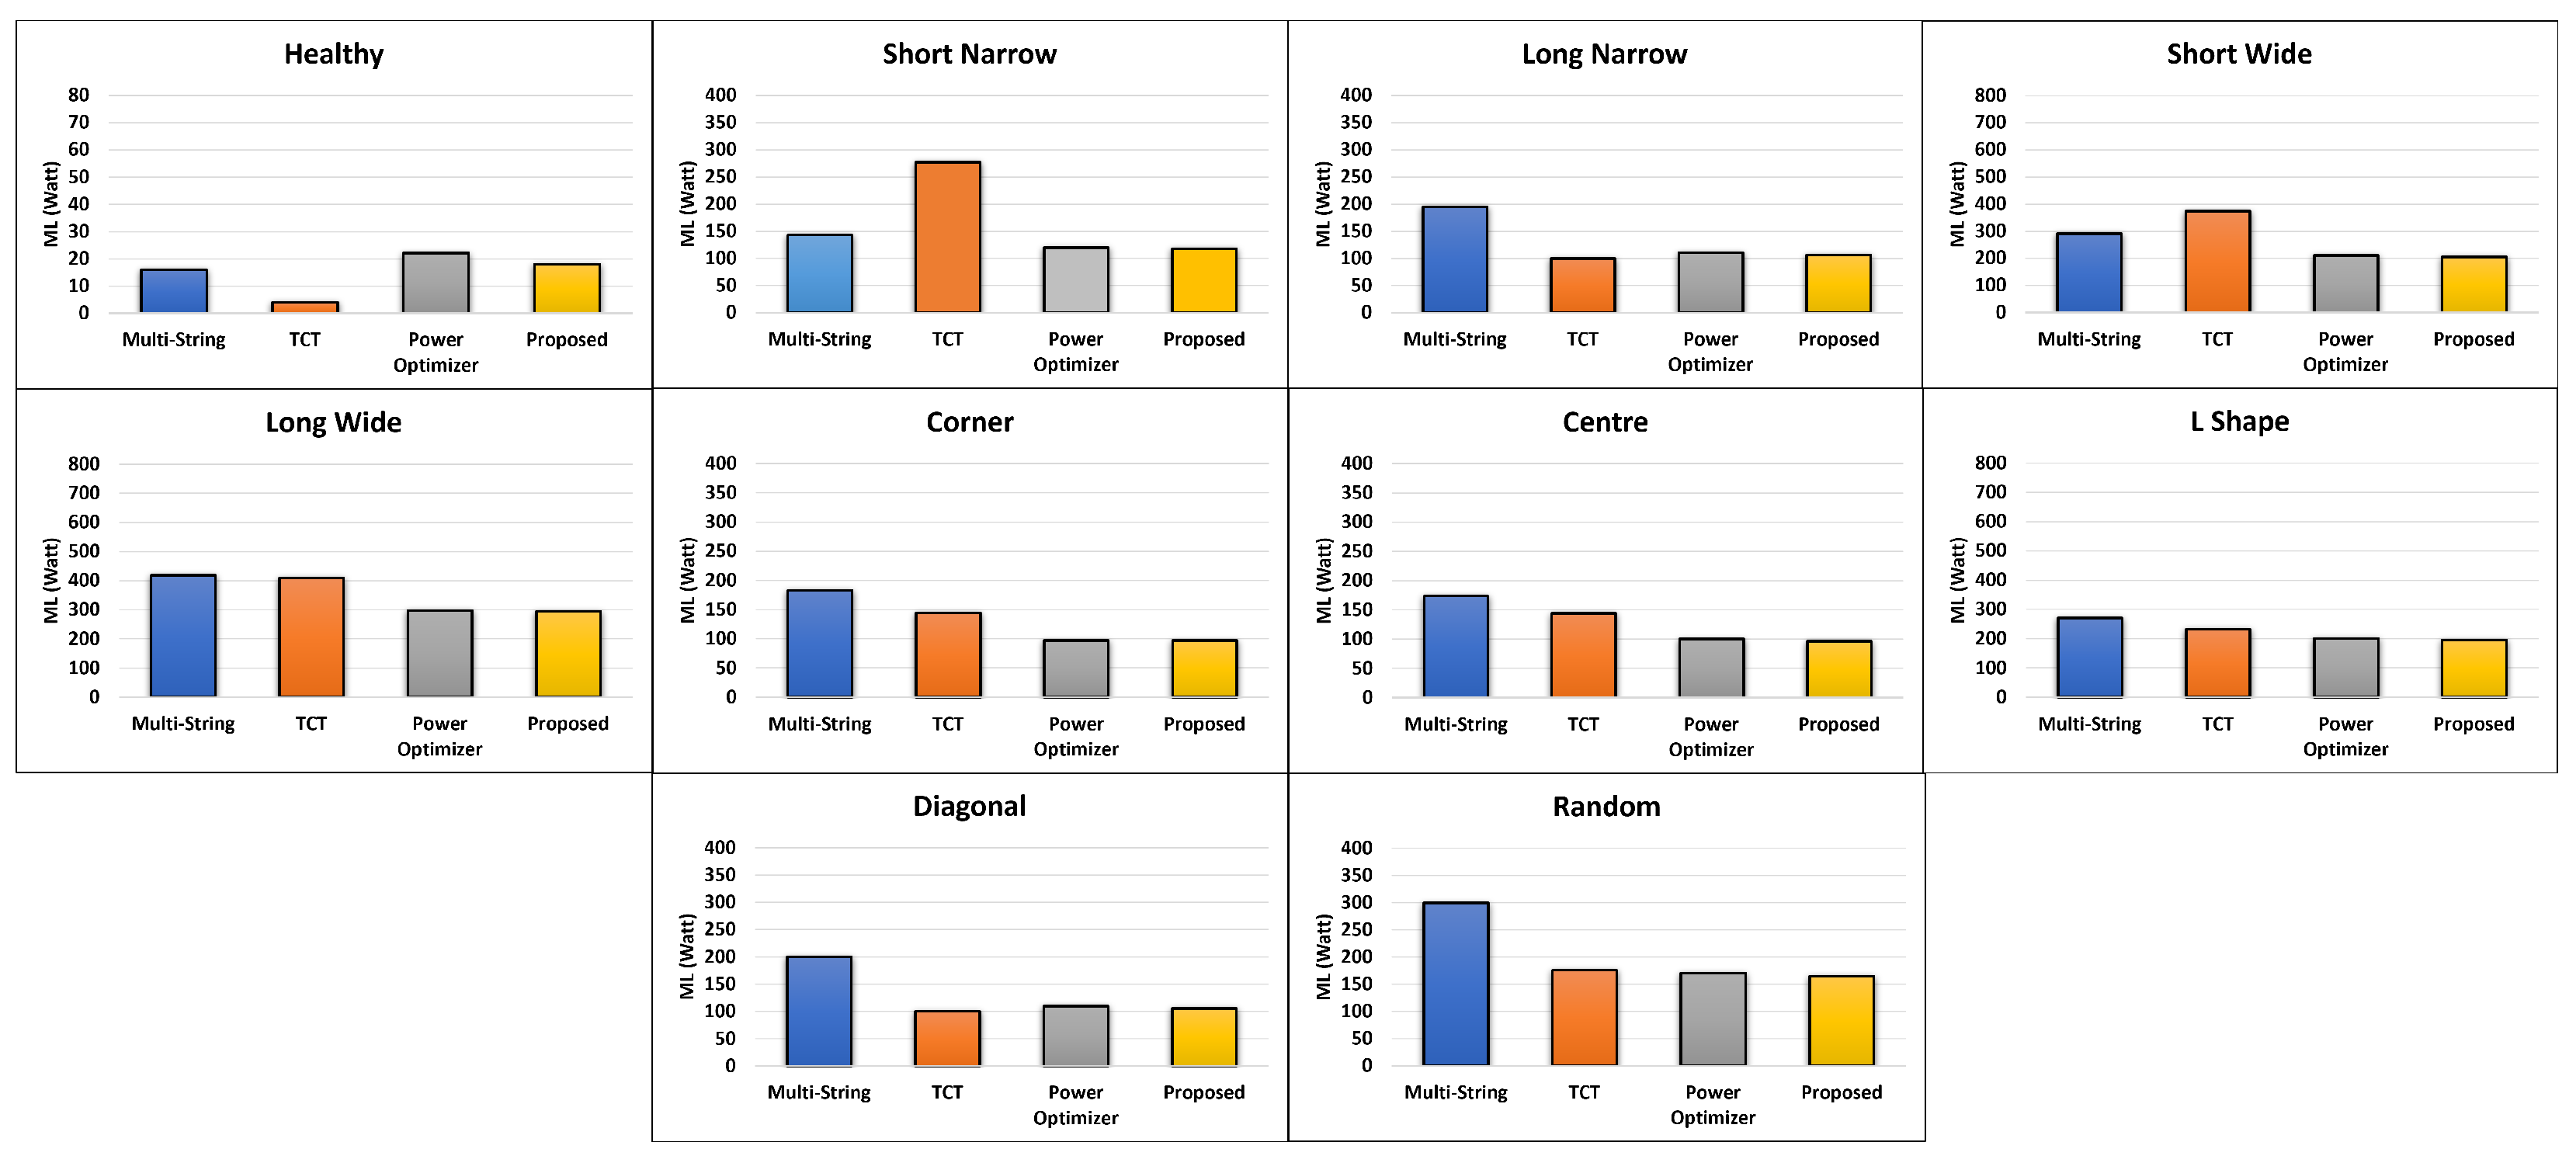
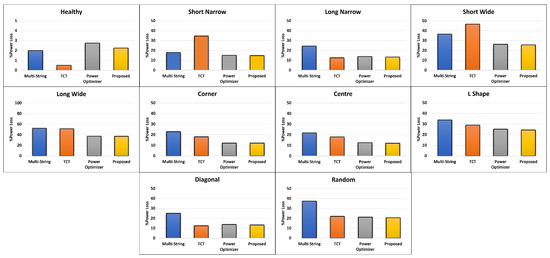
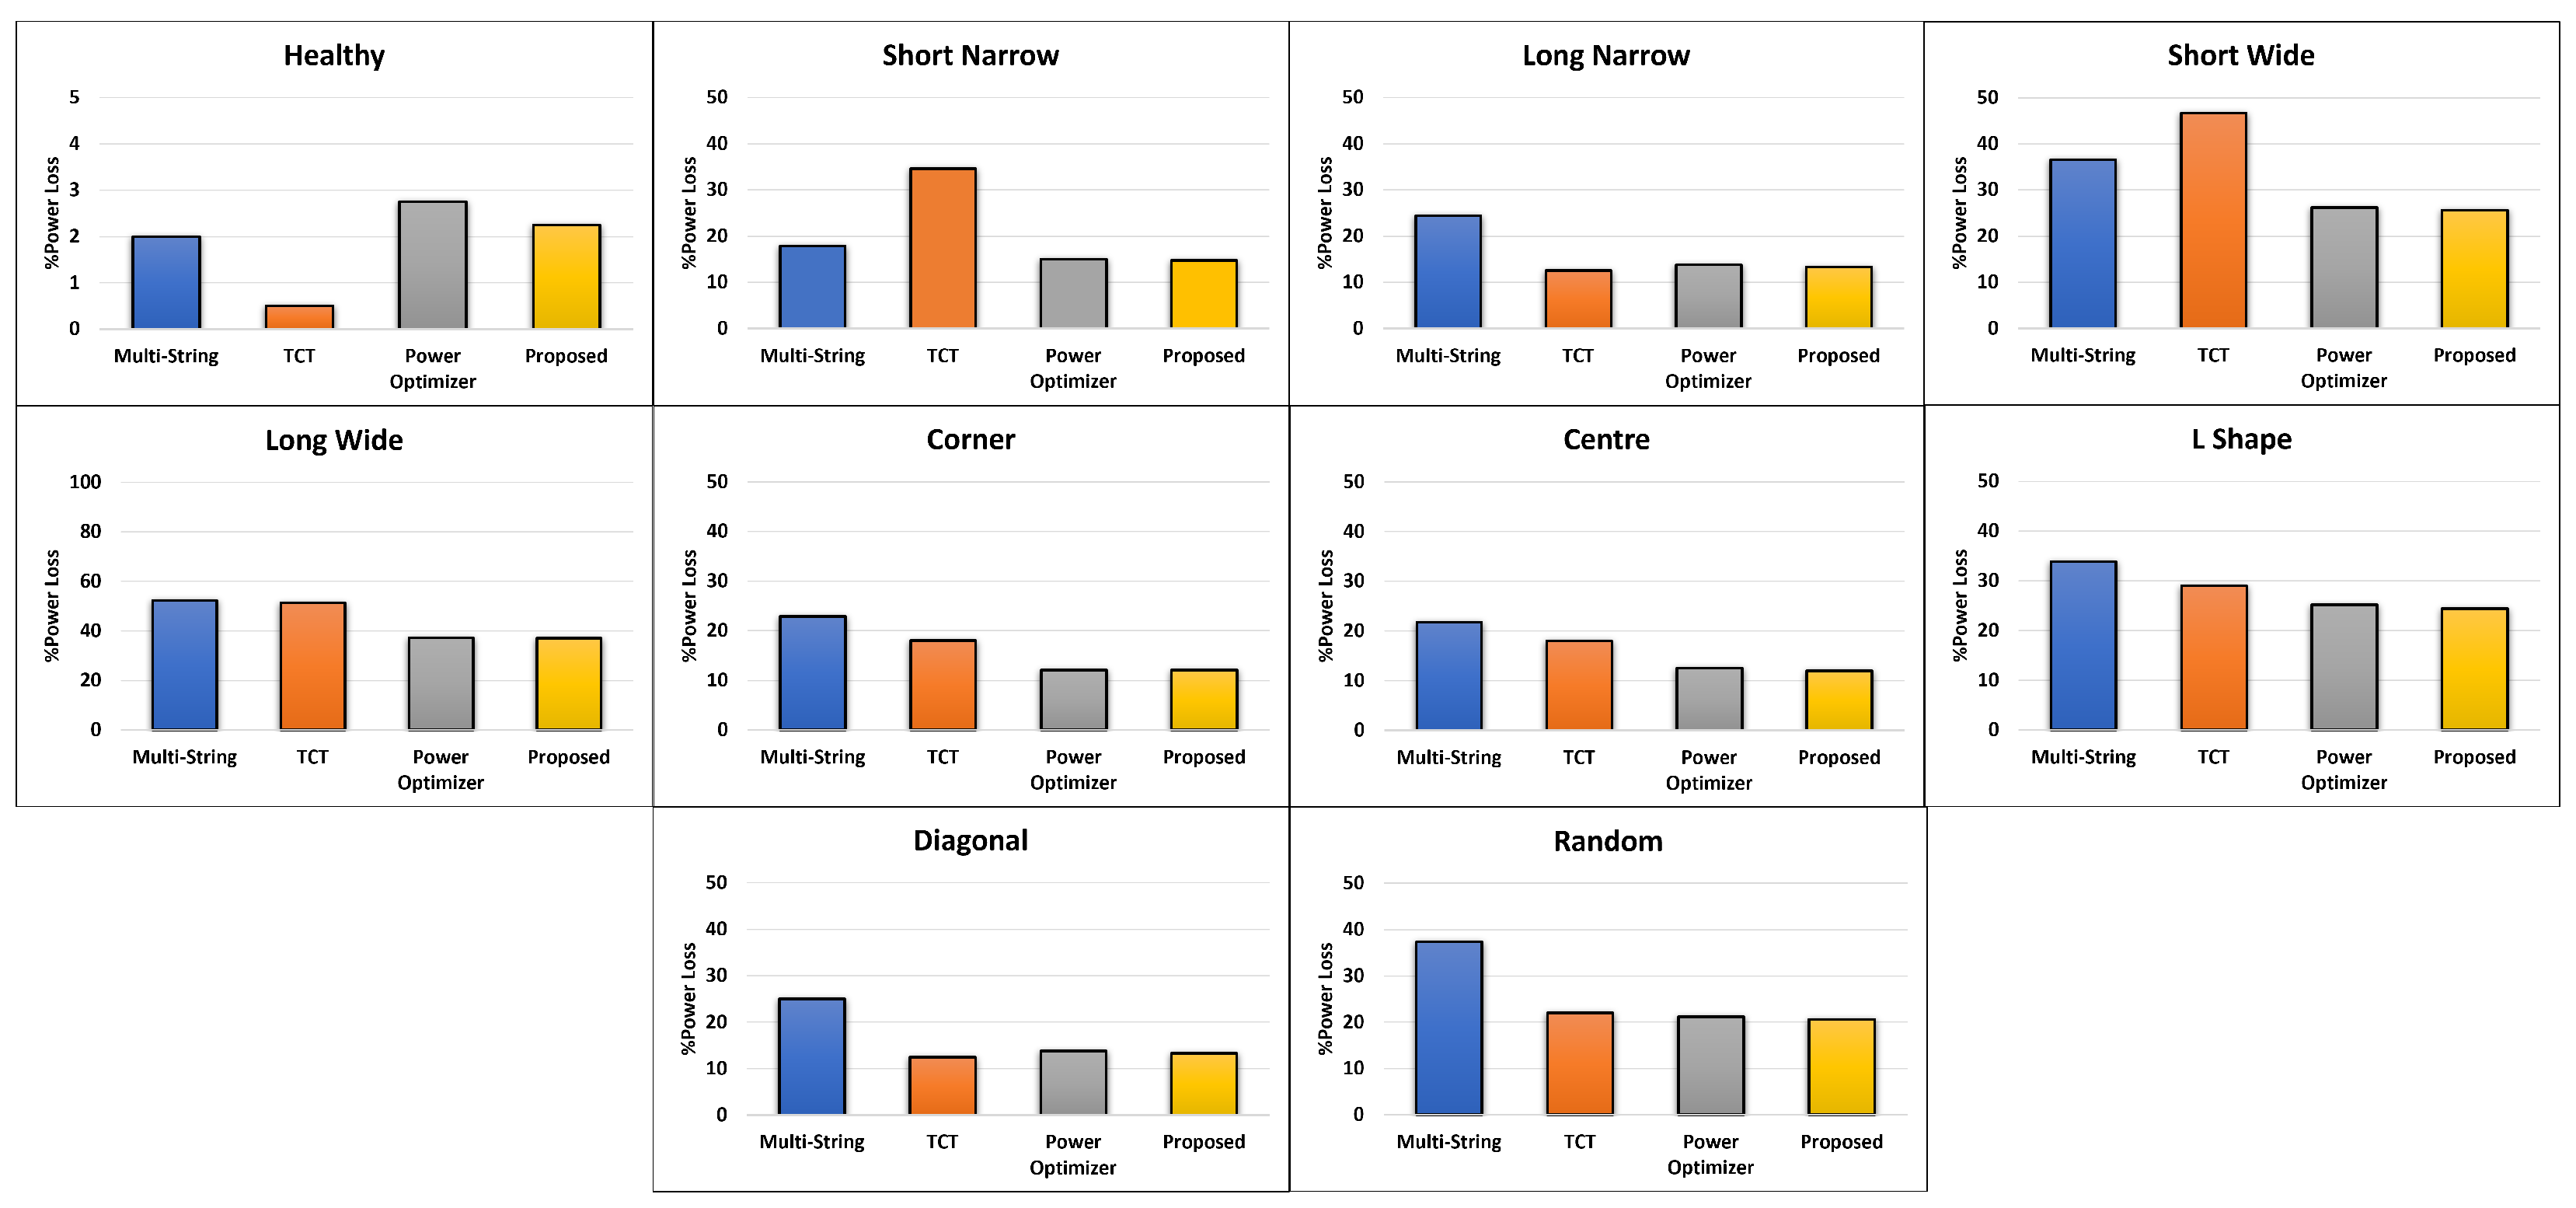
The proposed parallel-series configuration is further evaluated in comparison to the selected three PV configurations in terms of mismatch loss (ML), percentage power loss (PL), and executive ratio (ER) as introduced in Section 2.1. On the basis of the simulations, the comparison is summarized in Table 4. Moreover, the comparisons of , ML, %PL, and ER are graphically presented as bar graphs in Figure 8, Figure 9, Figure 10, and Figure 11, respectively. A closer look at the results reveals that the proposed method provides 0.5 to 1% more power than the power-optimizer configuration because the inductor and the switching losses in the proposed method are lower because of fewer switches used in the proposed PV configuration.
Table 4.
Performance metrics (Pout, mismatch loss, % power loss, executive ratio) of different PV configurations under various shading patterns.
Figure 9.
Mismatch loss comparison for different PV configurations under various shading patterns.
Figure 10.
Percentage power loss comparison for different PV configurations under various shading patterns.
Figure 11.
Graphical representation of comparison of executive ratio among various PV configurations at different shading patterns.
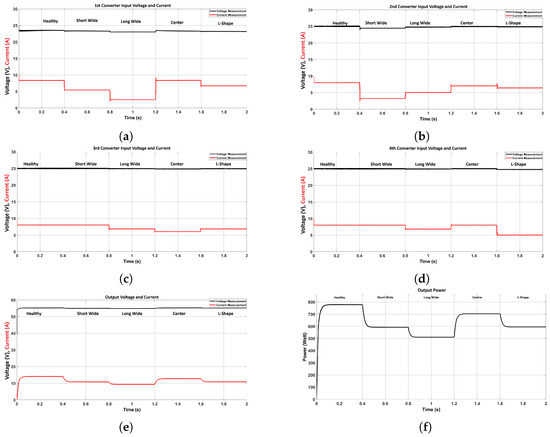
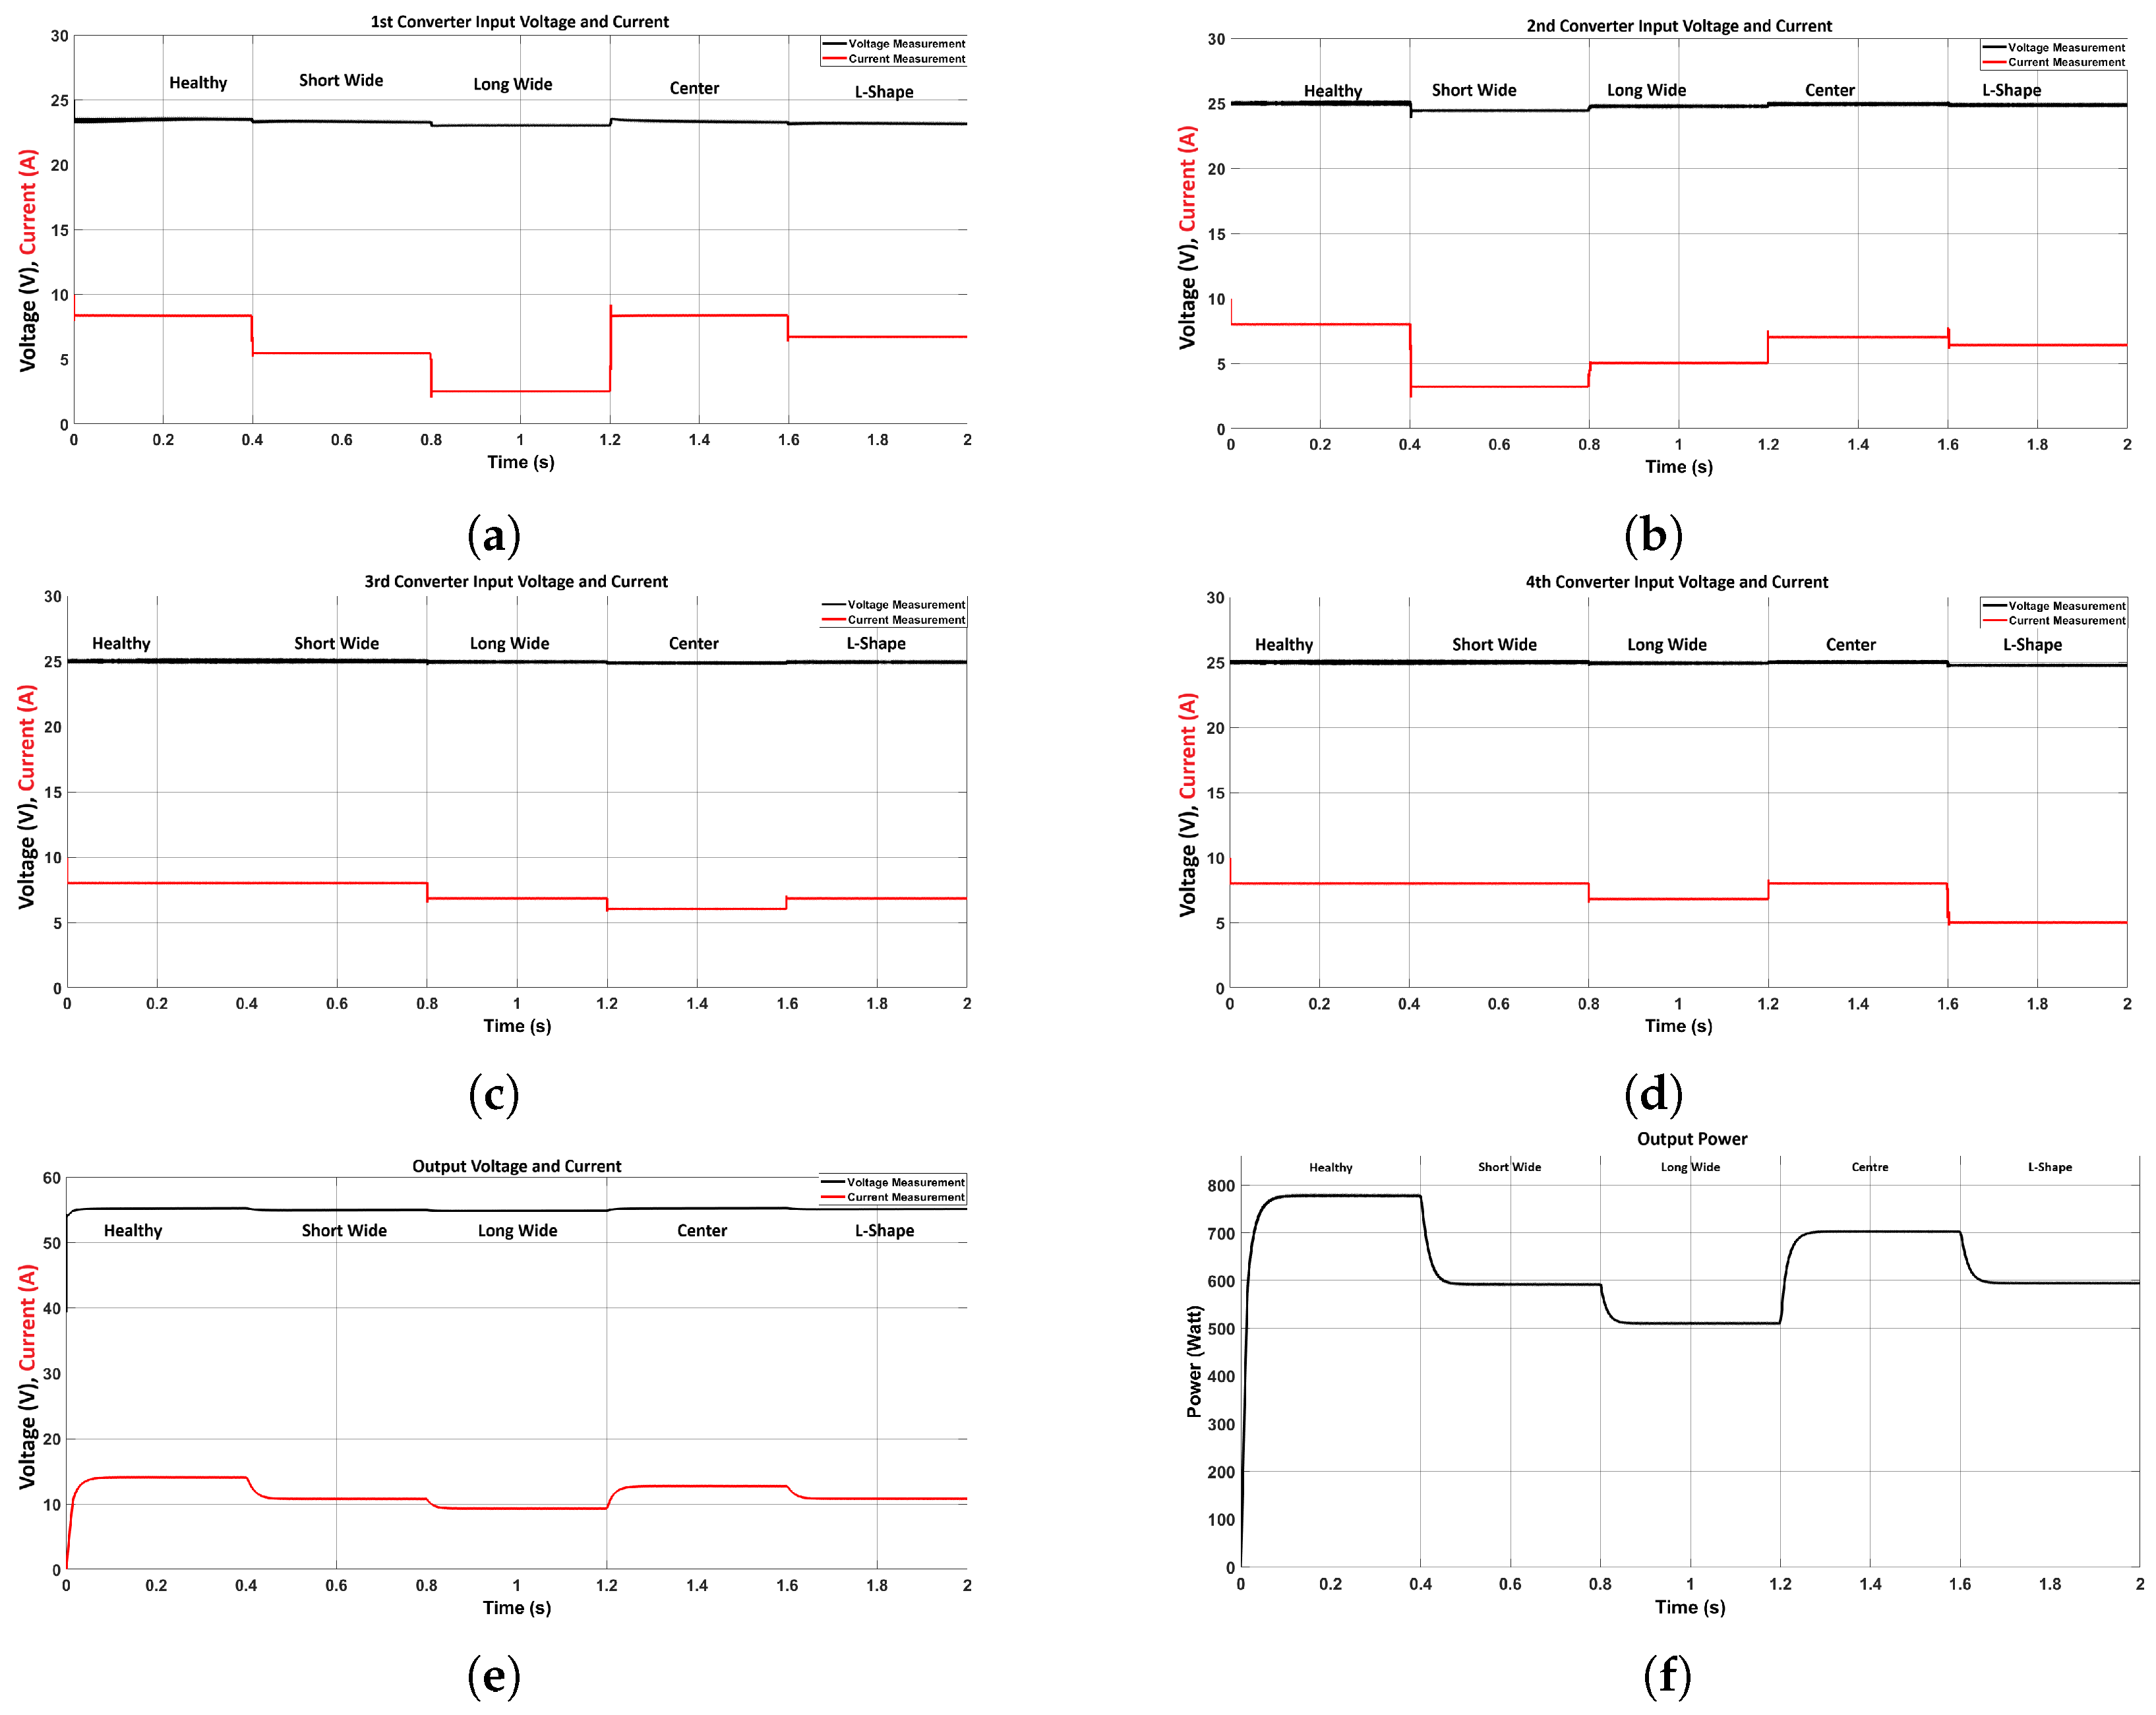
The dynamic response of the proposed configuration is evaluated under changing shading patterns. Different shading patterns (healthy, short-wide, long-wide, center, L-shaped) shown in Figure 2 with the specified irradiance values are used in the simulations. The sequence of shading patterns is as follows: healthy from 0 to 0.4 s, short-wide from 0.4 to 0.8 s, long-wide from 0.8 to 1.2 s, center from 1.2 to 1.6 s, and L-shape from 1.6 to 2.0 s. The simulation results are shown in Figure 12a–f. Figure 12a–d show the voltage across and the current contributed by each row of the PV panels. The overall output voltage and current of the 4 × 4 PV configuration under consideration are shown in Figure 12e. The overall harvested power is the sum of each converter at a given point, and the result obtained through simulations is shown in Figure 12f. In the voltage and the current profiles of the individual converters Figure 12a–d, some overshoots/undershoots are observed at the time of transition from one shading pattern to another. However, the voltage overshoots and current overshoots cannot exceed the open-circuit voltage rating and the cumulative short-circuit current rating of the PV panels , respectively, where n is the number of panels in a row. Hence, the converters, as shown in Figure 6, having the MOSFET and the diode of voltage rating and the current ratings greater than and , respectively, are not affected by these overshoots. However, such overshoots/undershoots beyond the steady-state values indicate that the maximum power is not harvested at the time of the shading transitions. This issue may be addressed by adopting different MPPT algorithms, which is beyond the scope of this paper.
Figure 12.
Transient performance of the proposed PV topology under step changes in irradiance. (a) Input voltage and current of 1st converter. (b) Input voltage and current of 2nd converter. (c) Input voltage and current of 3rd converter. (d) Input voltage and current of 4th converter. (e) Overall output voltage and current. (f) Cumulative output power.
Table 5 provides a comparison of the proposed topology with existing topologies based on component count, size, cost, and implementation complexity. In component count, the number of control circuits, semiconductor switches (), inductors (), diodes (), and capacitors () are considered. For a 4 × 4 system, it can be seen that the power optimizer requires the highest number of components, i.e., 16 control circuits, 16 switches, 16 diodes, 16 inductors, and 16 capacitors.
Table 5.
Comparison of hardware complexity (component counts and compatibility).
Multiple string and proposed configurations are comparable in terms of the number of switches, diodes, capacitors, and controllers; however, the proposed configuration requires only one inductor.
The total-cross-tied configuration has the lowest component count, and its performance is also very good under many shading patterns. However, its performance is suboptimal and not the best under all the shading conditions as discussed in the previous subsection and summarized in Table 4. Connecting cables for the panels is also one of the considerations that depends on the current passing through the cables. In the multi-string configuration, where all panels are connected in series, the maximum current is equal to the current rating of a single panel. In the total-cross-tied configuration, PV panels are connected in a parallel/series connected array, necessitating thicker conductors as compared to the multi-string configuration. In the case of power optimizer, wiring requirements are determined by the voltage and current ratings of each individual panel. In the proposed method, panels are connected in parallel, causing the current to accumulate, thus requiring thicker wires.
In total-cross-tied and multi-string configurations, there is a restriction on using panels of the same electrical specifications; otherwise, there will be an inherent mismatch loss. In contrast, the power-optimizer configuration offers the flexibility to use panels of different ratings as each panel has its own MPPT controller. The proposed parallel-series configuration requires panels of the same ratings in a row; however, different rows may use panels of different ratings without any effect on the performance of the systems.
Lastly, when comparing the costs of the converters, total-cross-tied emerges as the most economical option, followed by the proposed converter, the multi-string scheme, and the power optimizer as the most expensive choices. However, when evaluating the converter cost in relation to the obtained from these converters, it becomes clear that the proposed method is the most cost-effective solution in the long run.
5. Experimental Validation
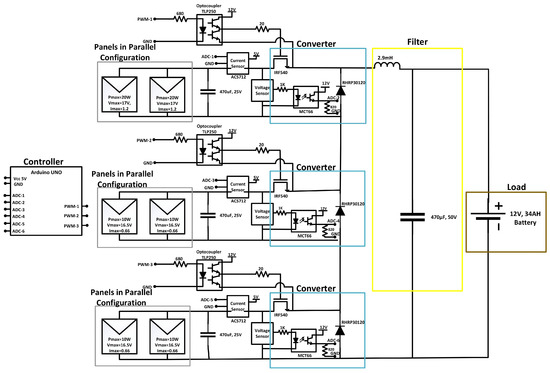
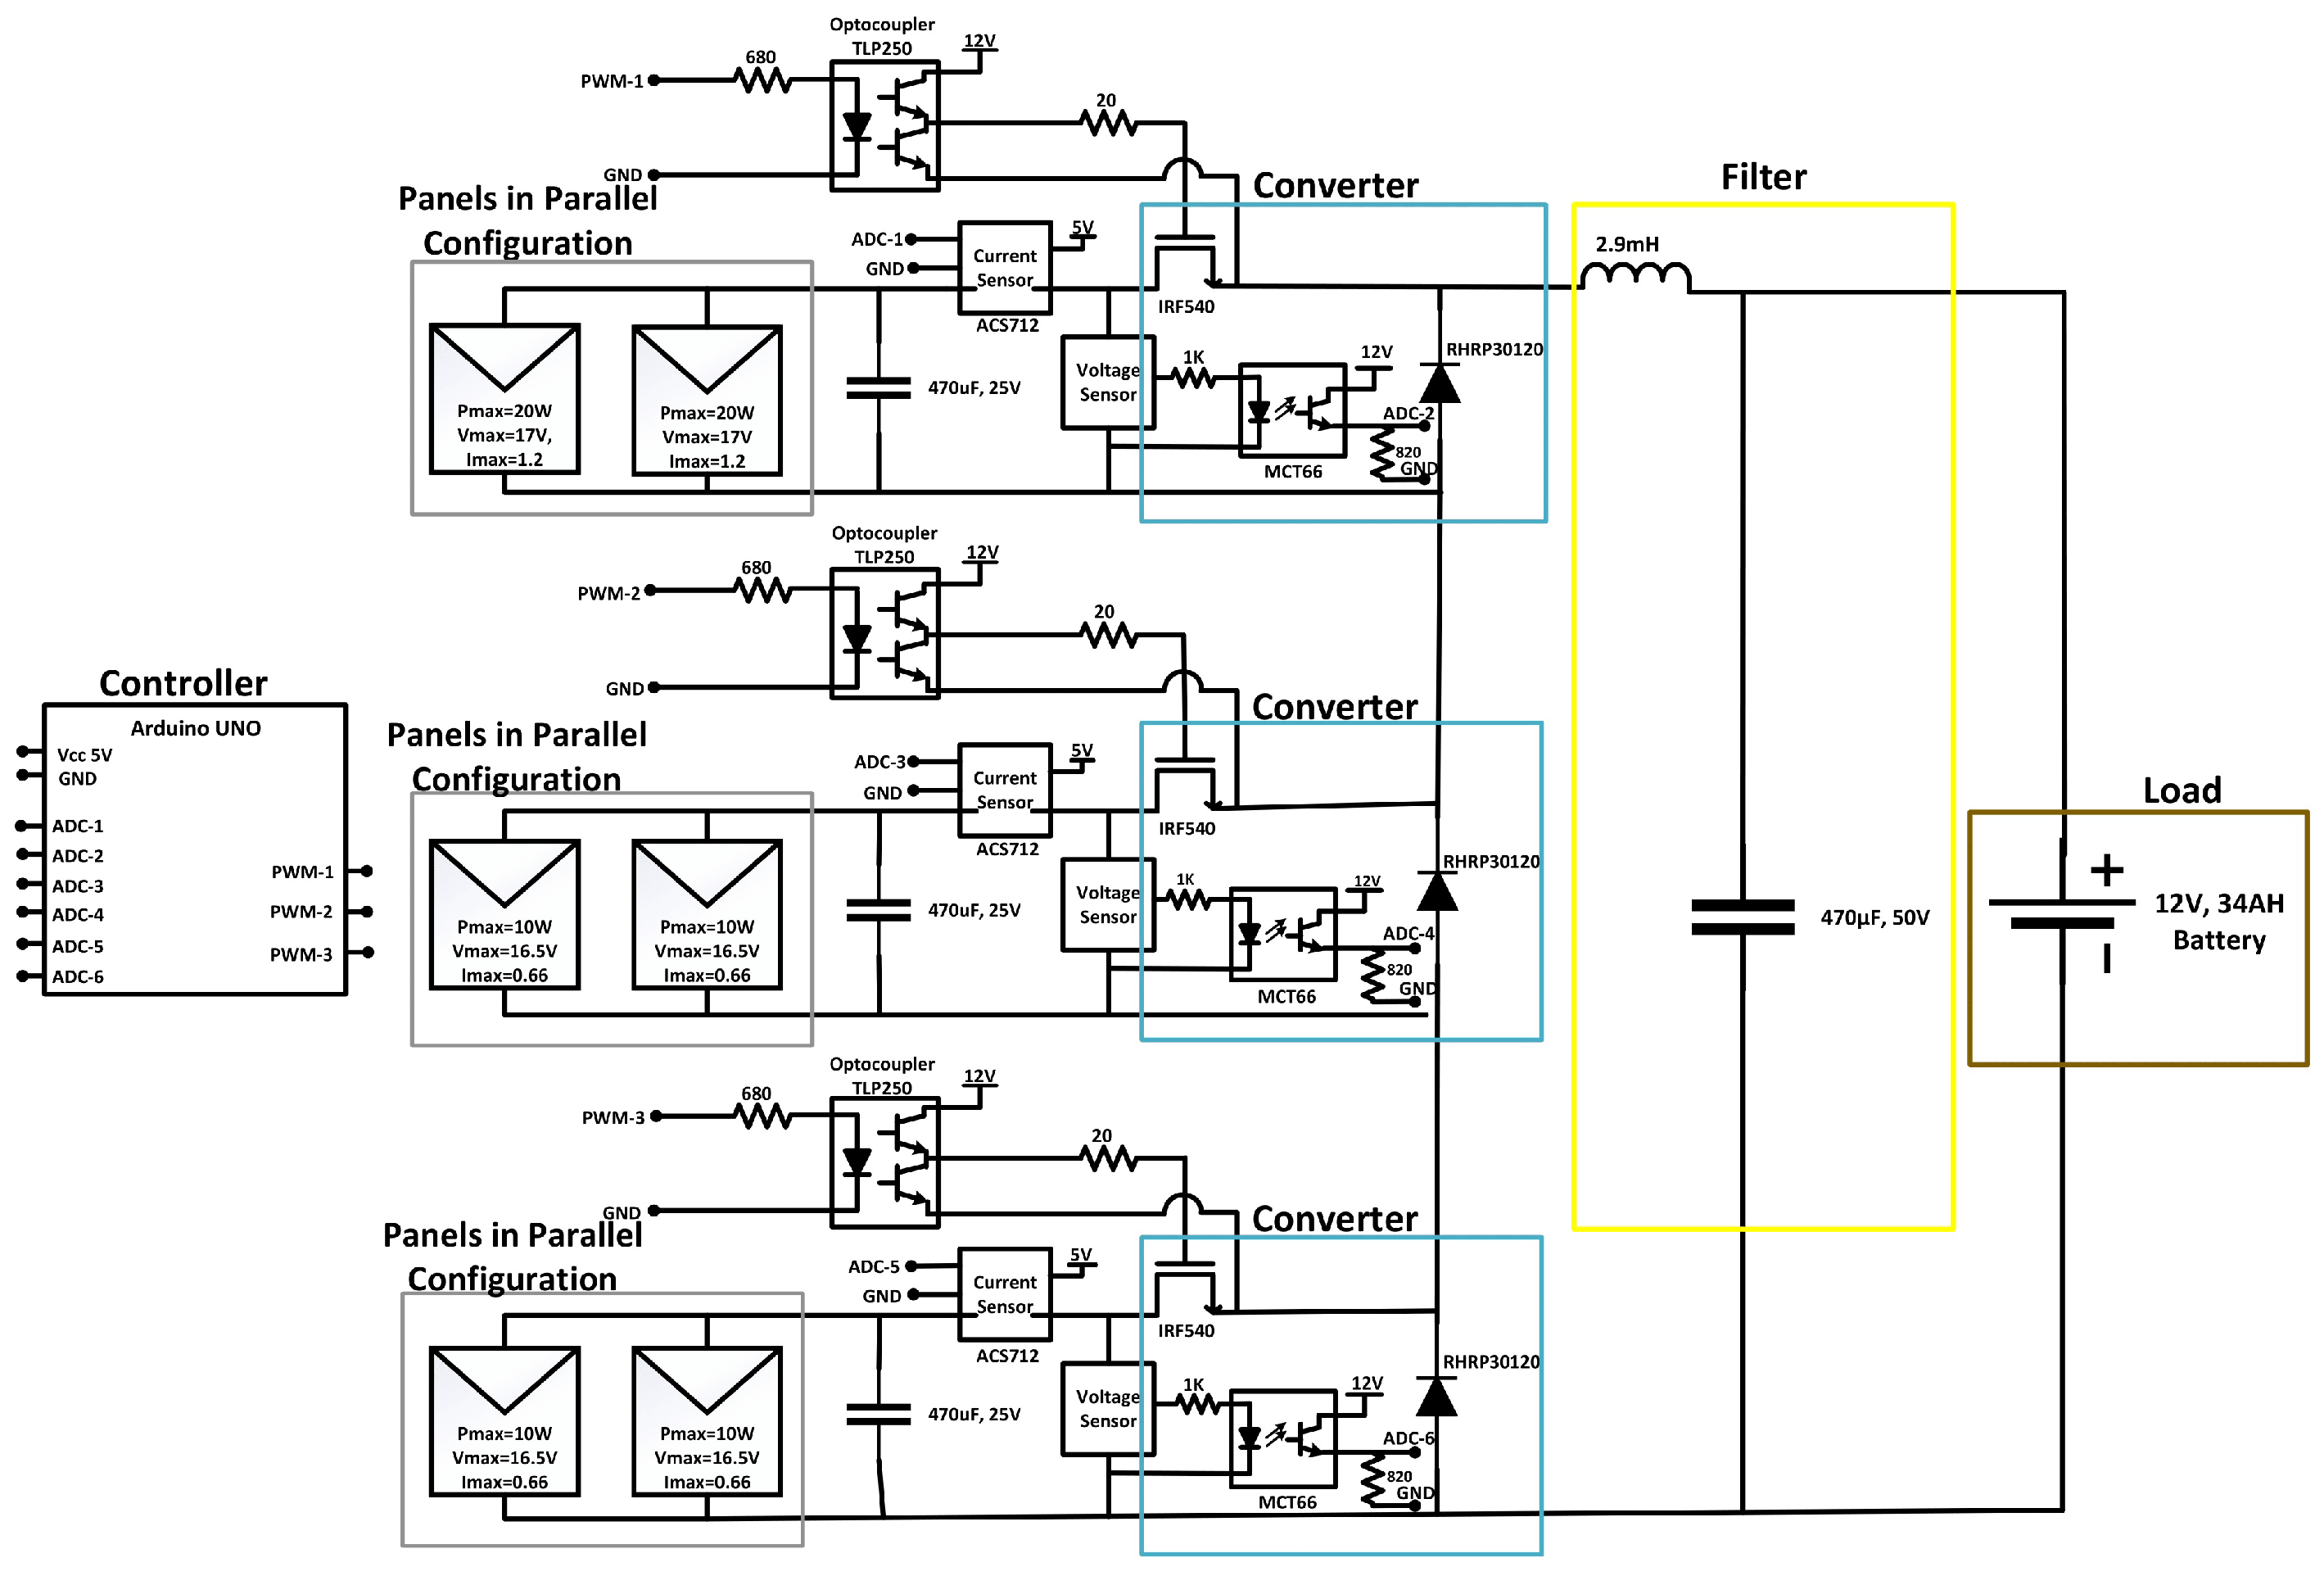
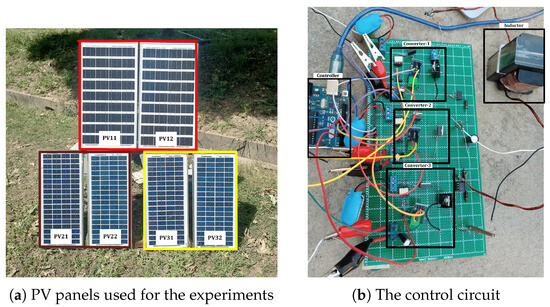
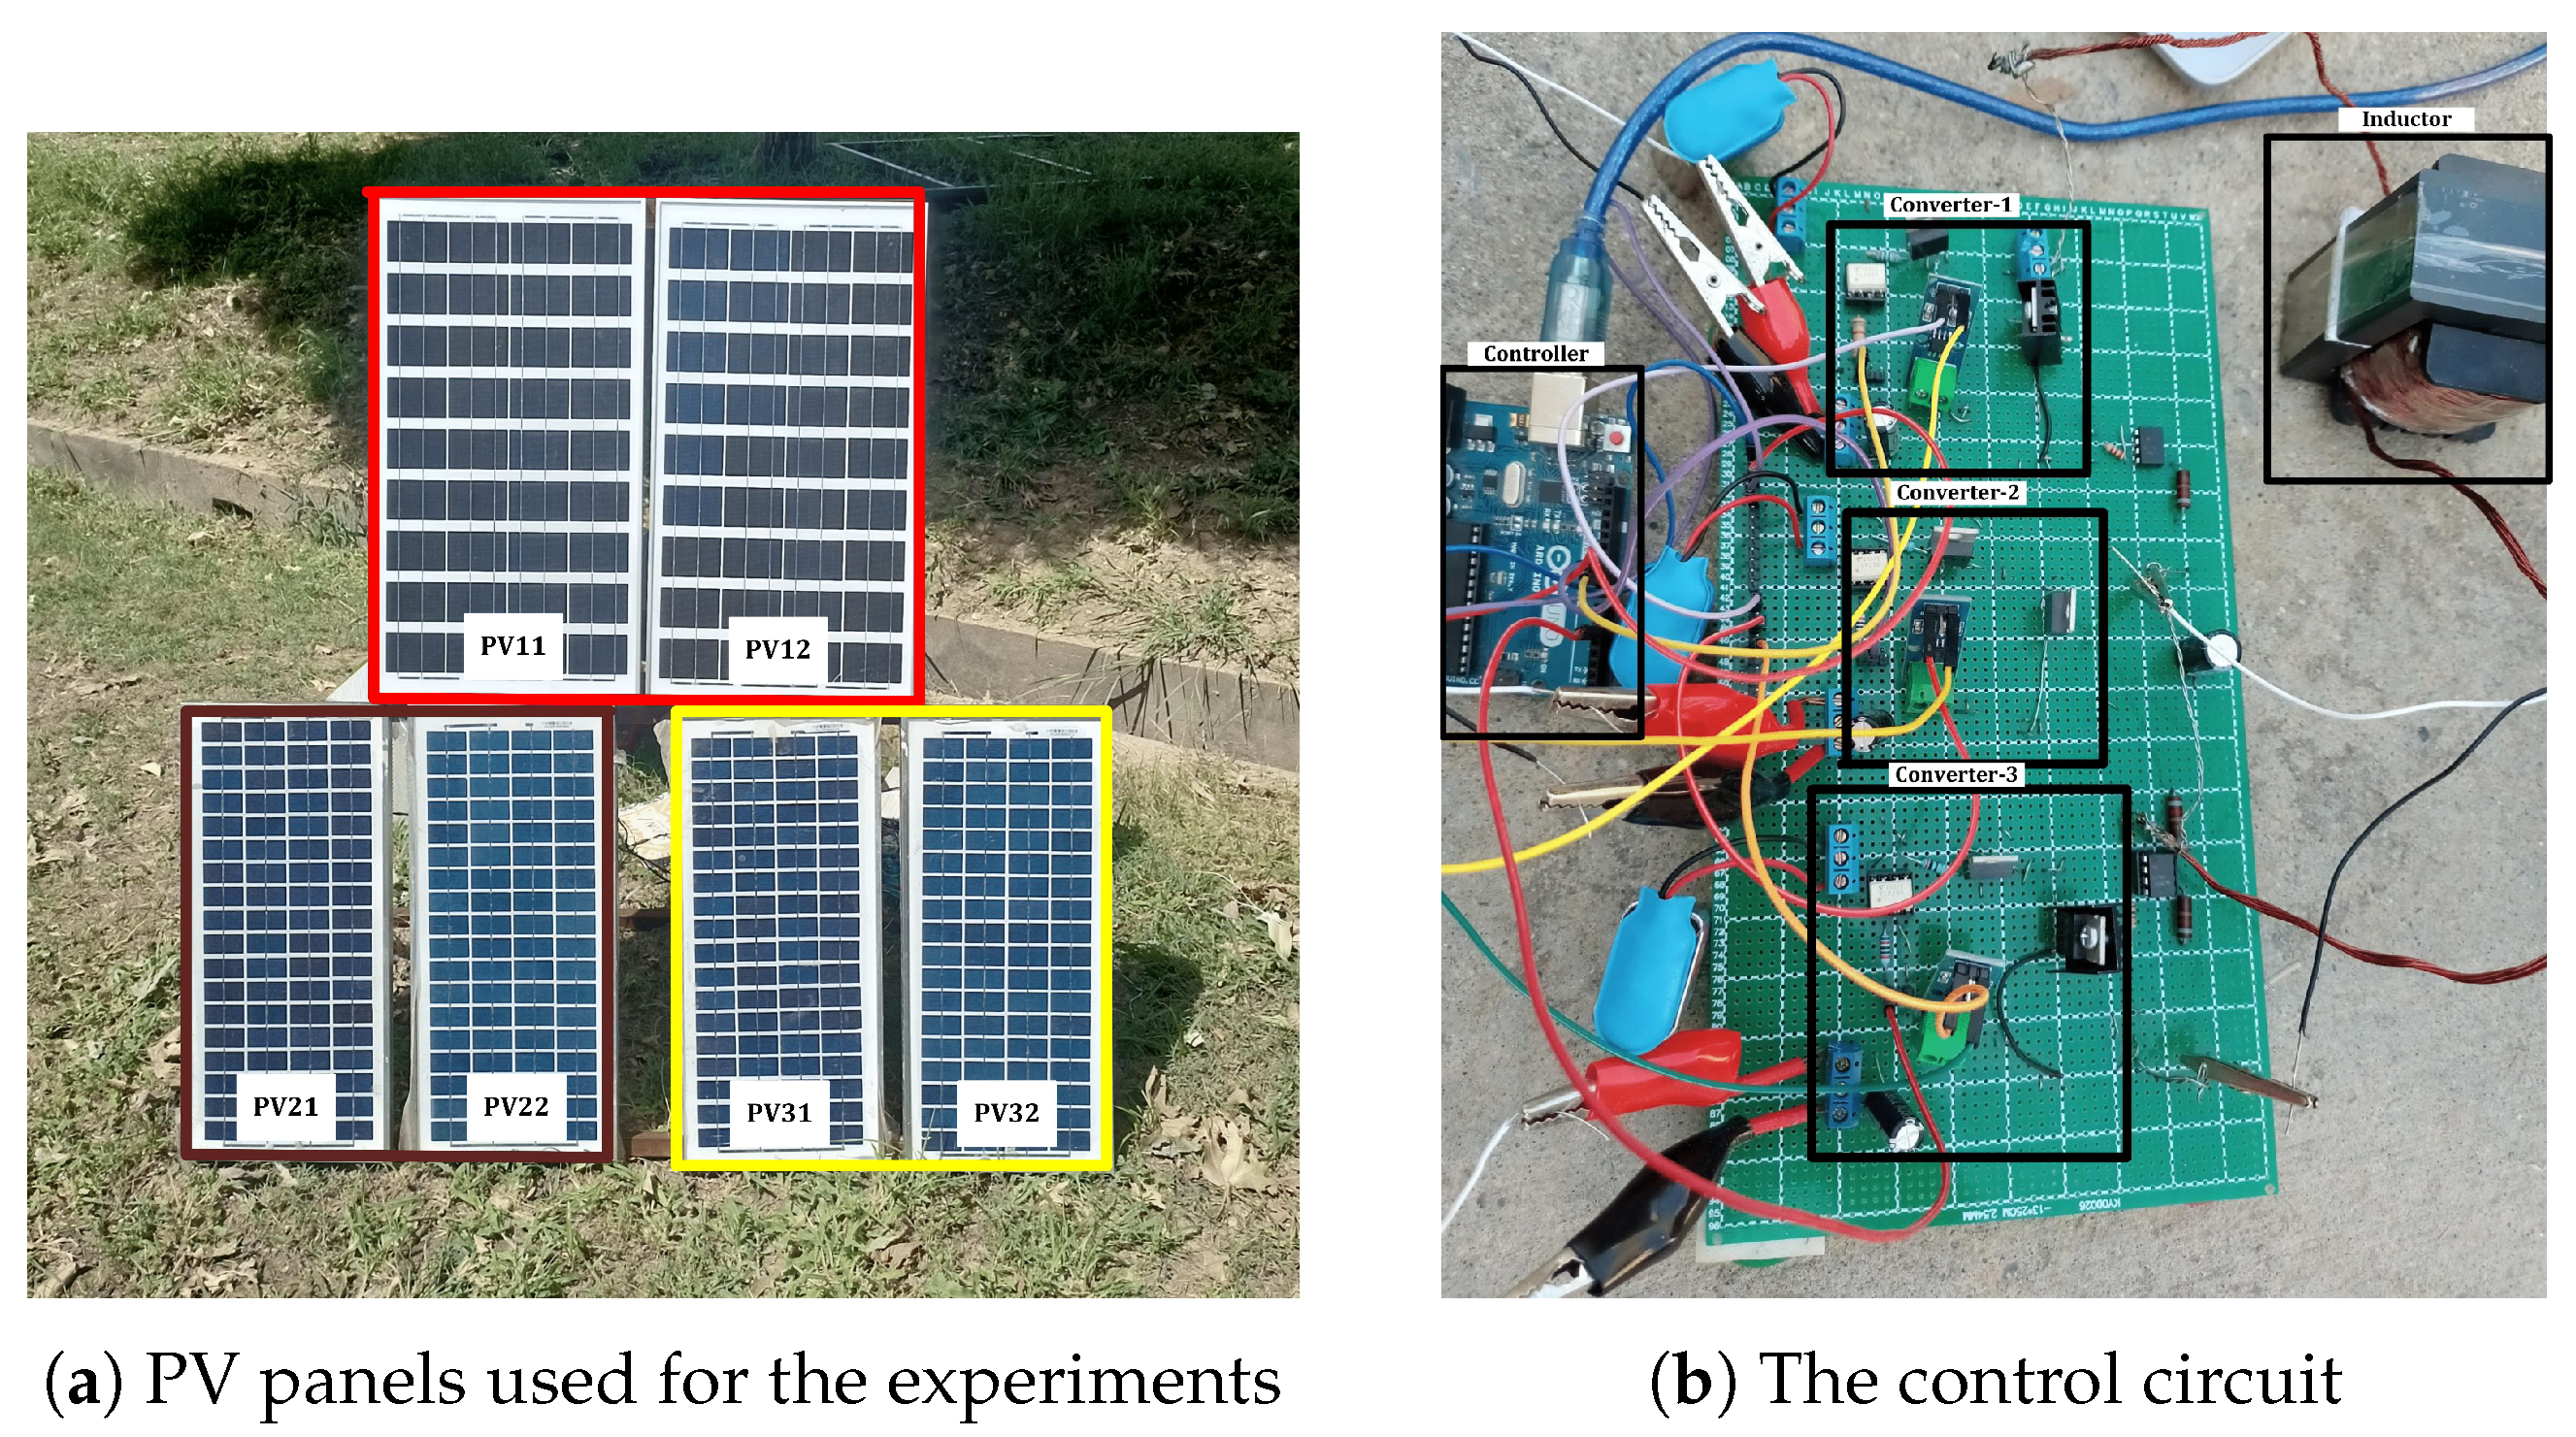
This section presents an evaluation of the proposed parallel-series configuration using a hardware setup. In this regard, a 3 × 2 configuration (three rows of PV panels, each consisting of two panels) is considered. The circuit diagram of the developed prototype is shown in Figure 13. A converter is connected to each row of the hardware configuration, resulting in three converters connected in series. The PV panels used in the experiments are shown in Figure 14. The panels are not physically placed in three rows to avoid mechanical instability; however, they are electrically connected in a 3 × 2 configuration as shown in Figure 13. Moreover, not all the panels are of the same ratings for better evaluation of the proposed configuration for mismatch loss. P11 and P12 (rated 20 W each) form the first row. PV21 and PV22 (rated 10 W each) and PV31 and PV32 (rated 10 W each) form the second and the third rows. The specifications of the PV panels are given in Table 6 and Table 7.
Figure 13.
Circuit diagram of the developed hardware prototype for the proposed PV configuration.
Figure 14.
Photographs of PV panels and control circuit used in hardware experiments.
Table 6.
Electrical specifications of 20 W PV panels used in the first row (PV11 and PV12) of the hardware prototype.
Table 7.
Electrical specifications of 10 W PV panels used in the second and third rows (PV21, PV22, PV31, and PV32) of the hardware prototype.
Each converter, as shown in Figure 13, consists of one input capacitor 470 F/25 V, a MOSFET switch IRF540, a fast recovery diode RHRP30120, a voltage sensor, and a current sensor ACS712. Additionally, each MOSFET switch was controlled using a MOSFET driver circuit. In the driver circuit, optocoupler TLP250 is employed for isolation. The perturb and observe MPPT algorithm was implemented on an Arduino UNO to generate control PWM signals, enabling us to extract the maximum power from the two parallel connected panels. The inductor, used after three interconnected converters, has a value of 2.9 mH, and the capacitor employed has a rating of 470 F/50 V. A 12 V battery is used as a load as the PV set is used to charge the battery. The control circuit is shown in Figure 14. The components used for the development of the converters are listed in Table 8.
Table 8.
Component list and ratings for converters in the hardware prototype.
Seven different shading scenarios, as described below, are considered in the hardware evaluation, and the results are presented in Table 9.
Table 9.
Measured hardware performance of the proposed PV configuration under various shading scenarios.
- First Scenario—short-narrow-I: One of the six panels is shaded, resulting in the following six cases:
- i.
- Only PV11 is shaded.
- ii.
- Only PV12 is shaded.
- iii.
- Only PV21 is shaded.
- iv.
- Only PV22 is shaded.
- v.
- Only PV31 is shaded.
- vi.
- Only PV32 is shaded.
- Second Scenario—short-narrow-II: Two panels of different rows are shaded in the following three ways:
- i.
- PV21 and PV31 are shaded.
- ii.
- PV11 and PV21 are shaded.
- iii.
- PV22 and PV32 are shaded.
- Third Scenario—long-narrow: Three panels of different rows are shaded in the following two ways:
- i.
- PV11, PV21, and PV31 are shaded.
- ii.
- PV12, PV22, and PV32 are shaded.
- Fourth Scenario—short-wide-I: Two panels of the same row are shaded in the following three ways:
- i.
- PV11 and PV12 are shaded.
- ii.
- PV21 and PV22 are shaded.
- iii.
- PV31 and PV32 are shaded.
- Fifth Scenario—short-wide-II: Two panels of the same row and one panel of another row are shaded in the following three ways:
- i.
- PV11, PV12, and PV21 are shaded.
- ii.
- PV21, PV22, and PV32 are shaded.
- iii.
- PV31, PV32, and PV22 are shaded.
- Sixth Scenario—long-wide-I: Two panels of the same row and one panel of the other two rows are shaded in the following three ways:
- i.
- PV11, PV12, PV21, and PV31 are shaded.
- ii.
- PV21, PV22, PV11, and PV31 are shaded.
- iii.
- PV31, PV32, PV12, and PV22 are shaded.
- Seventh Scenario—long-wide-II: Two two panels of two rows and one panel of third row are shaded in the following three ways:
- i.
- PV11, PV12, PV21, PV22, and PV31 are shaded.
- ii.
- PV11, PV12, PV21, PV31, and PV32 are shaded.
- iii.
- PV12, PV21, PV22, PV31, and PV32 are shaded.
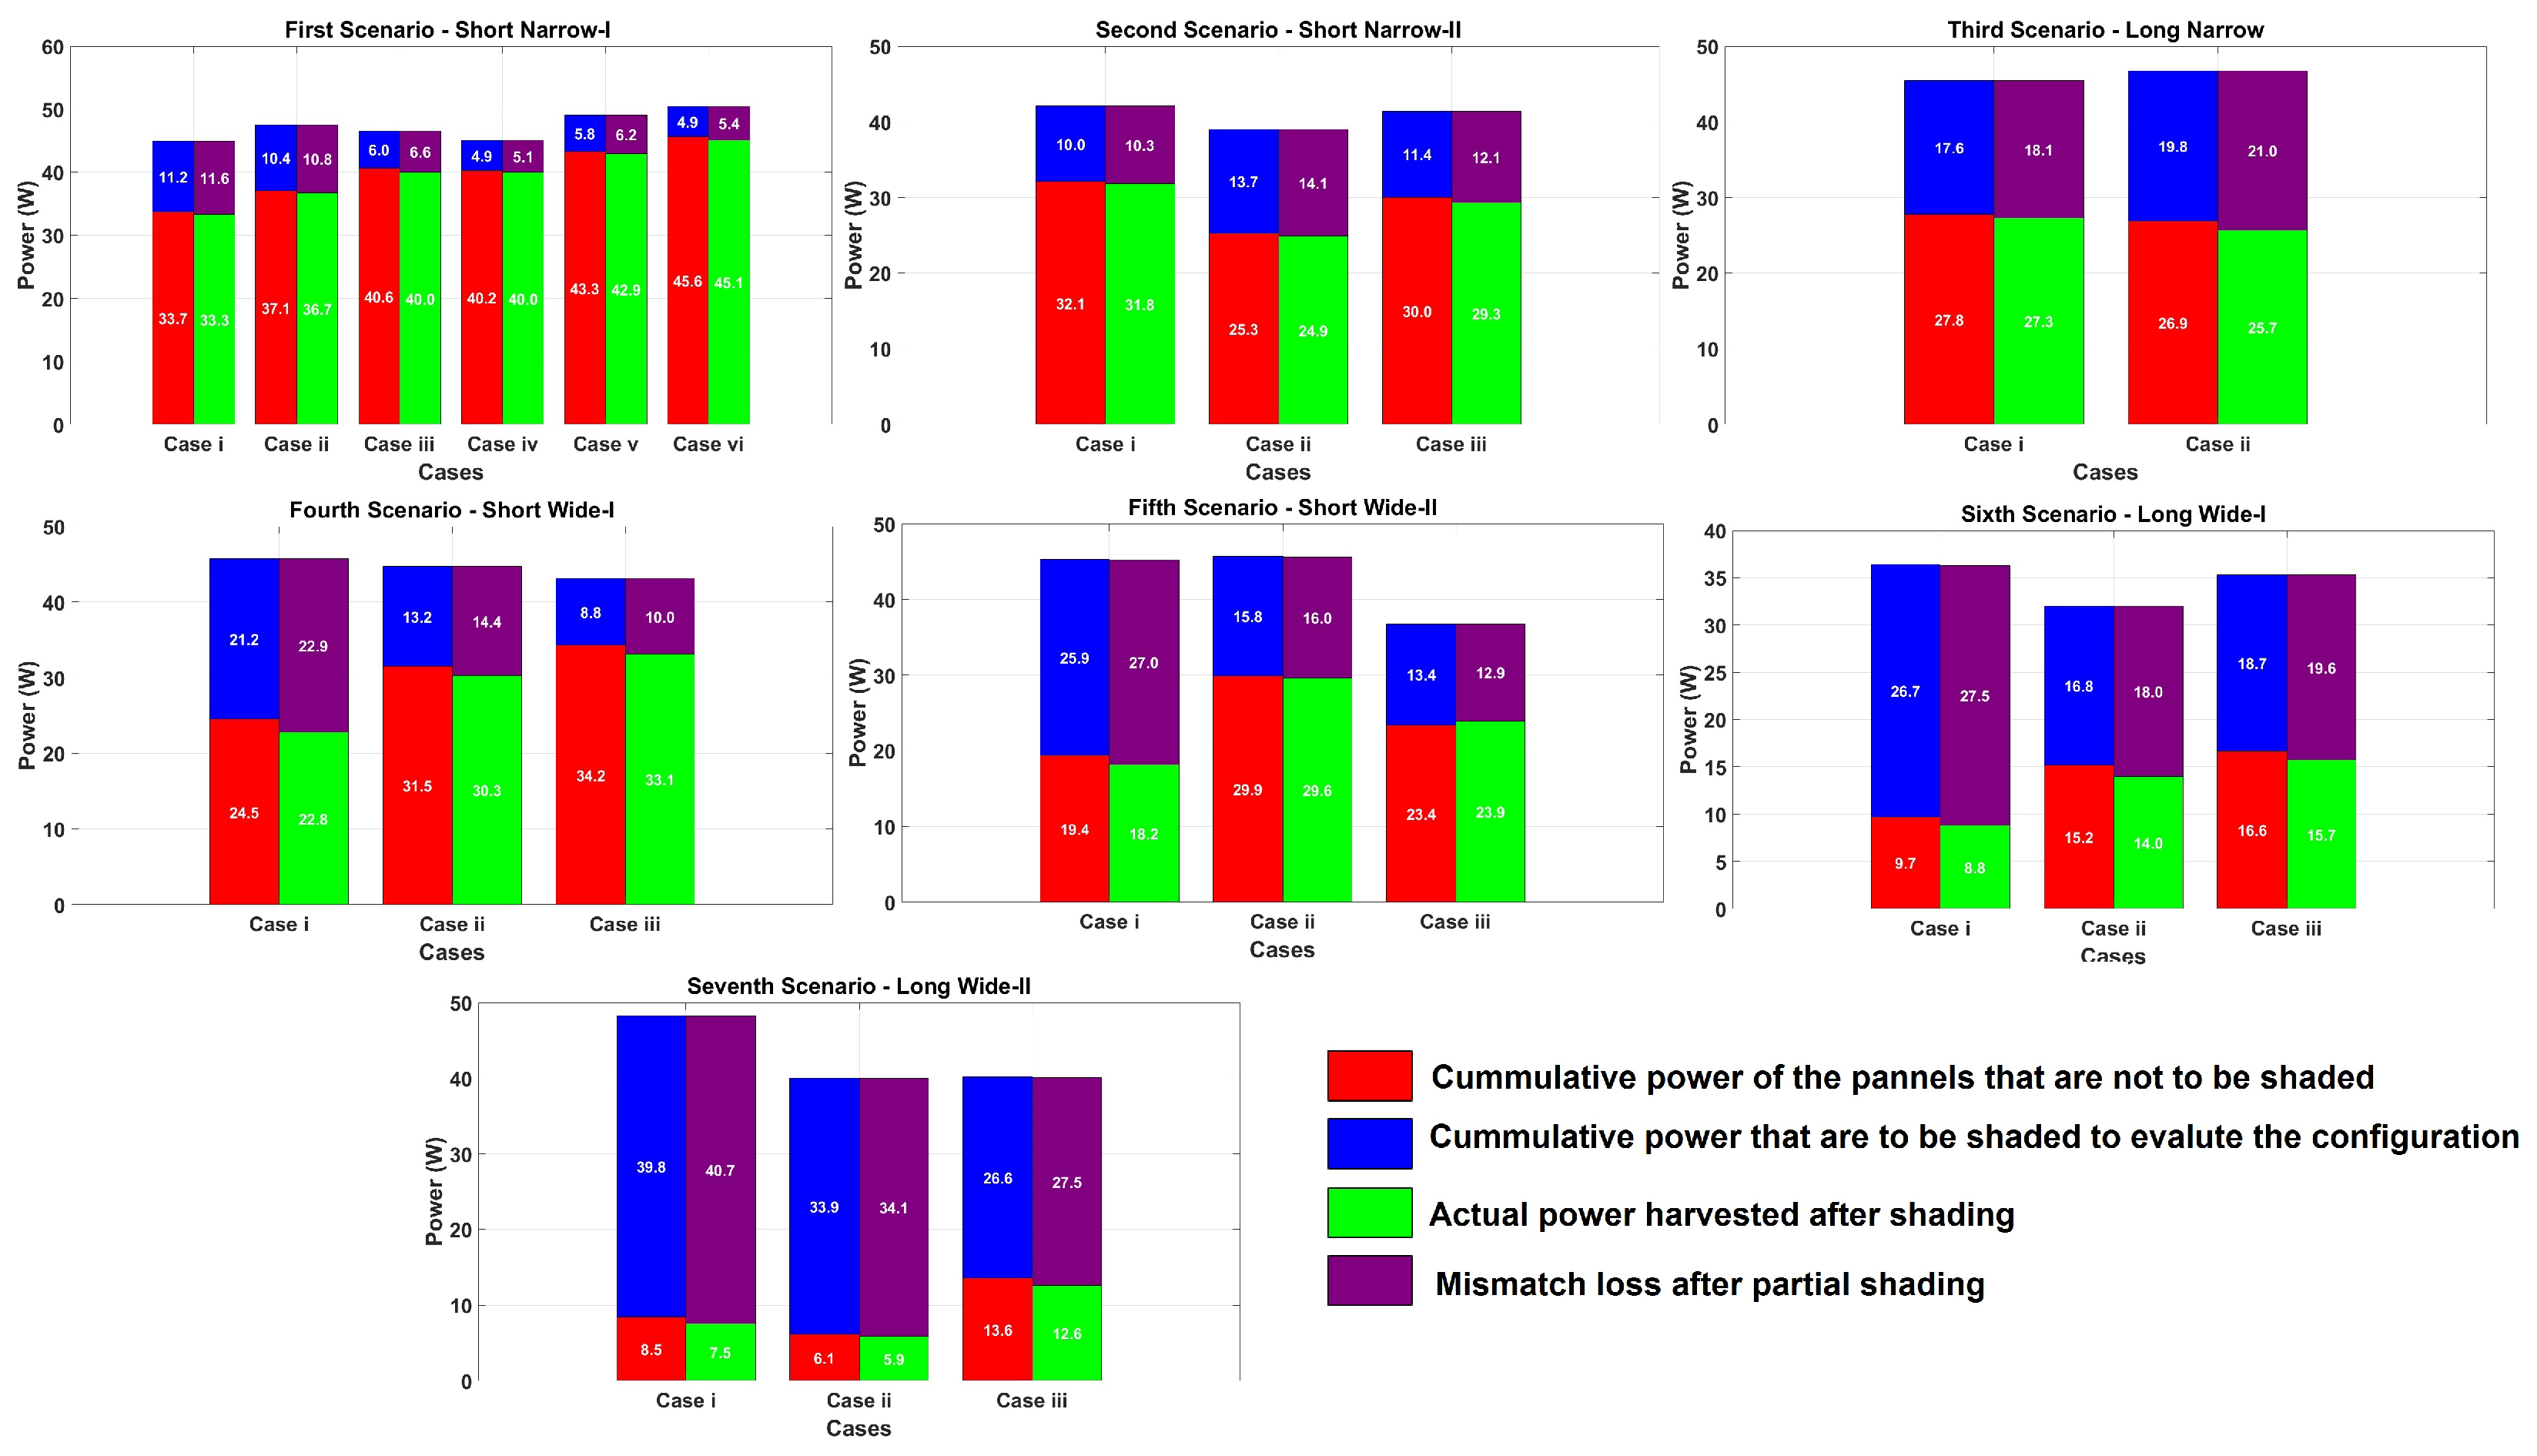
The experiment was conducted between 11:00 a.m. and 12:00 p.m. on 5–9 September 2023 in Islamabad. The solar irradiation values for that date are between 650 W/ and 750 W/, according to the data taken from tutiempo.net. The irradiation was varying, so the test conditions were recorded before every test. The sum of individual power generated by each panel under MPPT is reported as in the third column of Table 9. The sum of power of those PV panels that are to be shaded in the test is also reported in the fourth column as . Under such irradiation conditions, the of PV11 and PV12 panels was 10–13 W, while the PV21, PV22, PV31, and PV32 panels yielded 5–7 W. Consequently, the total from all the panels was 40–52 W. The next three columns in Table 9 show the results of PV configuration under no shading, followed by another set of three columns reporting the results under partial shading.
The last two columns in Table 9 report the mismatch loss as and for no shading and partial shading conditions, respectively. There is a small mismatch loss = in the case of no shading, despite the panels being of different ratings. This shows the strength of the proposed parallel-series configuration. As long as the panels are of the same ratings in a row (but could be of different ratings in different rows), the mismatch loss is very small. Ideally, it should be zero, but there is always some loss in the control/converter components, resulting in a small mismatch loss. Moreover, measurement inaccuracies and changes in the solar irradiance during the test are other contributing factors.
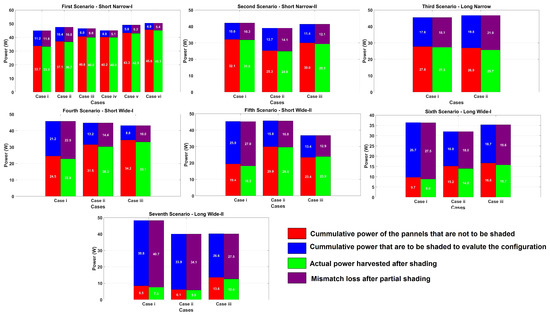
To test the proposed configuration under partial shading, certain PV panels (as specified in the shading scenarios at the start of this section) are covered by a thick cloth, resulting in a mismatch loss reported in the last column of Table 9. A closer look at the results reveals that the power loss is approximately the same as the commutative power of the shaded power recorded as under the test conditions. The same is shown in Figure 15. Hence, the proposed PV configuration lost the power of the shaded panels only and harvested the rest optimally. It is observed and appreciated that the proposed parallel-series configuration is equally good for all the shading patterns considered in the experiments. The total power is different in different scenarios as the experiments were performed at different times on different days between 11:00 a.m. and 12:00 p.m. on 5–9 September 2023 in Islamabad.
Figure 15.
Graphical summary of hardware experiment results for different shading scenarios.
Several practical constraints of the hardware experiments are acknowledged. Firstly, the 3 × 2 prototype serves as a proof-of-concept demonstration rather than a direct scale replica of the 4 × 4 simulation array; both consistently confirm the same principle: power loss under any shading scenario closely matches the sum of the individual panel powers that are shaded, validating near-optimal recovery of all unshaded panel power. Secondly, the shading was applied using opaque cloth covers, which is a low-cost approach in PV prototype research. While less precise than calibrated neutral density filters or a programmable solar simulator, it is sufficient for the mismatch loss validation presented. The use of a programmable solar simulator was precluded by laboratory equipment and budget constraints. Thirdly, the ACS712 Hall-effect current sensors (rated accuracy ±1.5%) and natural variability of solar irradiance during brief test windows contribute to the small non-zero mismatch losses observed in the no-shading baseline cases. Scale-up validation using commercial panels (>200 W) and more precise irradiance measurement is recommended/considered as an important extension of this work in the future.
6. Application in Smart Building Energy Systems
Smart buildings are a fundamental component of smart cities, integrating advanced technologies to optimize energy consumption, enhance occupant comfort, and reduce environmental impact. BIPV systems play a crucial role in transforming buildings from energy consumers to active energy producers, contributing to the distributed energy generation infrastructure of smart cities.
6.1. BIPV Systems in Smart Buildings
BIPV systems differ from traditional rooftop PV installations in that they are integrated into the building envelope, including facades, windows, roofs, and shading elements. This integration offers multiple benefits: (1) dual functionality as both building material and energy generator, (2) architectural aesthetics, and (3) optimized use of available building surfaces. However, BIPV systems in urban environments face unique challenges, particularly partial shading from neighboring buildings, which varies throughout the day and across seasons. The proposed parallel-series PV configuration is particularly well suited for BIPV applications in smart buildings for several reasons:
- Scalability and Modularity: The parallel-series architecture allows for flexible system sizing and easy expansion. Building facades can accommodate multiple parallel-series units, with each row adapted to the specific architectural requirements and solar exposure conditions of different building sections.
- Cost-Effectiveness: With hardware complexity comparable to multi-string converters but efficiency matching power optimizers, the proposed configuration reduces both initial investment and maintenance costs, making BIPV systems more economically viable for smart building developers.
- Integration with Building Energy Management Systems (BEMSs): The simple control architecture of the proposed configuration facilitates integration with smart building energy management systems. Each parallel-series unit can be monitored and controlled independently, enabling real-time optimization of building energy flows and coordination with other building systems such as HVAC, lighting, and energy storage.
6.2. Performance Analysis for Smart Building Scenarios
To illustrate the applicability of the proposed configuration in smart building contexts, we analyze the performance based on the experimental and simulation results presented in Section 4 and Section 5. Urban BIPV systems typically encounter various partial shading patterns throughout the day due to neighboring buildings, including corner shading (morning/evening), random shading (mid-day with cloud cover), and L-shape patterns (from adjacent structures). From the simulation results summarized in Table 4 for a 4 × 4 array (800 W rated capacity), the comparative performance under different shading patterns demonstrates the following results about each type of the configuration.
- Multi-String Configuration: Exhibits high variability in power loss depending on shading pattern—for instance, under random shading, 37.37% power loss (501 W output from 800 W capacity); under L-shape shading, 33.87% power loss (529 W output). The average power loss across the tested urban-relevant shading patterns (corner, center, L-shape, random) is approximately 28.7%.
- Total-Cross-Tied Configuration: Shows moderate performance with pattern-dependent results—under random shading, 22% power loss (624 W output); under L-shape, 29.00% power loss (568 W output). While performing better than multi-string, the variation across patterns (ranging from 12.5% to 29% loss) indicates inconsistent behavior in urban environments.
- Power-Optimizer Configuration: Demonstrates consistently low power loss—under random shading: 21.25% power loss (630 W output); under L-shape: 25.12% power loss (599 W output). The average power loss across urban shading patterns is approximately 18.7%.
- Proposed Parallel-Series Configuration: Achieves performance comparable to power optimizers with consistent results—under random shading, 20.62% power loss (635 W output); under L-shape, 24.37% power loss (605 W output). The average power loss across urban shading patterns is approximately 17.1%, representing a 40% reduction in mismatch losses compared to multi-string configurations and matching power optimizer performance.
These results demonstrate that for BIPV installations in smart buildings, where partial shading from urban structures is inevitable, the proposed configuration offers reliability and efficiency comparable to the best-performing systems while maintaining significantly lower hardware complexity. The consistent performance across different shading patterns is particularly valuable for building energy management systems, as it provides predictable energy generation profiles for optimization algorithms.
6.3. Smart City Integration and Grid Interaction
Beyond individual building benefits, widespread adoption of efficient BIPV systems using the proposed configuration contributes to the following smart city objectives:
- Grid Stability: By maximizing power harvest during partial shading conditions, the proposed configuration provides more stable and predictable power generation, reducing grid fluctuations and supporting demand-response strategies.
- Peak Demand Reduction: Enhanced PV performance during mid-day hours, when both solar generation and building loads are high, helps reduce peak demand on the urban grid infrastructure. Therefore, the overall operating cost of the conventional grid and the associated generating stations also reduces.
- Carbon Footprint Reduction: Improved energy harvest directly translates to reduced reliance on grid electricity, supporting smart city sustainability goals. The demonstrated 40% reduction in mismatch losses compared to multi-string configurations contributes proportionally to enhanced renewable energy utilization and carbon emission reductions in building operations.
- Data-Driven Optimization: The independent operation of parallel-series units enables detailed monitoring of building energy performance. This data can feed into city-wide energy management platforms, supporting predictive maintenance, energy forecasting, and urban energy planning.
6.4. Implementation Considerations for Smart Buildings
When considering implementing appropriate converter configuration in smart building applications, several practical considerations emerge. The proposed configuration, however, presents a huge potentional in overcoming these challenges. These are dicussed as follows:
- System Sizing: The modular nature of the parallel-series configurations allows architects and engineers to optimize system design based on building geometry, expected shading patterns, and energy requirements. Rows can be sized differently to match facade sections with varying solar exposure.
- Integration with Energy Storage: The DC output of the parallel-series configuration can be efficiently coupled with battery energy storage systems (BESSs), enabling smart buildings to store excess solar energy for use during peak demand periods or grid outages, enhancing building energy resilience.
- Maintenance and Monitoring: The simplified hardware reduces maintenance requirements compared to power optimizer systems while maintaining comparable performance. Smart monitoring systems can easily track the performance of each parallel-series unit, enabling predictive maintenance and rapid fault detection [62,63].
- Retrofitting Existing Buildings: The cost-effectiveness and performance advantages make the proposed configuration attractive for retrofitting existing buildings with BIPV systems, accelerating the transformation of conventional urban infrastructure into smart, energy-efficient buildings.
7. Conclusions
A novel parallel-series PV configuration is presented in this paper to mitigate mismatch loss in PV systems caused by aging effects, manufacturing/operational faults, and partial shading. The proposed configuration has been evaluated both for general PV applications and specifically for smart building energy systems in urban environments. Initially, the proposed PV configuration was intuitively perceived to perform better than many other PV configurations. The proposed PV configuration was then rigorously evaluated and compared with other PV configurations in MATLAB/SIMULINK using a 4 × 4 configuration and then using a 3 × 2 prototype hardware configuration. The simulations and hardware results demonstrate the superiority of the proposed PV configuration over all the PV configurations found in the literature to mitigate mismatch loss. The proposed PV configuration offers a mismatch loss as low as the power optimizers. However, the proposed parallel-series configuration requires simpler hardware; hence, it is economical as well. The total-cross-tied PV configuration is the simplest and performs equally well in some shading patterns; however, it suffers from two issues. Firstly, it fails to mitigate partial shading in some shading patterns. Secondly, it requires all the panels to be of the same ratings. In comparison, the proposed parallel-series configuration is not only equally good in all the shading patterns, but it also works well if different rows of PV panels use panels of different ratings.
For smart building applications, the proposed configuration offers several distinct advantages: (1) robust performance under the complex urban shading patterns typical of building-integrated PV systems, (2) cost-effective implementation enabling wider BIPV adoption, (3) scalability and modularity supporting flexible architectural integration, and (4) simplified integration with building energy management systems. These characteristics make the proposed parallel-series configuration particularly suitable for advancing smart building energy systems and contributing to sustainable smart city development. Future work will focus on long-term performance evaluation in actual smart building installations and optimization of the configuration for specific urban contexts and building types.
8. Limitations and Future Research Directions
The authors acknowledge limitations of the present study and consider specific directions for extension of this work in the future. The hardware validation used small-scale panels (20 W and 10 W) in a 3 × 2 array, considering portability during the experiments and cost of the PV panels to meet the constraints of the funding. Validation with larger commercial-scale arrays (>200 W panels) and a programmable solar simulator will reinforce the conclusions. Furthermore, hardware-based transient validation under dynamically changing shading conditions—including recording of individual converter input voltages () and currents during shading pattern transitions—constitutes an important future extension of this work. Such measurements, ideally obtained using a programmable solar simulator to enable fully reproducible irradiance transitions, would complement the simulation results in Figure 12 and provide direct experimental evidence of safe converter device operation during dynamic shading. Additionally, a systematic study of high-frequency MPPT and advanced control algorithms for the series-connected converter stack, including an assessment of potential cross-coupling effects between converter stages, would yield valuable insight into improving the speed and precision of the dynamic response and is identified as a meaningful direction for future investigation. Detailed small-signal modeling and stability analysis of the series-connected converter stack and power loss breakdown among the components are important extensions of this work that are considered beyond the current scope, i.e., proof-of-concept of parallel-series PV configuration. Annual simulations using specific meteorological year data for a specific BIPV building will provide actionable engineering insight for system designers. This analysis is beyond the present scope but is an important consideration for future work. Additionally, the conductor size requirement and a quantitative cable-loss analysis is desired for cost comparision among various configurations. Analysis of failure modes (e.g., open/short-circuit converter fault), protection coordination within the series stack, and overvoltage risk under load disconnect are practically important topics for real-world deployment and may also be considered a future extension of this work. The proposed configuration’s behavior under dynamic grid-connected conditions and its interaction with building energy management and storage systems in a city-scale context also demand dedicated investigation in the future.
Author Contributions
Conceptualization, T.A., S.T.S.G., N.K., A.K., S.A., and K.T.; methodology, T.A., S.T.S.G., and N.K.; software, S.T.S.G., N.K., and A.K.; validation, T.A., S.T.S.G., N.K., A.K., S.A., and K.T.; formal analysis, T.A., S.T.S.G., and N.K.; investigation, T.A., S.T.S.G., N.K., S.A., and A.K.; resources, T.A. and S.A.; data curation, S.T.S.G., N.K., and A.K.; writing—original draft preparation, T.A., S.T.S.G., N.K., and A.K.; writing—review and editing, T.A., N.K., S.A., and K.T.; visualization, S.T.S.G. and N.K.; supervision, N.K., T.A., and K.T.; project administration, T.A., S.A., and K.T. All authors have read and agreed to the published version of the manuscript.
Funding
This research received no external funding.
Data Availability Statement
The original contributions presented in this study are included in the article. Further inquiries can be directed to the corresponding authors.
Acknowledgments
The authors used ChatGPT (OpenAI, GPT-5.3) exclusively for preliminary language grammar checks and then reviewed and edited as needed. No generative AI tools were used for data analysis, study design, interpretation of results, or the creation of scientific content. After using this tool, all authors reviewed and edited the content as necessary and take full responsibility for the final version of the manuscript.
Conflicts of Interest
The authors declare that they have no conflicts of interest.
References
- Qazi, A.; Hussain, F.; Rahim, N.A.; Hardaker, G.; Alghazzawi, D.; Shaban, K.; Haruna, K. Towards sustainable energy: A systematic review of renewable energy sources, technologies, and public opinions. IEEE Access 2019, 7, 63837–63851. [Google Scholar] [CrossRef] [Scilit]
- Martins, F.; Felgueiras, C.; Smitkova, M.; Caetano, N. Analysis of fossil fuel energy consumption and environmental impacts in European countries. Energies 2019, 12, 964. [Google Scholar] [CrossRef] [Scilit]
- Gaete-Morales, C.; Gallego-Schmid, A.; Stamford, L.; Azapagic, A. Life cycle environmental impacts of electricity from fossil fuels in Chile over a ten-year period. J. Clean. Prod. 2019, 232, 1499–1512. [Google Scholar] [CrossRef] [Scilit]
- Shah, M.S.; Khan, N.; Abbas, T.; Ahmed, N.; Ali, A.; Khan, R. Design and implementation of a 10 kV/2 A LLC resonant converter with two-step soft-start PID control for industrial magnetron. J. Renew. Sustain. Energy 2025, 17, 064704. [Google Scholar] [CrossRef] [Scilit]
- Hosseini, S.E.; Wahid, M.A. Hydrogen from solar energy, a clean energy carrier from a sustainable source of energy. Int. J. Energy Res. 2020, 44, 4110–4131. [Google Scholar] [CrossRef] [Scilit]
- Qayyum, F.; Jamil, H.; Ali, F. A Review of Smart Energy Management in Residential Buildings for Smart Cities. Energies 2024, 17, 83. [Google Scholar] [CrossRef] [Scilit]
- Avrutin, V.; Izyumskaya, N.; Morkoç, H. Semiconductor solar cells: Recent progress in terrestrial applications. Superlattices Microstruct. 2011, 49, 337–364. [Google Scholar] [CrossRef] [Scilit]
- Ağbulut, Ü.; Sarıdemir, S. A general view to converting fossil fuels to cleaner energy source by adding nanoparticles. Int. J. Ambient. Energy 2021, 42, 1569–1574. [Google Scholar] [CrossRef] [Scilit]
- Aghaei, M.; Fairbrother, A.; Gok, A.; Ahmad, S.; Kazim, S.; Lobato, K.; Oreski, G.; Reinders, A.; Schmitz, J.; Theelen, M.; et al. Review of degradation and failure phenomena in photovoltaic modules. Renew. Sustain. Energy Rev. 2022, 159, 112160. [Google Scholar] [CrossRef] [Scilit]
- Kazerani, M.; Tehrani, K. Grid of Hybrid AC/DC Microgrids: A New Paradigm for Smart City of Tomorrow. In Proceedings of the 2020 IEEE 15th International Conference of System of Systems Engineering (SoSE), Budapest, Hungary, 2–4 June 2020; IEEE: New York, NY, USA, 2020; pp. 175–180. [Google Scholar] [CrossRef] [Scilit]
- Shahid, M.S.; Ali, S.M.; Gulzar, D.; Khan, S.; Khan, H.U.R.; Khan, N. Innovative v2g system for energy management: Insights from matlab simulink simulations. In Proceedings of the 2024 International Conference on IT and Industrial Technologies (ICIT), Chiniot, Pakistan, 10–12 December 2024; IEEE: New York, NY, USA, 2024; pp. 1–6. [Google Scholar]
- Olowu, T.O.; Sundararajan, A.; Moghaddami, M.; Sarwat, A.I. Future challenges and mitigation methods for high photovoltaic penetration: A survey. Energies 2018, 11, 1782. [Google Scholar] [CrossRef] [Scilit]
- Kavlak, G.; McNerney, J.; Trancik, J.E. Evaluating the causes of cost reduction in photovoltaic modules. Energy Policy 2018, 123, 700–710. [Google Scholar] [CrossRef] [Scilit]
- Ali, A.; Almutairi, K.; Padmanaban, S.; Tirth, V.; Algarni, S.; Irshad, K.; Islam, S.; Zahir, M.H.; Shafiullah, M.; Malik, M.Z. Investigation of MPPT techniques under uniform and non-uniform solar irradiation condition—A retrospection. IEEE Access 2020, 8, 127368–127392. [Google Scholar] [CrossRef] [Scilit]
- Chen, J.; Pan, G.; Ouyang, J.; Ma, J.; Fu, L.; Zhang, L. Study on impacts of dust accumulation and rainfall on PV power reduction in East China. Energy 2020, 194, 116915. [Google Scholar] [CrossRef] [Scilit]
- Bayrak, F.; Ertürk, G.; Oztop, H.F. Effects of partial shading on energy and exergy efficiencies for photovoltaic panels. J. Clean. Prod. 2017, 164, 58–69. [Google Scholar] [CrossRef] [Scilit]
- Piccoli, E.; Dama, A.; Dolara, A.; Leva, S. Experimental validation of a model for PV systems under partial shading for building integrated applications. Sol. Energy 2019, 183, 356–370. [Google Scholar] [CrossRef] [Scilit]
- Bernadette, D.; Twizerimana, M.; Bakundukize, A.; Pierre, B.J.; Theoneste, N. Analysis of shading effects in solar PV system. Int. J. Sustain. Green Energy 2021, 10, 47–62. [Google Scholar] [CrossRef] [Scilit]
- Ghosh, S.; Yadav, V.K.; Mukherjee, V. A novel hot spot mitigation circuit for improved reliability of PV module. IEEE Trans. Device Mater. Reliab. 2020, 20, 191–198. [Google Scholar] [CrossRef] [Scilit]
- Faria, J.P.; Pombo, J.A.; Calado, M.R.; Mariano, S.J.P.S. Solar Grid Tied Inverters: Configuration, Topologies, and Control Strategies. In Proceedings of the 2024 IEEE International Conference on Environment and Electrical Engineering and 2024 IEEE Industrial and Commercial Power Systems Europe (EEEIC/I&CPS Europe), Rome, Italy, 17–20 June 2024; IEEE: New York, NY, USA, 2024; pp. 1–6. [Google Scholar]
- Mohamed, A.M.; Mohamad, Y.S. A Comparative Analysis on Different Techniques for Improving the PV System Performance Subjected to Variant Solar Irradiance. J. Adv. Eng. Trends 2024, 43, 243–258. [Google Scholar] [CrossRef] [Scilit]
- Rajani, K.; Ramesh, T. Impact of wiring resistance on PV array configurations in harvesting the maximum power under static and dynamic shading conditions. IETE J. Res. 2024, 70, 936–964. [Google Scholar] [CrossRef] [Scilit]
- Gzaiel, M.B.; Khirouni, K.; Gargouri, M. Optical and electrical studies on the semi-conductor compound for the photovoltaic applications. J. Organomet. Chem. 2021, 950, 121992. [Google Scholar] [CrossRef] [Scilit]
- Devakirubakaran, S.; Verma, R.; Chokkalingam, B.; Mihet-Popa, L. Performance Evaluation of Static PV Array Configurations for Mitigating Mismatch Losses. IEEE Access 2023, 11, 47725–47749. [Google Scholar] [CrossRef] [Scilit]
- Raza, M.Q.; Nadarajah, M.; Ekanayake, C. On recent advances in PV output power forecast. Sol. Energy 2016, 136, 125–144. [Google Scholar] [CrossRef] [Scilit]
- Potnuru, S.R.; Pattabiraman, D.; Ganesan, S.I.; Chilakapati, N. Positioning of PV panels for reduction in line losses and mismatch losses in PV array. Renew. Energy 2015, 78, 264–275. [Google Scholar] [CrossRef] [Scilit]
- Maghami, M.R.; Hizam, H.; Gomes, C.; Radzi, M.A.; Rezadad, M.I.; Hajighorbani, S. Power loss due to soiling on solar panel: A review. Renew. Sustain. Energy Rev. 2016, 59, 1307–1316. [Google Scholar] [CrossRef] [Scilit]
- Alam, M.K.; Rafi, S.; Jalil, M.F.; Kirmani, S. Exploring the PV Topologies in Comparison with Loshu Reconfiguration: Estimate Output Power. In Proceedings of the 2023 IEEE 3rd International Conference on Sustainable Energy and Future Electric Transportation (SEFET), Bhubaneswar, India, 9–12 August 2023; IEEE: New York, NY, USA, 2023; pp. 1–6. [Google Scholar]
- Shukla, A.K.; Sudhakar, K.; Baredar, P. A comprehensive review on design of building integrated photovoltaic system. Energy Build. 2016, 128, 99–110. [Google Scholar] [CrossRef] [Scilit]
- Amelia, A.; Irwan, Y.; Leow, W.; Irwanto, M.; Safwati, I.; Zhafarina, M. Investigation of the effect temperature on photovoltaic (PV) panel output performance. Int. J. Adv. Sci. Eng. Inf. Technol. 2016, 6, 682–688. [Google Scholar] [CrossRef] [Scilit]
- Oufettoul, H.; Lamdihine, N.; Motahhir, S.; Lamrini, N.; Abdelmoula, I.A.; Aniba, G. Comparative Performance Analysis of PV Module Positions in a Solar PV Array Under Partial Shading Conditions. IEEE Access 2023, 11, 12176–12194. [Google Scholar] [CrossRef] [Scilit]
- Bingöl, O.; Özkaya, B. Analysis and comparison of different PV array configurations under partial shading conditions. Sol. Energy 2018, 160, 336–343. [Google Scholar] [CrossRef] [Scilit]
- Fang, X.; Yang, Q. Dynamic reconfiguration of photovoltaic array for minimizing mismatch loss. Renew. Sustain. Energy Rev. 2024, 191, 114160. [Google Scholar] [CrossRef] [Scilit]
- Storey, J.; Wilson, P.R.; Bagnall, D. The optimized-string dynamic photovoltaic array. IEEE Trans. Power Electron. 2013, 29, 1768–1776. [Google Scholar] [CrossRef] [Scilit]
- Myrzik, J.M.; Calais, M. String and module integrated inverters for single-phase grid connected photovoltaic systems—A review. In Proceedings of the 2003 IEEE Bologna Power Tech Conference Proceedings, Bologna, Italy, 23–26 June 2003; IEEE: New York, NY, USA, 2003; Volume 2, p. 8. [Google Scholar]
- Vieira, R.G.; de Araújo, F.M.; Dhimish, M.; Guerra, M.I. A comprehensive review on bypass diode application on photovoltaic modules. Energies 2020, 13, 2472. [Google Scholar] [CrossRef] [Scilit]
- Walker, G.R.; Sernia, P.C. Cascaded DC-DC converter connection of photovoltaic modules. IEEE Trans. Power Electron. 2004, 19, 1130–1139. [Google Scholar] [CrossRef] [Scilit]
- Hosseini, S.H.; Alishah, R.S.; Gharehkoushan, A.Z. Enhancement of extracted maximum power from partially shaded multi-string PV panels using a new cascaded high step-up DC-DC-AC converter. In Proceedings of the 2015 9th International Conference on Electrical and Electronics Engineering (ELECO), Bursa, Turkey, 26–28 November 2015; IEEE: Piscataway, NJ, USA, 2015; pp. 644–648. [Google Scholar]
- Pervez, I.; Antoniadis, C.; Ghazzai, H.; Massoud, Y. A Centralized Multi-String PV System Control with Multi-Dimensional MPPT Control. In Proceedings of the 2022 IEEE Asia Pacific Conference on Circuits and Systems (APCCAS), Shenzhen, China, 11–13 November 2022; IEEE: New York, NY, USA, 2022; pp. 304–308. [Google Scholar] [CrossRef] [Scilit]
- Kolantla, D.; Mikkili, S.; Pendem, S.R.; Desai, A.A. Critical review on various inverter topologies for PV system architectures. IET Renew. Power Gener. 2020, 14, 3418–3438. [Google Scholar] [CrossRef] [Scilit]
- Pendem, S.R.; Mikkili, S. Modeling, simulation and performance analysis of solar PV array configurations (Series, Series–Parallel and Honey-Comb) to extract maximum power under Partial Shading Conditions. Energy Rep. 2018, 4, 274–287. [Google Scholar] [CrossRef] [Scilit]
- Tubniyom, C.; Jaideaw, W.; Chatthaworn, R.; Suksri, A.; Wongwuttanasatian, T. Effect of partial shading patterns and degrees of shading on Total Cross-Tied (TCT) photovoltaic array configuration. Energy Procedia 2018, 153, 35–41. [Google Scholar] [CrossRef] [Scilit]
- Ganesan, S.; David, P.W.; Balachandran, P.K.; Senjyu, T. Fault identification scheme for solar photovoltaic array in bridge and honeycomb configuration. Electr. Eng. 2023, 105, 2443–2460. [Google Scholar] [CrossRef] [Scilit]
- Pendem, S.R.; Mikkili, S. Modeling, simulation, and performance analysis of PV array configurations (Series, Series-Parallel, Bridge-Linked, and Honey-Comb) to harvest maximum power under various Partial Shading Conditions. Int. J. Green Energy 2018, 15, 795–812. [Google Scholar] [CrossRef] [Scilit]
- Sai Krishna, G.; Moger, T. Improved SuDoKu reconfiguration technique for total-cross-tied PV array to enhance maximum power under partial shading conditions. Renew. Sustain. Energy Rev. 2019, 109, 333–348. [Google Scholar] [CrossRef] [Scilit]
- Krishna, S.G.; Moger, T. Optimal SuDoKu Reconfiguration Technique for Total-Cross-Tied PV Array to Increase Power Output Under Non-Uniform Irradiance. IEEE Trans. Energy Convers. 2019, 34, 1973–1984. [Google Scholar] [CrossRef] [Scilit]
- Kumar Pachauri, R.; Thanikanti, S.B.; Bai, J.; Kumar Yadav, V.; Aljafari, B.; Ghosh, S.; Haes Alhelou, H. Ancient Chinese magic square-based PV array reconfiguration methodology to reduce power loss under partial shading conditions. Energy Convers. Manag. 2022, 253, 115148. [Google Scholar] [CrossRef] [Scilit]
- Pachauri, R.K.; Minai, A.F. PV Array Topology Design and Performance Evaluation under Partial Shade Situations to Reduce Mismatching Power Losses. In Proceedings of the 2022 IEEE International Conference on Current Development in Engineering and Technology (CCET), Bhopal, India, 23–24 December 2022; IEEE: New York, NY, USA, 2022; pp. 1–6. [Google Scholar]
- Dhanalakshmi, B.; Rajasekar, N. Dominance square based array reconfiguration scheme for power loss reduction in solar PhotoVoltaic (PV) systems. Energy Convers. Manag. 2018, 156, 84–102. [Google Scholar] [CrossRef] [Scilit]
- Reddy, S.S.; Yammani, C. Odd-Even-Prime pattern for PV array to increase power output under partial shading conditions. Energy 2020, 213, 118780. [Google Scholar] [CrossRef] [Scilit]
- Nihanth, M.S.S.; Ram, J.P.; Pillai, D.S.; Ghias, A.M.; Garg, A.; Rajasekar, N. Enhanced power production in PV arrays using a new skyscraper puzzle based one-time reconfiguration procedure under partial shade conditions (PSCs). Sol. Energy 2019, 194, 209–224. [Google Scholar] [CrossRef] [Scilit]
- Venkateswari, R.; Rajasekar, N. Power enhancement of PV system via physical array reconfiguration based Lo Shu technique. Energy Convers. Manag. 2020, 215, 112885. [Google Scholar] [CrossRef] [Scilit]
- Madhusudanan, G.; Senthilkumar, S.; Anand, I.; Sanjeevikumar, P. A shade dispersion scheme using Latin square arrangement to enhance power production in solar photovoltaic array under partial shading conditions. J. Renew. Sustain. Energy 2018, 10, 053506. [Google Scholar] [CrossRef] [Scilit]
- Storey, J.P.; Wilson, P.R.; Bagnall, D. Improved optimization strategy for irradiance equalization in dynamic photovoltaic arrays. IEEE Trans. Power Electron. 2012, 28, 2946–2956. [Google Scholar] [CrossRef] [Scilit]
- Yang, B.; Ye, H.; Wang, J.; Li, J.; Wu, S.; Li, Y.; Shu, H.; Ren, Y.; Ye, H. PV arrays reconfiguration for partial shading mitigation: Recent advances, challenges and perspectives. Energy Convers. Manag. 2021, 247, 114738. [Google Scholar] [CrossRef] [Scilit]
- Orozco-Gutierrez, M.; Spagnuolo, G.; Ramirez-Scarpetta, J.; Petrone, G.; Ramos-Paja, C. Optimized configuration of mismatched photovoltaic arrays. IEEE J. Photovoltaics 2016, 6, 1210–1220. [Google Scholar] [CrossRef] [Scilit]
- Afridi, M.; Tatapudi, S.; Flicker, J.; Srinivasan, D.; Tamizhmani, G. Reliability evaluation of DC power optimizers for photovoltaic systems: Accelerated testing at high temperatures with fixed and cyclic power stresses. Eng. Fail. Anal. 2023, 152, 107484. [Google Scholar] [CrossRef] [Scilit]
- Ramli, M.Z.; Salam, Z. Performance evaluation of dc power optimizer (DCPO) for photovoltaic (PV) system during partial shading. Renew. Energy 2019, 139, 1336–1354. [Google Scholar] [CrossRef] [Scilit]
- Kabalci, E.; Boyar, A.; Kabalci, Y. Design and analysis of a micro inverter for PV plants. In Proceedings of the 2017 9th International Conference on Electronics, Computers and Artificial Intelligence (ECAI), Targoviste, Romania, 29 June–1 July 2017; IEEE: New York, NY, USA, 2017; pp. 1–6. [Google Scholar]
- Zhang, L.; Barakat, G.; Yassine, A. Deterministic optimization and cost analysis of hybrid PV/wind/battery/diesel power system. Int. J. Renew. Energy Res. 2012, 2, 686–696. [Google Scholar]
- Gao, L.; Dougal, R.A.; Liu, S.; Iotova, A.P. Parallel-connected solar PV system to address partial and rapidly fluctuating shadow conditions. IEEE Trans. Ind. Electron. 2009, 56, 1548–1556. [Google Scholar] [CrossRef] [Scilit]
- Tehrani, K.; Khan, N.; Djaghloul, C.; Abbas, T.; Bonnet, P.; Paladian, F.; Pasquier, C.; Drissi, K.E.K.; Vurpillot, F.; Jamshidi, M. A Survey of AI in System of Systems With a Focus on Power Electronic Systems—Part II: Maintenance and Forecasting. IEEE Syst. J. 2025, 19, 1025–1037. [Google Scholar] [CrossRef] [Scilit]
- Tehrani, K.; Khan, N.; Djaghloul, C.; Abbas, T.; Bonnet, P.; Paladian, F.; Pasquier, C.; Khamlichi Drissi, K.E.; Vurpillot, F.; Jamshidi, M. A Survey of AI in System of Systems with a Focus on Power Electronic Systems—Part I: Design and Control. IEEE Syst. J. 2025, 19, 1011–1024. [Google Scholar] [CrossRef] [Scilit]

Disclaimer/Publisher’s Note: The statements, opinions and data contained in all publications are solely those of the individual author(s) and contributor(s) and not of MDPI and/or the editor(s). MDPI and/or the editor(s) disclaim responsibility for any injury to people or property resulting from any ideas, methods, instructions or products referred to in the content. |
© 2026 by the authors. Licensee MDPI, Basel, Switzerland. This article is an open access article distributed under the terms and conditions of the Creative Commons Attribution (CC BY) license.