1. Introduction
Energy and environmental sustainability are crucial aspects in the context of today’s global challenges. Sustainability aims to meet current energy needs without compromising the ability of future generations to meet their own [
1]. It promotes the use of renewable energy sources, such as solar, wind [
2], and hydroelectric energy [
3] and sustainable development [
4], while reducing greenhouse gas emissions [
5,
6,
7]. In parallel, environmental sustainability focuses on preserving ecosystems, reducing pollution [
8], managing natural resources responsibly, and promoting biodiversity. In this framework, the concept of smart cities emerges as an integrated solution to address sustainability challenges [
9] in urban areas and to reach the Sustainable Development Goals (SDGs) [
10].
The optimal management of energy resources represents an essential component of smart cities. Such management encompasses promoting renewable energy sources and distributed energy systems, including solar panels and microgrids. These cities invest in sustainable mobility [
11], integrating green public transport [
12], smart traffic lights [
13], electric vehicles, and charging infrastructure [
14,
15] to reduce carbon emissions and improve air quality. The integrated approach of thinking, designing, and managing smart cities exemplifies the potential for innovative technologies [
16,
17] to be employed in the pursuit of energy and environmental sustainability objectives. This issue not only enhances the quality of life of citizens but also contributes to a more sustainable and resilient future [
18]. Moreover, these cities serve as exemplars of sustainable urban development [
19], offering practical and replicable solutions on a global scale. They demonstrate how the combination of advanced technologies and sustainable management practices can effectively address the challenges of urbanisation and climate change [
20,
21].
To evaluate the performance of the different actions within the integrated smart cities approach, several methods were proposed in the literature. Esteban-Narro et al. [
22] defined a multidimensional tool to support the planning phase in evaluating the projects of transformation of the city; Bandeiras et al. [
23] developed a multi-criteria model applicable to different policy scenarios to assess the sustainability of energy resources in their energy efficiency, energy supply, and storage technology. The ELECTRE system was realised to support the selection of the most appropriate technology for the smart city [
24], and the BTOPSIS method was utilised for analysing the data coming from citizens’ evaluation of urban factors that assess the quality of life within the city [
25]. Some studies developed algorithms for different optimisation purposes: the scheduling for fuel dispatching, power generation [
26], or for the optimal operation of a hydrogen hub [
27], the functions of the smart street lighting [
28], and the indication of the best parking solution. Other studies proposed models based on the finalised fuzzy logic to address the multiple urban issues [
29], to rank the strategies related to business intelligence [
30], to evaluate the sustainable energy systems [
31], to select the smart transportation systems most suited for each city [
32], to define the optimal management of indoor systems in Nzebs [
33], and to determine the location of service stations for electric vehicles [
34].
To rank smart actions, it is essential to collect appropriate key performance indicators (KPIs). These indicators play a key role in measuring the impact of selected strategies on different fields and promoting energy sustainability. KPIs allow ongoing strategies to be adapted and optimised to ensure long-term benefits. This goal is currently relevant, as pointed out by the project “Fit for 55,” aiming to reduce greenhouse gas emissions and promote a low-carbon economy [
35].
There are several KPIs in the literature, such as GHG emission reduction, energy consumption, resource efficiency, and air quality, that can promote smart cities towards decarbonization goals [
36]. In this context, smart energy system models are used to analyse how carbon pricing policies influence energy costs for users and the integration of renewable sources, which are key factors for decarbonization [
37]. For instance, integrating green infrastructure [
38], adopting energy-efficient technologies in buildings [
39,
40], and promoting low-emission transport can significantly contribute to improving the quality of the urban environment and reducing the overall carbon footprint. Incorporating targeted KPIs within a strategic framework, such as the “Fit for 55,” allows them to dynamically adapt their strategies in response to achievements. The mentioned approach not only promotes transparency and accountability in the implementation of urban policies but also ensures more resilient urban systems.
The first list of KPIs was related to business administration, where they provide a means of measuring corporate performance in achieving broader objectives [
41]. These indicators are quantifiable metrics that reflect an organisation’s performance in the context of achieving its strategic objectives. Gradually, the use of KPIs has extended beyond business and industry to government administration. In general, indicators and, in particular, KPIs should express as accurately as possible the degree to which a target or standard has been met or exceeded. To assess progress towards a specific target, a variety of indicators are available [
42]. It is of the utmost importance that the indicators identified are measurable, and preferably objectively so. For the majority of indicators within the people, governance, and propagation themes, quantitative measurability is limited. However, the social sciences offer approaches to deal with qualitative information in a semi-quantitative way [
43]. To ensure reliability, the definitions of indicators must be clear and not open to different interpretations. In many cases, an existing set of indicators that meet this requirement can be relied upon. New indicators are defined in a meaningful manner in the context of existing policy objectives [
44]. Furthermore, indicators within a system should not measure the same aspect of a sub-theme, as this would result in redundancy. Independence implies that minor alterations to the measurement of one indicator should not affect the preferences assigned to other indicators in the evaluation.
In this framework, this study proposes a smart evaluation of selected strategies to reduce gas emissions and increase the spread of renewable sources in an urban district. The role of the selected KPIs in the study is crucial to calculate the impact of strategies on different fields, such as environmental, community, and economic aspects. The smart methodology was previously defined by the authors [
45] and it is essential to aggregate the KPIs into a unique value that reflects the overall impact of the strategies considered. The main output of the work is to evaluate the final score per strategy, drafted in a priority ranking. The ranking gives a list of priorities that can guide policies and designers during the realisation processes.
Two scenarios are used for the integration of renewable energy sources into urban infrastructure. The first scenario involves the installation of a photovoltaic (PV) field on the roof of an abandoned building to power an electric bus line. The second scenario considers the deployment of smart traffic lights. The proposed interventions foresee an increase in the produced and self-consumed renewable share and a substantial reduction in CO2 emissions. This reduction is linked to the diminished use of energy produced from fossil fuels and to an improvement in the management of motorised traffic, with the consequent lowering of the related consumption. Although the two proposed interventions were developed by analysing specific data from a particular urban context, the measures proposed can be generalised and applied in other cities.
Moreover, the work proposes to employ a quantitative approach to identify a priority among the proposed interventions. The analysis, therefore, initially focuses on the identification of key performance indicators (KPIs) that are useful for characterising the interventions; then, an overall numerical value was attributed to each scenario, representing the impact of each scenario on the identified smart axes. This process enabled the identification of the most effective and pressing strategies, which were then ranked in order of priority. The presented work aims to evaluate the effectiveness of integrated smart city initiatives by defining and monitoring key performance indicators (KPIs), ensuring alignment with long-term sustainability goals, and contributing to reducing environmental impact.
The paper is structured as follows:
Section 2 delineates the methodology employed, including the tools utilised and the input required for the different actions.
Section 3 presents a detailed account of the primary findings, followed by the discussion (
Section 4), while
Section 5 offers a synthesis of the key insights. The presented work aims to evaluate the effectiveness of integrated smart city initiatives by defining and monitoring key performance indicators (KPIs), ensuring alignment with long-term sustainability goals, and contributing to reducing environmental impact.
2. Materials and Methods
The preliminary stage of the investigation entailed a comprehensive analysis of the case study to identify the principal weaknesses and potential solutions. In order to identify the priority actions, a survey was carried out among citizens to evaluate the solutions they prefer: the most rated interventions were considered in this study. The initial proposal involved the redevelopment of the former landfill site; this entailed the conversion of the principal structure into a depot for electric buses, with a photovoltaic system installed on the roof of the building itself. The structure was modelled using AutoCAD 3D software (Version 2025) to obtain a suitable model for subsequent simulations. The photovoltaic field was thus modelled using PvSyst 8; once the CAD model was imported into PvSyst, the system components (inverters and panels) were selected, and the orientation of the structure and project parameters (inclination and orientation) were defined. This enabled the calculation of the system’s annual production to be made. The proposed solution entails virtual self-consumption, grid-connected operation, and a year-long energy balance based on the total energy produced and consumed. In particular, the energy is employed to recharge a fleet of electric buses that operate on a local public transport route. By selecting the bus model and assuming a charging strategy that optimises battery life and maximises the number of daily routes, the reduction in pollutant emissions due to reduced fuel consumption resulting from a shift from private to public transport was estimated. This estimation can be made based on the assumption that the selected bus model is representative of the average bus model in terms of battery life and daily routes.
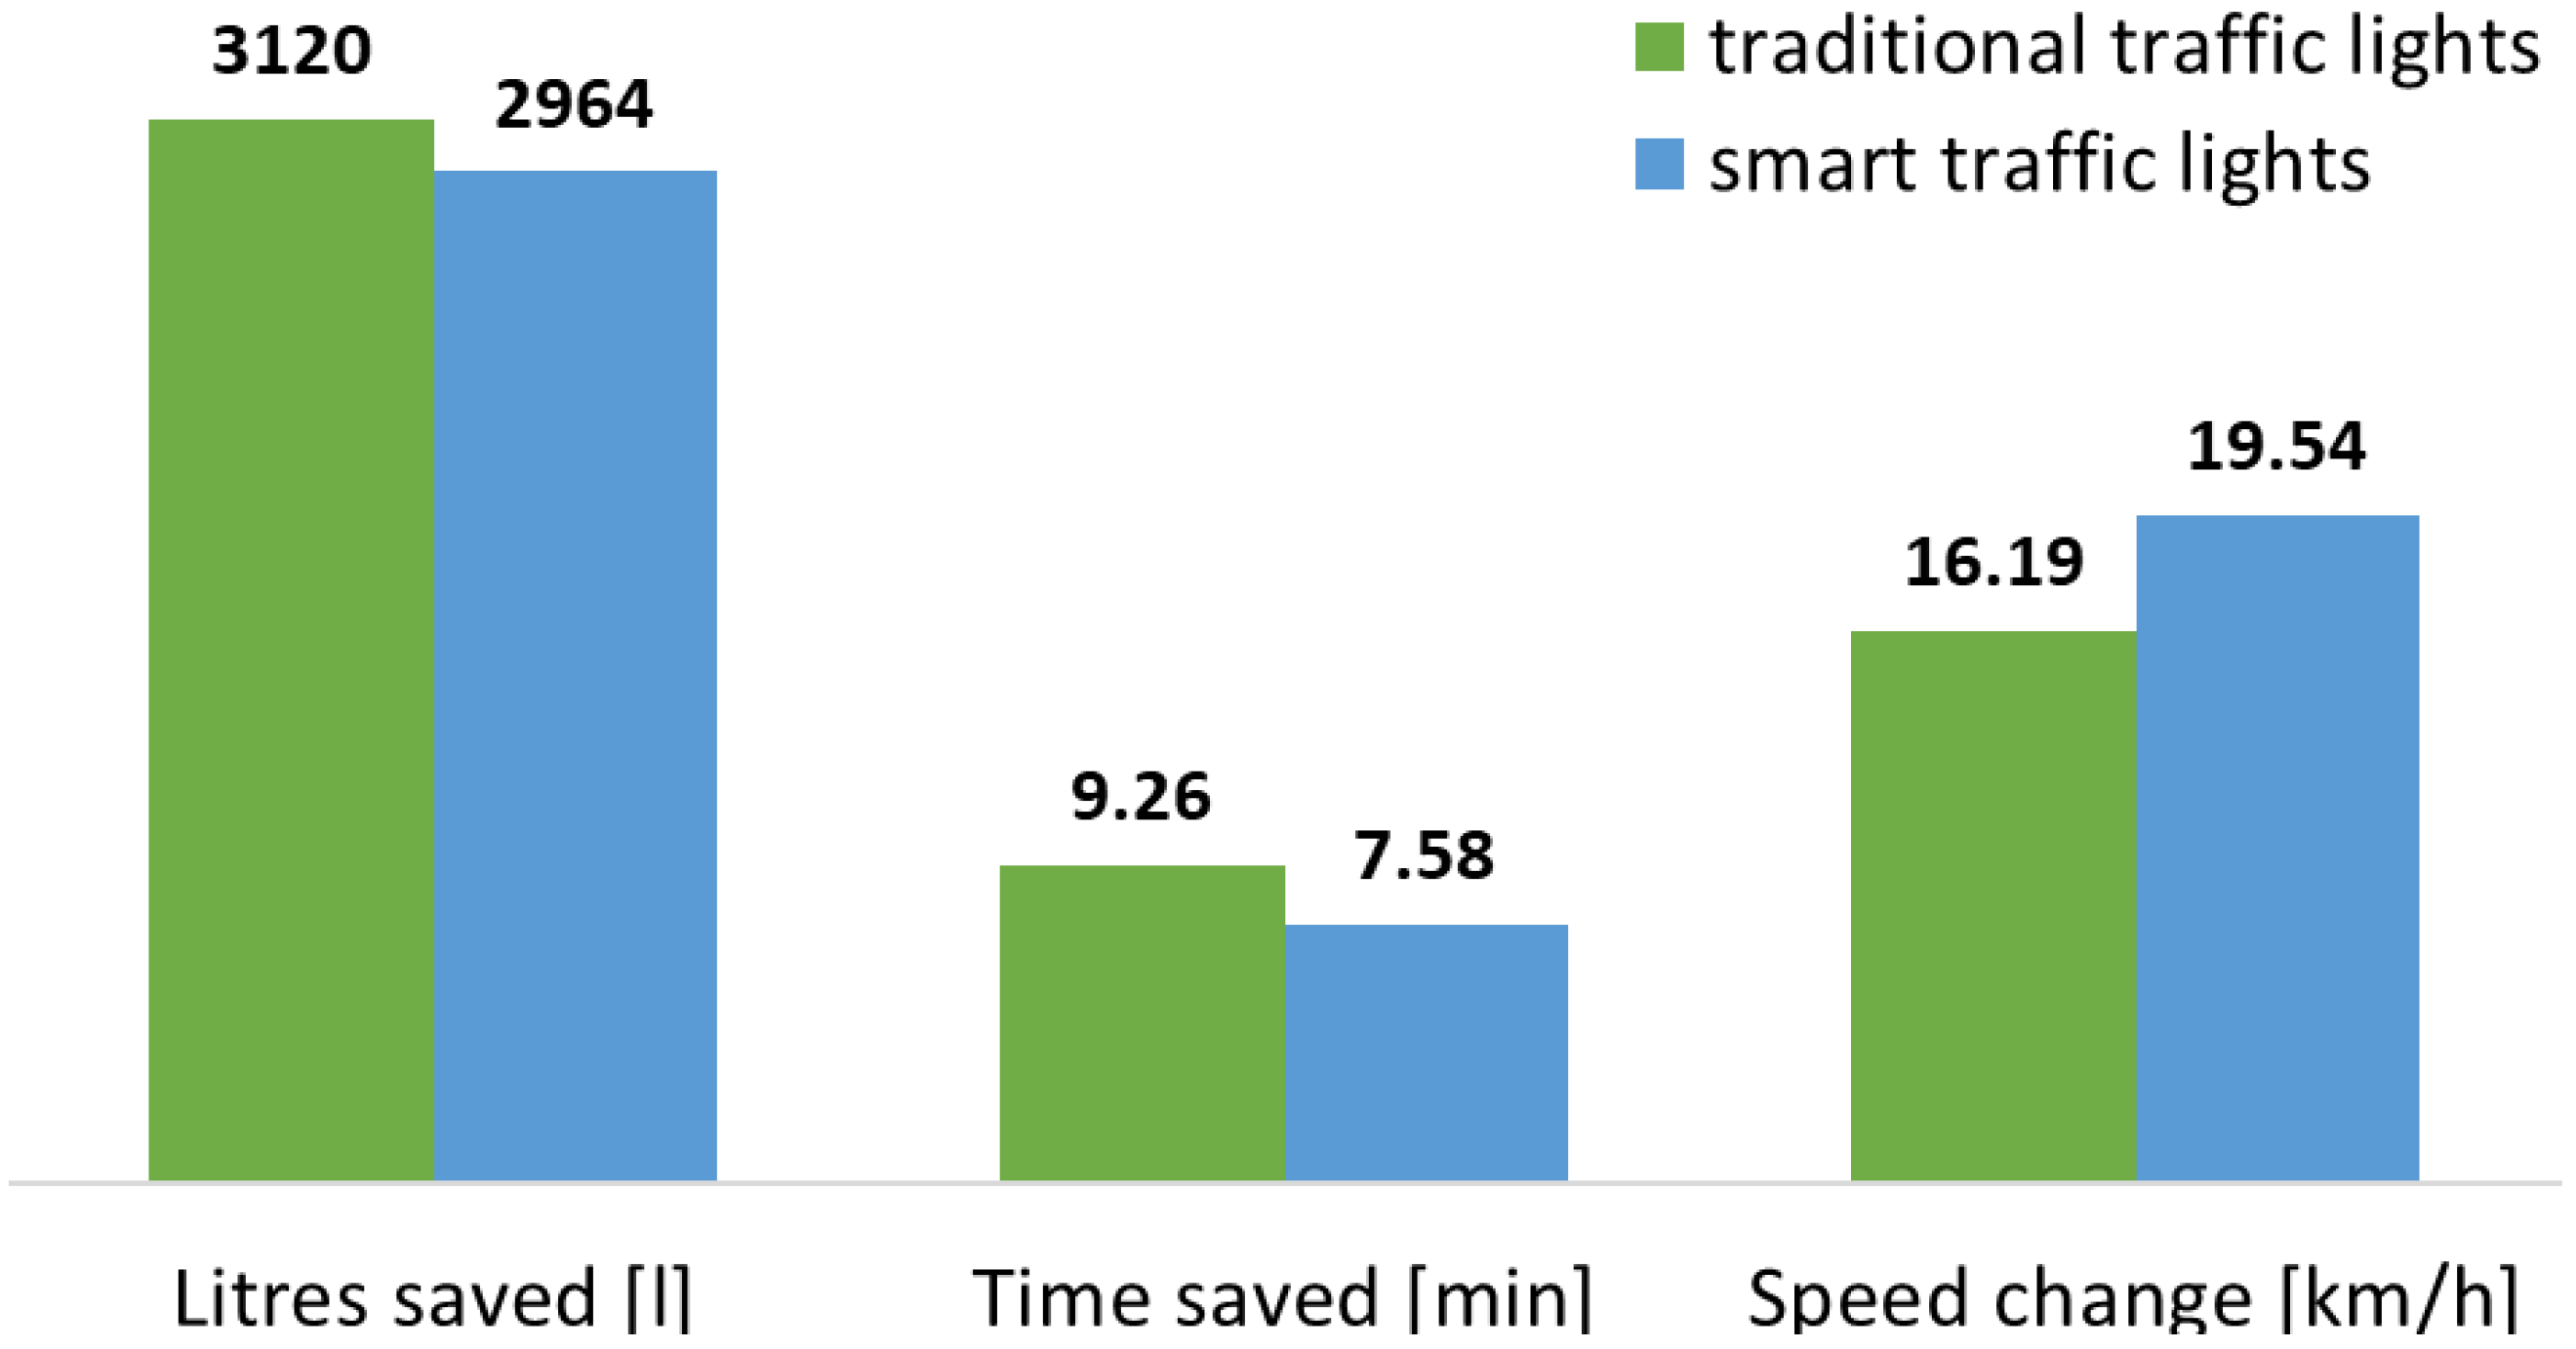
The second proposed action is the Intelligent Traffic Lights (ITS) scenario. The behaviour and effects of the ITS were simulated using NetLogo 7, a programming language and integrated development environment (IDE) for agent-based modelling. The software was selected for its capacity to provide a granular representation of the system, encompassing individual vehicles and their distinctive characteristics. Furthermore, the system enables the monitoring of parameters that are of interest for the study, including CO2 reduction, idling time, reduction in average travel time, average speed, and average consumption, as well as the number of stops. The simulation results were then compared with empirical data, both to refine the model in the initial phase and to highlight the effectiveness of the tool in describing this type of phenomenon. The final results of the smart traffic light simulations were compared with those of the traditional traffic light simulations.
Subsequently, to prioritise the different proposed strategies, a quantitative incidence matrix was developed [
45] to compare the different scenarios to the smart axes. To define the matrix properly, it is necessary to propose more than two solutions. Therefore, this study not only analyses the two central strategies of intelligent traffic lights and landfill reconversion but also includes a scenario involving the modernisation of a municipal library and the replacement of traditional streetlamps with intelligent lamps. Firstly, the KPIs were defined, and for each one, the relevance to the proposed scenario was assessed. A numerical value was then assigned to each scenario, thereby providing a comprehensive representation of the impact of each scenario on the identified smart axes. The obtained score of the interventions is then adjusted by two coefficients representing the economic-financial feasibility and the temporal feasibility of the interventions themselves to obtain a final ranking. The following subsections provide detailed explanations of the smart method’s steps as well as the case study employed.
2.1. Case Study
The proposed interventions have been designed for the third municipality of Rome. The characteristics of the municipality do not significantly affect the applicability of these solutions in other contexts. The implementation of a photovoltaic field and an electric bus route represents a viable measure for most urban centres, assuming the availability of adequate space for the installation of the PV plant. However, the variation in the performance of the panels depending on the location must be taken into account. Similarly, the values associated with the bus route indicators depend on specific estimates of use in the context studied. It is also worth noting that the use of electric buses is limited in terms of route length or duration unless intermediate charging stations are installed, which are unnecessary in this case.
In total, the structure occupies an area of approximately 40,000 square metres with a perimeter of 1027 m. The total area can be divided into three zones of interest:
The area currently used as a parking area and workshop for landfill vehicles, with an area of 11,238 square metres and a length of 334 m.
The first unused structure of the plant, with an area of 18,445 square metres and a perimeter of 529 m.
The second structure, which is currently not in use, has an area of 7175 square metres and a perimeter of 374 m.
The photovoltaic plant was installed on the existing but currently unused structure. The plant occupies an area of 5397 square metres and consists of 2656 Trinasolar TSM-DE15M-(II)-400 modules [
46], each with a nominal power of 400 Wp, for a total of 1062 kWp (
Table 1). The modules are inclined at 30° to the horizontal surface. The DC/AC converter employed is an Emerson SPV 1800 [
47], which has a rated power of 1060 kW and an AC/DC ratio of 1 (
Table 2). The electric bus selected is the basic 3-door Mercedes eCitaro [
48]. The estimated range of the vehicle is approximately 320 km when using the entire battery pack, which consists of 12 modules. Each module is composed of a package of 12 NMC2 batteries of 33 kWh, for a total capacity of 396 kWh.
AutoCAD 3D was initially employed to generate the three-dimensional model of the structure that would house the photovoltaic plant. The CAD project was then imported into the PVsyst software, which enabled the modelling of the installation.
The proposed circular route of buses is approximately 28 km long with an estimated journey time of approximately 90 min, taking into account potential city traffic, the need for passenger stops, and the final stop at the terminal. The strategy for managing charge cycles and bus use is as follows: assuming an average consumption of 1.5 kWh/km [
49], each route consumes a total of 42 kWh. To optimise battery life, it is assumed that the consumption is evenly distributed across the twelve modules, resulting in a reduction of 3.5 kWh per module after each complete route. This strategy exploits partial cycle operation to ensure that the residual capacity threshold of 16.5 kWh [
50] is not breached. Therefore, with a consumption of 3.5 kWh per route, each bus can complete four routes before recharging.
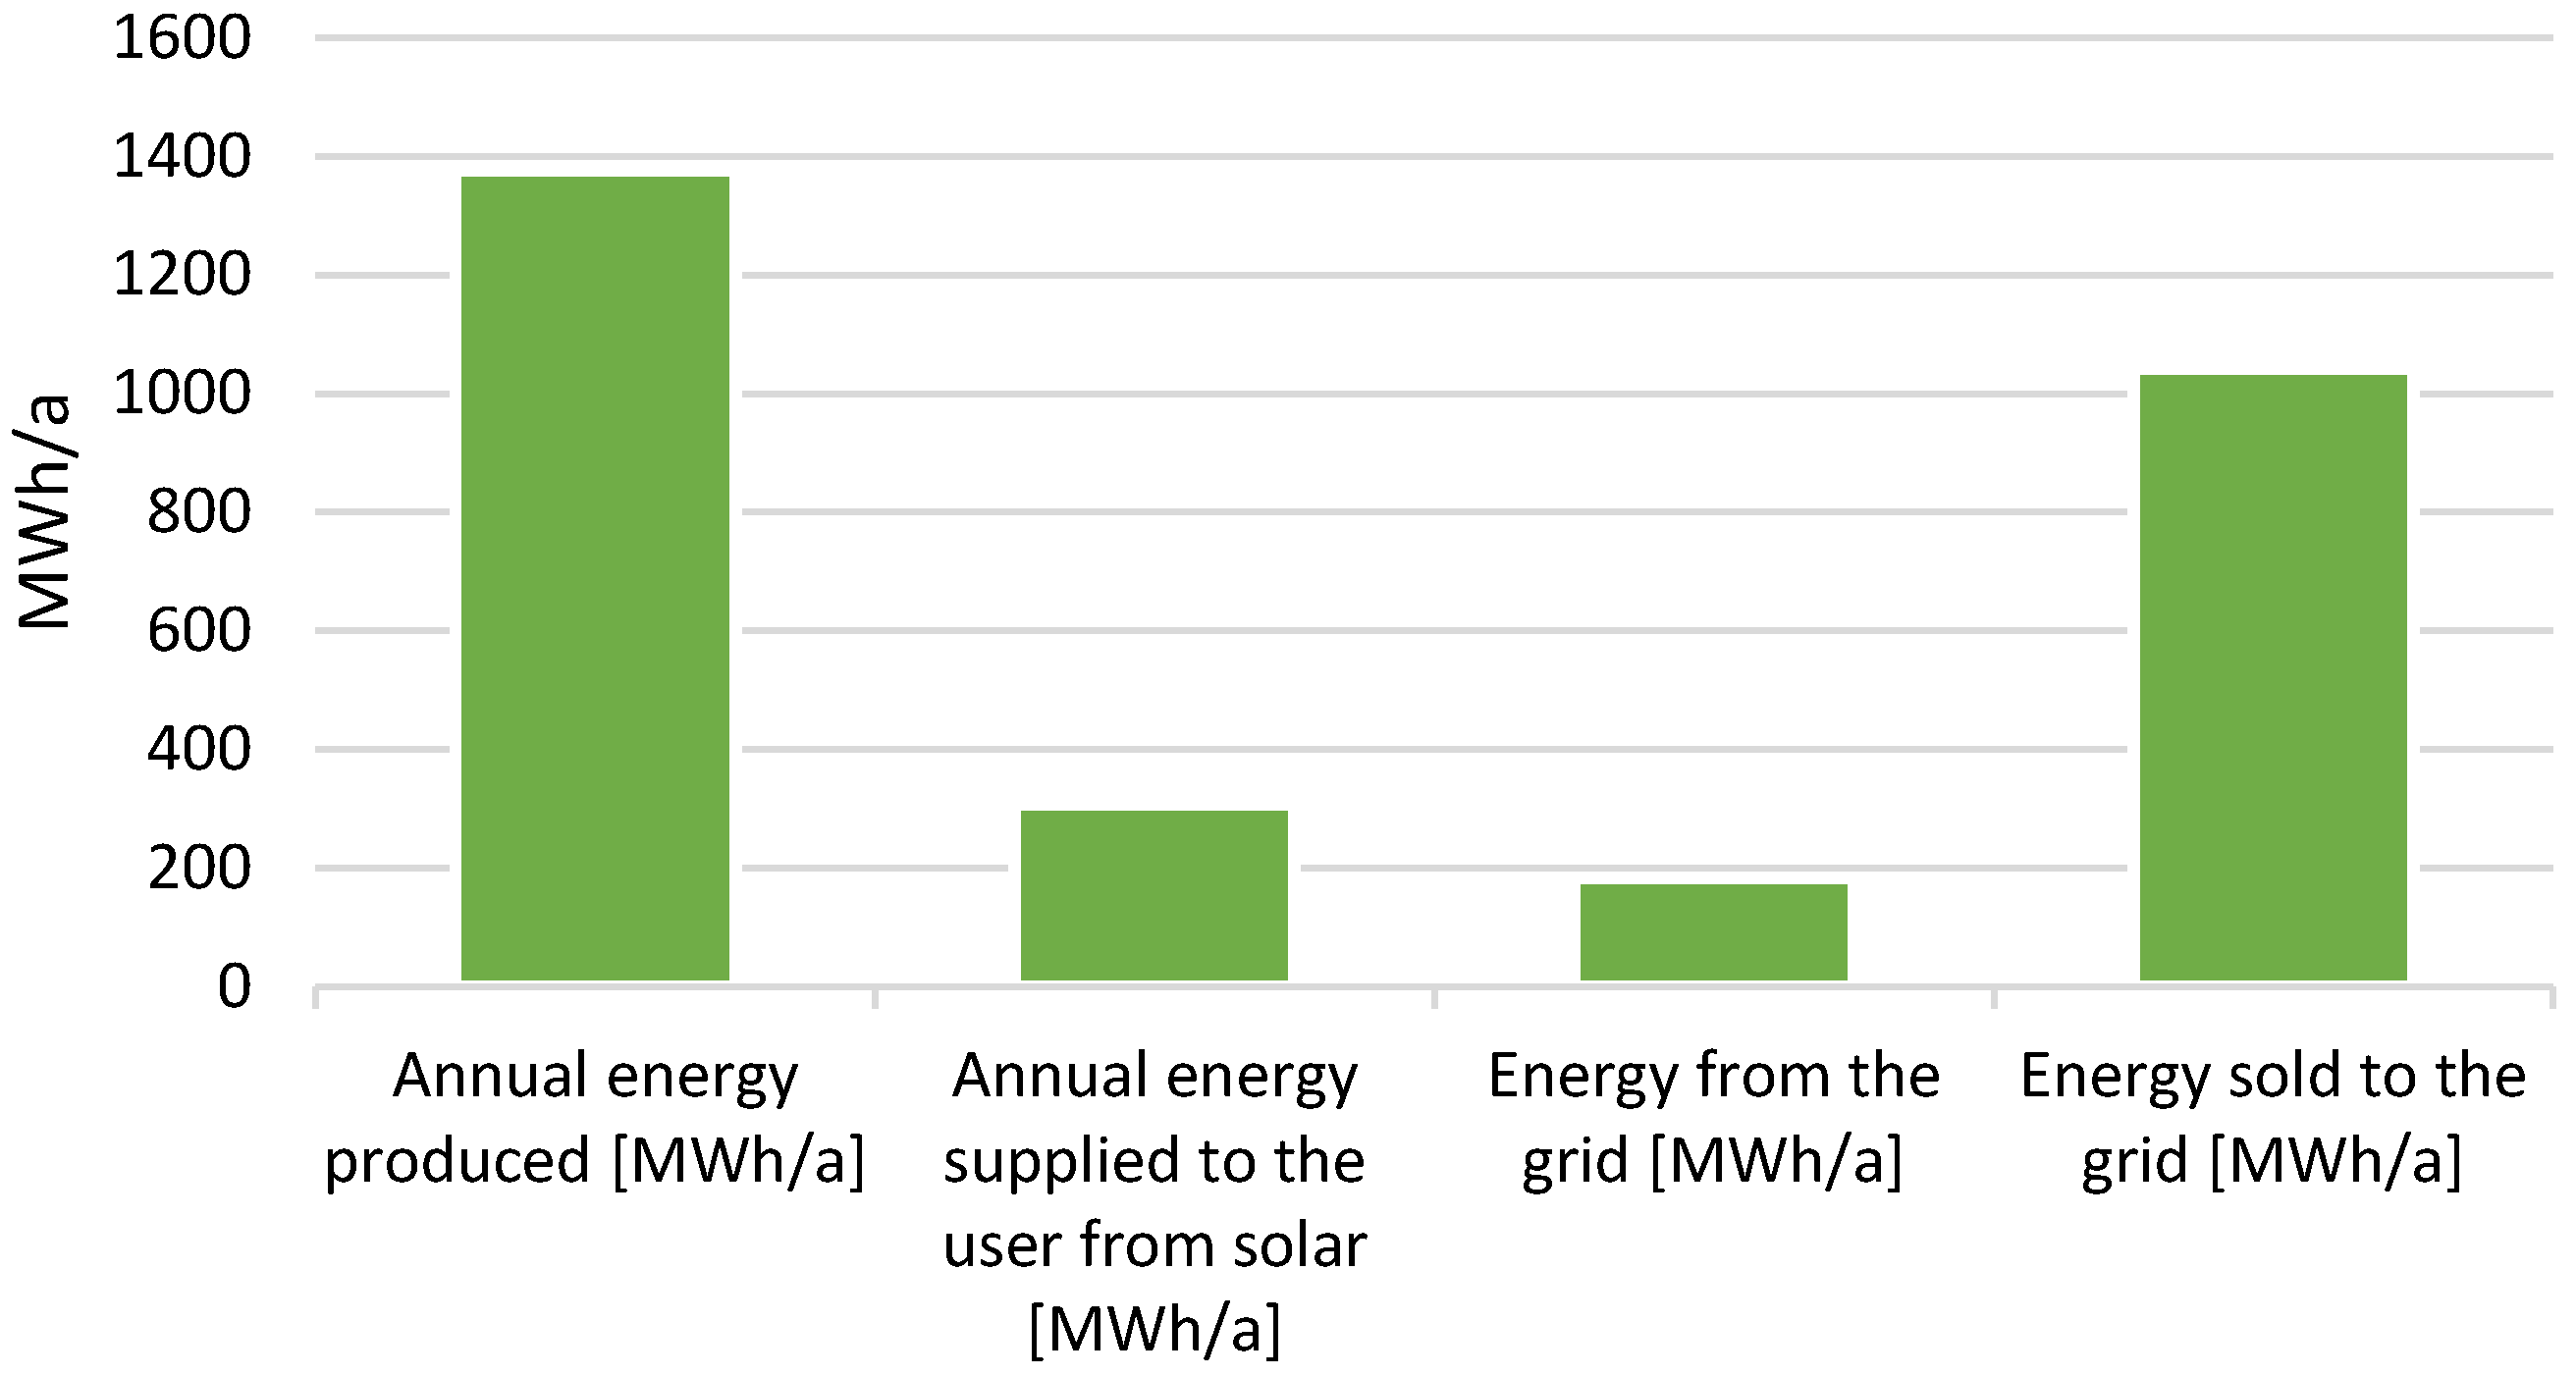
For recharging, a system capable of delivering 360 kW has been assumed, with a duration of 28 min (approximately 30 min). Two charging stations have been purchased to circumvent potential issues that may arise when multiple buses require simultaneous charging. It is assumed that four buses are used, with the first leaving at 7:00 in the morning and subsequent buses leaving every thirty minutes, with the last bus returning to the station at 22:00. Furthermore, it is essential to connect the charging stations to the grid to guarantee the availability of charging for the vehicles even when the photovoltaic plant is not generating power.
It can be assumed that for every 100 people using electric buses, there is a reduction of approximately 70 cars on the road [
51]. Subsequently, the average fuel consumption was estimated to be 7 litres per 100 km, and the daily result was extrapolated to reflect the annual consumption. Moreover, the conversion factor from kg to tonne of oil equivalent (Toe), which is equivalent to 1.051 Toe/kg [
52], the density of petrol, which is 0.76 kg/dm
3 [
31], and the primary energy conversion factor of 0.086 Toe/MWh [
53] have been employed to assess the results obtained and to facilitate comparison with the outcomes of alternative actions.
For the economic analysis, a unit cost of EUR 250,000 was assumed for each bus [
54], EUR 4000 for each charging station, and EUR 1500 per kWp for the photovoltaic system. It was assumed that operating and maintenance costs would be equal to 4% [
55], 2% [
56], and 2% [
57], respectively. Given the considerable total investment foreseen for this scenario, a financial structure of 70% debt and 30% equity was assumed. The investment period was assumed to be thirty years. The reference price for electricity sold is 0.25 EUR/kWh [
58]. Furthermore, the “renovation bonus” incentive, which guarantees a 50% reduction in IRPEF (Italian personal income tax) up to a maximum expenditure limit of EUR 96,000, divided into ten equal annual instalments, has also been applied.
2.2. NetLogo Intelligent Traffic Light Simulations
The traffic light system model was created using the two-dimensional version of NetLogo. It provides researchers with a flexible environment to create simulations where autonomous agents interact with each other and their environment. NetLogo supports the development of models that incorporate dynamic behaviours, rules, and emergent properties, making it suitable for exploring phenomena such as traffic dynamics. In traffic modelling, NetLogo allows for the representation of vehicles as agents that follow personalised rules for acceleration, deceleration, and lane changing. This enables the simulation and analysis of traffic flow dynamics, congestion patterns, and the impact of different traffic management strategies (including smart traffic lights). Researchers can adjust parameters such as vehicle density, road network topology, and signal timing algorithms to investigate their influence on traffic efficiency and safety within simulated environments.
The environment in which the agents (cars) operate is defined by “tiles,” which are built-in agents that represent floor tiles. The NetLogo environment employs a built-in variable, “ticks,” to track the passage of time: each time a command sequence is executed, a tick is added to the elapsed time. In the analysed model, a tick is equivalent to one second.
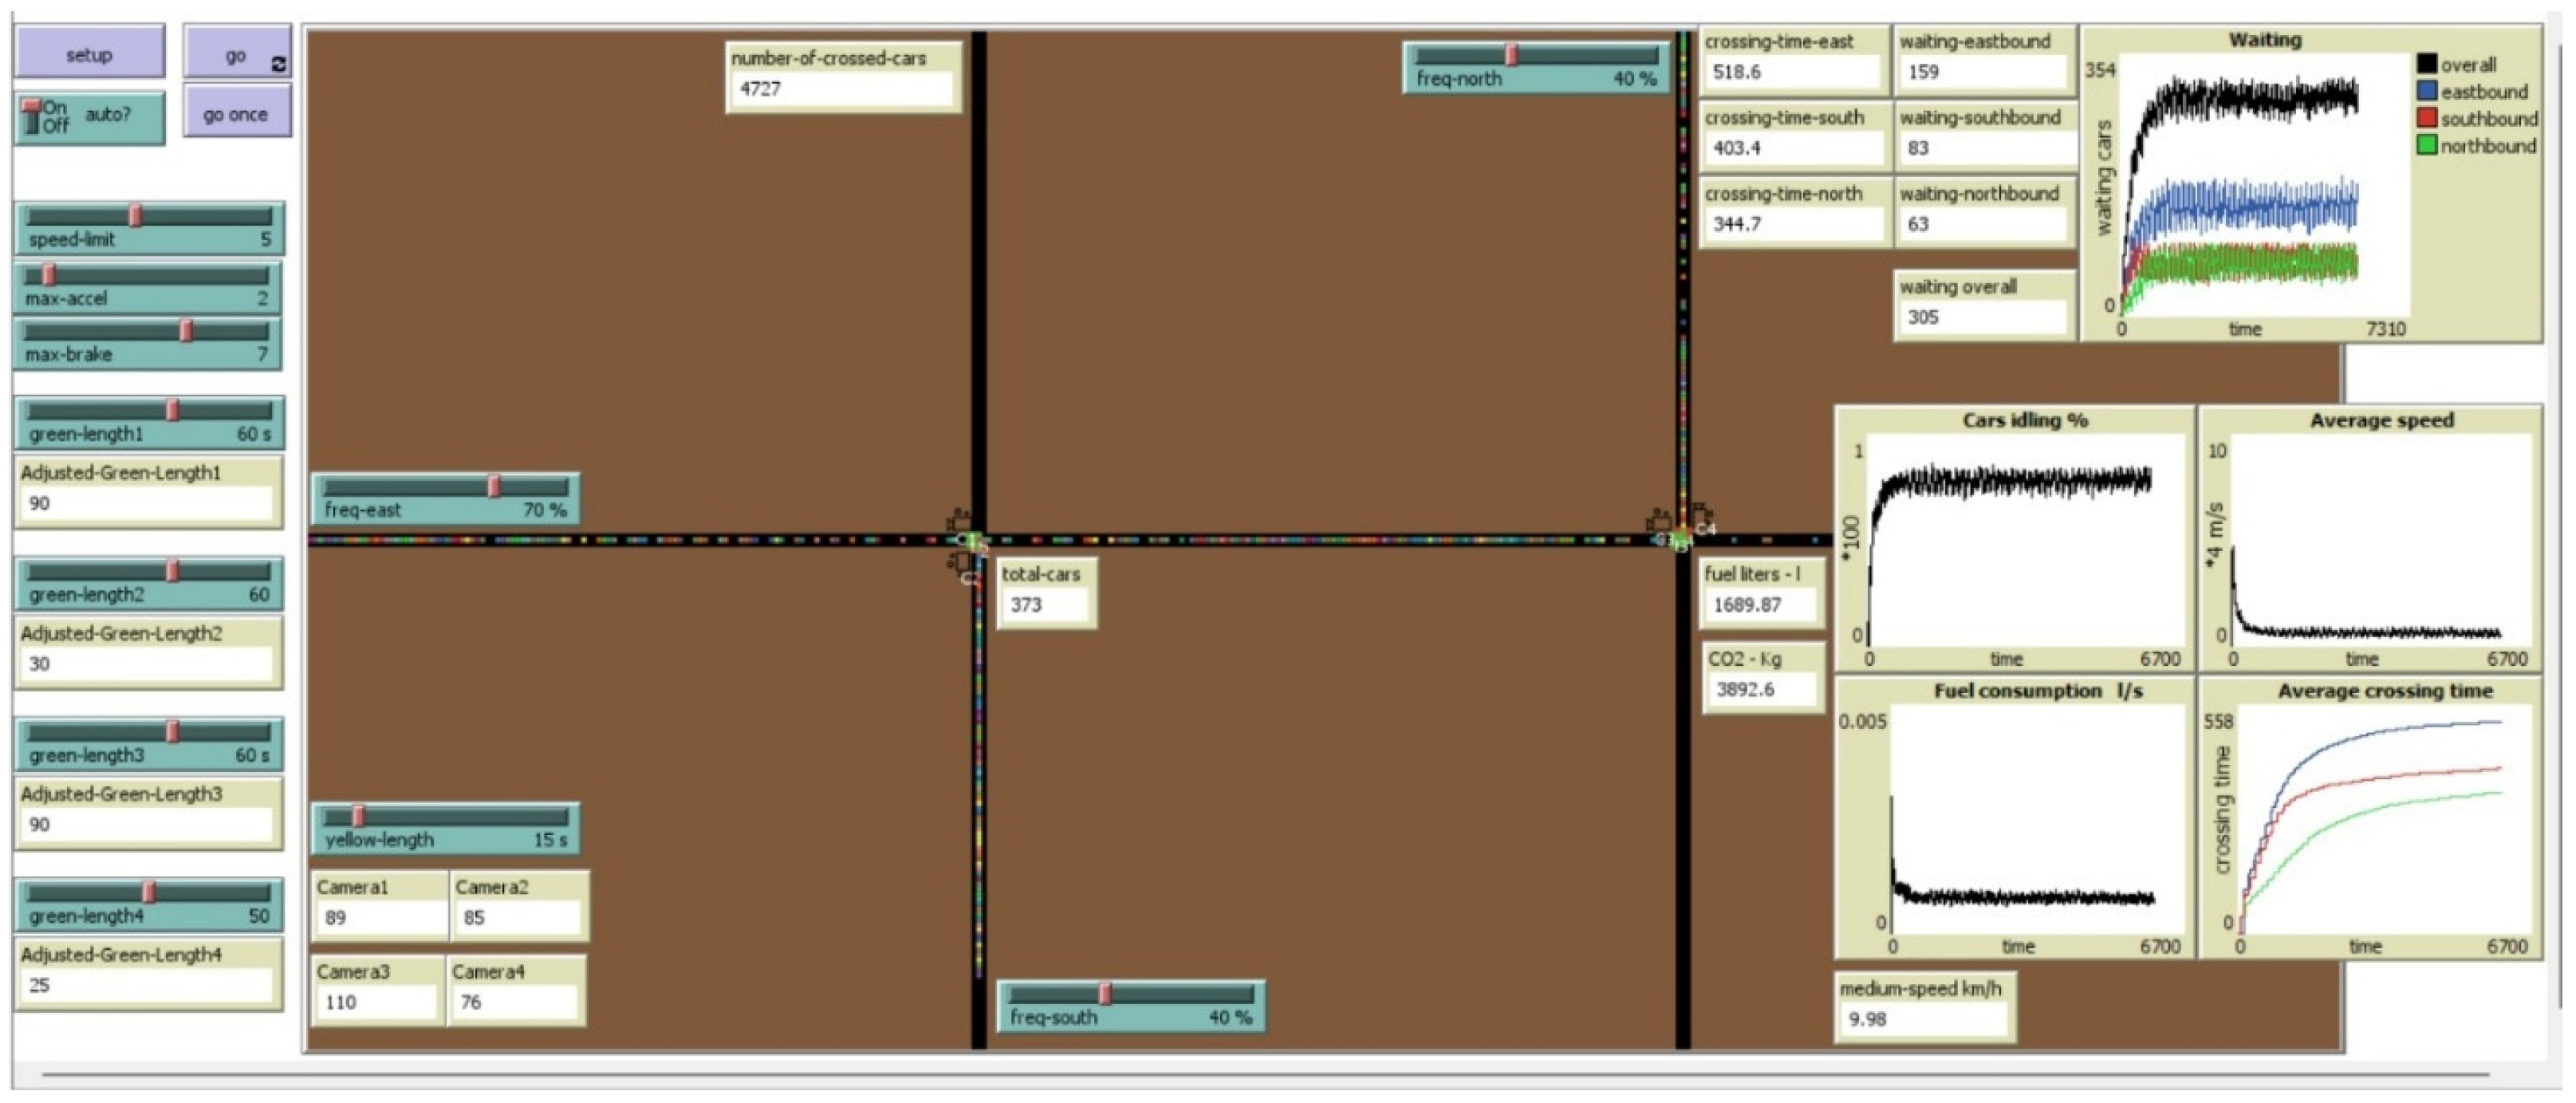
In this project, the spatial domain of the model was represented by a rectangular brown frame measuring 400 × 200 “tiles” or “patches” (see
Figure 1). In the model, cars are represented by the length of a single patch. Therefore, assuming an average car length of 4 m, the unit area of the model, i.e., the patch, corresponds to a square of 4 × 4 m, describing an area of 1.6 × 0.8 km.
The model depicts a principal road intersecting with two perpendicular side roads. All roads in the model are single-lane and one-way. The associated flows may be adjusted using the freq-north, freq-south, and freq-east sliders. A value of 70 means that there is a 70% probability that a car will be generated at each “tick”, another built-in temporal variable. Both intersections are equipped with intelligent traffic lights. The outcomes are then compared with those of simulations conducted using traditional traffic lights. The behaviour of the traffic lights is based on the detection of vehicles in the previous sections of the road. The traffic light adjusts the duration of the green light to favour the lane with the greater number of vehicles.
The green length sliders, specific to each traffic light, define the duration of the green time for that traffic light. The initial settings for the secondary roads are 60 s, while the main roads are set to 50 s. In the simulation with the switch on, i.e., with the intelligent traffic lights, the green length is the starting variable from which the adjusted green length is obtained. This is the optimised green time based on the incoming traffic. At each iteration of the script, the number of vehicles on the road segments ahead of the traffic lights is counted. For each pair of traffic lights, the green lengths are scaled by the same amount, either positively or negatively, depending on the road segment with the highest number of vehicles. The adjusted green length may vary by up to 30% of the initial green length, with increments of 0.1% per tick.
The number of vehicles generated is determined by the sliders visible in the graphical user interface. Each car is controlled by a few simple rules. These include adjusting their speed according to the behaviour of the car in front and striving to reach the optimal speed while avoiding collisions. The acceleration and braking values can be set using the corresponding sliders. The speed of each car is updated based on the distance from the preceding vehicle and the maximum acceleration and maximum braking values. Due to the unavailability of sufficient data, the simulations have been conducted with predetermined values for the acceleration, braking, and fuel consumption of the vehicles. It would be preferable to assign these values based on probabilistic distributions, thus better representing the variability in drivers’ behaviour. The fuel consumption is calculated based on the speed, which determines the gear used. This allows for the monitoring of fuel consumption for stationary cars.
The maximum acceleration, maximum braking, and speed limit sliders define the behaviour of the vehicles, adjusting their speed based on the distance to the preceding vehicle. It can be assumed that vehicles will always attempt to reach the speed limit if conditions allow. All three sliders have been set to values that are realistic and representative of the typical behaviour of vehicles. Based on the speeds, five distinct consumption classes have been delineated:
Idle consumption (0 km/h—0.00055 L/s);
First gear consumption (0–10 km/h—0.0043 L/s);
Second gear consumption (10–30 Km/h—0.0028 L/s);
Third gear consumption (30–50 Km/h—0.0019 L/s);
Fourth gear consumption (50–70 Km/h—0.0013 L/s).
The absence of a fifth gear is logical, given that the model describes an urban context with a speed limit of approximately 70 km/h.
The road section where the results were applied consists of eight traffic lights distributed over a length of approximately 2.5 km. Based on empirical observations, it can be estimated that approximately four hours of heavy traffic are recorded daily. The observed traffic flow under these conditions was estimated to be 2000 vehicles per hour or a total of eight thousand vehicles per day. Furthermore, given that Rome is one of the most congested cities in the world [
59], it has been estimated that four hours of traffic congestion per day occur on this route for at least 200 days per year. A value of 2.34 kg of CO
2 per litre of fuel consumed has been assumed in accordance with the findings of (Touring Club, Domande frequenti sul CO
2, n.d.), along with a social cost associated with carbon dioxide emissions of EUR 185 per ton. Additionally, an average social cost per capita per hour of congestion of EUR 12 has been assumed [
60]. For the economic analysis, a unit cost of EUR 30,000 per intelligent traffic signal and an operating cost of 6% of the investment cost were assumed. Considering the intersections of the road section under analysis, it is necessary to replace eight traffic lights, resulting in a total expenditure of EUR 240,000 [
61]. Given that this represents an acceptable amount for the municipality of Rome, a debt-free financing structure was established.
2.3. Photovoltaic System Simulations and Software
PvSyst is a specialised software application developed by the University of Geneva, which is widely employed in the solar energy industry and research to simulate and analyse photovoltaic (PV) systems. It provides robust capabilities for the design, optimisation, and assessment of PV installations across a range of scales and configurations. The detailed component modelling of PVsyst enables users to specify crucial parameters, including those pertaining to the characteristics of photovoltaic (PV) modules, the efficiencies of inverters, and the effects of shading. Engineers and researchers can then generate precise energy production predictions tailored to the PV system’s design, accounting for factors such as tilt, orientation, and shading conditions. Additionally, PVsyst includes robust financial analysis tools that are essential for the assessment of the economic viability of PV projects. The software is capable of calculating metrics such as the levelized cost of electricity (LCOE), payback periods, and financial returns [
62].
The initial step in the software is to import the weather data from Meteonorm 8.0, NASA, or PVGIS, depending on the project site. For this case study, the input data was limited to the indication of the panels’ orientation, the definition of the generation system (building structure, photovoltaic panels, and inverters), the module layout, and the electrical load due to the charging of electric buses. Once the modelling was complete, a simulation was executed to provide as an output the energy productivity of the system, the annual energy supplied to the user from the photovoltaic plant, and the share that needs to be supplied from the grid. The efficacy of the simulation is ensured by the mathematical models that describe the behaviour of the photovoltaic modules, the solar radiation incident on the photovoltaic system, and the energy conversion.
2.4. Simulations of Library Occupancy and Smart Street Lighting
Two additional possible solutions were simulated to correctly apply the matrix: the monitoring of the seat occupancy within the municipal library and the substitution of the traditional street lighting with a smart system. Both solutions were simulated with MATLAB Simulink R2025a.
To address the problem of the limited number of seatings in the public library, a MATLAB code was developed to simulate the functioning of a pressure sensor installed on the seat that detects the person’s weight. This sensor communicates with a display on the desk through which the person can indicate the hours of permanence in the library; this information will then be reported to an online database accessible to people who want to go to the library. The Simulink system is based on two “if” cycles: the first to set the display on and the second to show the message on the display. The display has two operating modes: on and off, corresponding to the values 1 and 0 exiting from the first “if” cycle. The message “Please insert the number of occupied hours” appears on the display when the input signal is 1, which occurs when the pressure sensor on the seat detects a weight higher than 45 kg; otherwise, if the pressure sensor detects a weight lower than 45 kg, the input signal to the display is 0 and the number of occupied hours will result in zero.
A new system of outdoor lighting for public parks was simulated in which the luminous intensity of the lamps is regulated by the users; this lighting system has the aim of reducing energy consumption when no people are in the area. The lighting system turns on when the environmental illuminance is below 10 lux, and the luminous flux of the lamps is set to the minimum by default, but people in the park can select the preferred illuminance level. The MATLAB Simulink structure is based on two “if cycles”: one manages the on-off condition of the lamps, and the other represents the interaction with people. A photocell detects the environmental luminous condition and sends the signal to the system: above 10 lux, the signal is 0, and the system is off, while under 10 lux, the signal is 1, and the system is on at the minimum level. The second “if system” reproduces the action of people who can regulate the luminous intensities of the lamps by means of a knob installed on the poles. The luminous intensity corresponds to the x variable in MATLAB: it can be set between 6.67% (corresponding to 10 lux and 400 lm) and 100% (corresponding to 150 lux and 6000 lm).
2.5. Incidence Matrix
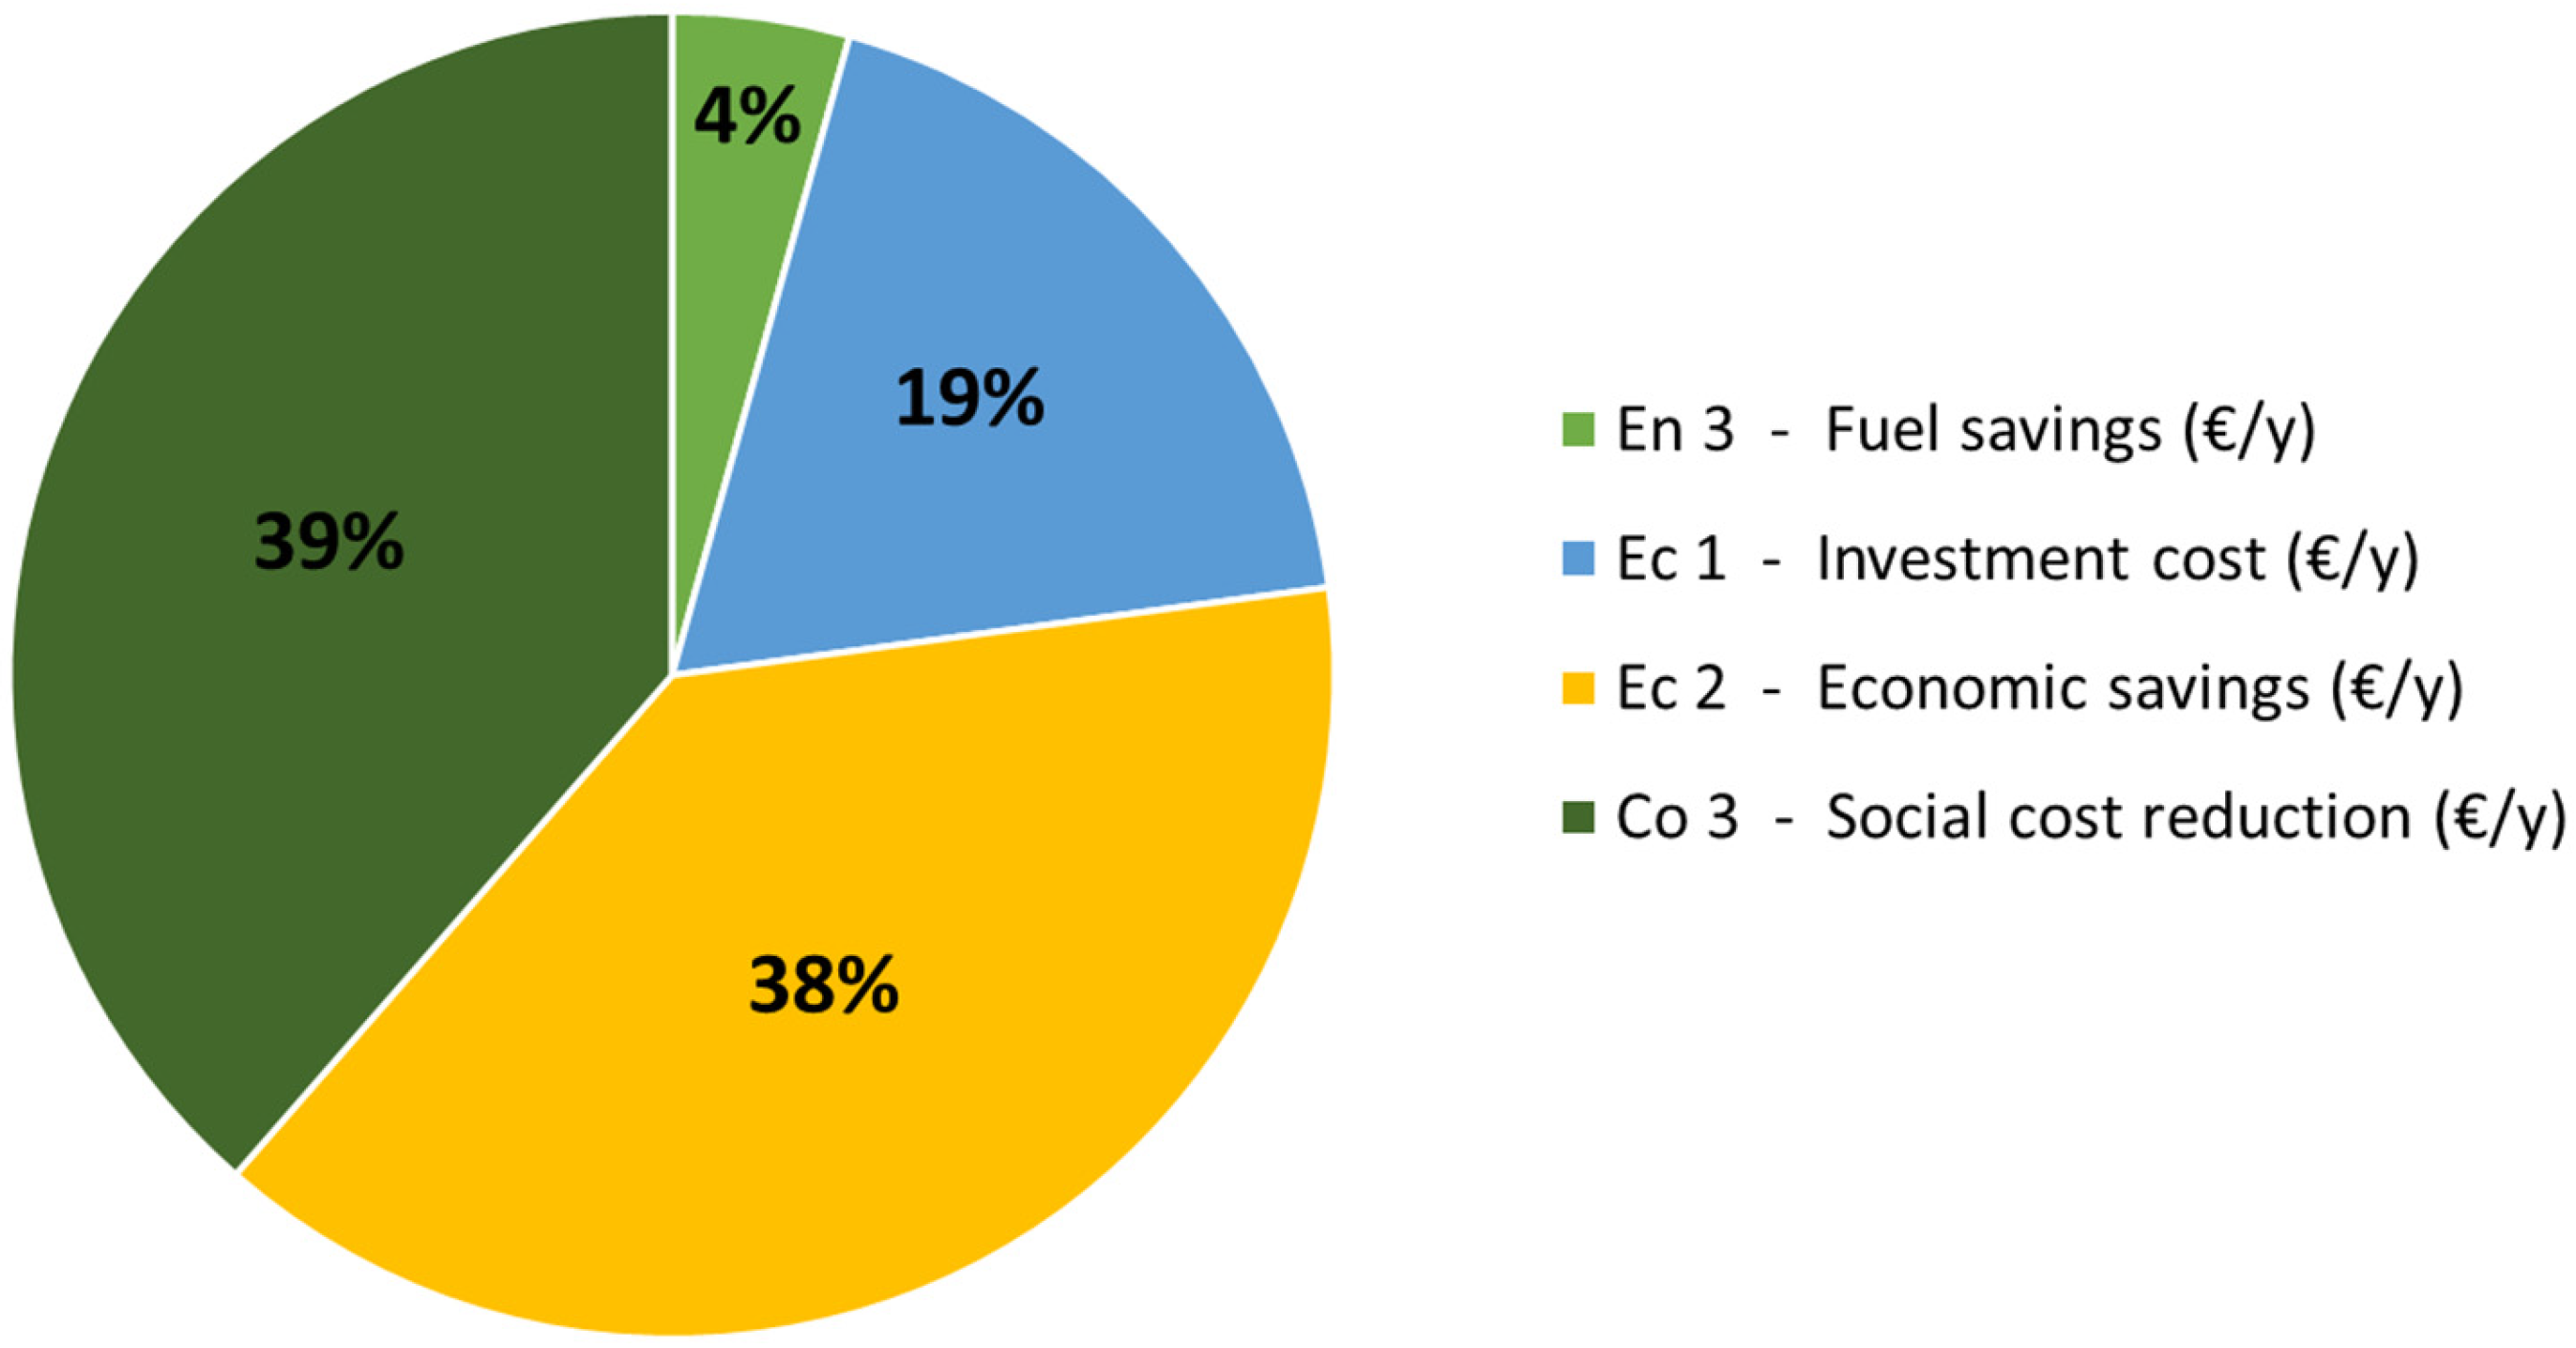
The incidence matrix enables a quantitative analysis of the proposed strategies. To define the incidence matrix, the smart axes that guide the study’s approach to the problem were defined, followed by the definition of smart indicators that specifically characterise these smart axes (
Table 3). The following smart axes were established in the project: energy, for the analysis of different aspects of the energy balance; economy, for the study of the economic structure; community, referring to the benefits that the community will obtain from the implementation of the proposed strategies; environment, to analyse the impact on the environment; and mobility, to study changes in transport. Except for the energy and economy axes, at least one indicator has been assigned for the other smart axes. The energy axes involve different indicators as follows:
The common economic indicators are employed to evaluate the actions proposed in the study, such as
Investment costs [EUR/yr]. The total investment cost was calculated by estimating the costs required to implement the proposed scenario.
Economic savings [EUR/yr]. The potential economic savings guaranteed by the implementation of the scenario were evaluated.
Investment payback period [yr]. It was evaluated using the following Formula (1):
PBPd is the compound payback period.
WACC is the weighted average cost of capital, expressed as a percentage:
D is the percentage of investment financed by debt.
kd is the rate of return on debt.
E is the percentage of investment financed by equity.
ke is the rate of return on equity.
INV is the investment cost required to implement the scenario.
UCF is the unlevered cash flow, which represents the actual cash flow generated by the financial structure. It is calculated by subtracting operating and maintenance costs from the sum of annual savings and any incentives.
Moving to the community axis, the following indicators were used:
Approval rate [%]. It is based on the direct involvement of citizens in the choice of solutions.
Time saved [min]. It is defined to assess the impact of the proposed solutions on the daily lives of citizens directly affected by the implementation of the action.
Reduction in social costs [EUR/year]. The social cost of one tonne of CO
2 is set at 185 EUR/tonne [
65], while the social cost of congestion is estimated at 12 EUR/h [
66].
For the environmental study:
For mobility:
Table 3.
Indicators of smart axes.
Table 3.
Indicators of smart axes.
| Indicator | Units of Measurement |
|---|
| En 1 (Primary non-renewable energy saved) | Toe/yr |
| En 2 (Renewable primary energy produced) | Toe/yr |
| En 3 (Fuel savings) | l/yr |
| Ec 1 (Investment cost) | EUR/yr |
| Ec 2 (Economic savings) | EUR/yr |
| Ec 3 (Investment payback time) | yrs |
| Co 1 (Satisfaction index) | % |
| Co 2 (Time saved) | min |
| Co 3 (Social cost reduction) | EUR/yr |
| Ev 1 (Tonnes of CO2 saved) | t CO2/yr |
| Mo 1 (Travel time reduction) | min |
The following formula is used to calculate the correction factor, which takes into account economic and time feasibility.
where
Referring to
Table 1, the mean value of each proposal is calculated for each smart indicator:
where
Mi is the mean of the i-th indicator.
n is the number of proposed solutions.
si,j is the value assumed by the j-th proposed solution for the i-th smart indicator.
A scaling procedure (normalisation of the numerical data) is then performed to evaluate the distance from the mean:
where
The raw KPI data were normalised to a −5 to +5 scale for each indicator, allowing for direct comparison across different units of measurement. A positive score indicates a performance above the mean of all four scenarios, while a negative score indicates performance below the mean. A detailed description of the scaling procedure is reported in
Appendix A.
In the event that a scenario is not described by a smart indicator, the value assumed for the indicator in the occurrence matrix is set to zero. This calculation must be performed for each smart indicator. The final ranking is thus obtained by summing all the values for each scenario, with the correction factor that takes into account the economic and temporal feasibility being applied. This represents the correlation value that is representative of each proposal.
4. Discussion
A comparison of the results of the different scenarios allows us to conclude the effectiveness of the interventions, the ability of the matrix to represent them correctly, and the suitability of the indicators employed.
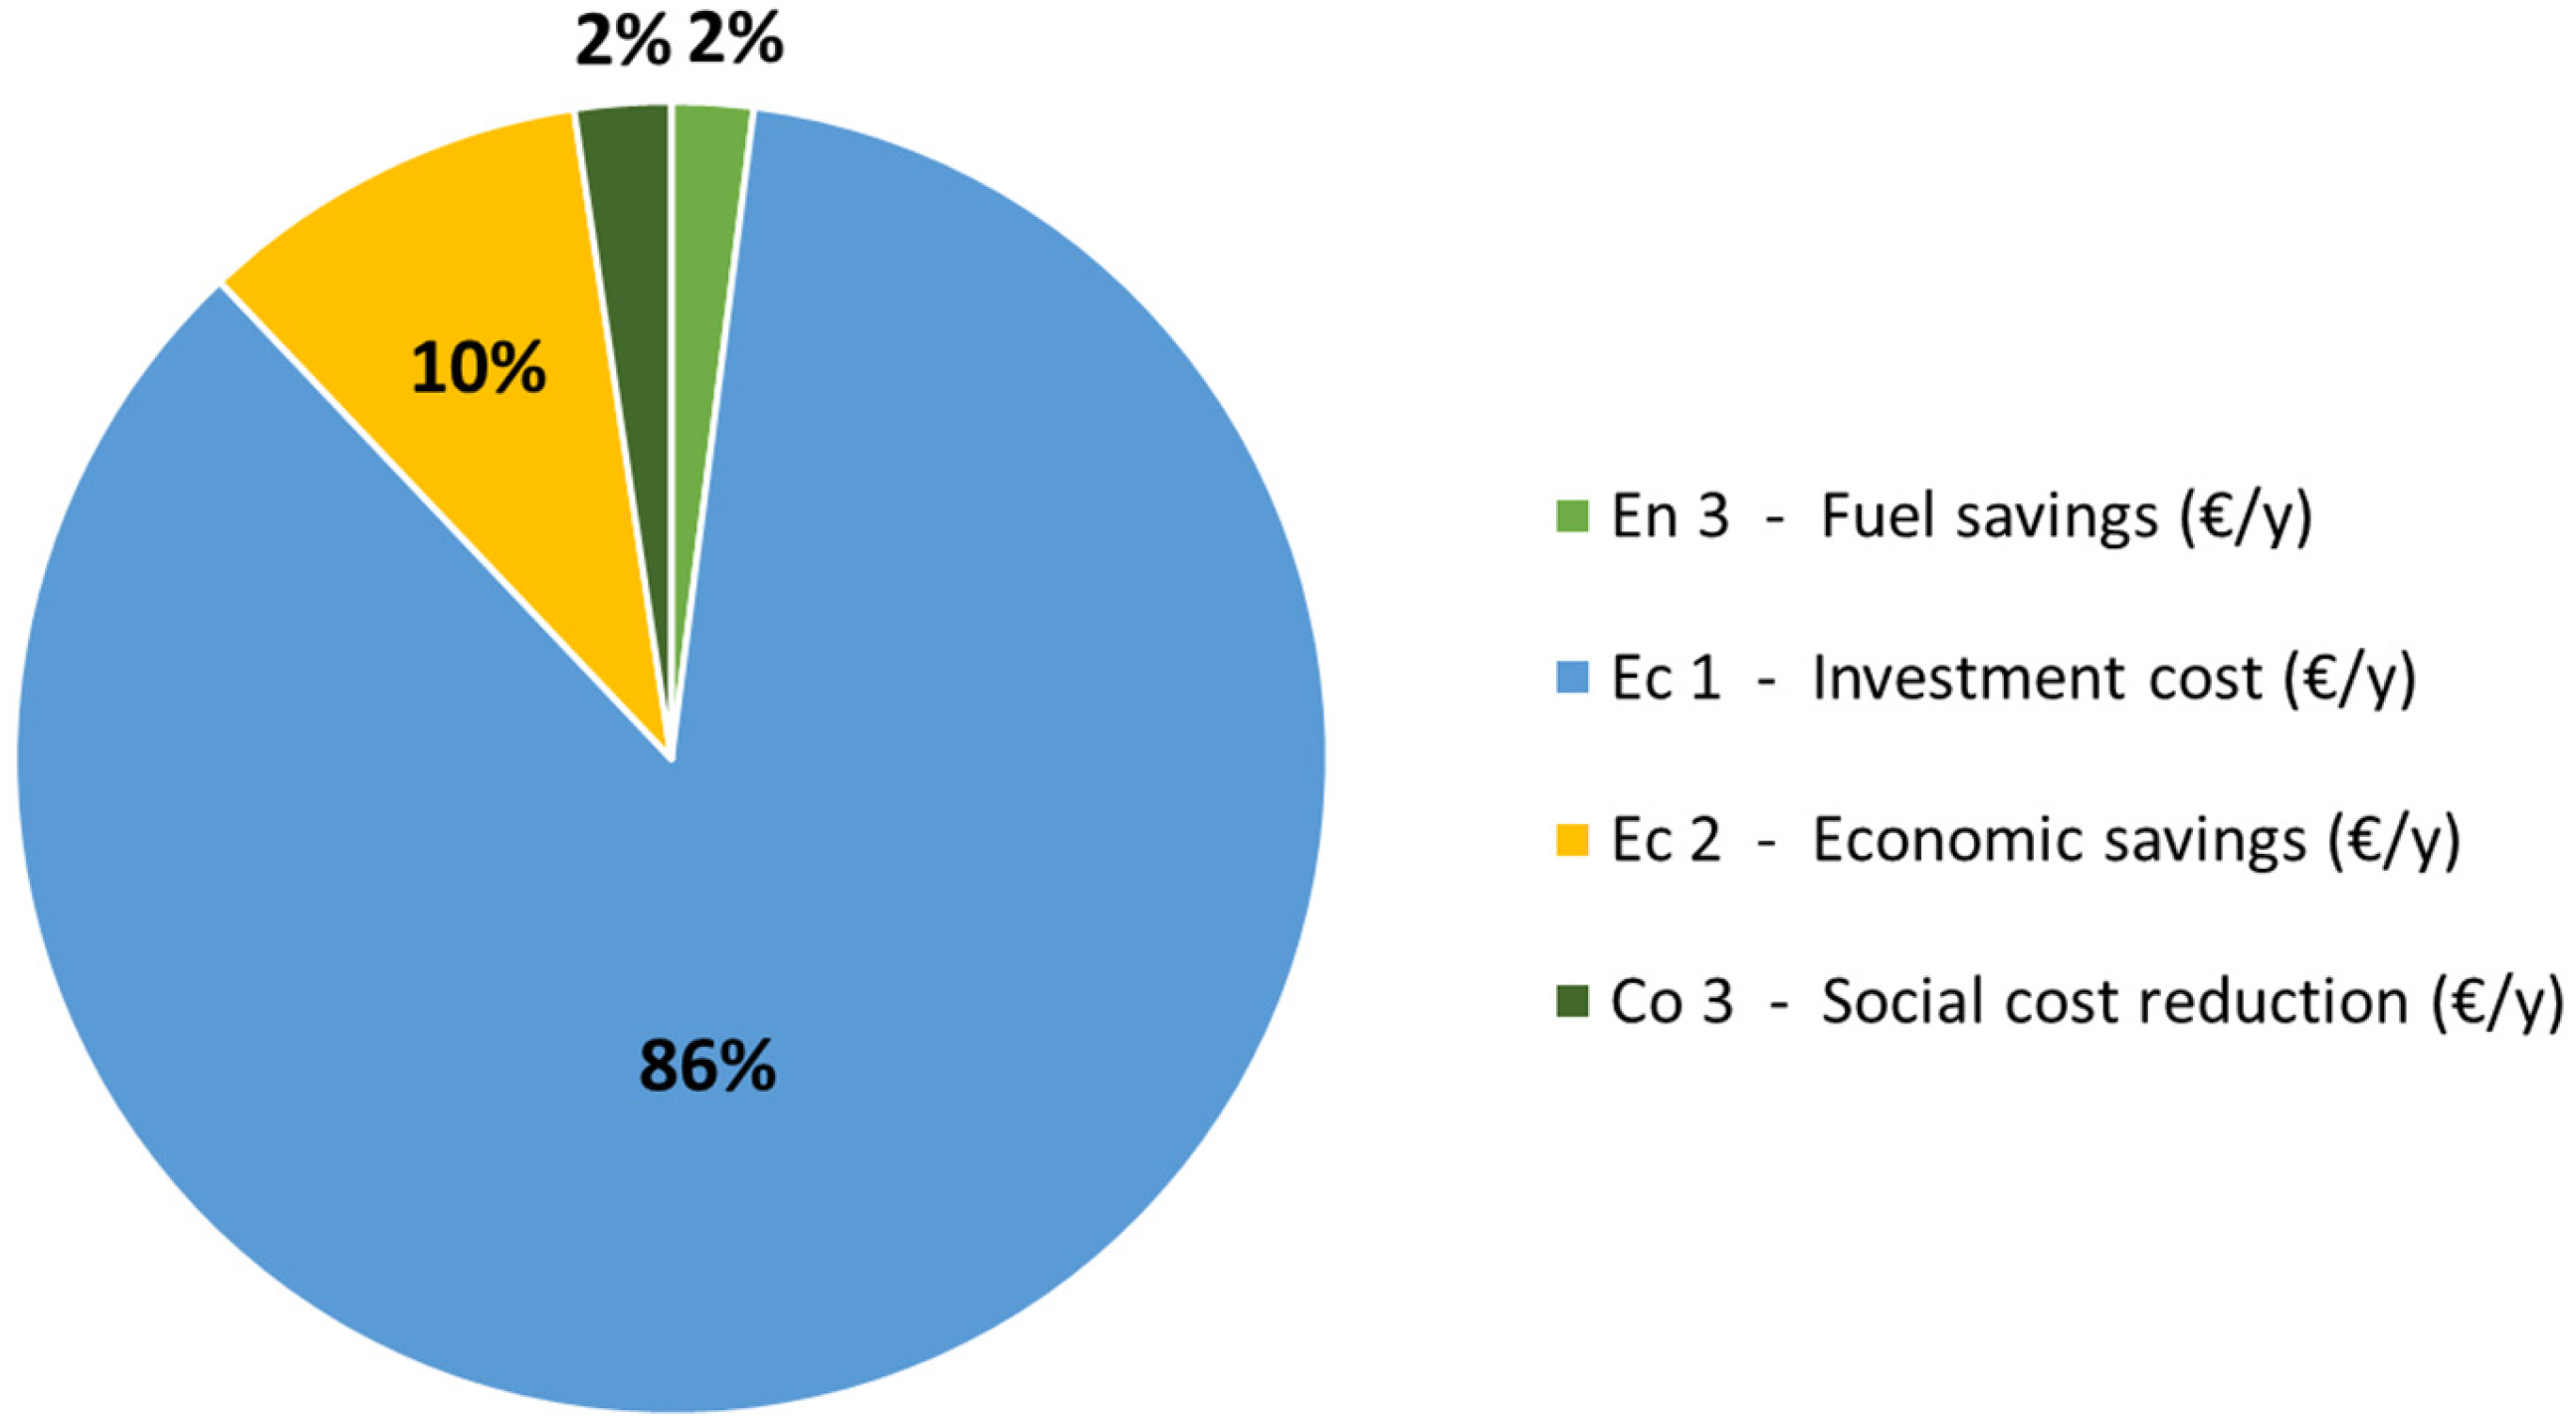
The scenarios that have the greatest impact on the problems identified in the third municipality of Rome are landfill rehabilitation and intelligent traffic lights. These scenarios are described by 10 out of a total of 11 indicators. Nevertheless, the landfill scenario ranks third. The presented analysis shows that an intervention that is beneficial for the municipality in terms of energy and environmental impact can still be evaluated negatively based on the values assigned to certain selected indicators. It is evident that the greatest impact on the landfill rehabilitation scenario is the significant economic expenditure required to implement the scenario itself.
Conversely, the implementation of intelligent traffic lights is a solution that is readily achievable in terms of both cost and time. Furthermore, it ensures superior outcomes for the majority of indicators. It is also noteworthy that the implementation of this solution can have a positive impact on the mobility of areas that are geographically distant from the application area. By extending the simulation to neighbouring areas, it is possible to observe a positive influence on a number of the indicators related to the scenario.
Furthermore, the implementation of this solution would result in a reduction in emissions from one of the most significant sources of pollution in Europe. In fact, in 2019, the transport sector was the primary source of greenhouse gas emissions on European territory, responsible for 28.6% of total greenhouse gas emissions. Of these emissions, 72.6% originated from private road vehicles such as cars (60.6%), motorcycles (1.3%), and light commercial vehicles (11.0%) [
68].
The reuse of the landfill site and its conversion into a sustainable energy production facility are fully aligned with European sustainability goals, such as the 2030 Agenda. Furthermore, there is also the potential of obtaining incentives for the reclamation and redevelopment of abandoned sites. For instance, Italy has allocated EUR 500 million for such objectives as part of the National Recovery and Resilience Plan [
69].
Several considerations also need to be made regarding the matrix and the indicators chosen to represent it. Firstly, it should be emphasised that, as the scaling process is based on assigning minimum and maximum scores (in our case, 5.5) to interventions that take the extreme values of a given indicator, it is mandatory to compare at least three interventions.
It should be further observed that the matrix may be constructed without including certain indicators, which may then be subsequently incorporated. For instance, the economic indicator representing the total investment of a given intervention is most effective when comparing solutions to the same problem. In the context of evaluating alternative solutions, it may be more appropriate to exclude this indicator from the matrix and consider it at a later stage in relation to the rankings obtained. This approach allows for an evaluation based on scores and the estimated impact of the interventions.
5. Conclusions
This paper presents two scenarios for the integration of renewable energy sources and smart solutions into urban infrastructure, focusing on the implementation of intelligent traffic lights and the deployment of a photovoltaic system coupled with an electric bus service. The two scenarios were analysed through simulation tools and evaluated using a KPI-based incidence matrix to support a comparative assessment of heterogeneous smart city interventions and identify priority actions for public administrations.
The results show that both scenarios can contribute to urban decarbonization, although with different impacts across the considered smart axes. The intelligent traffic lights scenario emerged as the most effective solution in terms of overall priority, due to its favourable balance between environmental benefits, economic feasibility, and implementation time. Conversely, the landfill reconversion scenario demonstrated a strong contribution to renewable energy production and CO2 emission reduction, but its higher investment costs and longer implementation time affected its final ranking. These findings highlight that the effectiveness of smart city interventions should be evaluated through integrated approaches that consider not only environmental performance but also economic and temporal aspects.
The adoption of an incidence matrix proved to be a useful tool for comparing interventions with different objectives and scales, allowing a holistic evaluation of their impacts beyond the primary sector addressed. By aggregating multiple key performance indicators into a single ranking, the proposed methodology supports strategic decision-making and helps identify interventions that are both impactful and feasible within an urban context.
Some limitations of the study should nevertheless be acknowledged. The analysis is based on a single urban case study, and the quantitative results are influenced by local conditions, such as traffic demand, energy mix, and socio-economic characteristics. In addition, the simulation models rely on representative and simplified assumptions regarding traffic behaviour, modal shift, and energy use due to the limited availability of detailed real-world data. For these reasons, the results should be interpreted mainly in terms of relative comparison and priority ranking rather than as directly generalizable outcomes.
Future research could extend the proposed framework by validating the methodology with real operational data, applying it to different urban contexts, and performing sensitivity analyses on indicator selection and feasibility assumptions. These developments would further enhance the robustness of the approach and strengthen its applicability as a decision-support tool for smart and sustainable urban planning.



 ,
,