


Highlights
What are the main findings?
- Manual measurements and the REWIZOR 1.0 AI-based method yield consistent qualitative data but differ quantitatively due to divergent definitions and methodological limitations.
- The REWIZOR software enables flexible parameter adjustment and automated extraction of boarding, alighting, and stop-time data, but currently cannot detect tram types or exchange types.
What are the implication of the main findings?
- AI-based measurements require calibration against reference methods to ensure comparability with traditional data sources.
- REWIZOR can reliably support analyses of passenger flows when used as a standalone system, and further software development may significantly improve accuracy.
Abstract
This article examines differences between conventional manual measurements of tram operations and data extracted automatically using the REWIZOR program, based on the Yolo10s algorithm. The study addresses the broader question of how artificial intelligence can support analyses of passenger exchange processes in public transport and improve the efficiency of data collection. Measurements conducted in four Polish cities included tram types, stop times, and detailed boarding and alighting durations, while the REWIZOR software enabled automatic detection of stop times and passenger flows based on video recordings. The results show that, although both approaches yield consistent qualitative information regarding doors and passenger counts, significant quantitative discrepancies arise. These differences stem mainly from methodological inconsistencies and varying definitions of boarding, alighting, and stop times, as well as from software-related detection errors. The findings indicate that AI-based measurements require calibration against reference methods to allow reliable comparison with conventional datasets. As currently implemented, REWIZOR can be used effectively for internal analyses of passenger flows, if all compared data come from the same system. Further development—such as implementing simultaneous tracking of people and heads—may considerably improve accuracy and facilitate wider applicability in public transport studies.
1. Introduction
The efficient movement of people within cities is the subject of numerous scientific studies in traffic engineering, public transport and related disciplines. Analyses of urban mobility primarily rely on quantitative data collected at designated nodal points. Based on this data, the occupancy of individual stops and routes can be determined, constituting a classical research method in traffic engineering. Passenger surveys are also conducted [1,2], allowing researchers to understand user preferences and behavioral patterns in public transport. This paper focuses on the rapidly developing tools of artificial intelligence (AI). These tools not only enhance quantitative analyses of urban mobility, but also allow qualitative approaches from the social sciences, especially sociology, to be incorporated. Qualitative research methods are well established in sociology [3]. In the context of traffic engineering, qualitative research refers to the analysis of passenger behavior in urban spaces, particularly their movement at tram stops during the stop–vehicle interaction phase.
Intelligent Transport Systems (ITS) are now installed in nearly every major city to improve urban traffic flow. These systems represent an evolving field that integrates various areas of knowledge, including sensor networks, machine learning (ML), transport engineering and information and communication technologies [4,5]. ITS are designed to address road traffic-related problems such as traffic management, accident prevention, toll collection, parking systems and pollution control [6]. The aim is to create an intelligent transport infrastructure that can manage large numbers of vehicles efficiently while reducing congestion and accidents. Studies show that properly designed ITS solutions can significantly reduce road accidents [7] and support the transition towards zero-emission transport [8]. ITS utilize advanced technologies to support traffic management, reduce congestion and improve safety, providing users with real-time information about road conditions [9]. However, AI algorithms are a relatively new and not yet fully validated tool in this context; they are not yet capable of independently analyzing complex human behaviors and drawing definitive conclusions from them. Nevertheless, the research presented in this paper proposes a methodology for training an algorithm to analyze human behavior.
Implementing AI-based solutions in ITS requires the integration of various measurement and observation technologies. One key area of development involves vision systems, which provide essential data for recognising and classifying objects in urban environments. The increasing use of variable-focus cameras has already made it possible to efficiently identify number plates in car parks and clean air zones. Systems are currently being developed to read licence plates using standard city surveillance cameras, with the footage analysed by trained AI algorithms. One example of such a solution is the system developed by [10].
In most modern urban ITS networks, cameras play a crucial infrastructural role [11], forming the backbone of AI-based classification systems [12,13]. AI classifiers are algorithms that assign labels to input data based on learned patterns. In this case, they analyse video frames to recognize and track objects (e.g., vehicles and pedestrians) using re-identification (Re-ID) methods [14]. Akbarzadeh et al. [15] used neural networks and machine learning to recognize and classify license plates within an urban ITS. Leveraging city surveillance, which is often an integral part of ITS infrastructure, creates the potential to develop tools that enable highly precise traffic management. By analyzing objects such as people and vehicles as displacement vectors between consecutive video frames, it is possible to calculate the derivatives of distance over time and thereby determine velocity and acceleration vectors. Consequently, it becomes possible to develop computational models in which traffic participants function as interacting elements of a single system modelled using deep learning. One of the main limitations of implementing such solutions is network infrastructure, which does not always allow for the real-time transmission and analysis of large volumes of data. However, the development of 6G technology presents a significant opportunity for the widespread application of deep learning methods in intelligent transportation systems [16]. The high bandwidth and low latency of next-generation networks will enable efficient, real-time, distributed video data analysis in the future.
Although ITS are not new to urban infrastructure, their integration with AI-based solutions is a relatively new—and inevitable—phenomenon [17]. One scientific trend directly linked to the advancement of AI in ITS is the concept of data-driven intelligent transportation systems (DDITS), in which data collected from various sources, such as sensors, cameras and vehicles, are used to continuously refine predictive models [18]. Currently, ITS are primarily designed for road traffic [19], yet in practice, traffic engineering cannot be analyzed in isolation from public transport and the needs of its passengers. Discussion on integrating ITS with public transport remains limited as the needs of public transport often conflict with those of individual transport. Nevertheless, differences in network architectures, a lack of software unification and varying transport challenges between cities [11] create opportunities for experimental AI implementations that could synchronize road traffic management with passenger movement in public transport. Research on ITS is increasingly considering pedestrian movement analysis and human interaction with public transport infrastructure. An interesting example of this approach is the concept proposed by [20], which integrates pedestrian movement analysis with ITS. The researchers emphasize that data from city cameras can be used not only to monitor road traffic, but also to study pedestrian behavior near stops. This allows traffic light parameters and spatial design to be optimized. However, adjusting pedestrian crossing signal cycles requires a proper predictive model. In this context, Iwanowicz [21] notes that machine learning–based systems can learn user behavior and adapt signal durations to pedestrians’ real-time needs. Some modern ITS already incorporate modules capable of analyzing complex nonlinear dependencies, such as artificial neural networks (ANNs) or support vector machines (SVMs) [22].
In terms of passenger flows, ANNs can be successfully used to model and predict human movement in transport hubs, such as airports, railway stations and bus terminals [23]. The latest research on passenger behavior in public transport indicates that spatial and behavioral factors are both crucial for the efficiency of passenger exchange processes. Kodapanakkal et al. [24] demonstrated that spontaneously formed pedestrian macro-structures, such as flow corridors or groups of waiting passengers, significantly affect boarding and alighting times, as well as the width of passenger exchange zones. Ramirez et al. [25] focused on the micro aspects of passenger behavior, analyzing body posture when boarding and alighting from buses. Machine learning methods enabled them to identify potential ergonomic issues that could hinder traffic flow.
Patni and Srinivasan [26] developed quantitative models to describe the relationships between the number of passengers boarding and alighting, and the characteristics of routes and stops. This allows for more accurate forecasts of traffic and operational demand. Andrade et al. [27] emphasized the importance of perception among people with reduced mobility when assessing bus stop accessibility, demonstrating that the design of boarding and alighting areas directly impacts passengers’ comfort and sense of safety. Yendra, Haworth and Watson-Brown [28] pointed out that the transition phase between vehicle and stop is one of the most hazardous parts of a journey, particularly in countries with poor stop infrastructure. Garcia et al. [29] used AI methods to monitor pedestrian behaviour at railway stations and identify key zones in the platform–door interface where flow slowdowns occur. Meanwhile, Warchoł-Jakubowska et al. emphasized the social dimension of designing accessible transport systems, demonstrating that implementing universal design principles improves travel comfort and passenger exchange efficiency.
In conclusion, modern studies show that the efficiency of passenger exchange depends not only on vehicle parameters or timetables but also on spatial ergonomics and actual user behaviors. Integrating these aspects into ITS can lead to the creation of more sustainable, accessible, and intelligent public transport solutions [26,27,28,29,30]. However, traditional passenger counting methods are both time-consuming and costly. They are also inefficient. Therefore, using AI algorithms for this purpose seems necessary. Currently, there is a lack of papers dedicated to this issue that would also provide a tool that can be used and developed by others. For this reason, we have decided to develop and make this tool available, while also highlighting the current issues with its use. Using the AI algorithm developed in this study for passenger positioning and counting could be a significant step towards its wider implementation in existing ITS infrastructures, which already have extensive video surveillance networks.
2. Materials and Methods
The boarding and disembarking process of the tram was analyzed using video recordings made with a DJI Air 3 Fly More Combo (RC-N2) drone (DJI, Shenzhen, China) and a GoPro 13 HERO(GoPro, Inc., San Mateo, CA, USA) sports camera. The drone’s position and the sports camera’s mounting location (using a magnetic mount) were adjusted depending on the recording location and the designated tram stop. The equipment was positioned so that the tram doors were not obstructed, as many of the tram’s doors as possible were visible, and the recording angle was between 45 and 90 degrees.
The recordings were made in 4 cities in northern Poland, i.e., Bydgoszcz (around 324 thousand inhabitants), Gdańsk (around 488 thousand inhabitants), Elbląg (around 112 thousand inhabitants), and Olsztyn (around 166 thousand inhabitants). The selection of specific stops located in the above towns was based on data on the potential largest passenger flows in the given cities. In Bydgoszcz, recordings were made at the Dworzec Główny and Rondo Jagiellonów stops. The research took place during rush hour from 1:00 p.m. to 3:00 p.m. on weekdays. In Olsztyn, similarly to Bydgoszcz, the tests were carried out at the final stop at the main railway station, as well as at the main transfer point in the city center–Skwer Wakara (Kościuszki) stop. The measurements were conducted in the morning hours from 6:00 a.m. to 9:00 a.m. The Galeria Bałtycka stop was selected as the reference point in Gdańsk. At this stop, the shopping mall customers were the main recorded passenger stream, and therefore, the tests were conducted on Saturday (a day off with active trade). The tests were conducted in the morning hours from 8:00 a.m. to 10:00 a.m., when traffic gradually increased. In Elbląg, the tests were conducted at the Dworzec stop due to the influx of bus and train passengers, hospitals, and service points. The records took place during the afternoon peak traffic on a weekday from 2:00 p.m. to 4:00 p.m.
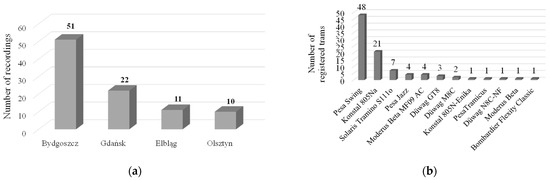
A total of 94 recordings were made: 51 in Bydgoszcz, 22 in Gdańsk, 11 in Elbląg, and 10 in Olsztyn. During the measurements, 12 different types of trams were registered. The most common types of registered trams were Pesa Swing (48) and Konstal 805Na (21) trams. It is worth noting that the Konstal 805Na (in standard and Enika versions) is the only registered high-floor tram, accounting for 22.34% of registered cases. Figure 1 shows all types of registered trams with the number of recordings they feature in, and how the number of recordings is distributed across individual cities.
Figure 1.
(a) Number of recordings made in different cities; (b) Number of registered trams by type.
The definition of the boarding and alighting process was adopted as follows for the purposes of manual counting:
- (1)
- The alighting was counted from the moment the doors started to open until the last passenger stood with both feet on the platform.
- (2)
- Boarding was counted from the moment when the first passenger started moving from a standing position at the door (where he was waiting for the alighting process to be completed) towards the door until the moment when the last passenger stood with both feet on the tram.
During the measurements, the tram’s dwell time was also measured, which is calculated from the moment the doors start opening until the last doors on the tram close.
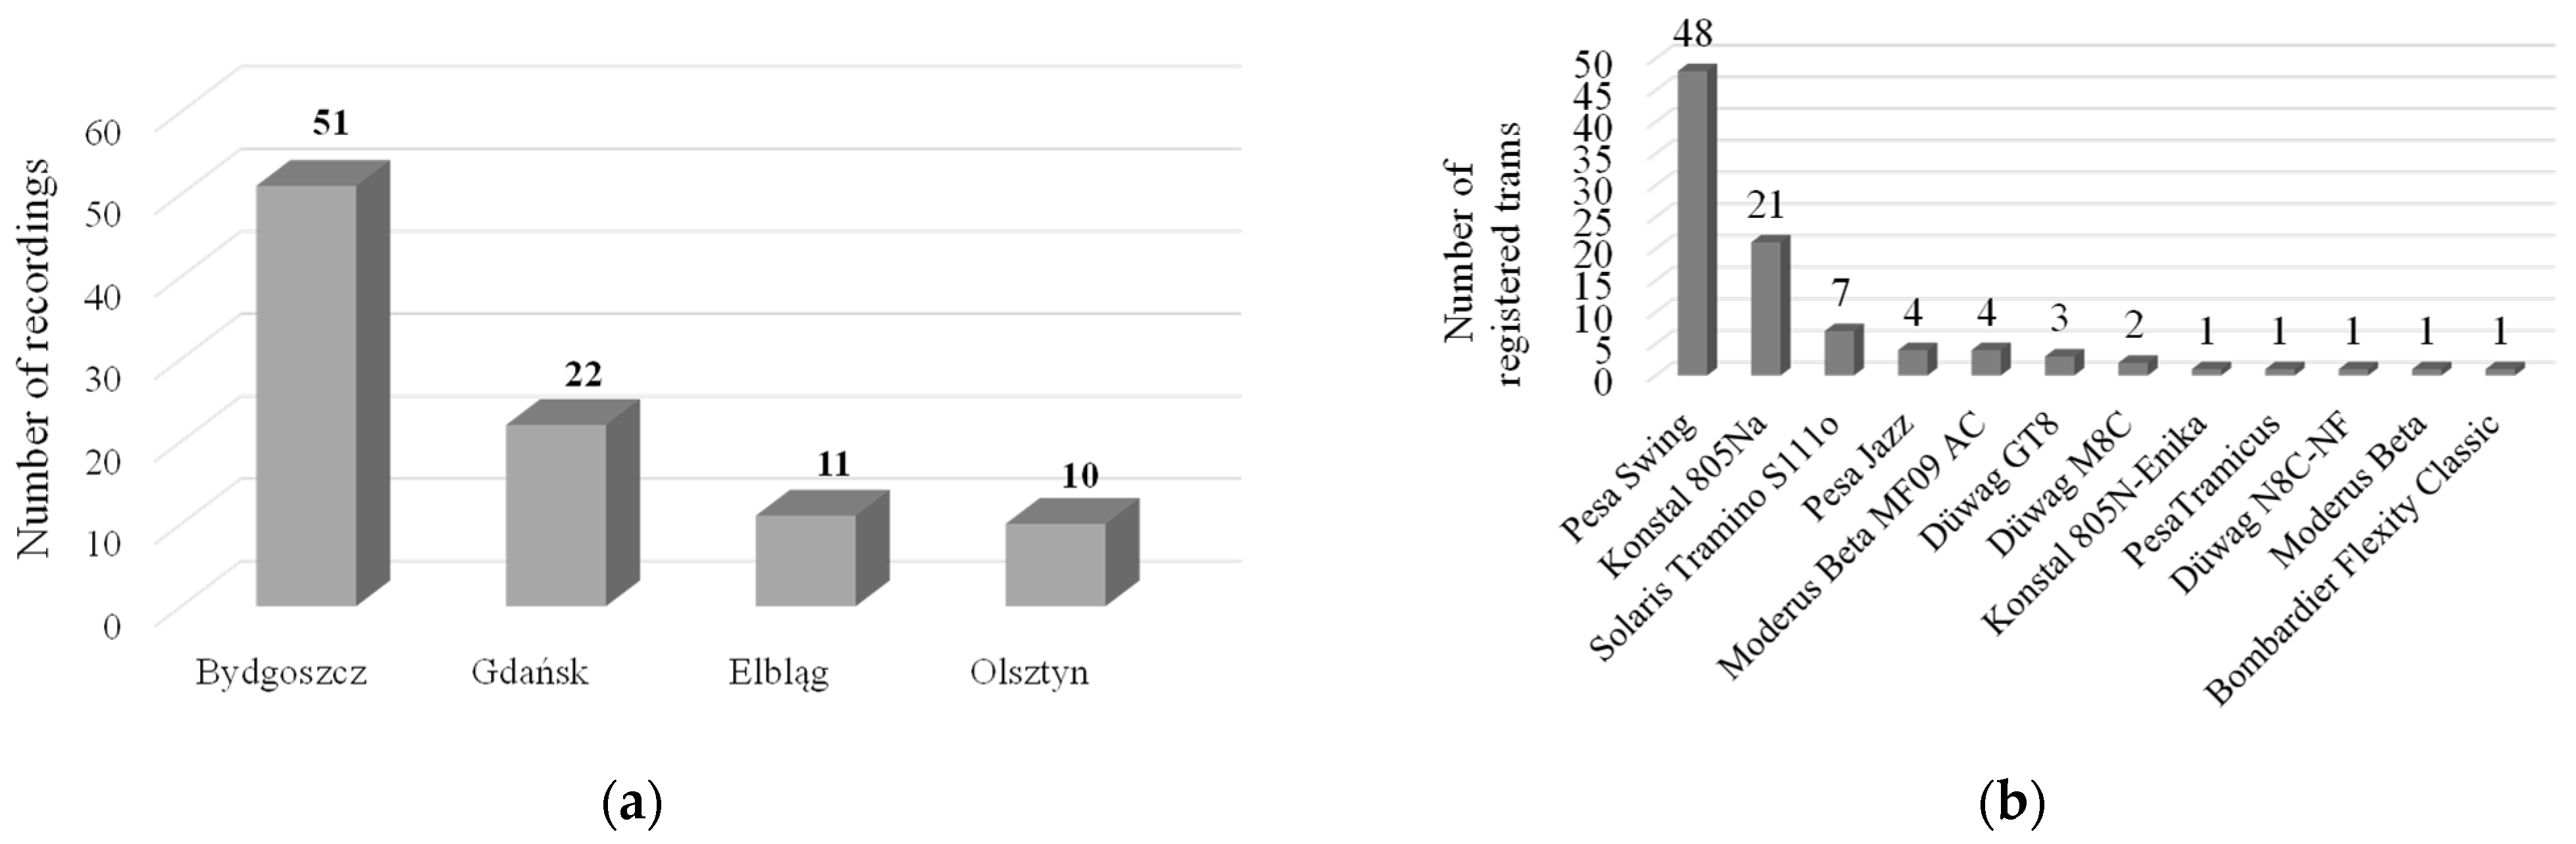
During the analysis, the different types of passenger exchanges was noted. To mark them, symbols consisting of a letter and a number were used, e.g., S0 or D3. The letters symbolize the type of door through which the process was carried out, and the number indicates the type of exchange:
- (1)
- S—passenger exchanges through single-leaf doors;
- (2)
- D—passenger exchanges through double-leaf doors;
- (3)
- 0—boarding or disembarking takes place;
- (4)
- 1—boarding and disembarking take place independently of each other, one after the other;
- (5)
- 2—alighting takes place through the middle of the door, and people waiting to board wait on the sides of the door, restricting the passenger flow;
- (6)
- 3—passengers waiting for the boarding stand and blocking the passage and people disembarking get off sideways along the vehicle.
The types of exchange were distinguished based on analysis of the recordings. To demonstrate the differences, Figure 2 presents a schematic representation of the distinguished types of passenger exchange.
Figure 2.
Schematic representation of types of passenger exchange. Green indicates passengers alighting, and red indicates passengers boarding. Arrows indicate the passenger movement route, and clocks with numbers indicate the order.
During data analysis, a reading accuracy of ±1 s was chosen. It should be noted that a more accurate analysis would have been possible because the videos were recorded at 4K resolution (3840 × 2160 px), 30 frames per second. However, in reality, it is difficult to arbitrarily determine the beginning or end of the passenger exchange process. Therefore, the authors decided to adopt a 1 s error limit, and the results are presented with this precision. This choice of time accurately reflects the challenge of precisely defining the end of alighting and the beginning of boarding. This problem does not arise when measuring the total passenger exchange time. Of course, the authors could define this time more precisely, per frame, but our experience has shown that such a measurement is subject to significant variation when the person analyzing the recordings changes.
2.1. Artificial Intelligence Model Training
For image analysis, the YOLOv10s [31] a convolutional neural network was employed. YOLO (You Only Look Once), first proposed by Joseph Redmon and colleagues in 2016, is a modern object detection framework capable of processing images in a single pass. The algorithm divides the image into a grid, where each cell predicts class probabilities and bounding boxes, enabling fast and efficient detection of multiple objects in real time. The YOLOv10s variant was selected because of its low latency, which reduces both training and inference times. The model is released under the open-source AGPLv3 license, making it accessible for use in both scientific research and non-commercial projects.
All computations were conducted in a local environment on a workstation equipped with an NVIDIA RTX 4070 (NVIDIA Corporation, Santa Clara, CA, USA) graphics processing unit (GPU) with 8 GB of VRAM and 32 GB of DDR5 system memory. The implementation and execution of experiments were carried out within the PyCharm (v. 2025.3.2) integrated development environment (IDE).
The YOLO model was trained using the transfer learning approach. In this method, the algorithm is first pre-trained on a large-scale object detection, segmentation, and captioning dataset (COCO) and subsequently fine-tuned on a domain-specific dataset. This strategy enables the model to leverage previously acquired knowledge and adapt more effectively to the new task. For the implementation, the Ultralytics library [31] was employed, providing full interoperability with YOLO-based architectures. The training set consisted of 8713 frames from videos recorded around the world (our videos and the photo from [32,33,34] were additionally used within the available licenses). During the training, recordings were made for various weather conditions, including early morning hours with daylight and evening hours with artificial light.
In the conducted experiments, two models were trained:
- The tram door detection model (TDDM)–the training set consists of a set of 23,031 annotated images. The training process took place in 500 epochs. The set split: 82% training data, 17% validation data, 1% test data.
- The person detection model (PDM)-the training set consists of a set of 17,401 annotated images. The training process took place in 500 epochs. The set split: 87% training data, 12% validation data, 1% test data.
The maximum number of epochs was set to 500 to allow sufficient headroom for the learning rate scheduler to decay, while an early stopping callback with a patience of 50 epochs was employed to mitigate overfitting.
The split set was selected in such a way that the data was not over-trained for 500 epochs.
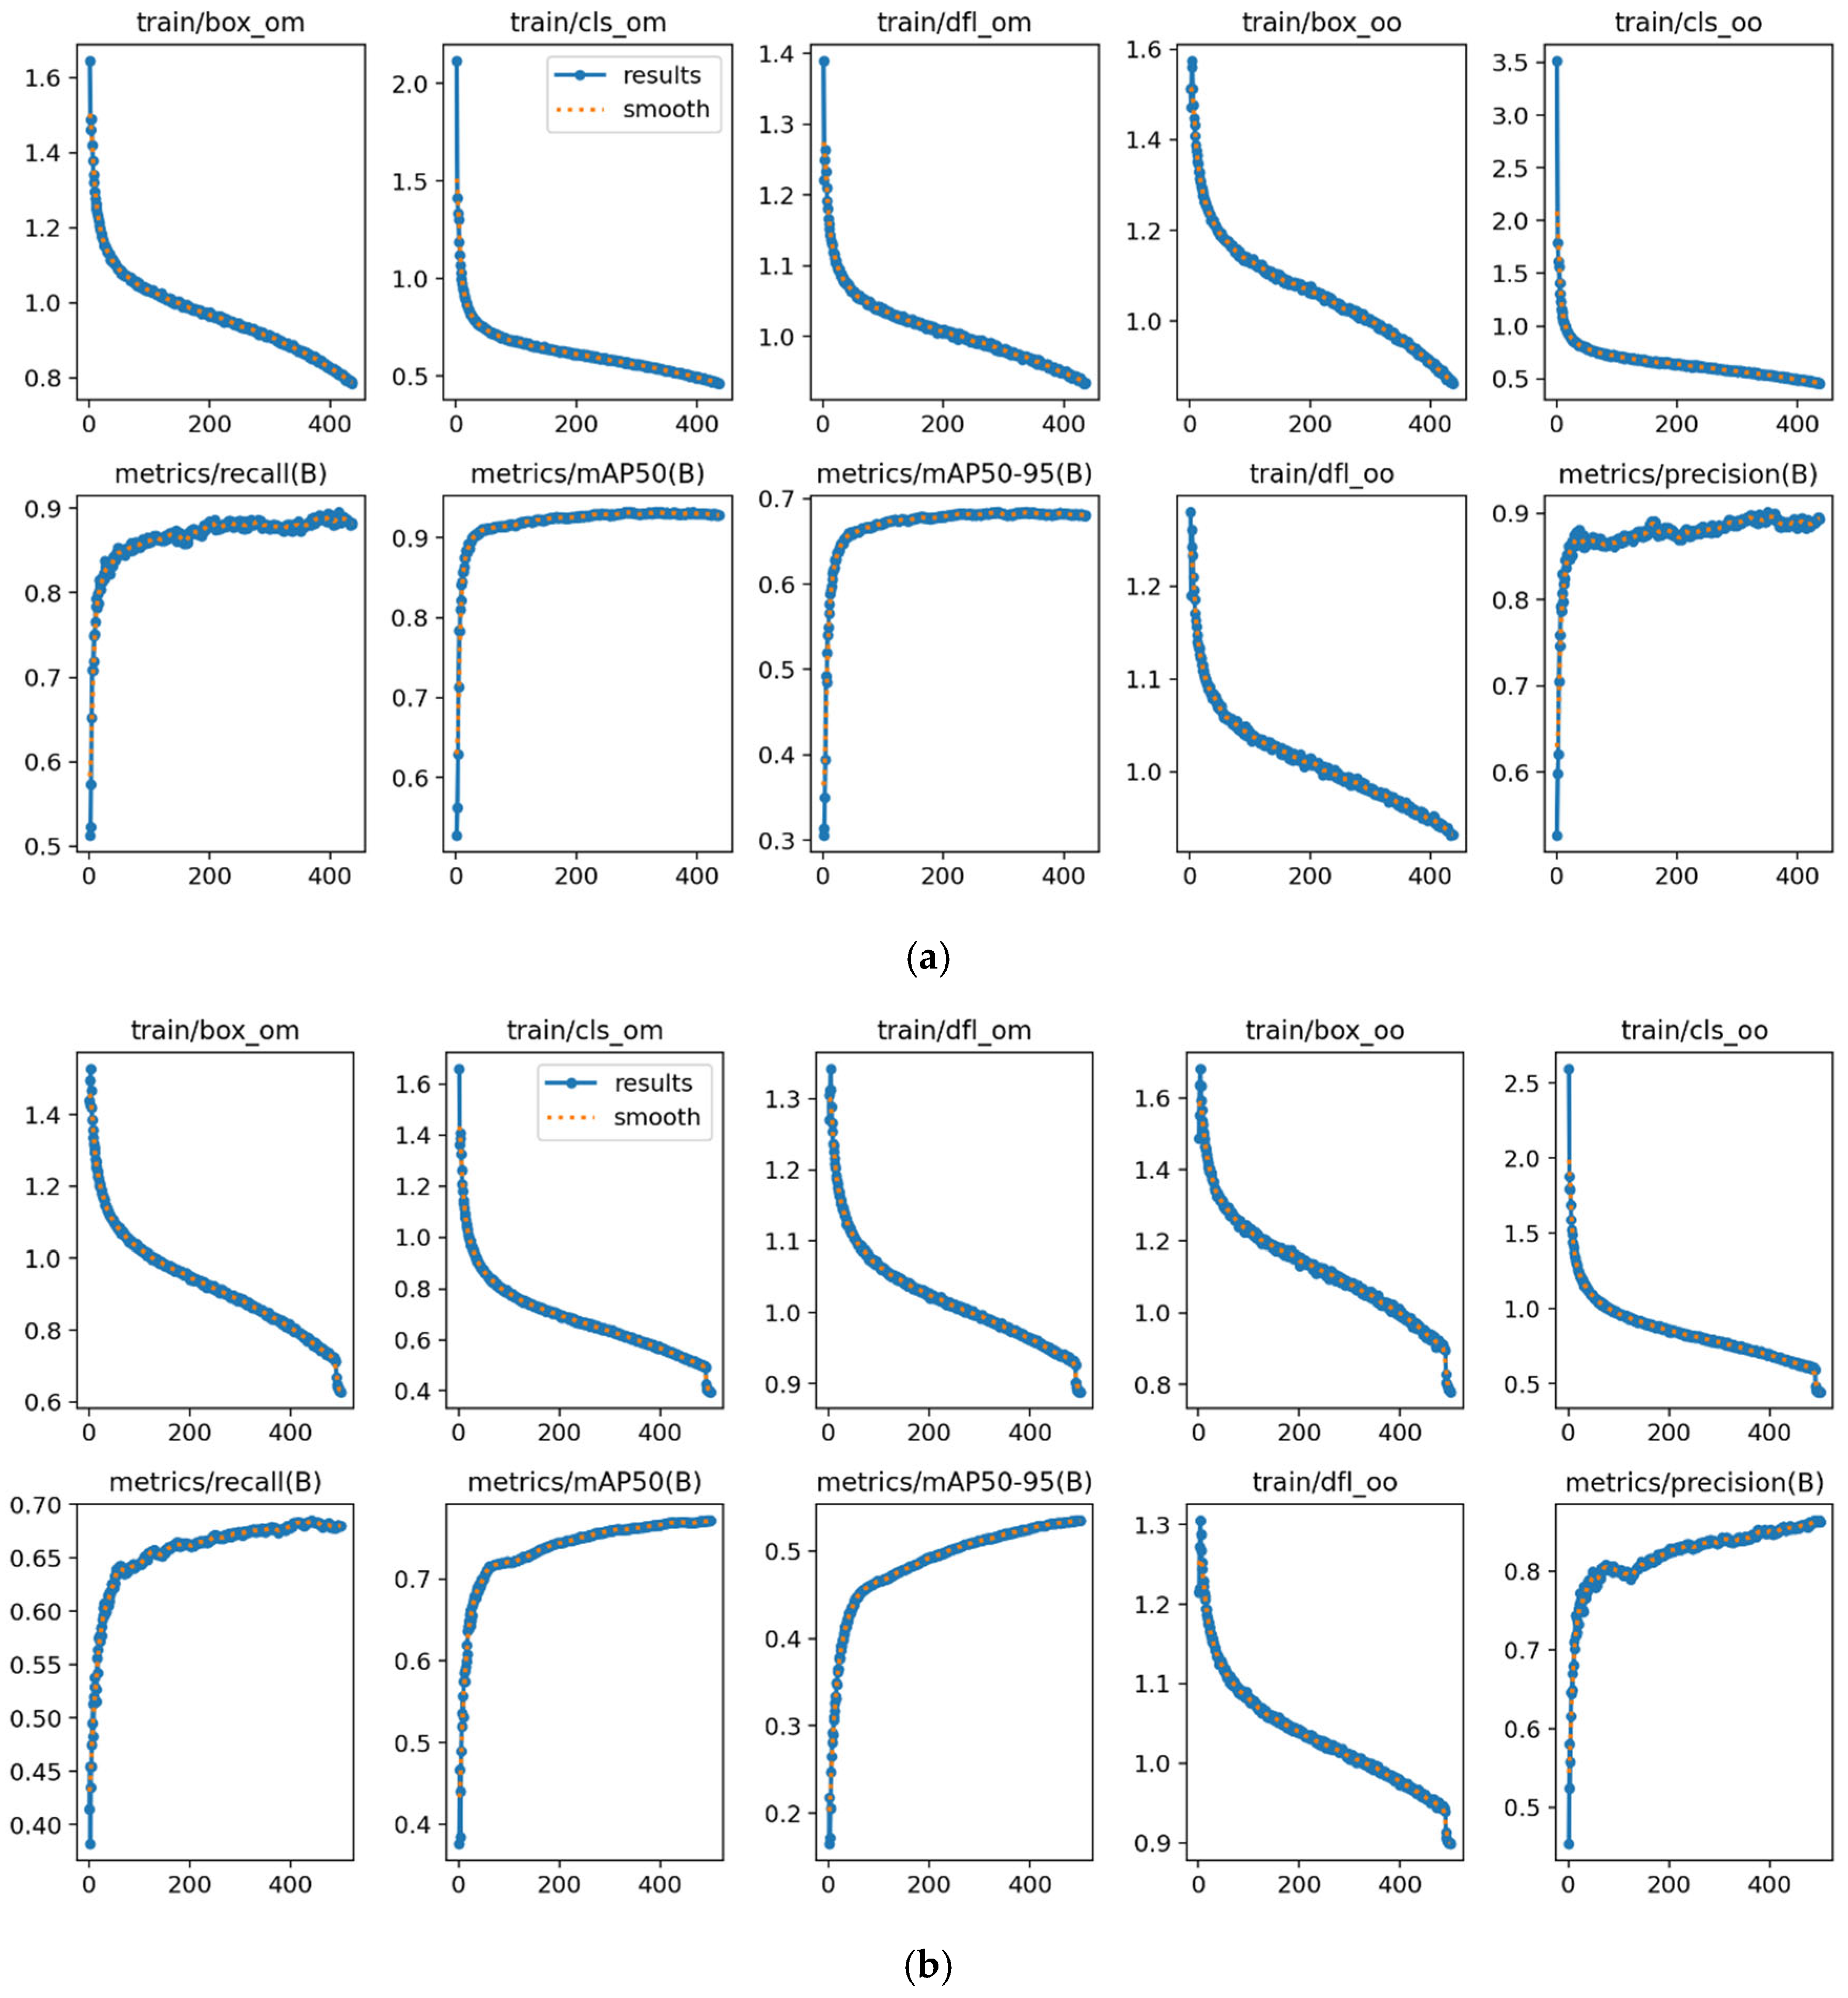
During training, the following notations were applied to monitor the loss functions and evaluation metrics across epochs:
- train/box_om–bounding box regression loss (one-to-many head);
- train/cls_om–classification loss (one-to-many head);
- train/dfl_om–distribution-based learning of box positions (one-to-many head);
- train/box_oo–bounding box regression loss (one-to-one head);
- train/cls_oo–classification loss (one-to-one head);
- metrics/recall (B)–sensitivity, defined as the ratio of correctly detected bounding boxes to the total number of ground-truth boxes;
- metrics/mAP50–mean Average Precision at 50% Intersection-over-Union (IoU);
- metrics/mAP50-90–mean Average Precision at IoU thresholds ranging from 50% to 90%;
- train/dfl_oo–lightweight distribution-based learning (one-to-one head);
- metrics/precision (B)–the ratio of correct predictions to all predictions.
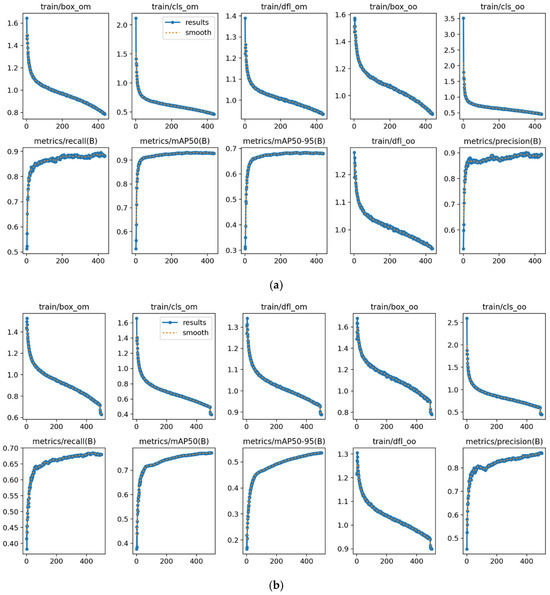
All the training and metrics parameters for TDDM and PDM were presented in Figure 3. We have chosen to show all parameters as keys during learning, but it should be noted that not all of them are equally important. The quality of training is determined by the key parameters’ train/box_oo and train/box_om. These errors indicate the extent to which the model’s predicted bounding boxes align with the actual objects in the image. As the model is trained, the error rate decreases with each epoch (Figure 3), indicating that it is becoming better at recognizing the boundaries of detected objects relative to the training set. In all training graphs, detection error decreases significantly during the initial iterations, indicating a coarse fit of the detection patterns (with a significant penalty for incorrect detections). In subsequent epochs, the model adjusts the weights more gently, aiming for the level specified by the model parameters.
Figure 3.
(a) Learning statistics of TDDM; (b) PDM. The x-axes show the epoch number, and the y-axes are labeled above the graphs.
Another parameter that defines learning quality is the metrics/recall (B) ratio, which is the proportion of correct detections relative to the ground truth level. Examining the metrics/recall (B) graphs of the tested models shows that the rate of correct detections increases with each iteration. This suggests that the model is improving in its ability to detect objects. Considering all the graphs in Figure 3 as a whole, a breakthrough can be observed between epochs 70 and 100 for all loss functions and evaluation metrics, where there is a clear change in the shape of the curves in the analyzed graphs. It should be noted that, in terms of evaluation metrics, there is only a slight change between 100 and 500 epochs. However, in terms of loss functions (e.g., train/box_om), the difference between 100 and 500 epochs is significant, at approximately 0.2 (20%) for TDDM (Figure 3a) and 0.4 (40%) for PDM (Figure 3b). Even though these values are significant, the changes that occur between epoch 0 and 100 are much greater, at approximately 0.6 for TDDM (Figure 3a) and 0.5 for PDM (Figure 3b).
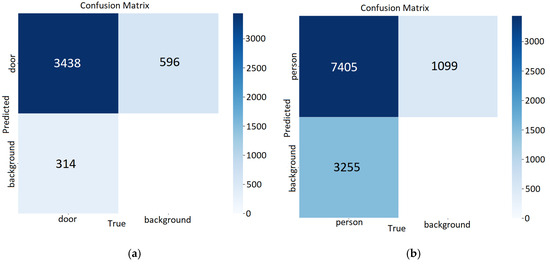
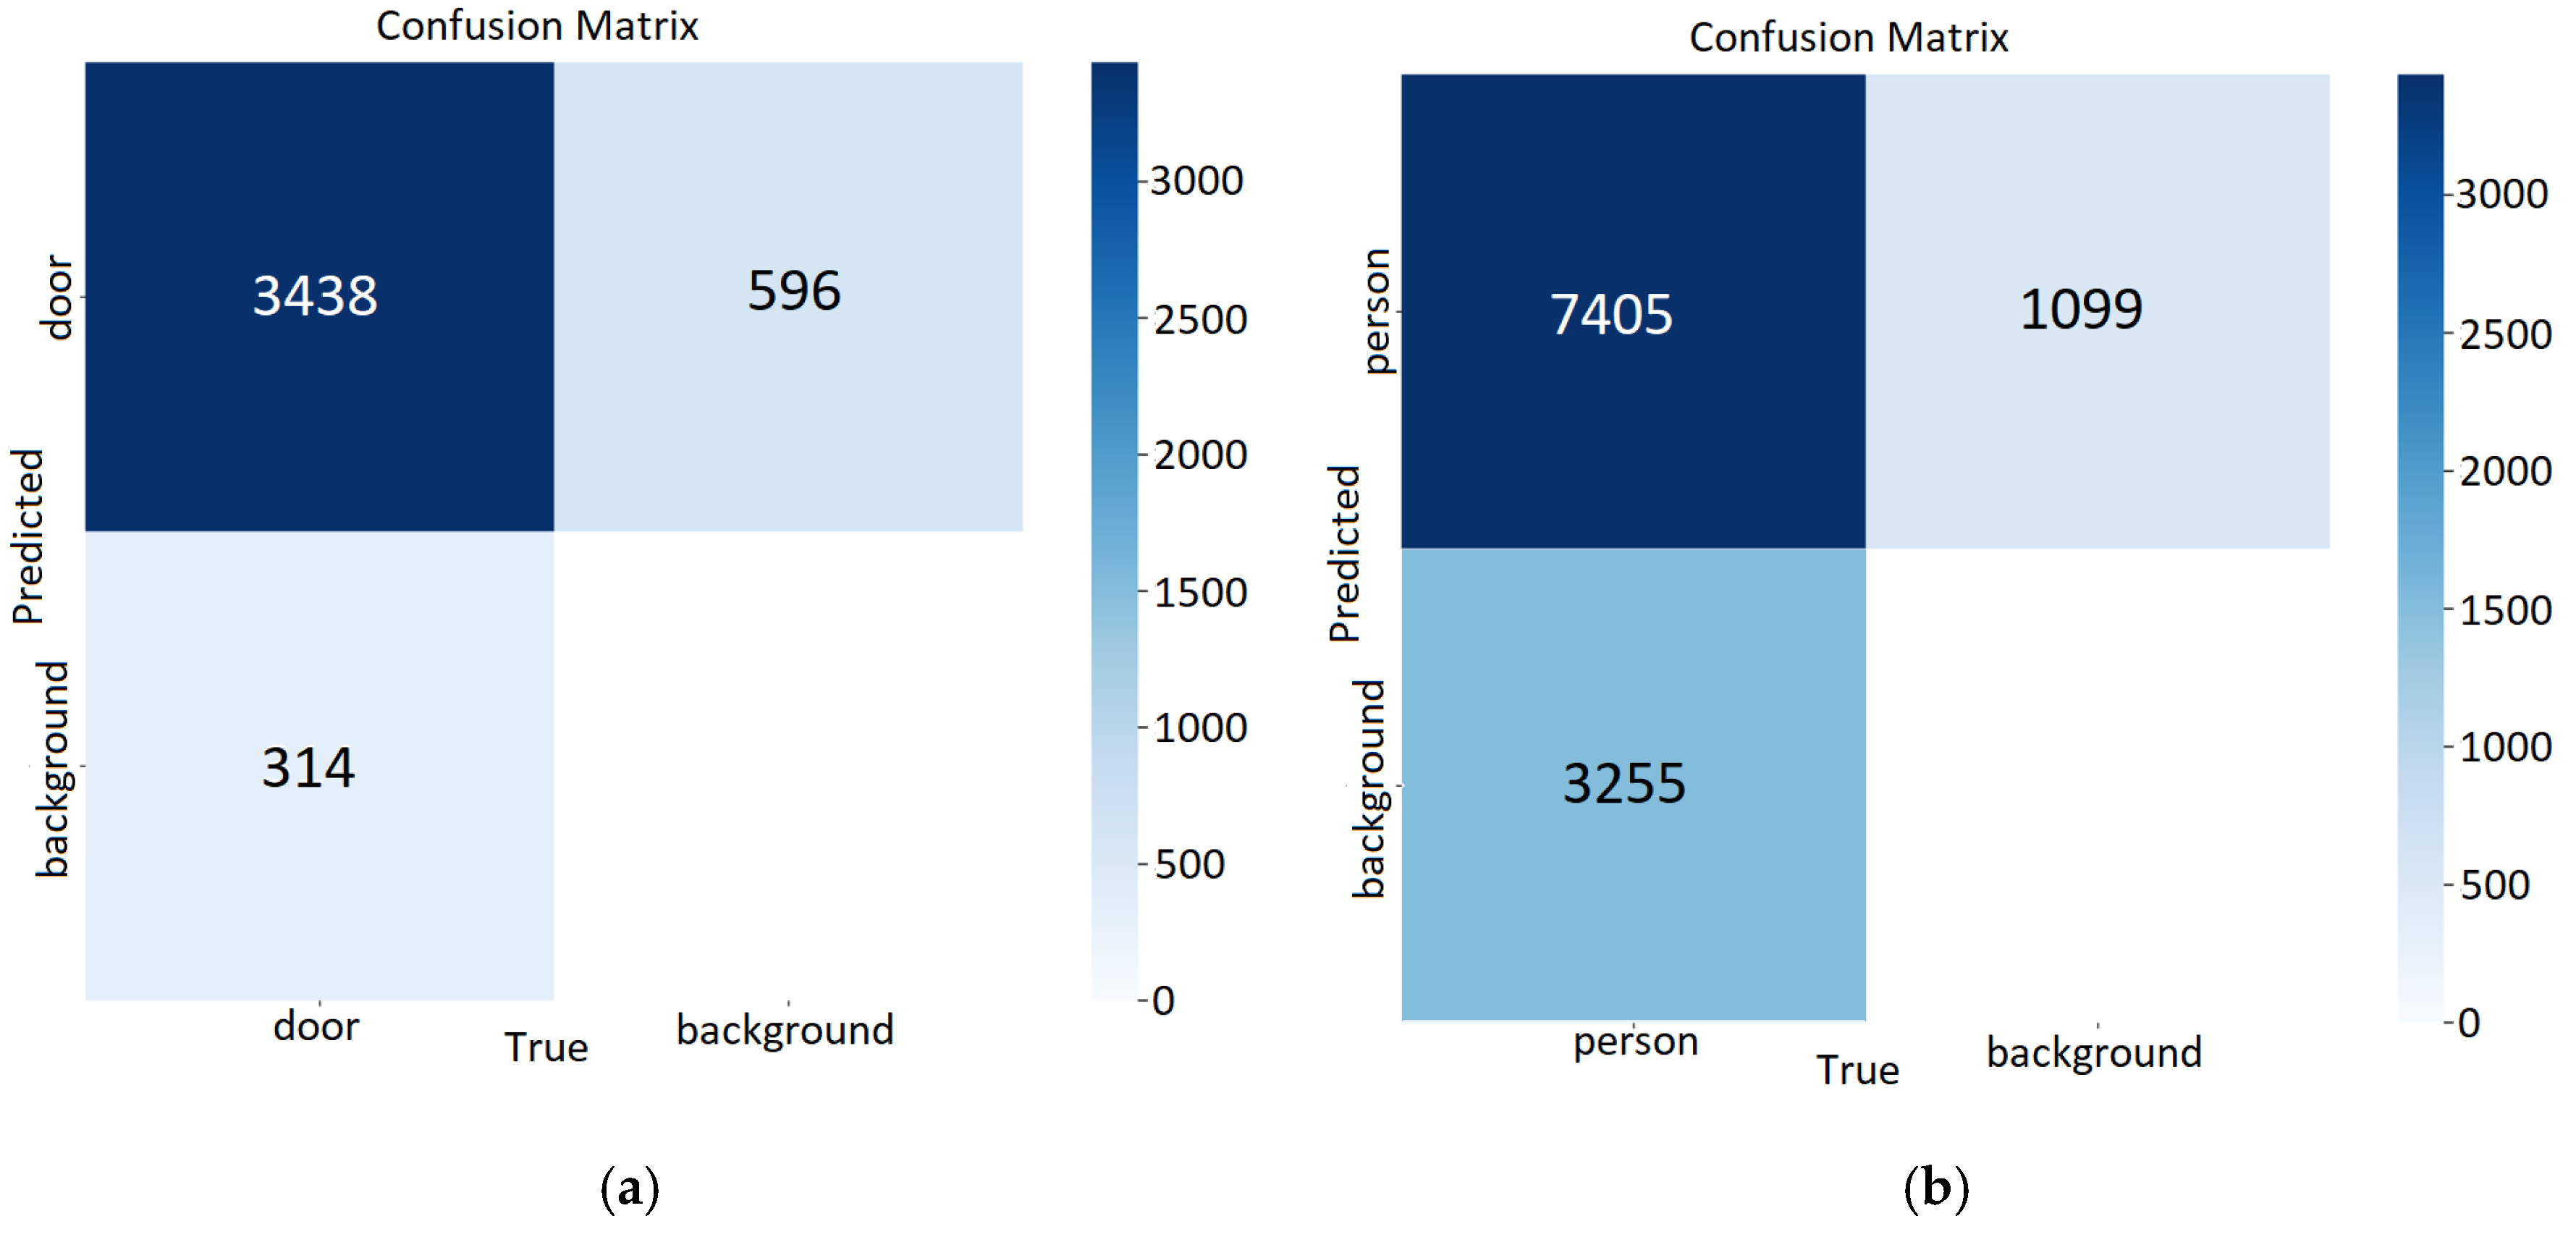
Figure 4 shows the detection matrix for TDDM and PDM. TDDM (Figure 4a) achieved a detection rate of 78,23%. It should be noted that 314 (7.21%) doors were not recognized by the algorithm as existing (false negatives), and 596 (15.56%) objects were recognized by the algorithm as doors despite being background objects (false positives). For PDM (Figure 4b), a detection rate of 62,97% was achieved, 3255 (27.68%) objects were false negatives, and 1099 (9.35%) were false positives. It should be noted that, while false positives do not introduce errors into the measurements, they do reduce the amount of recorded data. However, they can still distort the measurements and affect the measured values. An accuracy rate of 70% for doors and 62% for people can be considered satisfactory. Nevertheless, work should be carried out on a larger training set to improve the accuracy of the models. A new version of the YOLOv14 algorithm is currently available, which could improve accuracy.
Figure 4.
(a) TDDM detection error matrix; (b) PDM detection error matrix.
2.2. Artificial Intelligence Object Detections
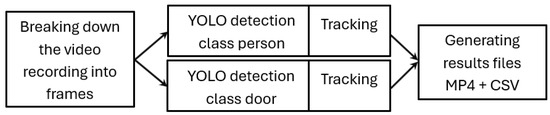
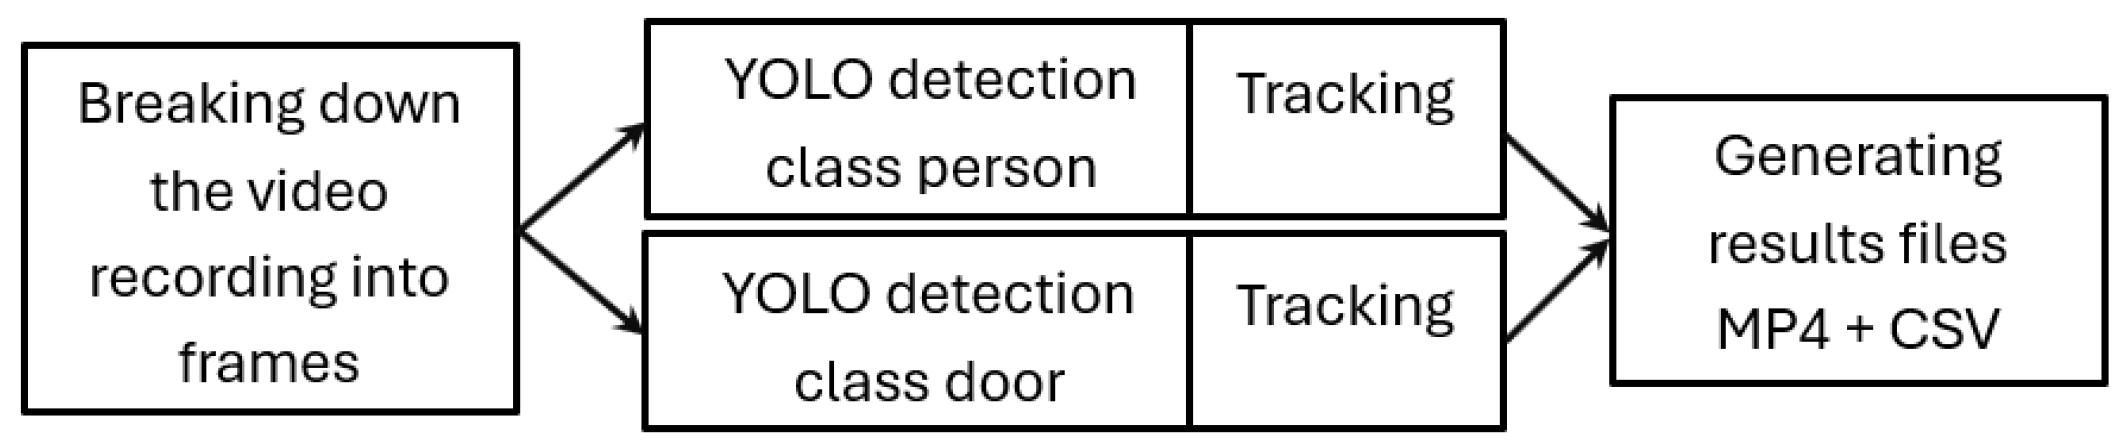
This chapter outlines the data processing procedure and explains how the algorithm operates. Please note that the analysis is performed on individual frames, rather than directly on the video. Furthermore, although the TDDM and PDM algorithms operate independently of each other, only their combined results are used to create an output file. The data flow in the analysis system is shown in Figure 5.
Figure 5.
The data flow in the analysis system.
As shown in Figure 5, data flow occurs in three stages:
- The first step involves breaking the video file into consecutive frames. Each frame is assigned a sequential number, and the frame rate of the entire video is obtained. This data allows for the unambiguous determination of the frame’s temporal position within the recording.
- The second stage involves analyzing each frame in parallel using two YOLO models (TDDM and PDM) to detect objects. This separation allows each model to be fine-tuned individually, which simplifies model management and training. The detection data is then stored in a matrix containing the coordinates of the detected objects. This stage also involves tracking objects in subsequent frames (tracked objects are assigned unique identifiers) and blurring people’s postures to comply with GDPR. Finally, the processed frames are combined into a new video and saved as an anonymized MP4 file.
- The third stage, where the resulting data is combined, annotates the detected objects, object tracking identifiers, and motion vectors on each subsequent video frame. The resulting frames are saved to video files, and the detection data is saved to CSV files for further analysis.
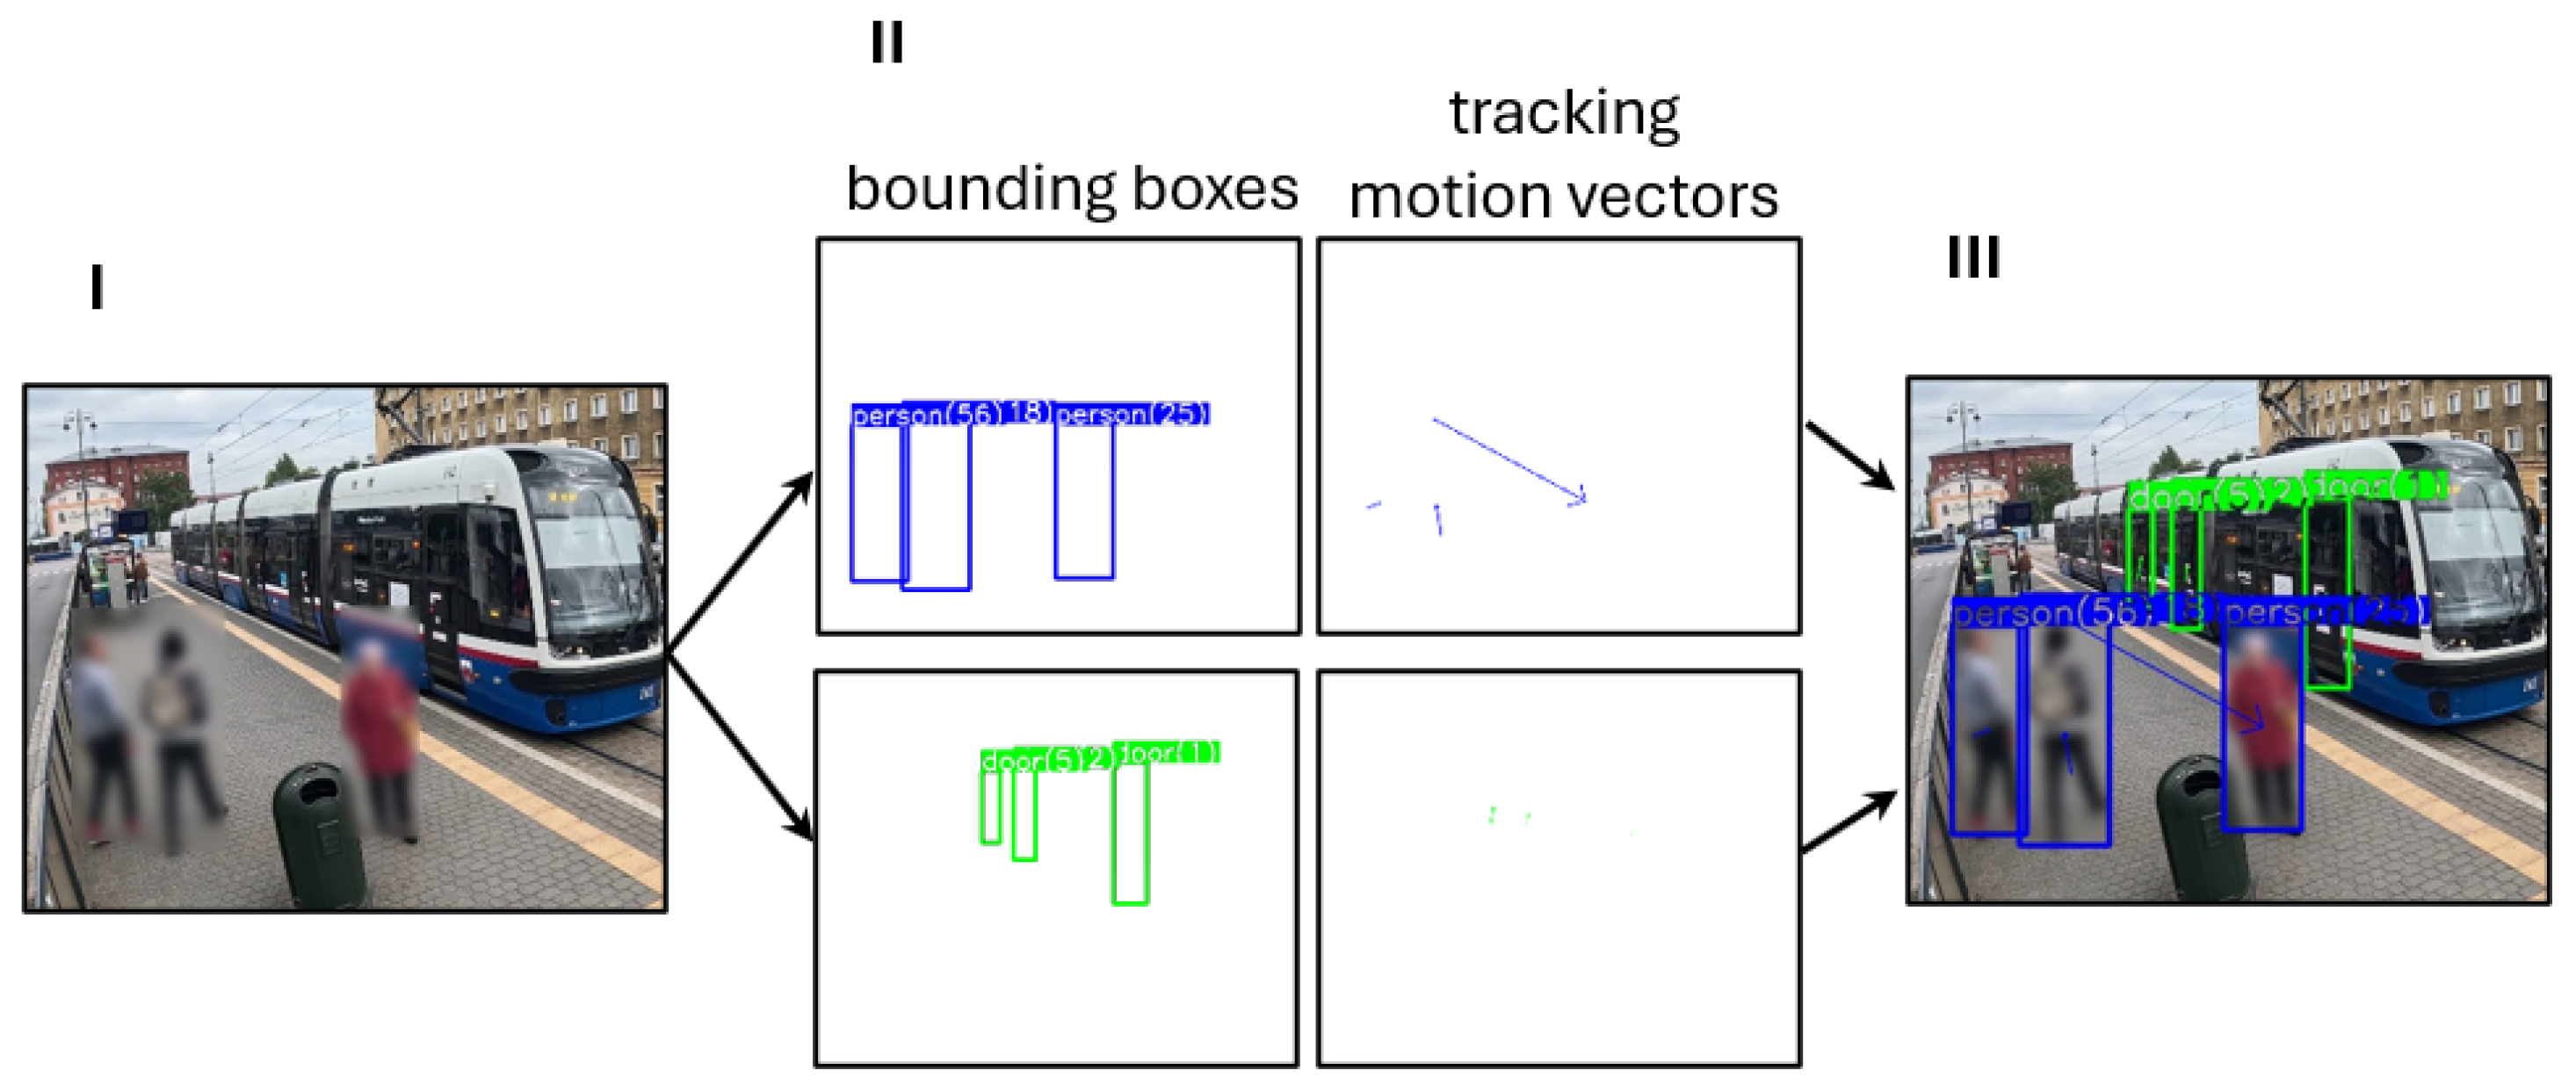
The above stages can be presented in a graphical way. The graphical interpretation of the model’s operation and data flow was presented in Figure 6.
Figure 6.
The graphical interpretation of the model’s operation.
Although graphical interpretation of the recognized models is important for verifying which objects have been recognized in the recording and which have not, as well as for assessing the level of detail recognized by the algorithm, further data analysis requires mathematical operations. Therefore, alongside the MP4 file, a CSV file containing the data in vector form is generated, where subsequent values contain information about:
- frame number;
- time from the beginning of the recording calculated based on the frame to the beginning of the event [s];
- person tracking ID (number assigned for the same object in subsequent frames), which is blank if the event concerns a door;
- number of doors in the frame (door IDX);
- door tracking ID (number assigned for the same object in subsequent frames). Which is blank if the event concerns a person;
- event from the selected: door stop, door move, boarding, alighting;
- time of the event [s];
- number of people detected in a frame;
- door stopping time corresponds to the tram’s stopping time at the stop [s].
The process of passengers boarding and alighting from a tram can be interpreted as the appearance (alighting) or disappearance (entry) of person objects within the door object. The overlap between the passage box and the door box is also important, which we assumed to be over 30%. The time calculations are based on the frame number in the sequence and the recording frame rate. This approach can provide precise timing during analysis. However, it is important to note that there is no such thing as boarding or alighting from the tram for the program. The rigid definition we have adopted (34% and 40% coverage between boxes, with people either boarding or disappearing) is also arbitrary. Modifying these conditions will produce different results. To sum up, the boarding/alighting process is defined as:
- alighting–time from the appearance of the object person within the door object area, counted until the moment when the door and person objects coverage is greater than 34%; the door object must exist at least 14 frames before the moment of counting the time; the minimal confirmation ratio was 0.4;
- boarding–time from the moment when the field of the person object overlaps the field of the door by 40% until the moment the person disappears within the area of the door field, the person and door object must exist at least 14 frames before the moment of counting the time; the minimal confirmation ratio was 0.4.
- The stop and move door process is defined as:
- door stop-the position of the door has not changed by more than 4 pixels in the next 12 frames; the door object must exist at least 8 frames (before these 12 frames), before the moment of counting the time;
- door move–after the event door stope, the door has not changed by more than 4 pixels in the next 12 frames; time of the event is calculated from door stop to door move based on the frame number.
The above parameters were selected experimentally by the authors of this article. Their values significantly influence the obtained results. However, the purpose of this study is not to analyze the impact of individual parameters on the obtained data, and for this reason, they have been included arbitrarily in the above definitions.
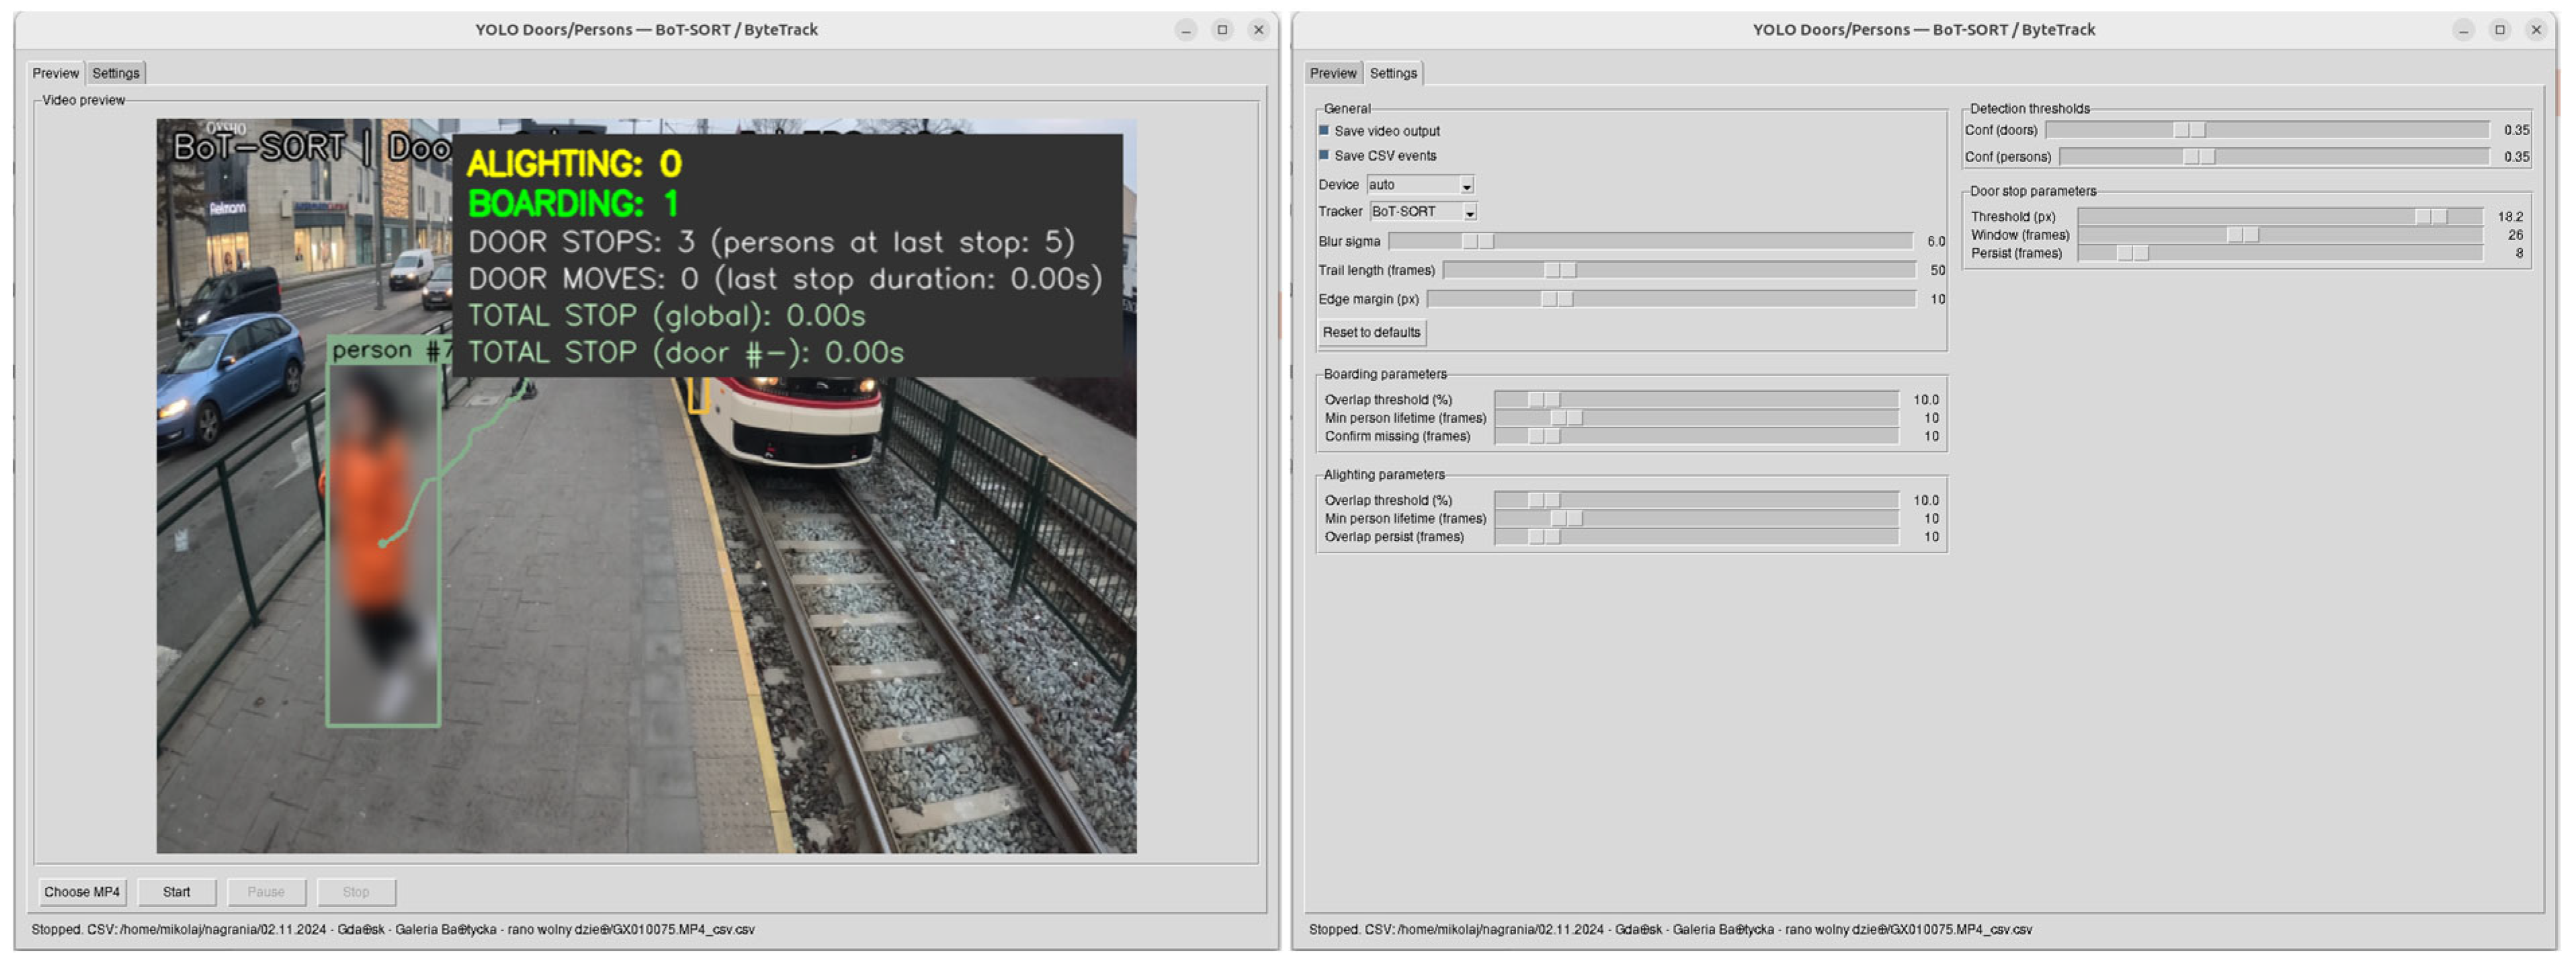
Figure 7 shows the software used to operate the algorithm. The software was named REWIZOR. The REWIZOR, along with instructions, is included in Appendix A. The REWIZOR includes a balloon tooltip explaining the usage of individual sliders and options.
Figure 7.
Application form for the REWIZOR software.
3. Results and Discussion
In this section, the results of the studies are presented both in the classical approach and using the REWIZOR software.
3.1. The Clasical Analisis
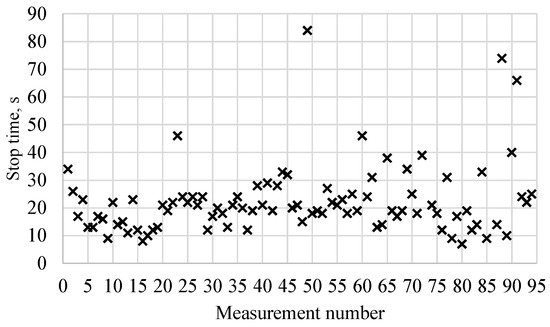
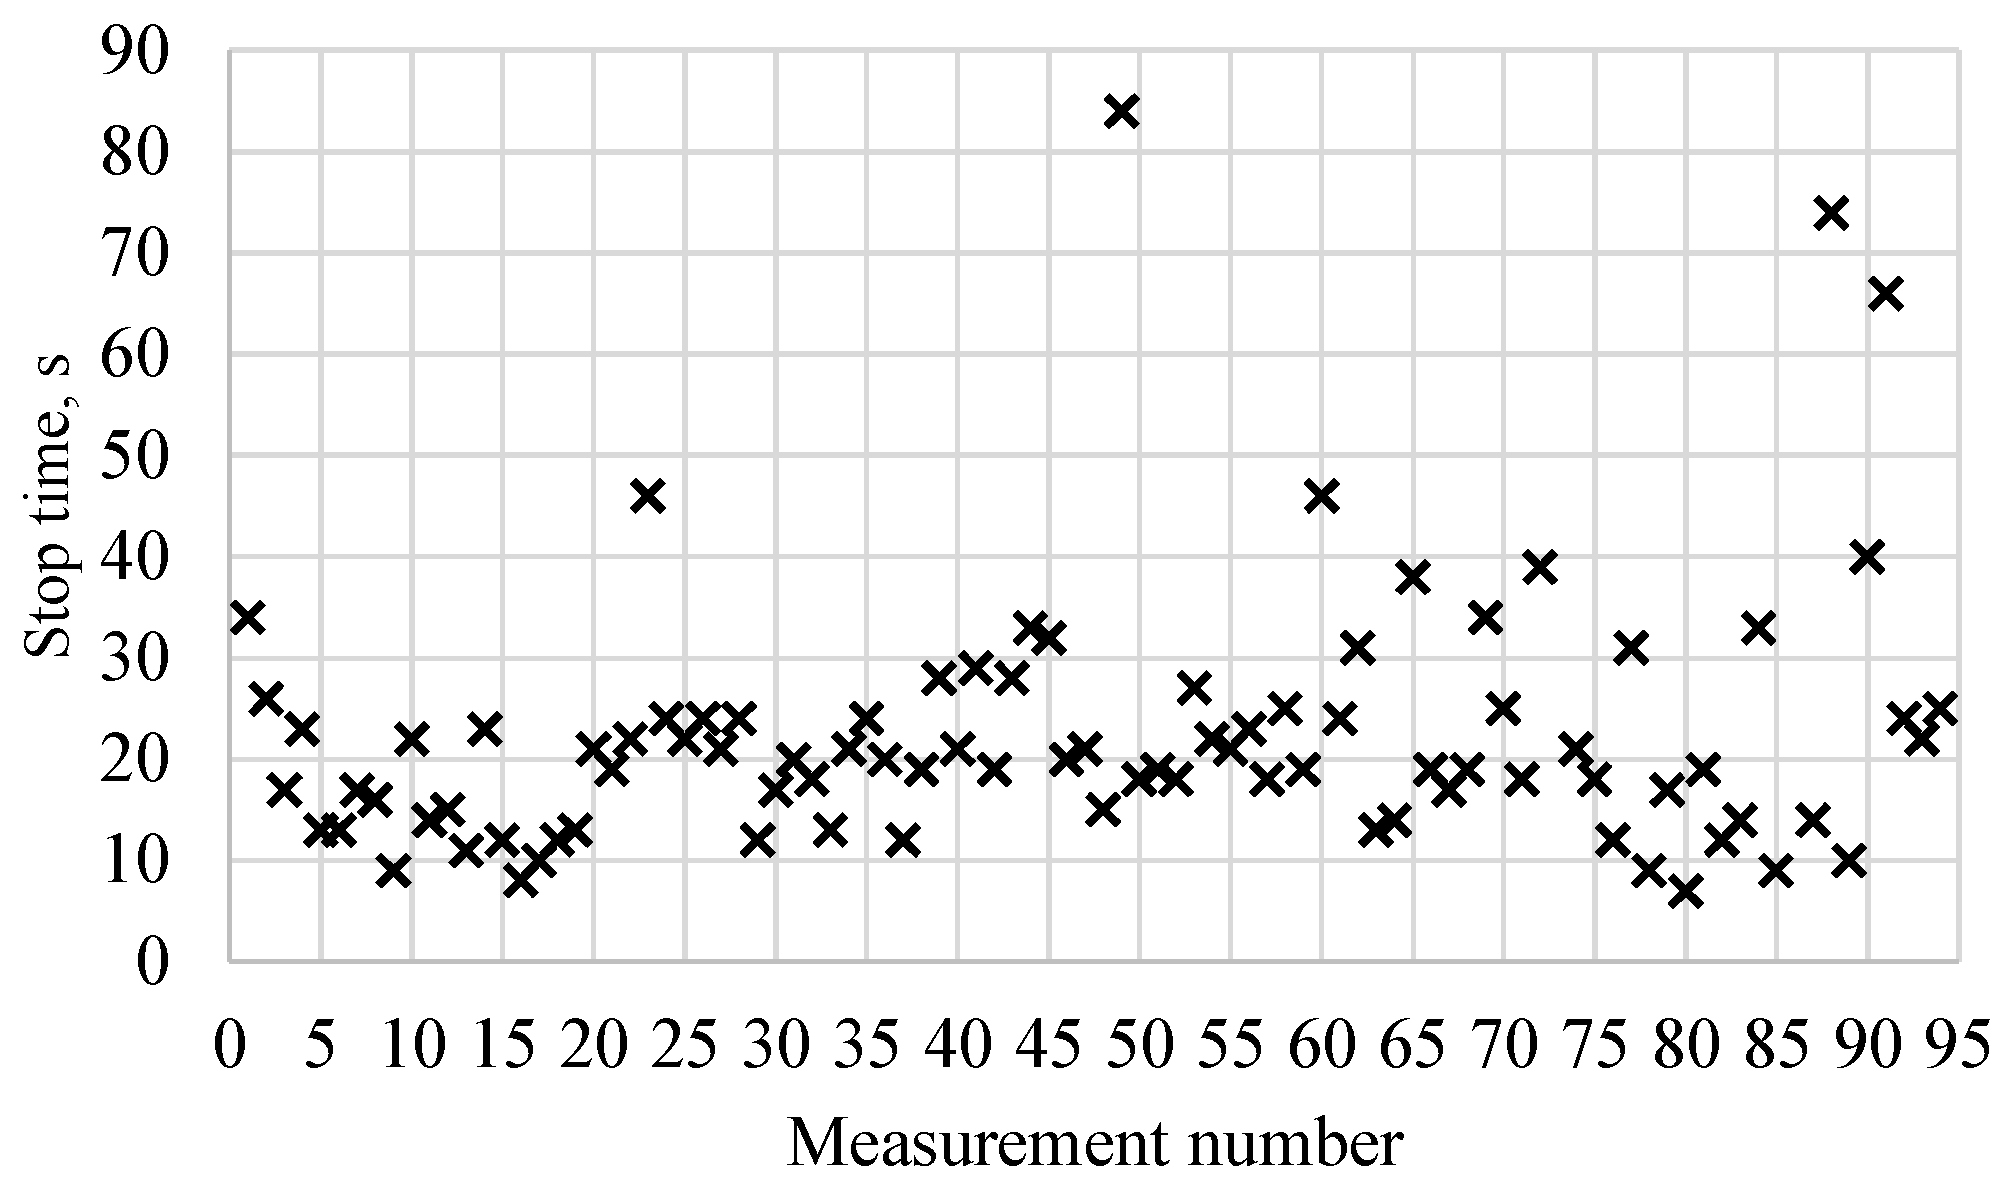
One of the most important parameters that can be resisted, and is important for the fluidity of road traffic, is the tram stop time at the stop. This time is presented in Figure 8. Only 92 cases were presented in Figure 8 because two recordings were completed before the tram left (one in Bydgoszcz and one in Elbląg). The mean value of the stop time was 22.40 s, and the standard deviation was ±12.57 s. So, high standard deviation is caused, among others, by the measurements where the standstill time was over 60 s. Almost 60% of the stop times were equal to or below the mean stop time. It is worth noting that all measurements were taken during hours of increased traffic, which may result in various road incidents increasing the tram’s stoppage time, regardless of the passenger exchange time. Nevertheless, the average time of 22.40 s is short. The minimum stop time was 7 s, and the maximum was 84 s. The presented data does not allow drawing conclusions as to the reason for the increase in stopping time. However, experience gained while recording passenger flows shows that stopping time exceeding 30 s is most often caused by traffic lights before the stop, a road incident, or other events not related to the exchange of passengers.
Figure 8.
The stop time at the tram stop.
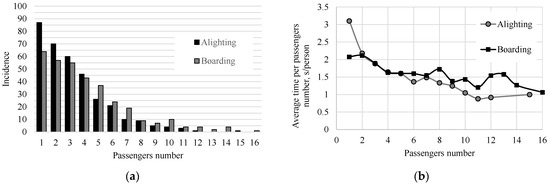
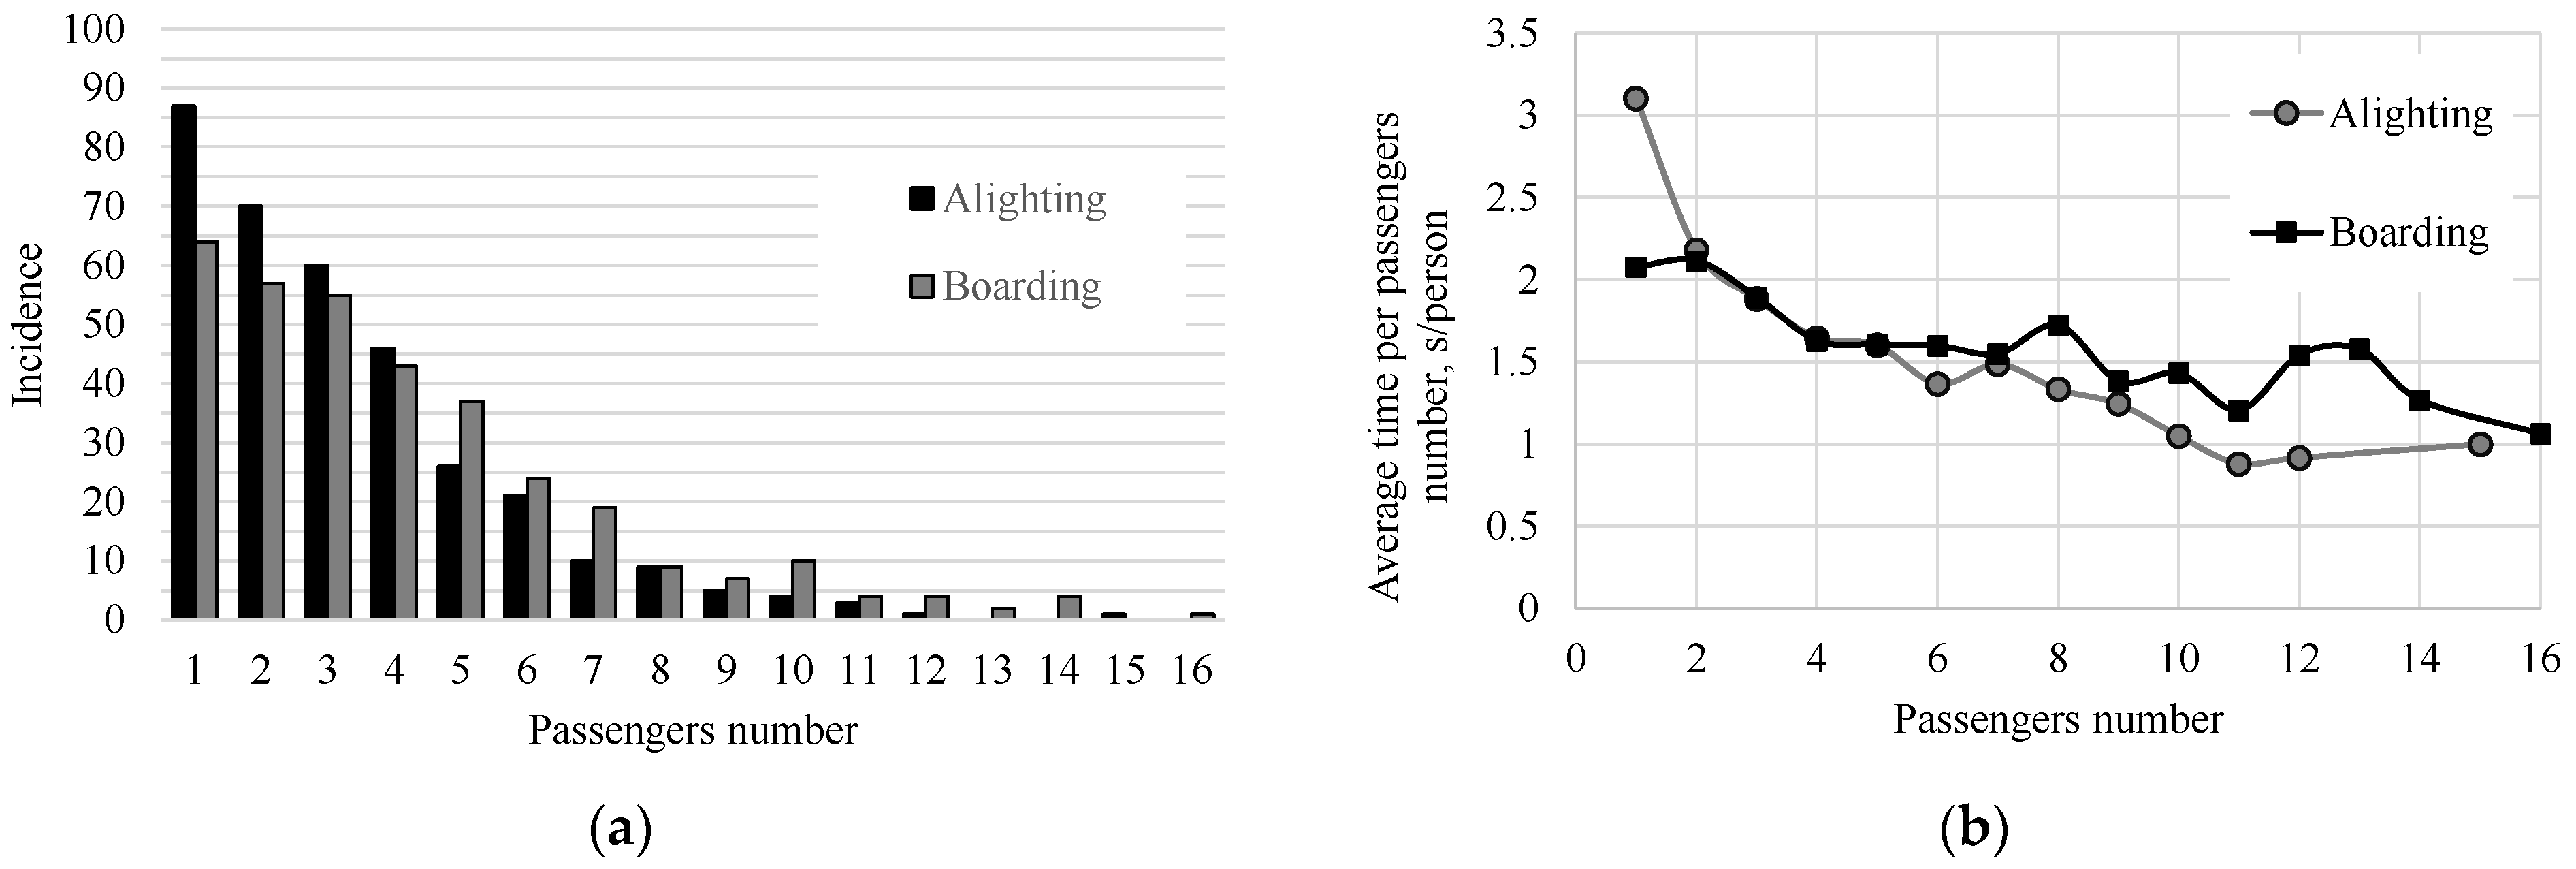
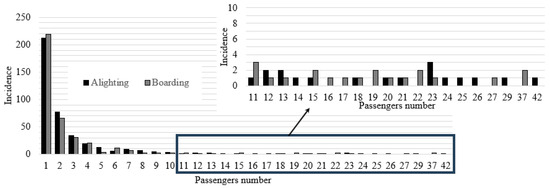
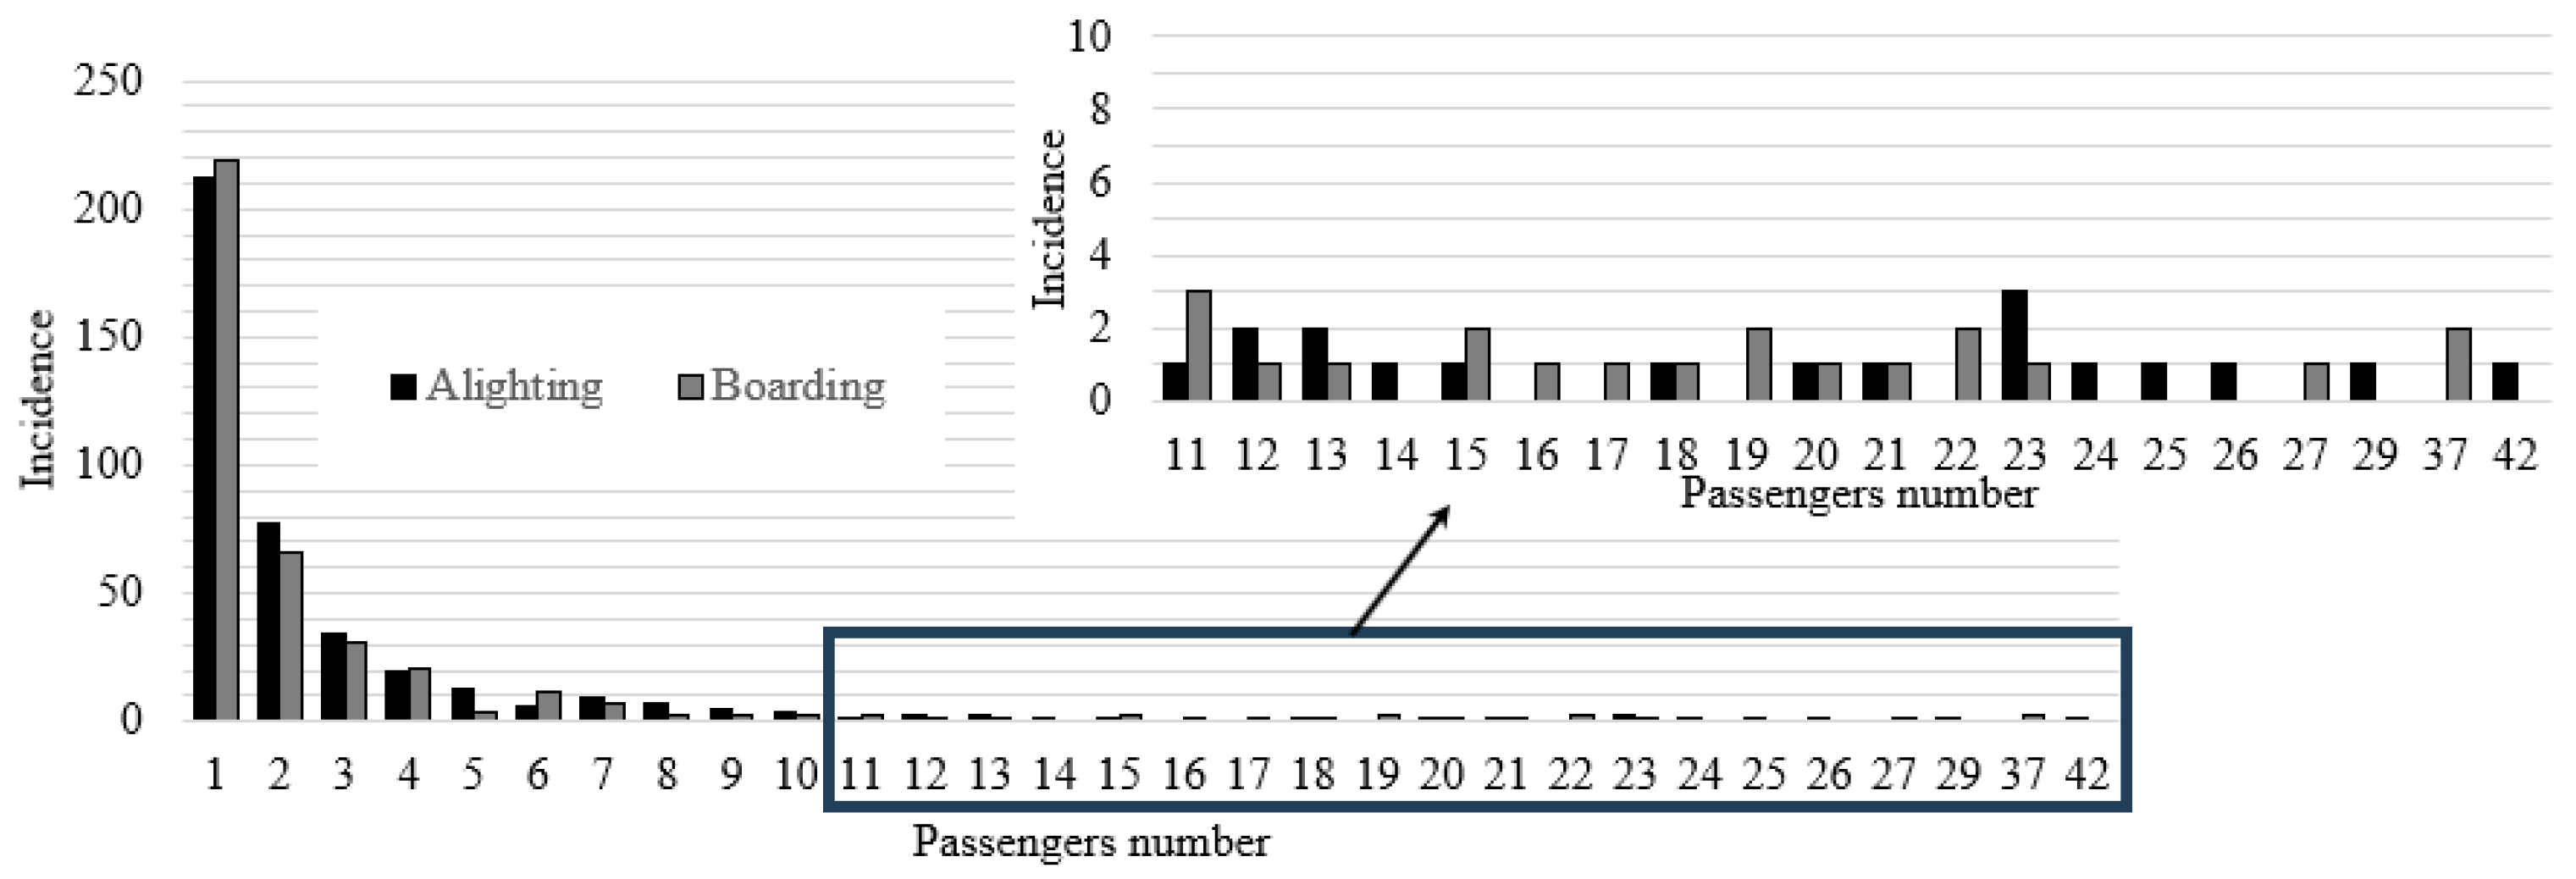
Of the 94 recorded cases of the passenger exchange process, 343 cases of alighting and 340 cases of boarding were recorded. The time of the process and the number of passengers were measured for each tram door separately. The number of registered processes, depending on the number of people in a process, was presented in Figure 9a. As shown, the fewer people getting on/off, the greater the number of recorded cases. It should be noted that these measurements were taken during rush hour at stops with a high passenger turnover. Despite this, over 22% of all recorded exchanges involve 1 passenger. Only 1 case of boarding was noted for 16 passengers, and 1 case of alighting for 15 passengers. Therefore, it can be seen that tram transport has a relatively small passenger flow.
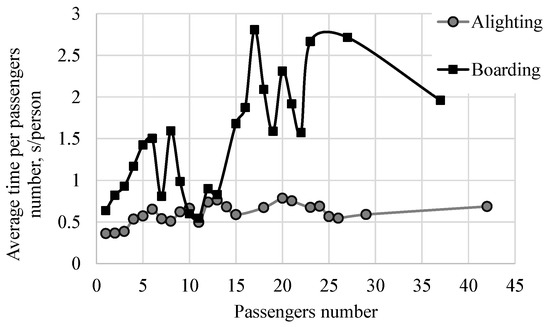
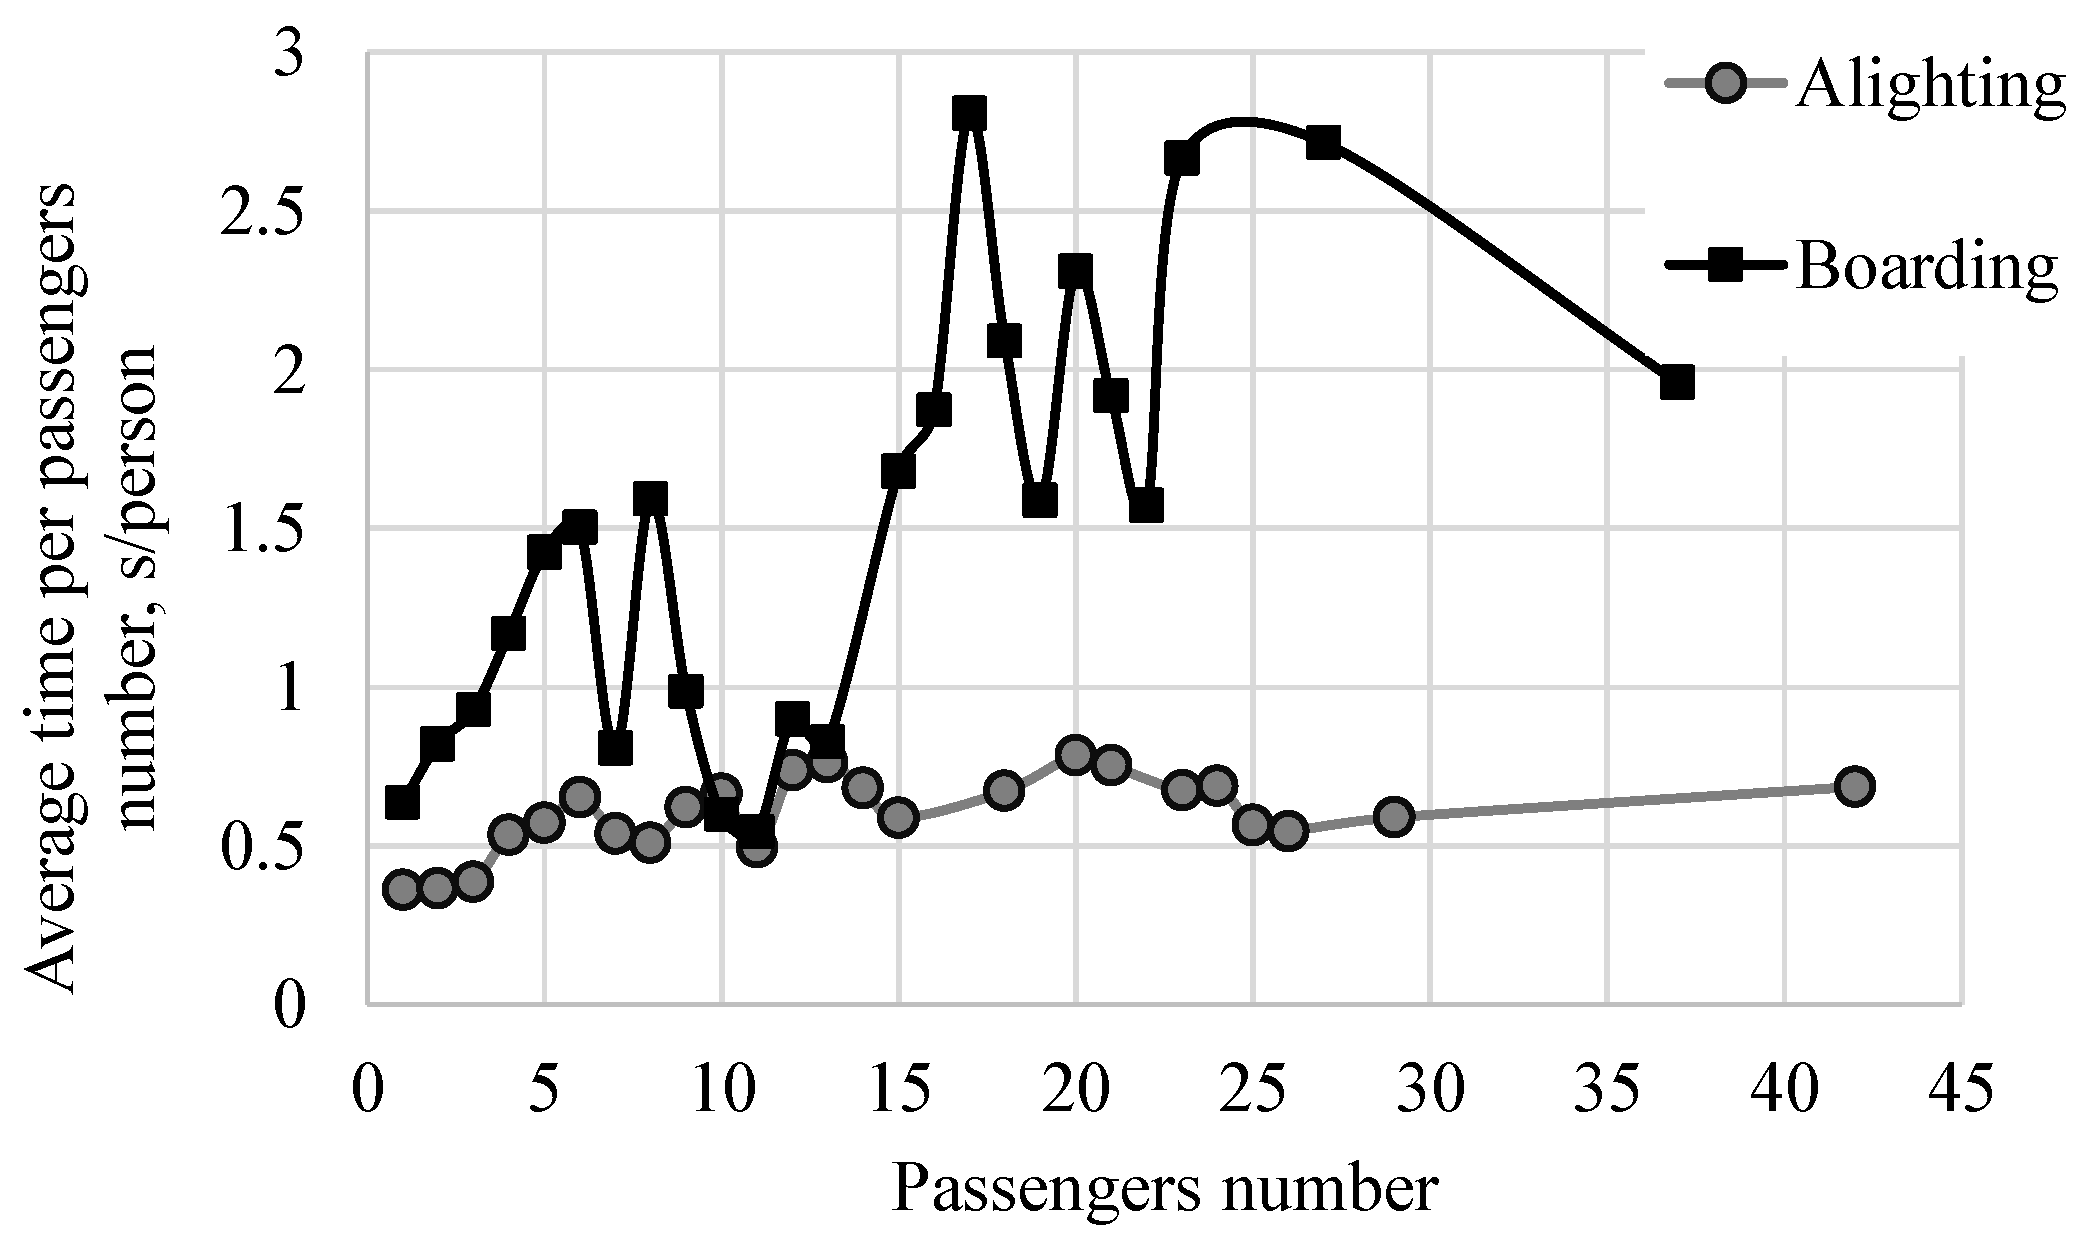
Figure 9.
The number of boarding and alighting cases (a), and the average process time per number of passengers participating in the exchange (b), vs. the number of people carrying out the process.
Figure 9b shows the average boarding/alighting process time per passenger as a function of the number of passengers involved in the process. The average time taken for boarding and alighting decreased with the number of passengers. For groups of 9 or more passengers, it was between 0.87 and 1.58 s. Similar results were obtained by Szyca et al. [35], and Podolski [36]. The boarding time was higher for groups of 8 or more passengers. The longest process time (3.1 s) was recorded for one passenger alighting. The standard deviation of the measurements was ±1.7 s for the boarding time and one passenger, while for the remaining measurements it was less than 1 s, and decreased with the number of passengers due to the decreasing number of measurement data. Detailed tabulations of the values from Figure 9, standard deviations and confidence intervals are presented in Appendix B.
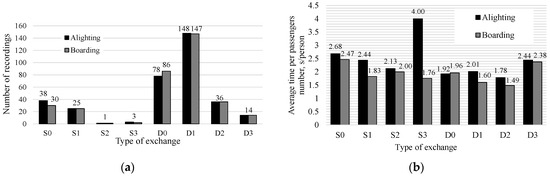
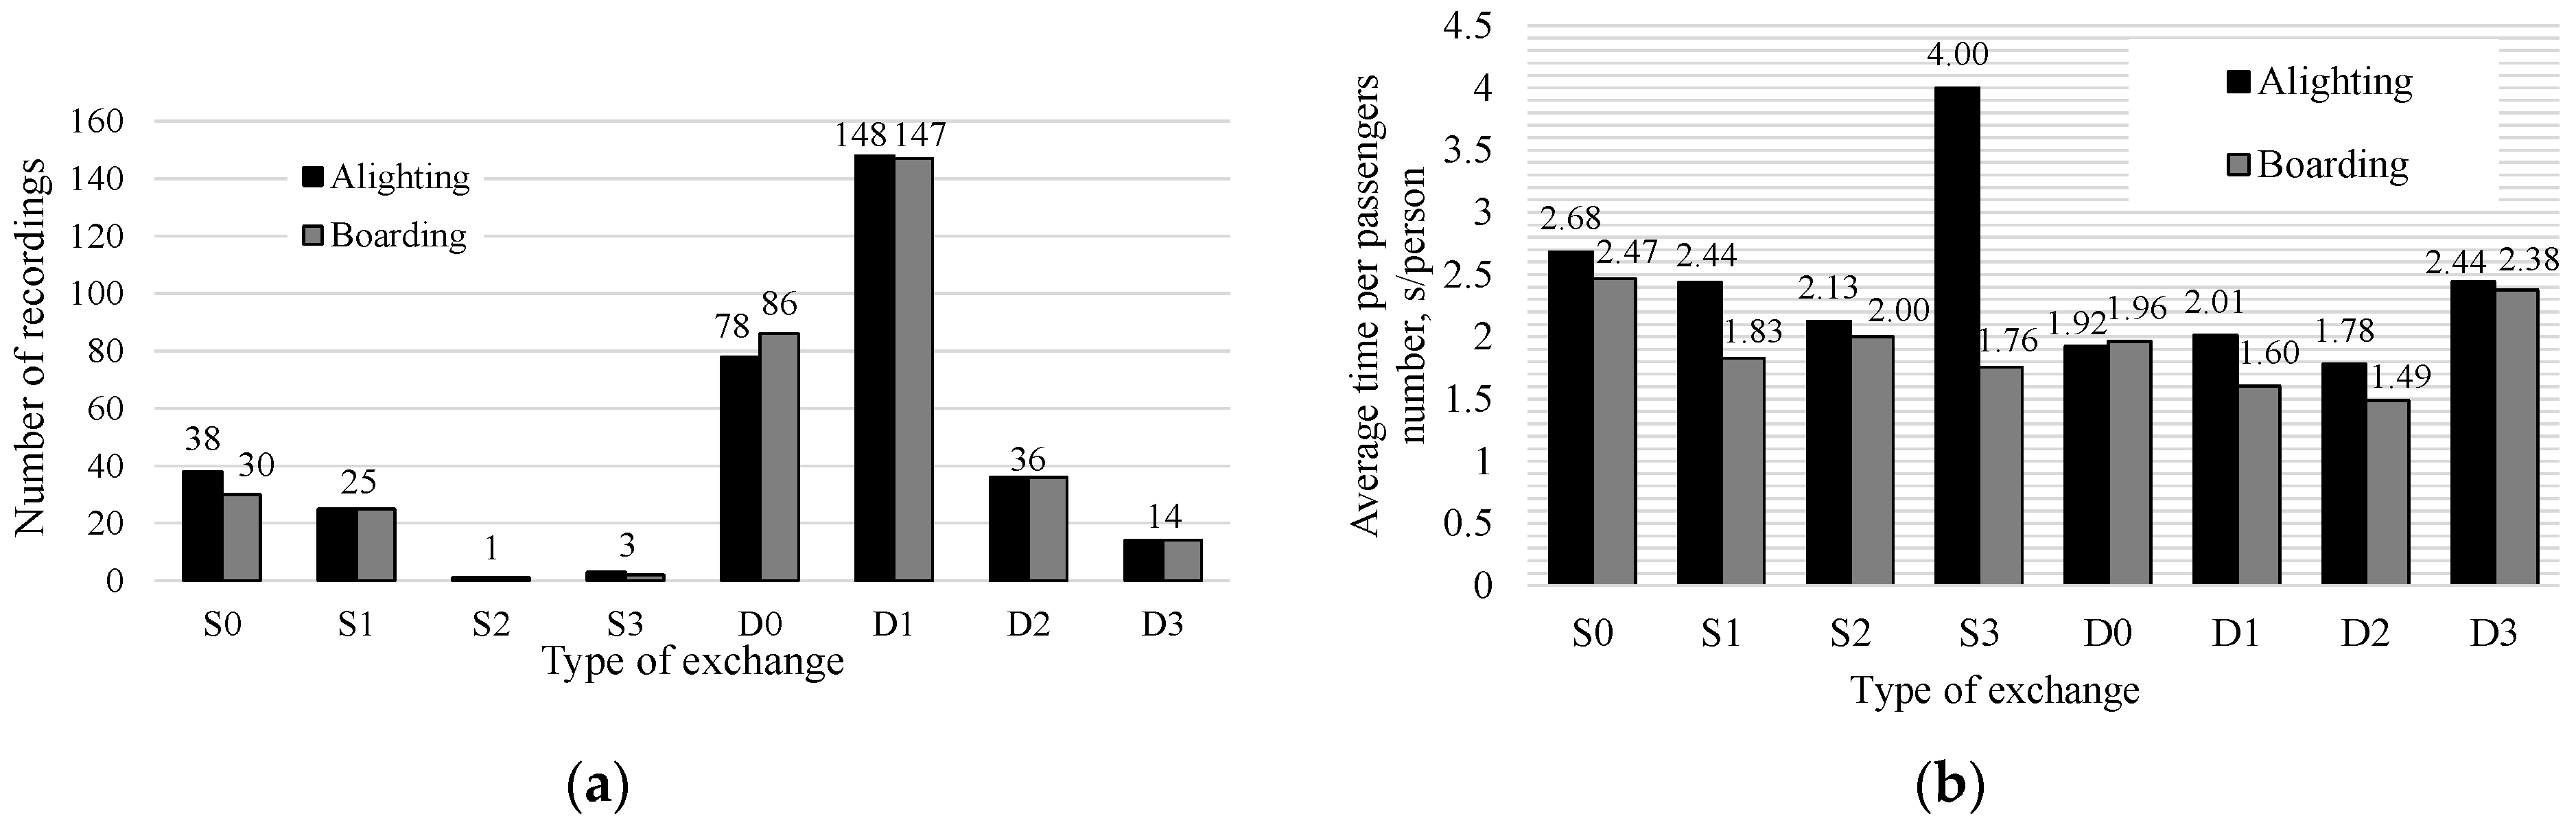
Figure 10a presents the number of registered cases of the process due to the type of passenger exchange. The number of registered cases is generally independent of the process type, except for cases S0 and D0, where the boarding and alighting process takes place independently. This applies to two cases: (1) passengers boarding and alighting without colliding with each other; and (2) only one process (boarding or alighting) being carried out through the door. For this reason, the recorded number of processes may be different.
Figure 10.
Number of registered exchange types (a) and average process time depending on exchange type (b).
Most recorded processes take place through double doors. Please note that the most common train was the Pesa Swing (Figure 1b, which has a single door at the front and rear. The remaining doors are double doors. Therefore, there are fewer single doors than double doors. Camera positioning is also crucial in this case. Due to the possibility of mounting the camera at the stop, trams were most often filmed from the front or rear, and the recording included one single door and two or more double doors. The most common type of passenger exchange for single doors was type S0, and for double doors was type D1. Types 2 and 3 were generally rare (around 14.6%). These types are characteristic of large passenger flows when people getting on/off significantly influence each other, and most of the recorded processes involved 5 or fewer passengers (Figure 9a).
Figure 10b presents the average alighting/boarding process time depending on the passenger exchange type. According to the data presented in Figure 9b, generally lower times were recorded for the alighting process than for boarding. The exception is the D0 exchange type, where the boarding time was higher, which may result from the fact that people with reduced mobility use mainly double doors—such as those with wheelchairs, strollers, or bicycles. The differences in process times are differentiated and are equal to 8, 25, 6, 56, 2, 20, 16, 3% sequentially (from S0 to D3 in the order shown in the charts in Figure 10). The largest difference (56%) was observed for the S3 exchange type. The average time was calculated based on 3 cases (Figure 10a). Due to significant deviations from other results, these cases were reviewed in more detail. All three cases involved one, two, and one passenger alighting and eight, six, and six passengers boarding (sequentially). All cases involved the Pesa Swing tram and occurred once in Gdańsk and twice in Bydgoszcz. These were cases in which the tram door was significantly blocked by a crowd of people that outnumbered the passengers getting off, according to the authors, what follows from the fact that single doors located only at the end of the tram are often used by passengers who wish to leave the tram by the shortest possible route, since tram stops generally have an exit on only one side. A similar disproportion in the number of alighting and boarding persons was also observed in the case of the D3 exchange type. But, in this case, the average process time is similar. It can therefore be concluded that single doors will reduce the rate of passenger exchange, and this effect may increase with the increase in the number of passengers and the disproportion between people getting on and off.
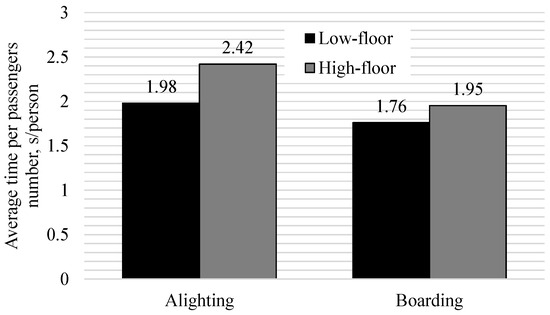
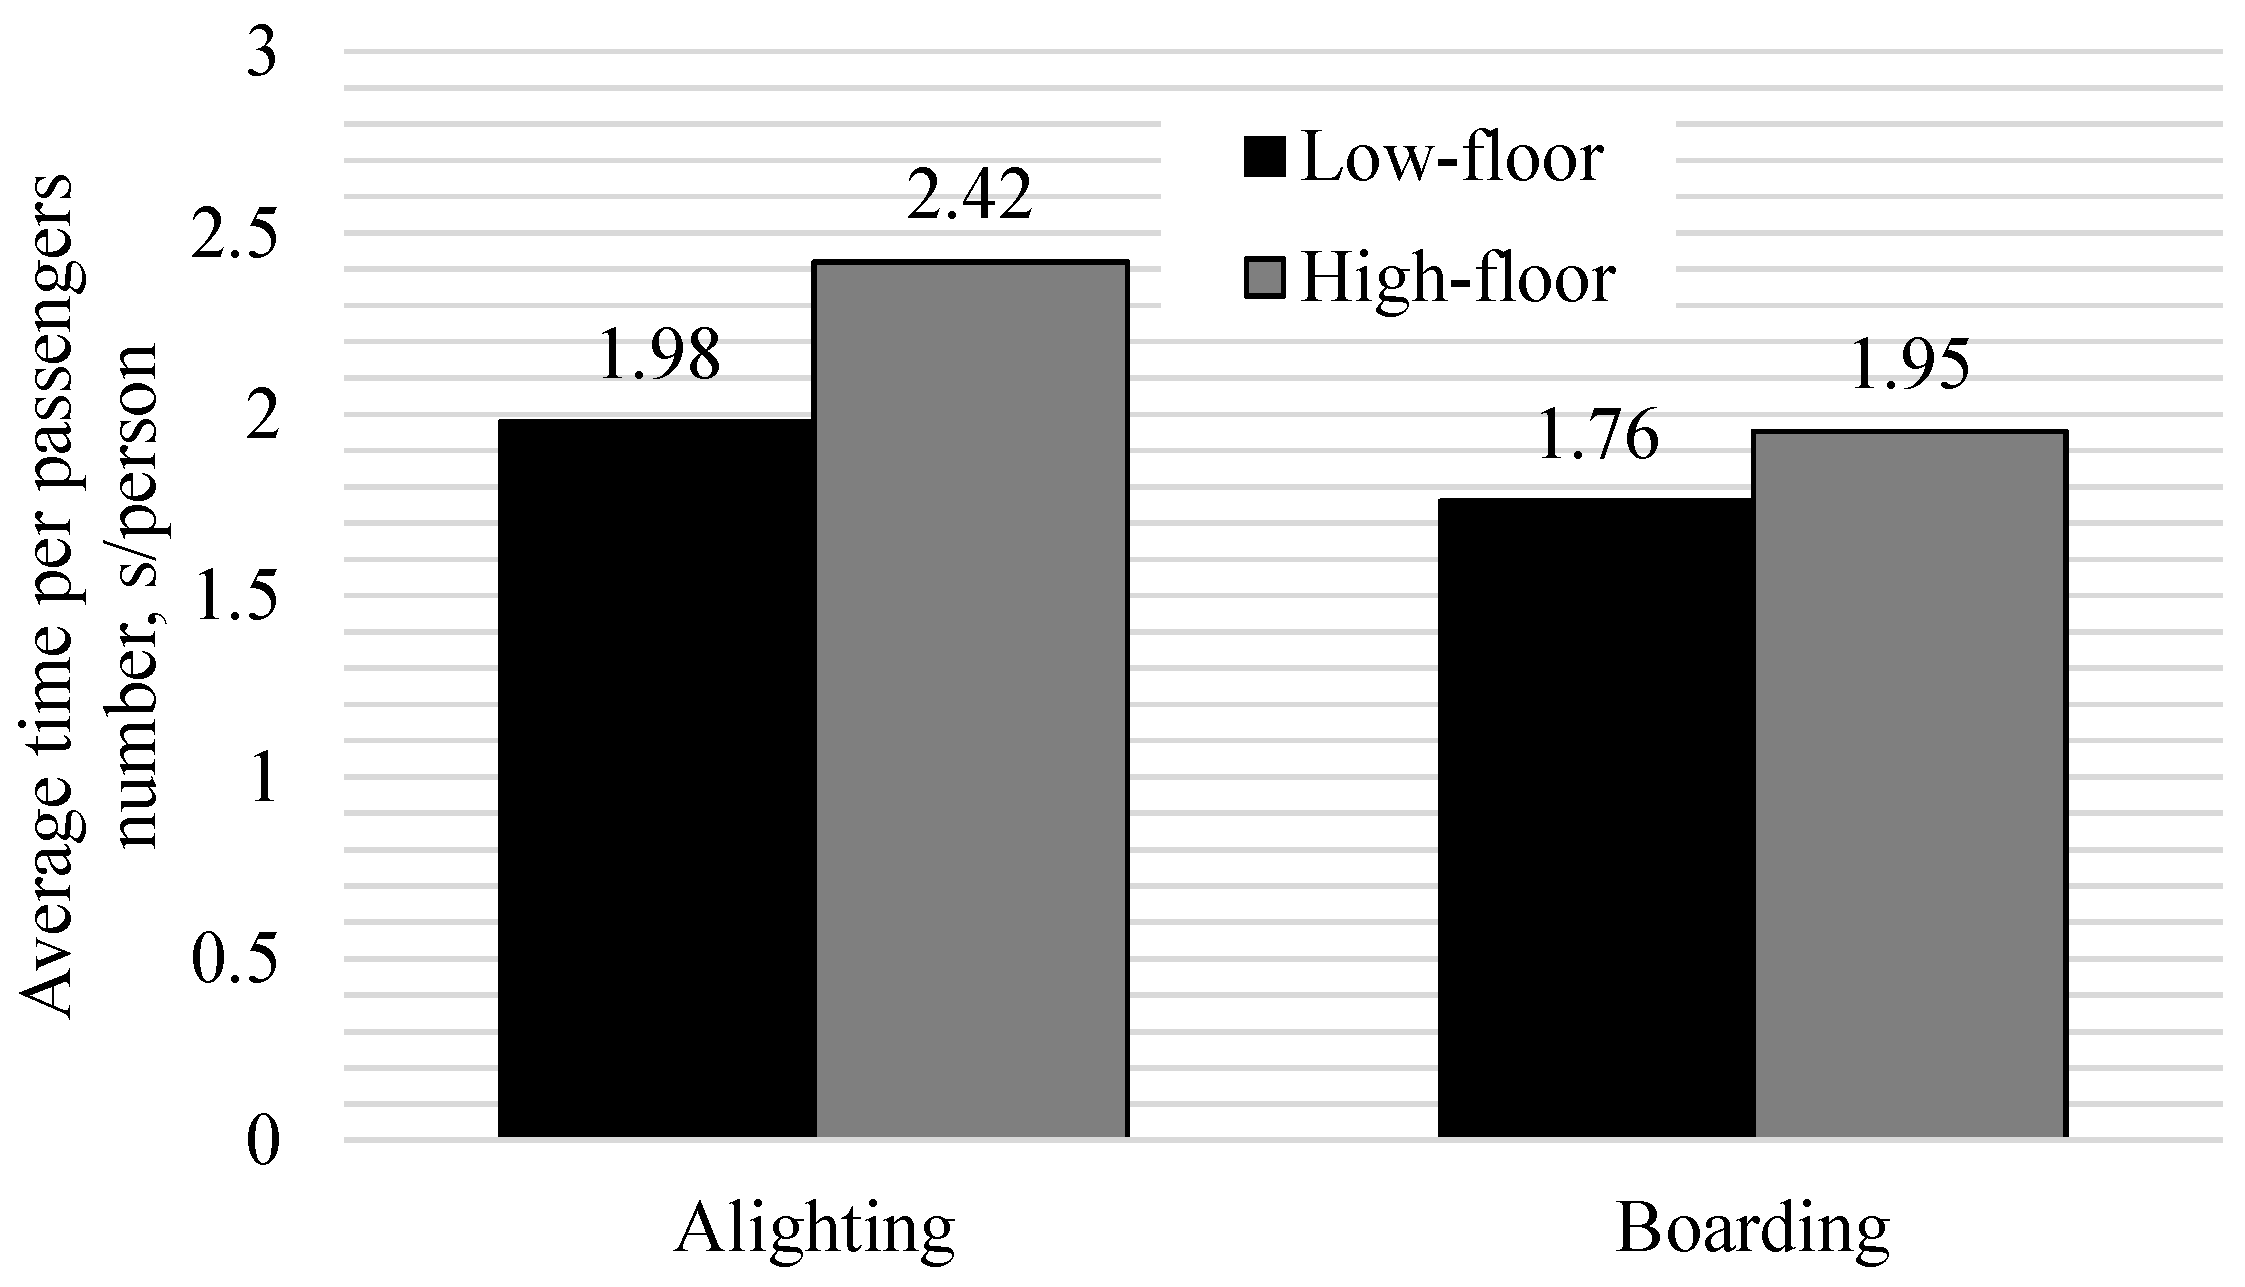
Figure 11 presents the alighting/boarding process time for low-floor and high-floor trams. Currently, high-floor trams are no longer produced, and there are fewer and fewer of them. However, the high-floor trams (Konstal 805Na and ENICA) were over 22% of all registered cases (Figure 1b). This is a significant share of the tram fleet. Konstal (805Na and Enika) was registered in two cities: Bydgoszcz and Elbląg. However, Konstal 805Na and other high-floor trams are operated in all Polish cities with trams except Olsztyn and Bydgoszcz (from summer 2025). According to the data presented in Figure 7, high-floor trams are characterized by longer boarding and alighting times by 11% and 22%, respectively. It should be noted that, apart from the time of the processes discussed, the issue of poor accessibility of these vehicles for people with disabilities or those using strollers is also important. Both of these aspects result in high-floor vehicles being withdrawn from operation and replaced by low-floor vehicles.
Figure 11.
The average process time for low–floor and high–floor trams.
3.2. Results Obtained with the Use of REWIZOR Software
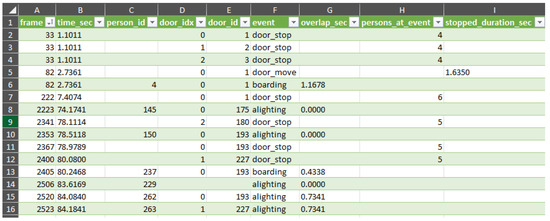
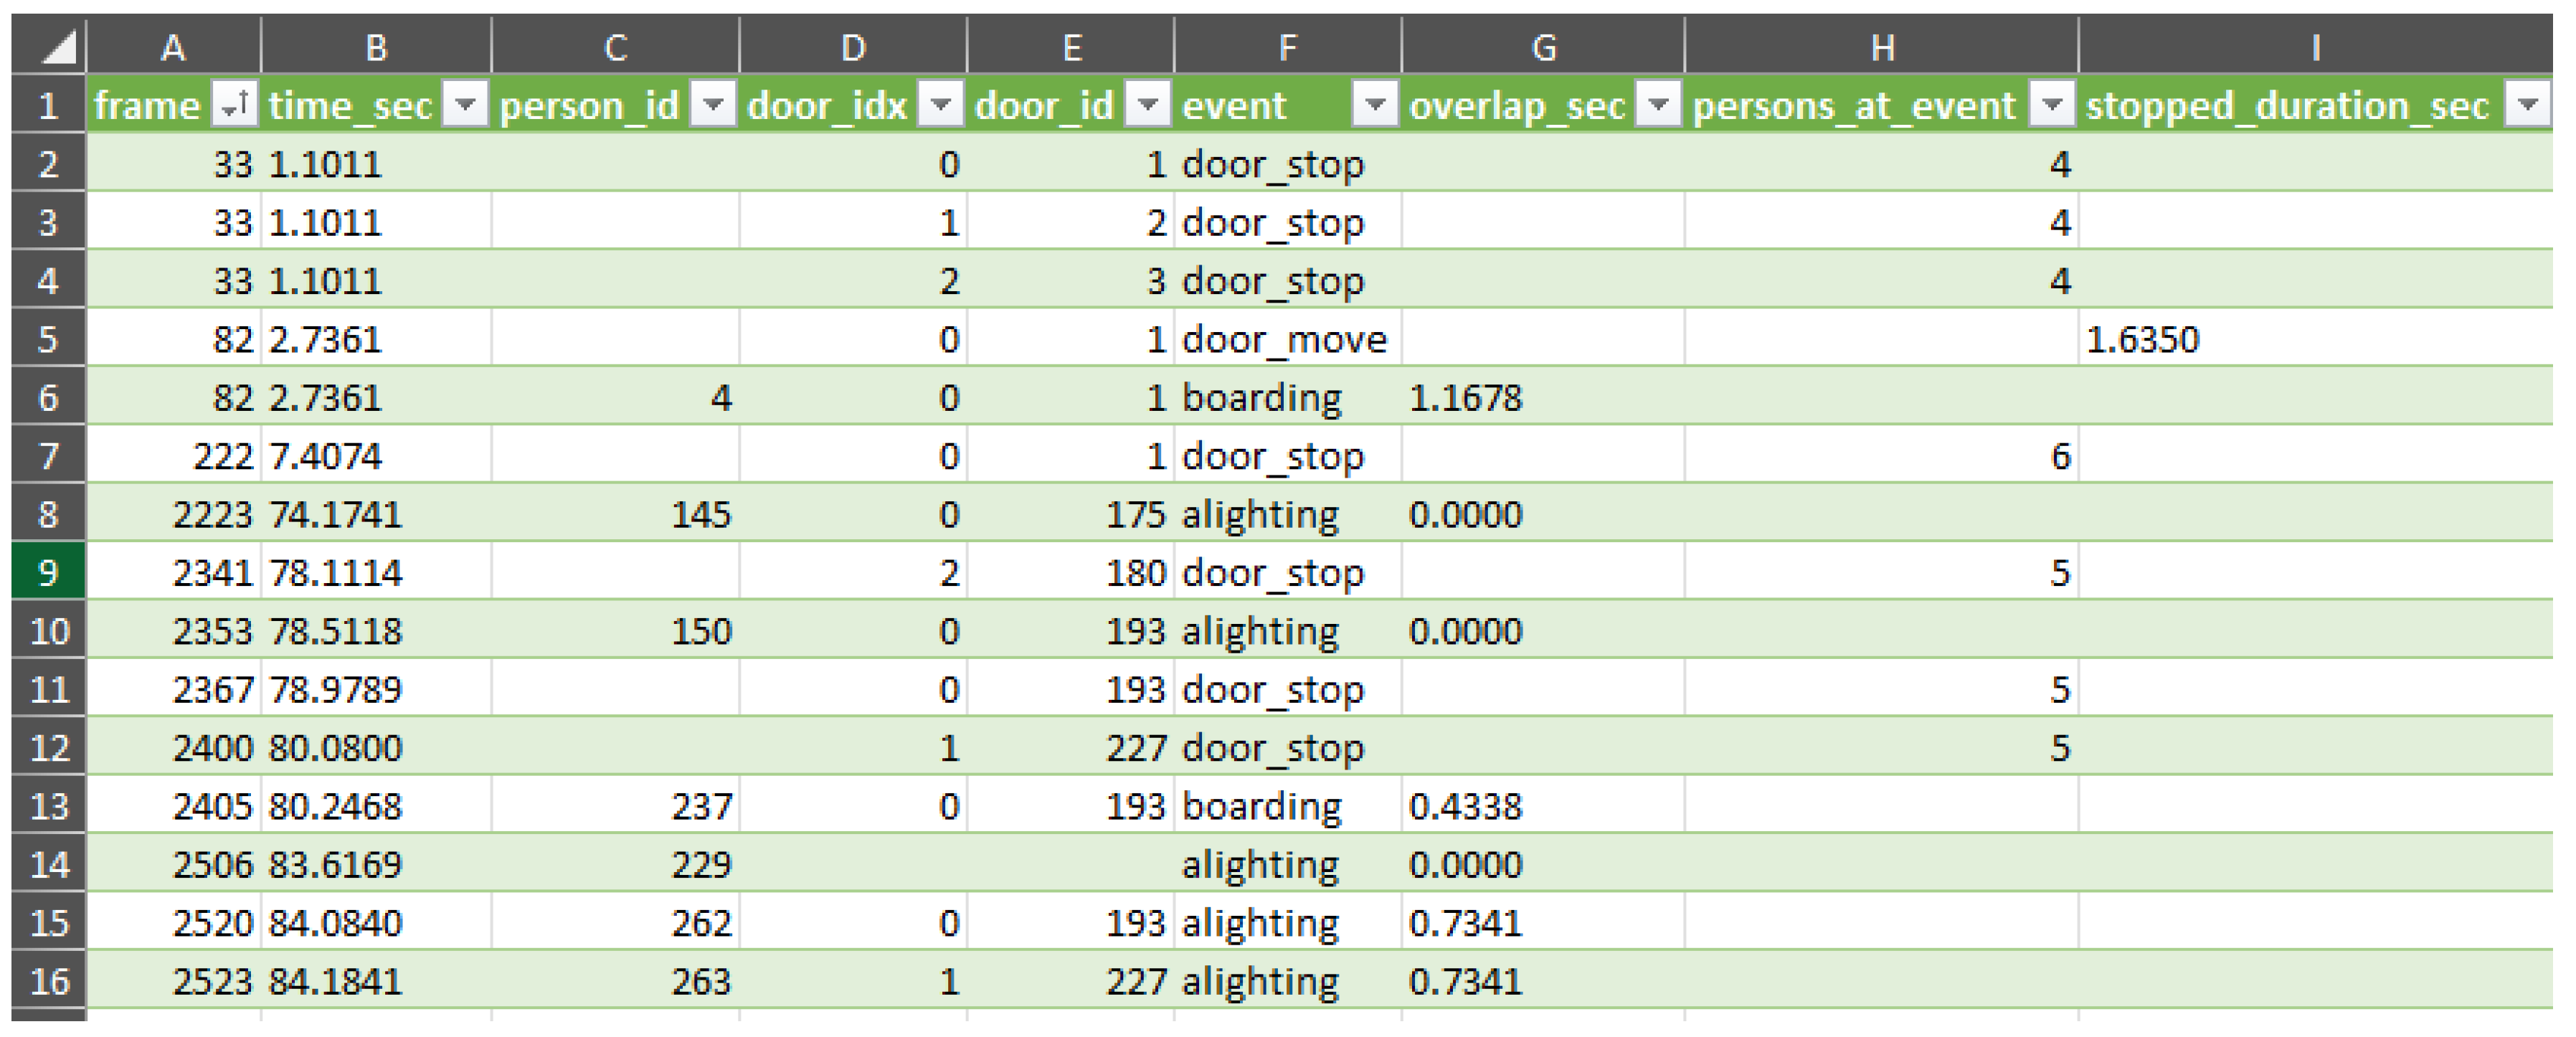
The data presented in Section 3.1 were analyzed with the REWIZOR software. The example results from the analyzed file were presented in Figure 12. The output file contains a significant amount of unnecessary information, such as the recording of a door stop, which can result from factors like tram braking and a short stop, vehicle movement during recording, or program inaccuracies. Analysis of the recordings also revealed that many high-angle drone recordings are unusable. The program fails to recognize doors or people from above. Consequently, such files are unreliable and must be rejected (see Figure 12, row 8, 10, 14). Based on the data qualified for analysis, a comparison was prepared of the number of boarding and alighting cases vs. the number of people carrying out the process (Figure 13).
Figure 12.
Example results file from the analyzed video from Bydgoszcz.
Figure 13.
The number of boarding and alighting cases calculated by REWIZOR in full scale of the Y-axis and for the number of incidents from 0 to 20.
As can be seen in Figure 13, the number of recorded cases differs significantly from the manually collected data (Figure 9a). In particular, the presence of registration of the boarding and disembarking process for passenger numbers above 16, which did not occur (as we know from manual calculations). Passenger multiplication occurred due to crowding and the cyclical disappearance and reappearance of people in the crowd that gathered at the doors. Therefore, these are cases of processes that should be rejected during analysis. The number of cases recorded for individual passengers is also much higher than the number of cases recorded manually. REWIZOR registered a significantly higher number of cases for one person. Despite the differences, the total number of people registered by REWIZOR was close to the actual number. It should be noted that REWIZOR recorded a total of 1213 and 1126 passengers for the disembarking and boarding processes, respectively. For manual calculations, these figures were 1134 and 1402, respectively. As mentioned, some data was rejected because the algorithm was unable to analyze the recordings from a high angle. It should therefore be noted that some of the counted individuals must have been false positives. The difference between the number of passengers registered in the records by REWIZOR and the manual count was therefore approximately 7% for alighting and 20% for boarding. This error size falls within the limits indicated for the algorithm in the methodological section (see Figure 4). Table 1 presents the number of recorded cases for passengers from 1 to 16, to better illustrate the differences between the manual counter and the counting performed by the REWIZOR program.
Table 1.
Comparison of the number of boarding and alighting processes for passengers from 1 to 16.
Although the number of registered passengers was close to the actual number, the measurement error was too large to consider the counted number of passengers passing through a specific door as reliable. The presented data showed that the program is not currently suitable for analyzing passengers passing through specific doors simultaneously. In our opinion, the margin of error in the number of passengers counted is too large to consider it reliable. However, it should be noted that the number of passengers counted is close to the actual number, and the margin of error of the algorithm is known. Additionally, we have information on the number of passengers registered at the stop when the doors closed. This enables us to evaluate the level of crowding at the stop.
Figure 14 presents the average process time per number of passengers participating in the exchange as a function of the number of people carrying out the process. Time data is counted with an accuracy of one film frame, which, at 30 frames per second, gives an accuracy of 0.033 s. The alighting time was similar for all passenger numbers, averaging 0.602 ± 0.118 s. The maximum time was obtained for 20 passengers, equaling 0.786 s, while the minimum time was obtained for one or two passengers, equaling 0.363 s. Boarding times were more uneven, averaging 1.498 ± 0.678 s, with minimal and maximal times of 2.807 and 0.545 s for 17 and 11 passengers, respectively. The standard deviation of alighting time was equal around 0.2–0.3 s for all cases except the incident involving 42 passengers. It should also be noted that the standard deviation was calculated for times for individual passengers, not for incidents, as in the case of manual measurement. for all cases except the incident involving 42 passengers. Therefore, it is calculated for a larger sample (). For boarding time, standard deviations were much larger, often even larger, than the mean values (note that time cannot be negative). The complete data, along with standard deviations and probability, are shown in Appendix B. Such a large discrepancy in times and standard deviations for individual processes indicates that the parameters of these processes should be defined in different ways in the REWIZOR program; for this analysis, the box coverage and the number of existence frames were the same.
Figure 14.
The average process time per number of passengers participating in the exchange vs. the number of people carrying out the process, based on REWIZOR.
The alighting time is significantly lower for the REWIZOR program than for manual calculations. This is due to differences in methodology and in how alighting time is defined. The investigated algorithm cannot estimate when the doors begin to open or when the last passenger reaches the platform. However, it does estimate the coverage of the door and passenger boxes. Furthermore, unlike the manual method, where the time was calculated as a whole and then divided by the number of passengers, the algorithm estimates the alighting time of individual passengers independently.
A similar problem occurred with the boarding time. This was caused by passengers waiting to board the tram standing at the doors, causing the boxes to overlap even though the process had not yet begun. However, these overlap values can be adjusted and the method can be calibrated depending on the angle at which the recording is made. This was not the purpose of this analysis, however, and further work on the algorithm is required.
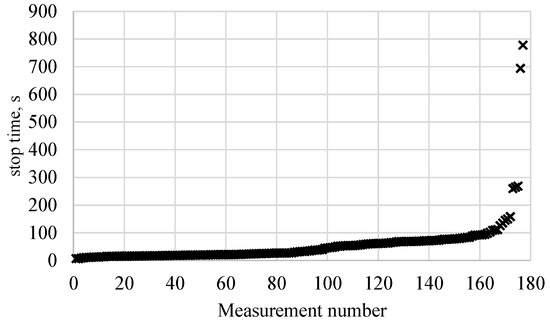
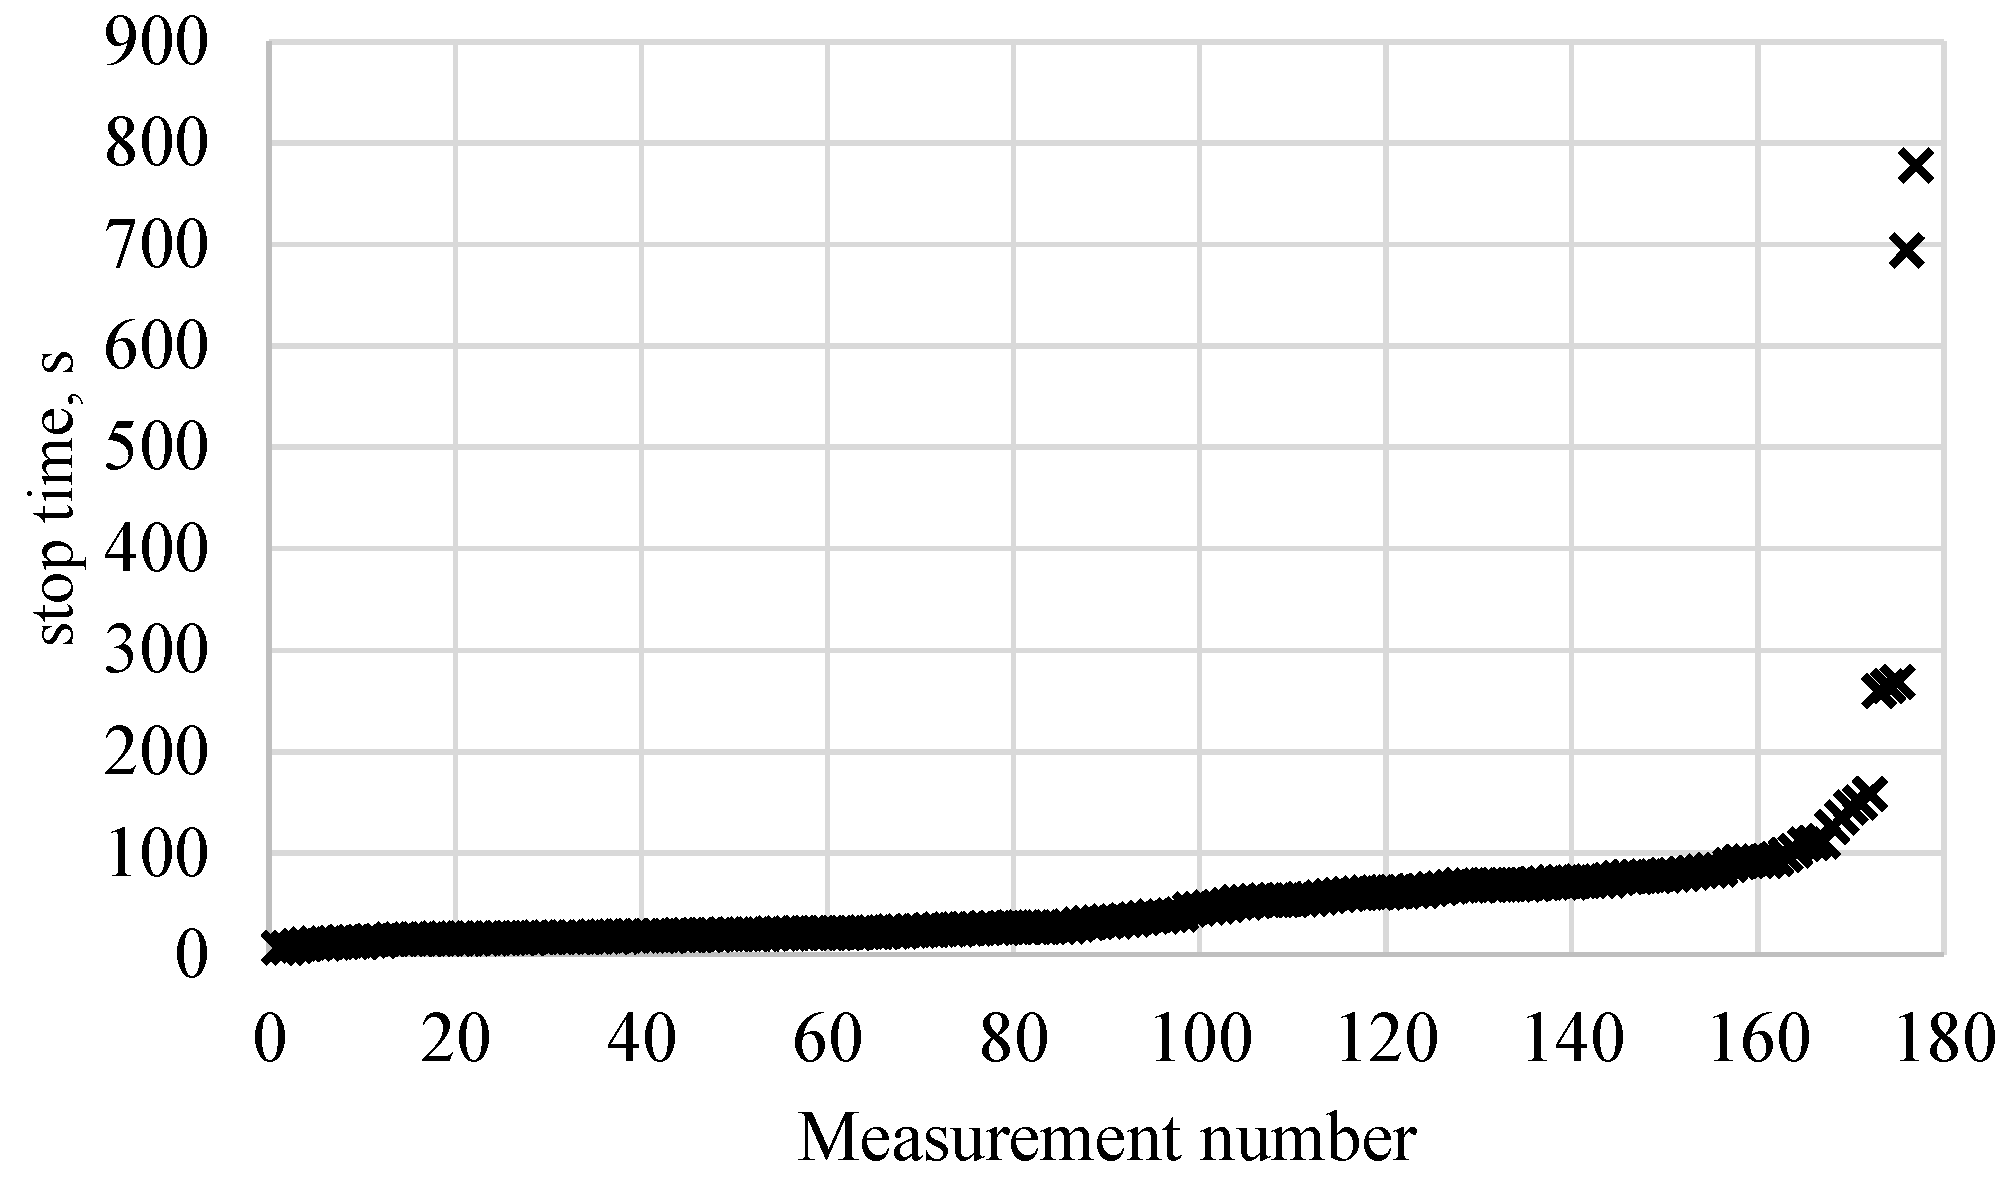
Figure 15 shows the calculated door stop time using REWIZOR software. The data has been sorted in order of increasing time. Stop times below 6 s have been excluded. These times are erroneous and the algorithm often returned stop times of less than one second. This occurred when the door was detected and then disappeared due to the angle of the door, or when the tram was stopped and travelling slowly. It is worth noting that there were several times above 200 s. These were cases where the algorithm detected false positive doors that were, for example, street lamps.
Figure 15.
The door stop time, based on REWIZOR.
REWIZOR recorded 177 different doors in 94 cases that were investigated. On average, at least three doors were visible in each recording. This suggests that many of the doors in the recordings were not detected at all. Furthermore, analysis of the recordings revealed that doors were detected in places where they were not present. This error is important when analyzing the time taken for the replacement process. Incorrectly detected doors provide incorrect data for a non-existent process, while undetected doors reduce the data count. Additionally, the recordings show instances where the tram started moving but stopped after travelling a few meters. Such situations also generate inaccurate data regarding the tram stop time.
The mean value of the manually calculated stop time was 22.40 s, with a standard deviation of ±12.57 s. The mean value of the REWIZOR stop time was 55.54 s, with a standard deviation of ±84.15 s. When times above 100 s were rejected, the stop time was found to be 39.40 ± 25.09 s. The REWIZOR mean value and standard deviation were higher than in the case of the manual investigation. It should be noted that these differences were expected. REWIZOR counts the time from when the door stops to when it moves, with a precision determined during measurements of 4 pixels. Therefore, the dwell time for a specific door is the time from when the door moves by less than four pixels in 12 consecutive frames, to when it moves by more than four pixels. Consequently, the dwell time measured from when the door begins to open until the last door closes should be added to the dwell time after stopping, but before the door opens and after it closes but before it moves. It is therefore important to note the methodological differences between manual measurement and the REWIZOR method.
3.3. Comment to the REWIZOR Method
As previously mentioned, the algorithm settings were chosen based on the authors’ experience. Analyzing the impact of these settings on quantitative data would be very time-consuming and is therefore not presented in this article. Based on our experience, REWIZOR settings should remain consistent for a given camera angle. This was difficult for the recordings we made. After the recordings were made, we gained experience of how the developed algorithm analyzed the recordings. Work on the algorithm and the recordings took place simultaneously, and many recorded processes were rejected as unsuitable for use—primarily due to the camera angle, which allowed for manual counting but was completely unreadable by the software. In other words, these settings have a particularly significant impact at crowded bus stops, where people move away from the doors much more slowly. The parameters should be consistent for the same camera angles.
It is also worth mentioning the differences resulting from different definitions of boarding and disembarking times. While it is possible to measure disembarking time from the moment the door opens, this would require a different type of image analysis. It is impossible to obtain the same definition of the end of disembarking time and the beginning of boarding time manually. Therefore, other definitions should be explored, such as those proposed in this article.
4. Conclusions
This article presents measurements of boarding and alighting times, as well as tram waiting times, based on video recordings taken in four Polish cities. The measurements were performed manually through human analysis of the recordings and using the Yolo10s algorithm. The resulting program was called REWIZOR. The aim of the article is to highlight the differences between the measurements and the methodological differences that exist between conventional measurements and those possible using artificial intelligence scripts. The REWIZOR program is attached to the article as an online resource in Appendix A (see Supplementary Materials).
In the case of manual measurement, the following were analyzed:
- tram types;
- stop time at tram stops;
- boarding and alighting time by type of exchange, number of passengers, and tram type.
In the case of the REWIZOR program, the data allowed for the analysis of:
- stop time at tram stops;
- boarding and alighting time by number of passengers.
The quantitative data regarding the number of registered doors and passengers coincide with each other–during the manual counting, trams were counted, not doors. However, the quantitative data are inconsistent. The differences stem from method errors (REWIZOR software errors are discussed in the methodology) and, above all, from different definitions of terms such as alighting and boarding times, and tram stop times. Differences between manual measurements and the results provided by the developed software were discussed, and their possible causes were presented. It should be noted that the software does not recognize tram type or passenger exchange type.
The REWIZOR software enables measurement parameters to be changed, and the obtained data clearly demonstrates the need to calibrate the measurements against the reference measurement. In the cases discussed, this was not possible due to differences between the individual recordings, for example, the angle of the camera relative to the tram. As it stands, the program can be used to calculate passenger flows, provided the comparison is made exclusively with measurement data obtained using the REWIZOR software. However, if comparisons with data obtained using other methods are necessary, the software should first be calibrated. In the next step, the impact of changing the parameters of individual measurements on the results should also be investigated. The authors plan to continue working on improving the software. According to the authors, one possible way to improve accuracy would be to simultaneously track people and heads, rather than just silhouettes. Additionally, the variety and scope of training data could be increased.
Supplementary Materials
The following supporting information can be downloaded at: https://www.mdpi.com/article/10.3390/smartcities9020025/s1.
Author Contributions
Conceptualization, investigation, E.S. and M.S.; methodology, M.S., E.S. and K.R.; software, K.R.; validation, J.D.; writing—review and editing J.D. and M.S.; formal analysis, resources, data curation, visualization, project administration, funding acquisition, M.S.; writing—original draft preparation, supervision, E.S. All authors have read and agreed to the published version of the manuscript.
Funding
This research was fully funded by the National Science Centre under project number 2023/49/N/ST8/03737.
Data Availability Statement
The data that support the findings of this study are available from the corresponding author upon reasonable request.
Acknowledgments
We would like to thank Michał Stopel for designing and creating Figure 2.
Conflicts of Interest
Author Krzysztof Radtke was employed by the company Intel Technology Poland. The remaining authors declare that the research was conducted in the absence of any commercial or financial relationships that could be construed as a potential conflict of interest.
Abbreviations
The following abbreviations are used in this manuscript:
| AI | Artificial Intelligence |
| ANN | Artificial Neural Network |
| COCO | Large-Scale Object Detection, Segmentation, and Captioning Dataset |
| DDITS | Data-driven Intelligent Transportation Systems |
| ITS | Intelligent Transport Systems |
| ML | Machine Learning |
| PDM | Person Detection Model |
| Re-ID | Re-Identification |
| SVM | Support Vector Machine |
| TDDM | Tram Door Detection Model |
| YOLO | You Only Look Once |
Appendix A
Project setup and run instructions:
- Install Miniconda (version 3.10 or newer):
- (1)
- Download and install Miniconda appropriate for your operating system from the official website;
- Launch the terminal:
- (1)
- Open Command Prompt or PowerShell;
- (2)
- Navigate to the project directory;
- (3)
- Use the cd command to move into your project folder:
- cd path\to\your\project
- Create and activate the Conda Environment:
- (1)
- Create the environment:
- conda create-n rewizor python = 3.10
- (2)
- Activate the environment:
- b.
- Conda activate rewizor
- Install dependencies
- (1)
- Ensure requirements.txt is located in the project directory, then run:
- pip install-r requirements.txt
- Run the application
- (1)
- python rewizor_gui.py
References
- Mamcarz, P.; Drozdziel, P.; Gzik, A.; Rybicka, I.; Drozdziel, P. Characteristics of Urban Transport Users and Their Level of Satisfaction with Transport Services. A Longitudinal Study of Passengers in Lublin City in 2018 and 2020. Transp. Res. Procedia 2023, 74, 371–378. [Google Scholar] [CrossRef] [Scilit]
- Kalašová, A.; Čulík, K. The Micromobility Tendencies of People and Their Transport Behavior. Appl. Sci. 2023, 13, 10559. [Google Scholar] [CrossRef] [Scilit]
- Domingo, T.; Mbatha, S.G.; Gumbo, T.; Mphambukeli, T.N. 4IR Technological Pathways to Shaping Smart and Sustainable Cities: Towards Intelligent Transport Systems in Johannesburg City; IGI Global: Hershey, PA, USA, 2024. [Google Scholar] [CrossRef] [Scilit]
- da Costa, A.R.; Kokkinogenis, Z.; Rossetti, R.J.F. An Ethical Perspective on Intelligent Transport Systems. In Progress in Artificial Intelligence; Moniz, N., Vale, Z., Cascalho, J., Silva, C., Sebastião, R., Eds.; Lecture Notes in Computer Science; Springer: Cham, Switzerland, 2023; Volume 14116, pp. 458–470. [Google Scholar] [CrossRef] [Scilit]
- Fatorachian, H.; Kazemi, H. Integrating Learning-Based Solutions in Intelligent Transportation Systems: A Conceptual Framework and Case Studies Validation. Cogent Eng. 2024, 11, 2427235. [Google Scholar] [CrossRef] [Scilit]
- Yuan, T.; Da Rocha Neto, W.; Esteve Rothenberg, C.; Obraczka, K.; Barakat, C.; Turletti, T. Machine Learning for Next-Generation Intelligent Transportation Systems: A Survey. Trans. Emerg. Telecommun. Technol. 2022, 33, e4427. [Google Scholar] [CrossRef] [Scilit]
- Khabiri, M.M.; Ghahfarokhi, F.M.; Sarfaraz, S.; Anaie, H.M. Application of Data Mining Algorithm to Investigate the Effect of Intelligent Transportation Systems on Road Accidents Reduction by Decision Tree. Commun. Sci. Lett. Univ. Žilina 2022, 24, 36–45. [Google Scholar] [CrossRef] [Scilit]
- Kabashkin, I.; Sansyzbayeva, Z. Intelligent Transport Systems for Green Transformation of Transport Corridor. Procedia Comput. Sci. 2024, 236, 493–501. [Google Scholar] [CrossRef] [Scilit]
- Garg, T.; Kaur, G. A Systematic Review on Intelligent Transport Systems. J. Comput. Cogn. Eng. 2023, 2, 175–188. [Google Scholar] [CrossRef]
- Pathak, N.; Biswal, G.; Goushal, M.; Mistry, V.; Shah, P.; Li, F.; Gao, J. Smart City Community Watch—Camera-Based Community Watch for Traffic and Illegal Dumping. Smart Cities 2024, 7, 2232–2257. [Google Scholar] [CrossRef] [Scilit]
- Kaur, G.; Kamboj, G. RFID Based Intelligent Transport System with RSU Communication for Emergency Vehicles in Urbanization. In 2022 4th International Conference on Inventive Research in Computing Applications (ICIRCA); IEEE: Piscataway, NJ, USA, 2022; pp. 333–338. [Google Scholar] [CrossRef] [Scilit]
- Liu, C.; Ke, L. Cloud Assisted Internet of Things Intelligent Transportation System and the Traffic Control System in the Smart City. J. Control Decis. 2023, 10, 174–187. [Google Scholar] [CrossRef] [Scilit]
- Lodhi, A.S.; Jaiswal, A.; Sharma, S.N. An Investigation into the Recent Developments in Intelligent Transport System. Proc. East. Asia Soc. Transp. Stud. 2023, 14. [Google Scholar] [CrossRef]
- Zhou, Z.; Li, Y.; Li, J.; Yu, K.; Kou, G.; Wang, M.; Gupta, B.B. GAN-Siamese Network for Cross-Domain Vehicle Re-Identification in Intelligent Transport Systems. IEEE Trans. Netw. Sci. Eng. 2023, 10, 2779–2790. [Google Scholar] [CrossRef] [Scilit]
- Akbarzadeh, O.; Khosravi, M.R.; Alex, L.T. Design and MATLAB Simulation of Persian License Plate Recognition Using Neural Network and Image Filtering for Intelligent Transportation Systems. ASP Trans. Pattern Recognit. Intell. Syst. 2022, 2, 1–14. [Google Scholar]
- Jha, A.V.; Appasani, B.; Khan, M.S.; Zeadally, S.; Katib, I. 6G for Intelligent Transportation Systems: Standards, Technologies, and Challenges. Telecommun. Syst. 2024, 86, 241–268. [Google Scholar] [CrossRef] [Scilit]
- Phillips, I.; Kenley, R. Verification of Intelligent Transportation Systems: Challenges and Possibilities. In 2022 17th Annual System of Systems Engineering Conference (SOSE), Rochester, NY, USA, 7–11 June 2022; IEEE: Piscataway, NJ, USA, 2022; pp. 127–131. [Google Scholar] [CrossRef] [Scilit]
- Njoku, J.N.; Nwakanma, C.I.; Amaizu, G.C.; Kim, D.S. Prospects and Challenges of Metaverse Application in Datan in Data and Challenges of Metaverse Application. Intell. Transp. Syst. 2023, 17, 1–21. [Google Scholar] [CrossRef] [Scilit]
- Alonso, F.; Faus, M.; Tormo, M.T.; Useche, S.A. Could Technology and Intelligent Transport Systems Help Improve Mobility in an Emerging Country? Appl. Sci. 2022, 12, 4759. [Google Scholar] [CrossRef] [Scilit]
- Papageorgiou, G.N.; Demetriou, D.; Tsappi, E.; Maimaris, A. Analyzing the Requirements for Smart Pedestrian Applications: Findings from Nicosia, Cyprus. Smart Cities 2024, 7, 1950–1970. [Google Scholar] [CrossRef] [Scilit]
- Iwanowicz, D. Traffic Control at Pedestrian Priority Crossings with Guaranteed Lane Throughput Capacity as Exemplified by the Legal Regulations Applicable in Poland. Sci. J. Silesian Univ. Technol. Ser. Transp. 2024, 122, 85–109. [Google Scholar] [CrossRef] [Scilit]
- Petrouš, M.; Suzdaleva, E.; Nagy, I. Modeling of Passenger Demand Using Mixture of Poisson Components. In Proceedings of the 16th International Conference on Informatics in Control, Automation and Robotics; SciTePress: Setúbal, Portugal, 2019; pp. 617–624. [Google Scholar] [CrossRef] [Scilit]
- Małek, A.; Caban, J.; Dudziak, A.; Marciniak, A.; Vrábel, J. The Concept of Determining Route Signatures in Urban and Extra-Urban Driving Conditions Using Artificial Intelligence Methods. Machines 2023, 11, 575. [Google Scholar] [CrossRef] [Scilit]
- Kodapanakkal, R.I.; Pouw, C.A.S.; Haans, A.; Ham, J.R.C.; Bombaerts, G.; Corbetta, A.; Dameski, A.; Spahn, A.; Toschi, F. The Influence of Macroscopic Pedestrian Structures on Train Boarding Efficiency. arXiv 2023, arXiv:2309.05476. [Google Scholar] [CrossRef] [Scilit]
- Ramirez, H.; Seriani, S.; Aprigliano, V.; Peña, A.; Arredondo, B.; Bastias, I.; Farias, G. Posture Detection of Passengers’ Movement When Boarding and Alighting an Urban Bus: A Pilot Study in Valparaíso, Chile. Appl. Sci. 2025, 15, 5367. [Google Scholar] [CrossRef] [Scilit]
- Patni, S.; Srinivasan, S. Modeling Boardings and Alightings by Route at Transit Stops. Public Transp. 2025, 17, 871–899. [Google Scholar] [CrossRef] [Scilit]
- Andrade, A.; Escudero, M.; Parker, J.; Bartolucci, C.; Seriani, S.; Aprigliano, V. Perceptions of People with Reduced Mobility Regarding Universal Accessibility at Bus Stops: A Pilot Study in Santiago, Chile. Case Stud. Transp. Policy 2024, 16, 101190. [Google Scholar] [CrossRef] [Scilit]
- Yendra, D.; Haworth, N.; Watson-Brown, N. A Comparison of Factors Influencing the Safety of Pedestrians Accessing Bus Stops in Countries of Differing Income Levels. Accid. Anal. Prev. 2024, 207, 107725. [Google Scholar] [CrossRef] [Scilit]
- Garcia, G.; Velastin, S.A.; Lastra, N.; Ramirez, H.; Seriani, S.; Farias, G. Train Station Pedestrian Monitoring Pilot Study Using an Artificial Intelligence Approach. Sensors 2024, 24, 3377. [Google Scholar] [CrossRef] [Scilit]
- Warchoł-Jakubowska, A.; Szwoch, I.; Szczeciński, P.; Krejtz, I.; Krejtz, K. Accessible Public Transport: A Case Study of Warsaw. In Transforming Media Accessibility in Europe; Springer: Cham, Switzerland, 2024; pp. 21–38. [Google Scholar] [CrossRef] [Scilit]
- Ultralytics Inc. YOLOv10: Real-Time End-to-End Object Detection. Available online: https://docs.ultralytics.com/models/yolov10/ (accessed on 29 August 2025).
- Pexels. Available online: https://www.pexels.com/search/tram/ (accessed on 1 February 2025).
- Pxhere. Available online: https://pxhere.com/en/photos?q=tram&search= (accessed on 1 February 2025).
- Libreshot. Available online: https://libreshot.com/?s=tram (accessed on 1 February 2025).
- Szyca, M.; Smyk, E.; Dižo, J. Analysis of the Boarding and Disembarking Process Time on the Example of the Pesa 122NaB Tram Operated in the City of Bydgoszcz. Pol. J. Tech. Issue 2025, 1, 4. [Google Scholar] [CrossRef] [Scilit]
- Podolski, J. Transport w Miastach (Ang. Transport in the Cities); Wydawnictwo Komunikacji i Łączności: Warsaw, Poland, 1985. [Google Scholar]

Disclaimer/Publisher’s Note: The statements, opinions and data contained in all publications are solely those of the individual author(s) and contributor(s) and not of MDPI and/or the editor(s). MDPI and/or the editor(s) disclaim responsibility for any injury to people or property resulting from any ideas, methods, instructions or products referred to in the content. |
© 2026 by the authors. Licensee MDPI, Basel, Switzerland. This article is an open access article distributed under the terms and conditions of the Creative Commons Attribution (CC BY) license.