


Highlights
What are the main findings?
- A citizen-centred sustainable and smart mobility evaluation model can serve as the design framework for an intelligent system: 12 of its indicators guided four IoT modules that retrofit existing seats, buses, bus-stops and pedestrian crossings, a LoRaWAN/LTE telematic system and the MueveT platform.
- In field tests with prototypes installed in a private vehicle, the LoRaWAN link of the mobile node recorded packet error rates of 38.7% (DR1) and 40.4% (DR2), the latter with half the time on air; the fixed bus-stop node showed no losses, and the LTE link reached a median latency of 272 ms to the platform, which obtained UEQ ratings between 4.25 and 5.00 out of 5.
What are the implications of the main findings?
- Technological retrofitting of existing infrastructure is a technically viable, low-recurring-cost pathway for intermediate cities of the Global South to move towards smart, sustainable and responsive city paradigms without replacing fleets or street furniture; for fixed nodes, LoRaWAN alone suffices, whereas mobile nodes require a hybrid strategy.
- Explicit indicator → data → function traceability turns transport operation into a source of evidence for the measurement perspective of the maturity model, although formal integration with the maturity scale remains a protocol to be validated.
Abstract
Intermediate cities of the Global South concentrate a growing share of the urban population but lack the financial and institutional capacity to renew their urban collective public transport (UCPT) systems according to smart-city references conceived in the Global North. This article presents the design, implementation and validation of an intelligent system for UCPT based on the technological retrofitting of existing elements (seats, buses, bus-stops and pedestrian crossings), developed within a research macro-project with a case study in Tunja, Colombia. The system derives its requirements from a citizen-centred multidimensional evaluation model of sustainable and smart mobility and is structured in the three layers of an IoT architecture: four low-cost perception modules (i-Seat, i-Bus, i-Bus-Stop and i-Crossing/Traffic-Light), a hybrid Edge–Cloud telematic system with LoRaWAN as the main technology and LTE/4G as backup, and the MueveT platform, which integrates telemetry, estimated time of arrival, detection of presumed infringements, device monitoring and service quality indicators. Validation was carried out with prototypes installed in a private vehicle that emulated UCPT journeys and with a usability evaluation completed by project researchers as a proof of concept. On a 3.72 km route, the mobile node recorded packet error rates of 38.7% with DR1 and 40.4% with DR2, the latter with half the time on air; on a 6.53 km route with four gateways, the fixed bus-stop node recorded no LoRaWAN losses, and the LTE link delivered the samples with a median latency of 272 ms to the platform. A digital twin fed with these records projected deliveries above 85% for 25 buses per gateway, and the platform achieved user experience ratings between 4.25 and 5.00. A comparative analysis with similar developments shows that the main contribution lies in the explicit traceability between the evaluation model, the captured data and the functions, providing a basis for daily operation and evidence for the maturity level of urban mobility.
1. Introduction
Twenty-first-century urbanization is not taking place mainly in megacities but in a system of intermediate cities that, according to UN-Habitat, absorbs most of the urban demographic growth in Africa, Asia and Latin America [1,2]. In these cities, urban collective public transport (UCPT) is the main instrument of access to opportunities for most of the population, yet it operates under traditional schemes: ageing fleets managed by private companies under affiliation contracts, fixed routes with scarce monitoring, bus-stops without user information and limited institutional capacity to plan with data [3,4,5]. Smart-city and sustainable mobility agendas, however, have been formulated from contexts with consolidated data infrastructure, and their evaluation frameworks presuppose inputs that rarely exist in resource-constrained environments [6,7].
In Colombia, the national System of Cities recognizes intermediate cities (100,000 to 1,000,000 inhabitants) as strategic nodes of territorial development [8], but their UCPT faces structural problems of fleet obsolescence, data fragmentation and absence of real-time information platforms [9]. Completely renewing vehicles, street furniture, roads, signage and pedestrian crossings exceeds the fiscal capacity of these municipalities; the relevant question is therefore not how to replicate the integrated systems of large capitals but how to technologically retrofit what already exists so that the system produces data, responds to its users and can be evaluated continuously.
The literature on IoT solutions for public transport in resource-constrained contexts has advanced in vehicle tracking with low-power wide-area networks [10,11,12,13], in low-cost alternatives to GPS [14], in instrumented bus-stops [15,16] and in the generation of open data for semi-formal routes [17]. Nevertheless, five limitations remain unresolved. First, intervention concentrates almost exclusively on the vehicle, leaving out seats, waiting furniture and traffic control infrastructure, which are the elements that determine user experience and road safety. Second, solutions are designed and validated without a link to a mobility evaluation framework, so the data they generate are not translated into comparable indicators or planning inputs. Third, field evidence on LoRaWAN with mobile nodes in irregular urban topography is scarce and rarely includes the original records that would allow results to be reproduced [18,19]. Fourth, no data-based distinction is made between elements that can operate only with a low-recurring-cost network and those that require cellular backup, which is decisive for economic viability. Fifth, the scalability of deployment beyond the available prototypes is assumed or omitted rather than projected from measurements. This article addresses these five limitations.
The work integrates, as a single whole, three investigations developed within the macro-project “Adaptation of the traditional urban collective public transport system of intermediate cities to the paradigm of smart, sustainable and responsive cities” (Minciencias, call 890 of 2020; UPTC SGI registration 3219), executed by the GIDPOT and TelemaTICs research groups of the Universidad Pedagógica y Tecnológica de Colombia in alliance with the Universidad Nacional Abierta y a Distancia and the Instituto Universitario de la Paz. The conceptual starting point is the citizen-centred multidimensional evaluation model of sustainable and smart mobility, developed in a doctoral thesis by a group member and validated in Tunja and Ibagué [6]. On that structure, a concrete solution was built covering the three layers of the IoT architecture: (i) a set of low-cost smart modules that retrofit seats, buses, bus-stops and pedestrian crossings (perception layer) [20]; (ii) a hybrid Edge–Cloud telematic system based on LoRaWAN with LTE/4G backup (network layer) [21]; and (iii) the MueveT information system, which processes telemetry, estimates arrival times, detects presumed infringements, monitors device health and calculates service quality indicators (application layer) [22].
The contribution of the article is fourfold. First, it formulates technological retrofitting as a design strategy for intermediate cities of the Global South and operationalizes it through an explicit traceability chain between the dimensions and indicators of the evaluation model, the data captured by the devices and the functions of the platform, declaring the implementation status of each indicator. Second, it reports field experimental evidence, with published original records [23], on the performance of the LoRaWAN link for mobile and fixed nodes in an Andean city with irregular topography and on the latency of the LTE link to the platform. Third, it projects the scalability of the LoRaWAN cell through a communication digital twin fed with those records. Fourth, it positions the development against similar systems and tools to identify which specific mobility shortcomings of the Global South it addresses and which remain open. The remainder of the article is organized as follows: Section 2 presents the concepts and the application context; Section 3 describes materials and methods; Section 4 defines the system architecture; Section 5 reports the field, digital twin and platform results; Section 6 compares the development with similar work; Section 7 discusses the findings, cost trade-offs and limitations; and Section 8 presents conclusions and considerations for future research.
2. Conceptual Framework and Application Context
2.1. Smart, Sustainable and Responsive Cities
The smart-city concept has evolved from a vision centred on information technology infrastructure to one that integrates human capital, governance and sustainability [24,25]. Bibri and Krogstie [26] summarize the convergence between smartness and sustainability as a city’s capacity to use data and technologies to improve quality of life without compromising environmental balance, while Kitchin [27] warns of the risks of real-time governed urbanism without citizen mediation. The notion of the responsive city adds a third dimension: the institutional capacity to listen and respond to citizens based on evidence [28]. In the field of mobility, Lyons [29] argues that the smart and sustainable paradigms must be aligned so that technology becomes an instrument of accessibility, equity and impact reduction rather than an end in itself. The macro-project framing this research explicitly adopts that triad—smart, sustainable and responsive—as the horizon for adapting traditional UCPT [30].
2.2. Intermediate Cities of the Global South and Traditional UCPT
The literature on sustainable transport in developing countries has been dominated by megacities, although most of the urban population of the Global South lives in smaller cities with qualitatively different problems: lower institutional density, reduced budgets, semi-formal services and limited data availability [3,4]. In sub-Saharan Africa, governance failures rather than technical constraints are usually the main barrier to sustainable mobility [31]; in Latin America, transport planning has reproduced access inequalities between centres and peripheries [5,32]. Diderot et al. [33] identify financial, infrastructure, connectivity and human capital barriers for intelligent transportation systems (ITSs) in developing countries, and Ramírez-Guerrero et al. [9] show, from interviews with officials of eight intermediate Colombian cities, that these cities prioritize open-standard technologies to inform users and require solutions adjusted to their economic and cultural contexts rather than the replication of standardized systems.
Tunja, capital of the department of Boyacá, with a projected population of 185,469 inhabitants in 2023 [34] and a delimited urban area of approximately 18.8 km2, is representative of this type of city. Its UCPT is operated by private companies on fixed routes with medium-capacity buses (13 to 30 seats); the fleet comprises 530 vehicles (buses, midibuses and minibuses) with an effective operation of 396 active units on average [35], without an operations support system, without arrival information at bus-stops and without technological integration between vehicles, street furniture and the mobility authority [20,36]. An evaluation with the reference model placed the city at a medium-low maturity level (2.8 by citizen perception), with the smart-mobility subdimension among the worst rated (2.4 out of 5) and explicit gaps in real-time measurement, fleet age, road safety and universal accessibility [6].
2.3. Technological Retrofitting Versus Replacement
We define technological retrofitting of UCPT as the incorporation of sensing, communication, processing and information capabilities into the existing physical and organizational elements of the system—vehicles, seats, bus-stops, signage and crossings—without replacing them so that the system acquires properties of observability, responsiveness and continuous evaluability. This definition contrasts with the replacement model, which conditions the intelligence of the system on fleet renewal, construction of dedicated infrastructure or adoption of comprehensive commercial platforms. In UCPT, retrofitting relies on three technological trends: the availability of low-cost microcontrollers and single-board computers, low-power wide-area networks (LPWANs) that reduce the recurring cost of connectivity [37,38,39], and edge-computing paradigms that allow local processing and transmission of only what is necessary [40]. Intelligent transportation systems for public transport have incorporated automatic vehicle location, real-time passenger information, IoT-based fleet management and incident detection as core capabilities [41,42,43]; the available evidence indicates that real-time arrival information improves perceived reliability and reduces waiting uncertainty [44,45,46,47] and that on-board sensors allow frequencies to be adjusted according to occupancy and mechanical failures to be anticipated [48,49]. Experiences such as LoRa-based tracking systems in Popayán [10,12] or the use of Bluetooth beacons instead of GPS in Malaysia [14] show that retrofitting lowers entry barriers, although—as discussed in Section 6—it is rarely linked to a mobility evaluation framework or quantified in terms of its cost trade-offs (Section 7.2).
2.4. The Evaluation Model as a Design Framework
The citizen-centred evaluation model of sustainable and smart mobility [6] comprises four dimensions (social, governance, environmental and economic), eight subdimensions and 36 indicators, weighted through the Analytic Hierarchy Process (AHP) with 18 experts (consistency < 10%). The social dimension obtained the highest weight (34.1%), followed by governance (23.9%), environmental (23.6%) and economic (18.5%). The model is evaluated from two perspectives—citizen perception and measurement by the authority—through the Responsive Mobility portal [50] and produces a maturity level from 1 to 5, adapted from the Colombian maturity model for smart cities and territories [51]. Two findings of the model are decisive for the design of the system: the smart-mobility subdimension (advanced planning based on updated data, real-time measurement and open data, available technology applications) concentrates 24.5% of the governance weight, and the discrepancies between official measurement and citizen perception reveal implementation gaps that can only be closed if the system generates verifiable data on its operation.
In the reference framework, mobility maturity is assessed through a hierarchy of indicators, subdimensions and four dimensions using expert-derived AHP weights; each indicator is rated on a 1–5 scale according to defined reference criteria, with separate evaluations based on city measurements and citizen perceptions, and the maturity descriptions address planning, management, participation and mobility outcomes. Accordingly, the framework provides the assessment context for the present technological development, but its maturity score cannot be reproduced by simply rescaling an operational Service Quality Index. As a multidimensional model, the IoT implementation presented here gives partial coverage of the model’s intentions: MueveT is conceived as a contributor of data to selected assessment needs within that broader framework, and incremental treatment through new sub-projects may lead, with diverse efforts, to the full constitution of the framework model.
3. Materials and Methods
3.1. General Research Design
The research was structured as a technological development macro-project with three sub-projects articulated by IoT architecture layers (Figure 1) and a prior conceptual investigation that abstracted the UCPT of an intermediate city through general systems theory into seven subsystems: regulations, vehicle, infrastructure, management entity, control entity, fare collection system and operational logic [36]. The perception and network sub-projects adopted a methodological composition between the Documentary Research Model (DRM), for technological grounding and selection, and the Agile Unified Process (AUP), for iterative design, construction and validation of prototypes [20,21]. The application sub-project followed a mixed, non-experimental, descriptive approach, with a systematic literature review guided by PRISMA 2020 [52] and the SALSA framework [53], requirements specification according to IEEE 830 [54], design with the C4 model [55] and development management with Scrum in nine monthly sprints [22,56].
Figure 1.
Layered architecture of the intelligent UCPT system: perception modules retrofitting existing elements, hybrid Edge–Cloud telematic system and MueveT platform. Own elaboration based on [20,21,22].
The systematic review of the application sub-project was organized into four search clusters with a 2018–2026 window: (1) UCPT in intermediate cities (469 initial records, 10 included); (2) technological solutions for UCPT management with emphasis on IoT and Global South cities (172 records, 12 included); (3) algorithmic solutions for estimated time of arrival (321 records, 6 included); and (4) service quality evaluation models (1158 records, 20 included) [22]. In addition, passenger-oriented information systems (Transit, TransmiApp, Moovit, QroBus, Q’ruta, Tunja en Ruta) and operator-oriented systems (CyberBus, Cittati, Nimbus/Wialon, MET Group ITS) were analysed comparatively to identify recurring functional patterns and limitations in intermediate cities.
3.2. Derivation of Requirements from the Evaluation Model
The central methodological link was the selection of model indicators amenable to technological treatment. From the complete battery of UCPT indicators defined by the macro-project co-researchers, those whose variables can be obtained through sensing, geolocation or time records in the elements of the system were filtered; twelve indicators were selected (Table 1), associated with the subdimensions of smart mobility, operational performance, safety, liveability and environmental quality [20]. The selection criterion was the feasibility of technological intervention, not the relative relevance of the indicators: the remaining 24 indicators—including affordability, universal accessibility, care mobility and citizen participation, which concentrate the greatest weight in the social dimension of the model—continue to be evaluated through the channels the model defines (citizen perception surveys, administrative information and mobility plans), and the system neither replaces them nor re-weights the model. To prevent ease of measurement from displacing social outcomes, for each selected indicator, Table 1 lists the available data, the additional data required and the implementation status achieved, distinguishing between implemented calculation, factor-based estimate, partial support and outcome not assessed. Each indicator was translated into (i) a cross-cutting technological requirement—interoperability, scalability, useful and secure transmission with low energy demand, real-time event logging—(ii) a physical intervention scenario (bus, seat, bus-stop, crossing/traffic light) and (iii) a set of data to be transmitted to the application layer. These data defined the functional requirements of MueveT, organized into six modules: IoT device management, operational infrastructure and transport network, operating calendars, real-time operational information, fleet monitoring and service quality indicators [22].
Table 1.
Indicators of the mobility evaluation model selected for technological treatment, required data and implementation status in the present study [20,22].
3.3. Validation Strategy
Validation was carried out at three levels and distinguished between software functionality, preliminary performance of the arrival time estimator and perceived usability. In the network layer, four test phases of increasing complexity were executed, each with its own objective: (1) validation of the node–gateway link on a university campus and estimation of radial coverage with and without line of sight; (2) validation with moving nodes in a simple urban environment, on four routes (A–D) and with the adaptive data rate (ADR) protocol active; (3) functional validation through the emulation of a 3.72 km UCPT route in Tunja, with two gateways in elevated positions and three fixed data rate configurations (DR1, DR2 and DR4); and (4) an integrated test on an extended 6.53 km route with four gateways, the i-Bus transmitting simultaneously over LoRaWAN and LTE, a fixed i-Bus-Stop and the MueveT platform in operation. In all phases, the metadata of each frame were recorded on The Things Stack Cloud network server (RSSI, SNR, spreading factor, bandwidth, time on air and frame counter), from which the packet error rate (PER) was calculated; in the fourth phase, the messages received over MQTT in MueveT were also recorded, with the device timestamp. Measured coverage was contrasted with RadioMobile propagation simulations, and network behaviour with an increasing number of nodes was projected with a digital twin fed with the fourth-phase records (Section 5.3). Table 2 delimits the data acquired in each phase; the original records are published in an open repository [23].
Table 2.
Data acquired in each test phase of the network layer [23].
In the perception layer, collision-free transmission of several i-Seat nodes to the i-Bus, the reading of the i-Bus-Stop environmental sensors and pedestrian detection by the i-Crossing were verified [20]. In the application layer, unit tests on the calculation modules, device–broker–persistence integration tests, a system test with a real journey on a configured route during the fourth phase, a preliminary comparison between estimated and observed travel times on four route segments, and acceptance tests with a questionnaire adapted from the User Experience Questionnaire (UEQ) [57] answered by 25 co-researchers and associated researchers of the macro-project were executed [22]. These evaluations provide evidence of prototype functionality and internal perceptions; they do not establish operational performance across a public transport fleet.
Since it was not feasible to intervene with a commercial fleet bus during the prototyping phase, field validation was carried out through the emulation of UCPT journeys: the i-Bus and i-Seat prototypes, designed to be portable, were installed in a private vehicle that drove typical service routes. In the third phase, a segment of Tunja’s Route 8 was emulated at a target speed of 30 km/h, usual for this service, with two scheduled stops of approximately 20 s to simulate passenger boarding and alighting; traffic lights and urban traffic introduced additional variations in effective speed. An evaluation of the interaction experience with MueveT was performed by the macro-project co-researchers as a proof of concept, without passenger participation. These conditions delimit the scope of the results, as discussed in Section 7.3.
4. Architectural Definition of the Intelligent UCPT System
4.1. Layered Overview
The system adopts the three-layer IoT architecture—perception, network and application—widely used in urban solutions [39], with a hybrid Edge–Cloud computing distribution [40]: field nodes perform sensing, light processing and packaging; the network layer transports compact frames over LoRaWAN, with LTE/4G as a contingency link; and the application layer in the cloud centralizes ingestion, analytics and interaction with the actors (Figure 1). The distinctive property of the design is that each perception element retrofits an already existing component of traditional UCPT identified in the conceptual model: the vehicle (i-Bus), its seats (i-Seat), the waiting furniture (i-Bus-Stop) and the traffic control and road infrastructure (i-Crossing/Traffic-Light) [20,36].
4.2. Perception Layer: Smart Retrofitting Modules
The four modules were built with general-purpose, low-cost components, favouring open hardware and software (Table 3). The i-Seat module detects the occupancy of each seat by combining a limit switch (pressure) and a ZX Gesture proximity sensor, monitors its battery with an INA219 and transmits a JSON message to the i-Bus through a LoRa RYLR998 transceiver in a star topology; to avoid collisions between multiple seats and a single receiver, a staggered time distribution (0, 3, 6 and 9 s additional per node) configured with AT commands was implemented, and the node enters deep sleep after reception confirmation [20,21]. The prototype evolved from a fixed version with WiFi communication (version 1) to a portable version (version 3) installable in any vehicle, a decision that made validation feasible without intervening with the commercial fleet.
Table 3.
Smart modules of the perception layer: retrofitted element, components, communication and data provided [20,21].
The i-Bus module, governed by a Raspberry Pi 4, receives the seat states over LoRa, reads a GY-NEO 6M GPS (position, speed, altitude, time), estimates occupancy with dual PIR sensors placed at the doors using in/out flow determination logic, measures electrical consumption with an INA219 and presents the information on a 7-inch touchscreen; it consolidates a compact binary frame (15 bytes in the first version evaluated in the field and 38 bytes in the final version, Appendix A) that a Lilygo LoRa32 module transmits to the LoRaWAN network, and it has an A7670SA LTE/4G modem as a communication backup in areas without LoRaWAN coverage. The i-Bus-Stop module develops its technological enrichment as an environmental station (DHT11 sensors for temperature and humidity, MQ135 for gases, PMS7003 for particulate matter, GY-ML8511 for UV radiation and LM6490 for noise) with a user display, which also acts as a fixed reference node to correlate journeys; the assembly of the bus-stop structure provides for the conditioning of the electronic instrumentation and photovoltaic power supply. Finally, the i-Crossing/Traffic-Light module uses a Raspicam camera and OpenCV on a Raspberry Pi 4 to detect pedestrians or volumetric elements on the pedestrian crossing during unauthorized traffic-light phases, activate audible and visual alerts, log incidents locally in MongoDB and report them to the cloud for interpretation at low, medium and high levels [20]. Table 3 summarizes the components and data provided by each module.
4.3. Network Layer: Hybrid Edge–Cloud Telematic System
The technological selection of the network layer was based on a comparison of alternatives for the Edge and Cloud environments (WiFi, Bluetooth, LoRa, Sigfox, 4G LTE and NB-IoT) and on an energy consumption test of the available boards transmitting payloads of a few bytes (Table 4). WiFi, the technology of the initial version of the modules, was discarded for its high transmission consumption (350 mA with NodeMCU V3) and for offering far more bandwidth than required; Bluetooth was discarded for its topological limitations; Sigfox and NB-IoT were discarded for depending on licences or contracted services; and LTE/4G (500–540 mA in transmission) was reserved as backup for its urban coverage [21]. LoRa/LoRaWAN was adopted as the main technology for its low consumption (120–135 mA in transmission; 10–20 µA at rest with the RYLR998), its range and its compatibility with distributed architectures [37], operating in the 902–928 MHz band with the LoRaWAN US915 regional plan [58]; in Colombia, spectrum allocation is governed by the National Frequency Band Allocation Table (ANE Resolution 105 of 2020) [59] and the licence-free use of the 915–928 MHz segment by low-power devices by Resolution 711 of 2016 [60].
Table 4.
Communication technologies evaluated for the telematic system and measured consumption of the test boards (payload ≤ 5 bytes) [21].
The resulting topology combines a local star between the i-Seats and the i-Bus (point-to-point LoRa with RYLR998) with a LoRaWAN star between the Lilygo LoRa32 nodes of each scenario and outdoor-grade Dragino DLOS8 gateways, which forward the messages over IP to The Things Industries’ The Things Stack Cloud network server, used on the free plan in the first three test phases and on a paid plan in the integrated test. Devices are activated through OTAA to guarantee unique session keys and protection against replay attacks. The server publishes the decoded messages to an MQTT broker, to which the application layer subscribes with an API key; the integration is bidirectional, enabling downlink messages to the i-Bus and i-Bus-Stop [20,21]. For backup, the i-Bus LTE modem establishes an IP link and publishes to an MQTT broker to which MueveT also subscribes. In the field tests, both links transmitted simultaneously for diagnostic purposes (Section 5.2); the proposed operational strategy keeps the modem in deep sleep and activates it when loss of the LoRaWAN link is detected or anticipated at the blind spots on the route.
Transmission dimensioning was governed by the fair-use policy of The Things Network public network, applicable to the free plan used in the first phases (a maximum of 30 s of uplink time on air per device per day and 10 downlink messages) [61], and by regulatory time-on-air limits. For SF7 and BW 125 kHz (DR3) with a 9-byte payload, the symbol time is 1.024 ms and the number of payload symbols is 43, whence:
which allows up to 680 daily uplink packets per node and, for a 10 h operating day, a transmission interval of approximately 53 s. Table 5 presents the estimated time on air and regulatory compliance for the DR0–DR4 data rate range [21].
Table 5.
Estimated time on air per data rate (US915 plan, reference payload) and compliance with the public network fair-use policy [21,61].
4.4. Application Layer: The MueveT Platform
MueveT evolved from iBUS, a monolithic web system (Laravel/Livewire) registered by the group in 2024 that managed users, roles, operating companies, vehicles, drivers, owners and routes [62], to a distributed, service- and event-oriented architecture (Figure 2). Its containers are: a React web application organized by features (feature-based architecture) with pages/components/hooks/services/api layers; a REST API in Laravel 11 with thin controllers, application services, repositories, DTOs, mappers and a Calculator pattern for indicators; an MQTT consumer service that validates frame structure, identifies the emitting device and persists the records; a WebSocket server (Laravel Reverb) that broadcasts position changes, events and alerts to the interface without polling; the OSRM routing engine on OpenStreetMap data [63] to generate geometries fitted to the road network; and hybrid persistence with MySQL for operational entities and MongoDB for high-frequency telemetry (vehicle_device_logs, bus_stop_device_logs and bus_stop_eta_prediction collections) [22]. Each telemetry record preserves the normalized payload, the original message received, the radio metrics reported by the network server and a latency calculated between the device timestamp and the persistence of the record. The platform is multi-tenant, ensuring that each operator accesses only its own data. It is deployed in Docker containers on a Proxmox-virtualized server, with continuous integration and deployment (CI/CD) automated through GitHub Actions, using actions/checkout v4, docker/login-action v3, docker/build-push-action v5, and appleboy/ssh-action v1.0.0. Docker images are published to GitHub Container Registry (GHCR).
Figure 2.
End-to-end data flow and non-functional requirements of MueveT; the experimental verification of the latency requirement is reported in Section 5.2. Own elaboration based on [22].
The non-functional requirements set a maximum response time of 2 s for standard queries (map, bus-stops, buses), an IoT data update frequency of up to 5 s with a maximum latency of 4 s between data reception and visualization, tolerance to communication interruptions while retaining the last valid data, role-based authentication and authorization (administrator, fleet administrator, mobility authority and passenger), validation of all incoming data and interoperability through MQTT and standardized APIs [22,64]. Section 5.2 reports the experimental verification of the latency requirement for the device–platform segment.
4.4.1. Estimated Time of Arrival and Segment Assignment
The estimated time of arrival (ETA) algorithm starts from the representation of each route as an ordered sequence of segments with OSRM geometry and associated bus-stops. For each vehicle record, the geodesic distance is calculated with the haversine formula [65]:
where R = 6,371,000 m. The vehicle position is projected onto each segment through the orthogonal projection scalar factor, and if the distance between the position and the projected point is below a 10 m threshold, the vehicle is assumed to be travelling on that segment, additionally verifying direction consistency to avoid erroneous assignments on parallel roads or turnarounds [66]. Once the segments pending to each bus-stop are identified, the ETA is obtained with the basic kinematic relation:
where d_remaining is the sum of the distances of the pending segments and v is the speed reported by the i-Bus. A simple, explainable estimator was deliberately chosen as a baseline, recognizing that approaches with Kalman filters, hybrid models or support vector machines with historical data [67,68,69] improve accuracy and constitute the natural evolution once a sufficient historical base exists; Section 5.4 reports a preliminary comparison with observed times.
a = sin2(Δφ/2) + cos φ1 · cos φ2 · sin2(Δλ/2); c = 2 · atan2(√a, √(1−a)); d = R · c
ETA = d_remaining/v
4.4.2. Detection of Presumed Operational Infringements
For each vehicle record, the platform evaluates three rules oriented to safety and service quality. Speeding: recorded when the speed exceeds by more than 10 km/h (tolerance threshold) the maximum speed of the assigned segment. Boarding or alighting at an unauthorized location: an occupancy change is detected by comparing the current record with the immediately preceding one in the same operating calendar, and it is verified whether any authorized bus-stop lies within a 15 m threshold of the travelled stretch; if not, the event is recorded. Overcapacity: recorded when the number of people on board exceeds the registered number of seats of the vehicle. Events are modelled through relational inheritance (base table and specialized tables) and emit real-time notifications to the fleet administrator and the authority [22]. These are rule-based detections on telemetry that characterize observed driving behaviour but do not measure reductions in crashes.
4.4.3. Route Recommendation, Device Monitoring and Service Quality Indicators
The route recommendation algorithm projects the user’s origin and destination onto the polyline of each active route; discards routes without valid segments, too distant or with the destination before the origin in the direction of travel; calculates walking access distances, travel distance and estimated time; and identifies boarding and alighting stops, ranking the alternatives by shortest access distance and then by shortest travel distance. The network operations centre (NOC) module presents, for each device, its health status, latest latency, RSSI, SNR, number of detecting gateways and date of the last record, with histories; this capability is essential because the ETA, the detections and the indicators depend on the availability and quality of field data.
The service quality module implements an operational indicator framework informed by the mobility evaluation model and by the literature on public transport service quality, which distinguishes objective operational measures from subjective perception measures [70,71]. It uses the variables available in MueveT to characterize transport operation, passenger travel conditions and the performance of the supporting technological infrastructure and organizes its indicators into six dimensions (Table 6): operation and performance (commercial speed, speed variability, frequency), service quality (average occupancy, saturation index, seat availability), accessibility and coverage (route density, GPS record density), intelligence and technology (latency, device health index, signal quality, electrical consumption), user experience (comfort index, probability of an available seat) and operational safety (speeding index, aggressive driving index). The Service Quality Index (SQI) calculation comprises three stages: calculation of the individual indicators for the selected assessment scope and reporting period, normalization and weighted aggregation. Let x_ij denote the value of indicator j in dimension i and L_ij and U_ij its lower and upper normalization bounds, with U_ij > L_ij; the normalized score is:
z_ij = clip((x_ij − L_ij)/(U_ij − L_ij), 0, 1) if higher values indicate better performance;
z_ij = clip((U_ij − x_ij)/(U_ij − L_ij), 0, 1) if higher values indicate poorer performance;
clip(v, 0, 1) = min(1, max(0, v))
z_ij = clip((U_ij − x_ij)/(U_ij − L_ij), 0, 1) if higher values indicate poorer performance;
clip(v, 0, 1) = min(1, max(0, v))
Table 6.
Battery of operational service quality indicators implemented in MueveT, by dimension, with data source and normalization direction [22].
Clipping prevents observations outside the normalization bounds from producing scores outside the interval [0, 1]; the normalization direction is specified individually for each indicator. Within each dimension, the available normalized indicators are combined using a weighted mean:
where a_ij is the configured non-negative weight of indicator j and A_i is the set of indicators with available values in dimension i; the denominator must be positive. This formulation preserves the relative weights of the available indicators and excludes missing values from both the numerator and the denominator so that a missing value is distinguished from an observed value of zero. When all six dimension scores are available, the overall index is:
with weights of 0.15 for operation, 0.20 for service quality, 0.15 for operational safety, 0.20 for technology/IoT, 0.20 for user experience and 0.10 for accessibility and coverage. Since each D_i lies within [0, 1], these conditions constrain the SQI to [0, 1], and the result is interpreted in four continuous intervals: high (0.80 ≤ SQI ≤ 1), medium (0.60 ≤ SQI < 0.80), low (0.40 ≤ SQI < 0.60) and critical (SQI < 0.40). The device health index is calculated as the average of normalized scores for latency, RSSI, SNR and age of the last message (e.g., 100 points for latency < 500 ms or RSSI ≥ −90 dBm; 10 points for latency ≥ 3000 ms or RSSI < −115 dBm).
D_i = Σ_{j∈A_i} a_ij · z_ij/Σ_{j∈A_i} a_ij
SQI = Σ_{i = 1}^{6} w_i · D_i, w_i ≥ 0, Σ_{i = 1}^{6} w_i = 1
The SQI aggregates the operational and technological indicators described in this subsection into six dimension scores; it does not directly aggregate the twelve indicators listed in Table 1. Its dimension weights were established through an initial judgement-based assignment by the research team, considering the functions represented by each dimension and their relevance to the proposed system: service quality, technology/IoT and user experience were each assigned 0.20, reflecting the emphasis on passenger occupancy and seat availability, on the reliability of the infrastructure supplying real-time data and on passenger comfort; operation and operational safety were each assigned 0.15 to account for service efficiency and regularity, speeding and driving behaviour; and accessibility and coverage were assigned the remaining 0.10 to incorporate spatial service coverage and monitoring density. These weights sum to 1.00 and represent a preliminary design configuration: they were not estimated from experimental observations, derived from the twelve indicators in Table 1 or inherited from the AHP weights of the original evaluation model. The SQI categories describe the operational service conditions represented by its component indicators and are distinct from the five mobility maturity levels of the reference framework [6], which encompass broader social, governance, environmental and economic conditions; no numerical conversion between the SQI and the maturity scale is applied in this study.
4.5. Traceability Between the Evaluation Model and the System
Figure 3 summarizes the traceability between the mobility evaluation framework, the technological intervention targets, the data captured by the system and the functions and indicators implemented in MueveT. This traceability concerns the contribution of the technological system to the information needs of the broader model; it does not imply equivalence between the two indicator frameworks. A selected mobility indicator may motivate several platform functions, and a single data source may support multiple operational indicators; conversely, some selected indicators require administrative, environmental or user-reported data that the IoT infrastructure alone cannot provide (Table 1).
Figure 3.
Traceability chain between the mobility evaluation model [6], the technologically treatable indicators, the perception modules and the MueveT functions and indicators. The SQI is an operational summary whose integration with the maturity scale remains a protocol to be validated (Section 4.5).
Within this relationship, the SQI provides a summary of the operational and technological conditions represented by its component indicators. It does not replace the mobility evaluation model, reproduce its coverage of social outcomes or establish a validated mobility maturity score. Its use as an input to the five-level maturity assessment remains a proposed integration requiring explicit mapping, calibration and validation; the contribution demonstrated here is the generation and processing of data that can support that future assessment. The relationship with mobility maturity is therefore established at the level of assessment needs and supporting evidence: vehicle telemetry, operational records and device monitoring data provide information relevant to selected aspects of transport operation and technological capability, but operational variables are not necessarily equivalent to the indicators used by the reference model. For example, speeding records characterize observed driving behaviour but do not measure reductions in traffic accidents or fatalities; likewise, the availability of a real-time information platform does not, by itself, demonstrate that its data are used in transport planning or meet the model’s open-data criteria. A future integration would require mapping each eligible data output to a specific reference indicator, verifying its definition and spatial and temporal coverage, applying the corresponding assessment criteria and retaining the original aggregation structure and weights, while administrative information and citizen perception assessments would remain necessary for the components not covered by the system. Consequently, neither a revised city maturity score nor an improvement in mobility maturity is inferred from the prototype tests.
5. Results
5.1. LoRaWAN Link Performance Under Real Urban Conditions
LoRa is conceived mainly for static nodes; even so, the study deliberately evaluated its performance with mobile nodes, as is the case of the i-Bus. The first two phases showed that the ADR protocol, useful for fixed nodes, does not adapt well to the rapid channel variation of a moving node and that topography, obstructions and gateway height are the determining factors of channel quality [21]. Therefore, in the third phase, ADR was disabled and the data rate was fixed manually. DR1 (SF9/125 kHz), DR2 (SF8/125 kHz) and DR4 (SF8/500 kHz) were evaluated. DR0 was discarded because its maximum payload in US915 does not admit the 15-byte i-Bus frame and its time on air exceeds the 400 ms limit (Table 5); DR3 (SF7/125 kHz) was not repeated as a fixed setting because its behaviour had already been observed in the second phase, when ADR assigned SF7.
One complete run of the 3.72 km route was performed per configuration on 9 April 2025, in the order DR1 (15:39–15:58), DR4 (16:27–16:40) and DR2 (16:53–17:03). The three runs used the same vehicle, the same route, the same stop pattern and the same two gateways. The i-Bus Raspberry Pi was configured to generate transmissions with pseudo-random spacing on the order of 8 to 12 s, deliberately more frequent than usual in LoRaWAN, in order to obtain the largest number of samples per run; the effective interval between consecutive recorded frames had medians of 6.8, 9.8 and 12.1 s, respectively. Packets sent were determined from the LoRaWAN frame counter of each device session and packets received from the network server events. During the DR1 run, vibration-induced power interruptions restarted the node and forced 14 new OTAA joins within about five minutes; counting was performed per session so as not to underestimate the packets sent. The metrics in Table 7 and Figure 4 derive from the packet-by-packet reprocessing of the original network server records [23].
Table 7.
Link metrics per data rate on the emulated UCPT route (3.72 km, two gateways, one run per configuration, 15-byte payload) [23].
Figure 4.
LoRaWAN link metrics per data rate on the emulated UCPT route: (a) PER with 95% confidence interval; (b) time on air per frame; (c) SNR, mean ± standard deviation. DR1: SF9/125 kHz; DR2: SF8/125 kHz; DR4: SF8/500 kHz (data from Table 7) [23].
All three configurations showed substantial losses in motion, consistent with an urban scenario of irregular topography and intermittent line of sight. DR1 and DR2 obtained PERs of 38.7% and 40.4%, with widely overlapping confidence intervals, so that with one run per configuration, they cannot be distinguished statistically; DR2 achieved this with almost half the time on air per frame (0.123 s versus 0.226 s), which makes it preferable given channel occupancy constraints. DR4, despite its shorter time on air (0.031 s), recorded the highest PER (45.9%), and 91% of its receptions depended on a single gateway, which is consistent with the lower sensitivity of a 500 kHz bandwidth. The higher mean RSSI of DR4 does not indicate a better link: it indicates that only packets emitted close to the gateway were received. These results are consistent with the experimental evidence on LPWAN for mobile nodes [18,19] and with what was reported in Popayán, where losses concentrated in sectors with obstacles in the line of sight [10]. On this basis, DR2 was adopted for the integrated test (Section 5.2).
From the third phase, four coverage radii per gateway were characterized: up to ~650 m with continuous communication (intermittent losses towards the edge), up to ~760 m with high losses, up to ~870 m without effective records on the network server despite momentary node association, and a theoretical radius of ~1 km attainable only with gateways installed at 20 to 40 m height. The comparison with RadioMobile showed general consistency but also identified areas where the real link exceeded the prediction (positive SNR and RSSI > −90 dBm at a point predicted as low coverage) and areas with favourable theoretical coverage but no effective records, confirming that simulation guides deployment but does not replace empirical validation. With the continuous-coverage radius, it was estimated that a uniform distribution of 24 gateways would cover the delimited urban area of Tunja (≈18.8 km2) (Figure 5) [21]; this distribution constitutes a dimensioning estimate whose definitive optimization requires overlaying the UCPT routes, bus-stops and traffic lights and validating the line of sight of each site. In the perception sub-project, tests with the four modules reported loss rates below 16% under stable conditions, without bottlenecks or MQTT collisions with multiple modules transmitting simultaneously [20].
Figure 5.
Coverage radii characterized per gateway and estimated layout of 24 gateways for the delimited urban area of Tunja (≈18.8 km2); RadioMobile prediction of received signal level [21].
5.2. Integrated Test on an Extended Route with Simultaneous LoRaWAN and LTE Communication
Based on the findings of the previous phases, an integrated test was executed on a 6.53 km route in the north of Tunja (4 March 2026, 13:59–14:52). The objective was to evaluate the complete architecture on a more complex route: the final i-Bus payload, simultaneous transmission over LoRaWAN and LTE, a fixed bus-stop node and data reception in MueveT. The network infrastructure was extended to four gateways placed to maximize line of sight (Table 8, Figure 6). The i-Bus transmitted over LoRaWAN with fixed DR2 (SF8/125 kHz), the configuration selected in the previous phase, a 38-byte frame; in parallel, the same samples were sent over LTE in JSON format to an MQTT broker integrated with the network server through an API key, to which MueveT subscribes. The i-Bus-Stop, installed in a fixed position next to the Viva gateway, transmitted its environmental variables every ≈60 s. In the 53 min of the test, the vehicle travelled 14.9 km, approximately two laps of the route. LoRaWAN loss was calculated with the frame counter (Table 9); the LTE message does not include a counter, so its loss was estimated by comparing the records received with those expected according to the duration and the median interval.
Table 8.
Gateways of the integrated test and receptions recorded by the network server [23].
Figure 6.
LoRaWAN reception along the extended route. Each point is an i-Bus frame placed at the vehicle’s GPS position at the instant of transmission (blue: received; orange: not received). Triangles indicate gateways, and dashed circles indicate the 650 m radius estimated in the previous phases [23].
Table 9.
Results of the integrated test (6.53 km route, four gateways, 4 March 2026) [23].
LoRaWAN loss for the mobile node (59.1%) was high even though 91% of the trajectory took place within 650 m of some active gateway, and delivery did not decrease monotonically with distance: it was 56% within 250 m of the nearest gateway and around 36% between 250 and 1000 m (Table 10). This indicates that, in motion, line of sight and antenna placement weigh more than nominal distance: the Viva gateway concentrated most of the receptions, even at nearly 2 km, while the Posgrados and Aranjuez gateways received few frames even with the vehicle nearby, and the Galilea gateway recorded no receptions. The vehicle speed, up to 65.6 km/h on some stretches, further reduces the useful exposure time to each gateway. In contrast, the i-Bus-Stop, static and within confirmed coverage, delivered 100% of its frames, which supports the exclusive use of LoRaWAN for fixed-infrastructure nodes.
Table 10.
i-Bus LoRaWAN delivery by distance to the nearest active gateway (Viva, Posgrados or Aranjuez) [23].
The LTE network continuously delivered the same samples, with an estimated loss of 4.3%. The latency measured from the device timestamp to the persistence of the record in MueveT had a median of 272 ms and a 95th percentile of 383 ms; 99% of the records were below 1 s and only seven of 695 exceeded that value, with a maximum of 4.1 s associated with cellular network reconnections (Figure 7). These values lie within the maximum latency requirement of 4 s between data reception and its availability on the platform (Section 4.4) for the measured segment, which comprises transmission, the MQTT broker, the consumer and storage; rendering in the web interface and the response time of standard queries were not instrumented at this stage.
Figure 7.
Distribution of LTE-link latency from the device timestamp to persistence in MueveT (695 records; values above 1200 ms are grouped in the last bin) [23].
The correlation between both links supports the proposal of a dynamic hybrid communication model. Since the i-Bus is based on a single-board computer with edge-processing capacity, the cellular network can remain at rest and be activated only when a local algorithm anticipates loss of line of sight from RSSI and SNR degradation, limiting LTE transmission to position and critical events while the vehicle crosses areas without LoRaWAN coverage, and returning to LoRaWAN when the link recovers. This switching, which reduces energy consumption and mobile data cost, is proposed as future development; in the test reported here, both links transmitted simultaneously for diagnostic purposes. For fixed nodes such as the i-Bus-Stop, the result obtained makes it possible to dispense with cellular backup, which is decisive for the economic viability of large-scale deployment (Section 7.2).
5.3. Digital Twin of the LoRaWAN Network
To project network behaviour beyond the devices available in the field, a digital twin of the network layer was developed in Python (version 3.13.12), understood as a computational representation of the LoRaWAN cell fed with operational data [72] and built as a discrete event simulator with two node classes: the mobile i-Bus and the fixed i-Bus-Stop. The model was fed with the real records of the integrated test (157 i-Bus frames and 34 i-Bus-Stop frames, with their 202 receptions): from them, it takes the emission periods (6.50 s and 60.68 s), the frame sizes (38 and 31 bytes), the radio configuration (SF8, 125 kHz, CR 4/5) with the eight observed channels, the recorded trajectories and the signal levels actually received. The receiver was parameterized with a sensitivity of −126 dBm, a minimum SNR of −10 dB, a capture margin of 6 dB and eight demodulation paths; a frame is lost if, during any overlap interval with another frame on the same channel and spreading factor, its aggregate signal-to-interference ratio falls below the capture margin, an approximation consistent with the capture models used in LoRa scalability studies [73]. The twin operates offline: it does not continuously synchronize with the deployed devices or control the physical network, and its results are conditional on its assumptions.
Four populations (1 + 1, 5 + 5, 25 + 25 and 50 + 50 buses and bus-stops) and an additional composition series with 50 nodes in total (from 0 + 50 to 50 + 0) were evaluated under six conditions: baseline; only two channels; degraded coverage (45 dB RSSI and 8 dB SNR penalty, with 3 dB variation); external interference with a 20% loss probability per frame; gateway outage between minutes 24 and 33; and four times more frequent reporting. Each scenario was simulated for 60 min with three seeds (162 runs in total). The packet delivery ratio (PDR), the fraction of time with fresh information (30 s threshold for the bus and 180 s for the bus-stop), the age of information [74], the maximum update gap and the cause of each loss were recorded.
The synthetic distributions of RSSI, SNR and intervals reproduced those observed in the test: median bus RSSI of −73.2 dBm versus −75 dBm observed, median SNR of 11.5 dB in both cases, and median intervals of 6.495 s versus 6.499 s (bus) and 60.64 s versus 60.67 s (bus-stop) (Figure 8). Under the baseline condition, the cell maintained a delivery of 97.9% for five buses, 85.3% for 25 buses (23 of 25 nodes above 80%) and 72.3% for 50 buses, with collisions as the dominant cause of loss; bus-stops retained deliveries of 95% or more for all populations (Table 11, Figure 9). This behaviour is consistent with the uncoordinated random access of LoRaWAN Class A, in which each node transmits without synchronizing with the others over the eight channels of the sub-band used. The higher delivery of the bus-stops is not due to their lower reporting frequency but to the fact that their signal reached the gateway with greater strength (median −59 dBm versus −73 dBm for the buses), which allows them to prevail by the capture effect when their frames coincide with those of a bus; in a deployment with bus-stops farther from their gateway, this advantage would be smaller. The fraction of time with fresh bus information remained above 99% even with 50 + 50 nodes, indicating that the application tolerates losses as long as recent samples keep arriving. The most severe degradations corresponded to the reduction to two channels and to four times more frequent reporting, which brought bus delivery down to 26.7% and 24.4% with 50 + 50 nodes (Figure 10).
Figure 8.
Observed (orange) and synthetic (blue) empirical cumulative distributions of RSSI, SNR and reporting interval in the integrated test for the bus and the bus-stop.
Table 11.
Digital twin results (mean ± standard deviation across three seeds; 60 min per run).
Figure 9.
Delivery ratio versus bus and bus-stop population for the six simulated conditions (mean ± standard deviation across seeds). Digital twin fed with the integrated test records.
Figure 10.
Primary cause of undelivered frames with 50 + 50 nodes. 1: baseline; 2: two channels; 3: degraded coverage; 4: external interference; 5: gateway outage; 6: reporting ×4.
These results must be read in light of two considerations. First, the 6.5 s period corresponds to the stress regime used in the tests; in operation, with an interval consistent with 30 s of daily uplink time on air per node (≈3.7 min for the 38-byte frame over a 10 h day), the offered load per bus would be about 34 times lower, so the simulated scenarios represent a demanding case. Although the regional plan used does not impose a duty cycle, the reporting frequency in operation must be adjusted to a reasonable use of a shared spectrum. Second, the twin represents the operation of one cell within its coverage area, from the signal levels actually received in the field, whereas losses due to lack of coverage along the route are characterized by the measurements in Section 5.2. As an indicative reference, the 396 active UCPT vehicles of Tunja (Section 2.2), distributed among the 24 gateways of the estimated layout, would correspond to about 16 buses per cell on average, within the range in which the twin projects deliveries above 85% even under the stress regime; the concentration of routes along corridors and in the city centre means that the real load per cell is not uniform. Overall, the field-data-informed digital twin constitutes the basis for evolving towards a more robust model that integrates the gateways of the estimated city layout and synchronization with the operating network, and it serves as a comparative reference for the definitive deployment.
5.4. End-to-End Integration and System Test
The integration tests verified that a message generated by a vehicle device and another by a bus-stop device were received by the MQTT consumer, interpreted, associated with the vehicle, the operating calendar and the registered device, and persisted in MongoDB, retaining both the normalized payload and the original record. The system test was executed during the integrated test described in Section 5.2, so the MueveT views correspond to the data received on that route: the application displayed the route, the bus-stops and the movement of the vehicle, and the ETA was updated based on the reported position and speed [22]. Figure 11 illustrates the evolution of the prototypes and Figure 12 the MueveT interface.
Figure 11.
Evolution of the prototypes: (a) portable i-Seat module, version 3; (b) i-Bus module with display and Lilygo LoRa32 installed in the test vehicle; (c) i-Bus-Stop environmental station; (d) i-Crossing/Traffic-Light prototype [20,21].
Figure 12.
MueveT interface with the integrated test data: (a) assisted segment creation with OSRM; (b) NOC view of devices; (c) Service Quality Index dashboard by dimension [22].
In addition to the integration and system tests, a preliminary comparison between estimated and observed travel times was conducted for four segments of the test route during a real journey. The estimator used the vehicle’s current speed and the remaining distance to the target point. Table 12 reports one prediction–observation pair per segment, i.e., four observations within the same route. Absolute errors ranged from 6 to 26 s, with a mean absolute error (MAE) of 15.00 s and a root-mean-square error (RMSE) of 16.63 s; absolute percentage errors ranged from 1.25% to 14.77%, with a mean absolute percentage error (MAPE) of 8.59%. Defining the signed error as estimated minus observed travel time, the mean signed error was −8.50 s: the estimator underestimated travel time in three segments and overestimated it in one. These values describe the behaviour of the estimator on one journey and do not constitute a validation of its predictive accuracy.
Table 12.
Preliminary comparison between estimated and observed travel time on four segments of the test route [22].
Deployment to the production environment enabled communication between frontend, backend, databases, MQTT brokers and WebSocket on containers with persistent volumes, with automated deployment and security practices (key-based SSH access on a non-standard port, secrets managed in GitHub Actions, externalization of credentials in environment variables and controlled port exposure). Unit tests on the indicator, IoT processing, time estimation, availability, occupancy and event detection modules passed in all defined cases [22].
5.5. Service Quality Indicators and Usability Evaluation
The indicator module became operational with dashboards at operating-company, dimension and operating-calendar levels, with summary cards, tables, historical charts, time filters and visual states for critical conditions; the environmental variables of the bus-stops are presented through interpreted ranges (e.g., adequate air quality between 350 and 600 ppm and poor between 1001 and 1500 ppm; comfortable noise below 55 dBA and critical above 86 dBA) so that a non-specialist user can understand waiting conditions. Since operational deployment on the commercial fleet has not yet taken place, the SQI values reported by the platform correspond to test data and are not presented here as a diagnosis of the city.
The internal usability assessment included 25 co-researchers and associated researchers of the macro-project, who completed a questionnaire adapted from the UEQ on a 1–5 scale (Table 13). High ratings were obtained in all dimensions: attractiveness between 4.25 and 4.75; ease of learning 4.75; ease of performing tasks and navigation 4.50; fast interactions 4.75 and system response 4.50; perceived reliability 4.75 with 100% affirmative answers on error-free operation; control 4.25; comfortable use 4.75, overall satisfaction 4.50 and intention of future use 5.00; and perceived innovation 4.25 with 100% recognition of unique functionalities. The control dimension, slightly lower, pointed to improvement opportunities in action feedback and confirmations in critical processes [22]. These results should be interpreted as evidence of functionality and usability perceived by internal evaluators, not as proof of service quality or of benefit to end users.
Table 13.
Results of the MueveT usability evaluation with a questionnaire adapted from the UEQ (1–5 scale; n = 25 co-researchers and associated researchers of the macro-project) [22].
6. Comparison with Similar Developments
To position the contribution, developments reported in the literature that share at least two of the following features were selected: intervention on existing UCPT, use of IoT/LPWAN or low-cost technologies, intermediate city or developing country context, and provision of real-time information; a demand–supply analysis tool is added as a reference for the use of indicators in decision-making. Table 14 compares ten references with the system presented here under eight criteria: application context, retrofitted UCPT elements, IoT architecture layers covered, communication technology, functions for user and operator, link to a mobility evaluation framework, validation evidence and cost model.
Table 14.
Comparison of the proposed system with similar developments and tools reported in the literature.
The closest reference is the line of work developed in Popayán, Colombia, an intermediate city of comparable size. With a proof of concept, Salazar-Cabrera et al. [10] demonstrated that LoRa-based tracking of public transport vehicles and the ITS services of vehicle tracking and traveller information (ARC-IT PT01 and PT08) are feasible, reporting losses close to 28% for moving vehicles with SF10 and estimating 15 gateways to cover the city; Rojas et al. [11] and Bolaños et al. [12] extended the proposal to a fleet management and control system with LoRaWAN, TTN and OTAA security, oriented to route and schedule compliance, speeding and user information; and Sánchez Díaz et al. [75] added inertial units and LSTM networks to estimate position when the LoRa link is lost, reporting LoRa coverage on 60.4% of the routes. Our system shares the technological choice and the context, with mobile node losses of the same order or higher (38.7–59.1% depending on the route and number of gateways), but differs in three respects: it also retrofits seats, bus-stops and pedestrian crossings, not only the vehicle; it integrates telemetry into a multi-tenant platform with event detection, NOC and composite indicators; and it derives its specification from a mobility evaluation model validated with experts and citizens, additionally publishing the field records.
In Japan, Boshita et al. [13] implemented a LoRaWAN bus location system aimed at reducing the communication cost of commercial systems, and Kumari et al. [76] implemented an IoT- and GPS-based bus tracking system in India. Di Renzone et al. [18], in controlled vehicle-to-infrastructure tests, obtained deliveries above 84% up to 110 km/h with a gateway near the road and line of sight, which, contrasted with our losses on urban journeys, underlines that obstruction rather than speed is the dominant factor in cities with irregular topography. In Malaysia, Elijah et al. [14] opted for Bluetooth beacons on buses and Raspberry Pi detectors at bus-stops, arguing that GPS represents a significant investment for small operators; their solution reached cost parity with GPS in the second year and recurring savings but depended on power and connectivity at each bus-stop, conditions met by only 50% of the bus-stops studied. Our design inverts that dependency: the mobile node reports to wide-area gateways and the bus-stop is an optional environmental enrichment node, which reduces the minimum infrastructure required.
Regarding street furniture, in the United Arab Emirates, Kamal et al. [15] developed smart bus-stops with environmental sensors, lighting and air-conditioning control and fault detection on Raspberry Pi and WiFi with a Firebase database. In Turin, Pronello et al. [16] demonstrated people counting at bus-stops through WiFi probe requests and deep learning with a mean absolute error close to 1.2 persons. The i-Bus-Stop coincides with the former in environmental instrumentation but is designed to operate without WiFi or air conditioning, with LoRaWAN transmission—which recorded no losses in the integrated test—and planned autonomous power supply, and its value lies not in the isolated bus-stop but in its function as a reference node for the ETA and the comfort of the waiting user. Measurement of occupancy at bus-stops, which the evaluation model requires for the waiting time indicator, is an open line for which the approach of Pronello et al. is directly adaptable.
From the perspective of data and user information, the Digital Matatus project in Nairobi [17] demonstrated that surveying semi-formal routes with mobile phones and publishing them in GTFS format enables trip-planning applications at very low cost, although without real-time information, and the OneBusAway experience in Seattle [46,47] quantified the benefits of real-time arrival information on satisfaction and perceived waiting time. MueveT lies between both extremes: it provides trip planning on OSRM geometries and ETA based on real telemetry on an open platform that could expose its data in GTFS and GTFS-Realtime to interoperate with third-party applications, which constitutes an explicit recommendation in Section 8.
A reference of a different nature, but relevant to the use of indicators in decision-making, is DORAM (Demand versus Offer Analyzer for Mobility) [77], a tool that compares the public transport offer described in GTFS with origin–destination demand matrices built from censuses, counts, telephony or WiFi data. It also calculates indicators of pick-ups and drop-offs per stop and time interval to identify crowding at stops and on vehicles and to evaluate what-if scenarios of changes in offer or demand, validated with data from the Tuscany region (25 lines, 11,173 trips and 942 stops in the Florence metropolitan area). DORAM and MueveT are complementary: the former starts from a planned offer and an estimated demand to analyse scenarios, whereas the latter produces, from operation, the measures of seat-level occupancy, saturation, seat availability and commercial speed that a tool such as DORAM needs as observed input. In an intermediate city without updated origin–destination matrices, the occupancy and saturation recorded by MueveT per route, stretch and time slot would make it possible to identify where capacity is lacking and to evaluate frequency adjustments, closing the loop between measurement and decision that DORAM illustrates with planned data; exposing the MueveT offer in GTFS would make that integration direct.
Commercial platforms oriented to the operator (Cittati, Nimbus/Wialon, MET Group ITS) and to the passenger (Moovit, Transit) cover equivalent or superior functionalities in fleet monitoring, indicators and multimodal planning but under SaaS licensing models, with dependence on GPS/LTE devices with a recurring cost per vehicle and without a link to sustainability evaluation frameworks; their adoption in intermediate Colombian cities is limited by costs and by the absence of structured baseline data [9,22]. The comparative analysis leads to a nuanced conclusion: the proposed system is not superior in every isolated capability—in particular, its LoRaWAN delivery for mobile nodes is lower than that of systems with cellular coverage—but it is the only one among those compared that combines multi-element retrofitting, low-recurring-cost LPWAN for fixed nodes, an open multi-tenant platform, traceability to a citizen-centred mobility evaluation model and published field records.
7. Discussion
7.1. Correspondence of the System with Global South Mobility Shortcomings
The evaluation model identified five characteristics that conventional frameworks must incorporate for the Global South: integration of governance, incorporation of citizen perception, adaptability to data constraints, real-time measurement strategies and the capacity to assess maturity [6]. The system presented directly addresses the third and the fourth: it turns a UCPT that produced no data into a continuous source of telemetry and does so with minimal infrastructure requirements for fixed nodes (one gateway covers ~650 m with continuous communication, and the bus-stop recorded no losses) and with an explicit hybrid strategy for mobile nodes. In a context where the official evaluation of mobility relied on scarce online information and the absence of a measurement culture [6], this capability is an enabling condition for evidence-based governance and responds to the data scarcity also reported by other mobility assessment methodologies in Latin American cities [78].
Regarding maturity assessment, the contribution is enabling rather than evaluative: the system demonstrates a means of producing operational records that could support selected measurement needs of the reference framework. It does not establish a change in the city’s maturity level or reproduce the comparison between measurement and citizen perception conducted in the reference study [6]; such a comparison would require aligned indicators, compatible spatial and temporal coverage and a corresponding citizen perception assessment. The correspondence is, moreover, partial in the social dimension, the one with the greatest weight in the model (34.1%): the system contributes to comfort, seat availability and information legibility, but it does not intervene with affordability, universal accessibility or care and night mobility, indicators that depend on fare decisions, vehicle design and public policy, not on sensing. Nor does it replace citizen participation: real-time information is a form of responsiveness, but full responsiveness requires feedback channels from the user to the authority that MueveT does not yet implement. These boundaries are consistent with the thesis that in the Global South, governance failures, more than technical constraints, constitute the main barrier [31]: technological retrofitting creates conditions for better governance but does not guarantee it.
7.2. Trade-Offs of Technological Retrofitting: Lifecycle Cost Structure
Retrofitting does not eliminate the costs of an intelligent system: it shifts them from asset renewal to instrumentation, network and maintenance. Table 15 decomposes the lifecycle cost structure of the proposed solution into its components, distinguishes between initial investment and recurring costs, and contrasts it qualitatively with the two usual alternatives: adoption of a commercial fleet management platform with GPS/LTE devices per vehicle and fleet renewal with factory-equipped vehicles. Three trade-offs follow from the results. First, the connectivity decision is per node type: fixed nodes (bus-stops, crossings) can operate exclusively over LoRaWAN, with zero recurring data cost on an own network or the fee of a managed network server, whereas mobile nodes require, with the gateway coverage attainable in a city with irregular topography, a cellular backup whose recurring cost per vehicle is of the same order as that of commercial solutions; the proposed dynamic switching reduces that cost by limiting LTE traffic to blind spots but does not eliminate it. Second, the gateway infrastructure (24 estimated sites, with height, power and backhaul) and its maintenance constitute a fixed cost that cellular solutions do not have, which is amortized only if the same network serves other urban services (lighting, metering, environment), as is usual in municipal LoRaWAN deployments [38]. Third, the move from prototypes with general-purpose components to industrial-grade hardware multiplies the unit cost of the modules, but it remains a fraction of the cost of a new vehicle; the Malaysian experience shows that a low-recurring-cost retrofitting solution reaches parity with a GPS alternative in the second year despite a higher initial investment [14]. A quantitative total-cost-of-ownership assessment requires local prices of industrial components, power and backhaul, as well as the observed service life of the modules in operation, inputs that only the prolonged operational validation (Section 8.2) can provide; for this reason, Table 15 is presented as a comparison framework and not as a monetary estimate.
Table 15.
Lifecycle cost structure: proposed IoT retrofitting versus commercial platform and fleet-renewal alternatives (qualitative comparison).
The results further suggest that retrofitting is consistent with the priorities of intermediate cities identified by Ramírez-Guerrero et al. [9]: open standards, user information and context-adjusted solutions. Three design lessons follow. First, the portability of the mobile modules was decisive for progressing without depending on agreements with operators, but it also exposes a risk: validation with private vehicles does not reproduce the vibrations—which, in phase 3, caused node restarts—power supply, vandalism or passenger density of a bus in operation. Second, the separation between a low-recurring-cost main technology (LoRaWAN in a licence-free band) and a subscription-based backup (LTE) allows operating expenditure to be limited to the minimum necessary, provided that the switching logic is synchronized with edge data and the blind spots of the routes are studied. Third, the event-oriented architecture and hybrid persistence of the platform allow a single datum (a vehicle record) to simultaneously feed the map, the ETA, event detection and the indicators, which makes the marginal cost of each new function low.
7.3. Limitations
The study has limitations that bound the generalization of the results and that correspond to the scope of the research macro-project. Field tests were carried out with functional prototypes and general-purpose components, not industrial-grade hardware, installed in vehicles outside the UCPT fleet that emulated service journeys. On the 3.72 km route, one run per configuration was performed, which allows the variability within each run to be described but does not allow statistically significant differences between configurations to be established; moreover, signal metrics exist only for received frames, which biases their averages towards areas of better coverage. In the integrated test, latency was measured on the LTE link up to persistence in the platform; end-to-end latency of the LoRaWAN link requires a synchronized millisecond-resolution timestamp on the device, to be incorporated in the next stage, and interface rendering and query response time were not instrumented. Full city coverage with 24 gateways is a dimensioning estimate based on the study carried out, and the digital twin was fed with a single field test, represents one cell with one gateway and does not incorporate the uncertainty in its assumptions (capture margin, number of demodulators, bus-stop positions) or acknowledgement, retransmission or ADR mechanisms.
The ETA is based on a kinematic estimator without historical data or traffic conditions, and its comparison with observed times was limited to four segments of one journey. The SQI weights are an initial assignment by the team, not an expert weighting, and the acceptance tests were applied, as a proof of concept, to 25 co-researchers and associated researchers of the macro-project, without passenger participation. The integration with mobility maturity remains conceptual: the study does not establish a calibrated mapping between the six SQI dimensions and the four dimensions of the reference framework, nor does it provide the complementary evidence required for a city-wide reassessment, so the maturity results reported from the reference study are contextual findings and not outcomes of the intervention presented here. The lifecycle cost structure is presented as a qualitative framework, without monetary estimation. Finally, the i-Crossing/Traffic-Light module was developed and operated in a controlled environment since its deployment under real conditions would entail altering the furniture of the territory’s traffic system.
8. Conclusions and Considerations for Future Research
8.1. Conclusions
This work demonstrates that a citizen-centred evaluation model of sustainable and smart mobility can serve as the design framework for an intelligent system for the UCPT of an intermediate city of the Global South and that such a system can be built through the technological retrofitting of existing elements rather than their replacement. Twelve indicators of the reference model guided the definition of technological intervention targets across the perception, network and application layers; the resulting platform processes the available telemetry into passenger information, monitoring functions and operational service quality indicators, while the full assessment of some reference indicators requires complementary data and further development.
The experimental evidence establishes design parameters transferable to comparable cities. For mobile nodes in irregular urban topography, it is advisable to disable ADR and operate with fixed intermediate data rates; in the US915 plan, DR2 offered delivery equivalent to DR1 with half the time on air and was the configuration adopted in the integrated test. Line of sight and antenna placement weighed more than nominal distance in the delivery of the mobile node, so the gateway layout, dimensioned with continuous-coverage radii of the order of 650 m, must be validated in the field site by site, whereas for fixed nodes, LoRaWAN alone guaranteed delivery. In the application layer, an event-oriented architecture with hybrid persistence and WebSocket communication satisfied device-to-platform latencies on the LTE link, with a median of 272 ms against the 4 s requirement, and the organization of indicators into a composite index offers an operational summary that can feed, after calibration, the measurement perspective of the model. The field-data-informed digital twin indicates that one cell can serve on the order of 25 buses, with deliveries above 85% even under the reporting regime of the tests, and that the number of channels and the reporting frequency are the most sensitive parameters for scaling.
The comparison with similar developments shows that the distinctive contribution does not lie in a particular technology—LoRaWAN, OSRM or MQTT are present in other systems—but in the integration of four decisions: intervening with several UCPT elements at once, keeping the recurring cost of connectivity close to zero for fixed nodes and bounded for mobile ones, explicitly tracing each datum to an indicator of a validated evaluation model, and publishing the field records that make the results reproducible. That integration is what allows us to state that the system addresses mobility shortcomings specific to the Global South: the absence of measurement, the gap between what the authority measures and what the citizen perceives, and the fiscal impossibility of renewing the infrastructure.
8.2. Considerations for Future Research
Five lines follow from this work. First, as an evolution of the technological development level achieved, execute a prolonged operational validation on the commercial fleet of Tunja, with industrial-grade modules, multiple vehicles, bus-stops and companies, that allows quantifying ETA accuracy against arrivals observed in the system itself, the real availability of the devices, the end-to-end latency of both links, network behaviour under congestion and operating and maintenance costs and incorporating a broad population of passengers and operators in the experience evaluation. In parallel, extend the digital twin to the estimated gateway layout of the city and synchronize it with the operating network in order to contrast its projections with the actual deployment. Second, evaluate the robustness of the SQI through sensitivity analysis and calibrate its weights and normalization criteria using a documented expert assessment procedure and operational evidence. Separately, develop and validate an integration protocol with the mobility maturity framework that establishes indicator-level correspondences, defines compatible spatial and temporal aggregation, applies the reference model’s assessment criteria and AHP weights and obtains complementary administrative and citizen perception data, examining the contribution of eligible MueveT outputs to the original indicators rather than assuming that the SQI can replace the maturity assessment. Third, evolve the ETA towards models that incorporate dwell times at bus-stops, historical patterns, time of day and traffic conditions, as well as position estimation in the absence of a link through inertial sensors, following recent experiences in intermediate cities [75], and implement dynamic LoRaWAN–LTE switching at the edge. Fourth, regarding open data, publish routes and arrivals in GTFS and GTFS-Realtime, enable citizen feedback channels on the platform and integrate occupancy measures with demand–supply analysis tools [77] so that responsiveness becomes bidirectional and the information feeds both third-party applications and the perception perspective of the model. Fifth, regarding territorial scaling, apply the model → indicators → modules → functions chain in other intermediate Colombian and Latin American cities, including those with semi-formal transport, to build a comparative base of maturity levels and retrofitting costs that supports public policy decisions.
Author Contributions
Conceptualization, M.A.M.-M. and D.A.-L.; methodology, M.A.M.-M., D.A.-L. and C.A.G.A.; software, J.P.A.-A.; hardware and perception layer, J.E.B.G.; telematic system and network layer, J.A.C.O.; validation, J.P.A.-A., J.E.B.G. and J.A.C.O.; formal analysis, M.A.M.-M.; investigation, all authors; resources, M.A.M.-M.; data curation, J.P.A.-A. and J.A.C.O.; writing—original draft preparation, M.A.M.-M.; writing—review and editing, all authors; visualization, M.A.M.-M.; supervision, M.A.M.-M. and C.A.G.A.; project administration, M.A.M.-M.; funding acquisition, M.A.M.-M. All authors have read and agreed to the published version of the manuscript.
Funding
This research was funded by the Ministry of Science, Technology and Innovation of Colombia (Minciencias), call 890 of 2020, project 1109-890-82201 “Adaptation of the traditional urban collective public transport system of intermediate cities to the paradigm of smart, sustainable and responsive cities”, contract CT ICETEX 2023-0788, executed by the Universidad Pedagógica y Tecnológica de Colombia (SGI registration 3219).
Institutional Review Board Statement
The study did not involve interventions on human beings or the collection of identifiable personal data; the pedestrian detection devices record only incident counts and are not intended to identify individuals or to build facial databases. The Research Ethics Committee of UPTC approved the citizen perception surveys for the reference evaluation model (3 April 2025) [6]. The UEQ acceptance tests were conducted with adult participants who gave their consent.
Informed Consent Statement
Informed consent for participation was obtained from all subjects involved in the study.
Data Availability Statement
The original records of the four field test campaigns of the network layer (The Things Stack network server exports, MQTT/MongoDB records of the platform and gateway locations) are available under a CC BY 4.0 licence at https://github.com/jhoncallejas01/muevet-lorawan-field-data, accessed on 4 November 2026 [23]. The source code of the MueveT platform is available at https://github.com/JuanArchila13/MueveT-React, accessed on 4 November 2026 (frontend) and https://github.com/JuanArchila13/MueveT-Backend, accessed on 4 November 2026 (backend). The Responsive Mobility portal (version 1.0, registration 13-96-454 of the National Copyright Directorate) is available at https://www.responsivemobility.com. The data, configuration and results of the digital twin are available from the corresponding author upon request.
Acknowledgments
The authors thank the GIDPOT and TelemaTICs research groups of UPTC, the Byte in Design (UNAD) and GREIP (UNIPAZ) groups, and the students linked to the macro-project whose collateral works provided the conceptual model of UCPT, the characterization of technologies and the first versions of the smart modules. During the preparation of this manuscript, the authors used Claude Opus 5.5 (Anthropic) to support editing, text structuring and reference checking. The authors have reviewed and edited the output and take full responsibility for the content of this publication.
Conflicts of Interest
The authors declare no conflicts of interest. The funders had no role in the design of the study; in the collection, analyses, or interpretation of data; in the writing of the manuscript; or in the decision to publish the results.
Abbreviations
The following abbreviations are used in this manuscript:
| ADR | Adaptive Data Rate |
| AHP | Analytic Hierarchy Process |
| API | Application Programming Interface |
| AUP | Agile Unified Process |
| BW | Bandwidth |
| CR | Coding Rate |
| DR | Data Rate (LoRaWAN) |
| DRM | Documentary Research Model |
| ETA | Estimated Time of Arrival |
| GTFS | General Transit Feed Specification |
| CI | Confidence Interval |
| IoT | Internet of Things |
| ITSs | Intelligent Transportation Systems |
| LPWAN | Low-Power Wide-Area Network |
| LTE | Long-Term Evolution |
| MAE/MAPE/RMSE | Mean Absolute Error/Mean Absolute Percentage Error/Root-Mean-Square Error |
| MQTT | Message Queuing Telemetry Transport |
| NOC | Network Operations Centre |
| OSRM | Open-Source Routing Machine |
| OTAA | Over-The-Air Activation |
| PDR | Packet Delivery Ratio |
| PER | Packet Error Rate |
| QoS | Quality of Service |
| RSSI | Received Signal Strength Indicator |
| SD | Standard Deviation |
| SF | Spreading Factor |
| SNR | Signal-to-Noise Ratio |
| SQI | Service Quality Index |
| ToA | Time on Air |
| TTN | The Things Network |
| UCPT | Urban Collective Public Transport |
| UEQ | User Experience Questionnaire |
| UPTC | Universidad Pedagógica y Tecnológica de Colombia |
Appendix A. Structure of the Transmitted Frames
Table A1 details the structure of the frames used in the third phase and in the integrated test. In the i-Bus LoRaWAN frames, the state of one seat travels per message, in rotation; over LTE, the state of all seats is sent in each message. In the third phase, the position was encoded with two decimals (resolution ≈ 1.1 km), sufficient to validate the end-to-end chaining of the frame; in the final version, it was encoded with five decimals (≈1 m) and voltage, current and a device timestamp were added.
Table A1.
Structure of the transmitted frames (decoding verified against the network server decoder) [23].
References
- UN-Habitat. World Cities Report 2022: Envisaging the Future of Cities; United Nations Human Settlements Programme: Nairobi, Kenya, 2022. [Google Scholar]
- Roberts, B.H. Managing Systems of Secondary Cities: Policy Responses in International Development; Cities Alliance/UNOPS: Brussels, Belgium, 2014. [Google Scholar]
- Pojani, D.; Stead, D. Sustainable Urban Transport in the Developing World: Beyond Megacities. Sustainability 2015, 7, 7784–7805. [Google Scholar] [CrossRef] [Scilit]
- Venter, C.; Mahendra, A.; Hidalgo, D. From Mobility to Access for All: Expanding Urban Transportation Choices in the Global South; World Resources Institute: Washington, DC, USA, 2019. [Google Scholar]
- Arellana, J.; Oviedo, D.; Guzman, L.A.; Alvarez, V. Urban Transport Planning and Access Inequalities: A Tale of Two Colombian Cities. Res. Transp. Bus. Manag. 2021, 40, 100554. [Google Scholar] [CrossRef] [Scilit]
- Angarita-Lozano, D.; Hidalgo-Guerrero, D.; Díaz-Márquez, S.; Morales-Puentes, M.; Mendoza-Moreno, M.A. Multidimensional Evaluation Model for Sustainable and Smart Urban Mobility in Global South Cities: A Citizen-Centred Comprehensive Framework. Sustainability 2025, 17, 4684. [Google Scholar] [CrossRef] [Scilit]
- Sdoukopoulos, A.; Pitsiava-Latinopoulou, M.; Basbas, S.; Papaioannou, P. Measuring Progress towards Transport Sustainability through Indicators: Analysis and Metrics of the Main Indicator Initiatives. Transp. Res. Part D Transp. Environ. 2019, 67, 316–333. [Google Scholar] [CrossRef] [Scilit]
- Departamento Nacional de Planeación (DNP). Sistema de Ciudades: Una Política Nacional para el Sistema de Ciudades Colombiano con Visión a Largo Plazo; DNP: Bogotá, Colombia, 2014. (In Spanish) [Google Scholar]
- Ramirez-Guerrero, T.; Toro, M.; Tabares, M.S.; Salazar-Cabrera, R.; Pachón de la Cruz, Á. Key Aspects for IT-Services Integration in Urban Transit Service of Medium-Sized Cities: A Qualitative Exploratory Study in Colombia. Sustainability 2022, 14, 2478. [Google Scholar] [CrossRef] [Scilit]
- Salazar-Cabrera, R.; Pachón de la Cruz, Á.; Madrid Molina, J.M. Proof of Concept of an IoT-Based Public Vehicle Tracking System, Using LoRa (Long Range) and Intelligent Transportation System (ITS) Services. J. Comput. Netw. Commun. 2019, 2019, 9198157. [Google Scholar] [CrossRef] [Scilit]
- Rojas, B.; Bolaños, C.; Salazar-Cabrera, R.; Ramírez-González, G.; Pachón de la Cruz, Á.; Madrid Molina, J.M. Fleet Management and Control System for Medium-Sized Cities Based in Intelligent Transportation Systems: From Review to Proposal in a City. Electronics 2020, 9, 1383. [Google Scholar] [CrossRef] [Scilit]
- Bolaños, C.; Rojas, B.; Salazar-Cabrera, R.; Ramírez-González, G.; Pachón de la Cruz, Á.; Madrid Molina, J.M. Fleet Management and Control System for Developing Countries Implemented with Intelligent Transportation Systems (ITS) Services. Transp. Res. Interdiscip. Perspect. 2022, 16, 100694. [Google Scholar] [CrossRef] [Scilit]
- Boshita, T.; Suzuki, H.; Matsumoto, Y. IoT-Based Bus Location System Using LoRaWAN. In Proceedings of the 2018 21st International Conference on Intelligent Transportation Systems (ITSC), Maui, HI, USA, 4–7 November 2018; pp. 933–938. [Google Scholar] [CrossRef] [Scilit]
- Elijah, O.; Keoh, S.L.; Abdul Rahim, S.K.; Seow, C.K.; Cao, Q.; Sarijari, M.A.; Ibrahim, N.F.; Basuki, A. Transforming Urban Mobility with Internet of Things: Public Bus Fleet Tracking Using Proximity-Based Bluetooth Beacons. Front. Internet Things 2023, 2, 1255995. [Google Scholar] [CrossRef] [Scilit]
- Kamal, M.; Atif, M.; Mujahid, H.; Shanableh, T.; Al-Ali, A.R.; Al Nabulsi, A. IoT Based Smart City Bus Stops. Future Internet 2019, 11, 227. [Google Scholar] [CrossRef] [Scilit]
- Pronello, C.; Anbarasan, D.; Spoturno, F.; Terzolo, G. A Low-Cost Automatic People-Counting System at Bus Stops Using Wi-Fi Probe Requests and Deep Learning. Public Transp. 2025, 17, 71–100. [Google Scholar] [CrossRef] [Scilit]
- Williams, S.; White, A.; Waiganjo, P.; Orwa, D.; Klopp, J. The Digital Matatu Project: Using Cell Phones to Create an Open Source Data for Nairobi’s Semi-Formal Bus System. J. Transp. Geogr. 2015, 49, 39–51. [Google Scholar] [CrossRef] [Scilit]
- Di Renzone, G.; Parrino, S.; Peruzzi, G.; Pozzebon, A.; Vangelista, L. LoRaWAN for Vehicular Networking: Field Tests for Vehicle-to-Roadside Communication. Sensors 2024, 24, 1801. [Google Scholar] [CrossRef] [Scilit]
- Patel, D.; Won, M. Experimental Study on Low Power Wide Area Networks (LPWAN) for Mobile Internet of Things. In Proceedings of the 2017 IEEE 85th Vehicular Technology Conference (VTC Spring), Sydney, Australia, 4–7 June 2017; pp. 1–5. [Google Scholar] [CrossRef] [Scilit]
- Bautista Gaona, J.E. Orquestación de Servicios para la Provisión de Funcionalidades Inteligentes en el Sistema TPCU de Ciudades Intermedias. Master’s Thesis, Universidad Pedagógica y Tecnológica de Colombia, Sogamoso, Colombia, 2025. (In Spanish) [Google Scholar]
- Callejas Ochoa, J.A. Sistema Telemático para la Comunicación Edge-Cloud dentro de la Arquitectura IoT para el STPCU de una Ciudad Intermedia. Master’s Thesis, Universidad Pedagógica y Tecnológica de Colombia, Sogamoso, Colombia, 2025. (In Spanish) [Google Scholar]
- Archila Amaya, J.P. Desarrollo de Funcionalidades Relacionadas con Indicadores de Ciudades Inteligentes, Sostenibles y Receptivas en el Sistema de Información iBUS. Bachelor’s Thesis, Universidad Pedagógica y Tecnológica de Colombia, Tunja, Colombia, 2026. (In Spanish) [Google Scholar]
- Callejas Ochoa, J.A.; Mendoza-Moreno, M.A.; Archila Amaya, J.P.; Bautista Gaona, J.E. MueveT LoRaWAN Field Data—Tunja, Colombia (Dataset, CC BY 4.0). Available online: https://github.com/jhoncallejas01/muevet-lorawan-field-data (accessed on 2 November 2026).
- Albino, V.; Berardi, U.; Dangelico, R.M. Smart Cities: Definitions, Dimensions, Performance, and Initiatives. J. Urban Technol. 2015, 22, 3–21. [Google Scholar] [CrossRef] [Scilit]
- Caragliu, A.; Del Bo, C.; Nijkamp, P. Smart Cities in Europe. J. Urban Technol. 2011, 18, 65–82. [Google Scholar] [CrossRef] [Scilit]
- Bibri, S.E.; Krogstie, J. Smart Sustainable Cities of the Future: An Extensive Interdisciplinary Literature Review. Sustain. Cities Soc. 2017, 31, 183–212. [Google Scholar] [CrossRef] [Scilit]
- Kitchin, R. The Real-Time City? Big Data and Smart Urbanism. GeoJournal 2014, 79, 1–14. [Google Scholar] [CrossRef] [Scilit]
- Goldsmith, S.; Crawford, S. The Responsive City: Engaging Communities Through Data-Smart Governance; Jossey-Bass: San Francisco, CA, USA, 2014. [Google Scholar]
- Lyons, G. Getting Smart about Urban Mobility—Aligning the Paradigms of Smart and Sustainable. Transp. Res. Part A Policy Pract. 2018, 115, 4–14. [Google Scholar] [CrossRef] [Scilit]
- Angarita-Lozano, D.L.; Díaz-Márquez, S.E.; Morales-Puentes, M.E. Sustainable and Smart Mobility Evaluation since Citizen Participation in Responsive Cities. Transp. Res. Procedia 2021, 58, 519–526. [Google Scholar] [CrossRef] [Scilit]
- Cirolia, L.R.; Harber, J.; Croese, S. Governing Mobility in Sub-Saharan African Cities; Volvo Research and Educational Foundations (VREF): Gothenburg, Sweden, 2020. [Google Scholar]
- Oviedo Hernandez, D.; Dávila, J.D. Transport, Urban Development and the Peripheral Poor in Colombia—Placing Splintering Urbanism in the Context of Transport Networks. J. Transp. Geogr. 2016, 51, 180–192. [Google Scholar] [CrossRef] [Scilit]
- Diderot, C.D.; Bernice, N.W.A.; Tchappi, I.; Mualla, Y.; Najjar, A.; Galland, S. Intelligent Transportation Systems in Developing Countries: Challenges and Prospects. Procedia Comput. Sci. 2023, 224, 215–222. [Google Scholar] [CrossRef] [Scilit]
- Departamento Administrativo Nacional de Estadística (DANE). Proyecciones y Retroproyecciones de Población Municipal para el Periodo 1985–2019 y 2020–2035 con Base en el CNPV 2018; DANE: Bogotá, Colombia, 2023. (In Spanish) [Google Scholar]
- Departamento Administrativo Nacional de Estadística (DANE). Encuesta de Transporte Urbano de Pasajeros (ETUP). 2026. Available online: https://www.dane.gov.co/index.php/ (accessed on 2 November 2026). (In Spanish)
- Vizcaya Gamboa, N.A. Modelo Conceptual del TPCU de Ciudades Intermedias, Basado en la Teoría General de Sistemas. Bachelor’s Thesis, Universidad Pedagógica y Tecnológica de Colombia, Tunja, Colombia, 2024. (In Spanish) [Google Scholar]
- Augustin, A.; Yi, J.; Clausen, T.; Townsley, W.M. A Study of LoRa: Long Range & Low Power Networks for the Internet of Things. Sensors 2016, 16, 1466. [Google Scholar] [CrossRef] [Scilit]
- Bonilla, V.; Campoverde, B.; Yoo, S.G. A Systematic Literature Review of LoRaWAN: Sensors and Applications. Sensors 2023, 23, 8440. [Google Scholar] [CrossRef] [Scilit]
- Al-Fuqaha, A.; Guizani, M.; Mohammadi, M.; Aledhari, M.; Ayyash, M. Internet of Things: A Survey on Enabling Technologies, Protocols, and Applications. IEEE Commun. Surv. Tutor. 2015, 17, 2347–2376. [Google Scholar] [CrossRef] [Scilit]
- Shi, W.; Cao, J.; Zhang, Q.; Li, Y.; Xu, L. Edge Computing: Vision and Challenges. IEEE Internet Things J. 2016, 3, 637–646. [Google Scholar] [CrossRef] [Scilit]
- Kuo, Y.-H.; Leung, J.M.Y.; Yan, Y. Public Transport for Smart Cities: Recent Innovations and Future Challenges. Eur. J. Oper. Res. 2023, 306, 1001–1026. [Google Scholar] [CrossRef] [Scilit]
- Elassy, M.; Al-Hattab, M.; Takruri, M.; Badawi, S. Intelligent Transportation Systems for Sustainable Smart Cities. Transp. Eng. 2024, 16, 100252. [Google Scholar] [CrossRef] [Scilit]
- Sumalee, A.; Ho, H.W. Smarter and More Connected: Future Intelligent Transportation System. IATSS Res. 2018, 42, 67–71. [Google Scholar] [CrossRef] [Scilit]
- Macedo, E.; Cova, P.; Camacho, R.; Rodrigues, J.; Pinho, M.; Bandeira, J.M. Real-Time Information Systems for Public Transport: User Perspective. Transp. Res. Procedia 2021, 52, 732–739. [Google Scholar] [CrossRef] [Scilit]
- Bruglieri, M.; Bruschi, F.; Colorni, A.; Luè, A.; Nocerino, R.; Rana, V. A Real-Time Information System for Public Transport in Case of Delays and Service Disruptions. Transp. Res. Procedia 2015, 10, 493–502. [Google Scholar] [CrossRef] [Scilit]
- Ferris, B.; Watkins, K.; Borning, A. OneBusAway: Results from Providing Real-Time Arrival Information for Public Transit. In Proceedings of the SIGCHI Conference on Human Factors in Computing Systems (CHI ’10), Atlanta, GA, USA, 10–15 April 2010; pp. 1807–1816. [Google Scholar] [CrossRef] [Scilit]
- Watkins, K.E.; Ferris, B.; Borning, A.; Rutherford, G.S.; Layton, D. Where Is My Bus? Impact of Mobile Real-Time Information on the Perceived and Actual Wait Time of Transit Riders. Transp. Res. Part A Policy Pract. 2011, 45, 839–848. [Google Scholar] [CrossRef] [Scilit]
- Eswar, M.; Titus Manohar, A.; Mani, A. Fleet Management of Public Transportation Using Internet of Things. Int. J. Eng. Technol. 2018, 7, 388–391. [Google Scholar] [CrossRef] [Scilit]
- Lushi, A.; Daas, D.; Nadeem, M. IoT-Based Public Transport Management System. In Proceedings of the 2022 IEEE Global Conference on Artificial Intelligence and Internet of Things (GCAIoT), Alamein New City, Egypt, 18–21 December 2022; pp. 69–75. [Google Scholar] [CrossRef] [Scilit]
- Angarita-Lozano, D.; Rodríguez-Hernández, A.; Mendoza-Moreno, M.; Díaz-Márquez, S.; Morales-Puentes, M. Responsive Mobility (Evaluación de la Movilidad), Version 1.0. Available online: https://www.responsivemobility.com (accessed on 2 November 2026). (In Spanish)
- Ministerio de Tecnologías de la Información y las Comunicaciones (MinTIC). Modelo de Medición de Madurez de Ciudades y Territorios Inteligentes para Colombia; MinTIC: Bogotá, Colombia, 2021. (In Spanish)
- Page, M.J.; McKenzie, J.E.; Bossuyt, P.M.; Boutron, I.; Hoffmann, T.C.; Mulrow, C.D.; Shamseer, L.; Tetzlaff, J.M.; Akl, E.A.; Brennan, S.E.; et al. The PRISMA 2020 Statement: An Updated Guideline for Reporting Systematic Reviews. BMJ 2021, 372, n71. [Google Scholar] [CrossRef] [Scilit]
- Grant, M.J.; Booth, A. A Typology of Reviews: An Analysis of 14 Review Types and Associated Methodologies. Health Inf. Libr. J. 2009, 26, 91–108. [Google Scholar] [CrossRef] [Scilit]
- IEEE Std 830-1998; IEEE Recommended Practice for Software Requirements Specifications. IEEE: New York, NY, USA, 1998.
- Brown, S. The C4 Model for Visualising Software Architecture. Available online: https://c4model.com (accessed on 2 November 2026).
- Schwaber, K.; Sutherland, J. The Scrum Guide: The Definitive Guide to Scrum: The Rules of the Game; Scrum.org: Boston, MA, USA, 2020. [Google Scholar]
- Laugwitz, B.; Held, T.; Schrepp, M. Construction and Evaluation of a User Experience Questionnaire. In HCI and Usability for Education and Work; Holzinger, A., Ed.; Lecture Notes in Computer Science; Springer: Berlin/Heidelberg, Germany, 2008; Volume 5298, pp. 63–76. [Google Scholar] [CrossRef] [Scilit]
- LoRa Alliance. RP002-1.0.4 LoRaWAN® Regional Parameters; LoRa Alliance: Fremont, CA, USA, 2022. [Google Scholar]
- Agencia Nacional del Espectro (ANE). Resolución 105 de 2020, por medio de la cual se planea y atribuye el espectro radioeléctrico en Colombia (Cuadro Nacional de Atribución de Bandas de Frecuencias); ANE: Bogotá, Colombia, 2020. (In Spanish) [Google Scholar]
- Agencia Nacional del Espectro (ANE). Resolución 711 de 2016, por la cual se establecen las bandas de frecuencia de libre utilización dentro del territorio nacional; ANE: Bogotá, Colombia, 2016. (In Spanish) [Google Scholar]
- The Things Network. Duty Cycle and Fair Use Policy. Available online: https://www.thethingsnetwork.org/docs/lorawan/duty-cycle/ (accessed on 2 November 2026).
- Angarita-Lozano, D.; Téllez Triana, J.; Mendoza-Moreno, M.A.; Rojas Alvarado, B. iBUS, Sistema de Información para el Transporte Público Colectivo Urbano; Certificado de Registro de Soporte Lógico; Dirección Nacional de Derecho de Autor: Bogotá, Colombia, 2024. (In Spanish) [Google Scholar]
- Luxen, D.; Vetter, C. Real-Time Routing with OpenStreetMap Data. In Proceedings of the 19th ACM SIGSPATIAL International Conference on Advances in Geographic Information Systems, Chicago, IL, USA, 1–4 November 2011; pp. 513–516. [Google Scholar] [CrossRef] [Scilit]
- Naik, N. Choice of Effective Messaging Protocols for IoT Systems: MQTT, CoAP, AMQP and HTTP. In Proceedings of the 2017 IEEE International Systems Engineering Symposium (ISSE), Vienna, Austria, 11–13 October 2017; pp. 1–7. [Google Scholar] [CrossRef] [Scilit]
- Sinnott, R.W. Virtues of the Haversine. Sky Telesc. 1984, 68, 159. [Google Scholar]
- Fagan, D.; Meier, R. Intelligent Time of Arrival Estimation. In Proceedings of the 2011 IEEE Forum on Integrated and Sustainable Transportation Systems, Vienna, Austria, 29 June–1 July 2011; pp. 60–66. [Google Scholar] [CrossRef] [Scilit]
- Shalaby, A.; Farhan, A. Prediction Model of Bus Arrival and Departure Times Using AVL and APC Data. J. Public Transp. 2004, 7, 41–61. [Google Scholar] [CrossRef] [Scilit]
- Kumar, B.A.; Vanajakshi, L.; Subramanian, S.C. A Hybrid Model Based Method for Bus Travel Time Estimation. J. Intell. Transp. Syst. 2018, 22, 390–406. [Google Scholar] [CrossRef] [Scilit]
- Yang, M.; Chen, C.; Wang, L.; Yan, X.; Zhou, L. Bus Arrival Time Prediction Using Support Vector Machine with Genetic Algorithm. Neural Netw. World 2016, 26, 205–217. [Google Scholar] [CrossRef] [Scilit]
- Eboli, L.; Mazzulla, G. A Methodology for Evaluating Transit Service Quality Based on Subjective and Objective Measures from the Passenger’s Point of View. Transp. Policy 2011, 18, 172–181. [Google Scholar] [CrossRef] [Scilit]
- dell’Olio, L.; Ibeas, A.; Cecin, P. The Quality of Service Desired by Public Transport Users. Transp. Policy 2011, 18, 217–227. [Google Scholar] [CrossRef] [Scilit]
- Tao, F.; Zhang, H.; Liu, A.; Nee, A.Y.C. Digital Twin in Industry: State-of-the-Art. IEEE Trans. Ind. Inform. 2019, 15, 2405–2415. [Google Scholar] [CrossRef] [Scilit]
- Bor, M.C.; Roedig, U.; Voigt, T.; Alonso, J.M. Do LoRa Low-Power Wide-Area Networks Scale? In Proceedings of the 19th ACM International Conference on Modeling, Analysis and Simulation of Wireless and Mobile Systems (MSWiM ’16), Valletta, Malta, 13–17 November 2016; pp. 59–67. [Google Scholar] [CrossRef] [Scilit]
- Kaul, S.; Yates, R.; Gruteser, M. Real-Time Status: How Often Should One Update? In Proceedings of the 2012 IEEE INFOCOM, Orlando, FL, USA, 25–30 March 2012; pp. 2731–2735. [Google Scholar] [CrossRef] [Scilit]
- Sánchez Díaz, C.A.; Díaz Lucio, A.S.; Salazar-Cabrera, R.; Pachón de la Cruz, Á.; Madrid Molina, J.M. Prototype of a System for Tracking Transit Service Based on IoV, ITS, and Machine Learning. World Electr. Veh. J. 2023, 14, 261. [Google Scholar] [CrossRef] [Scilit]
- Kumari, M.; Kumar, A.; Khan, A. IoT Based Intelligent Real-Time System for Bus Tracking and Monitoring. In Proceedings of the 2020 International Conference on Power Electronics & IoT Applications in Renewable Energy and its Control (PARC), Mathura, India, 28–29 February 2020; pp. 226–230. [Google Scholar] [CrossRef] [Scilit]
- Arman, A.; Badii, C.; Bellini, P.; Bilotta, S.; Nesi, P.; Paolucci, M. Analyzing Demand with Respect to Offer of Mobility. Appl. Sci. 2022, 12, 8982. [Google Scholar] [CrossRef] [Scilit]
- Huertas, J.I.; Stöffler, S.; Fernández, T.; García, X.; Castañeda, R.; Serrano-Guevara, O.; Mogro, A.E.; Alvarado, D.A. Methodology to Assess Sustainable Mobility in LATAM Cities. Appl. Sci. 2021, 11, 9592. [Google Scholar] [CrossRef] [Scilit]
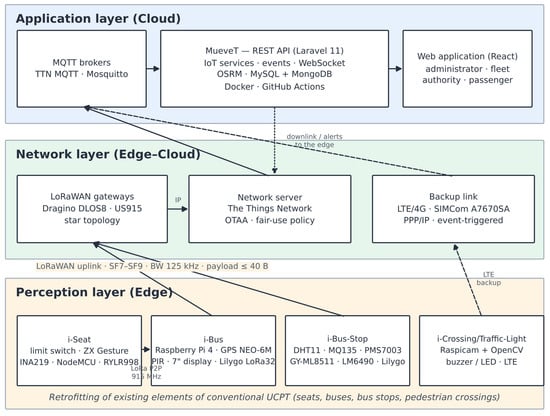
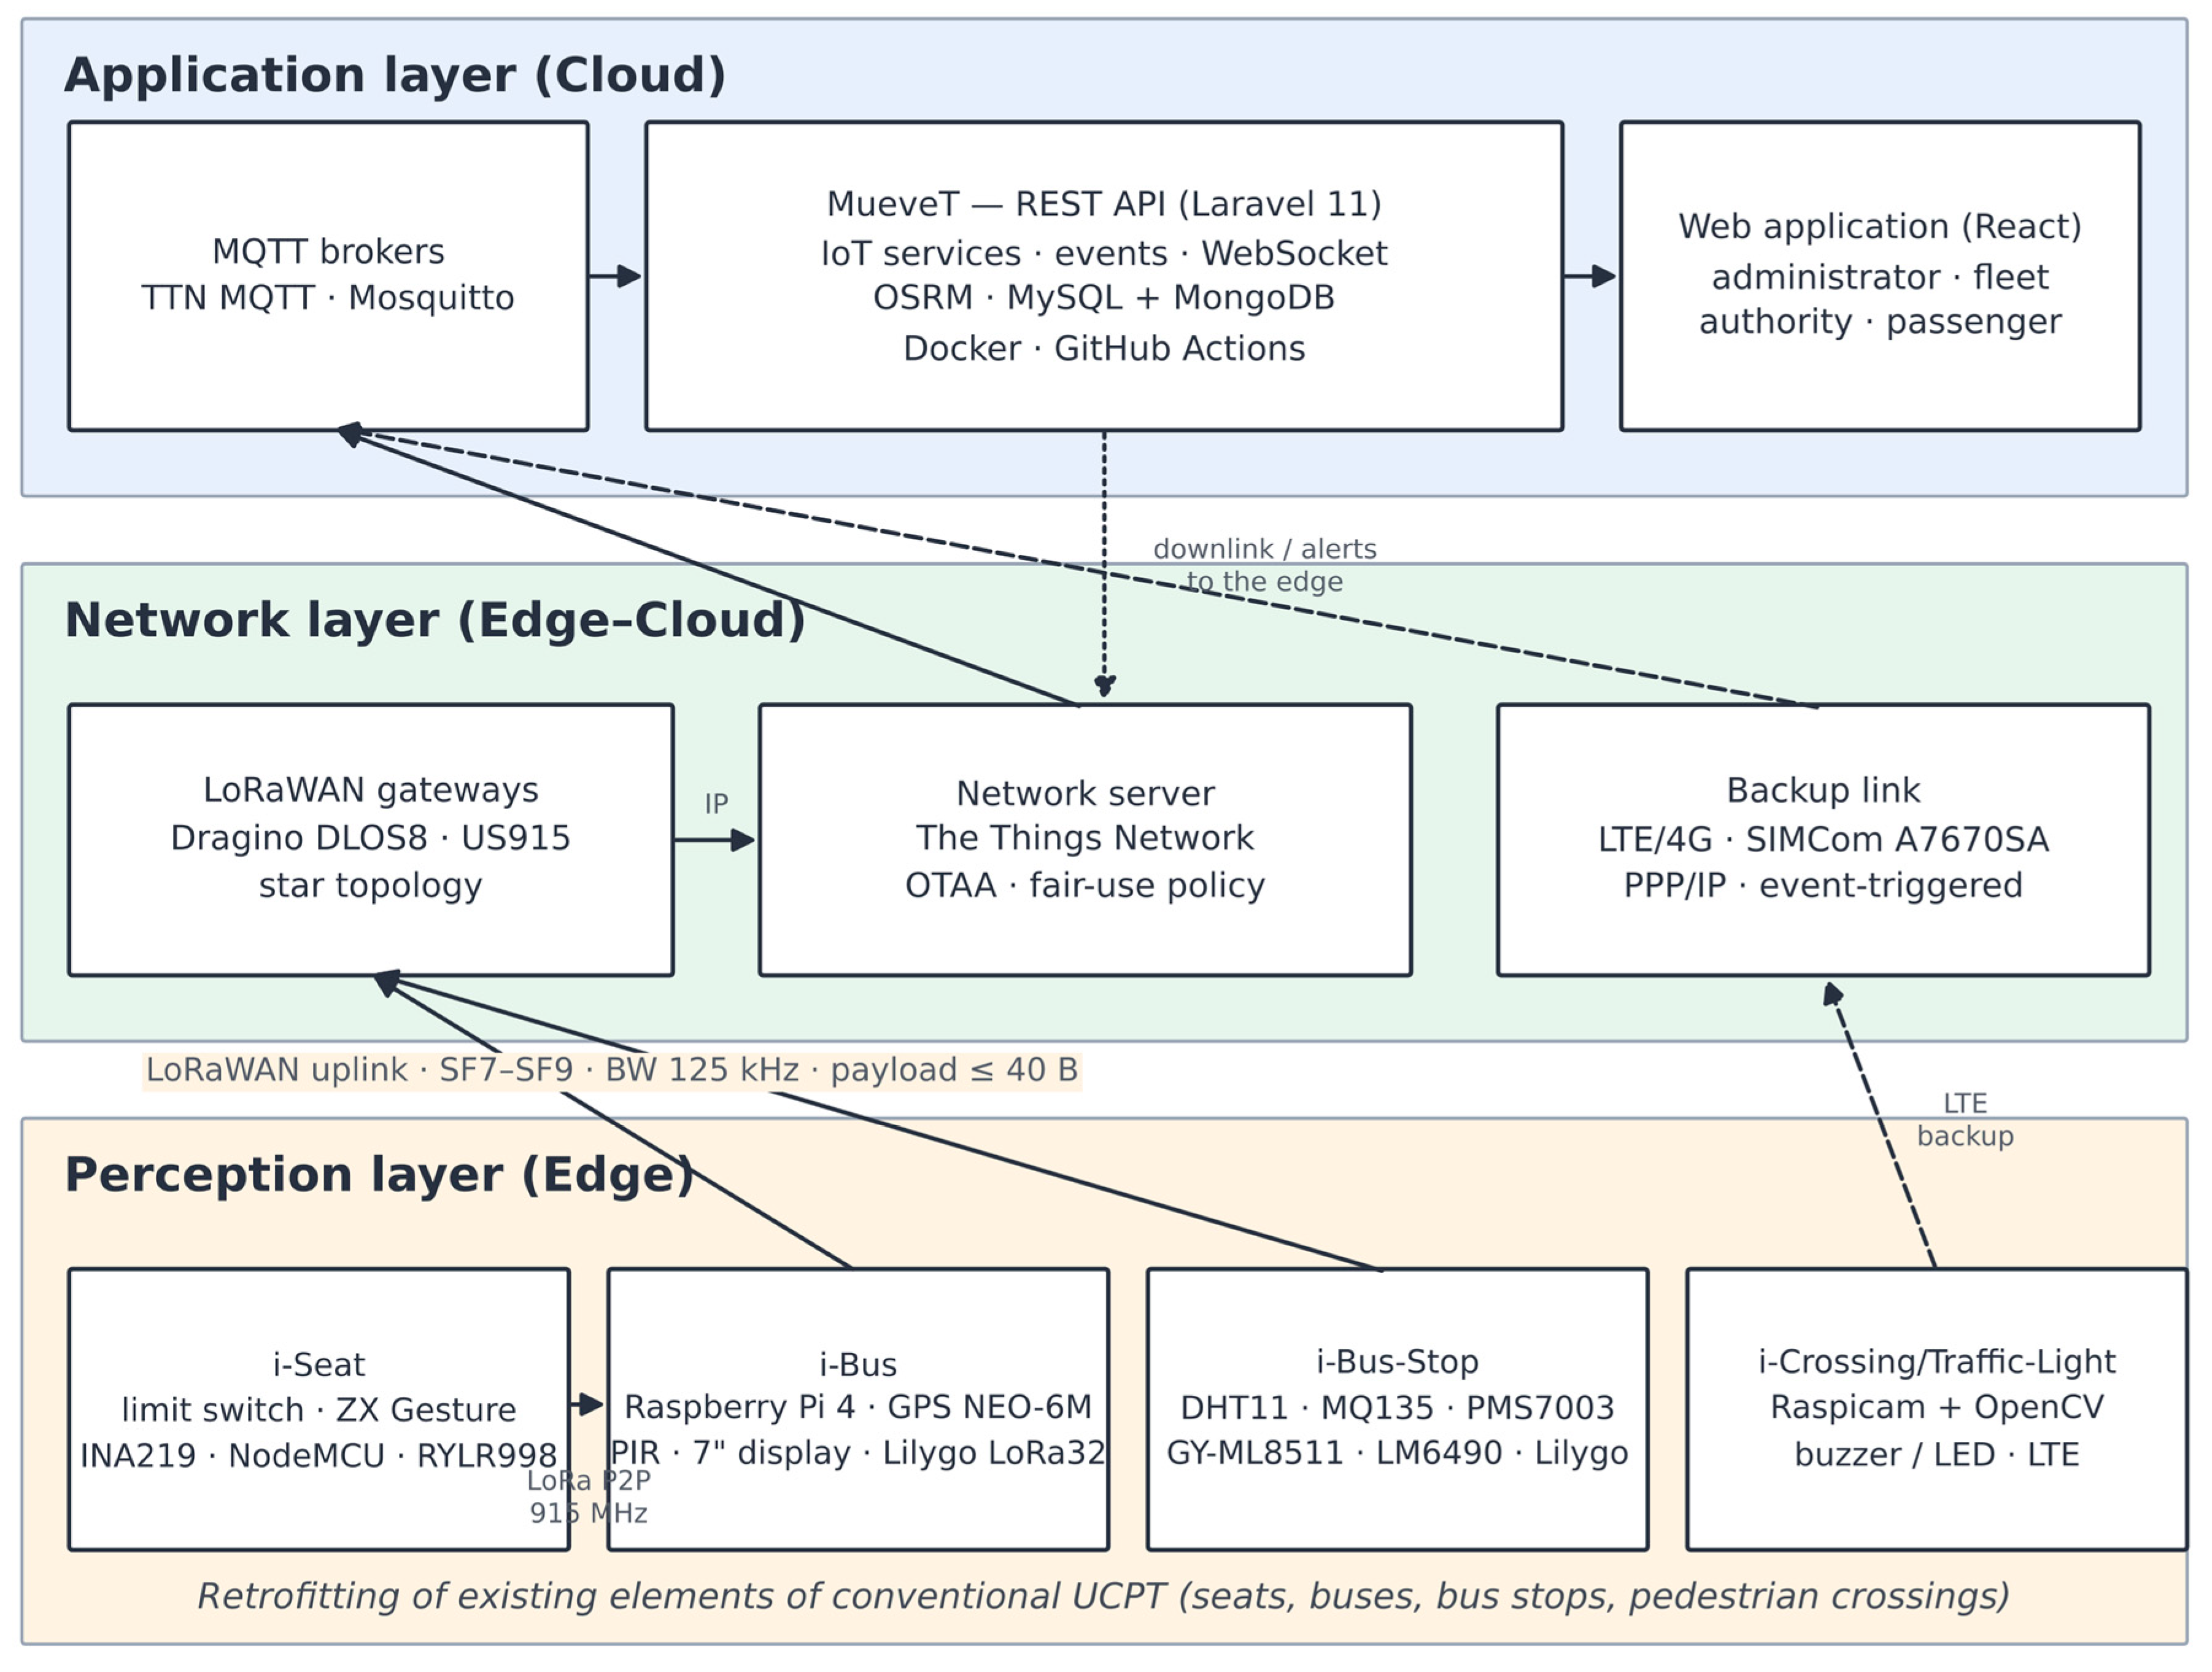
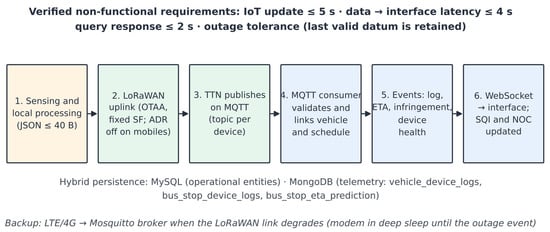
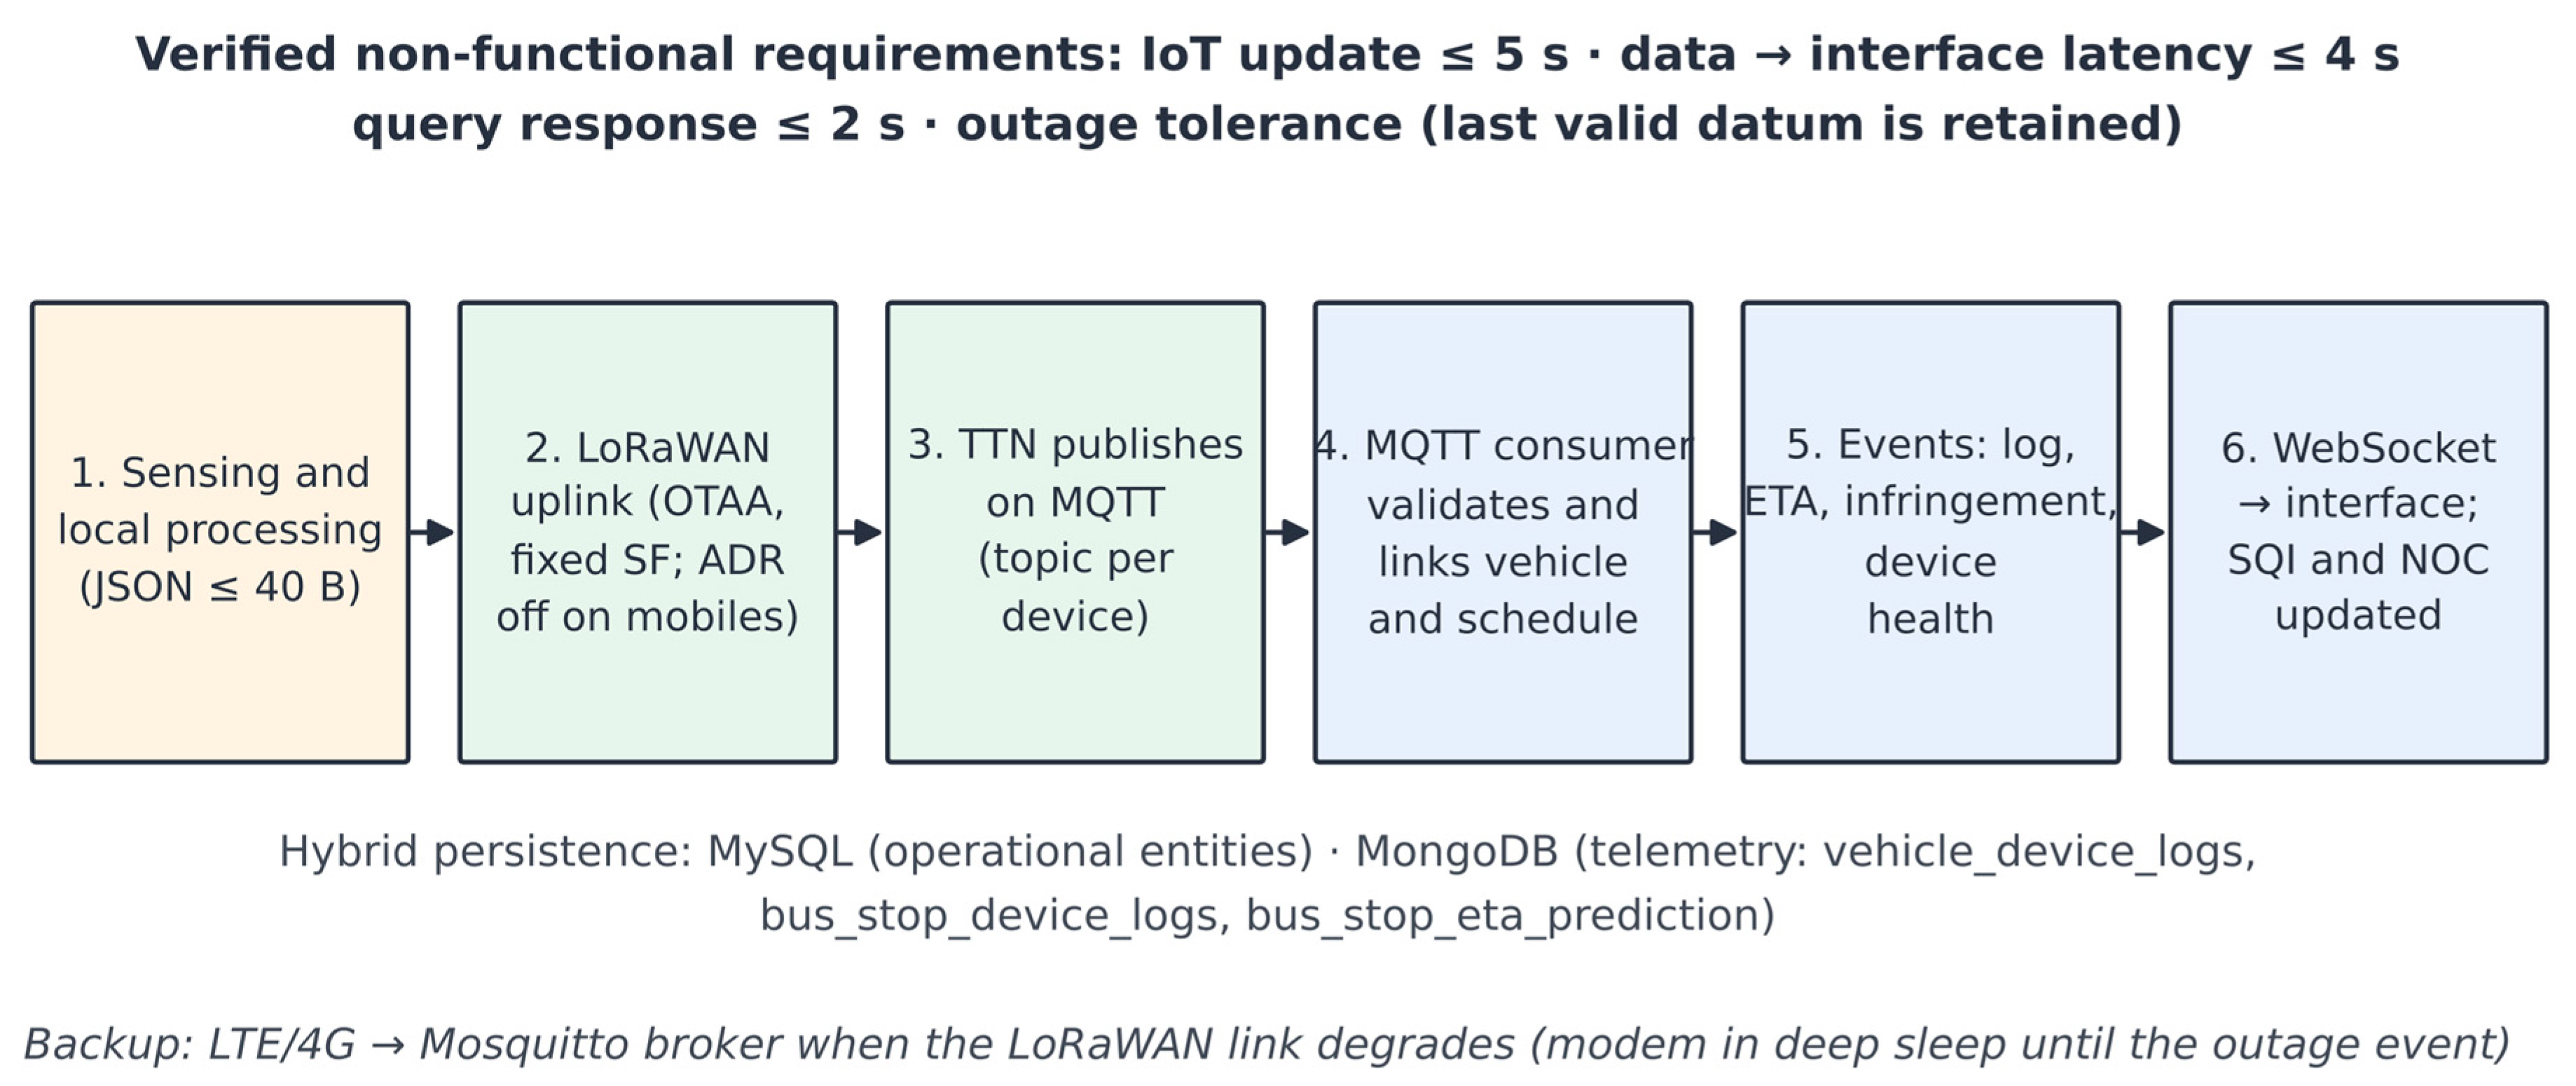
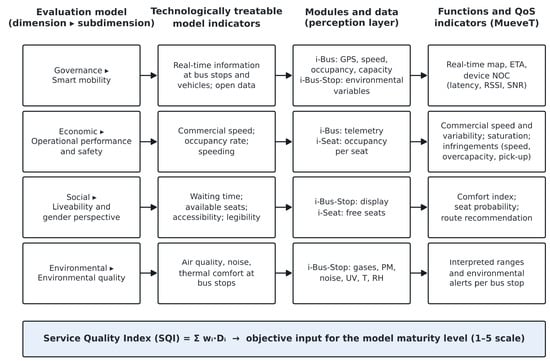
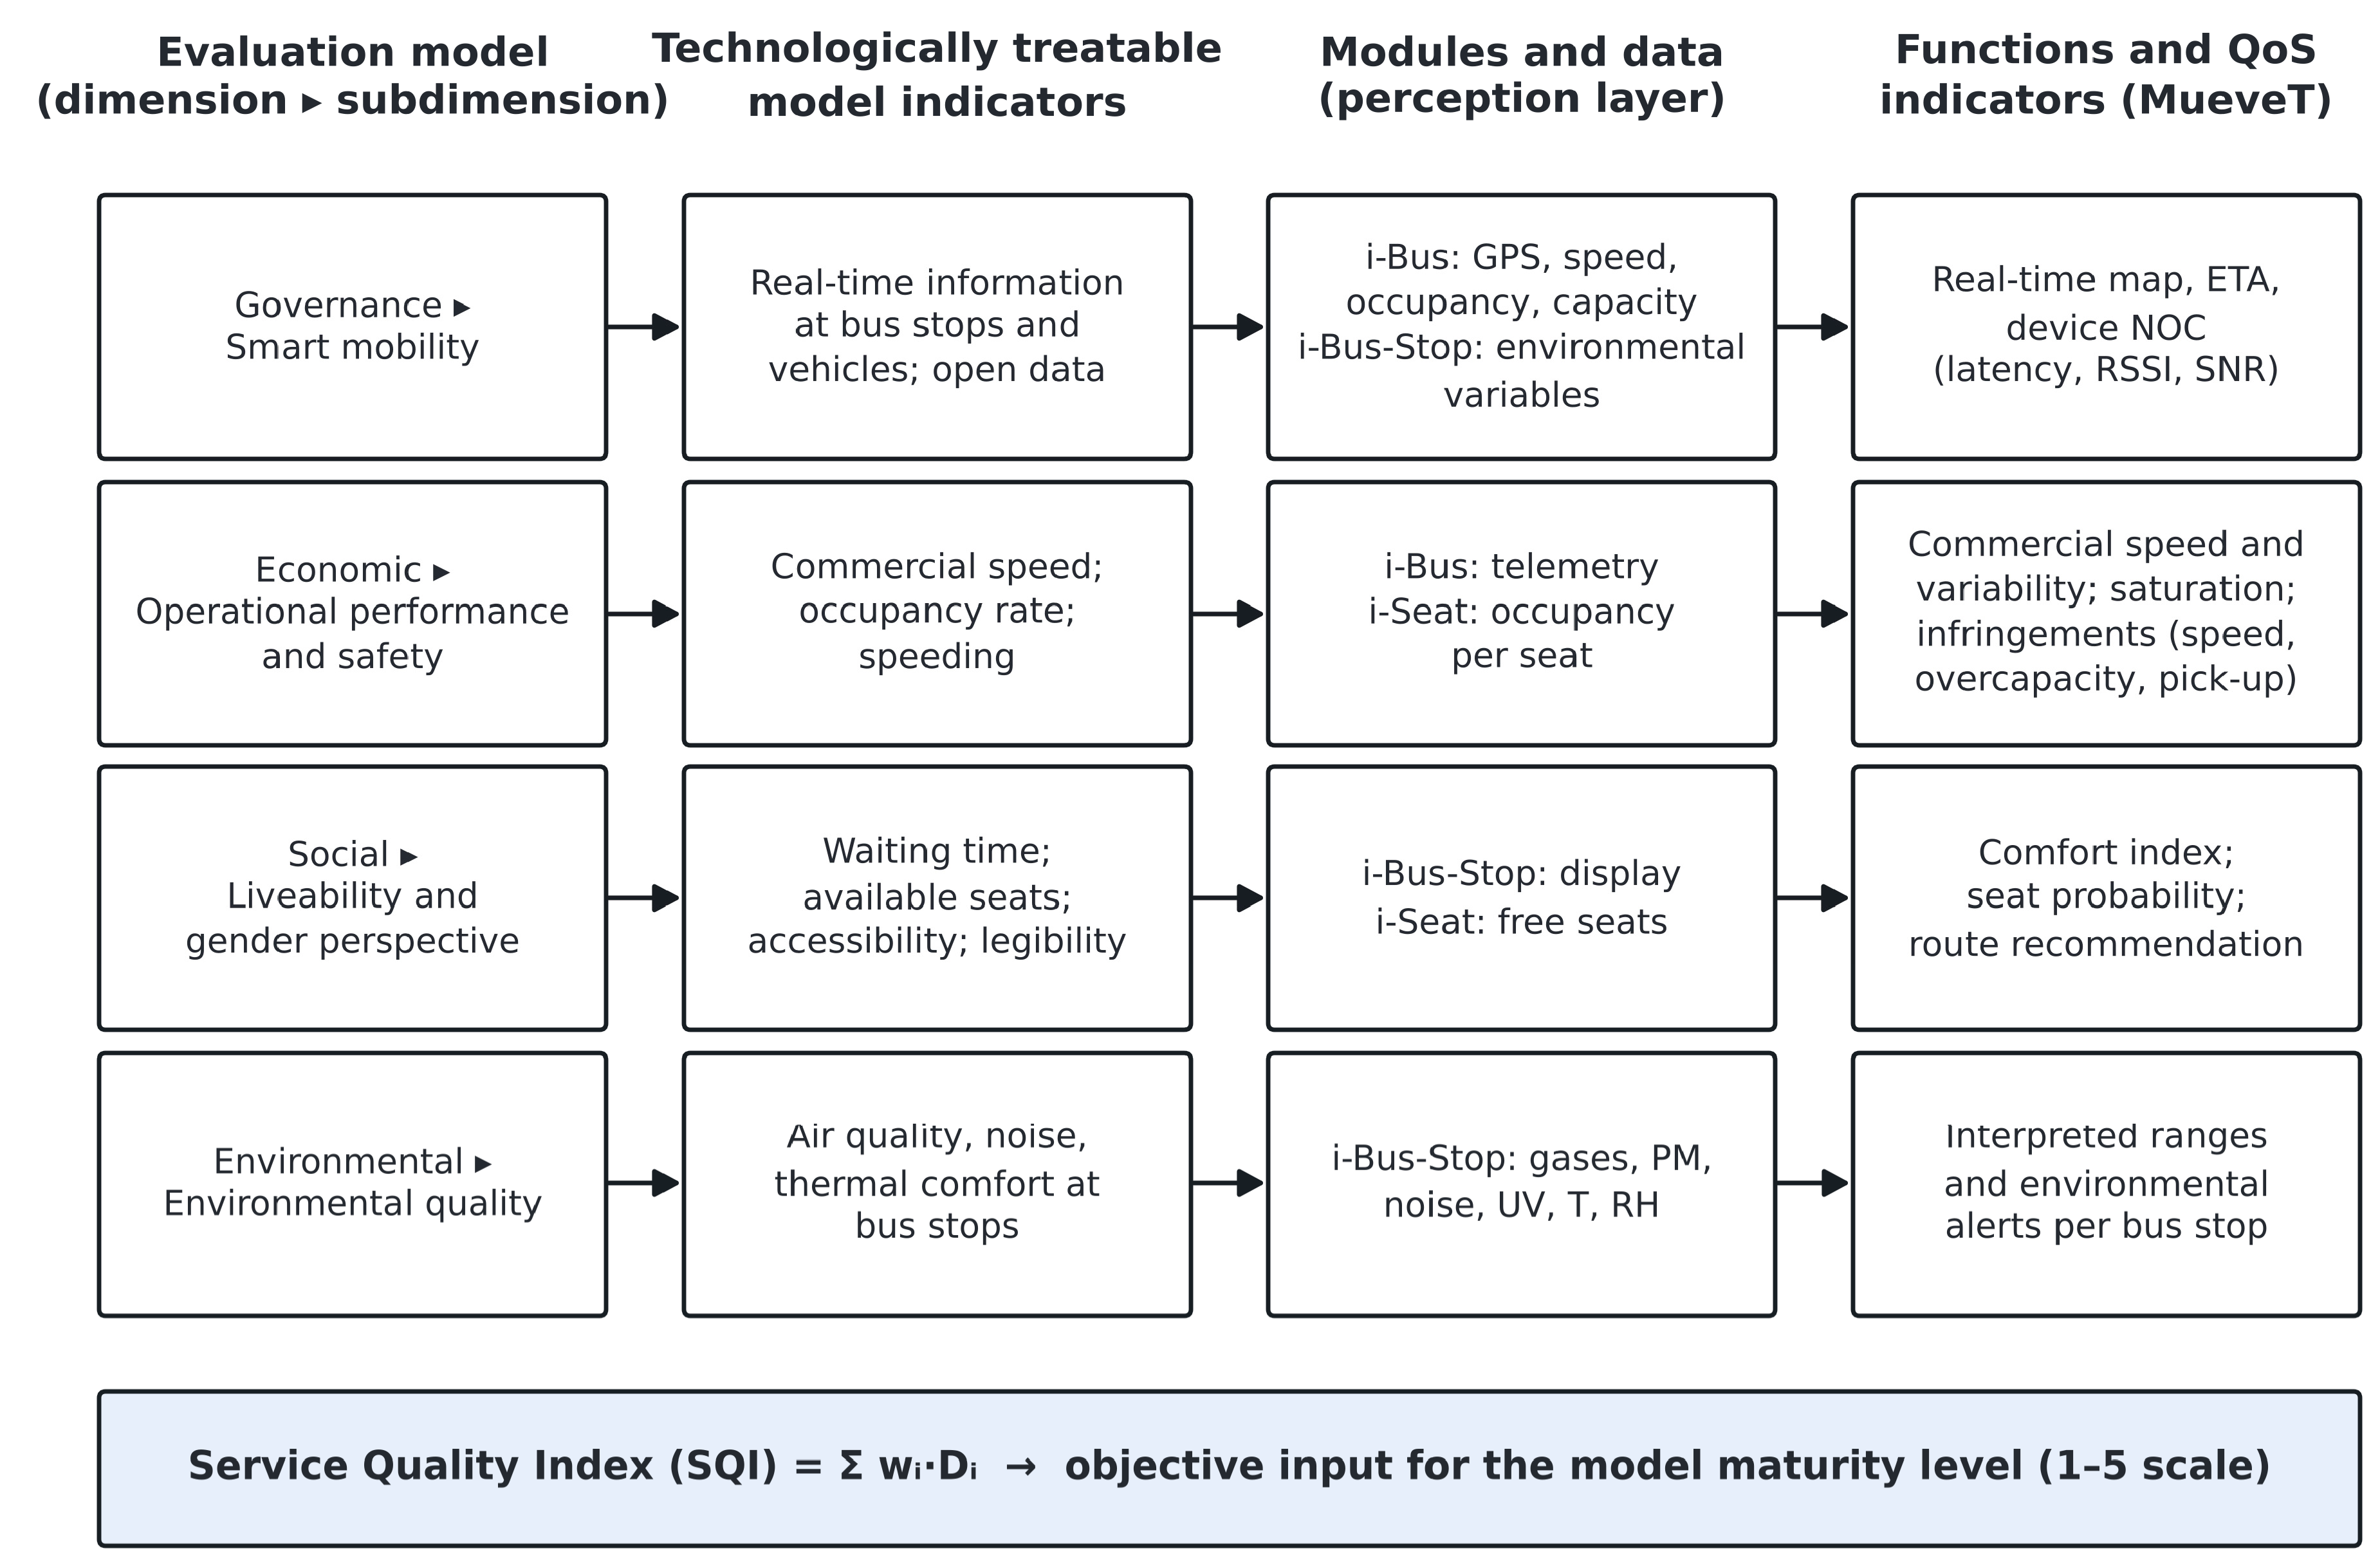
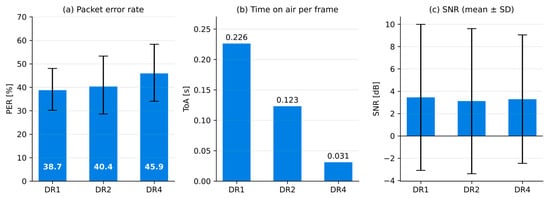
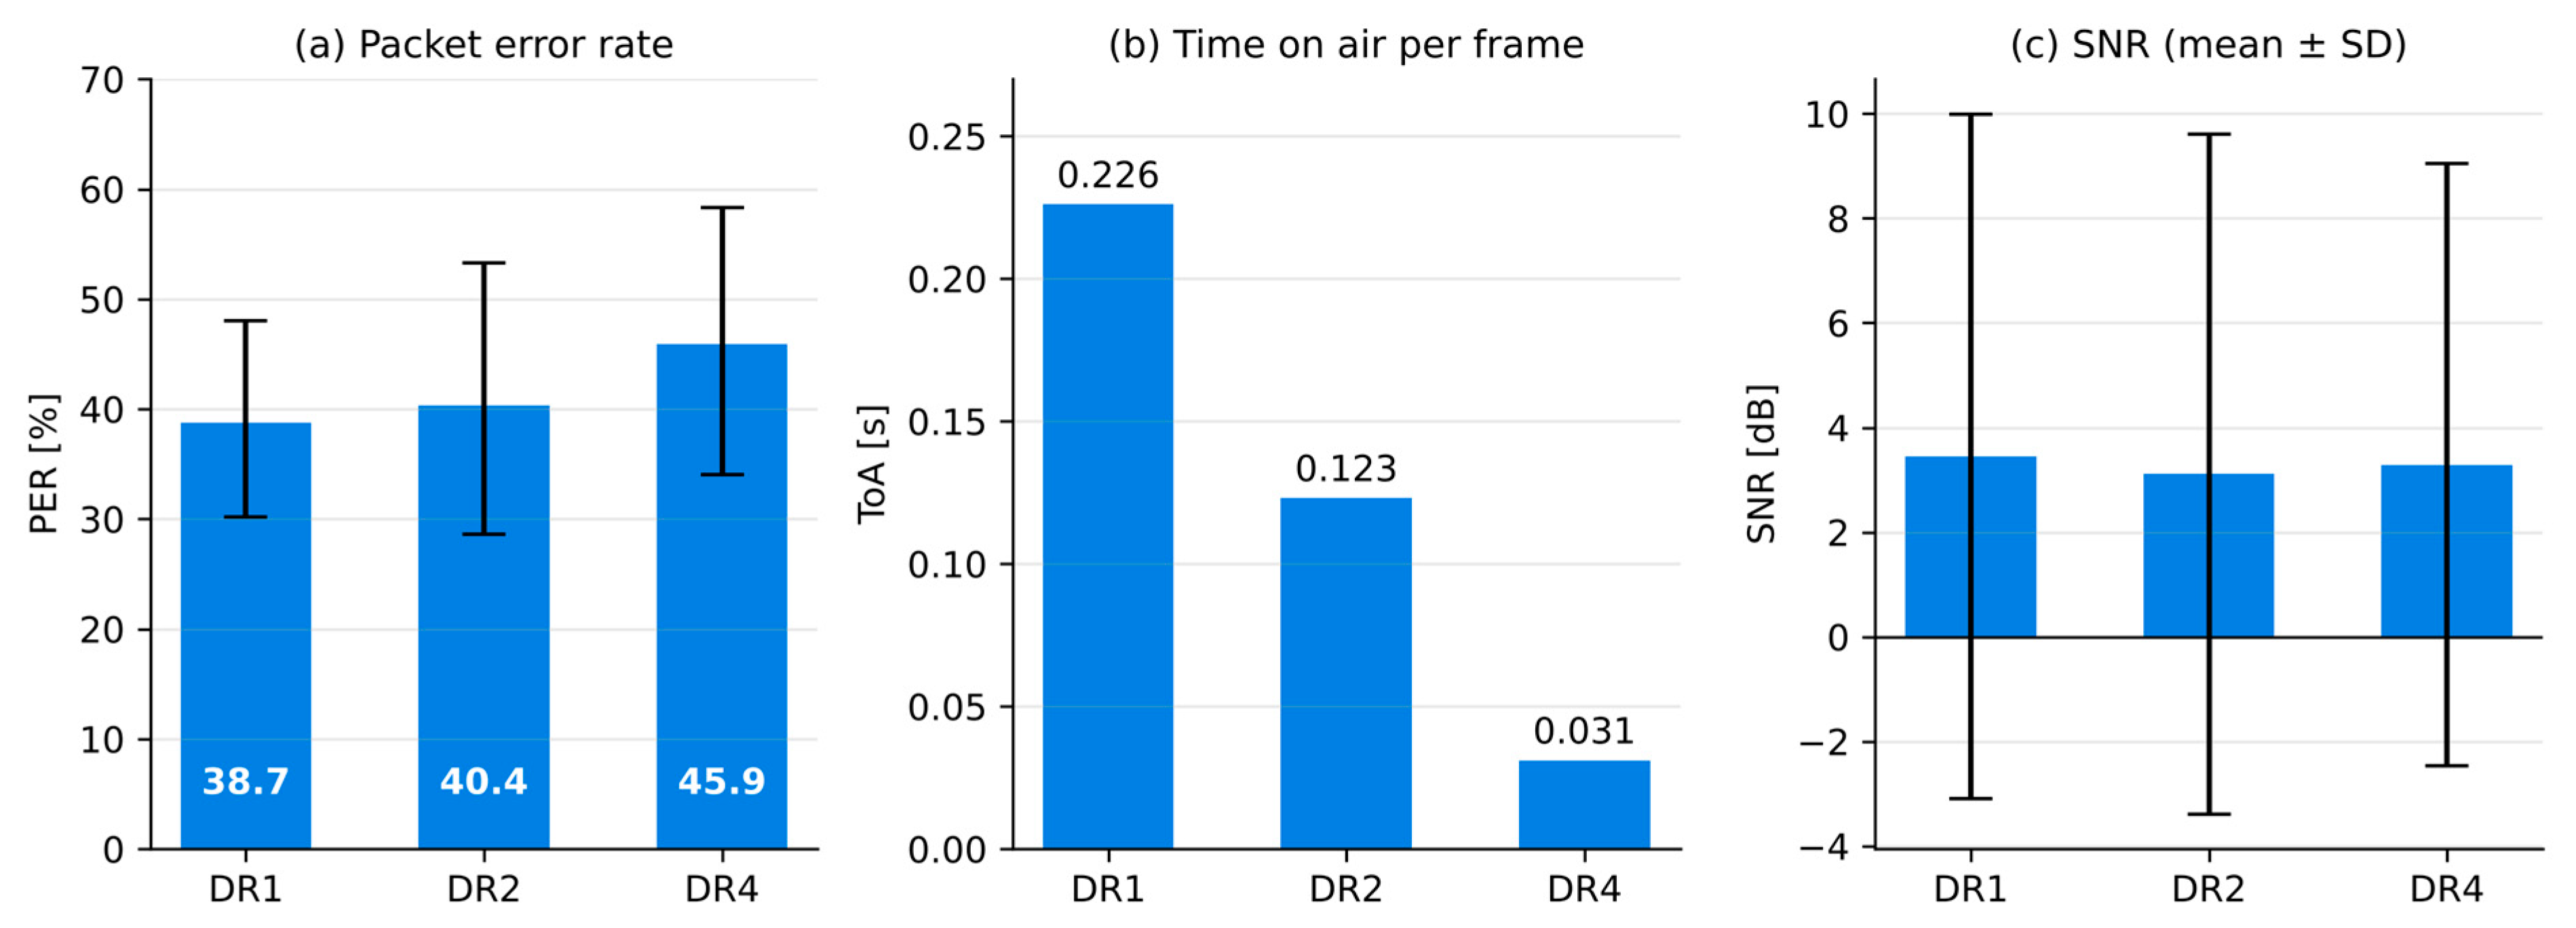
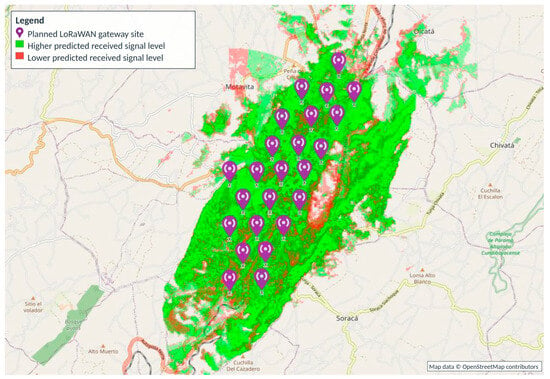
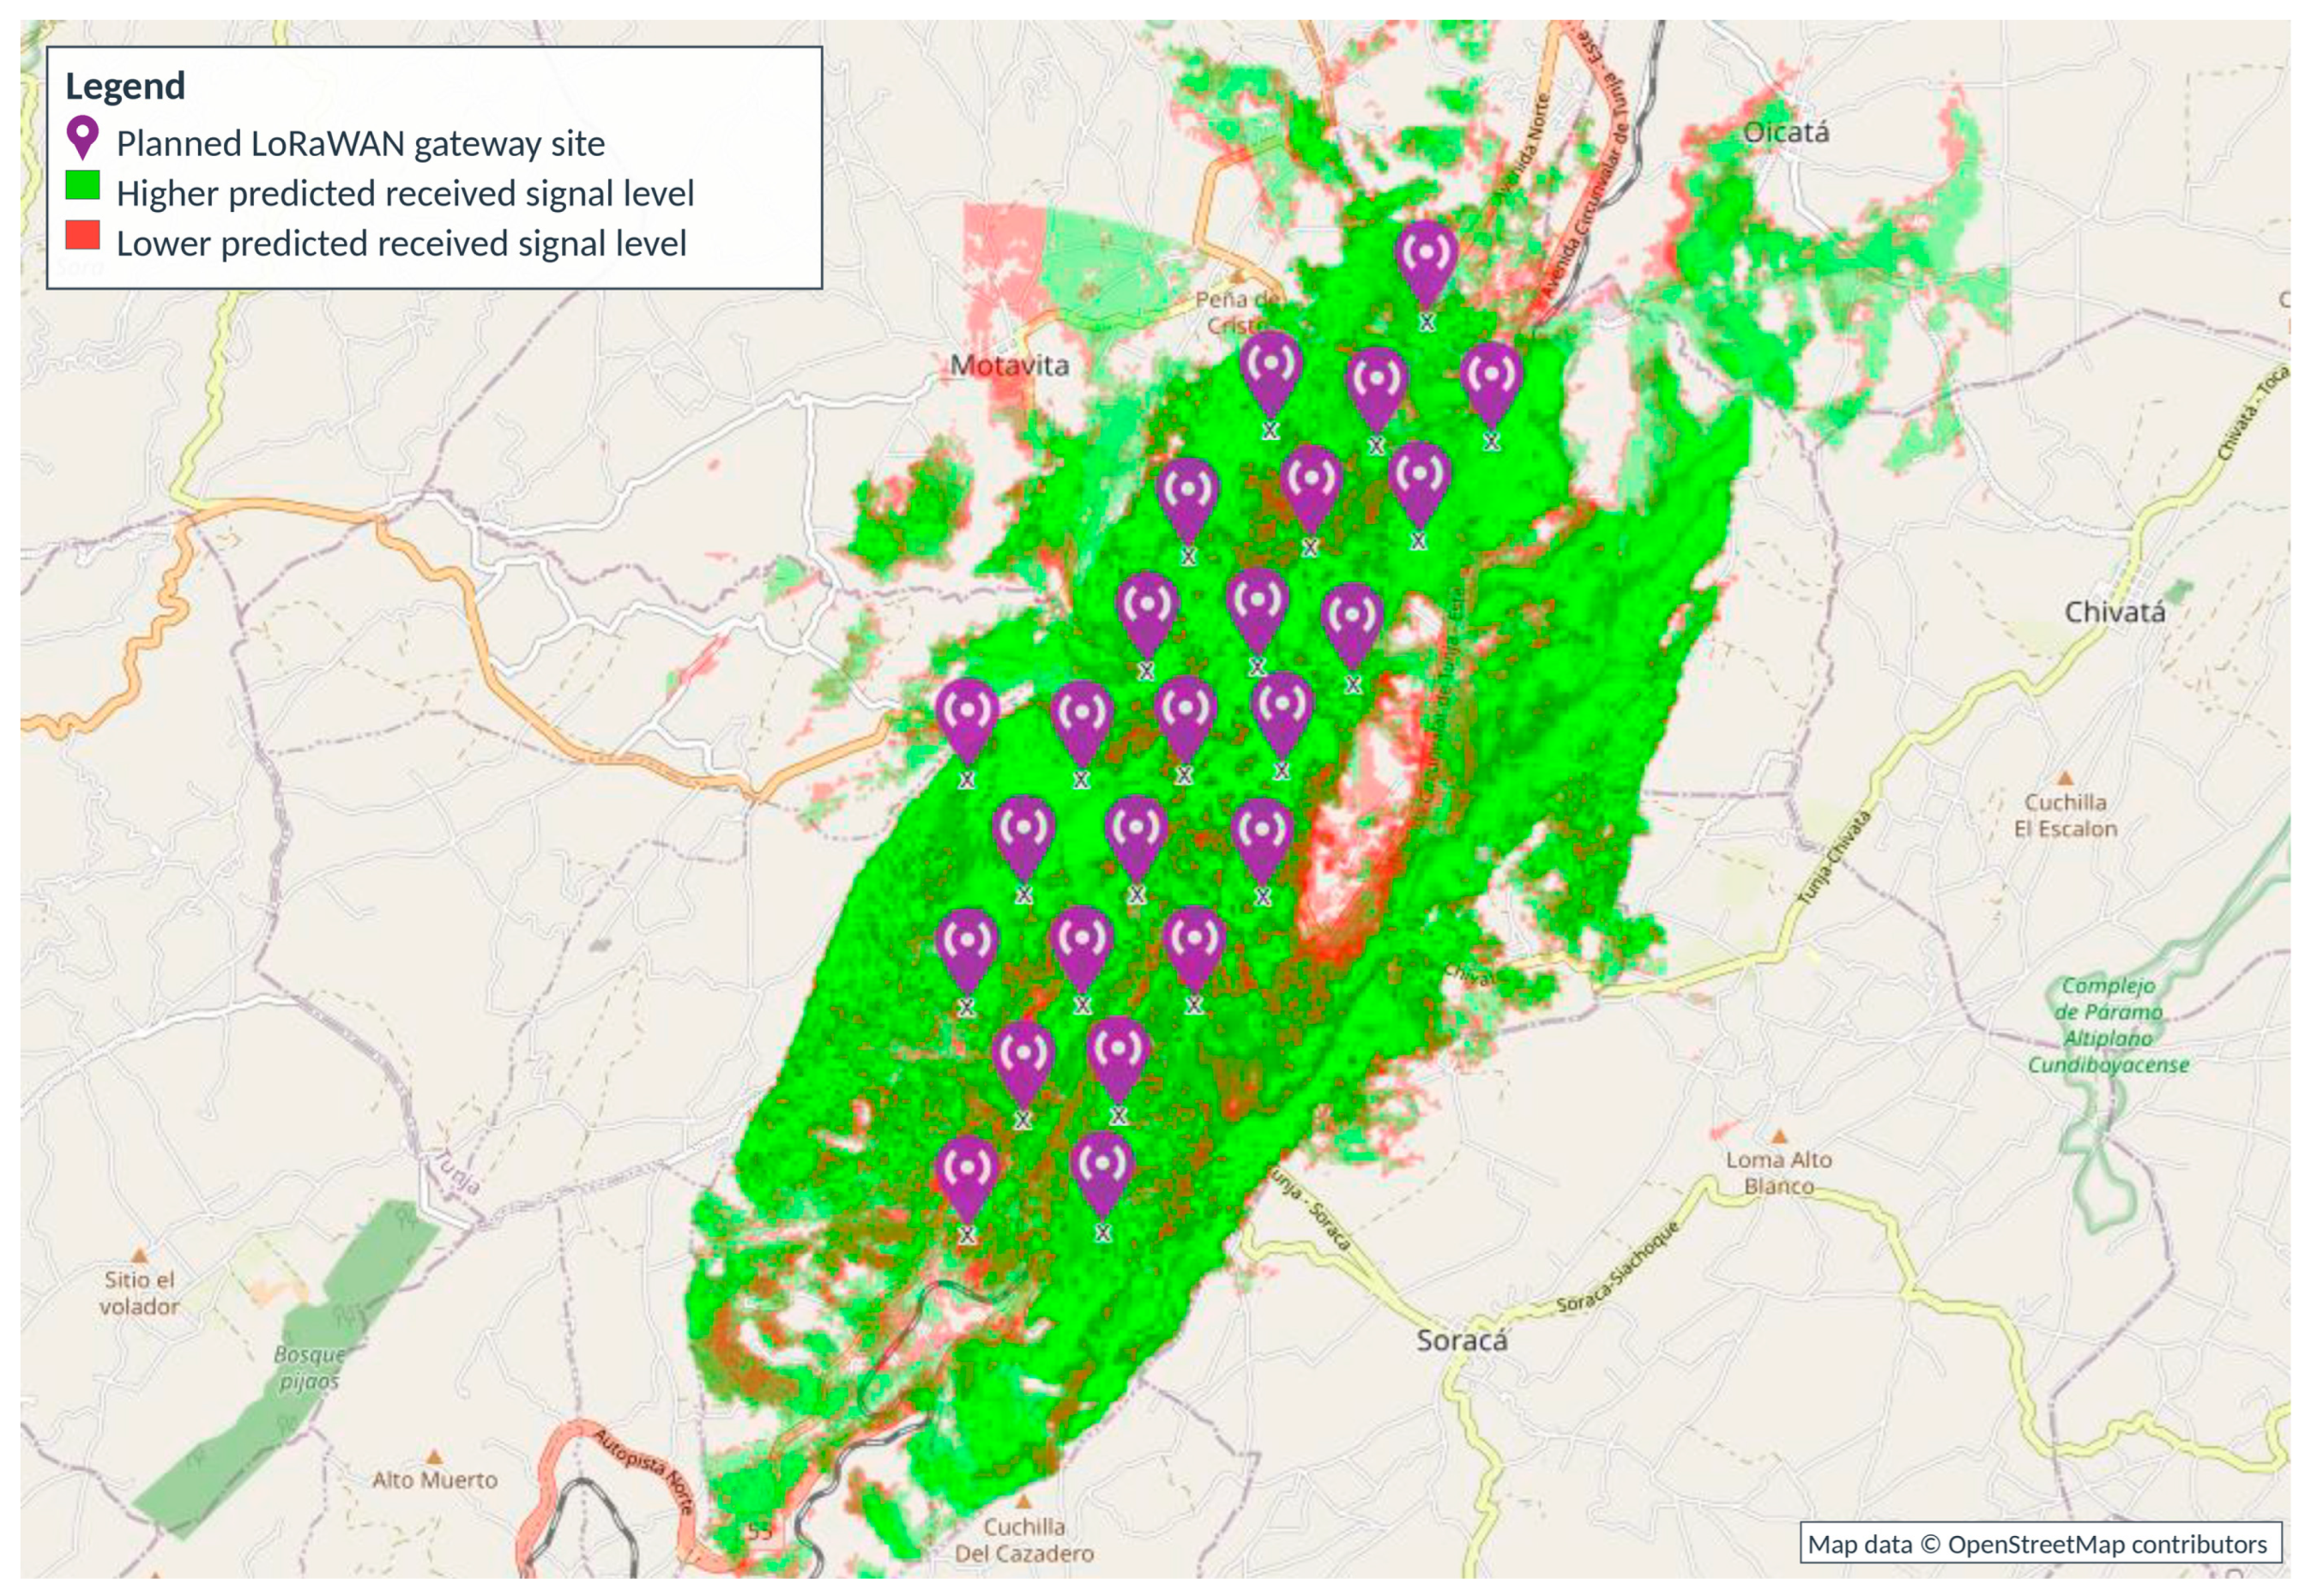
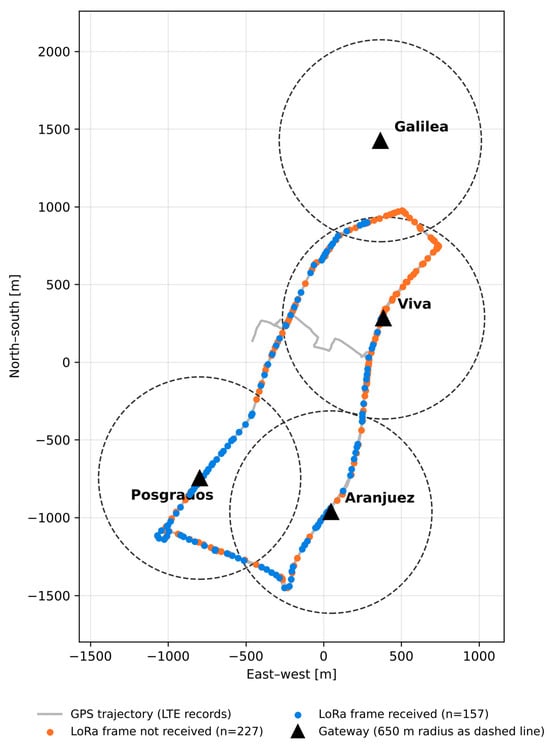
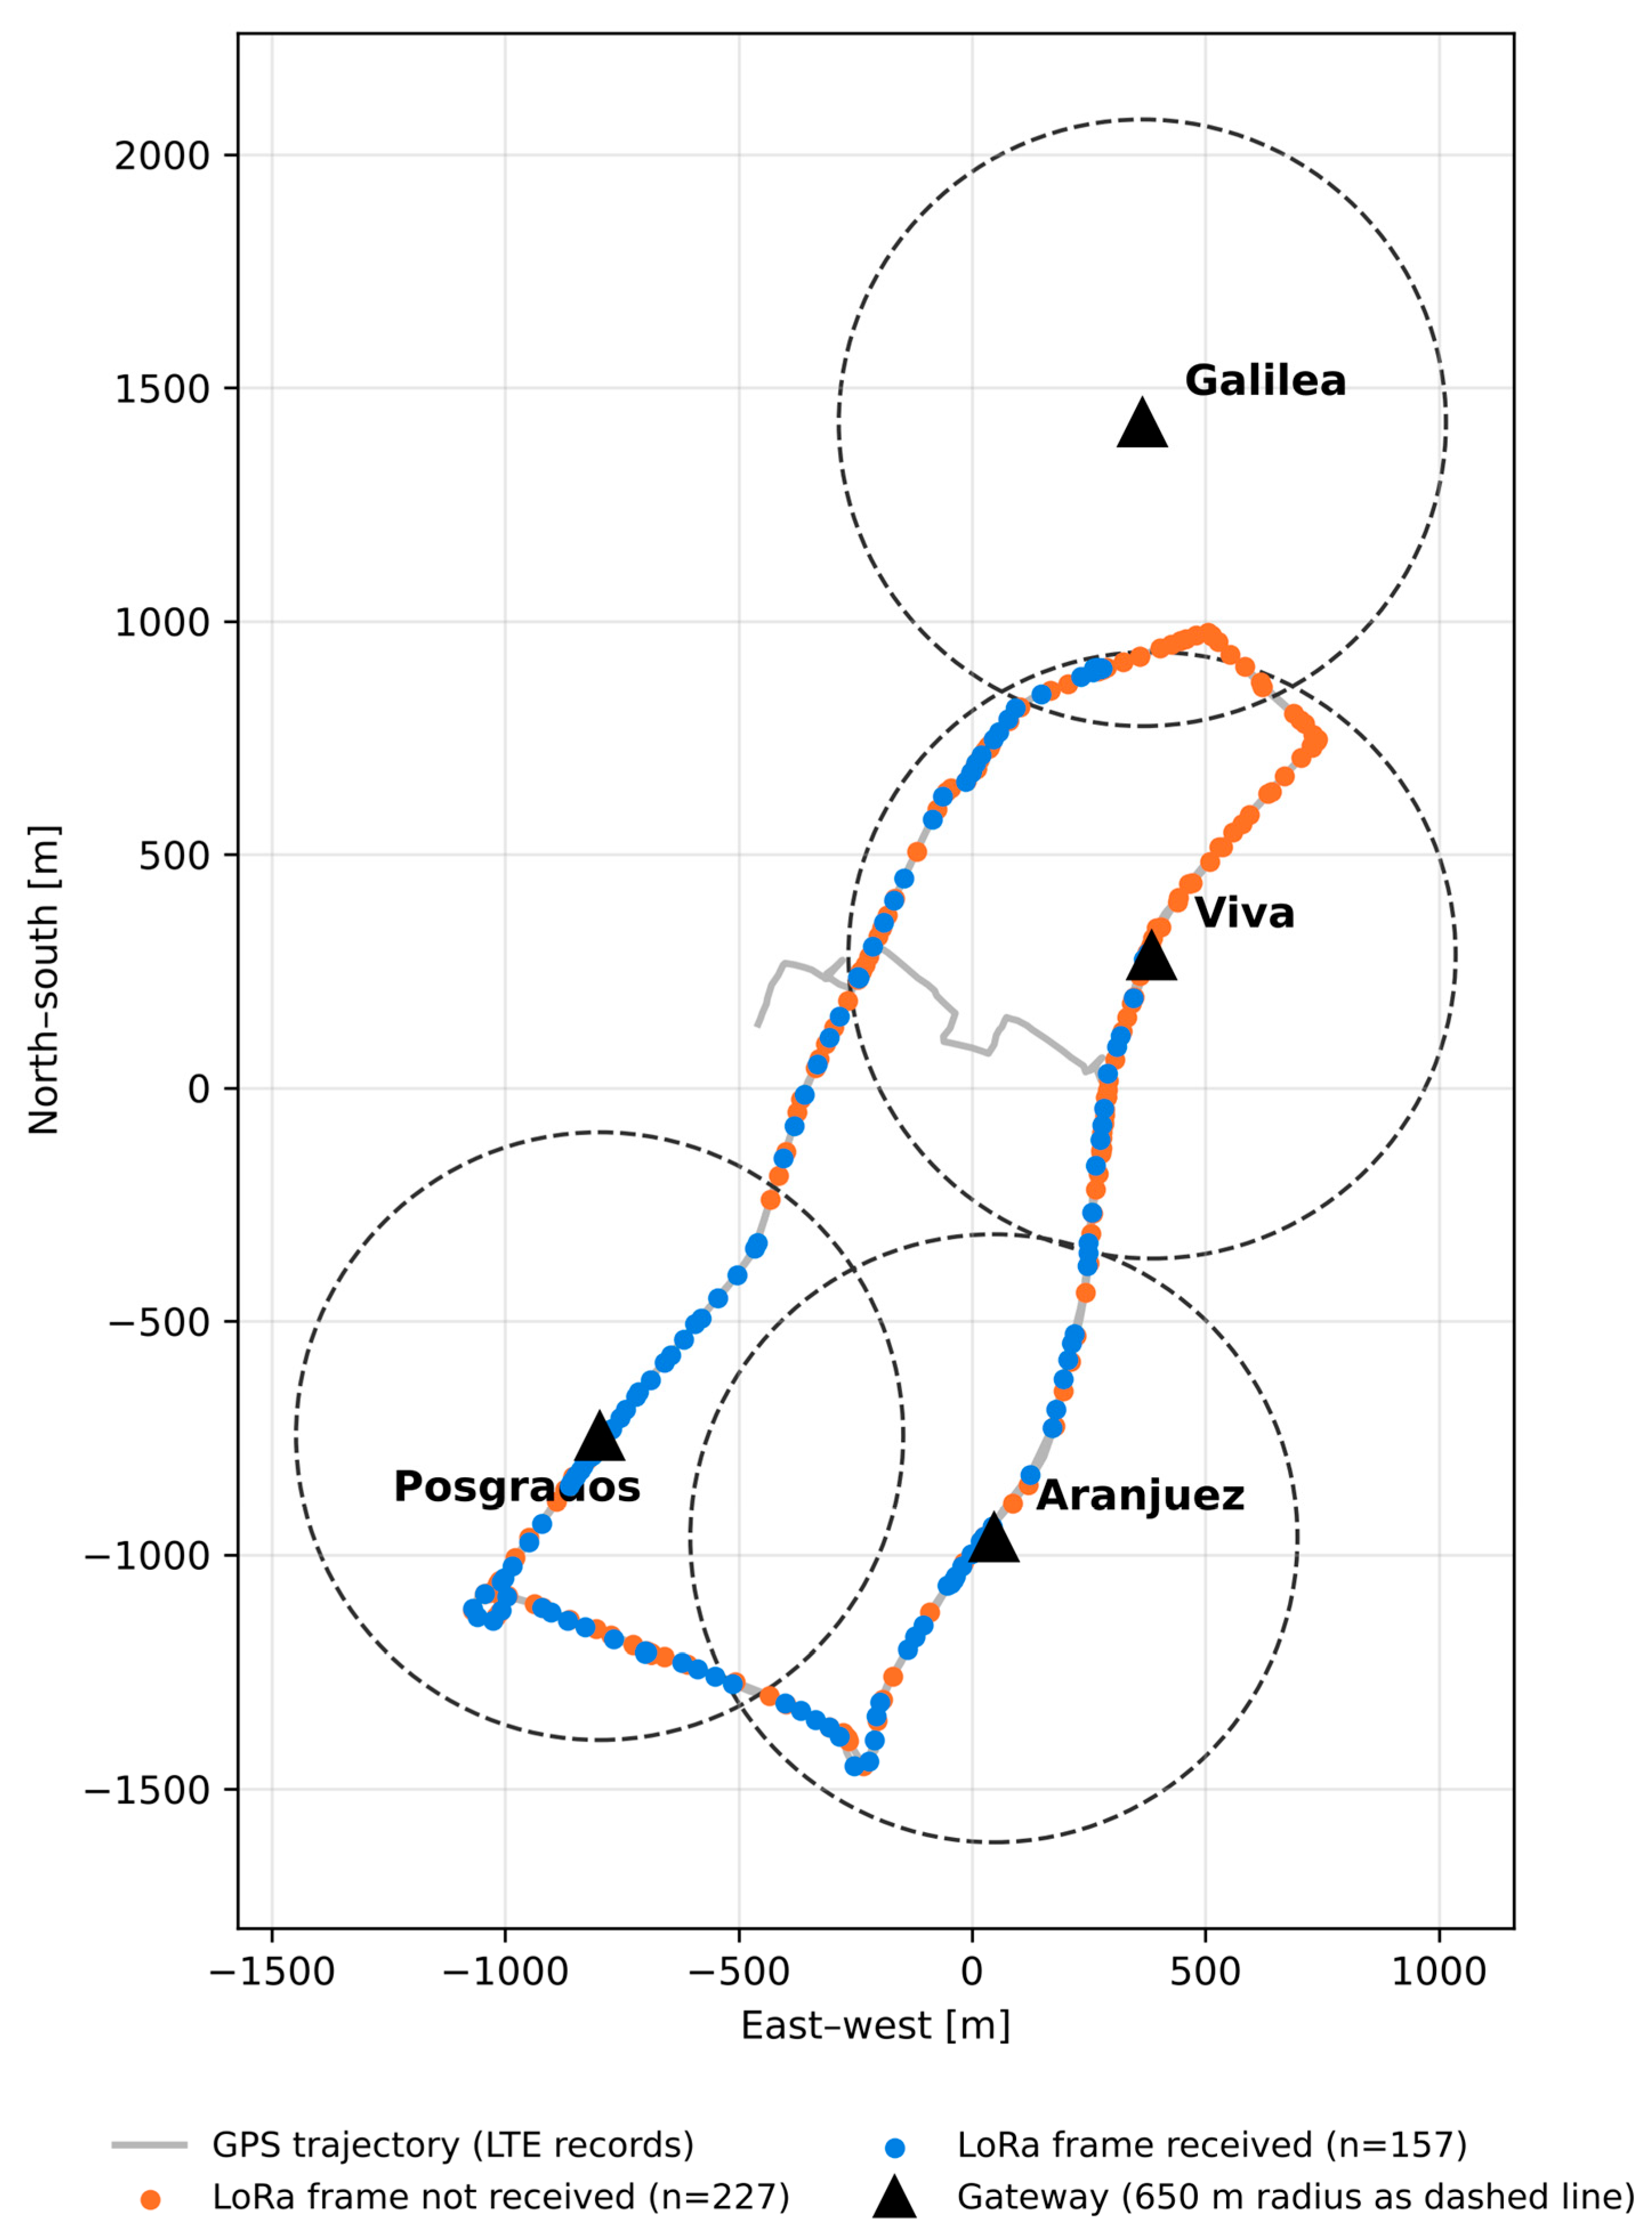
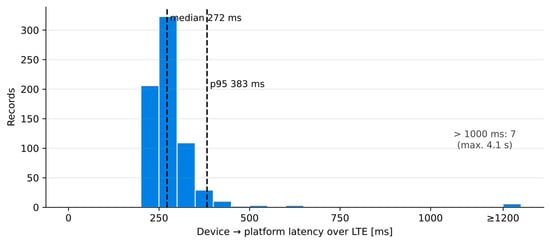
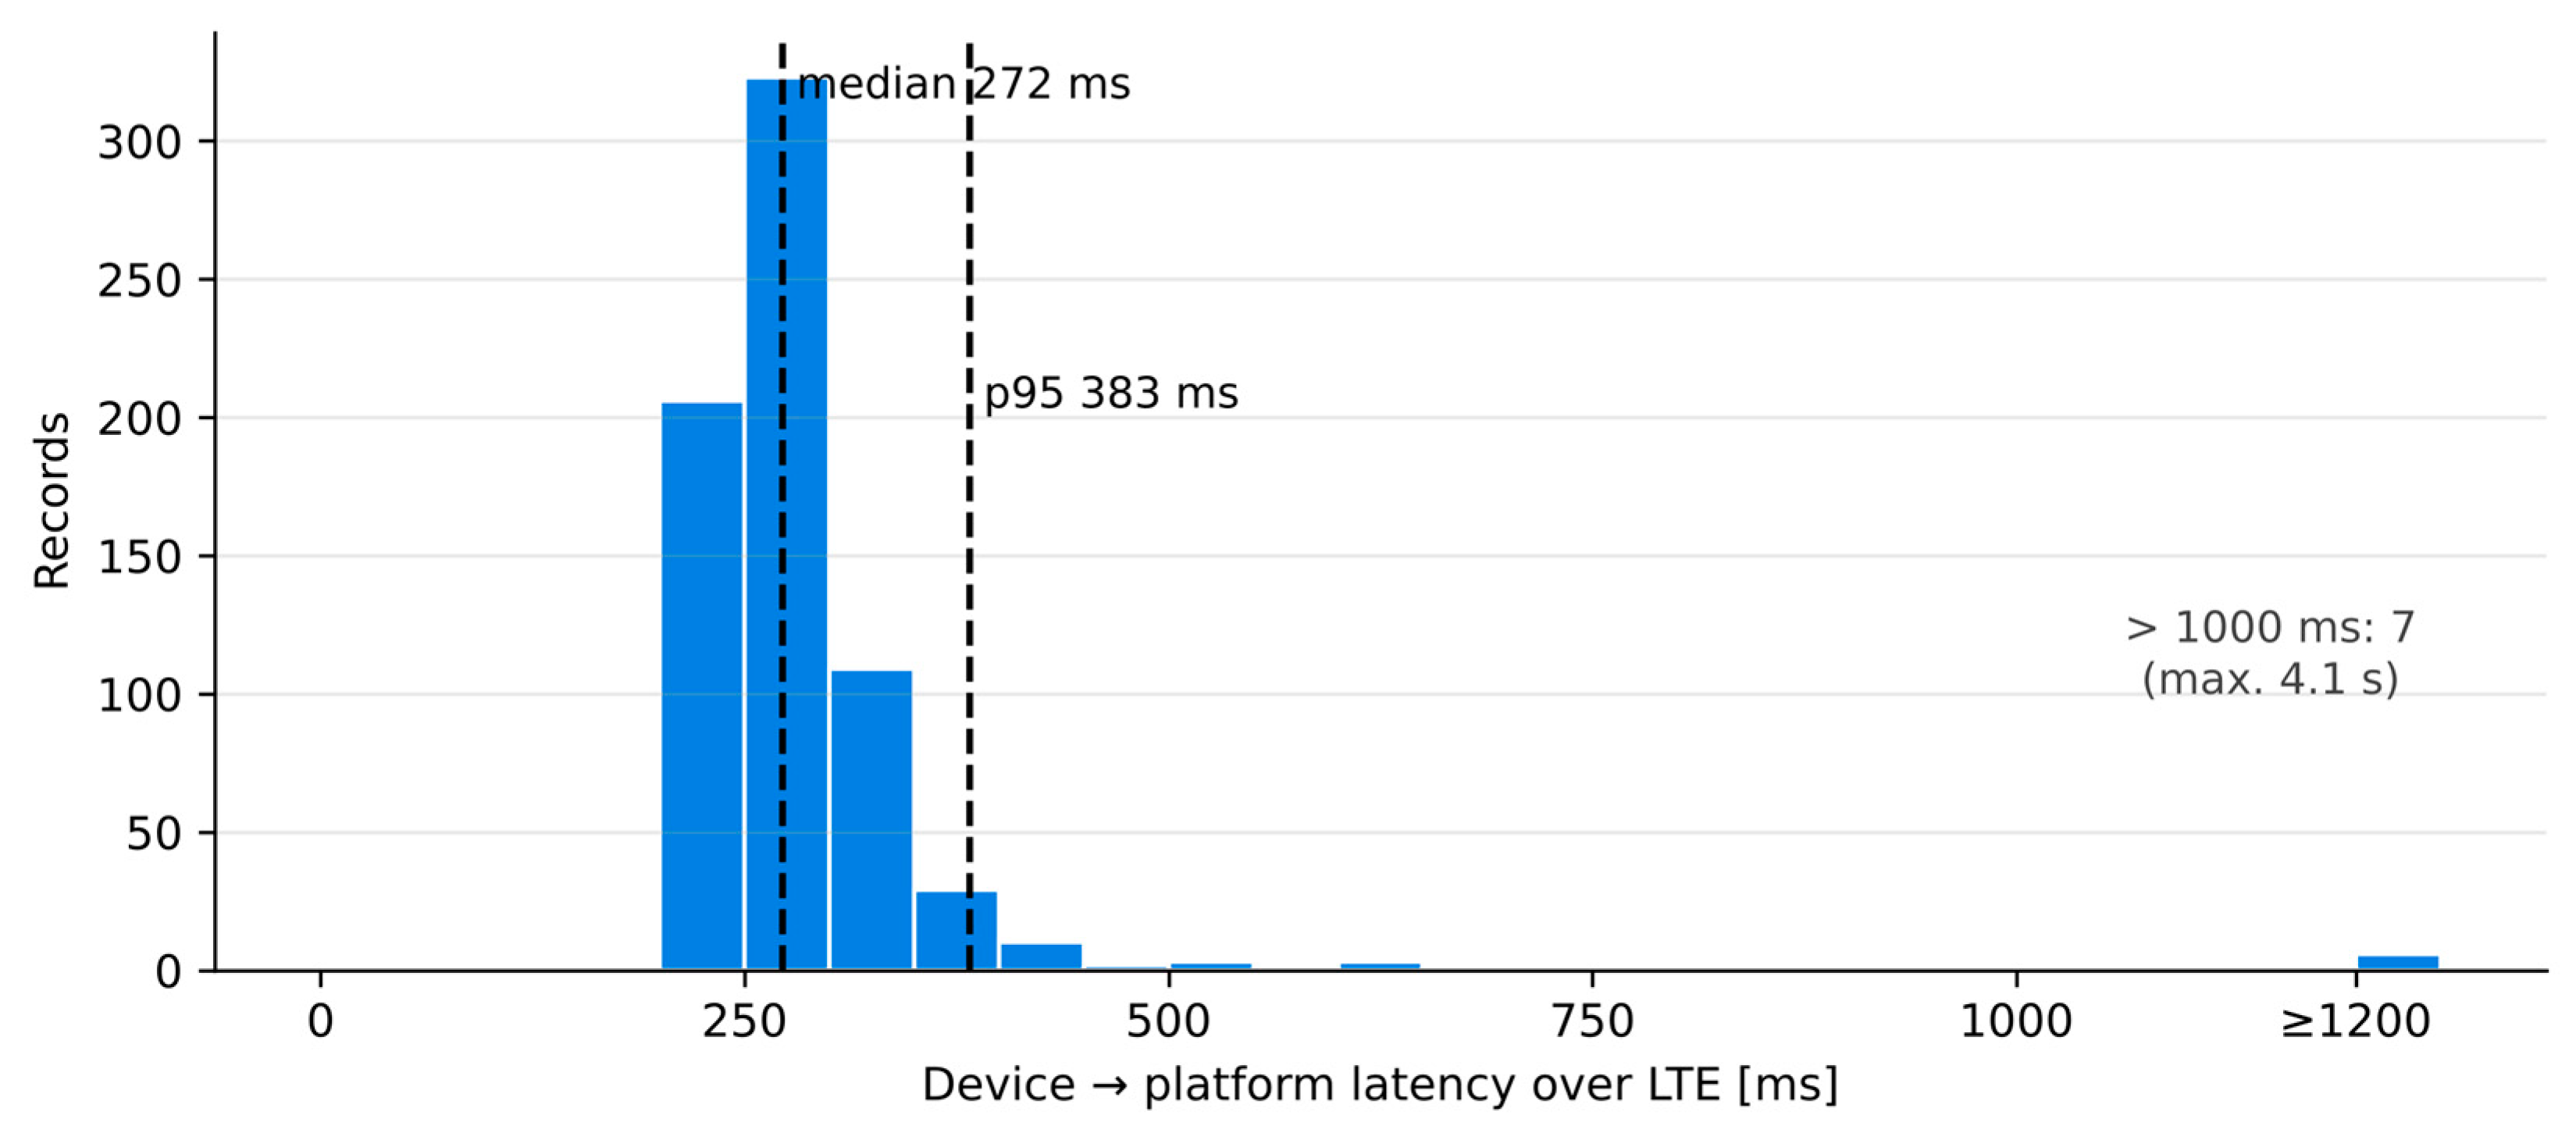
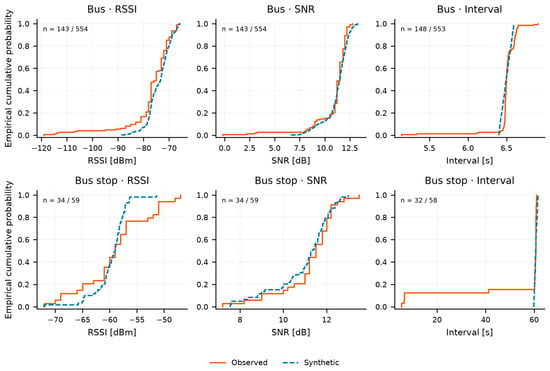
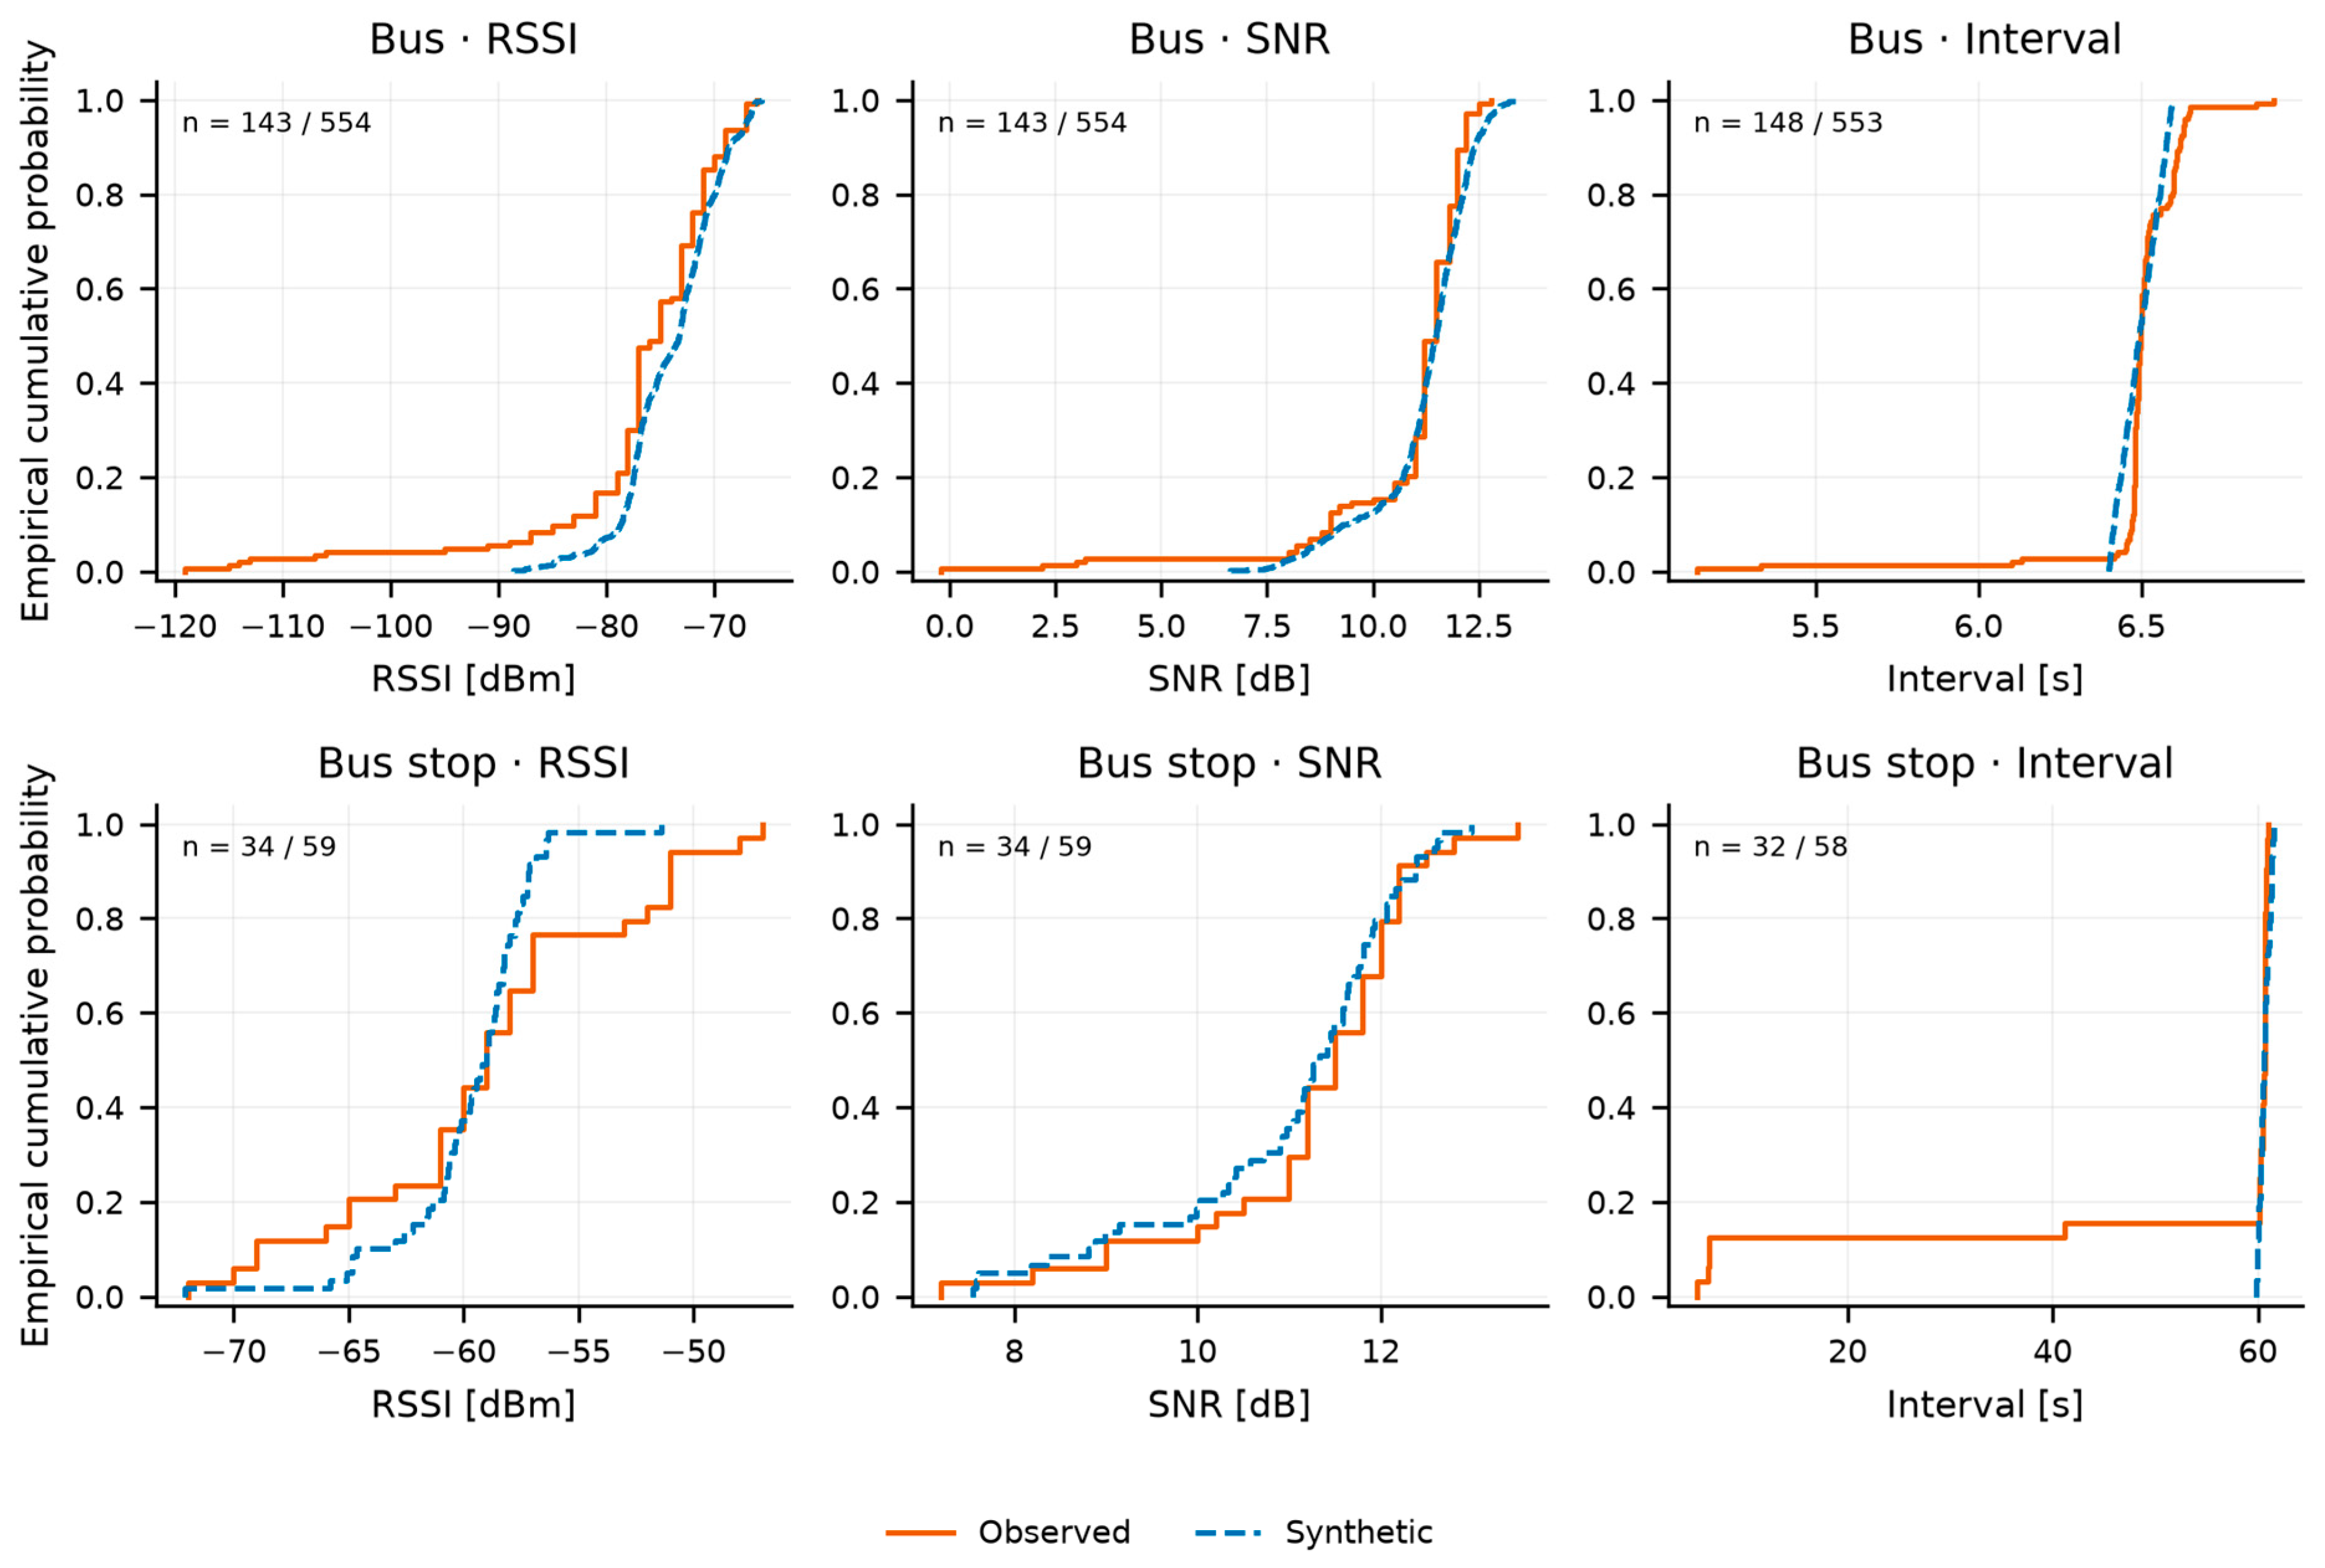
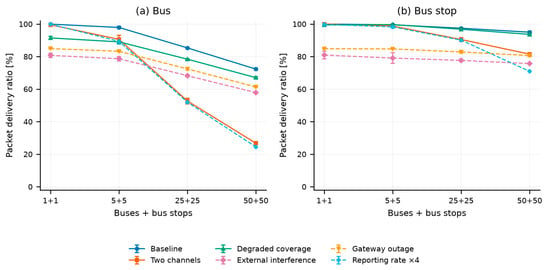
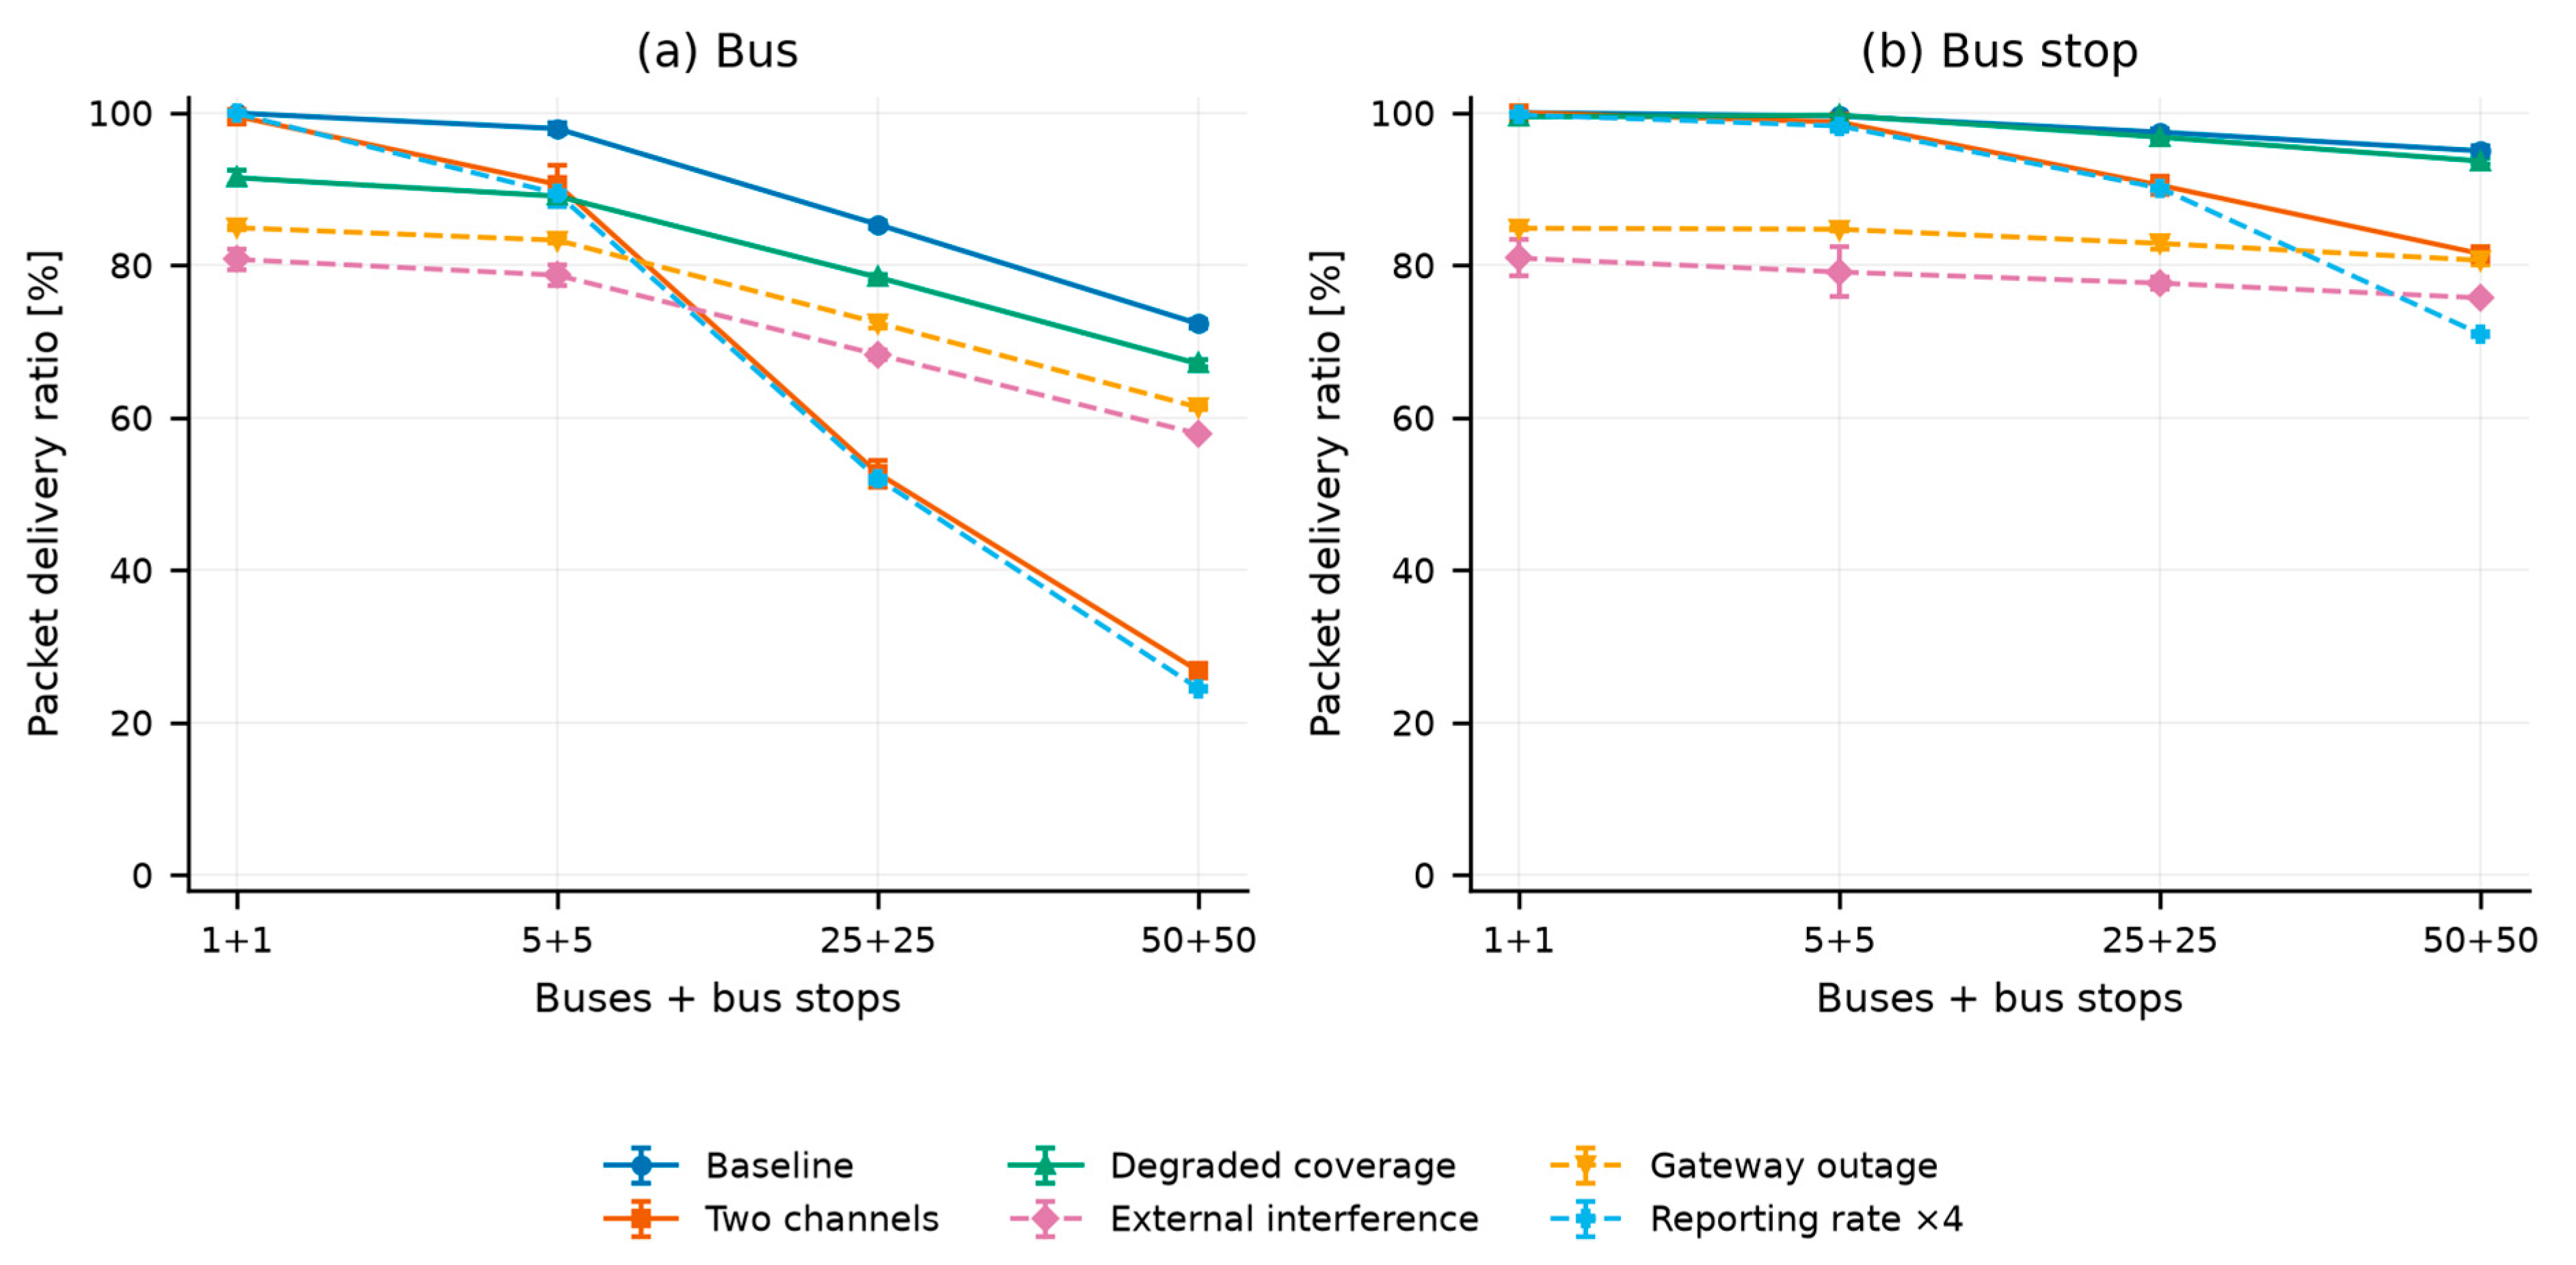
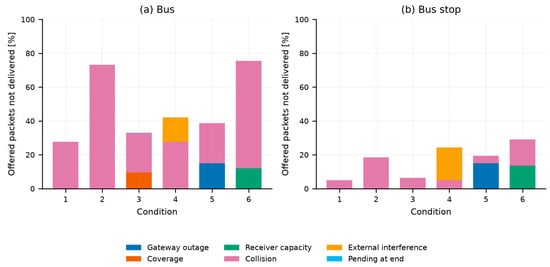
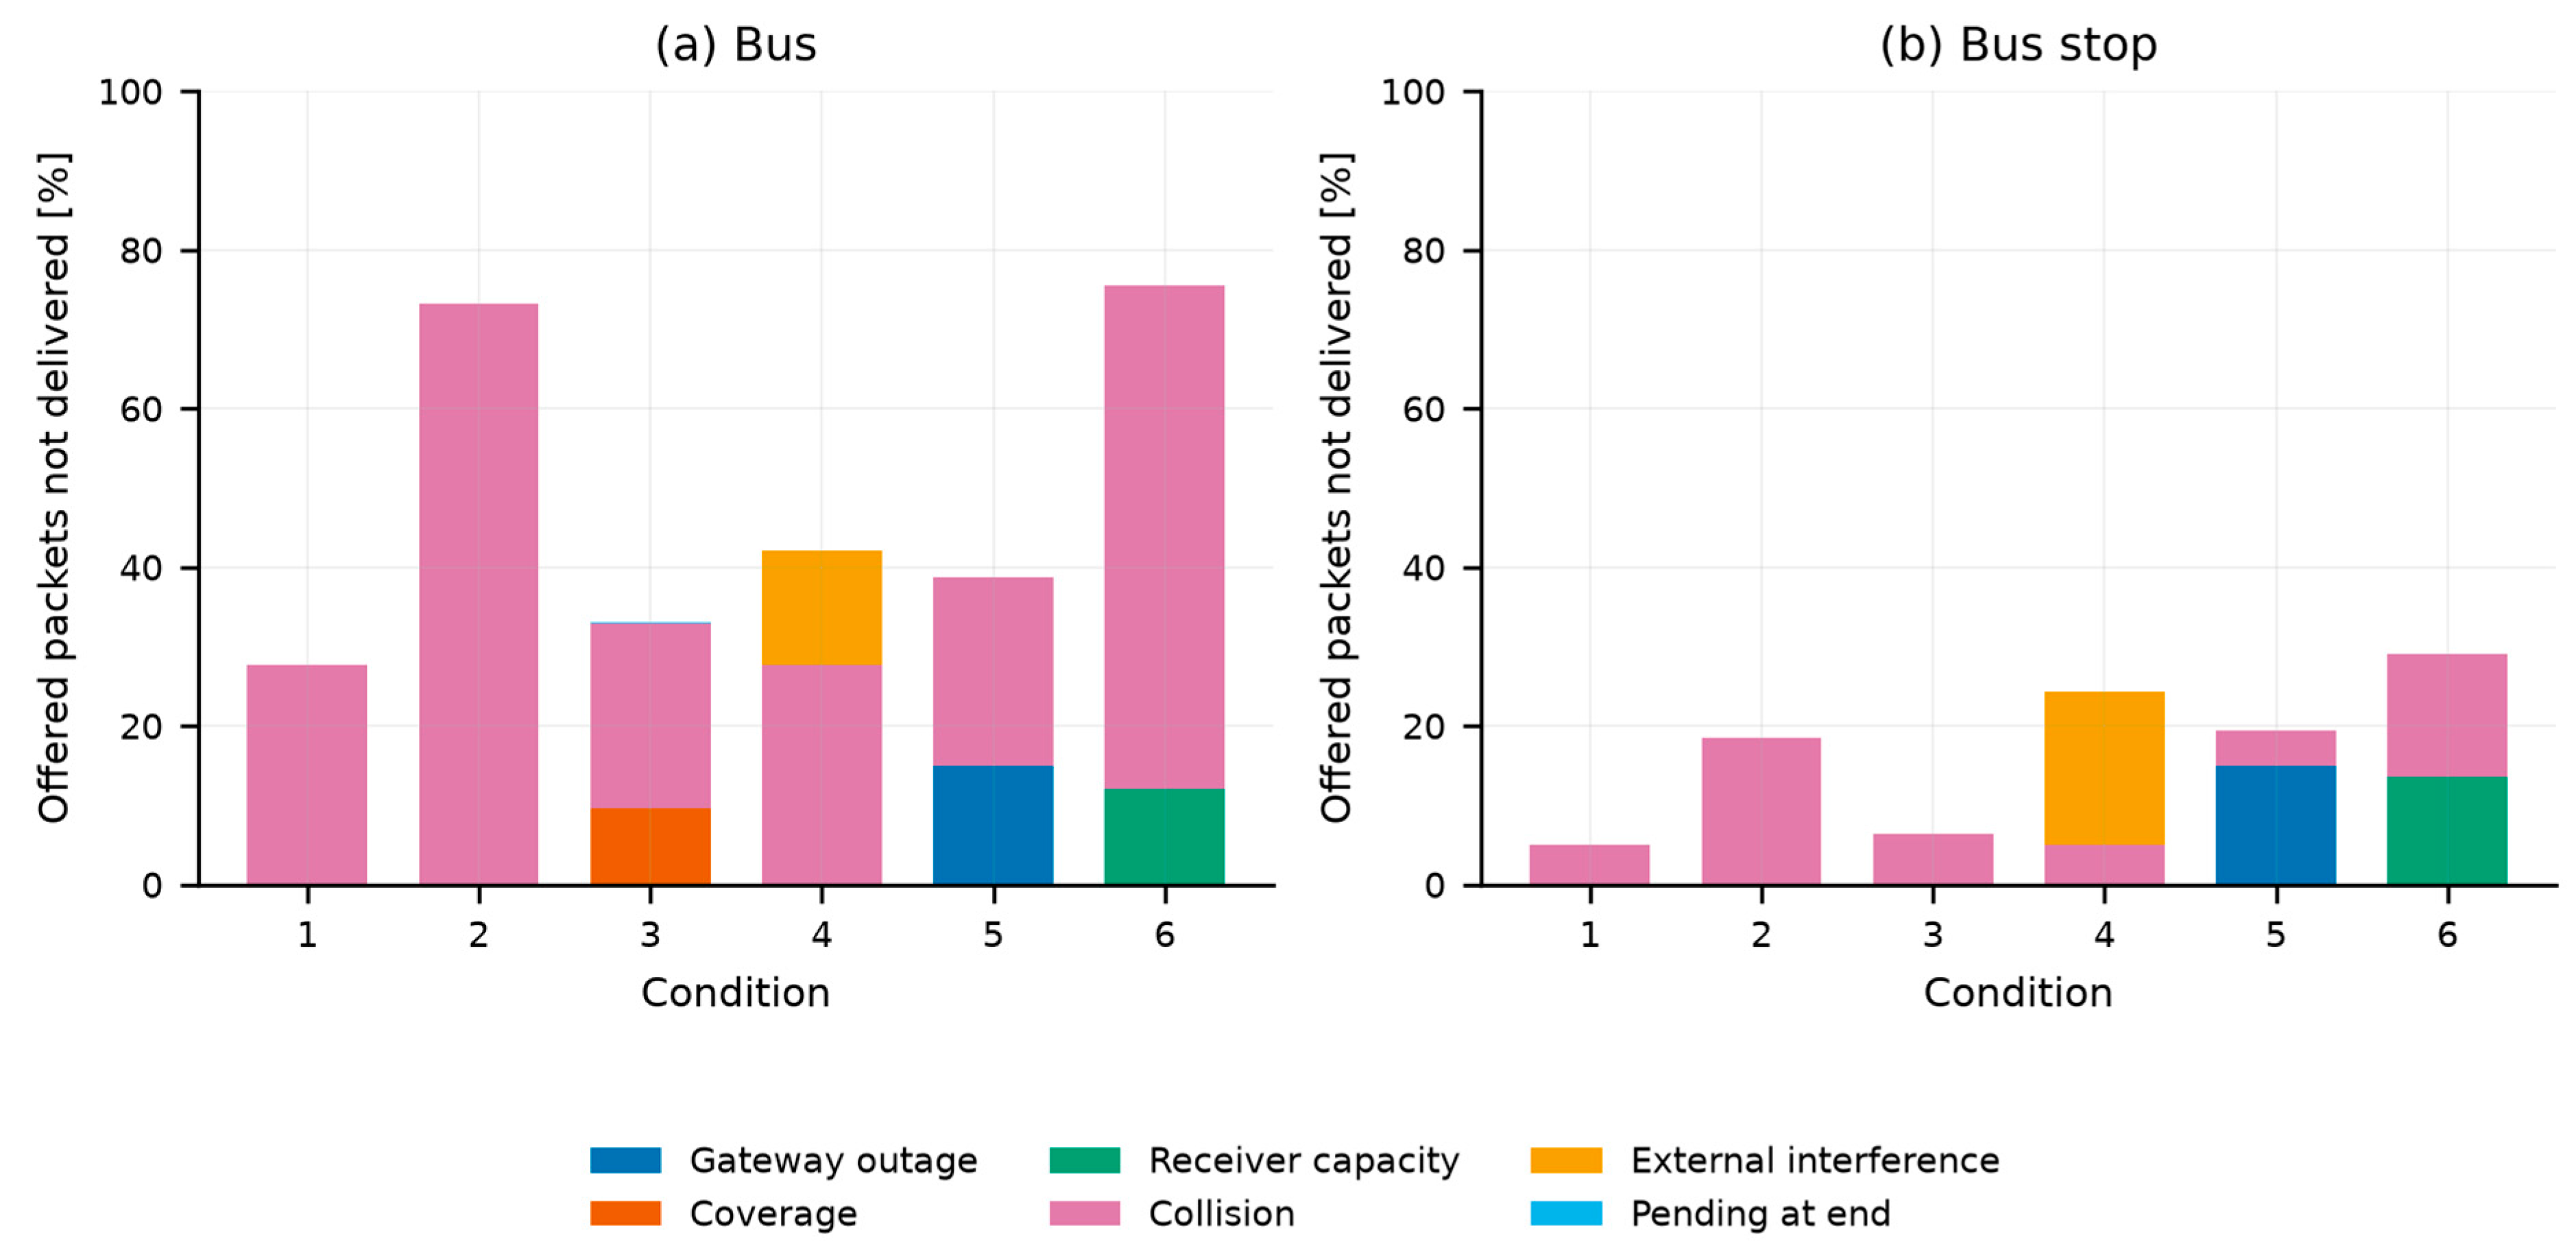
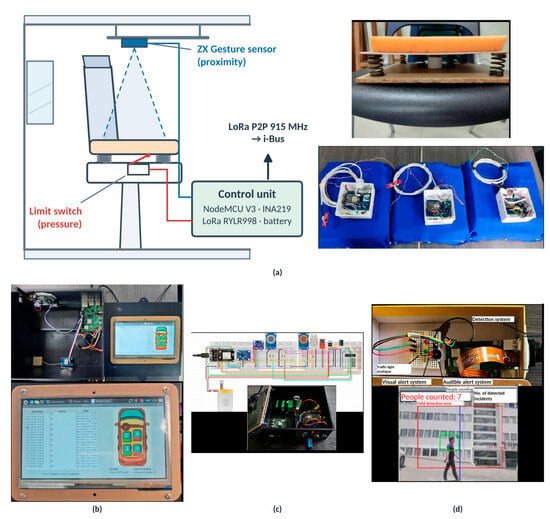
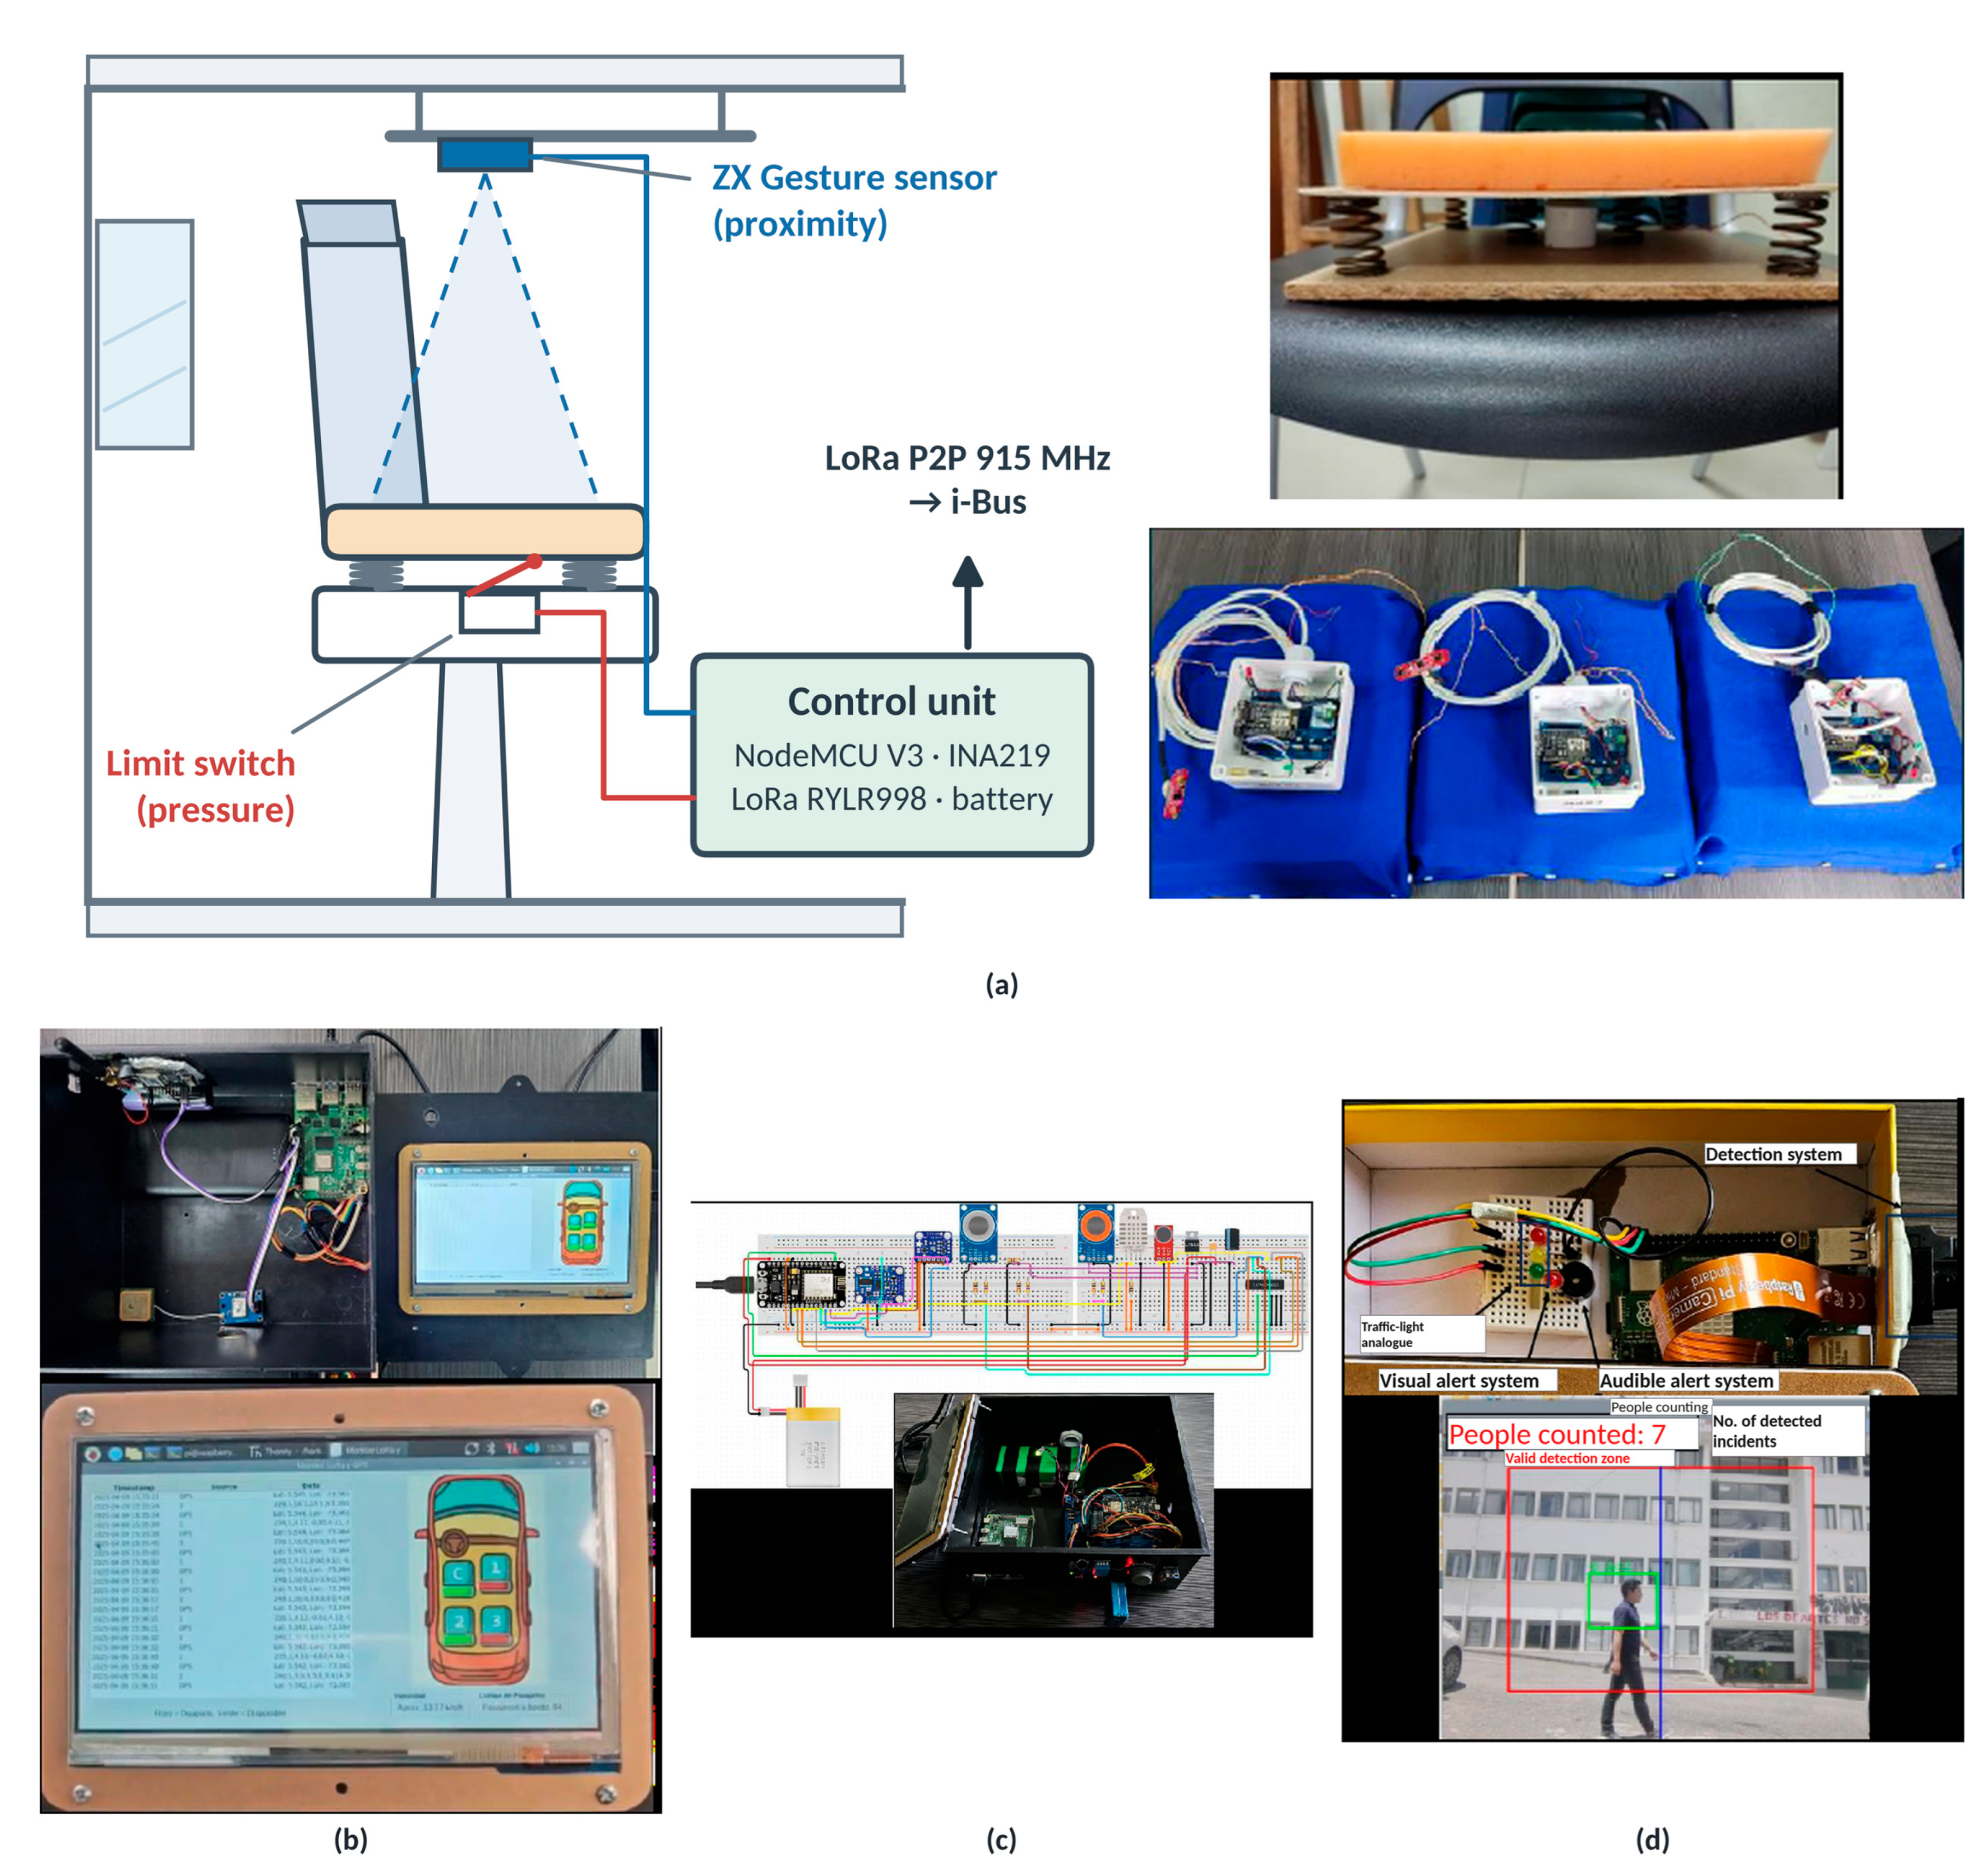
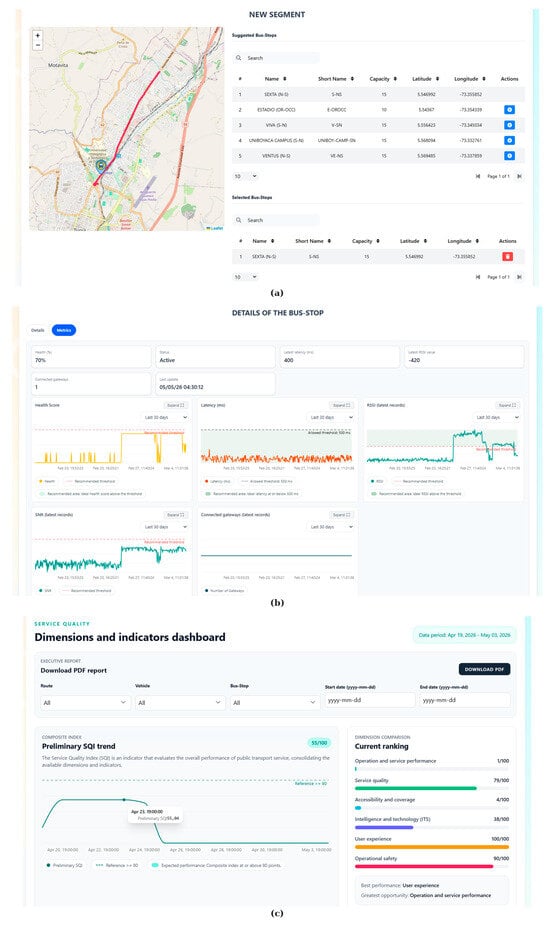
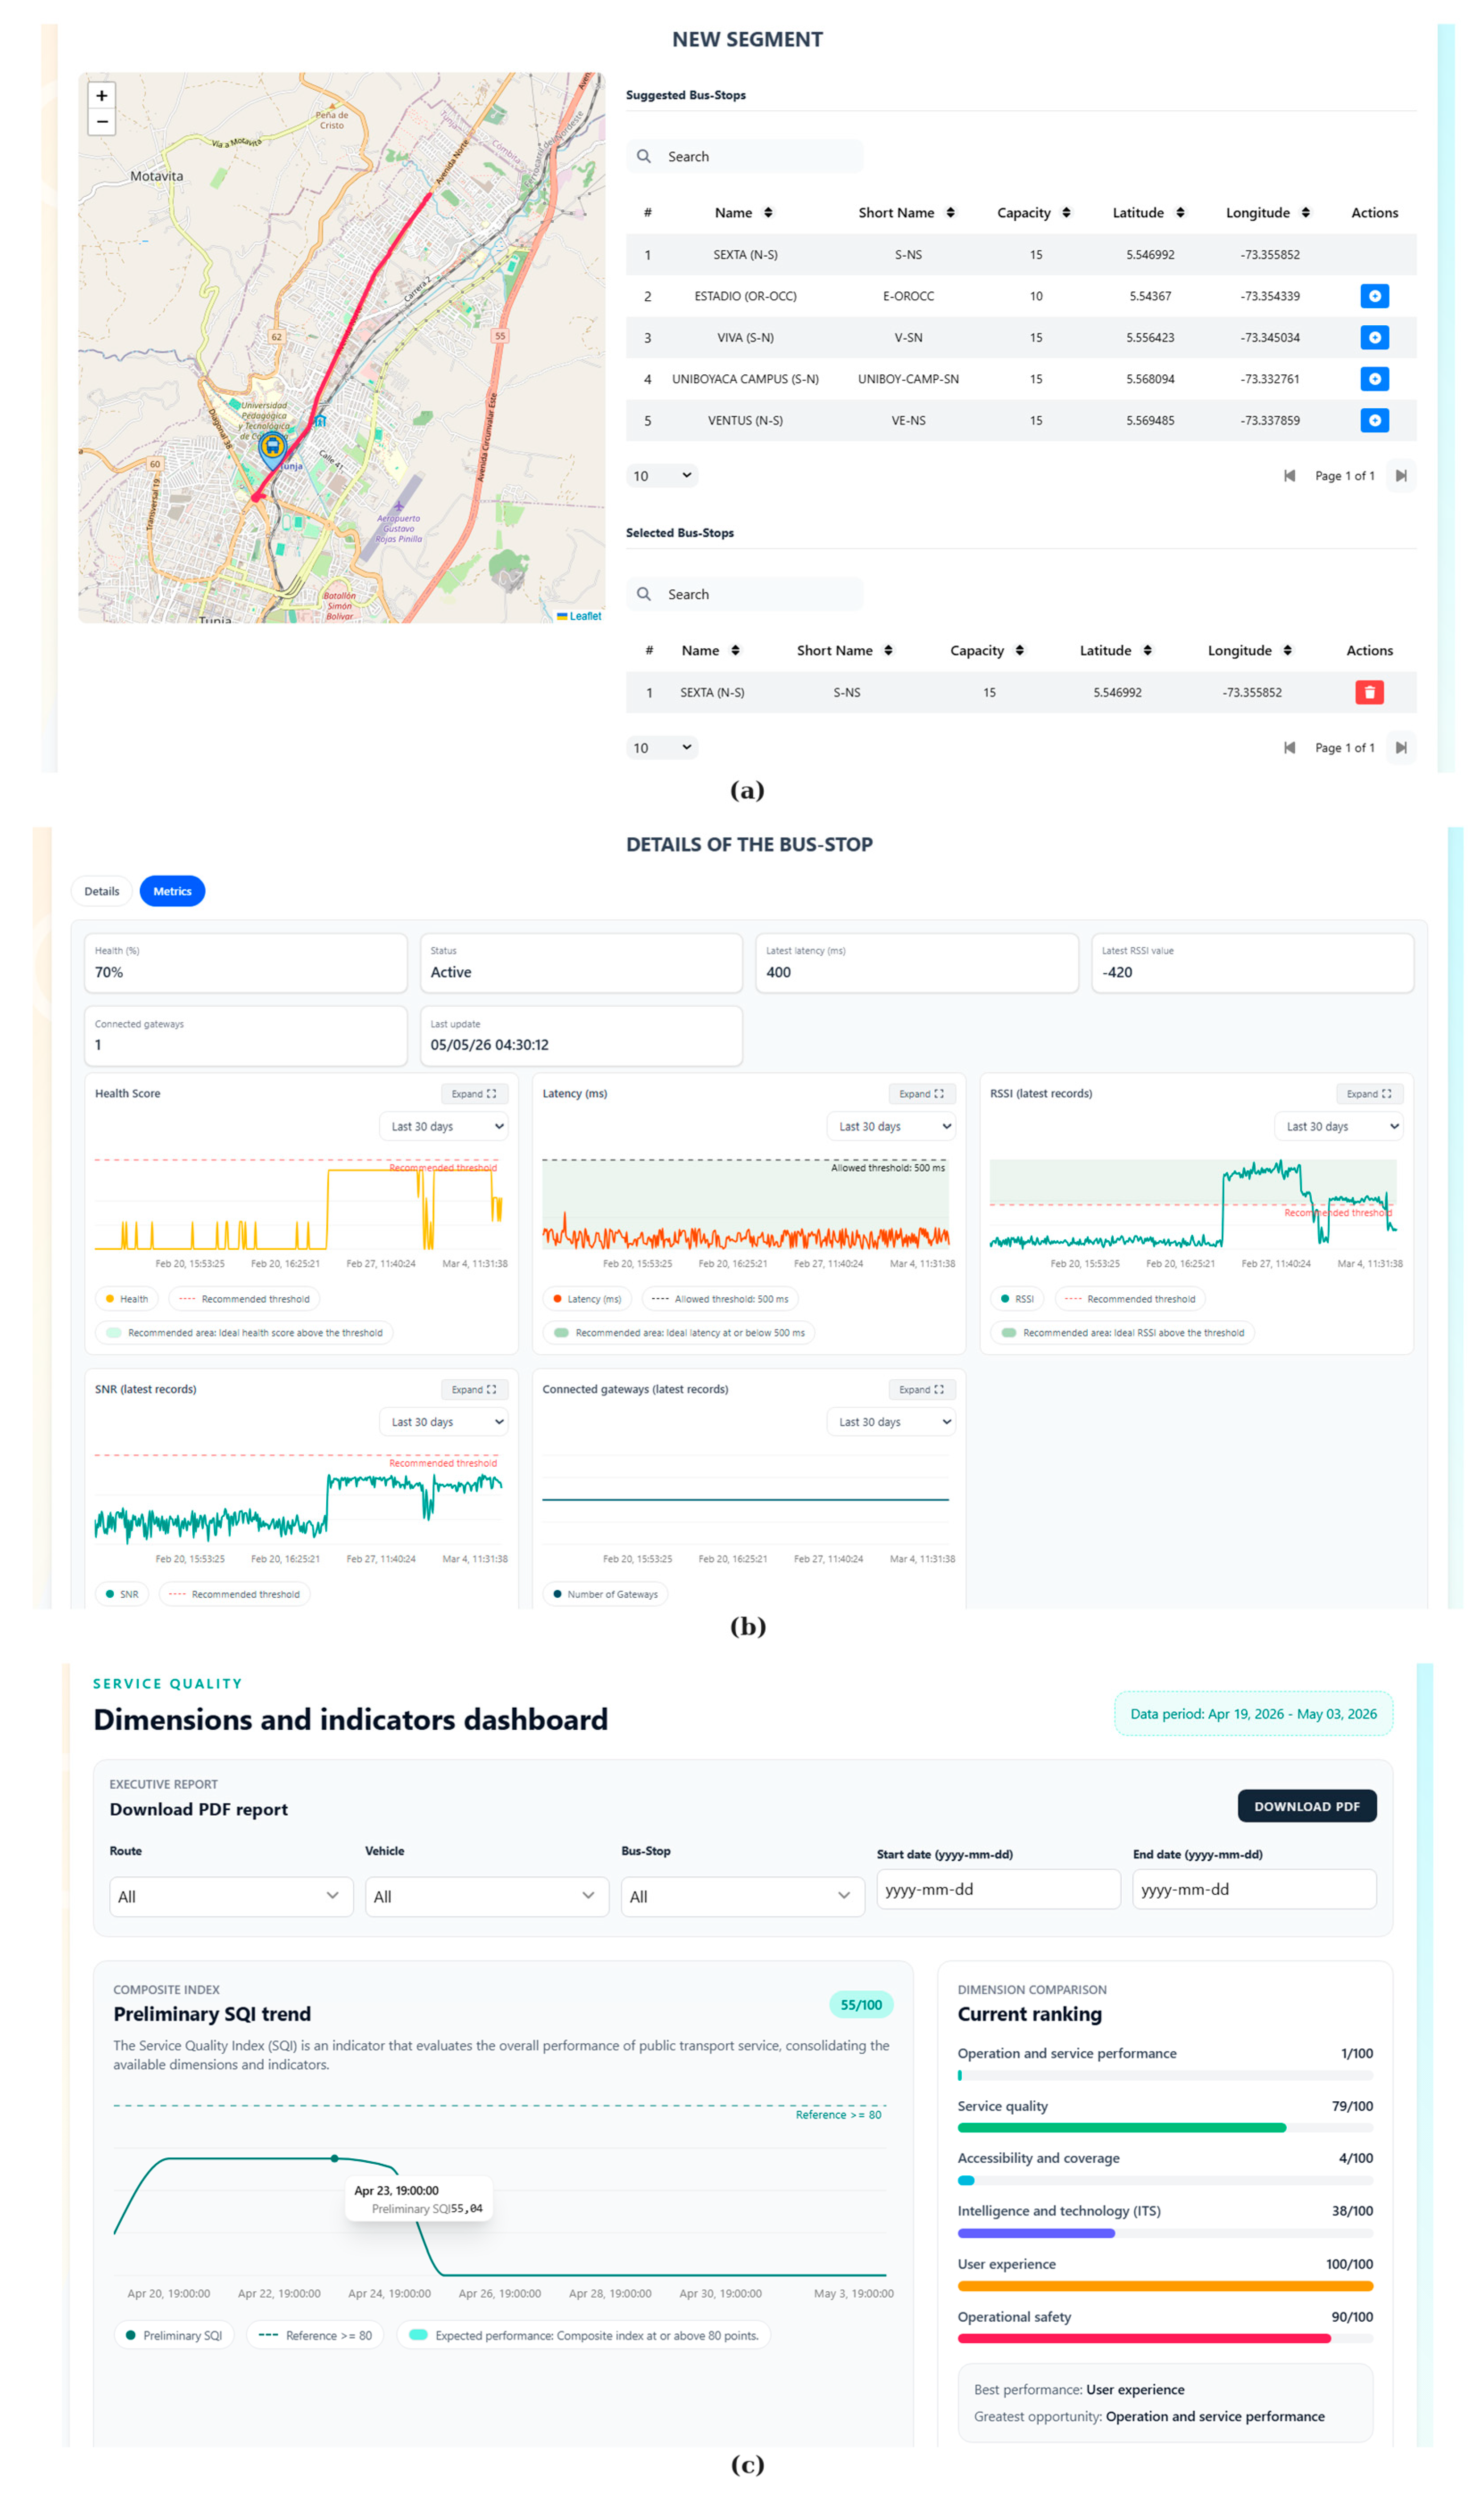

Disclaimer/Publisher’s Note: The statements, opinions and data contained in all publications are solely those of the individual author(s) and contributor(s) and not of MDPI and/or the editor(s). MDPI and/or the editor(s) disclaim responsibility for any injury to people or property resulting from any ideas, methods, instructions or products referred to in the content. |
© 2026 by the authors. Licensee MDPI, Basel, Switzerland. This article is an open access article distributed under the terms and conditions of the Creative Commons Attribution (CC BY) license.