


Highlights
What are the main findings?
- The integrated framework identified four priority segments where modeled solar exposure, physical route friction, and visual-route deficiencies converge along the Riyadh Metro corridor.
- The hybrid retrofit achieved the highest modeled spatial performance, increasing shade continuity from 18% to 84% and reducing the comparative solar-exposure index (CSEI) from 4.2 to 2.1, although its advantage remains conditional on implementation assumptions.
What are the implications of the main findings?
- Integrating climatic, spatial, and perceptual indicators provides a transparent decision-support approach for identifying pedestrian-route deficiencies and evaluating climate-responsive metro-access interventions.
- The framework can inform targeted retrofit planning in hot–arid cities, while its modeled findings require further environmental, behavioral, accessibility, and lifecycle validation before implementation or wider application.
Abstract
First/last-mile accessibility around metro stations in hot–arid cities depends not only on proximity and network connectivity but also on climatic exposure, physical movement friction, visual legibility, and route continuity. This study develops and tests a multi-scalar spatial decision-support framework for evaluating and retrofitting a station-parallel pedestrian corridor along the Riyadh Metro. The framework integrates five registered diagnostic dimensions—shade continuity, relative solar exposure, physical route friction, visual route confirmation, and inferred movement correspondence—followed by a separate comparison of conceptual retrofit options. Twelve route segments were assessed under baseline conditions and three retrofit scenarios: tree planting, lightweight canopies, and a hybrid strategy. The baseline analysis indicated 18% modeled shade continuity, a relative solar-exposure index (CSEI) of 4.2, approximately 42% availability of route-confirmation cues, and four segments in the highest study-defined IPS screening band. Under the hybrid established-canopy design state, the corresponding modeled values were 84%, 2.1%, and 75%, while spatial support for inferred origin–destination relationships increased from approximately 67% to 92%. The hybrid ranked highest within the principal uncosted comparison. These results indicate comparative spatial performance rather than measured thermal relief, successful wayfinding, observed pedestrian movement, or verified accessibility. The framework supports preliminary retrofit screening, subject to environmental, behavioral, accessibility, and cross-typology validation.
1. Introduction
Rapid investment in urban rail is reshaping mobility strategies in cities seeking to reduce automobile dependence, improve accessibility, and support more sustainable urban development [1,2]. Yet, the effectiveness of metro systems depends not only on network coverage, service frequency, and station distribution but also on the quality of the pedestrian journey connecting surrounding neighborhoods and destinations to station entrances. This first/last-mile condition is particularly important where walking environments are constrained by climatic exposure, wide road infrastructure, fragmented public-realm networks, and weak continuity between transit infrastructure and adjacent urban uses [3,4]. Under such conditions, a station may be geographically close while remaining functionally difficult to reach. Accessibility therefore cannot be understood through distance alone but must also account for the environmental, spatial, perceptual, and physical conditions encountered along the route.
These challenges are amplified in hot–arid cities, where direct solar exposure, discontinuous shade, crossings, and physical interruptions can make even short station approaches functionally difficult [5,6]. Climate-responsive access therefore depends not only on distance or aggregate shade, but on the continuity of protection, movement, and orientation along the pedestrian sequence.
Riyadh provides a relevant setting for examining these relationships [7]. The study focuses on Location 01, an elevated station-parallel corridor between commercial frontage and the metro edge. Although formal pedestrian infrastructure is present, the route combines solar exposure, crossing interruptions, limited shaded pause opportunities, and weak pedestrian-scale orientation. It is therefore examined as a critical case of retrofitting an existing station approach without changing the road network, building footprints, or metro alignment.
Research on pedestrian access already offers established measures of network distance, connectivity, and station catchments [8,9], while studies of heat exposure and walking identify climatic constraints and spatial-visibility research examines configuration, legibility, and wayfinding. Multi-domain integration is also established [8,10,11]. The unresolved planning question examined here is not how to measure these attributes independently or how to combine indicators in principle. It concerns how to prioritize physical retrofit locations along an existing metro approach when shade deficits, physical route friction, weak visual route confirmation, and inferred movement relationships coincide; how to compare defined tree, canopy, and hybrid packages within the same retained corridor geometry; and how sensitive those comparisons are to accessibility requirements, weighting choices, and operational assumptions. This study addresses these questions through a case-specific diagnostic-to-decision workflow rather than by introducing a new accessibility, thermal, or multi-criteria algorithm.
This study addresses this gap through the Place–Pattern–People framework, applied at corridor, route-sequence, and pedestrian-interface scales. Its conceptual dimensions and analytical relationships are detailed in Section 2.7. This study aims to develop and test, within a single elevated station-parallel corridor along Riyadh Metro, a multi-scalar spatial decision-support framework integrating comparative solar exposure, physical route friction, visual route confirmation, inferred movement relationships, accessibility requirements, and retrofit-option performance. The investigation focuses on the internal applicability of this framework to Location 01 rather than establishing its empirical validity across different station configurations or hot–arid cities.
The study pursues five objectives. It diagnoses the existing corridor; quantifies shade continuity, relative solar exposure, physical route friction, and visual route confirmation where evidence permits; integrates these dimensions through the Place–Pattern–People framework; compares three retrofit scenarios using consistent criteria; and identifies which framework components would require additional evidence, recalibration, or comparative testing before application to other station environments and hot–arid contexts. Four research questions structure the investigation:
- RQ1. How do modeled climatic exposure, coded physical route friction, spatial configuration, and visual route-confirmation conditions converge along a station-parallel pedestrian route in Riyadh?
- RQ2. Where do relative solar exposure, physical route friction, decision points, and inferred movement relationships overlap to create critical intervention locations?
- RQ3. How do tree planting, lightweight canopies, and hybrid retrofits compare in modeled climatic and route-related performance, environmental value, adaptability, maintenance, and implementation complexity, with accessibility retained as a separate prerequisite?
- RQ4. Which elements of the registered multi-scalar Place–Pattern–People framework provide a common basis for future cross-typology evaluation, and what local recalibration and empirical evidence would be required to assess its applicability beyond Location 01?
This study contributes an auditable, case-specific application of established spatial and multi-criteria methods to the retrofit of an elevated metro-access corridor. Its analytical sequence relates separately constructed environmental, physical, visual, and inferred movement indicators to fixed route segments, identifies compound spatial deficiencies, and evaluates alternative physical interventions. A benchmark against simpler screening approaches and conventional TOPSIS is included to examine whether this integration changes intervention priorities or scenario rankings. The contribution is therefore assessed in terms of decision traceability, differentiated diagnostic information, and modeled retrofit responsiveness rather than assumed algorithmic novelty or superiority over established techniques. The framework’s applicability beyond Location 01 requires independent empirical and cross-typology validation [12,13] (Figure 1).
Figure 1.
Environmental, spatial, and perceptual conditions shaping first/last-mile pedestrian access along an elevated metro corridor. Source: Authors.
2. Literature Review and Conceptual Framework
The pedestrian environment surrounding rapid-transit infrastructure is a critical component of sustainable urban mobility. Metro systems can reduce automobile dependence, improve regional accessibility, and support more compact urban development, but these benefits depend partly on how easily passengers can reach stations from surrounding streets, neighborhoods, and activity centers [14]. First/last-mile research therefore extends beyond the transit network itself to the spatial conditions connecting that network to everyday urban movement.
Network and catchment approaches establish which destinations are geographically connected to transit within defined spatial or distance thresholds [15]. Their strength lies in assessing coverage and network reachability, but these measures alone do not establish how solar exposure, crossing delays, physical interruptions, or visual uncertainty are distributed along a particular route. Perception-informed walkability assessments address some of these limitations through passenger evidence and statistical calibration [16]. The planning problem at Location 01 is more specific: identifying where to improve an already connected station approach while retaining its principal road and building geometry. The present study therefore treats network connectivity as the spatial context and evaluates additional route-level conditions without claiming to predict observed pedestrian behavior.
The literature is organized around five interconnected themes: first/last-mile accessibility and metro integration; relative solar exposure and shade; physical route friction and physical accessibility condition; visual legibility and wayfinding; and movement-informed spatial decision support. These themes provide the basis for the Place–Pattern–People framework developed in this study.
2.1. First/Last-Mile Accessibility and Metro Station Integration
First/last-mile accessibility concerns the portion of a journey between a passenger’s origin or destination and a public-transport stop or station. Conventional transport planning often represents this relationship through radial or network-based pedestrian catchments [17,18]. Such methods are useful for estimating service areas, but they may overstate practical accessibility when street conditions introduce barriers that geometric distance does not capture. A 500 m route, for example, may perform differently depending on the number of crossings, curb transitions, waiting conditions, route deviations, environmental exposure, and availability of directional cues.
This distinction is particularly relevant around elevated transport infrastructure. A metro corridor may improve regional accessibility while local pedestrian permeability remains uneven. The infrastructure itself may be visually prominent and physically close, yet the station entrance may remain difficult to reach because of wide carriageways, exposed sidewalks, limited crossings, inactive edges, or weakly coordinated interfaces [19]. Proximity therefore represents a potential condition, while accessibility depends on how the route actually performs.
Transit-oriented development research similarly emphasizes walkability, density, mixed use, connectivity, and public-realm quality around stations [4,20]. In hot–arid cities, however, these spatial qualities must also be considered alongside environmental exposure. A connected station area may still perform poorly for pedestrians if the route involves prolonged solar exposure, while a simpler connection may function effectively when shade, crossings, and orientation are well coordinated.
The present study therefore examines Location 01 as a complete station-approach sequence rather than as a collection of isolated design elements. The case already contains formal pedestrian infrastructure, including paving and tactile guidance, but its effectiveness depends on how these elements interact with shade continuity, crossings, and pedestrian-scale legibility.
2.2. Thermal Comfort, Shade, and Pedestrian Mobility in Hot–Arid Cities
Outdoor thermal conditions are particularly important in hot–arid environments, where pedestrian movement can involve high air temperatures and intense solar radiation [21]. Human thermal experience is shaped by radiant heat, wind, humidity, surface temperatures, clothing, activity level, and exposure duration, with solar radiation and mean radiant temperature especially influential in exposed urban spaces [22].
These conditions affect mobility because walking requires continuous exposure to the outdoor environment. Studies in hot climates have shown that shade can improve perceived comfort, extend walking tolerance, increase use of outdoor space, and reduce radiant heat exposure [5,23]. Vegetation and structural shading are therefore commonly incorporated into climate-responsive public-realm design, although they offer different benefits and constraints.
Pedestrian mobility in hot–arid cities has been examined through behavioral assessment, climatic simulation, and route optimization. In Riyadh, Gul et al. [24] document perceived walking barriers and responses to pedestrian-oriented street upgrades, while Binabid evaluates the influence of urban morphology and vegetation on simulated UTCI conditions. In Dubai, Wen et al. [25] develop a dynamic shaded-route approach that considers changing solar conditions and the contribution of indoor pedestrian connections. These studies provide complementary behavioral, physiological-modeling, and route-selection perspectives. However, their outputs should not be treated as interchangeable: self-reported walking responses differ from measured route choices, simulated thermal indices differ from observed heat stress, and shaded-route optimization differs from retrofit evaluation along a retained alignment. Because Location 01 lacks independently observed pedestrian trajectories and field-calibrated microclimatic data, CSEI is used only as a comparative solar-exposure proxy. The relevant design question is where discontinuous protection coincides with other diagnosed route constraints, not whether the analysis establishes physiological comfort or predicts pedestrians’ actual route choices.
Trees provide long-term environmental and ecological value through canopy shade, evapotranspirative effects, surface protection, and visual quality [26,27]. Their limitations include maturation time, irrigation, root-zone requirements, maintenance, and variable canopy density. Structural canopies provide more immediate and predictable shade, especially where planting space is constrained, but offer fewer ecological benefits and require structural coordination and maintenance.
For this study, the central issue is not only total shade but shade continuity along the walking line. A route may contain substantial aggregate shade while leaving exposed gaps at crossings, waiting points, or decision nodes. Conversely, strategically positioned shade may provide greater functional value even when total coverage is lower. This distinction underpins the Shade Continuity Map and Relative Solar Exposure Profile used in the analysis.
2.3. Physical Route Friction, Spatial Friction, and Physical Accessibility Condition
Pedestrian accessibility is not determined by distance alone. Crossings, curb transitions, level changes, obstacles, waiting periods, narrow passages, and changes in direction can increase the physical and cognitive effort required to reach a destination [28]. These conditions may appear minor individually but become more significant when they accumulate along the route.
The concept of spatial friction provides a useful way to represent this effect. Rather than treating all route distance as equivalent, friction-based approaches assign additional cost to conditions that slow movement, require waiting, introduce physical difficulty, or complicate navigation [29]. A slightly longer but uninterrupted route may therefore be easier to use than a shorter route containing repeated crossings or transitions.
These conditions also have implications for accessibility because different users may experience the same route differently. Curb changes, repeated crossings, prolonged waiting, and other interruptions may impose greater burdens on users with different mobility capacities. The magnitude of these burdens cannot be assumed to be equivalent across ambulatory pedestrians, older users, wheelchair users, or people using mobility aids. Physiological exertion, propulsion demand, balance requirements, and tolerance for repeated transitions would require user-specific empirical measurement [30]. The present study therefore treats these conditions as spatial indicators of potential route friction rather than as calibrated measures of human exertion or universal-access performance.
Distance- and event-based friction measures allow crossings, waiting conditions, level transitions, and obstacles to be compared consistently, but their assigned penalties cannot be equated with physiological exertion or equivalent difficulty across different mobility groups [31,32]. The PRFI therefore identifies the spatial accumulation of coded interruptions within S1–S12 rather than predicting user-specific movement burden. For retrofit planning, this distinction is essential: reducing a coded friction condition may improve the comparative spatial diagnosis, while compliance with clear-width requirements, tactile guidance, and wheelchair maneuvering must be verified independently. Physical accessibility consequently remains a non-compensatory prerequisite rather than another weighted performance benefit.
2.4. Visual Legibility, Isovists, and Wayfinding
Accessibility also has a perceptual dimension. Pedestrians must be able to recognize entrances, crossings, direction changes, and the sequence leading toward the station [33]. Wayfinding research commonly addresses environmental legibility, landmark recognition, signage, visual connectivity, and the cognitive processes through which routes are understood [34,35].
Isovists provide a spatial method for examining visible areas, occlusions, landmarks, and changes in visual access from specific points, while visibility graph analysis extends these relationships across multiple viewpoints [36]. Such methods are particularly relevant where large-scale infrastructure is visually prominent but the actual route to the entrance remains unclear.
Isovist and visibility-graph methods characterize spatial visibility and potential visual connections, but geometric visibility does not establish whether pedestrians notice, recognize, or correctly interpret available cues [36]. This distinction is relevant to Location 01, where the elevated metro structure may provide broad orientation while the next crossing, directional change, or station approach remains unclear. VRCS consequently addresses a narrower spatial question: whether predefined route-confirmation cues are available at pedestrian decision nodes. It does not estimate visual attention, glare response, cognitive wayfinding performance, or actual navigation success. Eye-tracking, passenger navigation trials, and environmental measurements would be required to establish whether the modeled visual cues are recognized and used by pedestrians.
2.5. Inferred Origin–Destination Relationships and Movement Correspondence
Pedestrian route-choice research demonstrates that walking decisions are associated with spatial directness, destination access, comfort, visibility, and perceived safety [37,38]. Behavioral models can estimate the relative importance of these factors when observed trajectories or passenger-response data are available. Context-based transport-demand models offer another approach by combining origin–destination information with residential, service, and transport-stop characteristics, although their estimates require validation against observed outcomes [39]. No pedestrian-tracking dataset was available for Location 01. Commercial entrances, sidewalks, crossings, pause points, and station access are therefore treated as plausible origins, destinations, and spatial connections rather than observed pedestrian movements. RCR evaluates whether the formal route supports these inferred relationships; it does not estimate movement volumes, revealed preferences, or heat-adapted route choices. Its value lies in identifying potential discrepancies between the physical route and surrounding activity interfaces that can subsequently be examined through field observation.
2.6. Multi-Criteria Urban Retrofit and Spatial Decision Support
Urban retrofit involves competing performance objectives. Climate-responsive pedestrian interventions must balance shade continuity, accessibility, route continuity, visual legibility, ecological value, adaptability, maintenance, and implementation constraints [40,41]. These criteria do not necessarily point toward the same design solution.
Trees may provide strong environmental benefits but be constrained by root zones, irrigation, or infrastructure. Structural canopies may deliver immediate shade but impose greater structural and maintenance demands. Scenario selection is therefore inherently a multi-criteria decision problem.
Multi-criteria decision analysis provides established methods for comparing alternatives against competing objectives. Techniques such as AHP, BWM, TOPSIS, and VIKOR can support stakeholder-based weighting, consistency assessment, and alternative ranking [42,43]. Their analytical value depends on appropriate indicator construction, defensible evidence, and the reliability of decision preferences rather than computational complexity alone. The present study does not have locally elicited commuter weights, verified lifecycle costs, or independently validated behavioral and thermal outcomes. IPS therefore adopts equal weighting as an explicit spatial-screening convention, while OPS compares three defined and uncosted retrofit packages under alternative planning priorities. Sensitivity analysis tests the dependence of these rankings on selected assumptions but cannot establish their empirical optimality. The structured comparison in Table 1 documents how the evidence requirements, analytical procedures, and decision outputs of established approaches differ from this case-specific assessment.
Table 1.
Methodological comparison of pedestrian accessibility, climate-responsive design, and transit decision-support research in hot–arid cities.
A focused comparison of recent research from hot–arid urban contexts was undertaken to clarify the methodological position of the proposed framework. Studies from Riyadh, Doha, Dubai, Muscat, and other Saudi metropolitan settings were selected for their direct relevance to station-area accessibility, pedestrian thermal conditions, streetscape intervention, or transport decision support. Each study was evaluated using five consistent dimensions: analytical resolution, input data, indicator construction, validation or robustness procedures, and planning decision outcomes. The comparison distinguishes existing methodological capabilities from the narrower decision-support task examined at Location 01 (Table 1).
The regional comparison demonstrates that integrated climate-responsive accessibility assessment is already established in hot–arid urban research. Studies from Riyadh, Dubai, Doha, and Muscat have advanced district-scale transit diagnostics, simulated pedestrian thermal conditions, optimized shaded routes, estimated streetscape preferences, and prioritized interventions through multi-criteria procedures. Their analytical resolution, evidence requirements, and decision outputs nevertheless differ. Within this focused set of studies, the present research addresses the more specific task of relating environmental, physical, visual, and inferred movement conditions to fixed route segments and linking their combined diagnosis to the comparative evaluation of physical retrofit packages. This constitutes a distinction in application and decision-support purpose, not evidence of methodological superiority or a previously unavailable analytical capability. Unlike approaches supported by observed pedestrian responses or calibrated thermal simulations, the present framework relies on modeled and inferred spatial indicators and internal robustness testing. Independent behavioral and microclimatic validation therefore remains necessary before its effectiveness can be established beyond Location 01.
2.7. Conceptual Framework: Place, Pattern, and People
The literature reviewed above indicates that first/last-mile accessibility around metro stations emerges from interacting environmental, spatial, and human-centered conditions. Environmental exposure can affect walking tolerance; spatial configuration shapes continuity and physical effort; visibility influences route legibility; and inferred movement relationships identify plausible spatial connections between origins and destinations. Treating these dimensions separately can therefore produce incomplete diagnoses.
This study organizes these relationships through the Place–Pattern–People framework:
- Place represents the environmental and physical context of movement, including solar exposure, shade continuity, material conditions, planting opportunities, and the physical capacity of the corridor to accommodate retrofit measures.
- Pattern represents the spatial organization of movement, including route continuity, crossings, interruptions, configuration, and relationships between entrances, destinations, and the station.
- People represents the human-centered accessibility dimension, including physical route friction, universal-access conditions, visibility, wayfinding, inferred movement relationships, and spatial conditions relevant to users with different mobility capacities.
The theoretical rationale of the framework rests on the distinction between potential accessibility and the environmental, physical, and perceptual conditions encountered when accessing transit. Network connectivity establishes the geometric opportunity to reach a station, but the practical quality of that connection also depends on the continuity of climatic protection, the accumulation of physical interruptions, and the availability of recognizable route-confirmation cues. Behavioral evidence demonstrates that pedestrians may trade walking distance against solar exposure, although the magnitude of such trade-offs varies across users and contexts. Inferred origin–destination relationships provide a further spatial reference by indicating which connections may be relevant to surrounding activities without establishing observed demand.
These relationships provide the conceptual basis for the Place–Pattern–People framework. Place records environmental conditions and retrofit capacity; Pattern describes route configuration, continuity, and connection; and People identifies spatial conditions relevant to pedestrian movement, accessibility, and visual orientation. Within Location 01, the three domains are registered to a common spatial base because the same pedestrian segment may simultaneously contain solar exposure, crossing interruptions, weak route confirmation, and plausible destination connections. The analytical sequence retains these dimensions separately before assessing their co-location through IPS and comparing retrofit responses through OPS. This approach establishes a traceable connection between spatial diagnosis and design decisions, not a statistically validated causal model of pedestrian behavior. Its applicability remains conditional on the available evidence, while physical accessibility is assessed separately as a mandatory design requirement (Figure 2).
Figure 2.
Place–Pattern–People framework integrating environmental, spatial, and human-centered conditions within a common pedestrian-access assessment. Source: Authors.
3. Methodology
3.1. Research Design and Case Selection
This study adopts an applied, design-led, quantitative-spatial case-study approach to examine how a station-parallel pedestrian route in Riyadh can be retrofitted to improve solar protection, accessibility, and spatial legibility. Environmental, spatial, perceptual, and movement-related conditions are integrated through the Place–Pattern–People framework using a common registered spatial base so that overlapping deficiencies can be identified and translated into targeted retrofit priorities.
Location 01 was selected as a critical case because it combines conditions commonly associated with elevated metro access in Riyadh: prolonged solar exposure, a linear route between commercial frontage and transit infrastructure, interruptions at crossings and entrances, existing tactile guidance, limited shaded pause opportunities, and a visually dominant viaduct that does not consistently provide pedestrian-scale orientation toward the station entrance (Figure 3).
Figure 3.
Location 01 within the surrounding street network and documented pedestrian approach to the metro station. Source: Authors.
The case was selected to test the internal analytical coherence of the framework under a clearly defined elevated-corridor morphology, not to represent the full range of Riyadh Metro station types. This controlled morphology allows the effects of climatic exposure, route friction, legibility, and inferred movement relationships to be examined while major infrastructural conditions remain fixed. Underground portals, at-grade stations, multi-level interchanges, and stations embedded within more complex urban fabrics may generate different decision-node structures, visibility conditions, crossing relationships, and approach sequences and therefore require separate comparative testing. The metro alignment, carriageway, building footprints, primary pedestrian path, crossings, and tactile guidance were retained as fixed conditions so that retrofit scenarios could be compared consistently.
3.2. Evidence Base and Units of Analysis
The evidence base consists of four categories: (i) site photographs documenting visible route and pedestrian-interface conditions; (ii) the Location 01 wayfinding plan providing a spatial reference for station access and route relationships; (iii) observable route features coded for the baseline corridor; and (iv) three proposed retrofit configurations comprising trees, lightweight canopies, and a hybrid system. These materials serve different evidential purposes. Photographs and the wayfinding plan inform the spatial description of existing conditions; coded features support comparative diagnostic indicators; and the proposed configurations provide design-stage scenario inputs. They do not constitute field-measured microclimatic data, observed pedestrian trajectories, or post-implementation evidence. Source provenance, spatial-reference limitations, and links between source materials and coded indicators are documented in Supplementary Table S1A. The evidence was organized on a common spatial base and examined through three nested units of analysis.
The corridor unit assesses relationships among surrounding plots, commercial frontage, carriageway, crossings, and the station. The route-sequence unit examines the cumulative pedestrian journey, including shade gaps, waiting conditions, direction changes, and movement friction. The pedestrian-interface unit focuses on eye-level visibility, tactile guidance, curb transitions, seating, street furniture, frontage access, and station orientation.
The pedestrian route was divided into twelve consecutive analytical segments (S1–S12) using a predefined spatial-event rule applied before indicator scoring. Segment boundaries were established at mapped changes in crossing or curb-transition conditions, frontage or access relationships, route direction, station-approach conditions, or pedestrian-interface configuration. Where several changes coincided, a single shared boundary was retained. Shade and relative solar-exposure scores were not used to redefine segment boundaries. The resulting segments were fixed across all diagnostic layers and retrofit scenarios to prevent changes in analytical-unit definition from influencing comparisons. Supplementary Table S1 reports the normalized length shares, while Table S1B provides cumulative positions along the normalized route. Original segment-boundary triggering events, metric coordinates, and source-document references have not been independently recovered and require verification against the original spatial material. The same segment identifiers are retained throughout the indicator calculations, integrated prioritization, and scenario comparisons (Figure 4).
Figure 4.
Common spatial base, twelve route segments, and three analytical units used to assess Location 01. Source: Authors.
The analytical record distinguishes visually documented conditions, spatially derived route attributes, inferred movement relationships, and modeled retrofit assumptions. Baseline conditions were assigned to the twelve fixed route segments (S1–S12), six visual decision nodes (N1–N6), or twelve inferred origin–destination relationships (OD1–OD12), as applicable. The source-to-indicator audit identifies the evidence supporting these records and distinguishes directly identifiable site features from interpretive or design-stage inputs. Route lengths are presented as normalized proportions of the complete walking line (Supplementary Table S1) rather than independently surveyed metric distances. Where source dates, drawing scales, spatial-reference information, or original measurement records cannot be verified, these limitations are documented instead of implying unavailable measurement precision.
3.3. Multi-Layer Analytical Framework
The workflow comprises five spatial diagnostic layers—shade continuity, relative solar exposure, physical route friction, visual route confirmation, and inferred origin–destination correspondence—followed by a separate sixth component, the Option Performance Matrix. The diagnostic outputs use a common registered spatial base; the matrix compares conceptual retrofit alternatives (Figure 5).
Figure 5.
Six-component analytical framework and workflow for diagnosing pedestrian conditions, comparing retrofit alternatives, and checking design coordination. Source: Authors.
Shade Continuity: The Shade Continuity Ratio (SCR) measures the proportion of the registered pedestrian walking line covered by existing or proposed shade under the same representative hot-period assessment condition across all scenarios. This assessment represents a controlled single-period comparison rather than a seasonal or lifecycle shade simulation. Solar geometry was not evaluated across multiple times of day or seasons, and vegetative shade was not modeled dynamically by species, canopy age, leaf density, pruning regime, or growth stage. The resulting SCR values should therefore be interpreted as comparative design-state shade conditions under the selected hot-period assessment rather than as annual or multi-year shading performance. The condition was applied as a controlled comparative solar-exposure setting rather than as a calibrated physiological thermal-comfort simulation; detailed assessment assumptions and segment-level shade records are provided in the Supplementary Information.
The assessment does not test the combined effects of route orientation, changes in solar altitude and azimuth, shading-element height, or shadows cast by surrounding buildings at alternative dates and hours. Such variations may alter the modeled shade fractions and comparative solar-exposure classes. Accordingly, SCR and CSEI are interpreted as conditional design-stage indicators rather than predictions of diurnal, seasonal, or lifecycle environmental performance. Stability of the intervention rankings under alternative solar geometries remains unverified.
The analytical resolution is limited to twelve event-defined route segments, with normalized length shares ranging from 4% to 12% of the complete walking line. Partial shade is represented in SCR through fractional centerline coverage, whereas CSEI assigns one exposure category to each segment based on its assessed exposure extent and continuity. Consequently, CSEI does not resolve fine-grained variations in partial shading, canopy permeability, shadow boundaries, or exposure within individual segments. Classification uncertainty may arise from the spatial evidence, the interpretation of mixed shaded and exposed conditions, and differences in assessor judgment. The available analytical record does not establish independently calibrated class boundaries or inter-rater agreement for CSEI. These limitations are distinguished from the numerical sensitivity of the resulting index, which is examined through a bounded classification–perturbation test. Shade continuity was calculated as:
where Ls is the length of route under effective shade and Lt is total route length. The analysis also recorded the longest uninterrupted exposed gap and whether crossings, waiting areas, and decision points were shaded. These values represent modeled comparative conditions rather than field-measured solar-exposure performance. These climatic outputs are modeled spatial indicators rather than field-validated environmental or pedestrian responses; their evidential limitations are detailed in Section 3.6.
Relative Solar Exposure (CSEI): Each route segment was assigned a case-relative direct-sun exposure class from 1 (very low) to 5 (very high) under the same representative hot-period condition. The Cumulative Solar Exposure Index (CSEI) is the route-length-weighted mean of these ordinal classes, calculated as:
where 𝓁i is the length of segment i, or its consistently normalized route-length share, and ei is its ordinal exposure class. Despite its established name, CSEI does not measure radiation accumulated over time, air temperature, mean radiant temperature, PET, UTCI, or physiological heat stress. It is a comparative spatial exposure proxy.
The five-level classification was adopted as a coarse, case-relative means of distinguishing spatial exposure conditions at the level supported by the available route documentation, without implying the precision of calibrated solar-radiation or thermal-comfort measurements. The classification considers the relative extent and continuity of direct exposure within each fixed segment, while the aggregation uses segment-length shares to represent each segment’s contribution to the complete walking route. This avoids assigning identical influence to analytical segments of unequal length. The arithmetic aggregation assumes equally spaced numerical scores as a transparent modeling convention; it does not imply that successive exposure categories represent equivalent physical increments in radiation, exposure duration, or physiological burden. Consequently, differences in CSEI are interpreted as changes in a comparative spatial score rather than proportional reductions in actual thermal exposure. The classification criteria and supporting segment-level evidence are documented in Supplementary Section S3.
The segment-level shade fractions (Supplementary Table S2) and ordinal exposure classes (Table S4) are comparative design-stage inputs. Their numerical reconstruction is documented, but original class-assignment evidence for selected segments remains incomplete (Supplementary Table S4A). The resulting CSEI comparisons should therefore be interpreted as conditional coded scenarios rather than instrument-calibrated or fully source-verified thermal assessments.
Physical Route Friction (PRFI): The Physical Route Friction Index is a unitless, rule-based measure of coded movement interruptions rather than physiological effort or verified accessibility. For each segment, PRFI combines normalized route distance with predefined penalties for crossings, curb or level transitions, obstacles, waiting requirements, and major directional changes:
PRFIi = di + ci + bi + oi + wi + gi
Here, di represents normalized segment distance; and ci, bi, oi, wi, and gi represent the respective event penalties. The coefficients and segment records are documented in Supplementary Table S5. These heuristic values do not quantify actual walking effort, wheelchair propulsion, travel time, or accessibility compliance. A separate accessibility audit is required before implementation.
The same event-specific coefficients were applied consistently across S1–S12 and the retrofit scenarios, with changes recorded only where a proposed intervention altered a coded physical condition. Importantly, an identical route interruption may impose substantially different difficulties on wheelchair users, older pedestrians, and individuals using mobility aids. As this study does not measure these user-specific responses, PRFI is interpreted as an indicator of accumulated spatial interruptions rather than a measure of equivalent mobility burden, universal accessibility, or compliance with accessibility requirements. Empirical calibration for different mobility groups would require independent field assessments and user-informed evaluation.
Visual Route Confirmation (VRCS): The Visual Route Confirmation Score measures the spatial availability of four predefined cues at six pedestrian decision nodes: station-portal visibility, next-segment visibility, directional-cue availability, and required crossing or destination–connection visibility. Each resolved cue receives 1 and each unresolved cue 0. The score is calculated as:
where anqk represents the binary status of cue q at node n under scenario k. VRCS is reported as a percentage of spatially resolved cues, using the same 24-condition denominator across scenarios. It does not quantify isovist area, observed navigation success, visual attention, glare tolerance, or cognitive wayfinding performance (Supplementary Tables S6 and S7).
Inferred Origin–Destination Relationships and Route Correspondence: The Inferred Origin–Destination and POI Overlay identifies plausible spatial relationships among the station, commercial entrances, surrounding sidewalks, crossings, and principal access or pause points. These relationships were derived from registered site geometry and functional access locations rather than from observed pedestrian trajectories, mobile-device tracking, or movement counts.
The Route Correspondence Ratio (RCR) represents the proportion of twelve spatially inferred origin–destination relationships supported by a continuous, legible, and directly connected pedestrian route under each scenario. Each relationship is treated as one equally weighted binary spatial connection, without adjustment for observed pedestrian volumes, trip frequency, or revealed route preferences (Supplementary Tables S8 and S9). Accordingly, RCR evaluates the extent to which a proposed spatial configuration supports a predefined set of plausible access relationships rather than estimating actual pedestrian demand or route-selection behavior. Improvements in route continuity or legibility may increase RCR even when the principal street geometry remains unchanged. Such improvements indicate stronger modeled support for the inferred connections and should not be interpreted as evidence of increased pedestrian use, changes in route preference, or higher metro ridership. Establishing these behavioral relationships would require independent pedestrian observation or trajectory-based validation.
3.4. Integrated Priority Analysis
To identify locations where multiple deficiencies overlap, each route segment was normalized against five diagnostic conditions: shade discontinuity, relative solar exposure, physical route friction, visual route-confirmation deficiency, and inferred movement conflict. Variables were transformed to a common 0–1 scale, with 0 representing the most favorable condition and 1 the least favorable. Indicators in which higher raw values represented better performance were reverse-coded. The Integrated Priority Score was calculated as:
where Si, Ti, Pi, Vi, and Di represent the normalized diagnostic values for shade discontinuity, relative solar exposure, route friction, visual-confirmation deficiency, and inferred movement conflict, respectively.
IPSi = 0.20Si + 0.20Ti + 0.20Pi + 0.20Vi + 0.20Di
Equal weights of 0.20 were adopted as a transparent reference configuration rather than empirically calibrated estimates of the relative importance of the five diagnostic dimensions. This choice does not establish substantive neutrality or equivalent effects on pedestrian behavior. In particular, shade discontinuity and relative solar exposure together contribute 0.40 to the composite score, although these two indicators represent related environmental conditions. The resulting IPS is therefore interpreted as a conditional spatial-screening score rather than an independently validated measure of intervention urgency (Figure 6).
Figure 6.
Combination of five normalized diagnostic conditions into a segment-level Integrated Priority Score. Source: Authors.
For descriptive comparison, the normalized 0–1 score is divided into four equally sized numerical screening bands: Low (0 ≤ IPS < 0.25), Moderate (0.25 ≤ IPS < 0.50), High (0.50 ≤ IPS < 0.75), and Highest (0.75 ≤ IPS ≤ 1.00). These author-defined boundaries do not represent empirically established thresholds for pedestrian discomfort, movement avoidance, accessibility failure, safety risk, or investment priority. A segment in the Highest band is identified for further assessment rather than automatically designated for intervention, while a lower score does not exclude an accessibility or safety deficiency requiring attention. The five diagnostic contributions remain separately traceable, and sensitivity to indicator inclusion and screening-band boundaries is evaluated in the Supplementary Information. Empirical calibration of weights and thresholds would be required before IPS could serve as an operational resource-allocation rule.
Cross-layer sensitivity was additionally evaluated through a leave-one-dimension-out procedure. The IPS was recalculated five times, sequentially excluding shade discontinuity, relative solar exposure, physical route friction, visual route-confirmation deficiency, and inferred movement conflict. In each iteration, the four retained dimensions were assigned equal weights of 0.25. Although some diagnostic dimensions are spatially related, they represent distinct analytical constructs: shade discontinuity captures continuity of protection; relative solar exposure captures cumulative exposure; physical route friction captures coded movement interruption; visual route-confirmation deficiency captures spatial legibility; and inferred movement conflict captures correspondence with inferred movement relationships.
A controlled descriptive comparison was conducted to examine whether cross-layer integration changes the prioritization obtained from independently assessed indicators. The no-integration comparator retained the same twelve route segments and normalized diagnostic inputs but assessed shade discontinuity, relative solar exposure, physical route friction, visual route-confirmation deficiency, and inferred movement conflict separately, without combining them into IPS. To provide a common comparison basis, the four highest-priority locations under each indicator were examined against the four highest IPS locations. Selection agreement and Spearman rank correlation were calculated where rankings permitted unambiguous comparison; ties were retained rather than resolved through arbitrary ordering. A simple count of severe diagnostic conditions (normalized values of at least 0.75) provided an additional aggregation baseline. The comparison evaluates differences in within-case prioritization and diagnostic interpretation, not independent prediction accuracy or observed planning effectiveness.
To examine the sensitivity of IPS to weight selection and classification assumptions, an expanded deterministic analysis was performed using the twelve-segment normalized dataset. Each of the five indicator weights was independently allowed to take values of 0.10, 0.15, 0.20, 0.25, or 0.30, subject to the requirement that their sum equal 1.00. This generated 381 feasible weight combinations, including the original equal-weight configuration. The selected interval represents an illustrative methodological stress range rather than empirically calibrated stakeholder preferences.
The analysis additionally examined four input-scaling specifications: the original baseline-anchored min–max scores, square-root-transformed scores, squared scores, and baseline-anchored midrank-percentile scores. The alternative transformations preserve the ordering of individual indicator values while changing the numerical contribution of intermediate conditions. The same baseline-derived scaling specification was retained when evaluating the hybrid scenario to preserve comparability.
Classification sensitivity was examined by simultaneously shifting the three IPS screening-band boundaries by −0.05 and +0.05 relative to their reference values of 0.25, 0.50, and 0.75. The complete design therefore comprised 381 weighting configurations, four input-scaling specifications, and three boundary configurations, producing 4572 parameter combinations for each available segment-level assessment condition. Robustness was evaluated through the identity of the four highest-ranked baseline segments, membership within the highest screening band, and changes in the distribution of segment classifications. The tests assess internal dependence on modeling assumptions and do not establish empirical validity of the weights or planning thresholds.
3.5. Retrofit Scenarios and Comparative Evaluation
Three conceptual retrofit packages—tree planting, lightweight canopies, and a hybrid—were compared using the same corridor geometry and analytical criteria, without equalizing installed quantities, capital budgets, or lifecycle expenditure. Tree and hybrid shade values assume established vegetative coverage, whereas structural-canopy coverage represents the proposed installed configuration. Species, planting dimensions, canopy specifications, installation quantities, and costed maintenance schedules were not established to construction-design level. The results therefore compare modeled spatial performance rather than short-term delivery, resource efficiency, or lifecycle feasibility. Available assumptions and unresolved specifications are summarized in Supplementary Table S17A (Figure 7).
Figure 7.
Existing corridor and three proposed retrofit configurations using a consistent viewpoint and retained site geometry. Source: Authors.
All scenarios were evaluated using eight scored performance criteria: shade continuity (SCR), solar-exposure performance (CSEI), route correspondence (RCR), visual route confirmation (VRCS), environmental value, adaptability, maintenance demand, and implementation complexity. Physical accessibility was evaluated separately as a non-compensatory design requirement rather than included as a weighted criterion. This distinction was adopted because the available evidence does not support reliable differentiation of wheelchair or mobility-aid performance among the proposed scenarios. Tree pits, canopy foundations, planting beds, seating, and other retrofit elements may alter clear width, maneuvering space, surface continuity, or tactile guidance even when the principal street and crossing geometry remains unchanged. A scenario should therefore not receive an assumed accessibility benefit or neutral score unless these effects are demonstrated through an accessibility audit.
Reported aggregates were independently reconstructed from the documented segment, node, and inferred-relationship records. SCR and CSEI use route-length weighting, VRCS and RCR use fixed binary denominators, and PRFI and IPS follow their predefined coding and aggregation rules. Calculations retain source precision until final reporting, while all input and output units, source classifications, and verification checks are documented in the Supplementary Information. These checks establish internal numerical reproducibility, not independent empirical validation (Table 2).
Table 2.
Criterion-level scenario scoring matrix for eight comparative performance criteria.
Before implementation, each scenario should pass a dedicated accessibility screen verifying continuous unobstructed width, curb and level transitions, tactile-guidance continuity, maneuvering clearances, surface evenness, and the placement of columns, tree pits, furniture, and other fixed elements. Failure to satisfy the applicable accessibility requirements should trigger redesign irrespective of the scenario’s OPS. Accessibility is therefore treated as a prerequisite condition that cannot be compensated for by stronger performance in shade, environmental value, or other criteria.
The judgment-based scores represent provisional single-rater author assessments applied against predefined qualitative anchors; no independent second rating was undertaken, so inter-rater agreement cannot be reported and some assessor bias may remain. For maintenance demand and implementation complexity, the assessment considers only characteristics evident in the proposed intervention systems, including irrigation and vegetation establishment requirements, structural inspection and upkeep, the number of systems requiring coordination, foundation requirements, and the likely coordination of planting and structural components. The scores do not incorporate municipal budget cycles, contractor availability, procurement lead times, local specialist capacity, or regional supply-chain conditions. They should therefore be interpreted as comparative design-stage operational assumptions rather than verified measures of municipal feasibility.
For indicators where higher raw values represented better performance, the standardized score was calculated as:
For indicators where lower raw values represented better performance, the direction was reversed:
Here Sik is the standardized criterion score for scenario k, xik is the corresponding raw value, and xk,min and xk,max are the minimum and maximum values across the assessed baseline and retrofit scenarios. The resulting scores are relative to the tested alternatives and should be recalculated when the comparison set changes (Table 3).
Table 3.
Scoring anchors for judgment-based criteria.
The same anchors and documented scenario characteristics were applied consistently to all three alternatives. Half-point increments were permitted where a scenario’s characteristics fell between two adjacent rubric anchors, allowing more precise comparative scoring while retaining the predefined five-point structure. The judgment-based scores reflect the comparative characteristics of the three tested intervention types. Trees receive the strongest environmental-value score but incur irrigation, establishment, and landscape-maintenance demands. Lightweight canopies provide relatively predictable implementation and maintenance conditions but contribute less ecological value.
The hybrid option performs strongly in environmental value and adaptability because it combines both systems, but it receives the least favorable maintenance and implementation-complexity scores because it requires the coordinated installation and long-term upkeep of both vegetative and structural intervention systems. These operational penalties are therefore not structured to advantage the hybrid alternative. Their magnitude, however, remains provisional because it has not been calibrated against local municipal, contractor, or procurement evidence.
The Option Performance Matrix records the criterion-level ratings for each alternative, while their weighted aggregation produces the Overall Performance Score (OPS). This score represents uncosted comparative performance rather than economic viability or resource efficiency. Material quantities, irrigation costs, maintenance expenditure, and replacement cycles were not quantified. OPS was calculated as:
where Sik is the standardized 1–5 performance score of scenario i on criterion k, and wk is the corresponding criterion weight. In the equal-weight model, the eight scored criteria each receive a weight of 0.125. Alternative climate-priority, pedestrian-access-priority, and implementation-priority weights are applied to the same criterion-level score matrix so that sensitivity testing changes only the decision priorities and not the underlying scenario evidence (Table 4).
Table 4.
Operational Definitions, Units, and Evidence Status of the Analytical Indicators.
Equal weighting was used as the baseline, followed by sensitivity testing under three alternative weighting structures: climate priority, pedestrian-access priority, and implementation priority. These structures were intended to test rank stability under plausible shifts in planning emphasis rather than to represent empirically validated stakeholder preferences (Table 5).
Table 5.
Sensitivity-analysis weighting structures.
Scenario changes were calculated from the underlying numerical inputs, while CSEI and PRFI are reported to one decimal place in the main manuscript to reflect their comparative and non-calibrated nature. Additional computational precision is retained in the Supplementary Information solely for reproducibility and does not imply greater measurement accuracy. Differences between proportions are expressed in percentage points, whereas CSEI changes are reported in ordinal index points rather than percentages of physical thermal exposure. SCR was reconstructed through route-length weighting, while strategic-node shade, VRCS, and RCR use fixed denominators of 12, 24, and 12, respectively (Supplementary Tables S1–S9). The reported perturbation ranges represent conditional coding sensitivity rather than statistical confidence intervals.
A scenario was considered comparatively robust when its rank remained stable across the alternative weighting structures. The sensitivity analysis therefore evaluates dependence on decision assumptions rather than statistical uncertainty.
Because maintenance demand and implementation complexity are judgment-based criteria, an additional operational-score sensitivity test was conducted by varying each score by ±1 point while holding the remaining criterion scores constant. One-at-a-time perturbations did not reverse the scenario ordering under the implementation-priority model, indicating that the result is not dependent on a single one-point adjustment to either operational criterion. A conservative joint stress test was also examined in which both hybrid operational scores were reduced by one point while the corresponding tree and canopy scores were increased by one point. Under this deliberately adverse assumption, the canopy alternative overtook the hybrid under implementation-priority weighting. The test therefore indicates that the scenario ordering has robust to moderate individual scoring variation but can change when multiple operational assumptions shift simultaneously.
To examine whether the integrated framework generates prioritization outcomes distinct from conventional approaches, a decision–output benchmark was conducted using the twelve baseline segments and the five normalized diagnostic indicators. The four highest-priority IPS segments were compared with shade-only screening, relative solar-exposure-only screening, physical-friction-only screening, a count of severe diagnostic conditions (normalized values of 0.75 or greater), and conventional equal-weight TOPSIS. TOPSIS used vector-normalized indicators, with greater diagnostic deficiency representing higher intervention priority. Comparison measures included agreement in the four selected segments and Spearman rank correlation across all twelve segments. Separately, the ranking of the three retrofit packages was tested using TOPSIS applied to the eight OPS criteria. Segment-level baseline and hybrid IPS values were also compared to distinguish initial intervention priority from modeled responsiveness. These tests evaluate descriptive decision consistency and differences within the available dataset, not predictive accuracy or independent empirical superiority. The four-segment comparison does not represent an equal-cost intervention budget.
3.6. Multi-Scalar Verification, Analytical Consistency, and Limitations
The highest-ranked scenario was reviewed at three analytical scales. Corridor-scale review considered intervention distribution; route-sequence review examined intended shade and wayfinding continuity; and pedestrian-interface review identified potential conflicts involving walking width, tactile guidance, seating, trees, canopies, crossings, and frontages (Figure 8). These design-stage checks do not replace a measured accessibility-compliance audit.
Figure 8.
Coordinated review of the hybrid proposal at corridor, route-sequence, and pedestrian-interface levels. Source: Authors.
Analytical consistency was supported by using the same spatial base, route segmentation, coding logic, and scenario boundaries across all layers. Because segmentation was defined from pre-analysis route events and then held constant, differences among the baseline and retrofit scenarios cannot result from subsequent adjustment of analytical-unit boundaries. The segmentation therefore functions as a fixed spatial reference for comparing changes in shade, relative solar exposure, physical route friction, visual legibility, and route correspondence.
Accordingly, the cross-layer analysis should be interpreted as evidence of spatial co-occurrence rather than statistically estimated interaction; formal interaction testing requires larger multi-station samples and independent observed outcomes such as pedestrian volumes, route choice, or measured accessibility performance.
Maintenance and implementation-complexity scores are likewise provisional design-stage judgments and have not been validated against municipal budgeting, procurement procedures, contractor capacity, local labor specialization, or material supply chains. Their inclusion allows operational considerations to inform the comparative model, but the resulting scores should not be interpreted as verified estimates of implementation difficulty or lifecycle burden.
The analytical sequence therefore follows a fixed procedure: establish the registered spatial base; define S1–S12; code climatic, physical, visual, and movement-related conditions; normalize indicators where required; identify compound priority locations; evaluate the three retrofit scenarios using the same criteria; and test rank stability under alternative weighting assumptions (Figure 9). The procedure preserves the distinction between observed site conditions, inferred spatial relationships, and modeled comparative outputs.
Figure 9.
Exploded top-view synthesis of the six registered analytical layers at Location 01. Source: Authors.
The Supplementary Information provides the coded numerical records, sensitivity checks, and benchmark calculations (Tables S1–S23). Table S1B records normalized intervals for S1–S12, while Table S1A identifies outstanding provenance and boundary-verification requirements. The registered numerical inputs support internal reconstruction of the reported indicator and ranking outputs but do not independently verify all original boundary locations, node/relationship-to-segment assignments, or ordinal exposure classifications.
This study remains subject to several limitations. It examines a single corridor and does not claim statistical representation of the wider Riyadh Metro network. The twelve analytical segments are generated through predefined spatial-event rules rather than automated clustering and should therefore be understood as reproducible analytical units rather than mathematically unique partitions of the corridor. Future applications with high-resolution continuous spatial data could compare this event-based procedure with automated change-point detection or unsupervised spatial clustering to test segmentation sensitivity.
The present analysis does not model physiological thermal comfort. Its climatic component is limited to shade continuity and relative direct solar exposure and therefore does not resolve dynamic variation in air temperature, wind channeling, humidity, long-wave radiation, or mean radiant temperature. Accordingly, CSEI should be interpreted only as a comparative solar-exposure indicator within Location 01. A full microclimatic assessment would require field-calibrated meteorological inputs and a validated numerical model capable of deriving MRT and physiological indices such as UTCI or PET.
The PRFI likewise uses rule-based route-friction penalties that have not been calibrated against physiological exertion, gait biomechanics, wheelchair propulsion demand, or other user-specific mobility responses. Its values therefore identify spatial friction within the corridor but do not quantify the magnitude of burden experienced by different mobility groups.
The visual route-confirmation assessment is limited to binary spatial confirmation at predefined decision nodes. It does not measure continuous visual-field quality, luminance contrast, solar glare, eye movements, visual attention, cognitive load, or differences in route interpretation among passenger groups. VRCS should therefore be interpreted as a spatial legibility proxy rather than an empirical measure of human wayfinding performance.
Shade modeling is also temporally limited to a representative hot-period condition. Seasonal solar trajectories, diurnal variation, species-specific crown geometry, foliage density, growth, pruning, and canopy maturation were not modeled. The current shade outputs therefore support within-condition scenario comparison but not annual or multi-year lifecycle prediction.
The analysis also does not estimate a behavioral heat-tolerance threshold or identify the combination of thermal conditions and walking distance at which pedestrians shift away from walking. Establishing such thresholds requires field-based behavioral calibration under peak-summer conditions and cannot be inferred reliably from the shade-continuity and relative-exposure proxies used in the present study. IPS weights and priority bands are analytical conventions for within-case spatial comparison. The equal weights of 0.20 do not represent empirically calibrated commuter preferences and should not be interpreted as estimates of the relative behavioral influence of each diagnostic condition. Consequently, the IPS identifies compound intervention priority but cannot determine which individual constraint causes route avoidance or abandonment.
4. Results and Analytical Findings
The results are derived and modeled outputs from the registered spatial framework rather than post-occupancy or instrument-based field measurements. They should therefore be interpreted as comparative scenario estimates of spatial performance rather than demonstrated reductions in physiological heat stress, measured microclimatic improvement, or observed pedestrian satisfaction. The existing corridor and three retrofit configurations were assessed using the procedures defined earlier. The route was divided into twelve sequential analytical segments, S1–S12, which provided a consistent basis for comparing the baseline, tree, lightweight-canopy, and hybrid scenarios.
4.1. Baseline Climatic and Shade Performance
The baseline condition provides formal pedestrian continuity but limited continuity of modeled solar protection. Shade is intermittent and does not consistently correspond with the principal walking line, crossings, or likely pause points.
The modeled baseline Shade Continuity Ratio is approximately 18%, indicating that less than one-fifth of the evaluated route benefits from effective shade under the representative hot-period assessment. Only a small proportion of strategic nodes is adequately protected.
The baseline Cumulative Solar Exposure Index is approximately 4.2 on the five-point comparative scale. Four of the twelve analytical segments fall within the very-high relative exposure category, five within the high category, and only three within moderate or lower exposure levels.
These findings indicate that the baseline problem concerns not simply the absence of shade, but its discontinuous distribution along the pedestrian sequence. Existing shaded elements do not form a sufficiently continuous network to protect the route at key crossings, waiting points, and decision locations.
4.2. Physical Route Friction and Accessibility Conditions
The baseline Physical Route Friction Index is approximately 7.9, with the highest values associated with crossings, curb or level transitions, waiting requirements, physical interruptions, and major changes in direction near the final station approach. This value represents accumulated coded route-friction conditions and should not be interpreted as physiological effort or as equivalent burden across users with different mobility capacities.
Several of these high-friction locations coincide with segments identified as highly exposed in the climatic analysis. The overlap does not mean that solar exposure is included in the PRFI. Rather, it demonstrates that independent physical and environmental disadvantages are concentrated at the same points, which becomes important when the indicators are integrated through the IPS.
Because the tested scenarios retain the principal road geometry, crossing structure, and station alignment, their capacity to reduce physical movement friction is limited. The principal retrofit benefits therefore occur through solar protection, route legibility, and improved correspondence with the inferred movement structure rather than through major alteration of the underlying pedestrian geometry.
4.3. Visual Legibility and Route Confirmation
The visual analysis identifies a distinction between visibility of the metro infrastructure and legibility of the pedestrian route. The elevated viaduct provides a strong large-scale visual reference, but the next movement decision is not consistently apparent from pedestrian eye level.
The baseline Visual Route Confirmation Score is approximately 42%, indicating that fewer than half of the applicable route-confirmation conditions are spatially resolved at the assessed decision nodes.
The VRCS increases to approximately 50% under the tree scenario, 67% under the lightweight-canopy scenario, and 75% under the hybrid configuration. These values represent modeled spatial availability of visual cues rather than observed passenger wayfinding success. The improvement reflects not only the presence of shade but also the spatial sequencing created through repeated structural elements, paving differentiation, and coordinated wayfinding cues. Shade infrastructure can therefore contribute to route legibility when it reinforces the direction and sequence of movement (Figure 10).
Figure 10.
Comparison of baseline and hybrid route-confirmation conditions at consistent pedestrian decision nodes. Source: Authors.
4.4. Inferred Origin–Destination Relationships and Route Correspondence
The spatial overlay identifies commercial entrances, surrounding sidewalks, crossing locations, pause points, and the metro destination as spatial generators from which plausible origin–destination relationships are inferred. These relationships are geometric and functional hypotheses rather than reconstructed pedestrian trajectories.
The baseline Route Correspondence Ratio (RCR) indicates that eight of the twelve predefined origin–destination relationships are spatially supported by continuous, legible, and directly connected routes (approximately 67%). Under the proposed tree, lightweight-canopy, and hybrid configurations, the corresponding modeled proportions are 9/12 (75%), 10/12 (approximately 83%), and 11/12 (approximately 92%), respectively. These values describe the spatial support provided for a selected set of hypothetical access relationships rather than the proportion of pedestrians using those routes or any observed change in movement behavior. Because the relationships were inferred from site geometry and functional access locations, they may exclude actual trip origins, informal crossings, alternative pedestrian paths, or temporally varying route preferences. No independent pedestrian-trajectory data were available to evaluate the agreement between inferred and observed movement patterns. Accordingly, the modeled RCR differences should not be interpreted as verified operational improvements, increased pedestrian volumes, or changes in metro ridership.
4.5. Integrated Hotspot Analysis
Cross-reading the five diagnostic layers reveals compound intervention priorities that are not evident from any single indicator. Under the baseline condition, four of the twelve segments fall within the study-defined Highest IPS screening band, five within the high-priority range, two within the moderate range, and one within the low range.
Segments within the Highest screening band share one characteristic: several diagnosed disadvantages overlap spatially. High relative solar exposure coincides with crossings, waiting events, visual route-confirmation deficiencies, or insufficient spatial support for potential origin–destination connections inferred from mapped access points. The IPS therefore identifies relative intervention need within Location 01 rather than observed movement demand or universal acceptability thresholds.
The leave-one-dimension-out sensitivity analysis provides an additional qualification regarding the inferred movement layer. When the inferred-movement dimension was excluded and the remaining four diagnostic dimensions were equally reweighted, S4, S6, S8, and S10 remained the four highest-priority baseline segments (Supplementary Tables S13 and S14). This indicates that the principal spatial hotspots are not identified solely because of the inferred movement relationships. However, the result demonstrates internal prioritization stability rather than agreement with observed pedestrian trajectories or behavioral outcomes.
Under the original equal-weight IPS specification and baseline-anchored min–max normalization, the hybrid scenario contains no segments within the study-defined Highest screening band. Two segments remain in the High category, six in Moderate, and four in Low (Figure 11). These classifications are conditional on the adopted indicator weights, numerical scaling, and screening boundaries. They should not be interpreted as demonstrating the elimination of accessibility barriers, safety deficiencies, or empirically established intervention requirements.
Figure 11.
Baseline and hybrid distributions of integrated intervention priority across the twelve analytical segments. Source: Authors.
A screening-band sensitivity test was conducted to assess whether the principal hotspot identification depended on the selected classification boundaries. The three band cutoffs were simultaneously decreased or increased by 0.05 while preserving the underlying IPS values and indicator weights (Supplementary Table S14A). The same four baseline segments—S4, S6, S8, and S10—remained in the highest screening band across these alternative classifications, while the hybrid configuration retained no segments in that band. However, the distribution among lower screening categories changed, particularly under the higher cutoff structure. This indicates that the identification of the principal compound hotspots is internally stable within the examined cutoff range, whereas intermediate priority labels are more sensitive to classification assumptions. More restrictive thresholds can also alter the highest-priority group. These findings support the use of IPS for comparative screening but do not establish empirically validated intervention thresholds or justify resource allocation without independent site assessment.
The expanded sensitivity analysis demonstrated a distinction between relative hotspot identification and fixed-category stability. Across all 381 feasible weight combinations, the four highest-ranked baseline segments remained S4, S6, S8, and S10. The same leading set was retained under the three alternative input-scaling specifications. However, classification membership varied with the numerical assumptions. Under the original min–max specification and the reference Highest-band cutoff of 0.75, all four segments retained that classification in 313 of the 381 weighting combinations; under the stricter cutoff of 0.80, the corresponding number decreased to 172. Alternative score transformations produced further changes in category membership, including instances in which one or two hybrid segments entered the Highest band (Supplementary Table S14B,C). These findings indicate that the principal baseline hotspot set is internally stable within the tested parameter ranges, whereas absolute priority classifications and claims of complete category elimination are less robust. IPS should consequently be applied as a relative spatial-screening instrument rather than a calibrated basis for intervention authorization or resource allocation.
4.6. Comparative Performance of the Retrofit Scenarios
Under the modeled design-state assumptions, SCR reaches 62% for trees, 71% for lightweight canopies, and 84% for the hybrid (Table 6). The tree and vegetated hybrid components assume established canopy rather than installation-stage shade; therefore, the hybrid’s first-year coverage cannot be inferred from these results. Structural canopies could provide protection following installation, but construction duration and phasing were not assessed. The resulting scenario ranking reflects uncosted spatial performance, not comparative delivery speed or lifecycle efficiency. The lightweight-canopy scenario provides predictable immediate coverage and strong protection at strategic nodes but offers lower ecological value and greater structural and maintenance demands. The hybrid scenario performs most consistently across the assessed criteria because the strengths of one intervention compensate for limitations of the other (Figure 12).
Table 6.
Modeled comparative performance of the baseline and retrofit scenarios.
Figure 12.
Proposed hybrid pedestrian retrofit combining planting, lightweight canopies, and coordinated route treatments within the retained Location 01 geometry. Source: Authors.
The tree and hybrid shade values represent the modeled comparative design condition used for scenario testing and should not be read as year-one or lifecycle predictions. Actual vegetative coverage would vary with species selection, initial planting size, establishment success, crown development, pruning, seasonal foliage characteristics, and long-term maintenance.
Segment-level reconstruction identifies S6, S10, S4, and S3 as the largest contributors to the hybrid’s modeled shade improvement, collectively accounting for approximately 48% of the corridor-wide change. The largest CSEI reductions occur at S6, S7, S9, and S10, contributing approximately 56% of the aggregate decrease (Supplementary Table S17C). These are changes in calculated spatial indicators, not measured environmental or pedestrian-access outcomes. Independent arithmetic checks and the underlying scenario records are documented in the Supplementary Information (Table 7).
Table 7.
Weighted performance scores of retrofit scenarios under alternative decision-priority models.
Applying the equal-weight model to the criterion-level scoring matrix produced:
The equal-weight eight-criterion model produced OPS values of 3.24 for trees, 3.49 for lightweight canopies, and 4.13 for the hybrid. The hybrid remained the highest-ranked conceptual alternative, followed by canopies and trees (Table 7; Figure 13). Physical accessibility remains a separate non-compensatory prerequisite and is not included in OPS.
Figure 13.
Criterion-level performance and sensitivity of overall scores across the tree, lightweight-canopy, and hybrid retrofit alternatives. Source: Authors.
4.7. Sensitivity of Scenario Ranking
Using the eight-criterion OPS matrix, the hybrid remained highest-ranked under the climate-priority, pedestrian-access-priority, and implementation-priority models, scoring 4.42, 4.33, and 3.76, respectively. The corresponding canopy scores were 3.56, 3.61, and 3.44, while trees scored 3.44, 2.93, and 3.19 (Table 7). The ranking is stable across these decision-priority weights, but physical accessibility remains a separate, unverified implementation prerequisite.
The targeted operational-score test provides an additional qualification. Individual ±1 point changes to maintenance demand or implementation complexity did not independently reverse the scenario ordering. However, under the conservative joint stress condition in which both hybrid operational ratings were reduced by one point and both competing alternatives received one-point improvements, the implementation-priority scores shifted to 3.55 for trees, 3.80 for the canopy scenario, and 3.39 for the hybrid scenario. The canopy alternative therefore became highest ranked under this deliberately adverse operational assumption. This result confirms that local implementation conditions can materially affect scenario selection and should be empirically calibrated before investment decisions are made.
Using source-precision quantitative criteria, overlap-reduced OPS structures retained the hybrid as the highest-ranked spatial alternative. The six-criterion grouped model yields 3.37 for trees, 3.32 for canopies, and 3.83 for the hybrid; the equally weighted four-domain model yields 3.47, 3.32, and 4.33, respectively (Supplementary Table S19A). Representative-criterion models also retain the hybrid ranking but vary the ordering of trees and canopies. Conversely, excluding all four quantitative spatial criteria favors trees (3.63), ahead of the hybrid (3.25) and canopies (3.00). These are conditional structural-sensitivity results, not evidence of criterion independence, accessibility compliance, or lifecycle superiority.
A classification-sensitivity test examined the effect of changing one CSEI exposure class by one ordinal level while retaining the remaining segment assignments and route-length weights. The resulting comparative index ranges were approximately 4.1–4.4 for the existing condition, 2.8–3.1 for trees, 2.5–2.7 for lightweight canopies, and 2.0–2.2 for the hybrid scenario (Supplementary Table S4B). The relative scenario ordering remained unchanged under these isolated coding adjustments. However, these ranges represent deterministic sensitivity to ordinal classifications rather than measured variation in solar radiation, physiological heat stress, or outdoor thermal comfort. They do not establish robustness under simultaneous reclassifications, alternative empirical thresholds, or observed environmental conditions.
4.8. Benchmarking Integrated Prioritization Against Conventional Assessment Methods
Using the same twelve-segment dataset, the integrated IPS identified S10, S4, S8, and S6 as the highest-priority baseline locations. Relative solar-exposure-only screening identified the same four segments, whereas shade-discontinuity-only and physical-friction-only assessments each identified three of these four locations. The corresponding rank correlations with IPS were 0.82 for relative solar exposure, 0.18 for shade discontinuity, and 0.84 for physical route friction. Visual route-confirmation deficiency and inferred movement conflict produced tied values that prevented unique four-segment selections without additional ranking rules. A simple severe-condition count also recovered the same four principal hotspots (Table 8). These results indicate that integrated assessment does not necessarily change the highest-priority locations and should not be interpreted as evidence of greater diagnostic accuracy.
Table 8.
Comparison of intervention priorities under alternative screening and multi-criteria methods.
The comparison nevertheless distinguishes the composition of diagnosed deficiencies. Although S4 and S6 share the highest relative solar-exposure deficiency, their normalized physical-friction values differ substantially (1.00 and 0.16, respectively), as do their visual route-confirmation deficiencies (0.25 and 1.00). Following the modeled hybrid intervention, S4 remains in the high-priority category (IPS = 0.55), whereas S6 shifts to low priority (IPS = 0.13). These differences demonstrate the value of retaining individual diagnostic information when interpreting compound priorities and identifying residual constraints. They represent modeled within-case differences rather than observed pedestrian outcomes. The complete twelve-segment and three-option TOPSIS reconstructions, including all coefficients and the tie-handling convention, are reported in Supplementary Tables S22 and S23.
5. Discussion
The results demonstrate that route proximity alone does not describe the overlapping modeled solar exposure, coded route friction, visual-cue conditions, and inferred movement relationships at Location 01. The Place–Pattern–People framework registers these conditions to a common spatial base and identifies candidate screening priorities; it does not establish causal interactions or measured improvements in pedestrian accessibility.
5.1. Co-Occurrence of Climatic Exposure, Route Friction, Spatial Configuration, and Visual Cues
The first research question examined where modeled solar exposure, coded physical route friction, route configuration, and visual-cue deficiencies coincide along the station-parallel pedestrian sequence. The results demonstrate spatial co-location within this case, not statistically estimated interaction or verified accessibility outcomes. Despite existing paving and tactile guidance, several segments exhibit discontinuous shade, crossing interruptions, or unresolved route-confirmation cues.
This distinction challenges the assumption that formal provision is equivalent to effective access. Conventional catchment and network approaches may identify a route as accessible because it falls within an acceptable walking distance and maintains physical connectivity [48,49]. The Location 01 analysis shows that such measures can overlook the environmental and perceptual conditions shaping the practical quality of the route.
The climatic findings reinforce this point. High relative solar exposure becomes particularly significant where it coincides with crossings, entrances, direction changes, or waiting locations. The problem is therefore not only exposure itself, but its spatial relationship with points where movement is already constrained. Similarly, the wayfinding analysis shows that the visual prominence of the metro structure does not guarantee legibility at pedestrian scale. The elevated viaduct may orient users toward the transit system generally, while the route to the station entrance remains only partially resolved.
These findings support a broader interpretation of metro accessibility as a multidimensional corridor condition. Physical connectivity establishes the possibility of movement, but solar protection, route continuity, and visual clarity shape the quality and legibility of that movement.
5.2. Overlapping Spatial Deficiencies and Candidate Intervention Points
The second research question focused on where relative solar exposure, pedestrian barriers, decision points, and inferred movement relationships overlap to create priority locations. The integrated hotspot analysis demonstrates that the most important segments are not necessarily those that perform worst in one variable, but those where several disadvantages coincide.
This finding supports the methodological premise of the study. A shade map can identify exposed segments but cannot determine whether they also contain crossings, waiting events, or ambiguous decision points. A movement-friction analysis can identify interruptions but cannot establish whether they coincide with high solar exposure. Likewise, a visibility analysis can reveal weak route confirmation without showing whether that same point also corresponds to a strong inferred movement relationship.
Registering these layers to the same spatial base makes such overlaps visible. A segment characterized by high exposure, crossing friction, weak next-node visibility, and strong inferred movement correspondence warrants greater attention than an exposed segment with uninterrupted movement and clear orientation. The IPS therefore functions primarily as a relative prioritization device rather than as an absolute measure of acceptability.
The second research question identified where modeled solar exposure, coded route friction, visual-cue deficiencies, and inferred movement relationships overlap. Under the reference IPS configuration, S4, S6, S8, and S10 emerged as the four highest-ranked baseline segments. Unlike individual shade, friction, or visibility maps, the integrated assessment identifies locations where multiple spatial deficiencies coincide. However, these classifications represent within-case screening results rather than measured pedestrian discomfort or verified intervention effectiveness. The identified segments therefore warrant further field assessment and design investigation before implementation priorities are established.
The independent-indicator comparison qualifies the contribution of cross-layer integration. Solar-exposure-only screening recovers the same four highest-priority segments as IPS, indicating that integration does not produce an exclusive hotspot set in this case. Its practical contribution instead lies in retaining the distinct climatic, physical, visual, and inferred movement conditions associated with each priority location and relating these diagnoses to modeled retrofit responsiveness and remaining constraints. Such diagnostic traceability can inform the selection and coordination of intervention measures, but it does not establish superior empirical accuracy, cost-effectiveness, or observed pedestrian outcomes. These claims would require independent field validation and resource-adjusted evaluation.
5.3. Comparative Performance of Tree, Canopy, and Hybrid Retrofit Strategies
The alternatives have different temporal and technical requirements. Tree planting can contribute ecological value and established-canopy shade but depends on suitable root zones, irrigation, growth, survival, and maintenance. Lightweight canopies can protect exposed walking and waiting locations after installation, subject to structural support, clearance, and upkeep requirements. The hybrid combines both systems and offers potential for phased implementation, although construction sequencing and canopy maturation were not modeled (Figure 14).
Figure 14.
Pedestrian and aerial views of the proposed hybrid shade configuration at Location 01. Source: Authors.
The hybrid achieves the highest score within the uncosted design-state comparison, but the alternatives were not normalized by installed quantity, delivery time, or lifecycle cost. Its additional planting and structural components may increase capital, irrigation, maintenance, and coordination requirements. Under the conservative implementation-priority stress test, the lightweight canopy instead ranks first (3.80), followed by trees (3.55) and the hybrid (3.39; Supplementary Table S21). This reversal demonstrates sensitivity to operational scoring assumptions, not measured lifecycle performance. Consequently, the hybrid’s modeled spatial advantage cannot establish short-term or economic superiority. Selection requires verified design quantities, accessibility compliance, and lifecycle assessment over a common planning horizon.
The results also reveal an important distinction between retrofit-responsive and structurally constrained variables. Shade continuity and visual sequencing can be modified substantially through localized public-realm interventions, whereas crossings, carriageway geometry, and some forms of physical route friction may require larger transport or street-network changes. Keeping these dimensions analytically separate prevents improvement in one domain from being interpreted as equivalent improvement across the entire accessibility system.
The sensitivity analysis strengthens this interpretation. The hybrid scenario remained highest ranked under all three alternative weighting structures, although its advantage narrowed under implementation-priority weighting. This pattern suggests that the scenario ordering is robust to moderate changes in decision priorities while remaining sensitive to the greater maintenance and coordination burden associated with the broader hybrid intervention. However, the result remains conditional on the selected criteria, scenario definitions, and implementation assumptions.
5.4. Methodological Portability and Cross-Typology Validation
The fourth research question concerns which components of the framework are methodologically portable and which require recalibration across different station environments. The single-case design does not demonstrate empirical transferability or systematic applicability across station morphologies. It instead shows that the analytical structure is modular and identifies the variables that would need to be retested comparatively.
The physical solution developed for Location 01 responds to a specific combination of commercial frontage, elevated infrastructure, crossing relationships, and planting opportunities. Other station environments may require different combinations of shade, planting, crossing improvements, or wayfinding measures. The hybrid design should therefore remain site-specific. Station morphology may also change the structure of the pedestrian decision sequence itself. An underground portal may concentrate movement around discrete entrance points and reduce long-range station visibility; an at-grade station may introduce different crossing and interface conditions; and a multi-level interchange may increase vertical transitions, internal decision nodes, and route-choice complexity. These variations can alter the relative importance and spatial distribution of the same diagnostic dimensions used in the present framework.
Cross-typology validation should also extend beyond station configuration to the morphology of the surrounding urban fabric. Irregular intersections may alter route segmentation and crossing logic; sloping or topographically constrained environments may introduce gradients, level changes, and different accessibility conditions; and historic neighborhoods may contain narrow rights-of-way, irregular plot structures, heritage-sensitive interfaces, and limited capacity for structural or vegetative intervention. These conditions could change both the spatial distribution and the relative importance of the framework’s diagnostic dimensions.
The present case therefore demonstrates the internal operation of the analytical sequence within one elevated, relatively linear corridor condition. It does not establish that indicator relationships, thresholds, segmentation rules, or intervention priorities remain stable across contrasting urban morphologies.
The analytical sequence has potential methodological portability because its registered layers can, in principle, be reconstructed in other contexts while allowing indicators, segmentation rules, thresholds, weights, and intervention criteria to be locally recalibrated. Whether this portability remains analytically reliable across different urban morphologies is an empirical question that the present single-case study cannot resolve (Figure 15).
Figure 15.
Methodological components that can be retained and local inputs requiring recalibration in future applications. Source: Authors.
This modularity provides a basis for subsequent comparative testing at other Riyadh Metro stations and, potentially, in comparable hot–arid transit environments. Such testing should compare divergent station morphologies rather than assume that the relationships observed at Location 01 remain unchanged. Such applications should be treated as new empirical tests rather than direct extensions of the present case. Direct thermal monitoring, pedestrian counts, GPS-based movement traces, user-perception data, and post-occupancy evaluation could be incorporated without changing the underlying decision-support logic.
5.5. Contribution to Smart and Climate-Responsive Urban Mobility
The findings extend previous station-area walkability assessments and Gulf transit-oriented development studies [17,44], by examining climatic, physical, and perceptual conditions along a registered pedestrian sequence rather than primarily at catchment or district scale. At Location 01, the elevated metro structure, commercial frontages, carriageway crossings, and discontinuous shade create overlapping conditions that are not adequately represented by proximity alone. Although formal pedestrian infrastructure is present, the modeled analysis identifies localized exposure, movement-friction, and route-confirmation deficiencies. These findings characterize the examined Riyadh corridor and should not be generalized to other stations without comparative assessment.
The results are also methodologically distinct from studies examining observed heat-responsive pedestrian route choices or detailed three-dimensional visibility relationships. SCR and CSEI represent modeled spatial exposure, while VRCS and RCR describe coded visual cues and inferred access relationships rather than observed behavior. Similarly, although the integrated assessment aligns conceptually with multidimensional urban decision-support approaches, its OPS results remain conditional on the selected criteria and unverified implementation assumptions. The demonstrated contribution is therefore the integration of traceable spatial indicators into within-case prioritization and conceptual retrofit comparison. Claims concerning thermal comfort, walking uptake, accessibility improvements, or metro ridership remain hypotheses requiring independent validation (Table 9).
Table 9.
Claim-to-Evidence Mapping and Validation Status of Principal Findings.
Evidence status distinguishes documented site conditions, internally reconstructable model outputs, inferred relationships, and untested behavioral hypotheses. Internal numerical consistency and deterministic sensitivity tests do not constitute external environmental, behavioral, or operational validation. The reported scenario values represent comparative design states rather than measured intervention effects.
6. Recommendations and Implementation Framework
The spatial analysis identifies candidate locations where modeled exposure, coded movement barriers, limited route-confirmation cues, and inferred access relationships overlap. As a proposed planning application, the framework can guide further investigation of coordinated shading, circulation, and wayfinding measures. These locations represent preliminary screening priorities rather than confirmed investment decisions; implementation should depend on field verification, accessibility and safety assessments, technical feasibility, and resource availability.
6.1. Spatial Priorities for Pedestrian Retrofit
The first priority is to treat shade as part of the mobility network rather than as a supplementary landscape element. Aggregate shade coverage alone is insufficient because exposed gaps may remain at locations where pedestrians must stop, cross, turn, or orient themselves. Strategic protection should therefore focus first on crossing approaches and waiting areas, decision points, the final station approach, major commercial access points, and rest locations.
For Location 01, the hybrid scenario provides the strongest modeled spatial-performance basis within the uncosted comparison because it combines immediate structural shade with longer-term vegetative protection (Figure 16). This should be treated as a design-performance finding rather than a final investment recommendation. The extent and phasing of hybrid intervention should be determined only after capital, irrigation, maintenance, replacement, and lifecycle resource requirements are compared with less intensive alternatives.
Figure 16.
Design principle: coordinating shade, frontage access, pause points, and station connection. Source: Authors.
The hybrid’s approximately 84% shade continuity represents a modeled design-state result under the selected hot-period condition and established-canopy assumption, not an empirically validated minimum for pedestrian comfort. Operational shade targets should be established through site-specific environmental measurements, pedestrian needs assessment, and implementation feasibility rather than inferred directly from this case.
Shade infrastructure should also be coordinated with accessibility and wayfinding. Canopy columns, tree pits, planting beds, benches, and other street furniture should remain outside the unobstructed pedestrian path and tactile guidance system. Their placement should also be verified through wheelchair turning and trajectory checks, clear-width assessment, surface-transition review, and inspection of potential conflicts with tactile guidance. Compliance should be demonstrated at detailed-design stage rather than assumed from the conceptual layout.
Pedestrian-scale legibility should be strengthened through a sequence of visual confirmations. At major decision points, users should be able to identify the station portal, the next route segment, a recognizable directional cue, or the crossing required to continue the journey. Canopy modules, aligned planting, differentiated paving, lighting, and signage can reinforce this sequence when coordinated as a single system. Their placement should also preserve sightlines so that climatic improvements do not create new visual barriers.
Retrofit should additionally reflect the spatial logic of likely movement. Commercial entrances, sidewalks, crossings, pause points, and station access should be considered as interconnected generators rather than isolated elements. Where inferred movement relationships diverge from the formal route, crossing arrangements, alignment, or the placement of shade and rest infrastructure should be reassessed. Future pedestrian observation and tracking could refine these inferred relationships without altering the analytical structure.
6.2. Phased Implementation and Performance Monitoring
A phased implementation model is appropriate because structural and vegetative interventions operate over different timescales. Lightweight shade can deliver immediate protection, whereas the environmental contribution of trees develops progressively. The phasing strategy should therefore be linked to canopy monitoring rather than treated as a fixed installation sequence. Tree survival, crown spread, shade contribution, and maintenance condition should be reviewed periodically so that the balance between vegetative and structural protection can be adjusted as the landscape matures.
Implementation can therefore proceed through four linked stages. The first stage should address the highest-priority segments identified through the IPS, particularly exposed crossings, waiting areas, and visually ambiguous decision points. The second should extend shade and coordinated pedestrian treatments between these nodes to strengthen route continuity. The third should reinforce planting where adequate root zones, irrigation, and maintenance capacity can be secured, allowing long-term canopy development to complement or, where appropriate, reduce dependence on structural shade. The fourth stage should evaluate post-implementation performance and adjust local conditions as necessary (Figure 17). This stage should repeat the environmental and user-response protocol established during pre-implementation validation so that observed changes in shaded and exposed conditions can be compared directly with the modeled scenario predictions.
Figure 17.
Proposed sequence for prioritizing interventions, establishing corridor continuity, supporting planting maturation, and monitoring performance. Source: Authors.
Because no retrofit was evaluated after implementation, actual effectiveness remains unverified. Future assessment should combine pedestrian-level microclimatic measurements and appropriately derived thermal-comfort indices with observed walking volumes, route choices, wayfinding performance, and station entry or ridership records. Comparisons should account for seasonal, operational, and surrounding land-use changes, preferably using suitable control conditions. Such evidence is necessary to evaluate whether modeled spatial improvements translate into measurable accessibility or transit-use benefits.
Before investment selection, the three alternatives require lifecycle evaluation over a common analysis period using verified planting and canopy quantities, installation schedules, capital costs, irrigation and energy demand, maintenance, replacements, and end-of-life expenditure. Tree and hybrid assessments must additionally account for stage-dependent canopy development rather than assuming established vegetation throughout the evaluation period. Results should compare present-value costs and resource-adjusted performance under consistent assumptions, with applicable accessibility clearances verified independently. Because these technical and financial inputs were not established in the present study, lifecycle cost rankings remain undetermined, and the modeled OPS should not be interpreted as an investment recommendation.
Once verified lifecycle costs are available, a resource-adjusted performance indicator may be calculated as the change in OPS relative to baseline divided by the present value of lifecycle cost. The purpose of this secondary measure is not to replace the multi-criteria assessment, but to reveal whether additional performance is achieved proportionately to additional expenditure. Scenario selection should therefore consider both absolute performance and resource-adjusted efficiency.
The physical-friction component should also be calibrated across users with different mobility capacities. Controlled route trials could compare coded crossings, curb transitions, waiting events, directional changes, and obstacles against observed travel time and, where ethically and technically appropriate, physiological or biomechanical measures such as heart-rate response, gait characteristics, wheelchair propulsion effort, or other mobility-specific indicators. Such calibration would allow future applications to replace the present uniform route-friction penalties with empirically derived user-specific weights.
Visual-route performance should similarly be validated through field-based passenger studies. Mobile eye-tracking could be undertaken along the same decision sequence under high-solar-exposure conditions and compared across different passenger groups. Measures such as fixation location and duration, missed or delayed cue recognition, route-decision time, and navigation errors could be examined alongside measured luminance, illumination contrast, and glare conditions. These observations would allow the present VRCS to be calibrated against actual visual attention and cognitive wayfinding performance.
Future empirical validation of the inferred movement component should combine repeated pedestrian counts with anonymized trajectory observations collected across representative weekday and weekend periods, peak and off-peak station operations, and contrasting environmental conditions. Observations should document station entrances, commercial access points, formal and informal crossing locations, route choices, and pedestrian movement sequences, subject to appropriate ethical and privacy safeguards. Recorded trajectories should be registered to the same spatial base used in the present analysis and compared with the twelve predefined origin–destination relationships. Validation should report the observed frequency of each hypothesized connection, identify frequently used relationships omitted from the inferred network, and quantify spatial correspondence through explicitly defined measures of route overlap and link-level agreement. Sampling procedures, observation periods, and criteria for distinguishing supported from unsupported relationships should be established before evaluating predictive agreement. These observations would allow the inferred access structure to be tested and recalibrated against actual baseline pedestrian behavior. However, validation of existing movement patterns would not independently establish operational benefits from the proposed retrofit configurations. Such benefits would require additional post-implementation or appropriately controlled behavioral evaluation of changes in route choice, crossing behavior, pedestrian volumes, and station access.
Long-term shade performance should also be evaluated temporally. Future modeling should test representative morning, midday, and afternoon solar conditions across seasonal periods and incorporate species-specific canopy parameters where planting is proposed. For trees, scenarios should distinguish establishment, intermediate growth, and mature-canopy conditions using documented crown dimensions, growth characteristics, and seasonal foliage behavior. Repeated field canopy measurements or remote sensing could then update modeled shade coverage through time and test whether structural shade can be reduced, retained, or repositioned as vegetation matures.
Post-design accessibility verification should include wheelchair and mobility-aid trajectory audits along the complete proposed route, with particular attention to tree pits, canopy foundations, furniture zones, curb interfaces, and changes in paving. Where feasible, rolling-resistance or equivalent mobility-effort measurements should be used to identify localized surface or transition conditions that are not captured by geometric clearances alone. These audits should be completed before implementation and repeated after construction so that accessibility is verified against the built condition rather than inferred from plan geometry.
The judgment-based criteria should subsequently be calibrated through structured expert elicitation. A Delphi process involving municipal and transit-agency engineers, landscape and public-realm specialists, maintenance personnel, contractors, and relevant procurement practitioners could independently assess environmental value, adaptability, maintenance demand, and implementation complexity. Successive anonymous rating rounds should seek convergence on criteria such as irrigation and establishment burden, structural maintenance, utility coordination, construction staging, contractor specialization, procurement lead times, material availability, and compatibility with municipal budget and maintenance cycles. Consensus-derived scores could then replace the provisional author ratings and be reintroduced into the scenario-sensitivity analysis.
A complementary sample of transit users could support preference calibration of the IPS through structured pairwise comparisons, allowing spatially modeled priorities to be compared with the relative importance that users assign to environmental, physical, perceptual, and movement-related constraints.
Taken together, these validation data would serve two functions. First, they would verify whether the implemented retrofit performs as intended. Second, they would allow assumptions embedded in the current framework, particularly inferred movement relationships and accessibility implications for users with differing mobility capacities, to be tested empirically. The framework should therefore be understood as an adaptive decision-support process rather than a one-time design exercise.
6.3. Application Beyond Location 01
The potentially transferable component of the study is the analytical sequence rather than the physical design outcome. A structured validation program should therefore test the framework across deliberately contrasting spatial typologies rather than replicate it only on corridors similar to Location 01. Relevant pilot cases would include linear elevated-station corridors, underground portal conditions, irregular multi-arm intersections, topographically constrained routes, multi-level interchange environments, and historic or fine-grained urban fabrics. Applying the same core analytical sequence across these cases would allow comparison of which variables remain stable, which require recalibration, and whether new context-specific variables must be introduced. Different stations may require different combinations of planting, structural shade, crossing modification, wayfinding, or route adjustment, depending on local morphology, environmental exposure, operational constraints, and accessibility requirements.
A subsequent cross-city phase could extend this testing to selected GCC municipalities with comparable climatic exposure but contrasting street networks, development patterns, transit interfaces, and regulatory conditions. Such work should be framed as comparative empirical validation rather than as direct transfer of the Location 01 model.
Transferability should be assessed by examining whether the same analytical sequence can be implemented consistently, whether the principal diagnostic dimensions remain meaningful, whether segment and node definitions can be reproduced under different geometries, and whether modeled priorities correspond with locally observed environmental and pedestrian conditions. Stability of procedure would indicate methodological portability, whereas substantial changes to indicators, segmentation logic, or interpretation would identify the limits of generalization.
The IPS weighting structure and classification bands should be empirically recalibrated before wider application. A subsequent calibration stage could use an Analytic Hierarchy Process based on structured pairwise comparisons with local metro users to estimate the relative importance of solar protection, physical route friction, visual route confirmation, movement correspondence, and other diagnostic conditions. Responses should be examined across relevant user groups and travel contexts, and AHP consistency checks should be applied before deriving aggregate weights. The resulting locally calibrated weights could then replace the present equal-weight baseline and be compared against it to determine whether intervention priorities remain stable.
Before broader applicability can be claimed, the framework requires independent cross-case validation across contrasting station typologies, including elevated corridors, underground portals, at-grade stations, and multi-level interchanges. A future comparative study should retain SCR, CSEI, PRFI, VRCS, and RCR as common diagnostic constructs while evaluating whether their operational definitions remain appropriate under different spatial and climatic conditions. Route segmentation, decision-node definitions, solar-exposure assessment conditions, physical-friction coding, inferred origin–destination relationships, IPS normalization bounds and weights, and OPS scoring criteria should be documented and recalibrated where necessary. Comparisons should use harmonized evidence-collection procedures and examine whether the resulting diagnostic priorities correspond with independently observed environmental and pedestrian conditions. Such testing would establish which components remain reliable across contexts and which require modification. The present investigation does not provide these cross-case results and makes no claim of externally validated applicability.
6.4. Implications for Smart and Climate-Responsive Mobility Planning
At policy level, the framework offers a potential spatial-diagnostic complement to conventional transit-access assessments. Incorporating climatic exposure, movement friction, and route legibility into planning is a proposed application of the framework, not evidence that its implementation would increase walking participation or metro ridership. Such outcomes require independent evaluation before wider policy effectiveness can be established.
Metro-access assessment should therefore complement conventional measures of walking distance and network connectivity with climate-responsive and pedestrian-scale indicators such as shade continuity, exposed waiting conditions, physical route friction, visual legibility, and inferred movement relationships. These variables can be represented spatially and incorporated into municipal or transit-agency decision-support systems.
Within such systems, the equal-weight IPS used in this study should be treated as a transparent baseline rather than a fixed policy model. Operational deployment should replace or test these equal weights against locally calibrated preferences derived from commuter evidence, accessibility requirements, and stakeholder priorities. AHP or an equivalent structured multi-criteria elicitation method can provide one transparent mechanism for this recalibration. Additional datasets, including real-time thermal monitoring, pedestrian counts, mobility traces, and digital-twin information, could be incorporated without changing the basic Place–Pattern–People logic.
The wider planning implication is therefore a shift from isolated public-realm improvements toward performance-based pedestrian retrofit. Trees, canopies, crossings, tactile systems, seating, and wayfinding should be understood as components of a single first/last-mile accessibility system whose performance is evaluated through solar protection, physical route friction, spatial clarity, and correspondence with inferred movement relationships.
7. Conclusions
This study tested a multi-scalar spatial decision-support framework along an elevated Riyadh Metro corridor. The analysis identifies where modeled shade and relative solar exposure overlap with coded route friction, visual-cue availability, and inferred access relationships. The resulting hotspot and retrofit comparisons indicate potential spatial intervention opportunities rather than demonstrated improvements in pedestrian accessibility or behavior. Verification requires independent environmental monitoring, accessibility assessment, and pedestrian observations.
Tree planting and lightweight canopies provide complementary rather than interchangeable responses. Within the tested and uncosted comparison, the hybrid configuration performed most consistently because it combined longer-term environmental benefits with more immediate and predictable structural protection. This result should be understood as comparative design performance rather than evidence of economic superiority, resource efficiency, or universal preference. Resource-normalized and lifecycle-cost analysis remain necessary before an implementation alternative can be selected.
The methodological contribution is a traceable framework linking climatic, physical, perceptual, and inferred movement conditions to case-specific retrofit screening. Its application beyond Location 01 requires comparative testing across station typologies and empirical validation of environmental performance, pedestrian behavior, and accessibility outcomes. The framework should therefore be understood as a design-stage decision-support method rather than an externally validated measure of pedestrian or transit-system effectiveness.
Supplementary Materials
The following supporting information can be downloaded at: https://www.mdpi.com/article/10.3390/smartcities9100172/s1, S1: Analytical Base, Segmentation, and Reproducibility Logic; S2: Shade Continuity and Strategic-Node Protection; S3: Relative Solar-Exposure Coding and Cumulative Solar Exposure Index (CSEI); S4: Physical Route Friction Index (PRFI) Coding Record; S5: Visual Route Confirmation Score (VRCS); S6: Inferred Origin–Destination Relationships and Route Correspondence Ratio (RCR); S7: Integrated Priority Score (IPS) Computational Record; S8: IPS Leave-One-Dimension-Out Sensitivity Check; S9: Scenario Score Transformation and Overall Performance; S10: Additional Robustness Checks for Criterion Dependence; S11: Operational-Score Sensitivity Check; S12: Interpretation Boundaries and Data Status; S13: Replication Checklist for Future Station Applications; S14: Benchmark Against Conventional Prioritization and Multi-Criteria Methods.
Author Contributions
Conceptualization, M.M.A.; methodology, M.M.A. and A.M.A.; software, M.M.A.; validation, A.M.A.; formal analysis, M.M.A. and A.M.A.; resources M.M.A. and A.M.A.; data curation, M.M.A. and A.M.A.; writing—original draft preparation, M.M.A.; writing—review and editing, M.M.A. and A.M.A.; visualization, M.M.A.; supervision, A.M.A.; project administration, M.M.A.; funding acquisition, A.M.A. All authors have read and agreed to the published version of the manuscript.
Funding
This research received no external funding.
Data Availability Statement
The spatial, methodological, and coding evidence supporting the findings is documented in the article and Supplementary Information.
Acknowledgments
During the preparation of this manuscript/study, the authors used Grammarly, v.1.2.291.1949 and QuillBot, v. 44.157.2, for the purposes of language and grammar refinement. The authors have reviewed and edited the output and take full responsibility for the content of this publication.
Conflicts of Interest
Ahmad Mashary Alnaim is affiliated with Afniah Architects and Engineers Consultant. The remaining authors declare that the research was conducted in the absence of any commercial or financial relationships that could be construed as a potential conflict of interest.
Abbreviations
| Abbreviation | Definition |
| SCR | Shade Continuity Ratio |
| CSEI | Cumulative Solar Exposure Index |
| PRFI | Physical Route Friction Index |
| VRCS | Visual Route Confirmation Score |
| RCR | Route Correspondence Ratio |
| IPS | Integrated Priority Score |
| OPS | Overall Performance Score |
References
- Kumar, V.; Das, B.K.; Vivek, A.K. Mass rapid transit systems and sustainable urban development: A review of impacts and implications. City Environ. Interact. 2026, 29, 100318. [Google Scholar] [CrossRef] [Scilit]
- Filippi, F. A paradigm shift for a transition to sustainable urban transport. Sustainability 2022, 14, 2853. [Google Scholar] [CrossRef] [Scilit]
- Yadav, K.; Dehalwar, K.; Sharma, S.N. Assessing the factors affecting first and last mile accessibility in transit-oriented development: A literature review. GeoJournal 2025, 90, 298. [Google Scholar] [CrossRef] [Scilit]
- Yahia, O.; Chohan, A.H.; Arar, M.; Mangi, M.Y. Enhancing neighborhood functionality through transit-oriented design, a study of sustainable development, proximity, and mobility. Front. Built Environ. 2025, 11, 1689752. [Google Scholar] [CrossRef] [Scilit]
- Nasrollahi, N.; Ghosouri, A.; Khodakarami, J.; Taleghani, M. Heat-mitigation strategies to improve pedestrian thermal comfort in urban environments: A review. Sustainability 2020, 12, 10000. [Google Scholar] [CrossRef] [Scilit]
- Aghamolaei, R.; Azizi, M.M.; Aminzadeh, B.; O’Donnell, J. A comprehensive review of outdoor thermal comfort in urban areas: Effective parameters and approaches. Energy Environ. 2023, 34, 2204–2227. [Google Scholar] [CrossRef] [Scilit]
- Martens, W. Smart Mobility and Last-Mile Rail Integration. Encyclopedia 2026, 6, 26. [Google Scholar] [CrossRef] [Scilit]
- Yadav, K.; Dehalwar, K.; Sharma, S.N. Determinants of First and Last Mile Connectivity Within Transit-Oriented Development: Insights from Global Literature. Transp. Dev. Econ. 2026, 12, 24. [Google Scholar] [CrossRef] [Scilit]
- Yadav, K.; Dehalwar, K.; Sharma, S.N. Exploring the environmental determinants of mode choice in first and last mile connectivity: Evidence from a systematic review. Innov. Infrastruct. Solut. 2026, 11, 204. [Google Scholar] [CrossRef] [Scilit]
- Zhao, M.; Lei, S.; Li, W. Incorporating urban thermal comfort into transit-oriented development (TOD) planning: Non-linear heterogeneous built environment effects. Sustain. Cities Soc. 2026, 140, 107254. [Google Scholar] [CrossRef] [Scilit]
- Dong, T.; Tadi, M. Equitable Access to Urban Green Spaces Under Heat Stress: An Agent-Based Simulation (ABS) of Age-Differentiated Walkability Through a Behavioral Perspective. Smart Cities 2026, 9, 97. [Google Scholar] [CrossRef] [Scilit]
- Fayyaz, M.; Fusco, G.; Colombaroni, C.; González-González, E.; Nogués, S. Optimizing smart city street design with interval-fuzzy multi-criteria decision making and game theory for autonomous vehicles and cyclists. Smart Cities 2024, 7, 3936–3961. [Google Scholar] [CrossRef] [Scilit]
- Kim, J.; Meller, B.; Woo, J.; Arora, A.S.; Schuetze, T. Integrated Urban Climate Resilience and Sustainability Assessment System for Urban Regeneration and Building Renovation. Land 2026, 15, 920. [Google Scholar] [CrossRef] [Scilit]
- Ali, L.; Nawaz, A.; Iqbal, S.; Aamir Basheer, M.; Hameed, J.; Albasher, G.; Shah, S.A.R.; Bai, Y. Dynamics of transit oriented development, role of greenhouse gases and urban environment: A study for management and policy. Sustainability 2021, 13, 2536. [Google Scholar] [CrossRef] [Scilit]
- Marwal, A.; Silva, E. Literature review of accessibility measures and models used in land use and transportation planning in last 5 years. J. Geogr. Sci. 2022, 32, 560–584. [Google Scholar] [CrossRef] [Scilit]
- Vichiensan, V.; Wasuntarasook, V.; Malaitham, S.; Fukuda, A.; Rujopakarn, W. Willingness to Pay for Station Access Transport: A Mixed Logit Model with Heterogeneous Travel Time Valuation. Sustainability 2025, 17, 6715. [Google Scholar] [CrossRef] [Scilit]
- Pilgram, C.A.; West, S.E. Transit station area walkability. J. Transp. Land Use 2023, 16, 267–292. [Google Scholar] [CrossRef] [Scilit]
- Dong, Z.; Chen, C.; Liao, C.; Chen, X.; Lee, D.-H. Community-based ultra-flex autonomous mobility system: A framework for advancing urban transportation spatial equity. Eng. Manag. 2026, 13, 164–193. [Google Scholar] [CrossRef] [Scilit]
- Abubakar, G.; Alonge, D. Enhancing Passenger Navigation through Effective Wayfinding Strategies in Railway Stations. Assoc. City Manag. Niger. Collab. 2026, 106–178. [Google Scholar]
- Adeel, A.; Arif, M.M.; Sheikh, N.B.; Ahsan, M.; Bashir, N. Designing livable transit-oriented development: A multi-stakeholder choice experiment on street-level trade-offs. Int. J. Civ. Infrastruct. 2025, 8, 138–154. [Google Scholar] [CrossRef] [Scilit]
- Elnabawi Mahgoub, M.H.; Alshehhi, S.S.; Elgendy, L.; Al Madhani, L.A.; Almehairi, M.A.; Alefari, F.G. Outdoor thermal comfort in hot arid and semi-arid cities of the Middle East and North Africa: Current knowledge, gaps, and a framework for climate-sensitive urban design. Front. Sustain. Cities 2026, 8, 1792739. [Google Scholar] [CrossRef] [Scilit]
- Nazarian, N.; Krayenhoff, E.; Bechtel, B.; Hondula, D.; Paolini, R.; Vanos, J.; Cheung, T.; Chow, W.; de Dear, R.; Jay, O. Integrated assessment of urban overheating impacts on human life. Earth’s Future 2022, 10, e2022EF002682. [Google Scholar] [CrossRef] [Scilit]
- Abuwaer, N.; Ullah, S.; Al-Ghamdi, S.G. Establishing the nexus between urban walkability and thermal comfort in a changing climate. Nat. Cities 2025, 2, 801–811. [Google Scholar] [CrossRef] [Scilit]
- Gul, Y.; Elhassan, Z.A.; Hakim, L.; Jokhio, G.A.; Sirror, H. Perceptions of walking behavior in Riyadh and the role of street widening and urban upgrades. Discov. Sustain. 2026, 7, 1461. [Google Scholar] [CrossRef] [Scilit]
- Wen, J.; Abuhani, D.A.; Mazzarello, M.; Duarte, F.; Norford, L.; Xu, R.; Wong, N.H.; Ratti, C. Walking smart in the heat: A dynamic shade-oriented pathfinding approach to enhance pedestrian comfort in arid cities. Comput. Environ. Urban Syst. 2025, 122, 102337. [Google Scholar] [CrossRef] [Scilit]
- Cuce, P.M.; Cuce, E.; Santamouris, M. Towards sustainable and climate-resilient cities: Mitigating urban heat islands through green infrastructure. Sustainability 2025, 17, 1303. [Google Scholar] [CrossRef] [Scilit]
- Yin, Y.; Li, S.; Xing, X.; Zhou, X.; Kang, Y.; Hu, Q.; Li, Y. Cooling benefits of urban tree canopy: A systematic review. Sustainability 2024, 16, 4955. [Google Scholar] [CrossRef] [Scilit]
- Prescott, M.; Labbé, D.; Miller, W.C.; Borisoff, J.; Feick, R.; Mortenson, W.B. Factors that affect the ability of people with disabilities to walk or wheel to destinations in their community: A scoping review. Transp. Rev. 2020, 40, 646–669. [Google Scholar] [CrossRef] [Scilit]
- Chen, Q.; Qin, Y.; Yao, M.; Zhang, Y.; Zhai, Z. The consistency of subjective and objective factors influencing walking path choice around rail transit stations. Buildings 2024, 14, 2225. [Google Scholar] [CrossRef] [Scilit]
- Shaheen, S.; Martin, E.; Cohen, A.; Broader, J.; Davis, R. Managing the Curb: Understanding the Impacts of On-Demand Mobility on Public Transit, Micromobility, and Pedestrians; San Jose State University: San Jose, CA, USA, 2022. [Google Scholar]
- Dadizadeh, M.; Mirbagheri, B.; Claramunt, C.; Shakiba, A. An event-based model for discovering frequent spatio-temporal patterns: Application to the study of tropical cyclones. Int. J. Geogr. Inf. Sci. 2026, 1–28. [Google Scholar] [CrossRef] [Scilit]
- Sheikh, N.B.; Arif, M.M.; Adeel, A. Balancing Pedestrian and Vehicular Needs in Urban Environments: An Agent Based Signal Timing Study. Planning 2025, 35, 1–17. [Google Scholar] [CrossRef] [Scilit] [PubMed]
- Marciniak, J.B.; Wiktorzak, B. Automatic Generation of Guidance for Indoor Navigation at Metro Stations. Appl. Sci. 2024, 14, 10252. [Google Scholar] [CrossRef] [Scilit]
- Iftikhar, H.; Shah, P.; Luximon, Y. Human wayfinding behaviour and metrics in complex environments: A systematic literature review. Archit. Sci. Rev. 2021, 64, 452–463. [Google Scholar] [CrossRef] [Scilit]
- Ghamari, H.; Sharifi, A. Mapping the evolutions and trends of literature on wayfinding in indoor environments. Eur. J. Investig. Health Psychol. Educ. 2021, 11, 585–606. [Google Scholar] [CrossRef] [Scilit] [PubMed]
- Omrani Azizabad, S.; Mahdavinejad, M.; Hadighi, M. Three-dimensional embodied visibility graph analysis: Investigating and analyzing values along an outdoor path. Environ. Plan. B Urban Anal. City Sci. 2025, 52, 1669–1684. [Google Scholar] [CrossRef] [Scilit]
- Liu, X.; Wong, S.; Li, B.; Chng, S.; Neo, H. Walking the preferred path: Exploring spatial-temporal variation in pedestrian route choice through revealed preferences in a developing city. Travel Behav. Soc. 2026, 44, 101278. [Google Scholar] [CrossRef] [Scilit]
- Basu, N.; Oviedo-Trespalacios, O.; King, M.; Kamruzzaman, M.; Haque, M.M. What do pedestrians consider when choosing a route? The role of safety, security, and attractiveness perceptions and the built environment during day and night walking. Cities 2023, 143, 104551. [Google Scholar] [CrossRef] [Scilit]
- Arman, A.; Bellini, P.; Nesi, P.; Paolucci, M. Analyzing public transportation offer wrt mobility demand. In Proceedings of the 1st ACM International Workshop on Technology Enablers and Innovative Applications for Smart Cities and Communities; Association for Computing Machinery (ACM): New York, NY, USA, 2019; pp. 30–37. [Google Scholar]
- Alnaim, M.M.; Alnaim, M.A. Urban heritage as climate intelligence: Translating traditional urban morphology in AlUla into contemporary resilience frameworks. Front. Built Environ. 2026, 12, 1850869. [Google Scholar] [CrossRef] [Scilit]
- Sepe, M. Resilience and liveability as drivers of sustainability: The case of UBC’s public spaces. Sustainability 2025, 17, 9878. [Google Scholar] [CrossRef] [Scilit]
- Aria, M.; Costanzo, D.; Misuraca, M.; Spano, M. Assessing tourism sustainability through stochastic multi-criteria acceptability analysis: Insights from the Italian regional context. Manag. Decis. 2026, 1–18. [Google Scholar] [CrossRef] [Scilit]
- Mkhitaryan, K.; Kocharyan, M.; Harutyunyan, H.; Sanamyan, A.; Karakhanyan, S. Sustainability indicators and urban decision-making: A multi-layer framework for evidence-based urban governance. Urban Sci. 2026, 10, 70. [Google Scholar] [CrossRef] [Scilit]
- Mazzetto, S.; Furlan, R.; Hoblos, J.; Al-Matwi, R. Transit-Oriented Development in the Gulf: Comparative Analysis of Al Mansoura (Doha) and Olaya (Riyadh). Sustainability 2026, 18, 2952. [Google Scholar] [CrossRef] [Scilit]
- Aleghaili, B.F.; Alqahtany, A.M.; Alzamil, W.S. Assessing New Urbanism–Transit-Oriented Development Principles in Al Malqa District, Riyadh: Adaptations for Sustainable Development Under Saudi Vision 2030. Sustainability 2026, 18, 7238. [Google Scholar] [CrossRef] [Scilit]
- Binabid, J. Mitigating Heat Stress for Pedestrians in Residential Neighborhoods: A Simulation-Based Approach to Enhance Outdoor Thermal Comfort. Buildings 2026, 16, 493. [Google Scholar] [CrossRef] [Scilit]
- ElSerafi, T. Barriers and Priority Interventions for Public Transport Implementation in Saudi Metropolitan Cities. J. Constr. Dev. Ctries. 2026, 31, 251–287. [Google Scholar] [CrossRef] [Scilit]
- Rhoads, D.; Solé-Ribalta, A.; Borge-Holthoefer, J. The inclusive 15-minute city: Walkability analysis with sidewalk networks. Comput. Environ. Urban Syst. 2023, 100, 101936. [Google Scholar] [CrossRef] [Scilit]
- Lin, Z.; Wang, L.; Zhen, X. Multiple dimension equity assessment of walking for visual and physical access to central parks across 27 Yangtze River Delta cities. Sci. Rep. 2026, 16, 17402. [Google Scholar] [CrossRef] [Scilit] [PubMed]
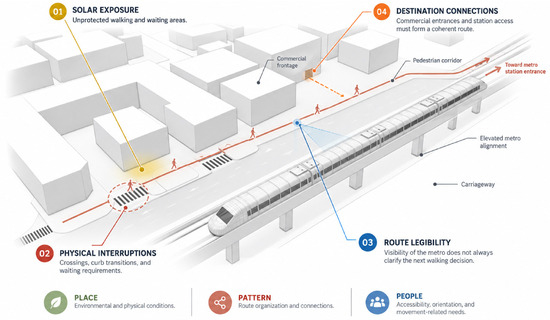
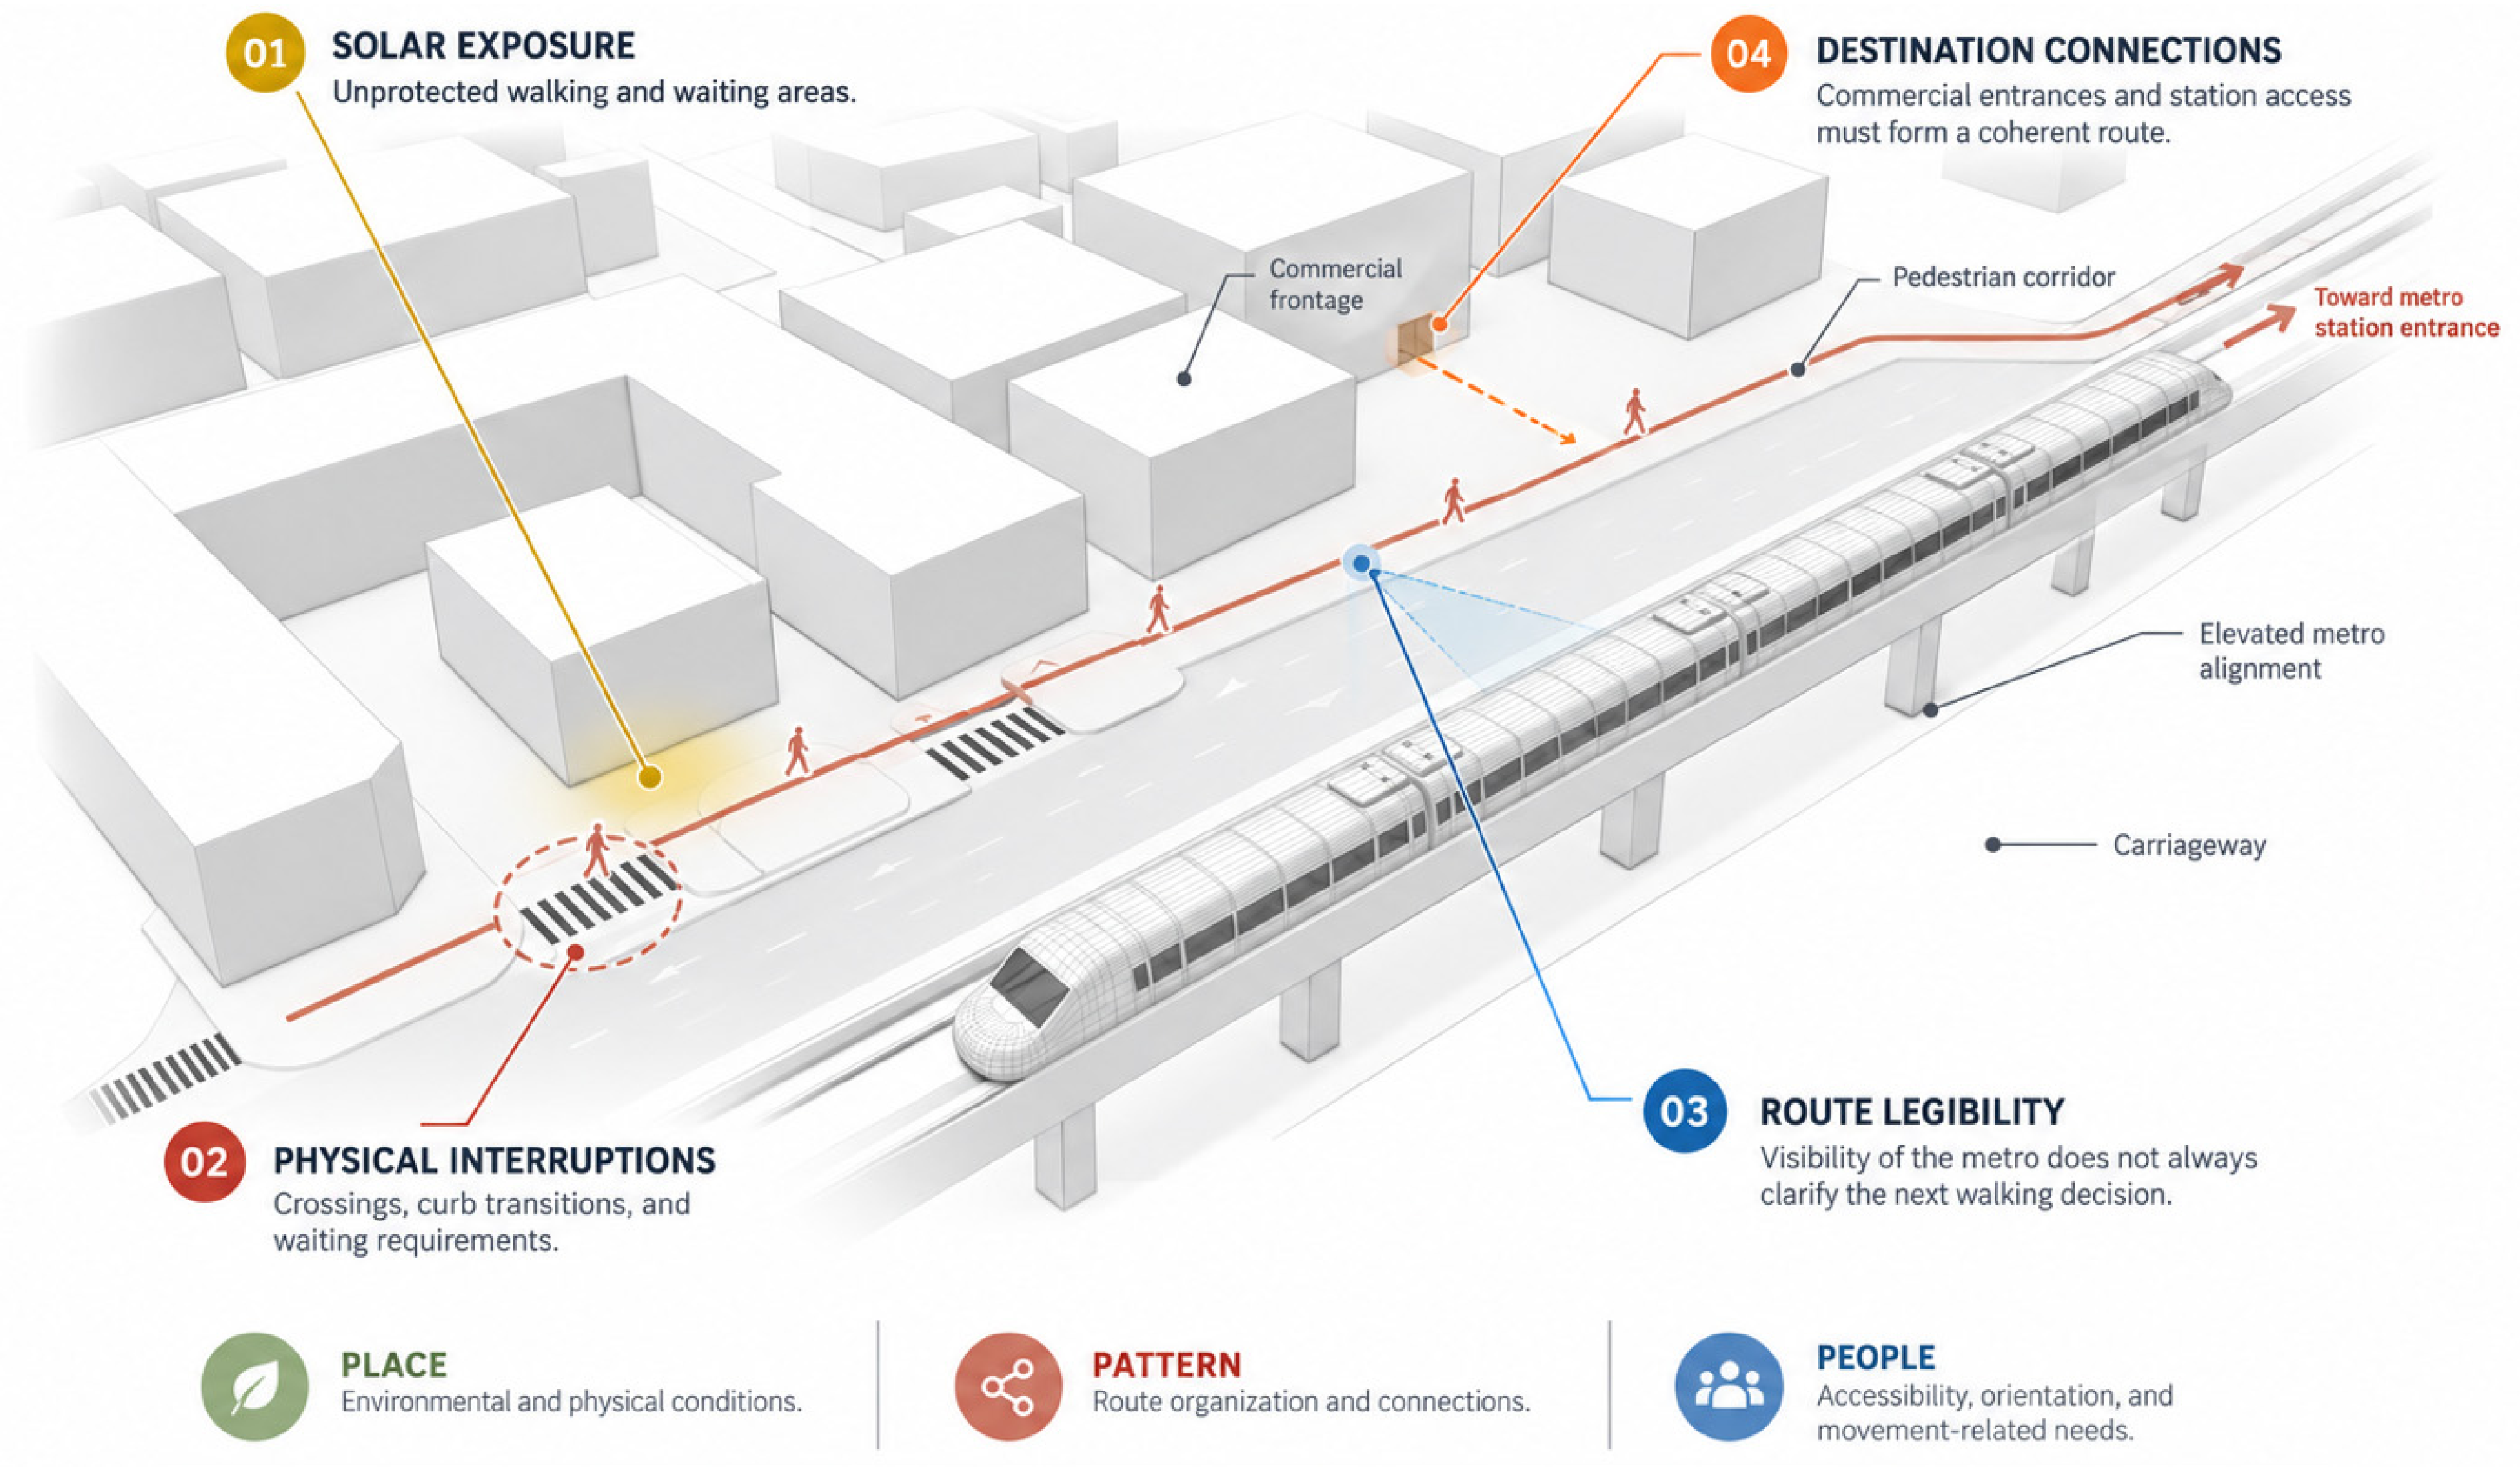
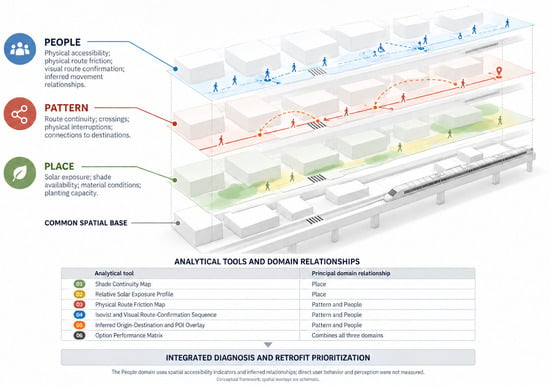
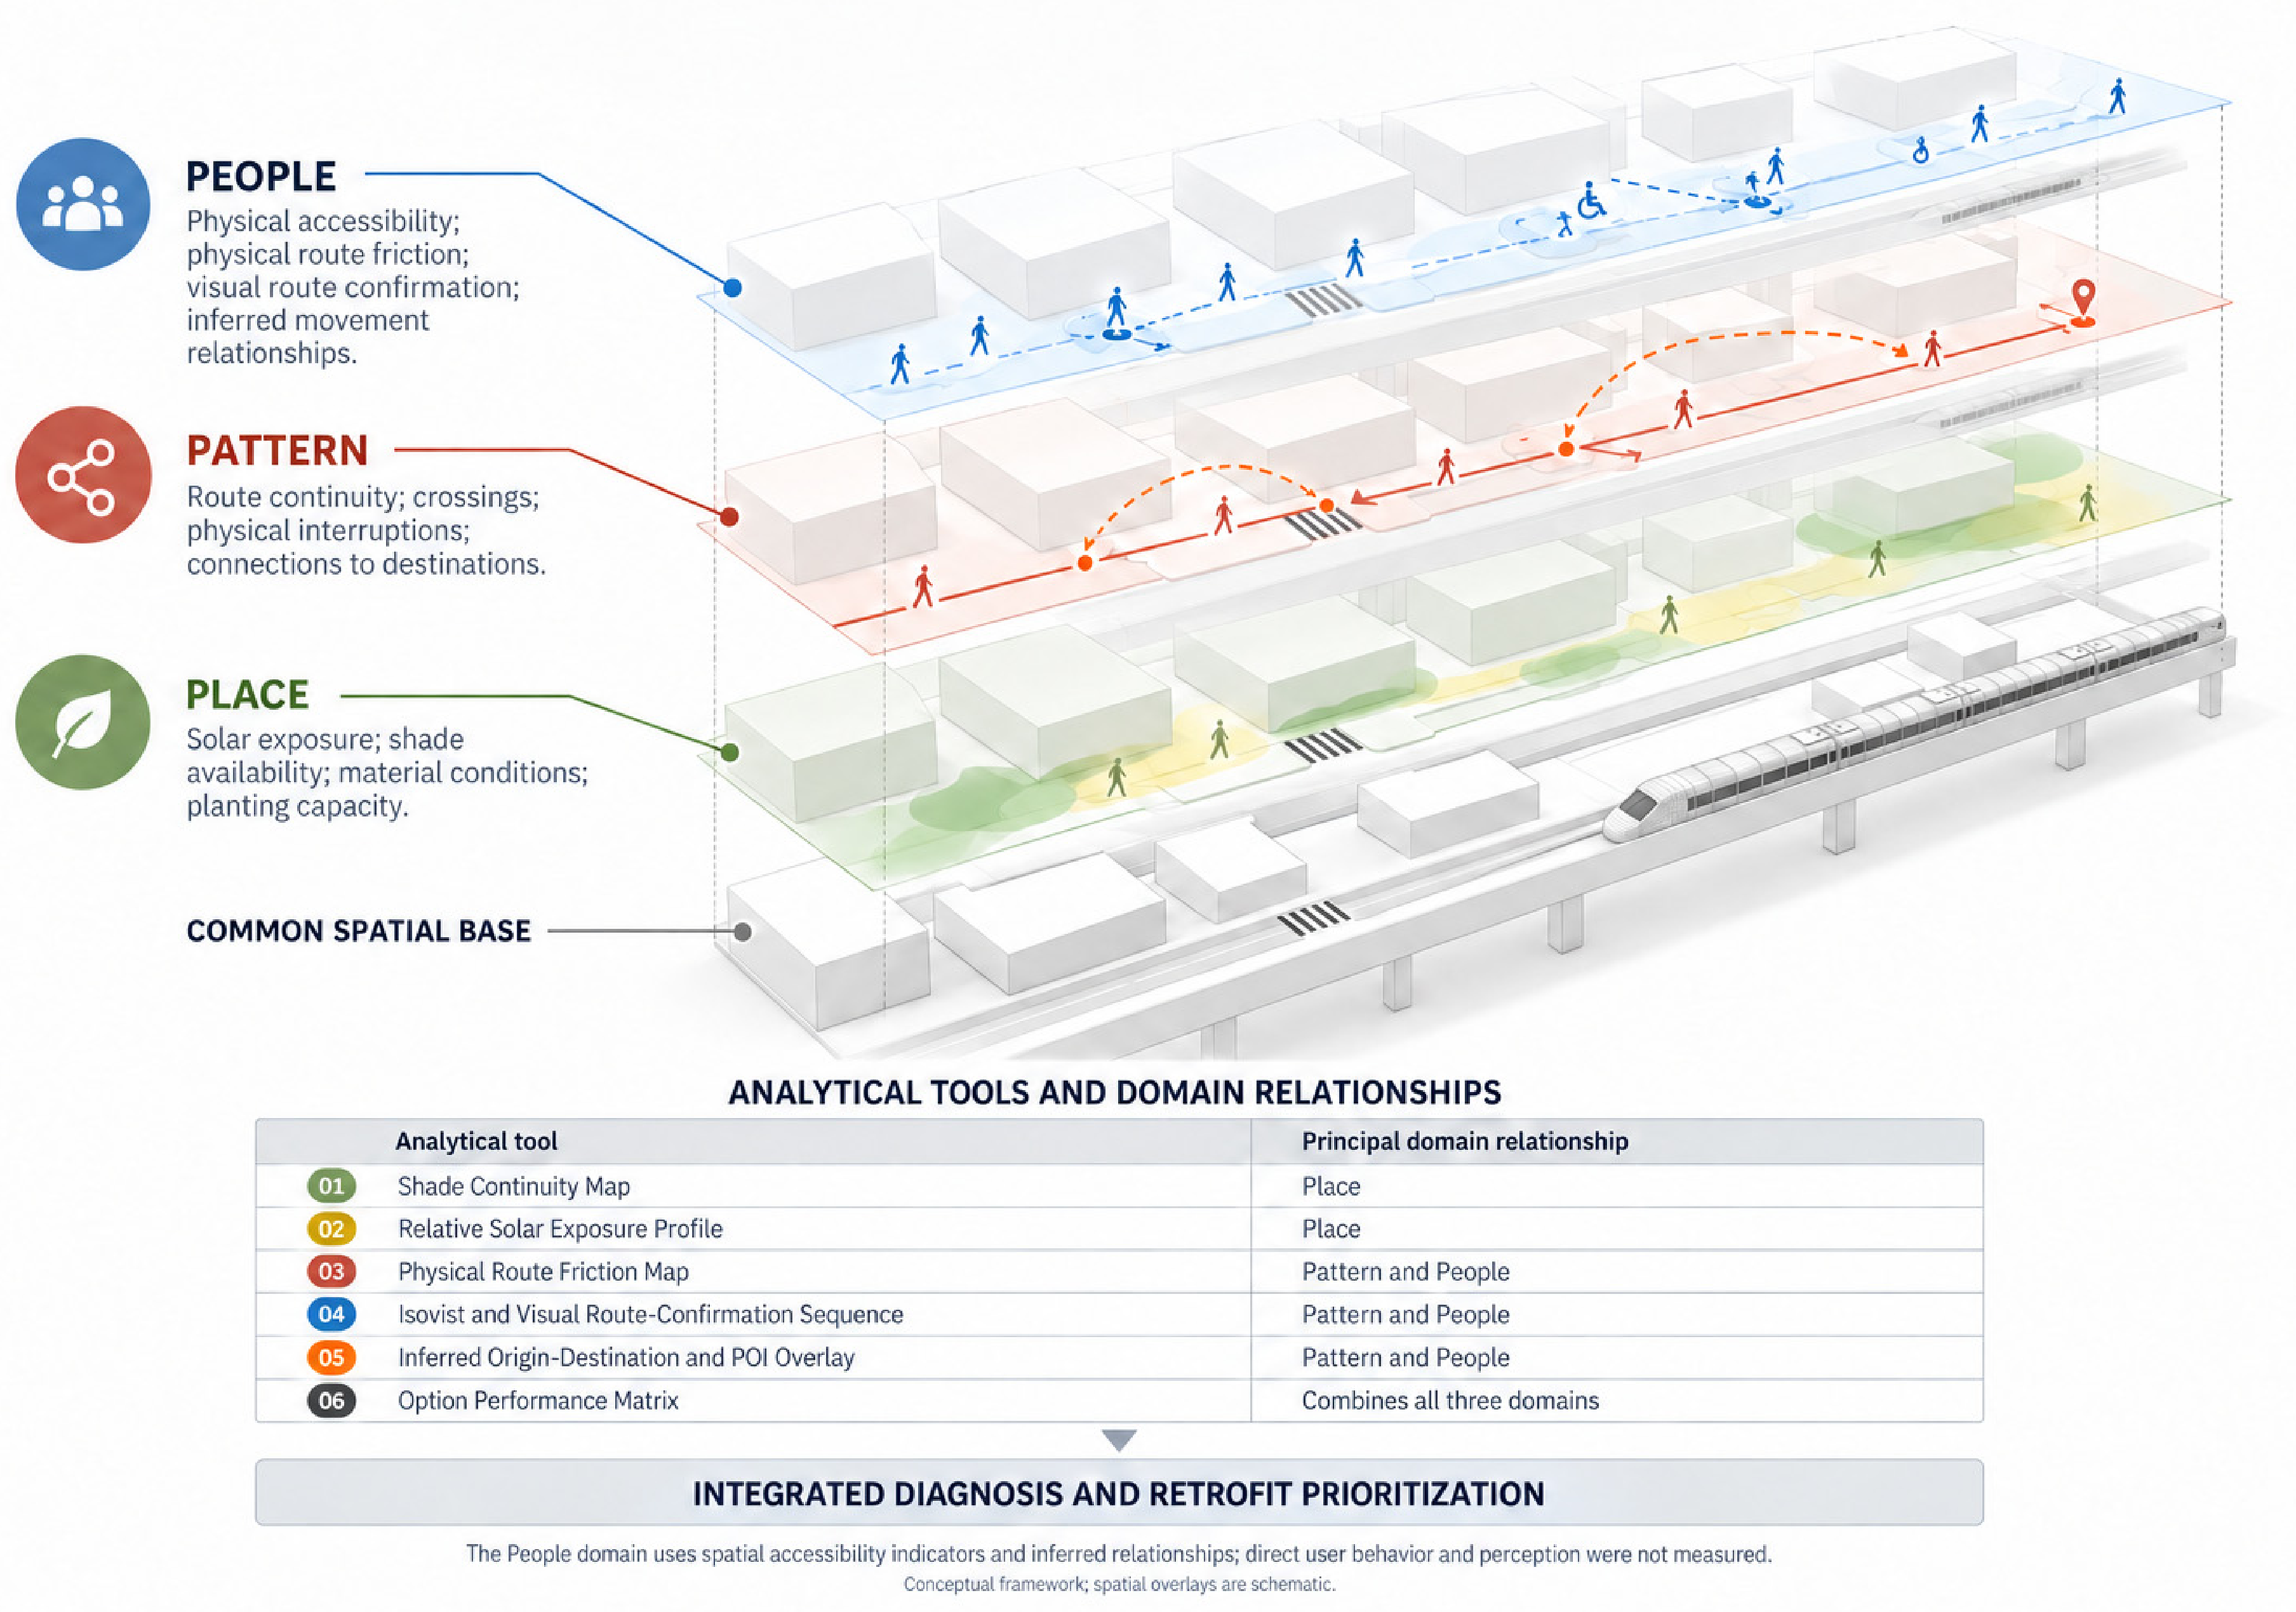
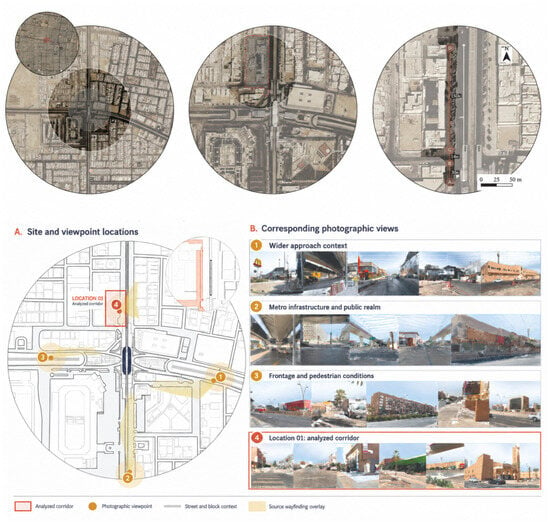
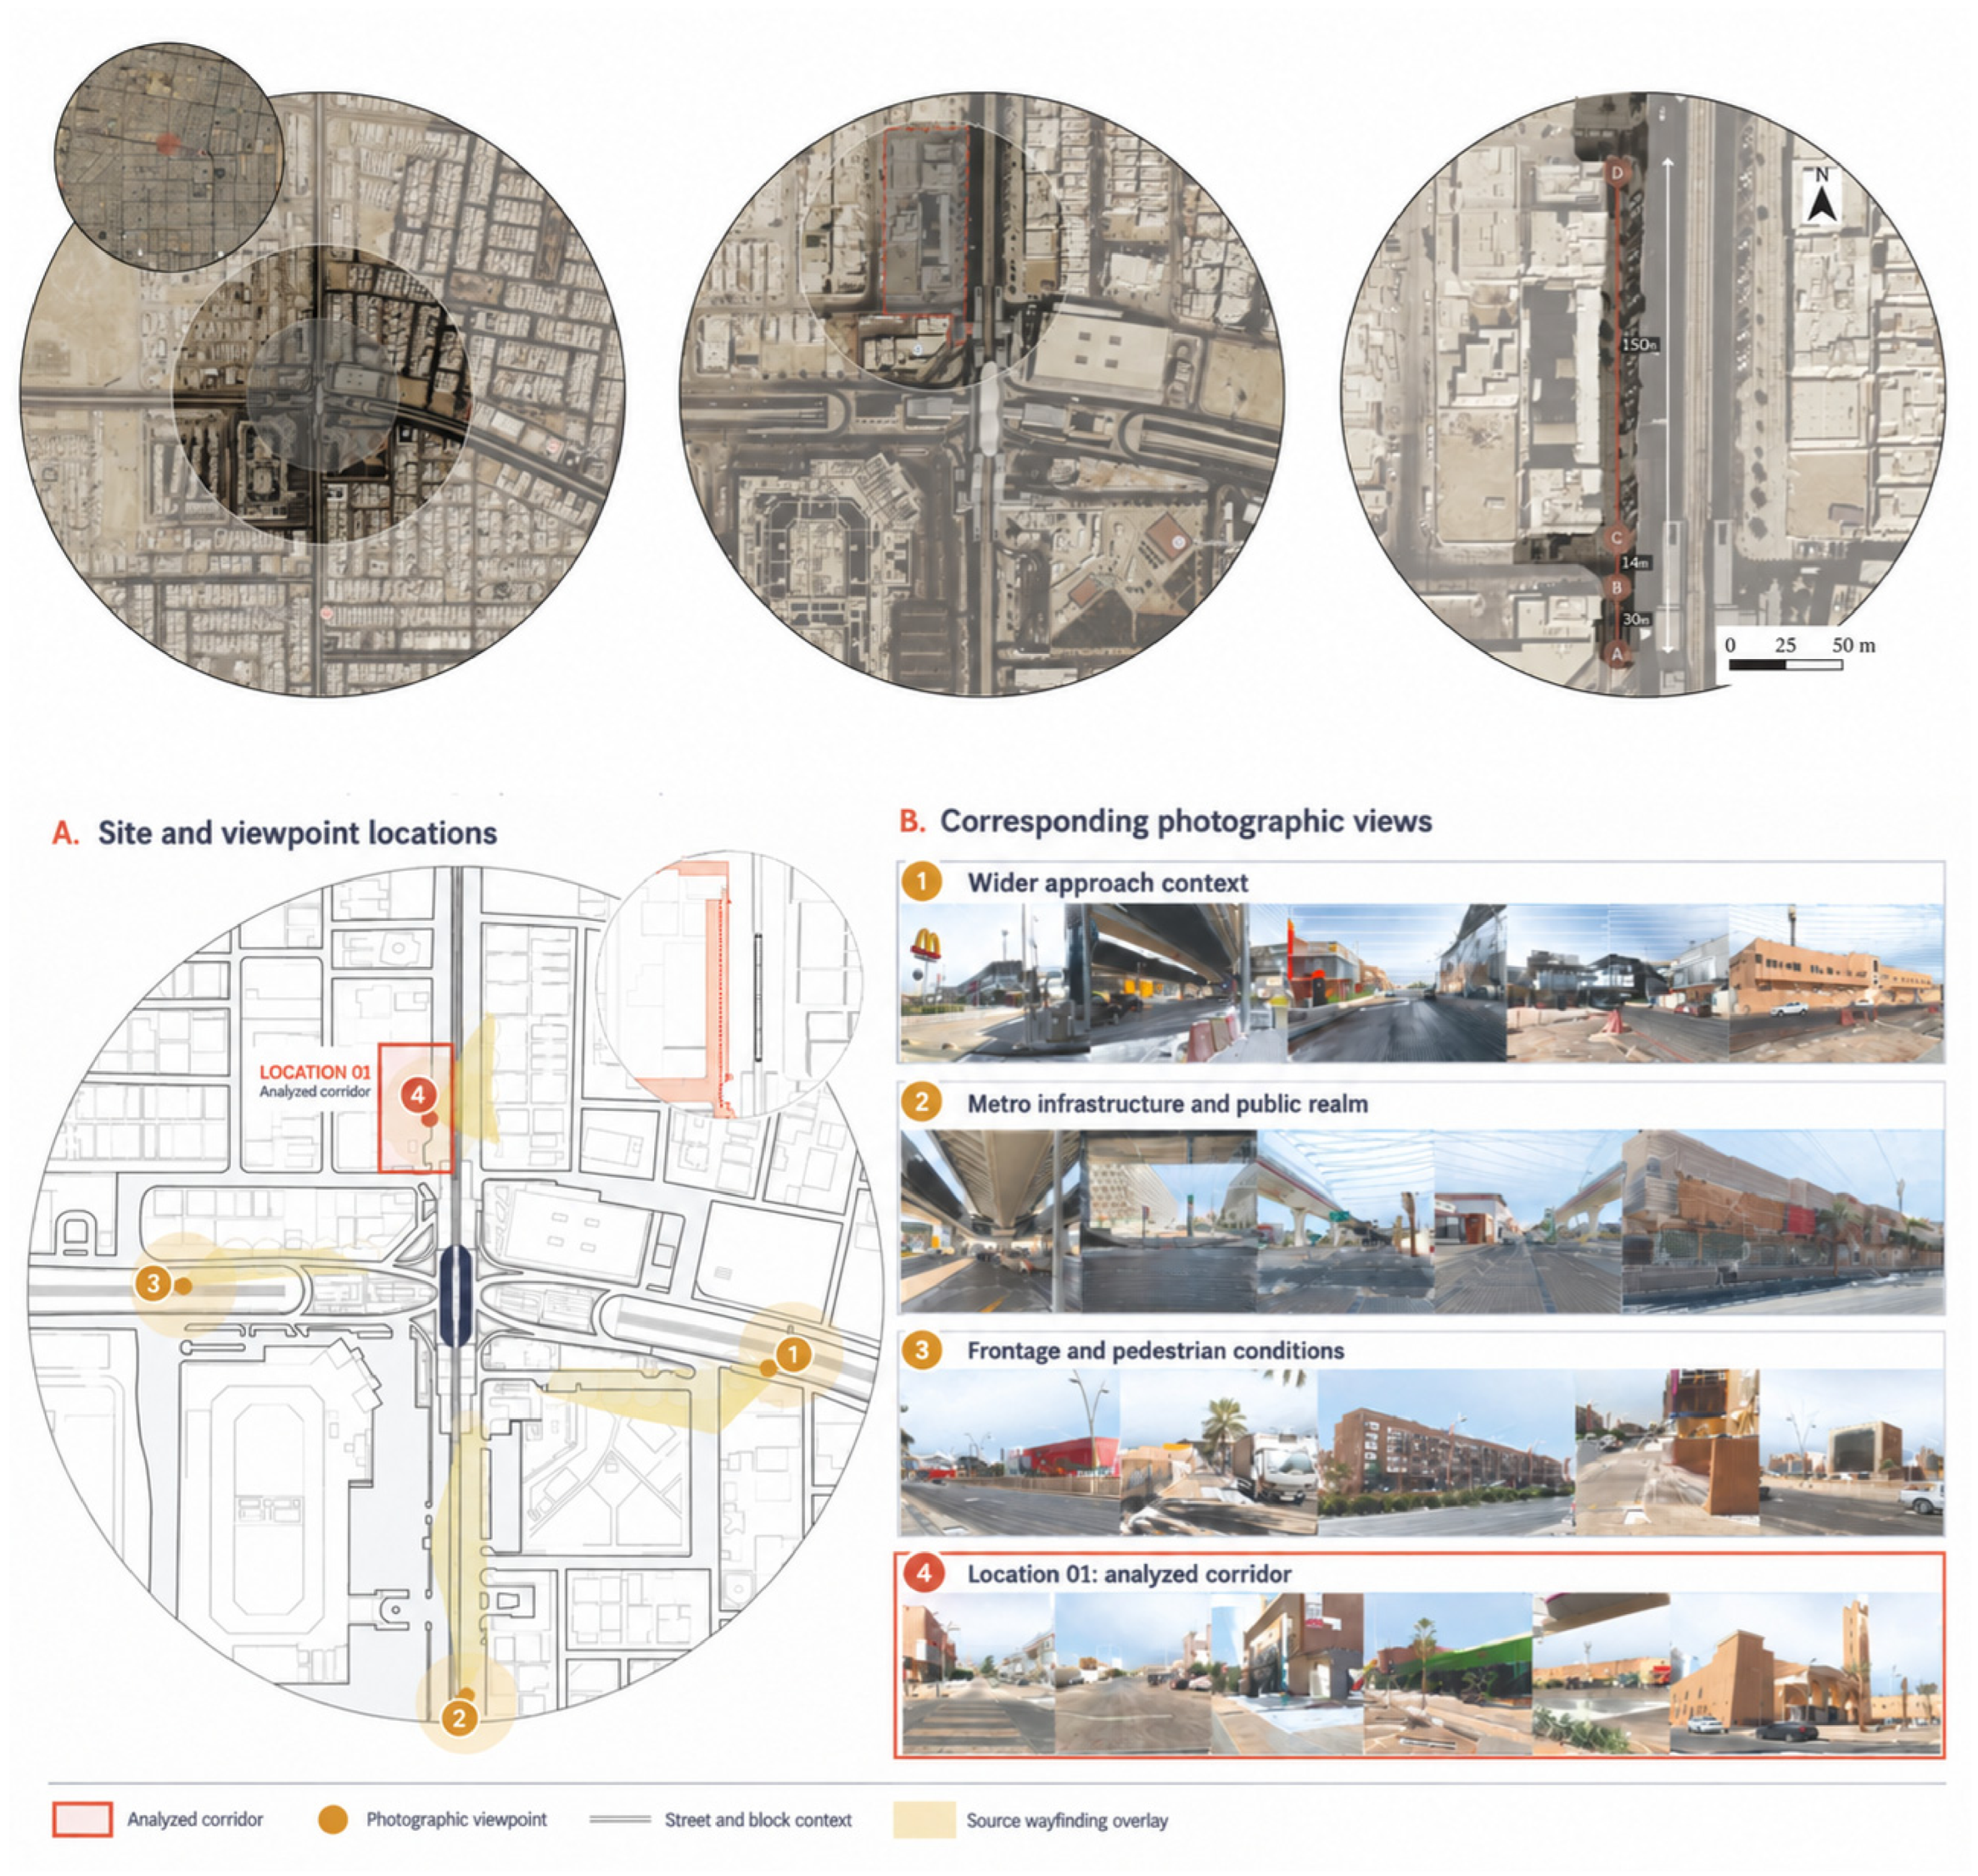
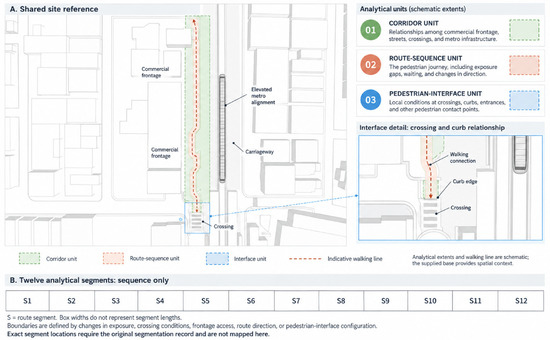
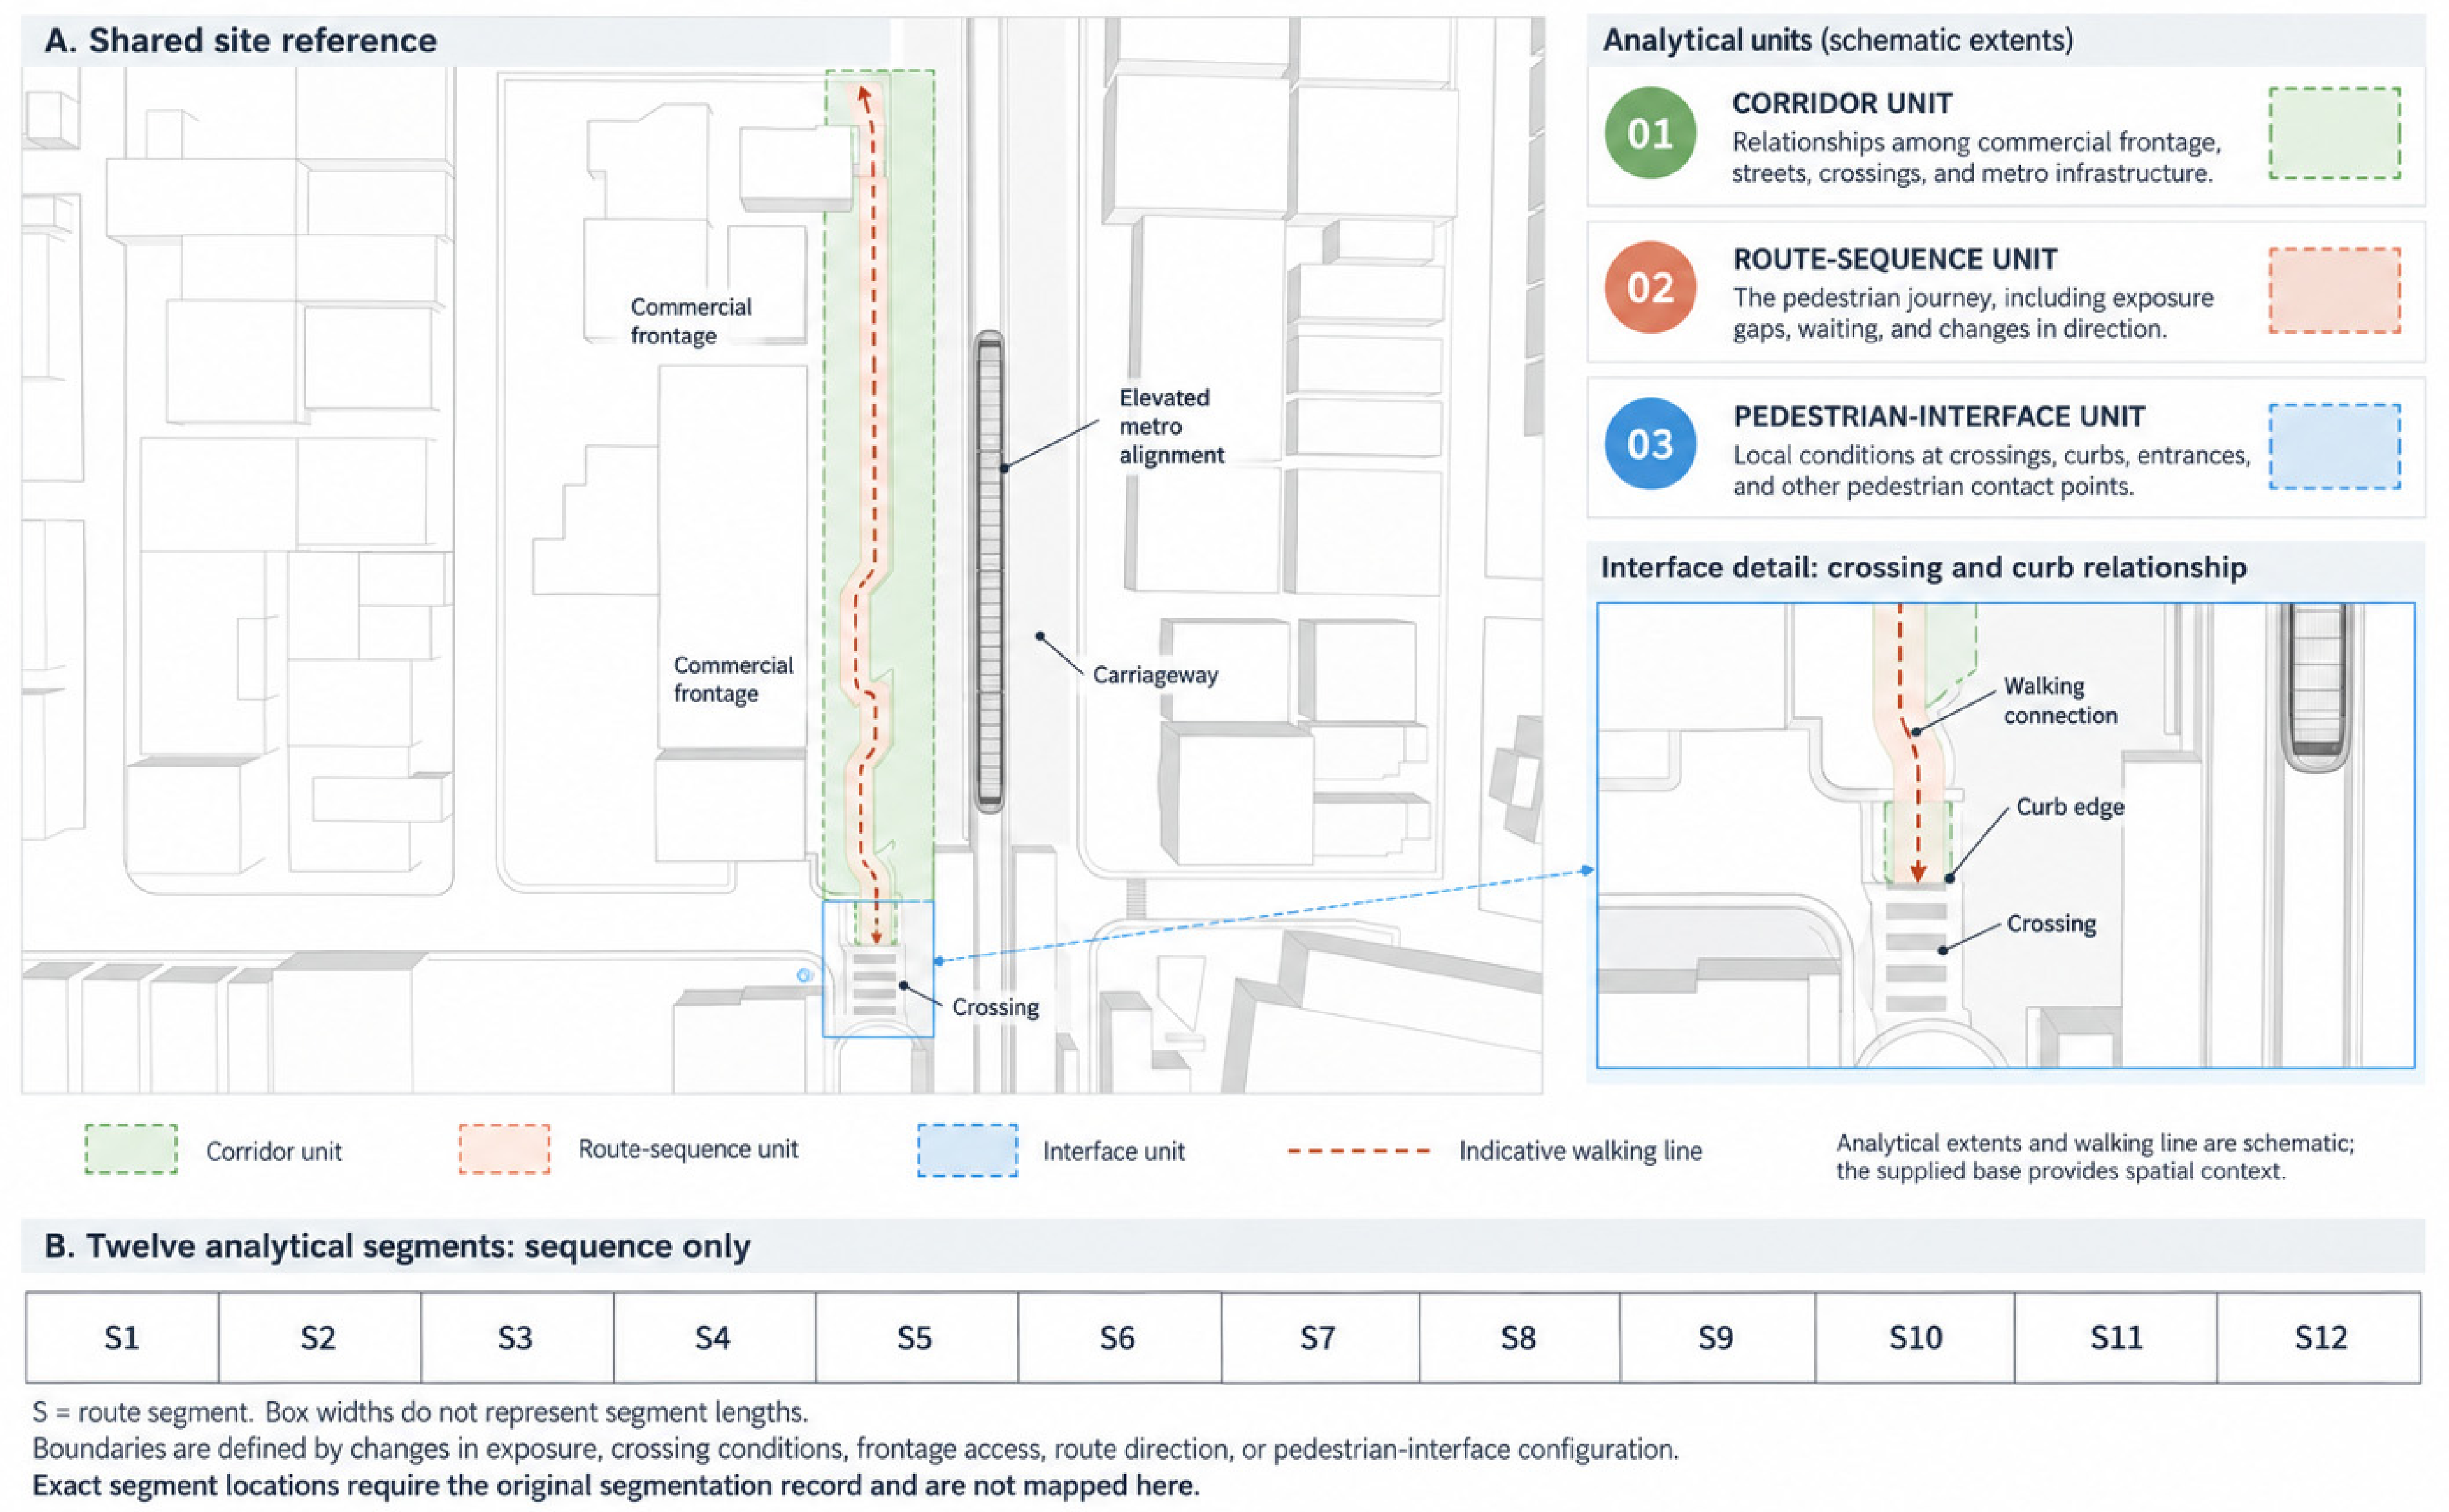
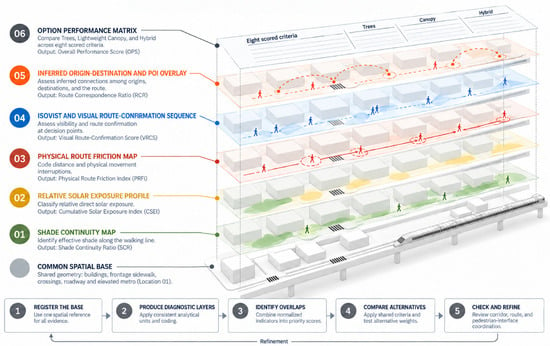
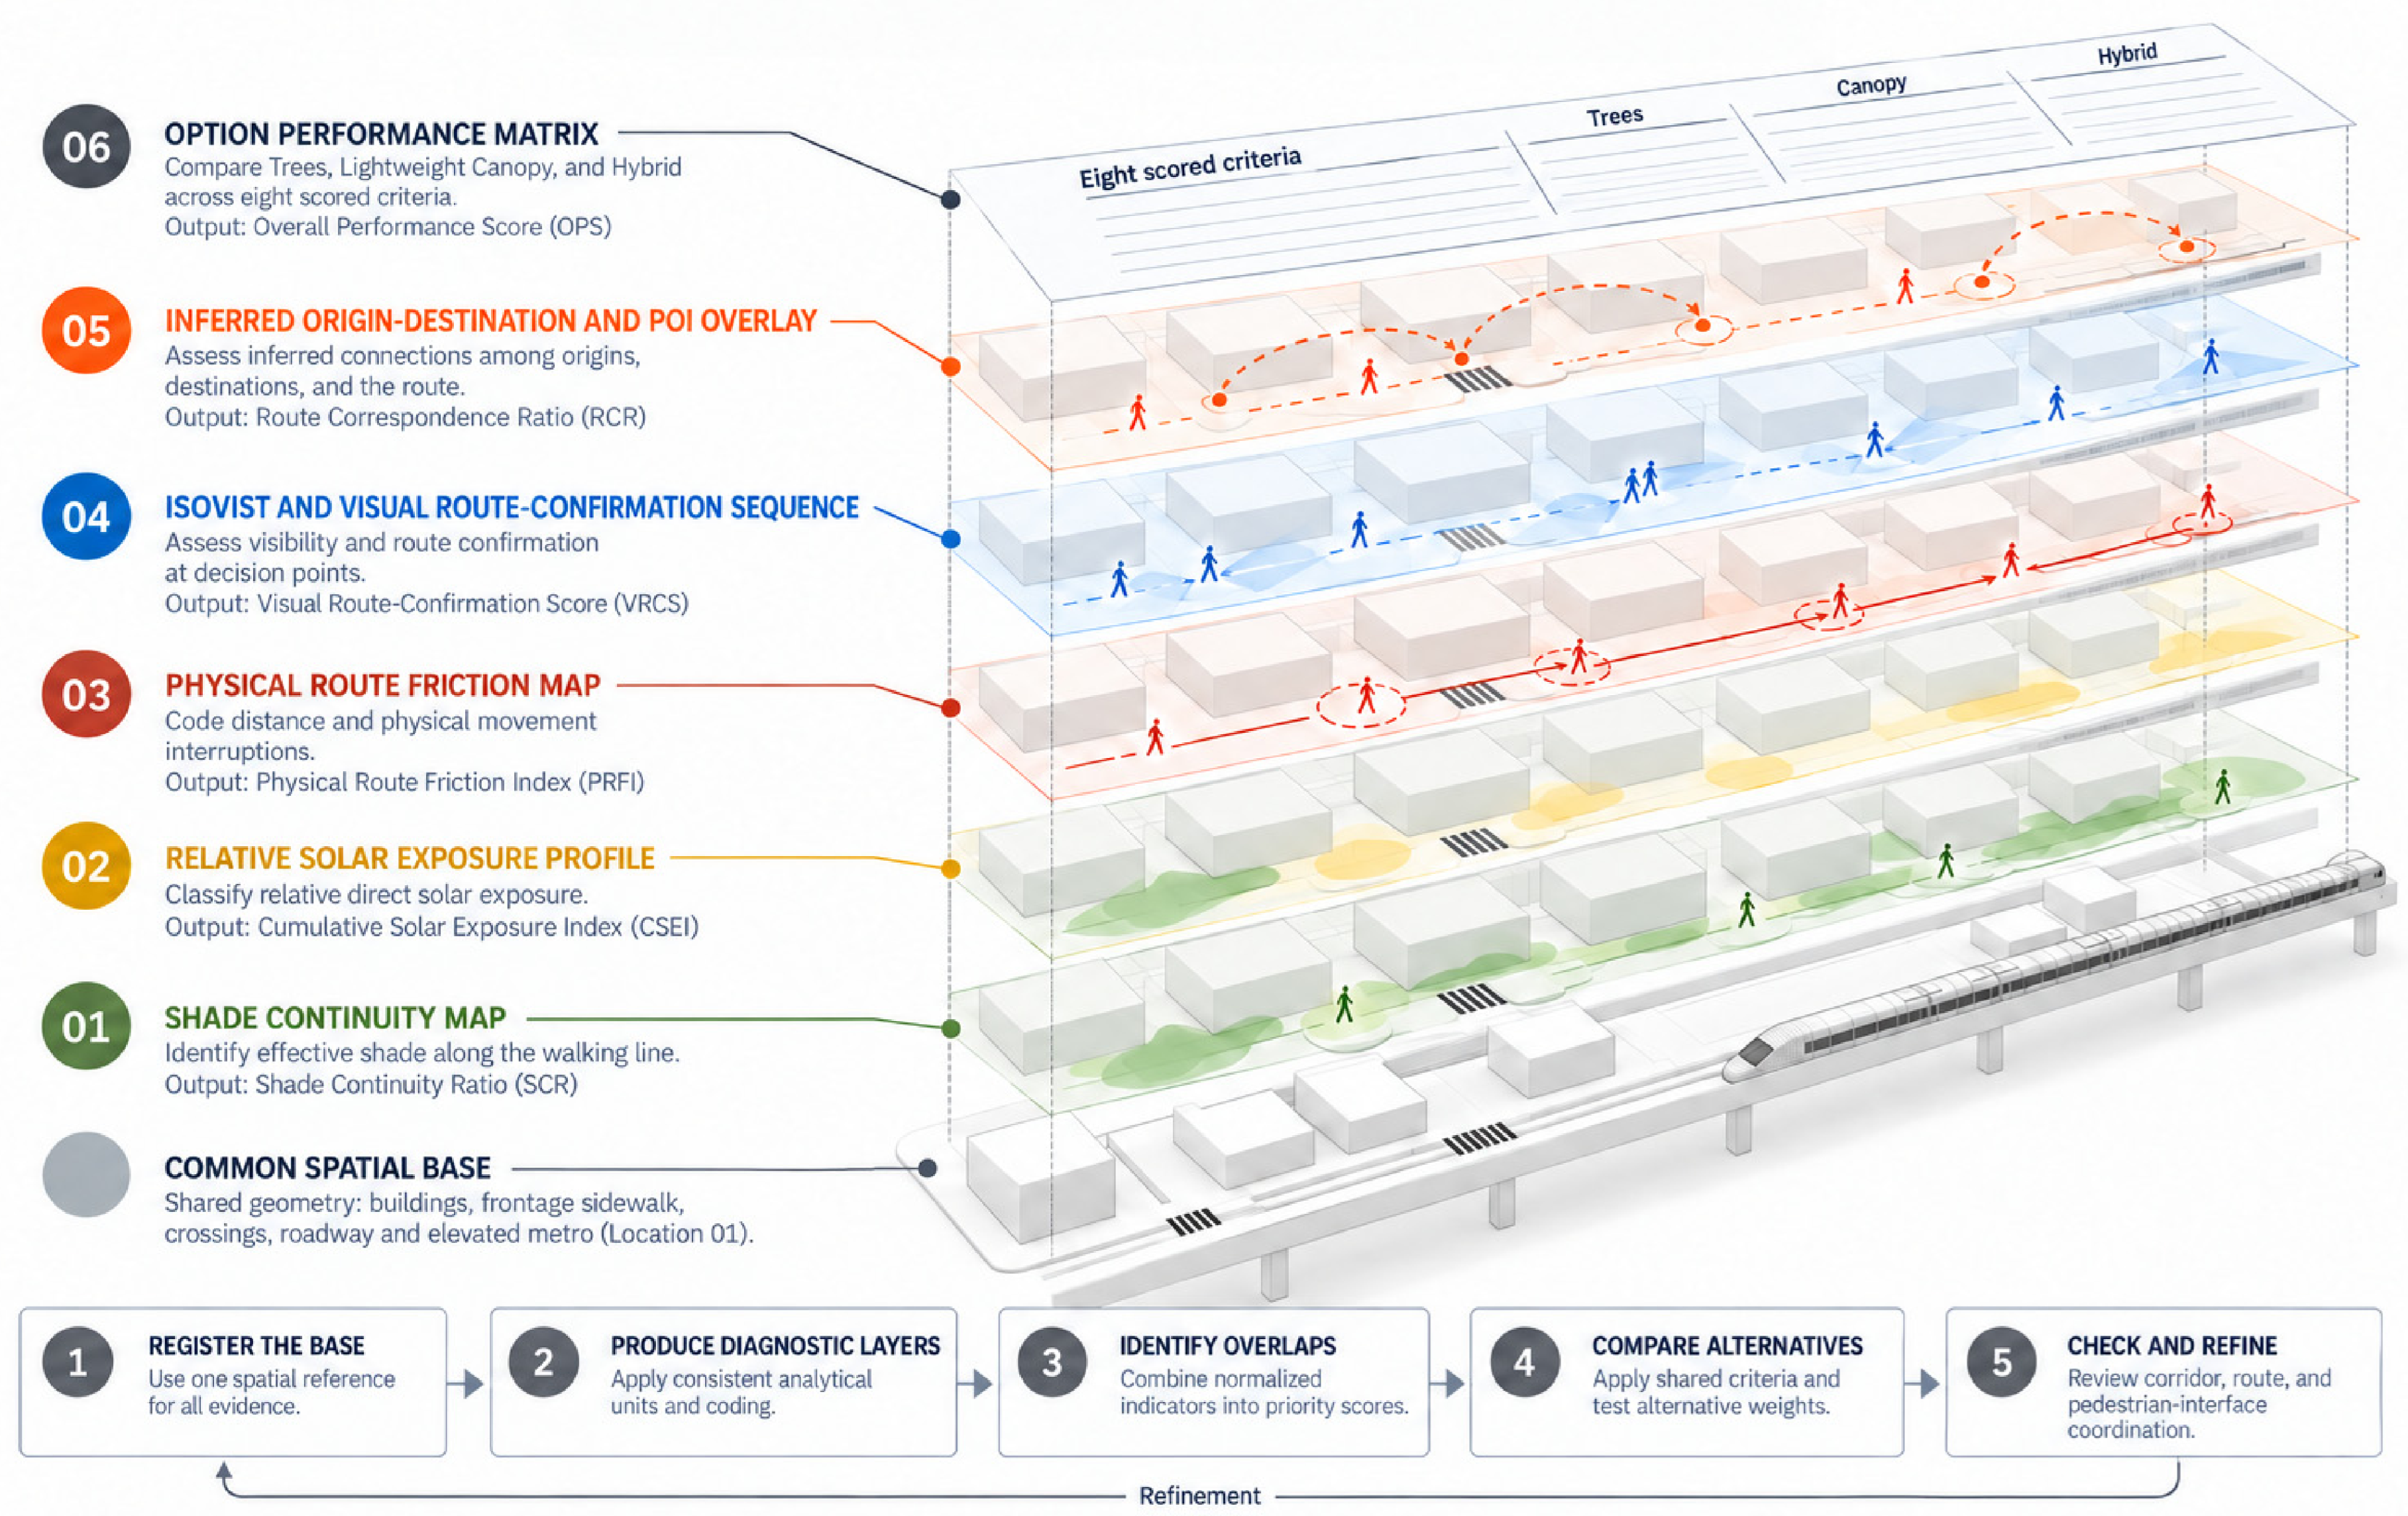
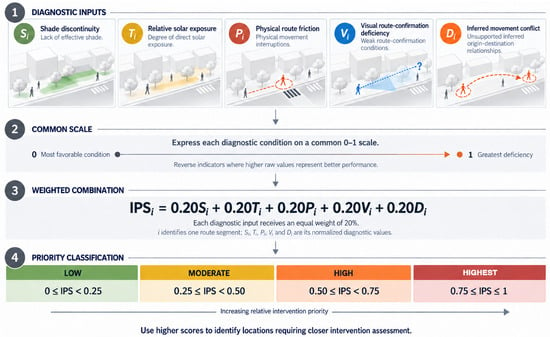
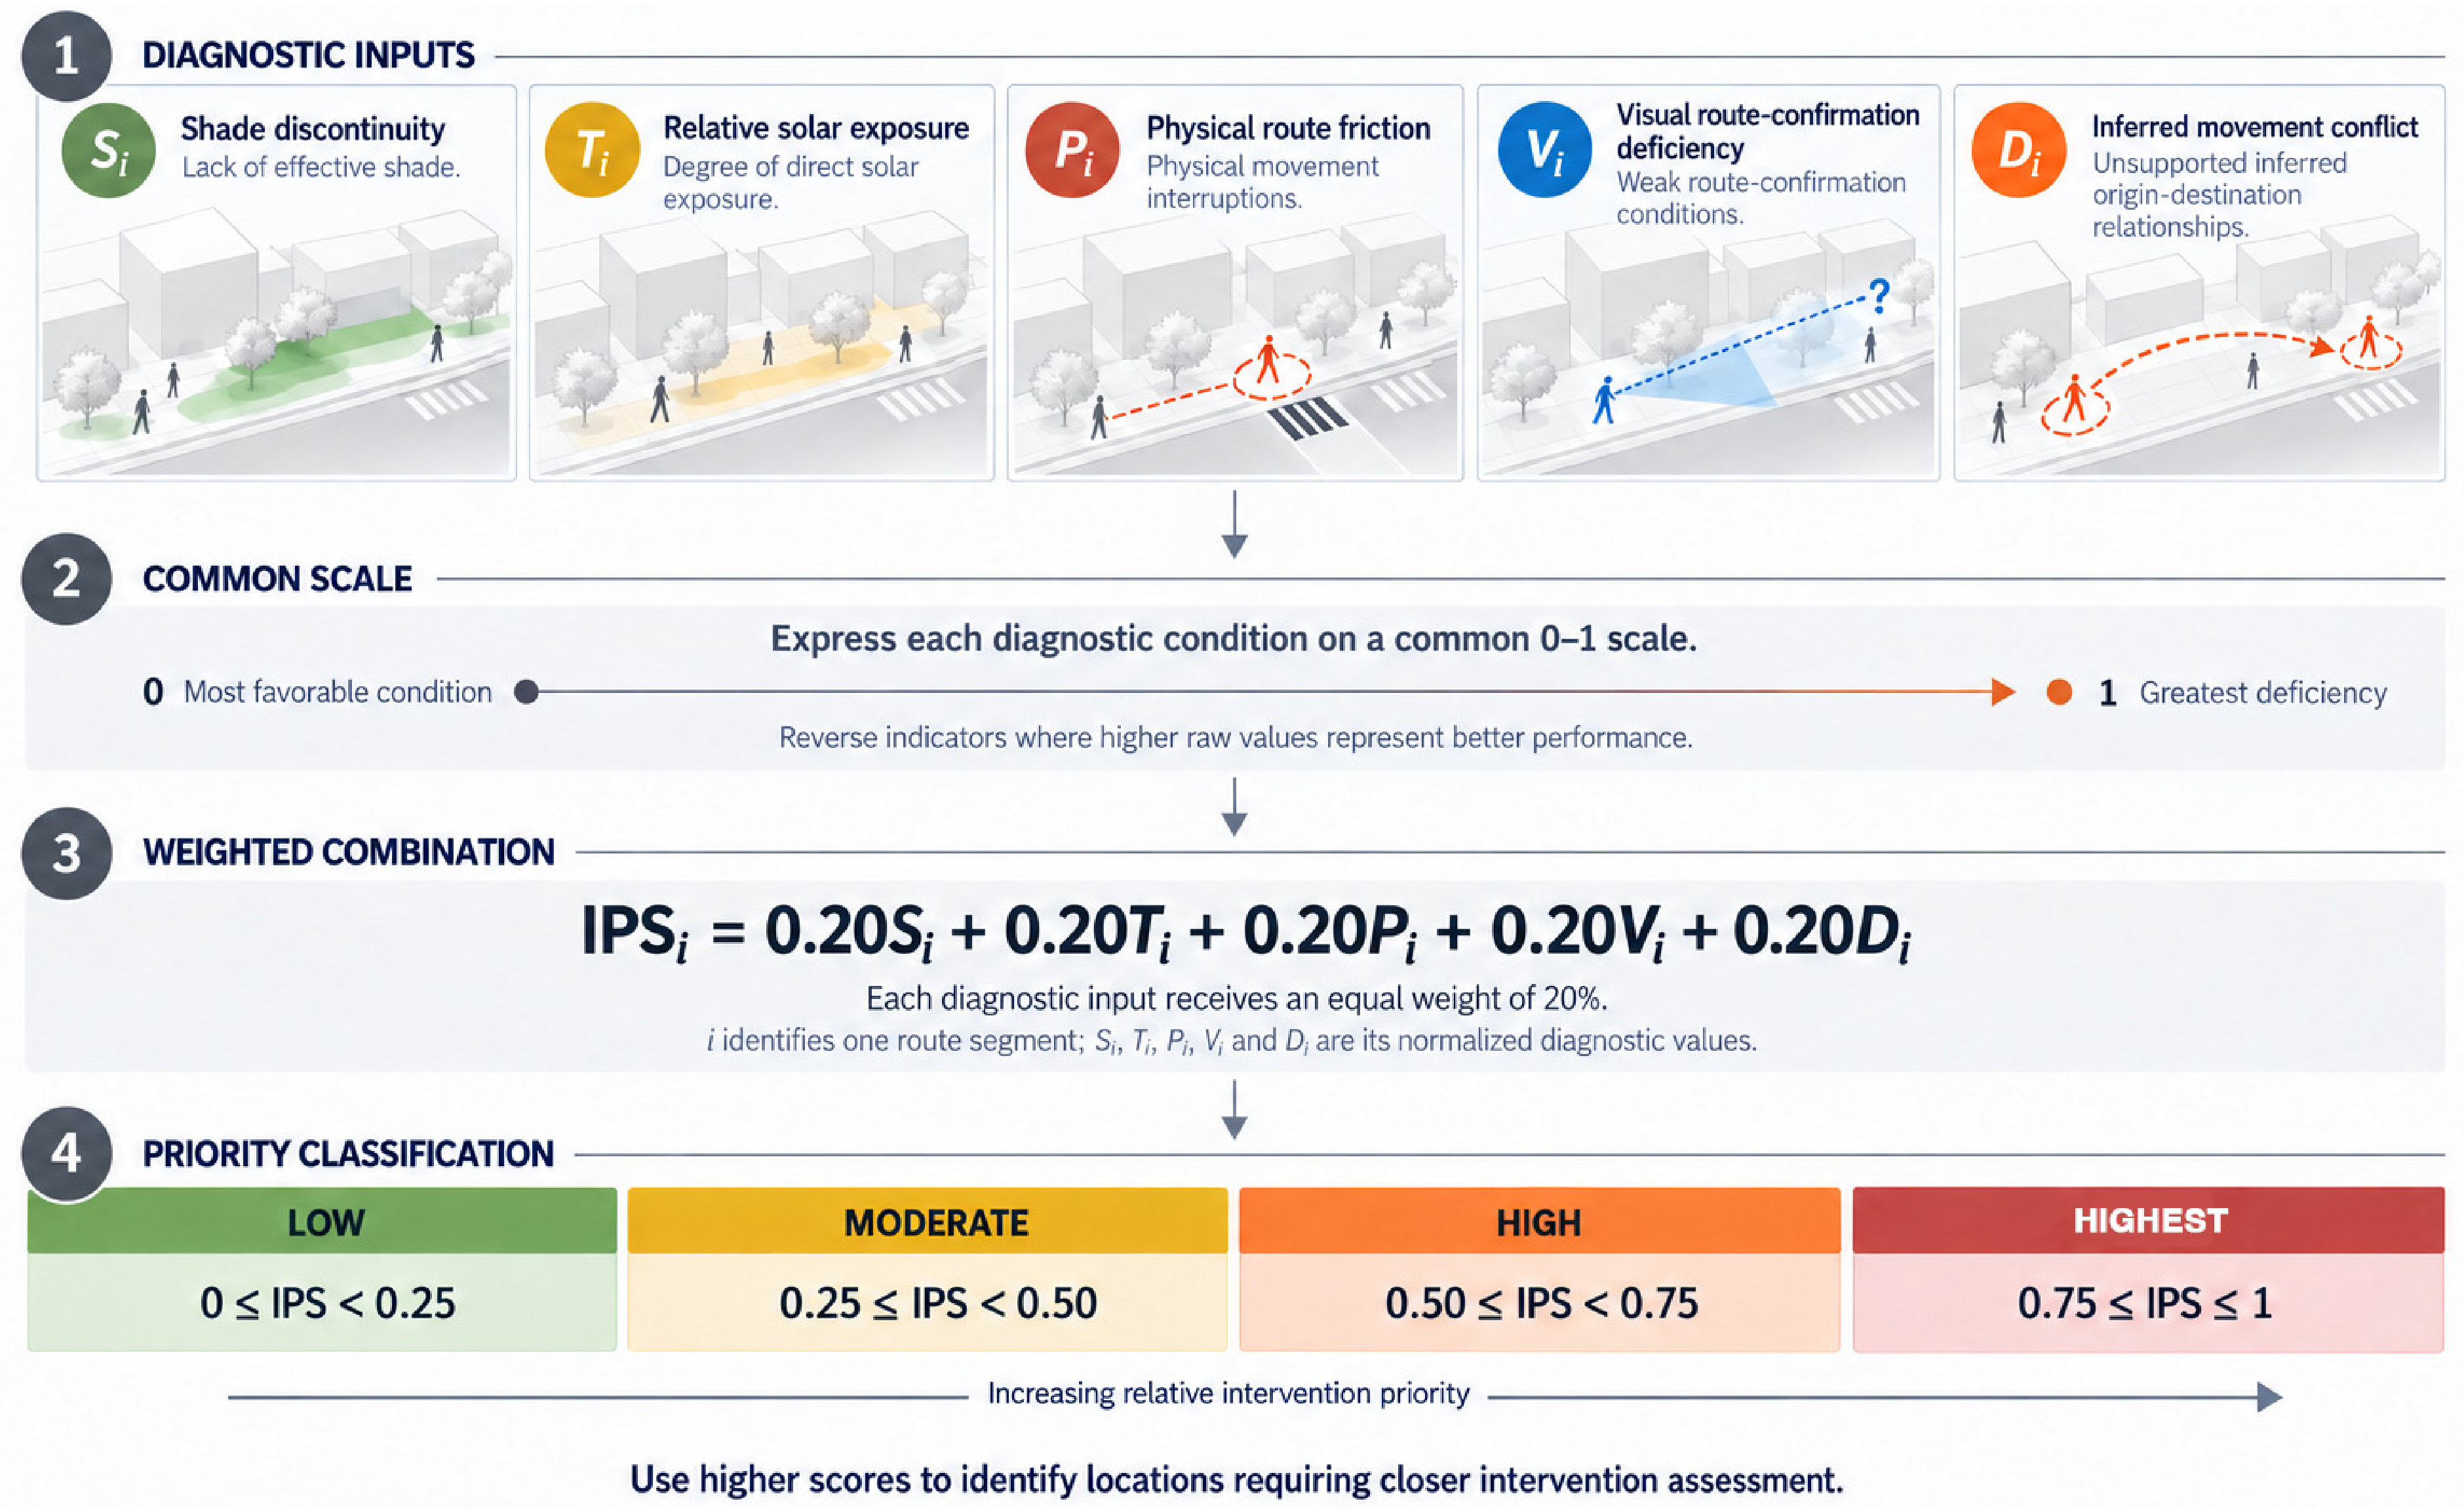
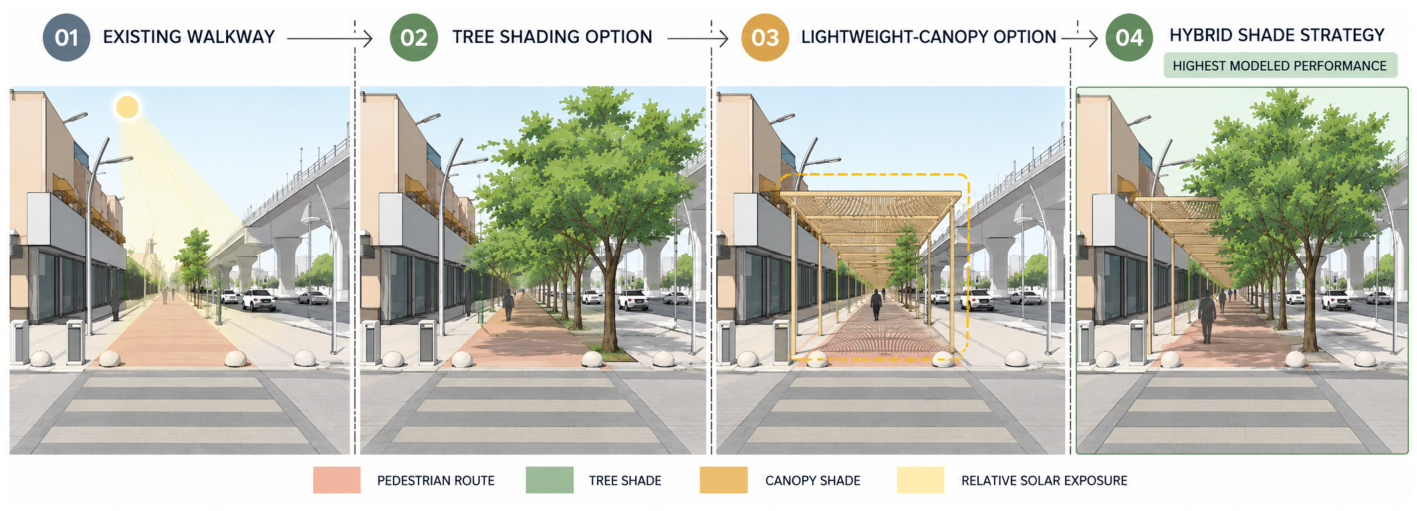
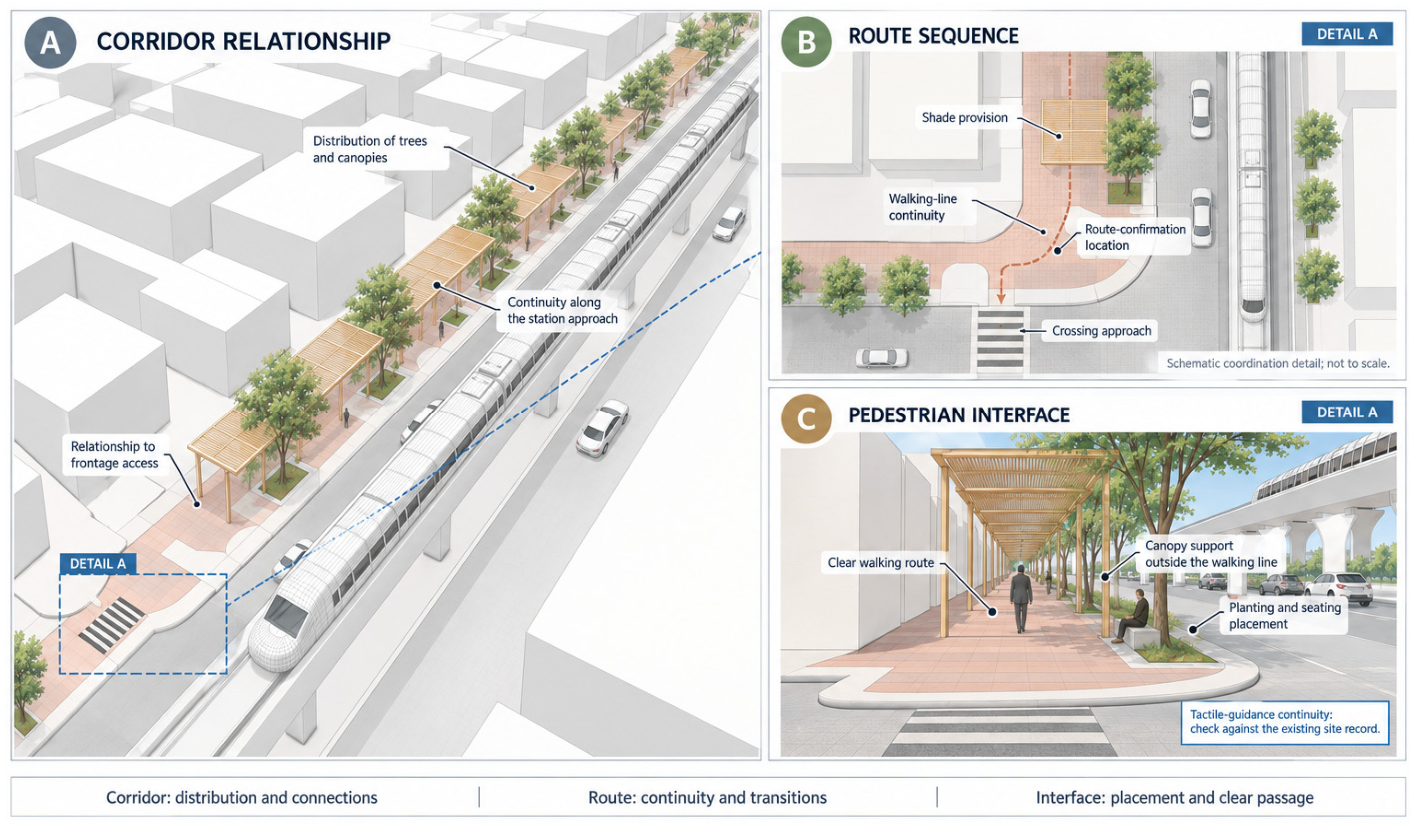
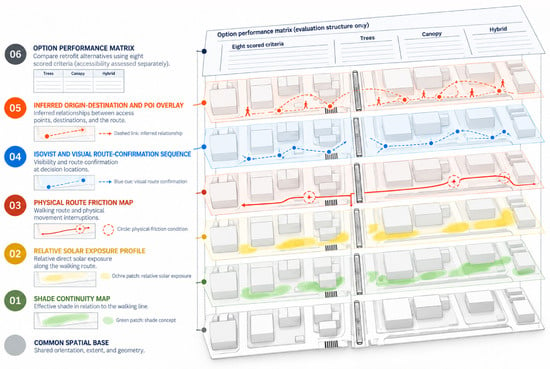
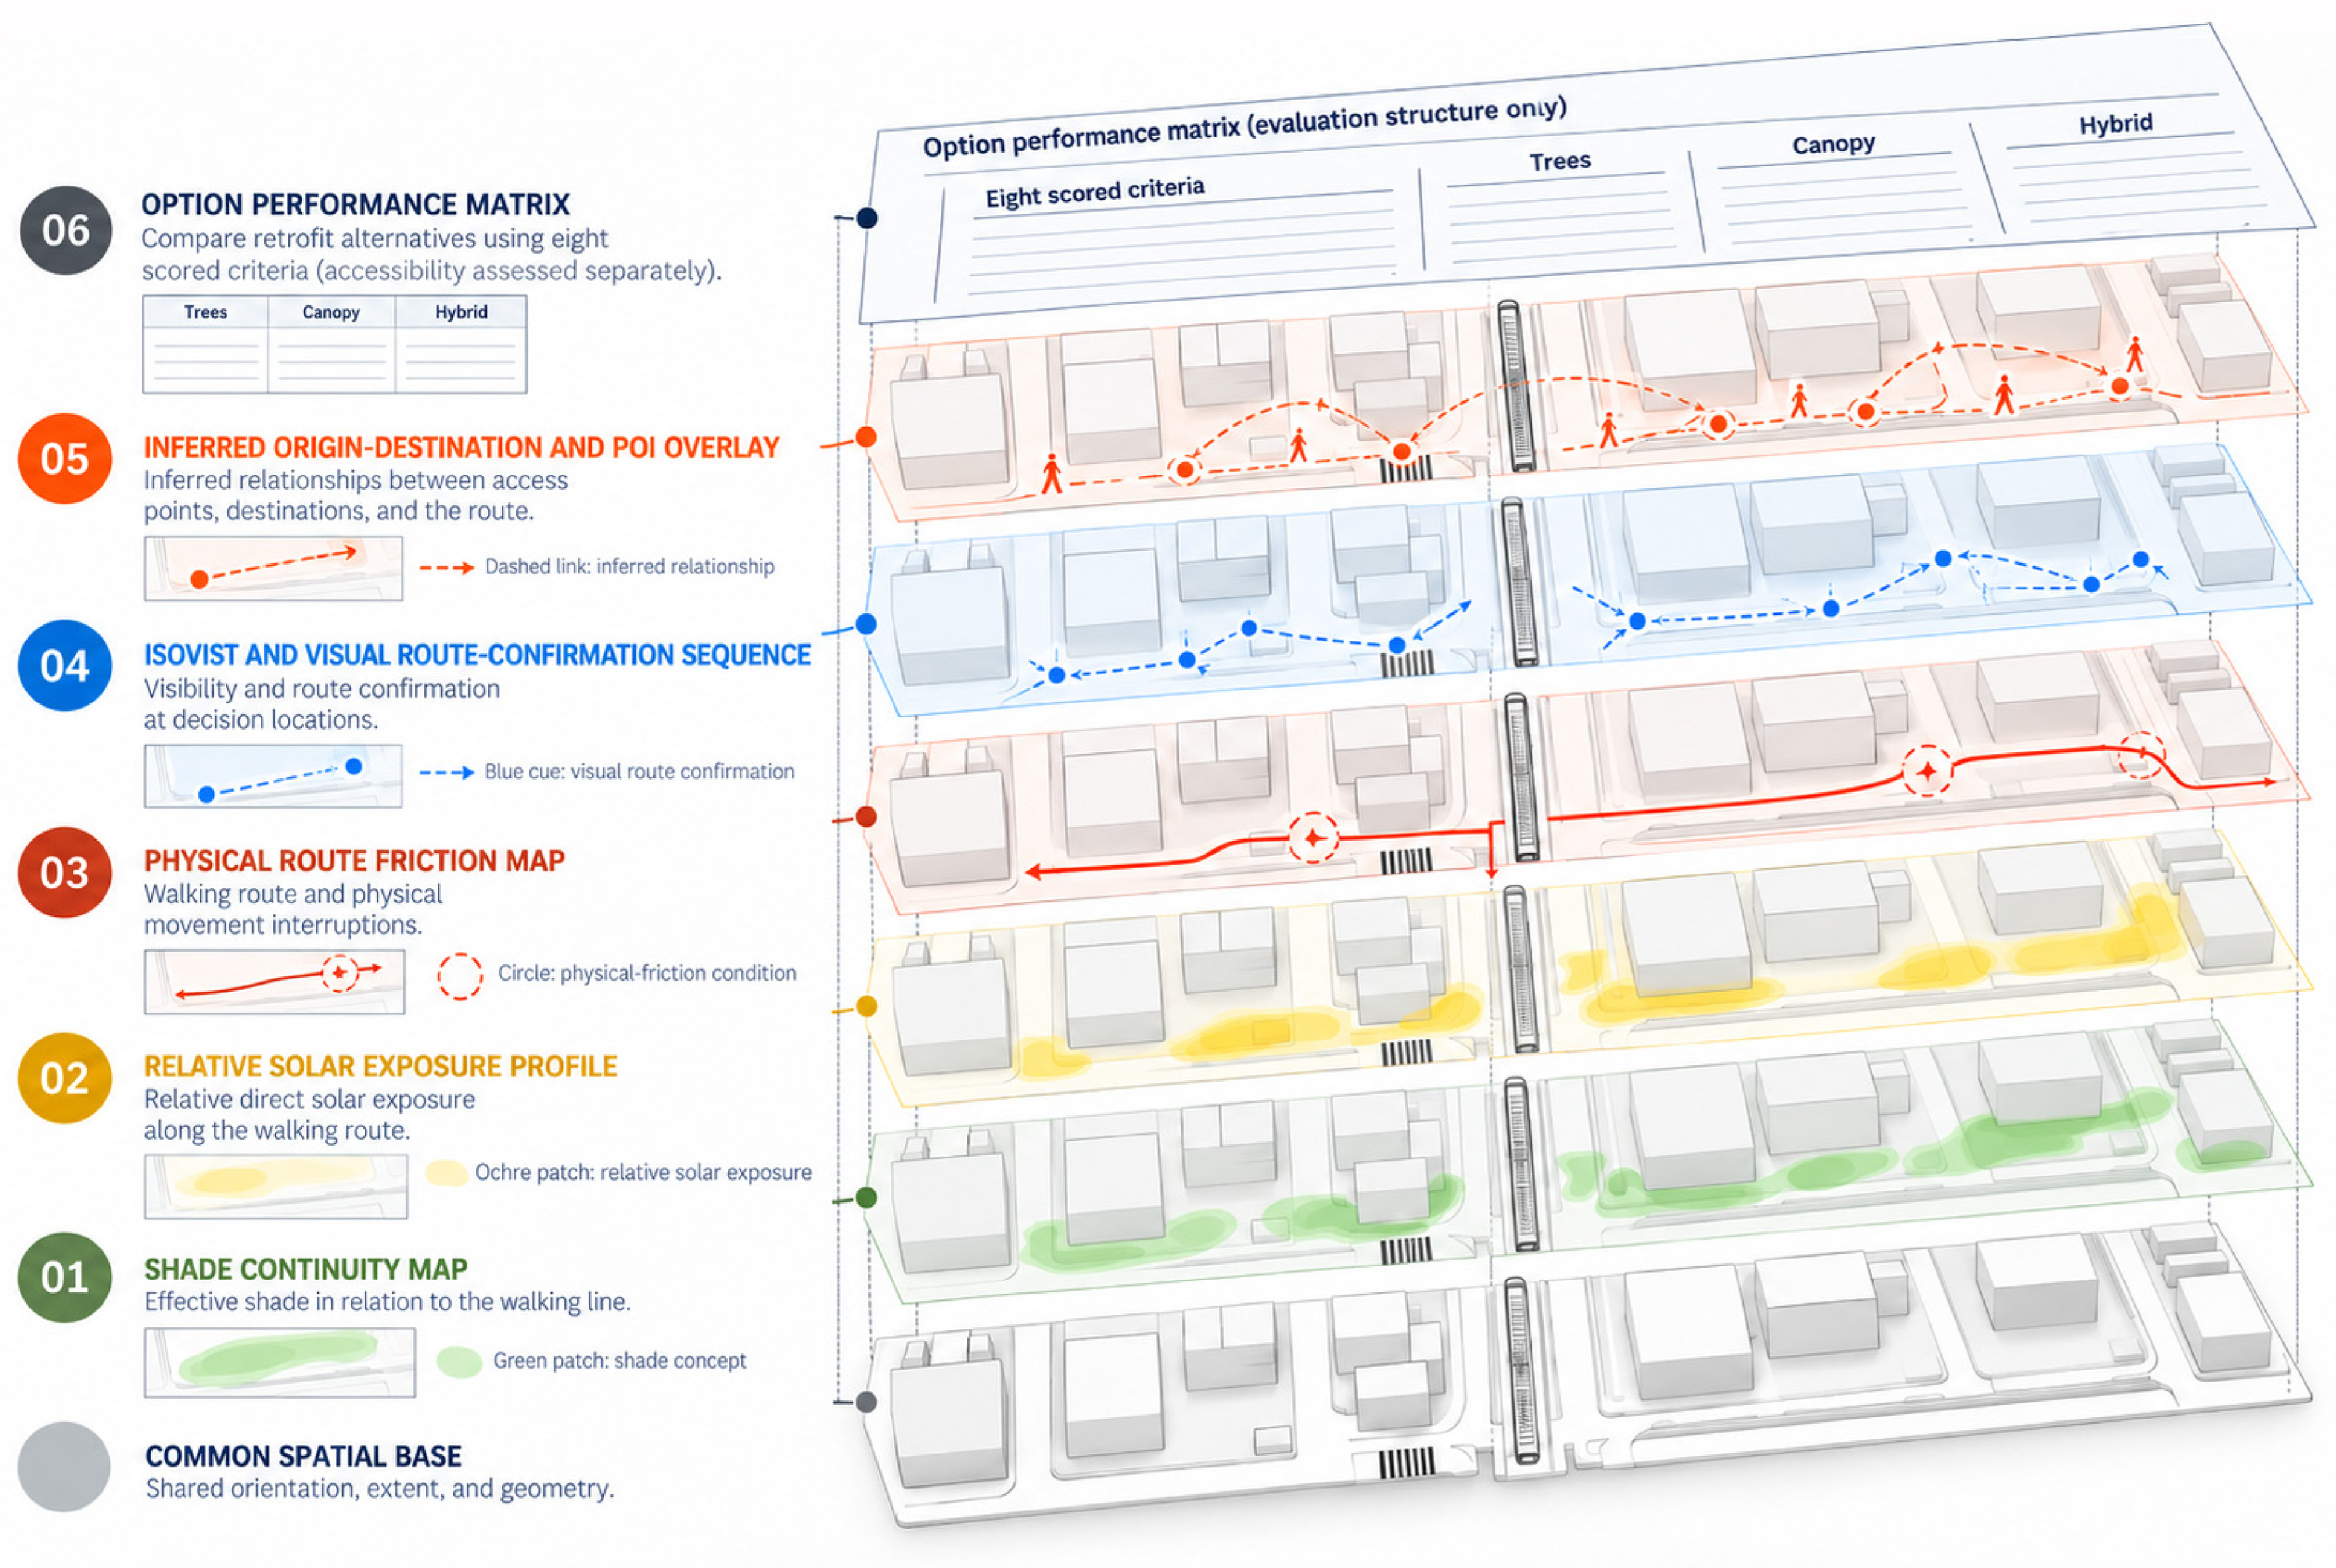
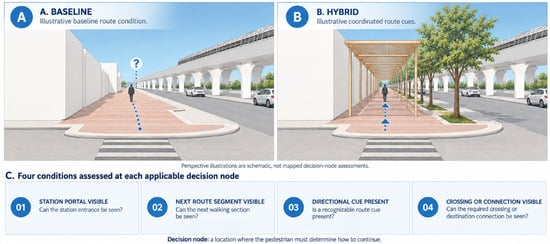
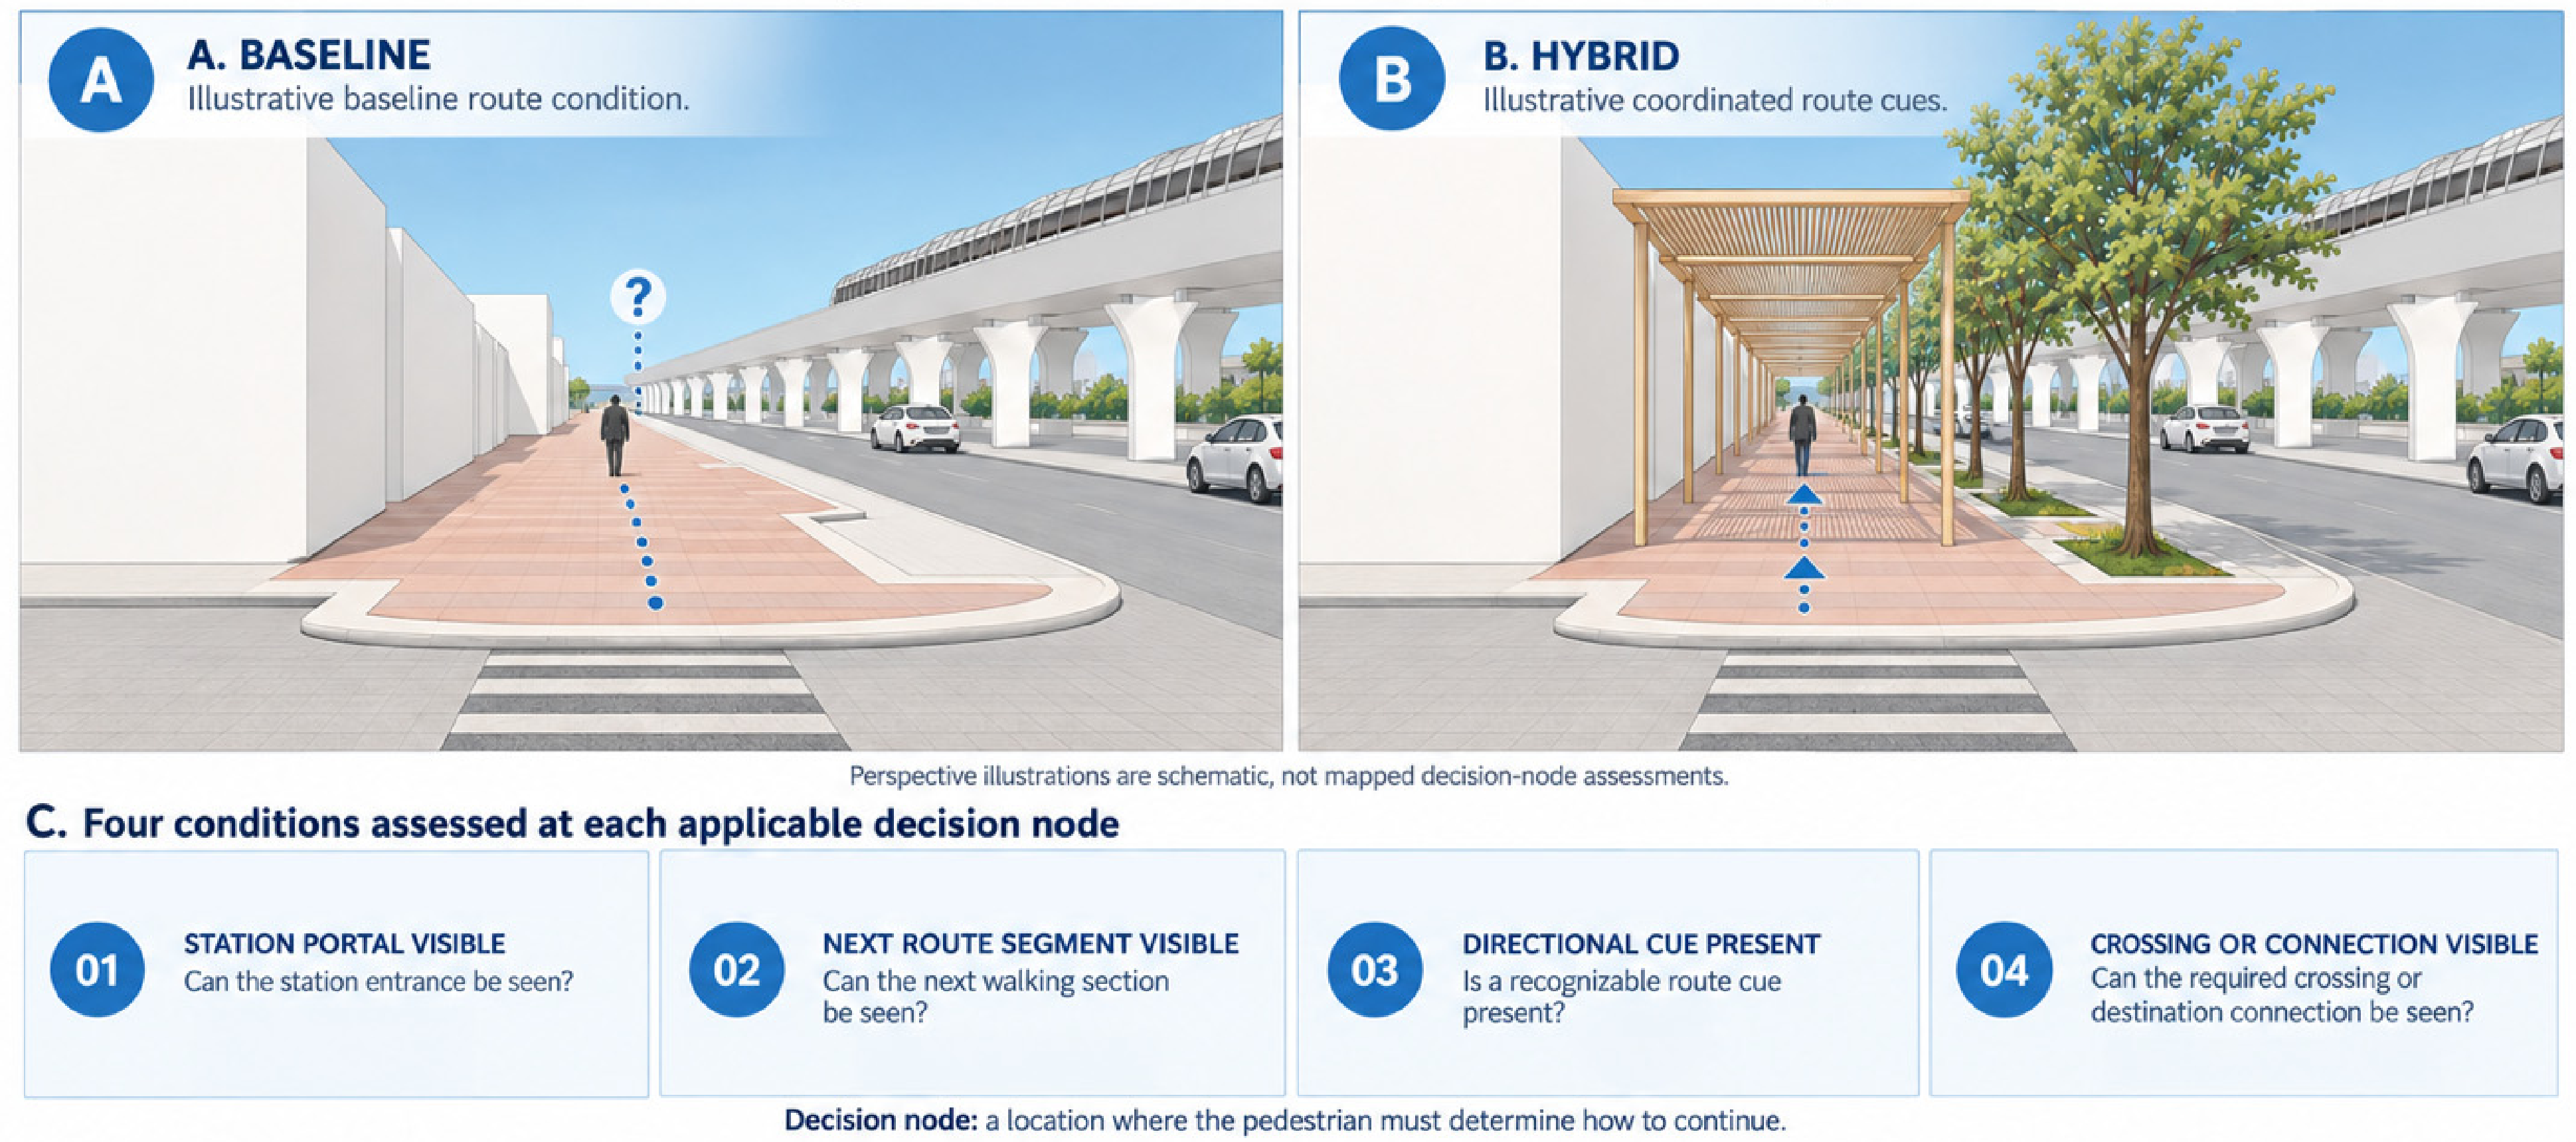
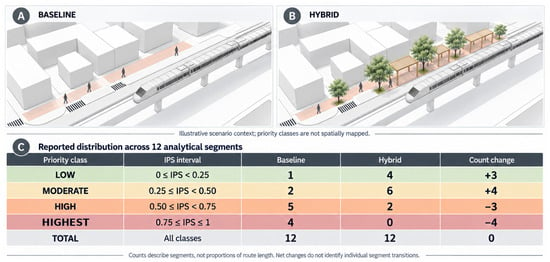
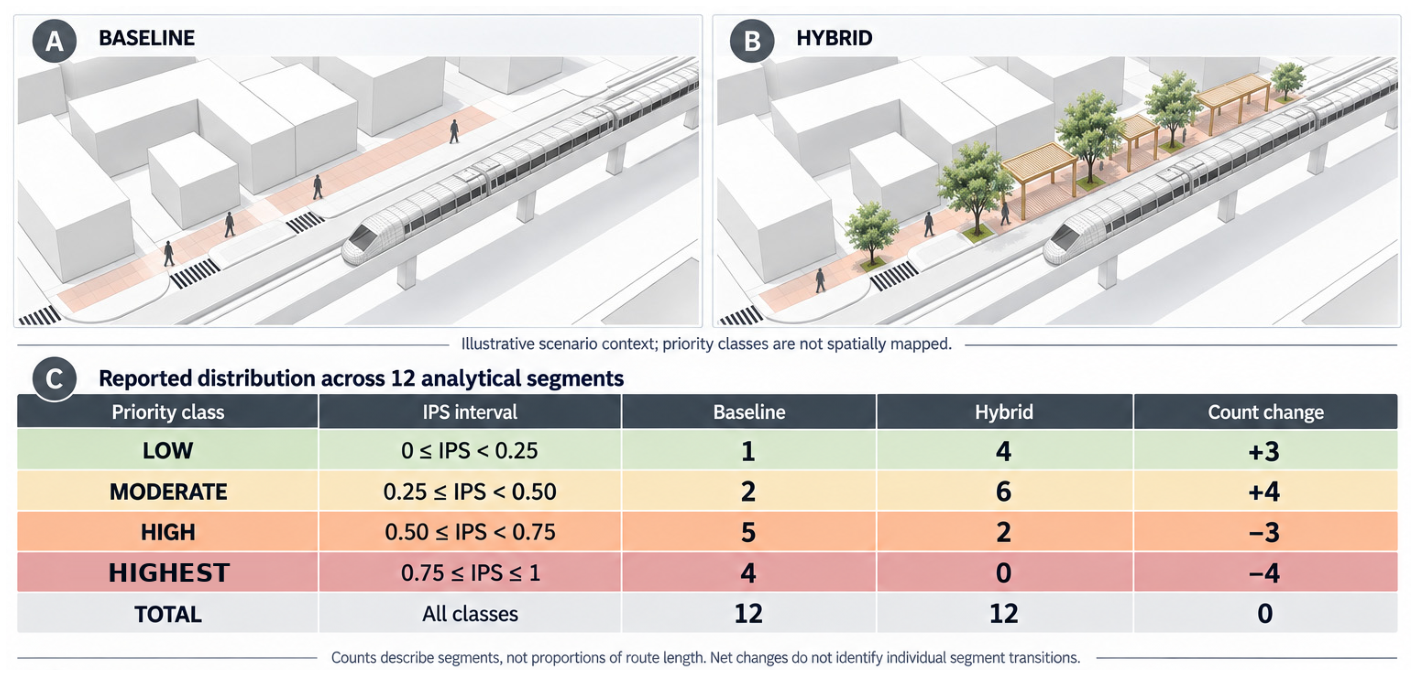
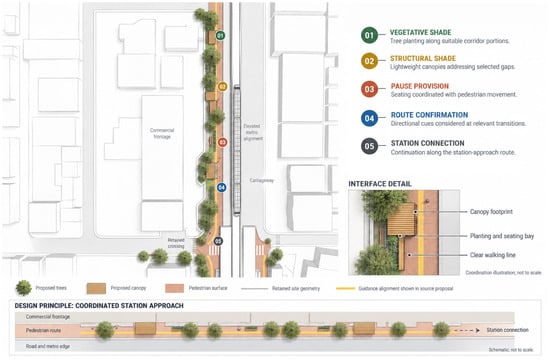
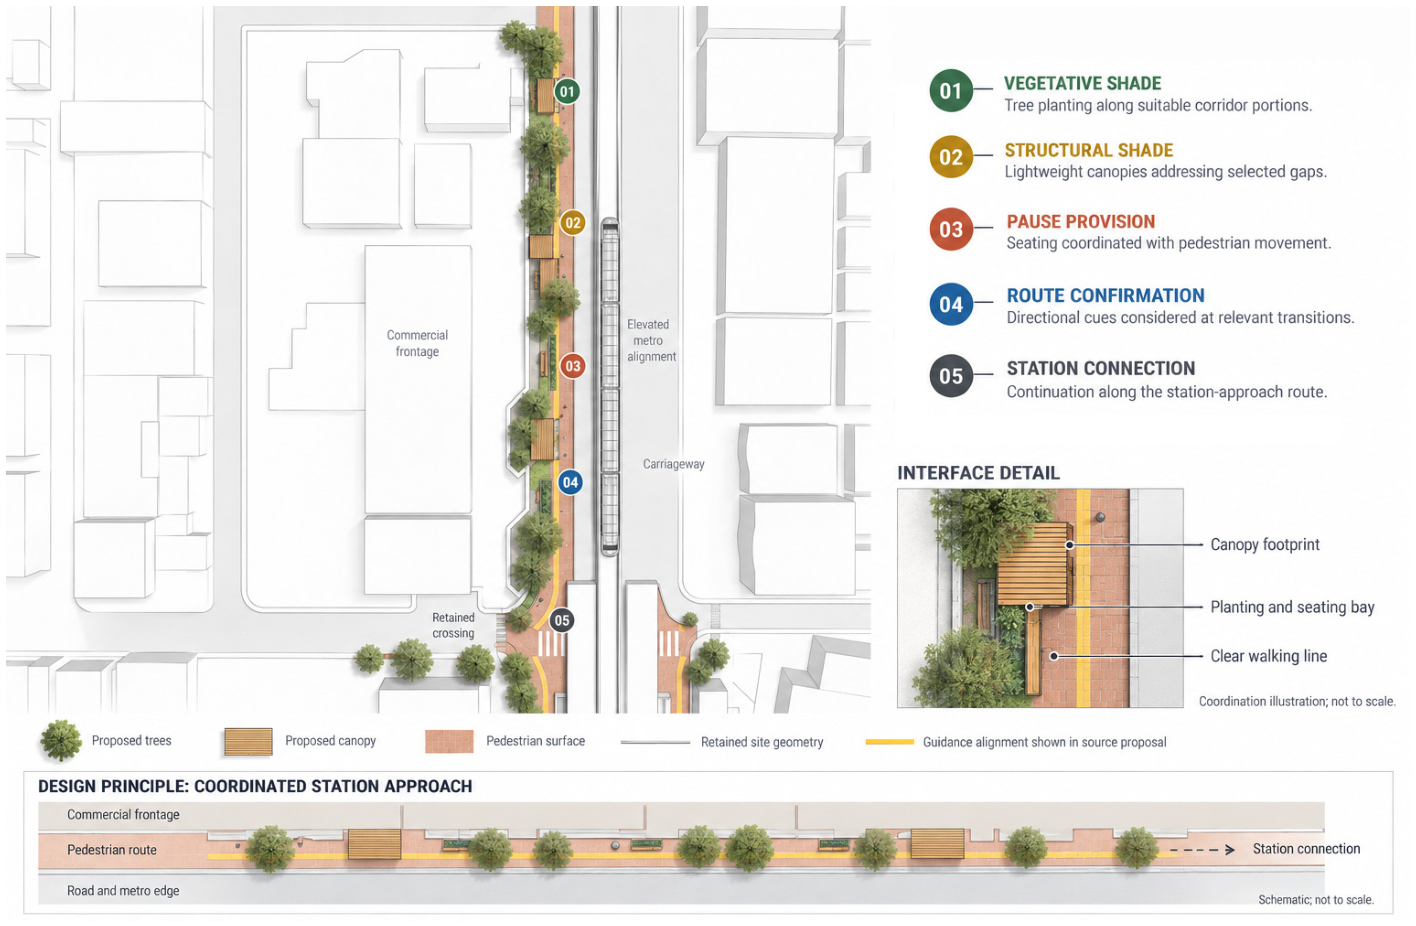
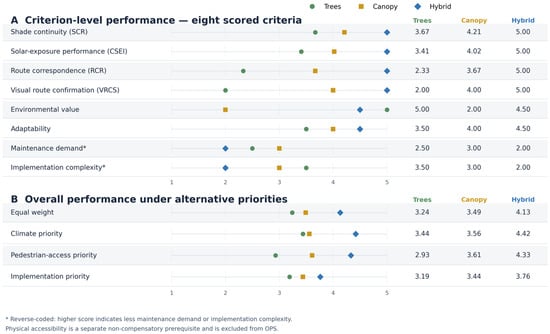
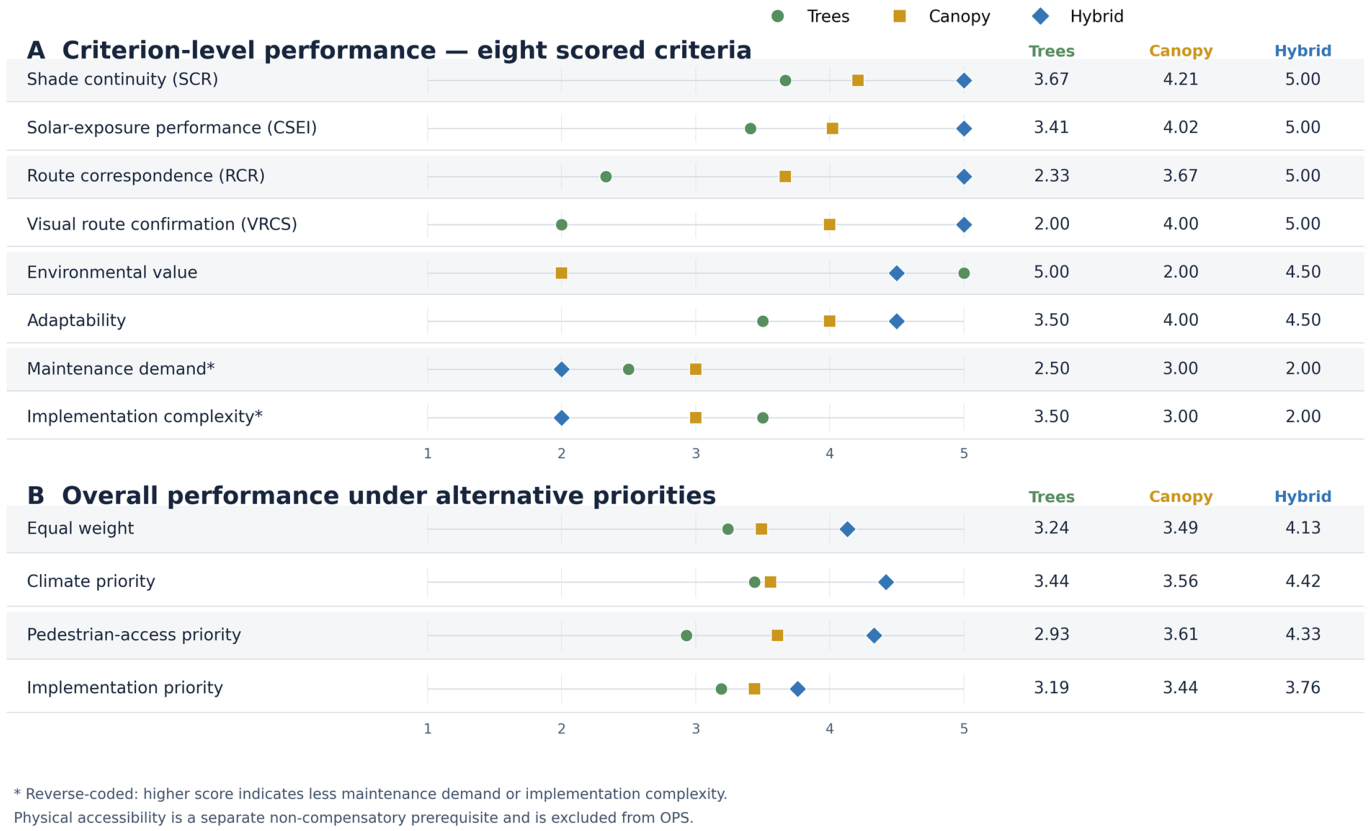
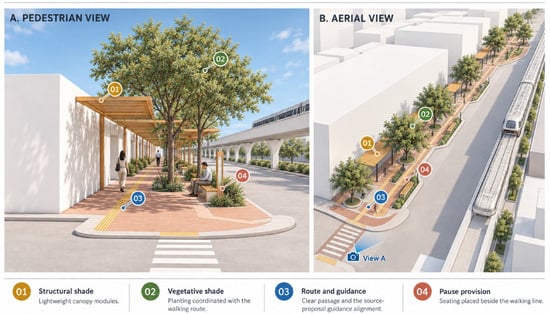
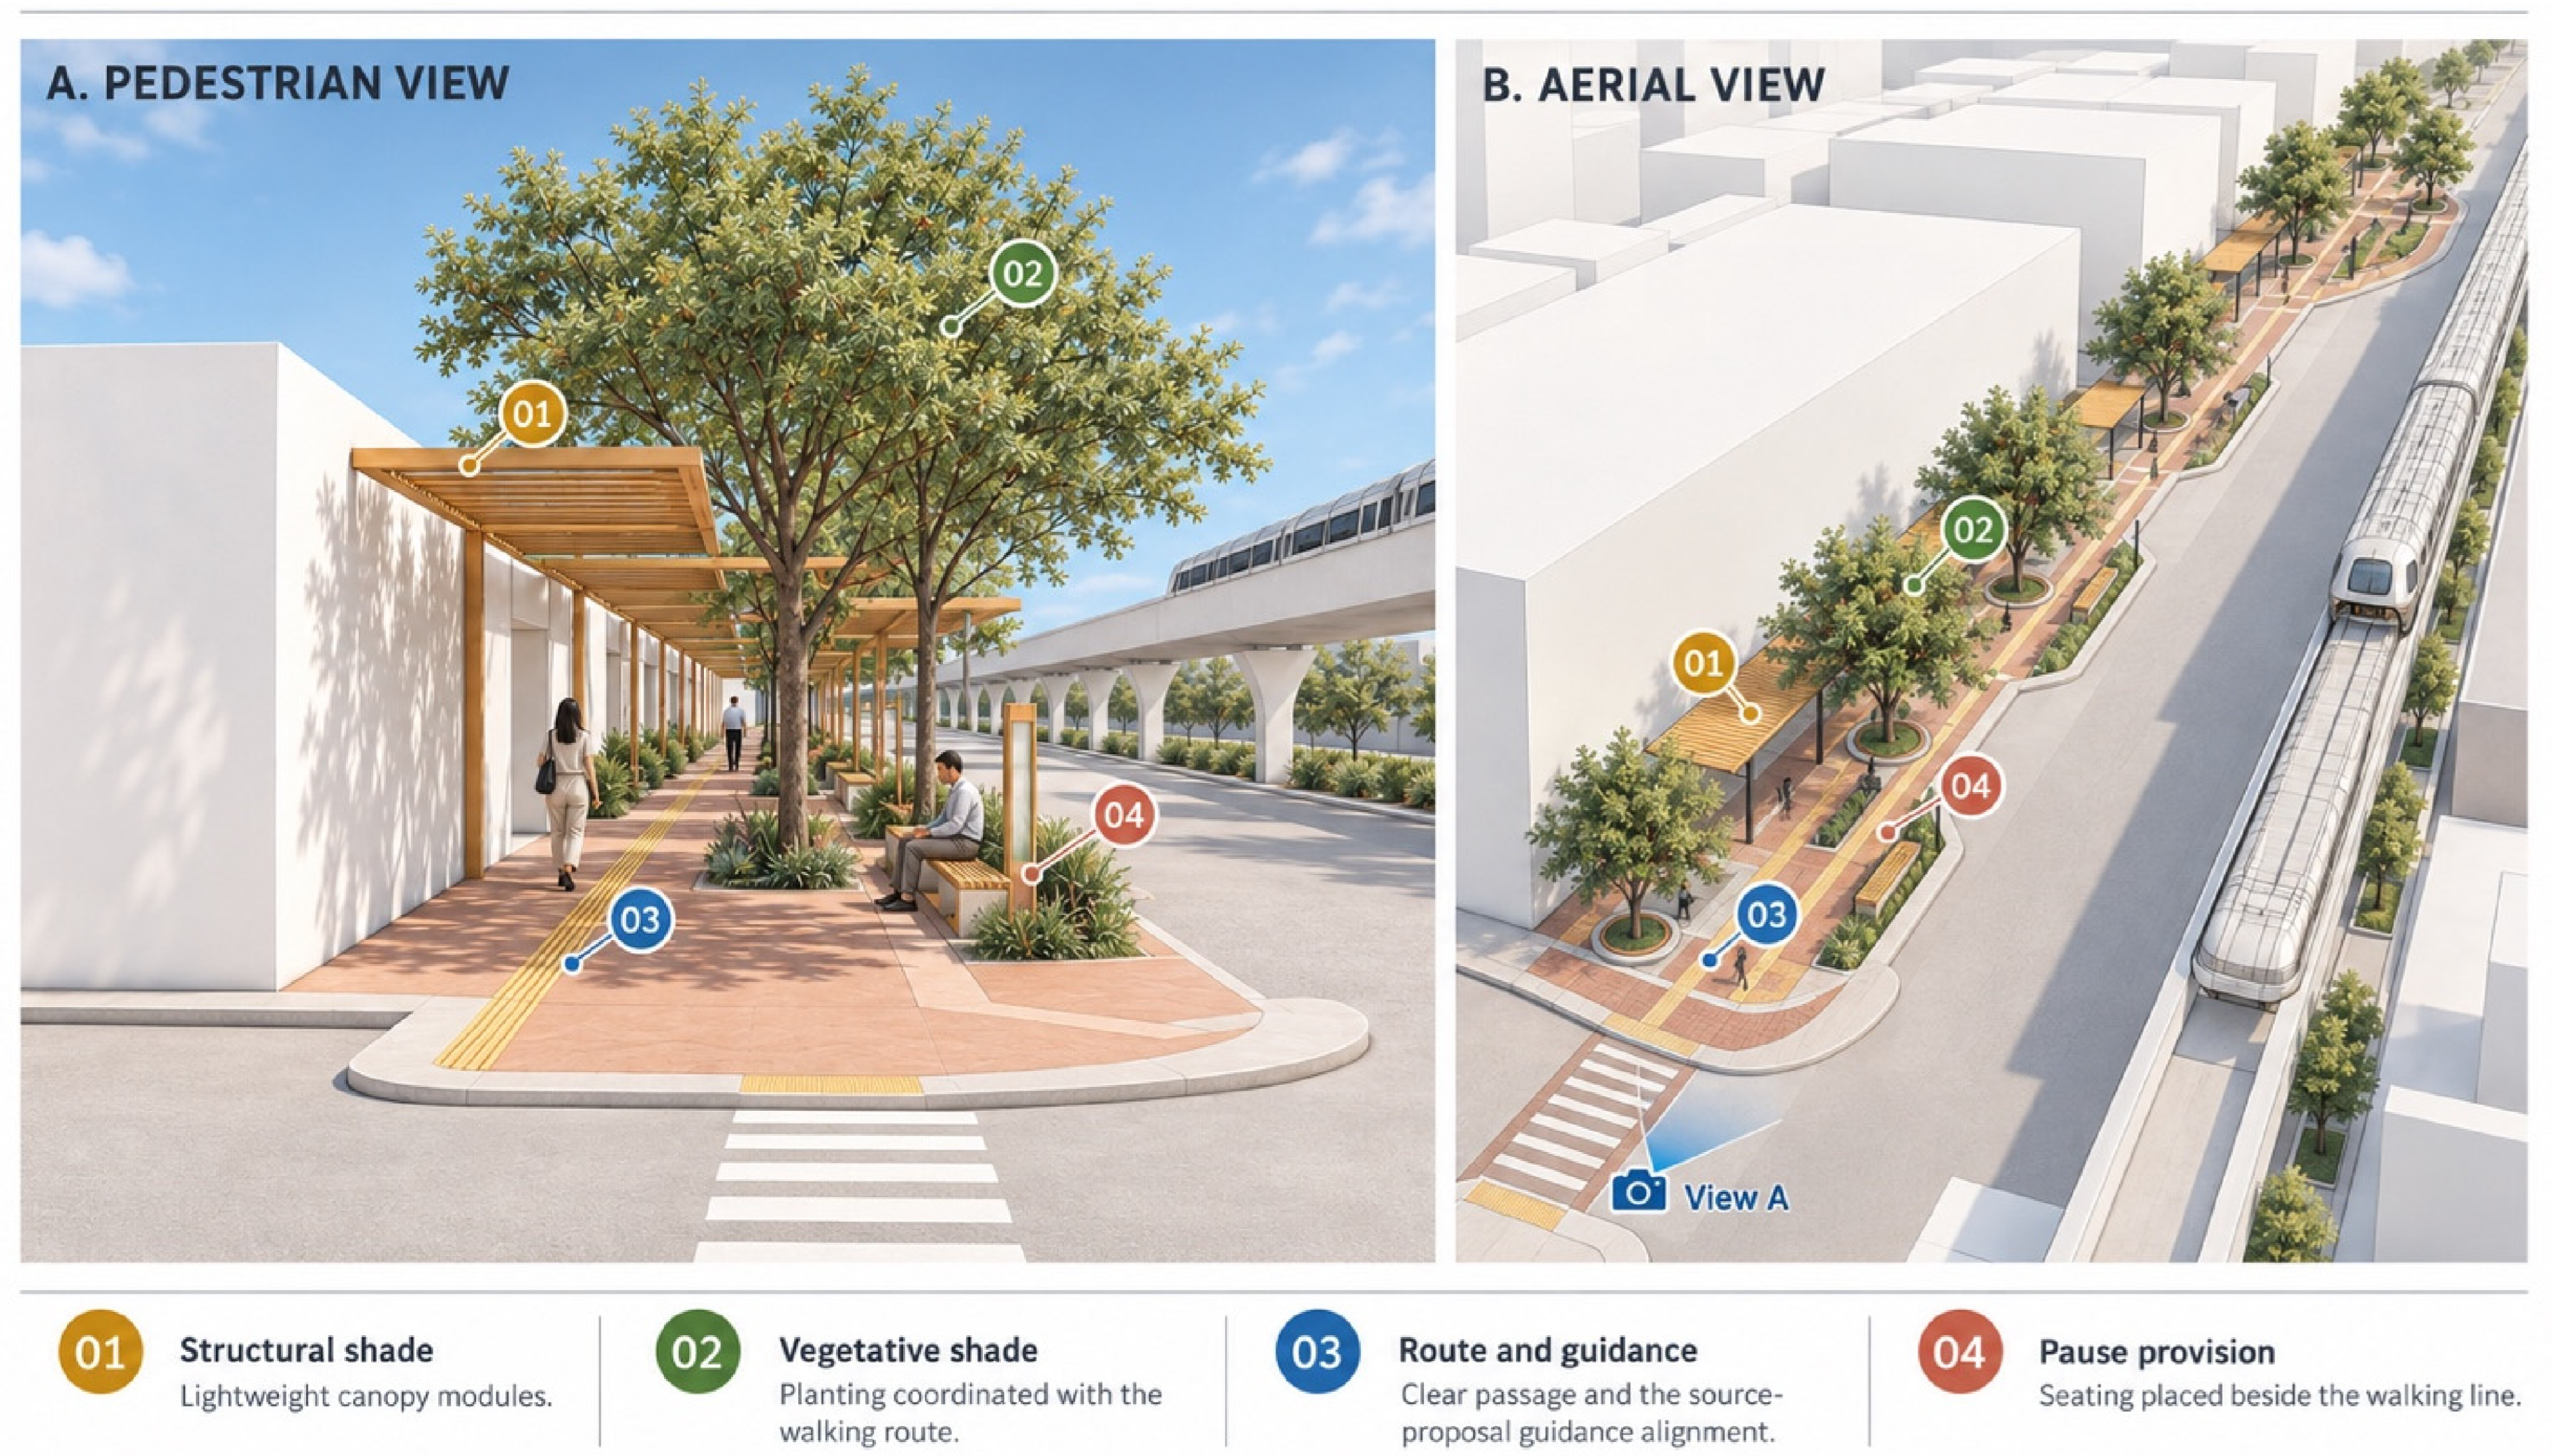
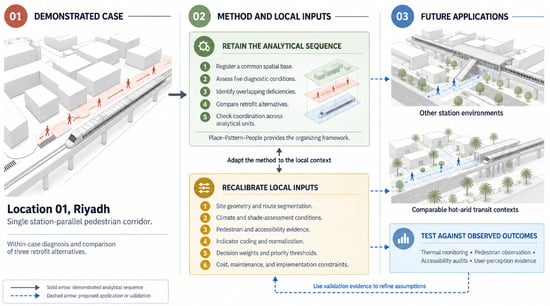
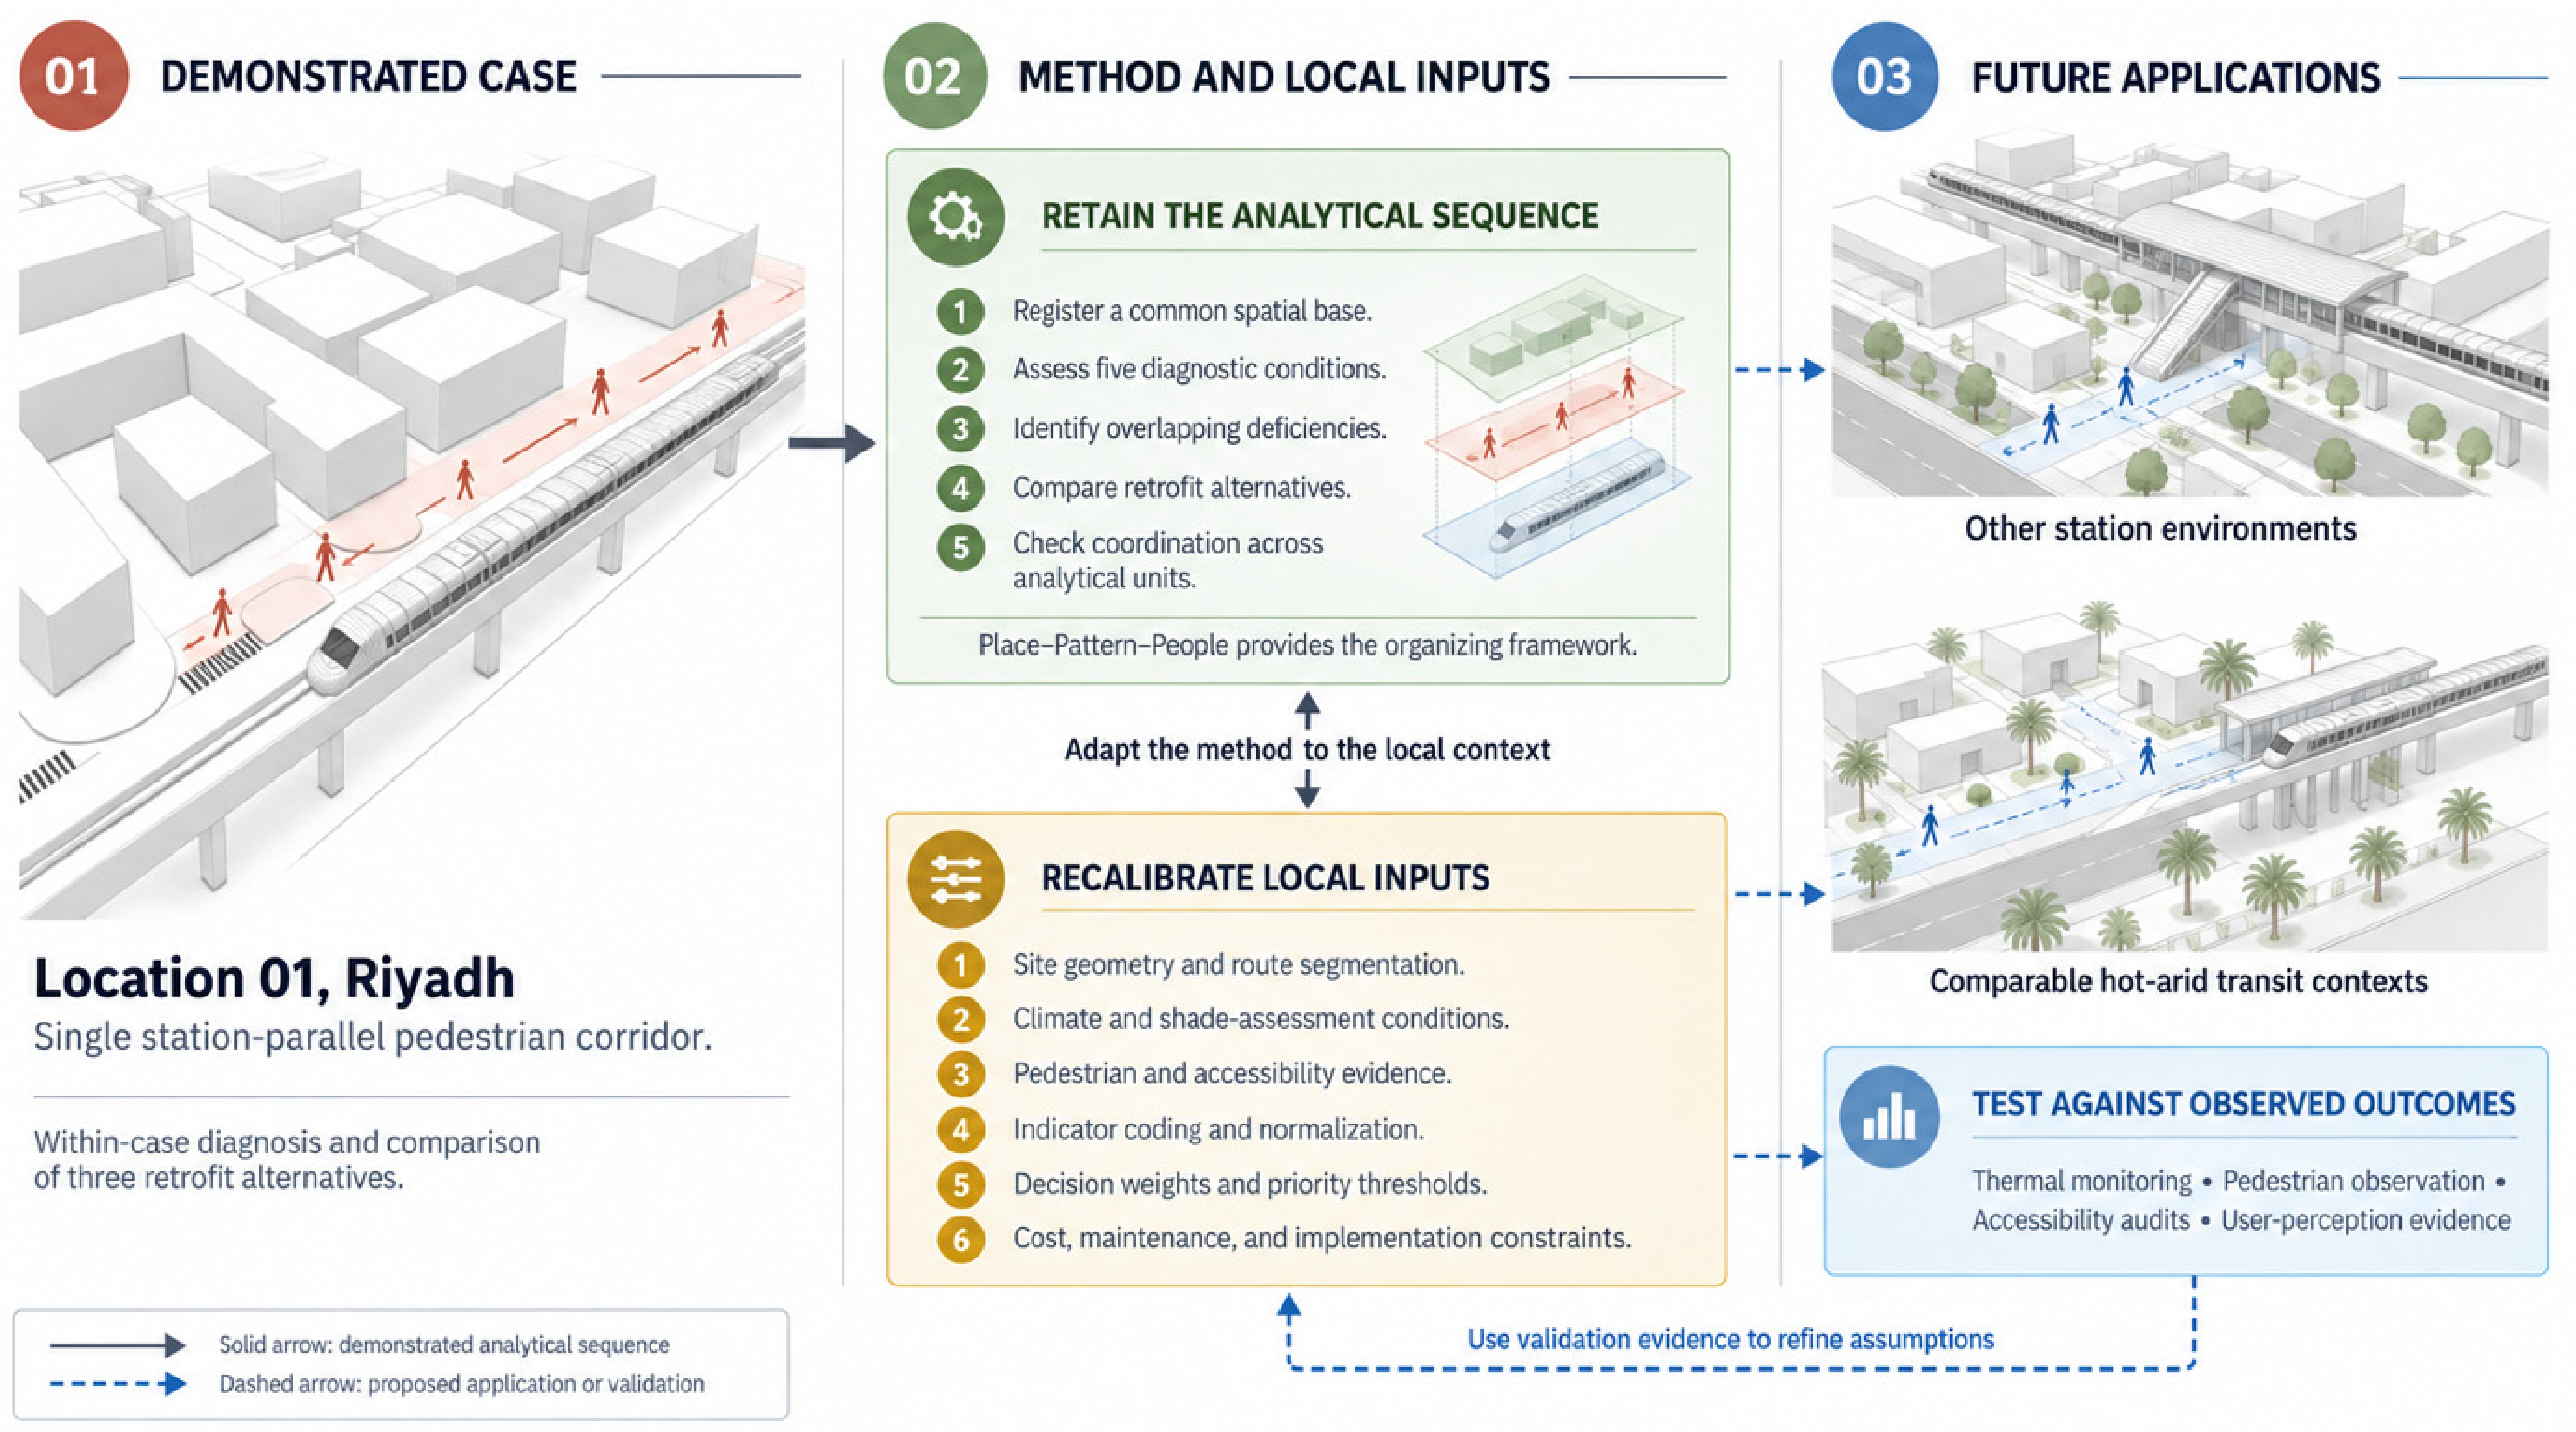
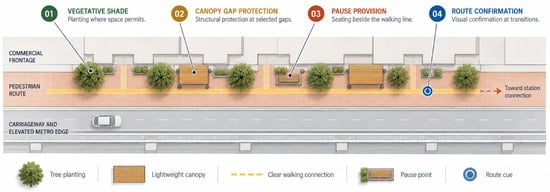
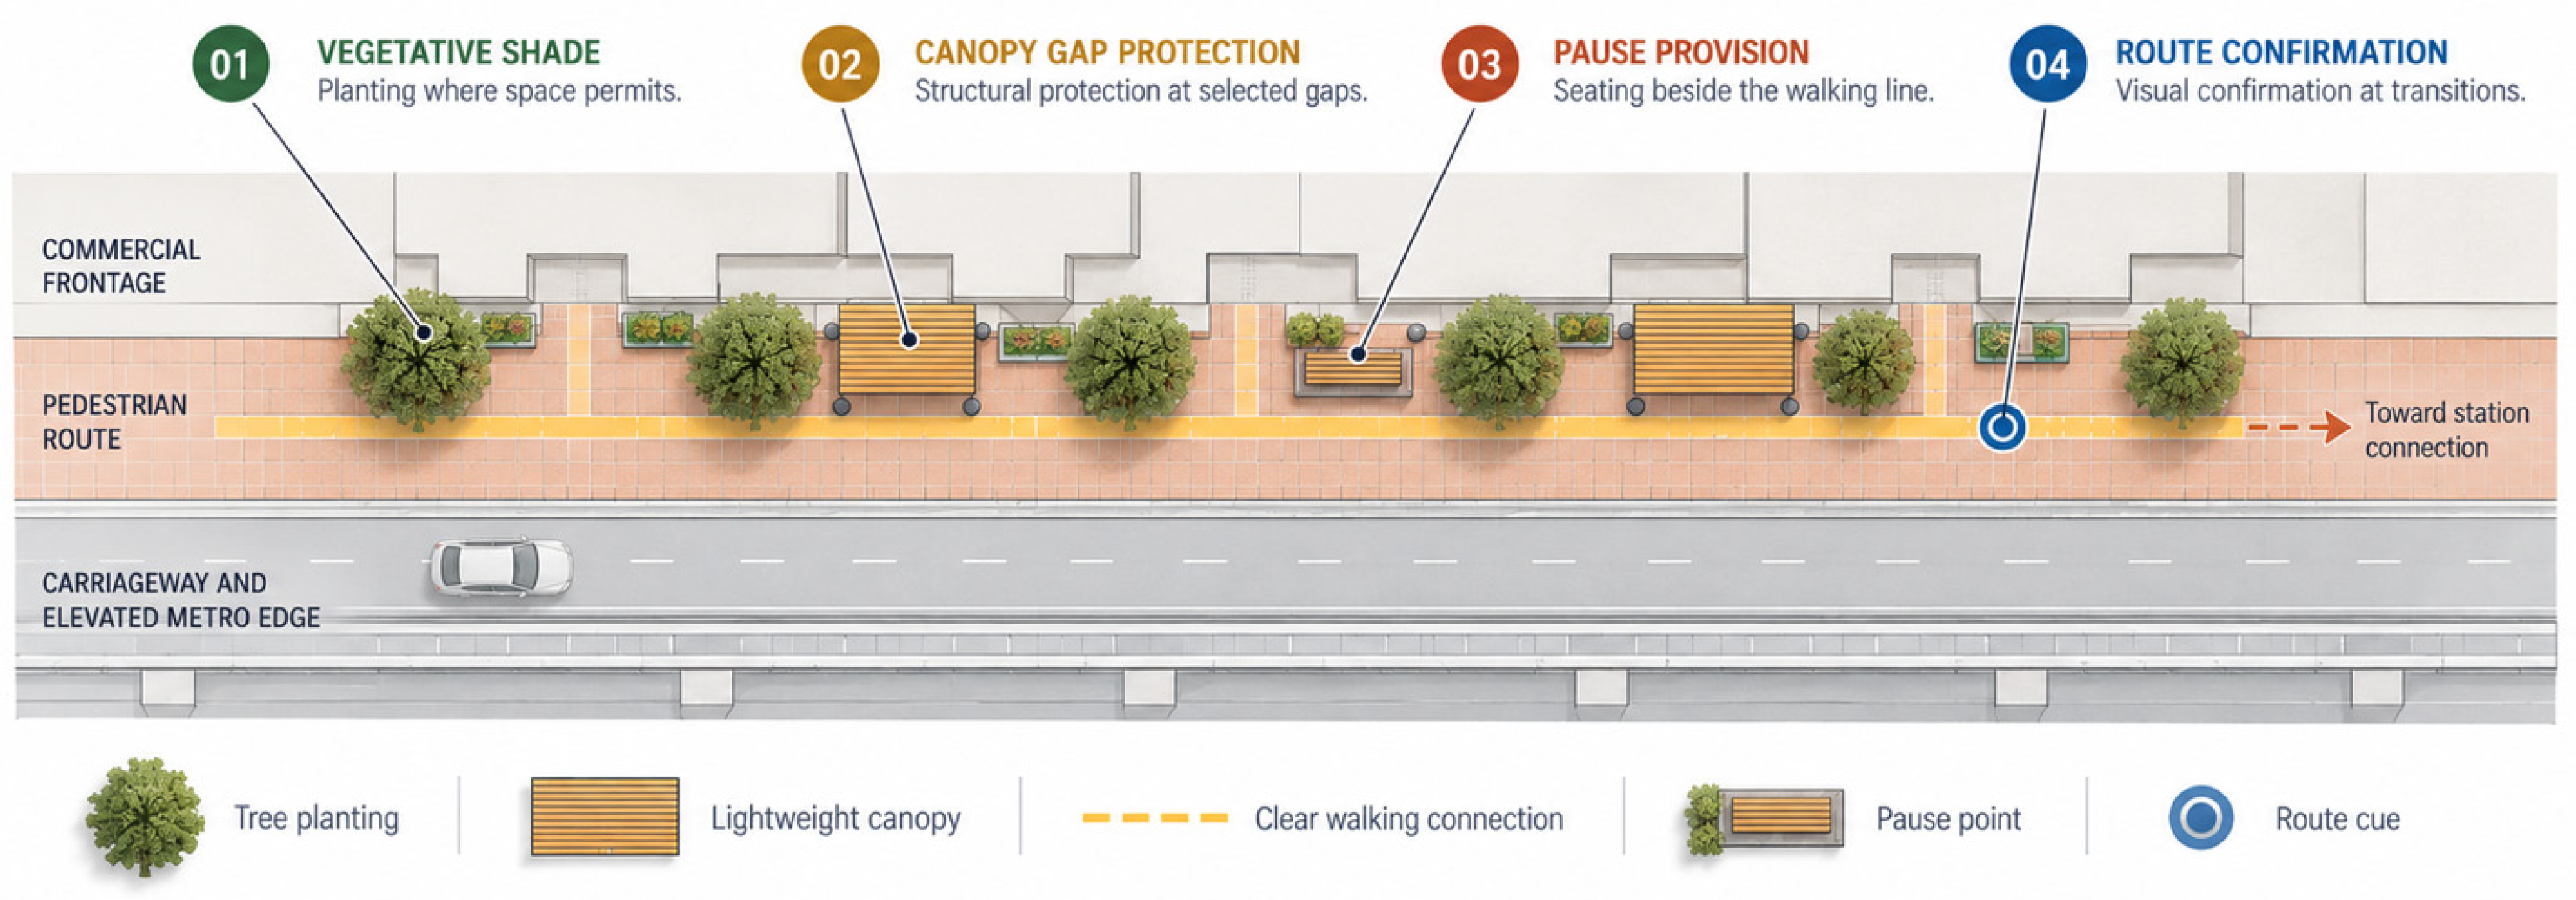
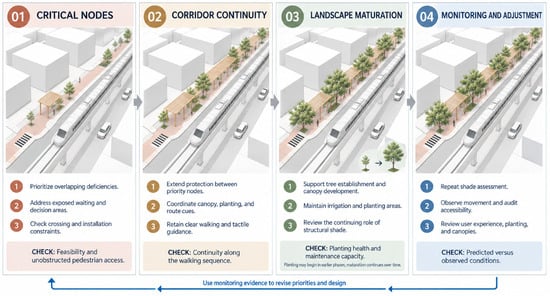
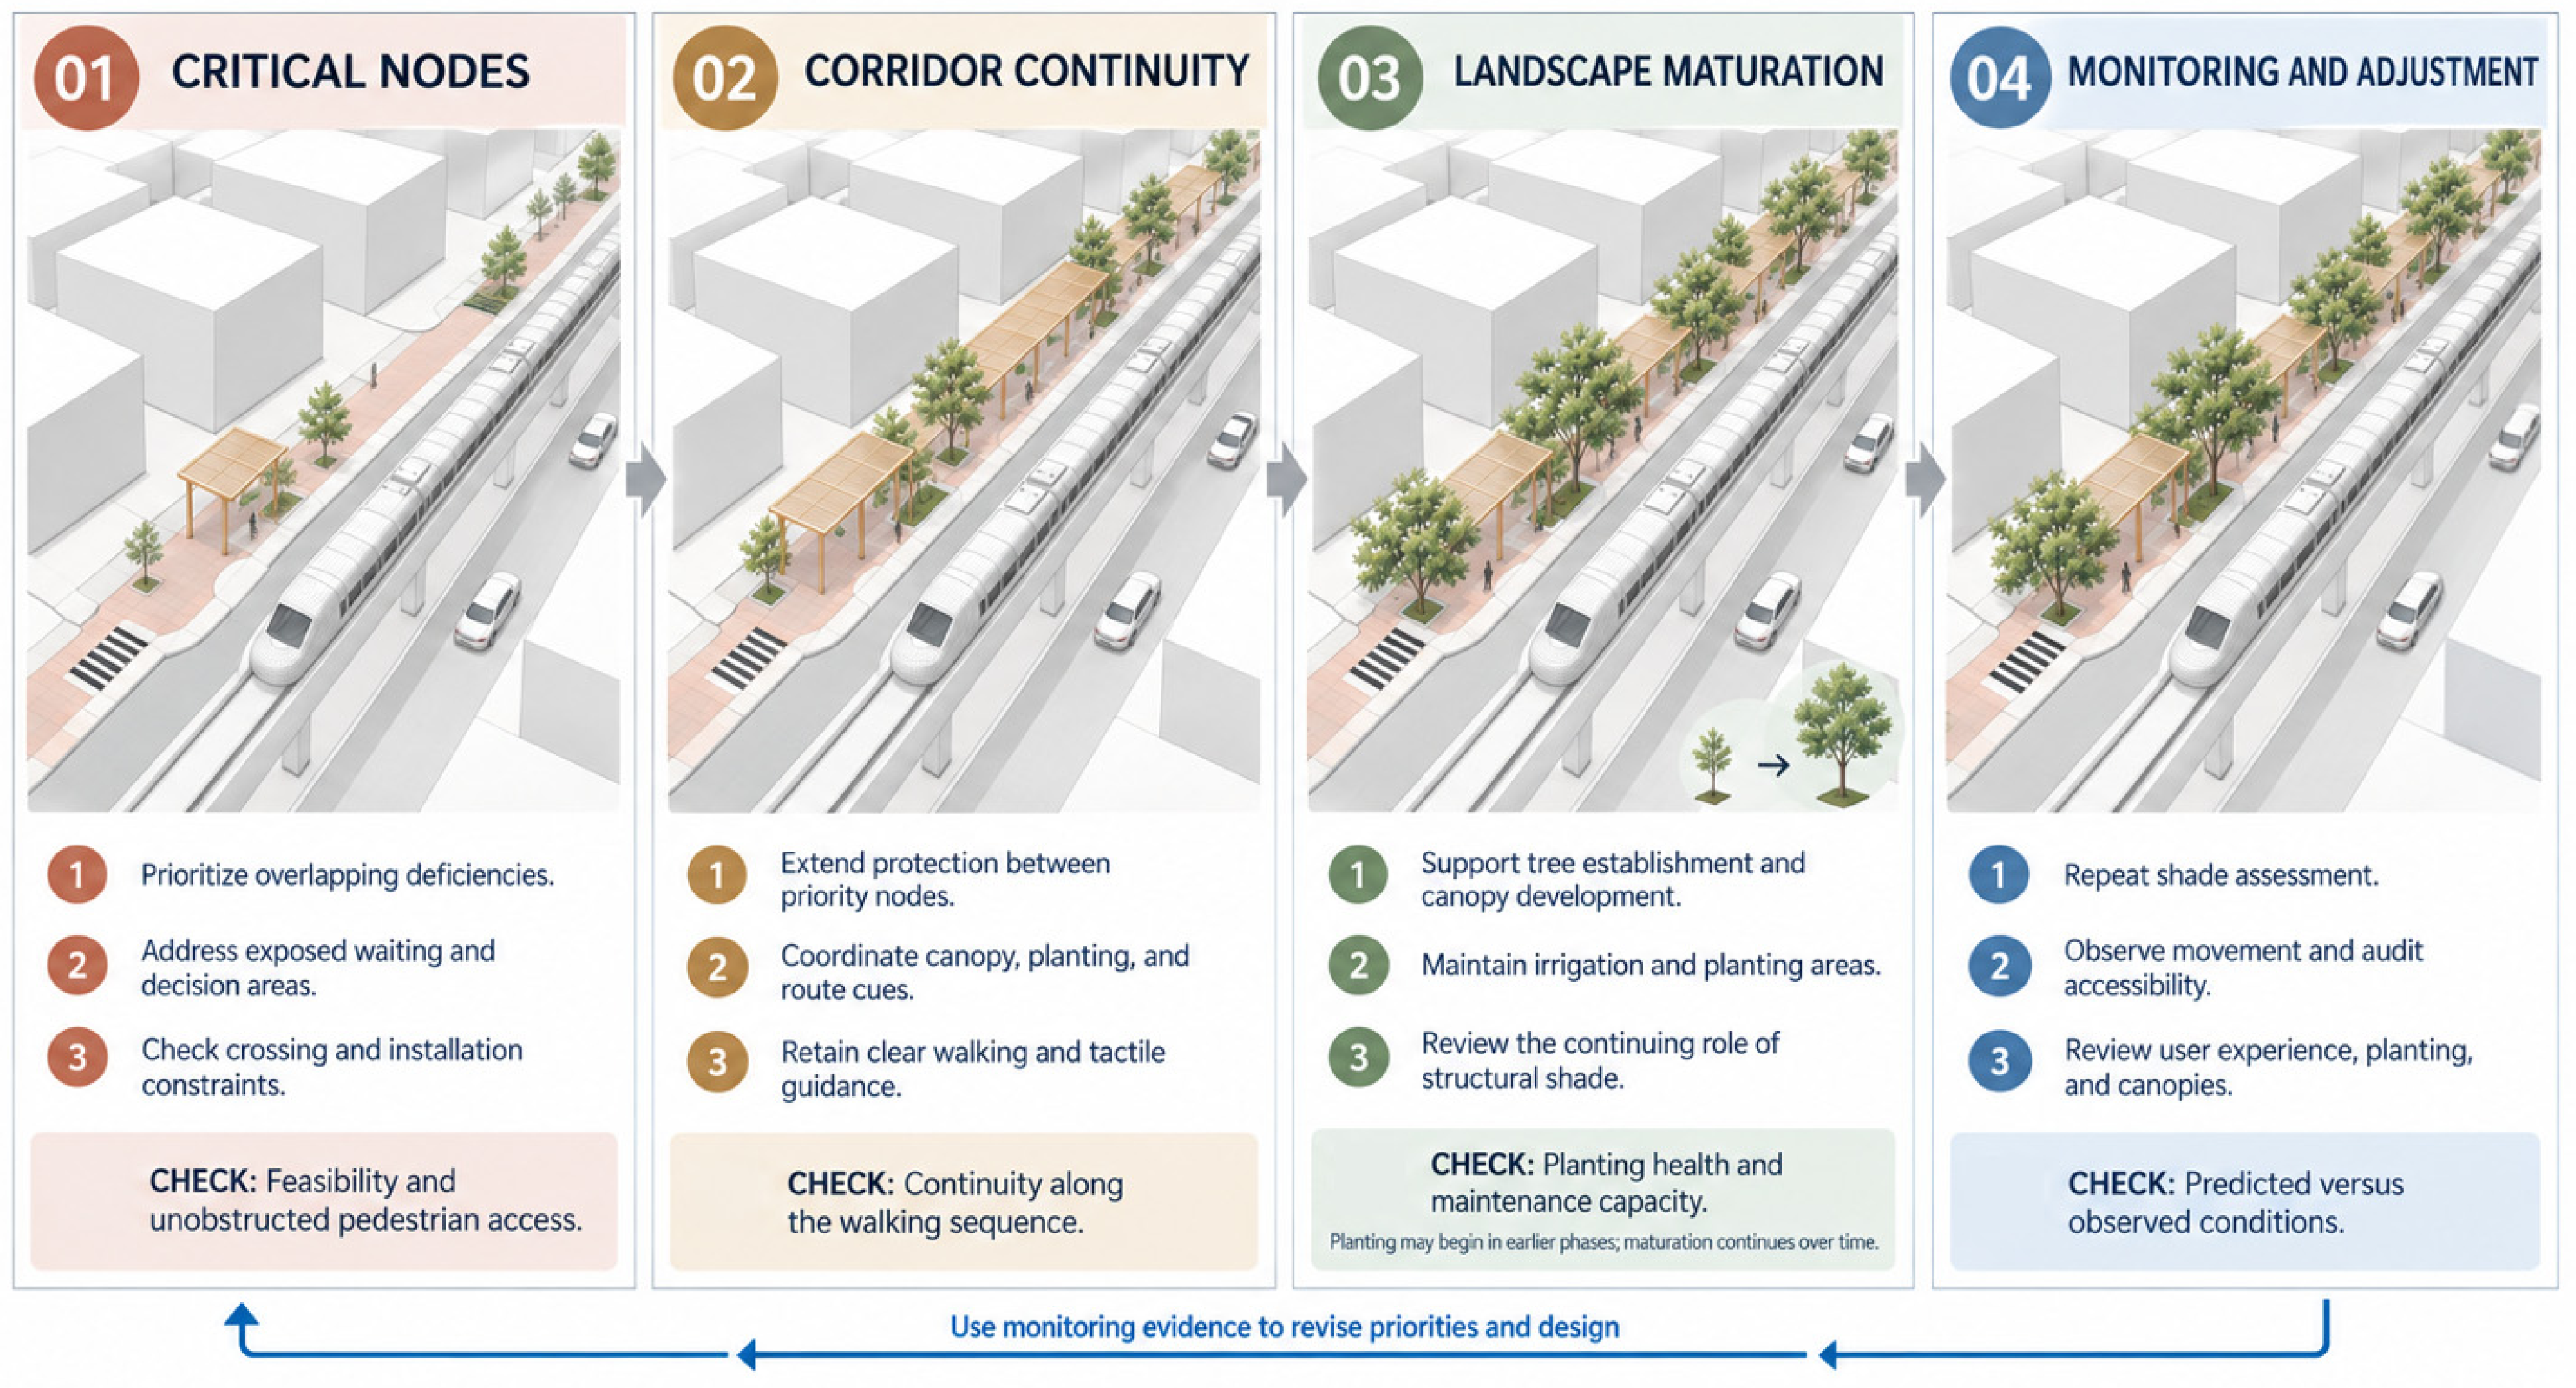

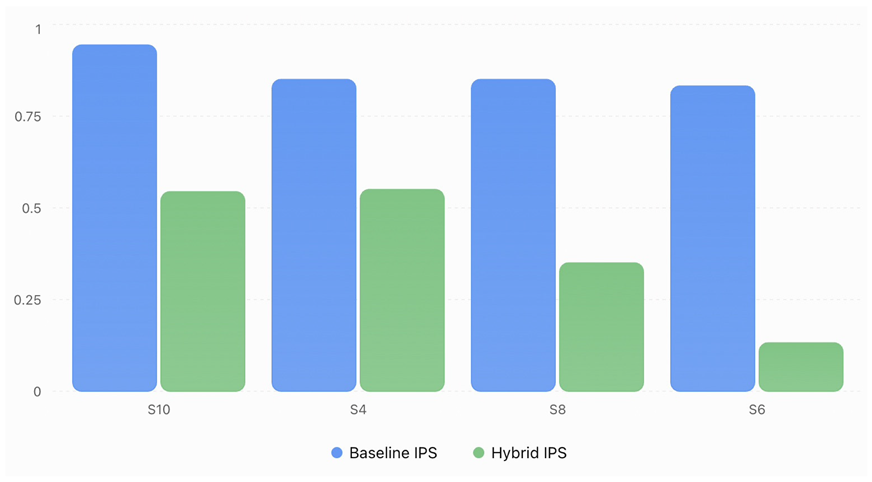
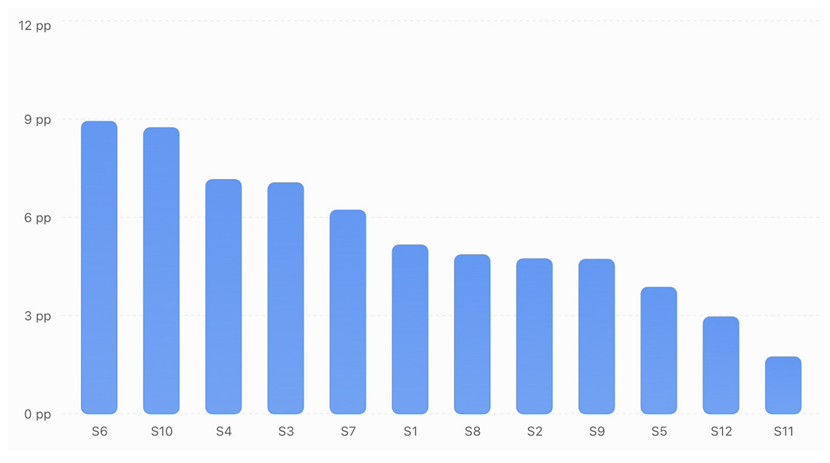
Disclaimer/Publisher’s Note: The statements, opinions and data contained in all publications are solely those of the individual author(s) and contributor(s) and not of MDPI and/or the editor(s). MDPI and/or the editor(s) disclaim responsibility for any injury to people or property resulting from any ideas, methods, instructions or products referred to in the content. |
© 2026 by the authors. Licensee MDPI, Basel, Switzerland. This article is an open access article distributed under the terms and conditions of the Creative Commons Attribution (CC BY) license.