


Abstract
Sound has an important role in how users perceive their environment. Under this context, a soundscape approach was followed for the evaluation of indoor spatial experience of university architecture studios. A tailored framework of factors affecting sound perception and spatial experience was proposed for this study and used in the questionnaire. An indoor soundscape questionnaire investigating architecture students’ perception of their acoustical environment and how it affects their spatial experience was designed and applied. The survey was conducted with a total of 191 first-grade and fourth-grade students. Demographic characteristics were found to be statistically associated with users’ indoor environment expectations and acoustic perception. Among many statistically significant correlations between soundscape perception and spatial experience, correlations between intelligibility perception and architectural design expectations, as well as between perception of and reaction to sound sources and perception of spatial experience factors, stood out.
1. Introduction
Sound is considered an invisible, nonetheless significant component that remarkably impacts our daily life experience. Soundscape studies tend to be a prevalent topic being discussed within the frame of acoustic studies. Findings in this context presume that soundscape arises through the space user’s perception. It has been stated that perception relies on expectations, preferences, moods, and actions [1]. ISO 12913-1 [2] states that perception is the factor that defines soundscape, and that it is significantly influenced by the acoustical environment and the sociodemographic traits of users.
Once aural environments are incorporated into people’s everyday lives, they are referred to as soundscapes [3]. Hence, the occupants’ sensory experience within an enclosed space is a notable element to take into consideration throughout the acoustic environment evaluation process. Soundscape was also defined by the ISO as “acoustic environment as perceived or experienced and/or understood by a person or people, in context” [2]. Space users are the key feature in obtaining accurate information regarding sonic environments. Therefore, the subjective aspect considered by the occupants experiencing the space is particularly required in order to conduct a relevant analysis within the soundscape field. Sound elements within architectural spaces create an acoustic environment, which in turn must be integrated into the overall architectural design [4]. To put it another way, a soundscape can enhance the feeling of being somewhere, which is reminiscent of actual places. It has been discovered that our perception of a space is significantly influenced by the components that make up our acoustic environment [5]. Thus, indoor soundscape perception largely contributes to the spatial experience, emphasizing the user’s attentive engagement with their surroundings.
Some research done in the literature has studied indoor or urban soundscape, by focusing on the objective acoustic variables [1,6,7,8]. However, socio-cultural properties, spatial parameters and multisensory factors affect the perception of space and the soundscape. Focusing on users’ psychological assessment of the indoor soundscape of the space they occupy is an important factor to be examined in the interest of investigating the relationship between sound and space. Therefore, integrating psychological approaches into the indoor soundscape questionnaire design as a method of evaluation leads to significant results under the subjective analysis scope [9,10,11,12,13,14,15].
Recent research [16,17,18,19,20,21,22,23] have emphasized the significance of examining users’ psychological and emotional characteristics in addition to spatial components, environmental elements and activities, in order to better understand the indoor soundscape. Users’ auditory perceptions vary depending on the sound sources, acoustical considerations, and architectural characteristics. As the function of space changes, the users change and the sound source types alter within the indoor environment. Indoor soundscape studies are fragmented across room types and building uses. Various public and semi-public spaces, such as railway stations [24], restaurants [1], exhibition spaces [24], open-plan offices [12,21,22], healthcare buildings [19,20], nursing homes [6], sports buildings [24], libraries [10,25,26] and high school classrooms [13,14,23] have been studied. The development of standardized, context-sensitive indoor soundscape assessment protocols is still underway and requires more evidence from various space uses. Socio-cultural and demographic effects, as well as embedding multisensory methods, need to be examined across diverse contexts. An important context is how architecture students, who will be designing future spaces, perceive and experience their environment and soundscape, which is missing in the literature.
The main purpose of this article is to reveal the possible relations between sound perception and spatial experience through a specially designed indoor soundscape questionnaire. This study has focused on the evaluation of the factors affecting perception and experience notions through assessments of architecture studio classroom users. A tailored framework based on previous studies [16] that includes different variables related to user, sound and space has been considered for this study to help shape the questionnaire design.
Main questions asked during this research are: How do the sound and space-related factors affect the users’ soundscape perception in an educational space? How do architecture students perceive and experience their environment and soundscape?
In order to answer these research questions, a novel indoor soundscape framework and questionnaire design methodologies [9,16] were adapted and used. This study aspires to examine the applicability and performance of these new methods on the indoor soundscape of public spaces and explore their applications in other indoor spaces. Checking the consistency of the questionnaire results, on how soundscape perception and spatial experience concepts affect each other, is also intended in this study. It is believed that the revelation of influences on spatial experience will provide an understanding for especially architects on the importance of sound environment.
2. Methodology
The evaluation method in this research was pursued through a subjective perspective to observe the intricate associations between sound perception and spatial experience variables. This research evolved through three steps. First, a tailored framework (adapted from Aburawis and Dokmeci Yorukoglu [16]) was created based on demographic factors, soundscape perception and spatial experience. In the second step, an indoor soundscape survey (based on Dokmeci Yorukoglu and Kang [9]) was created for this evaluation. And finally, results provided from the questionnaire through statistical analysis were evaluated and discussed under the context of this research.
2.1. Case Study and Participants Selection
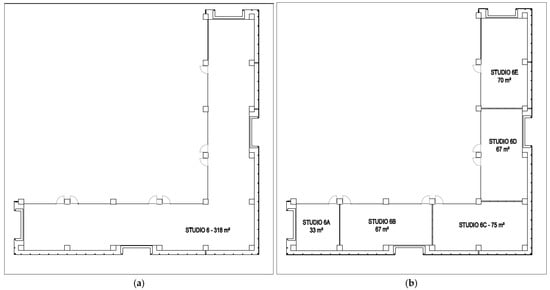
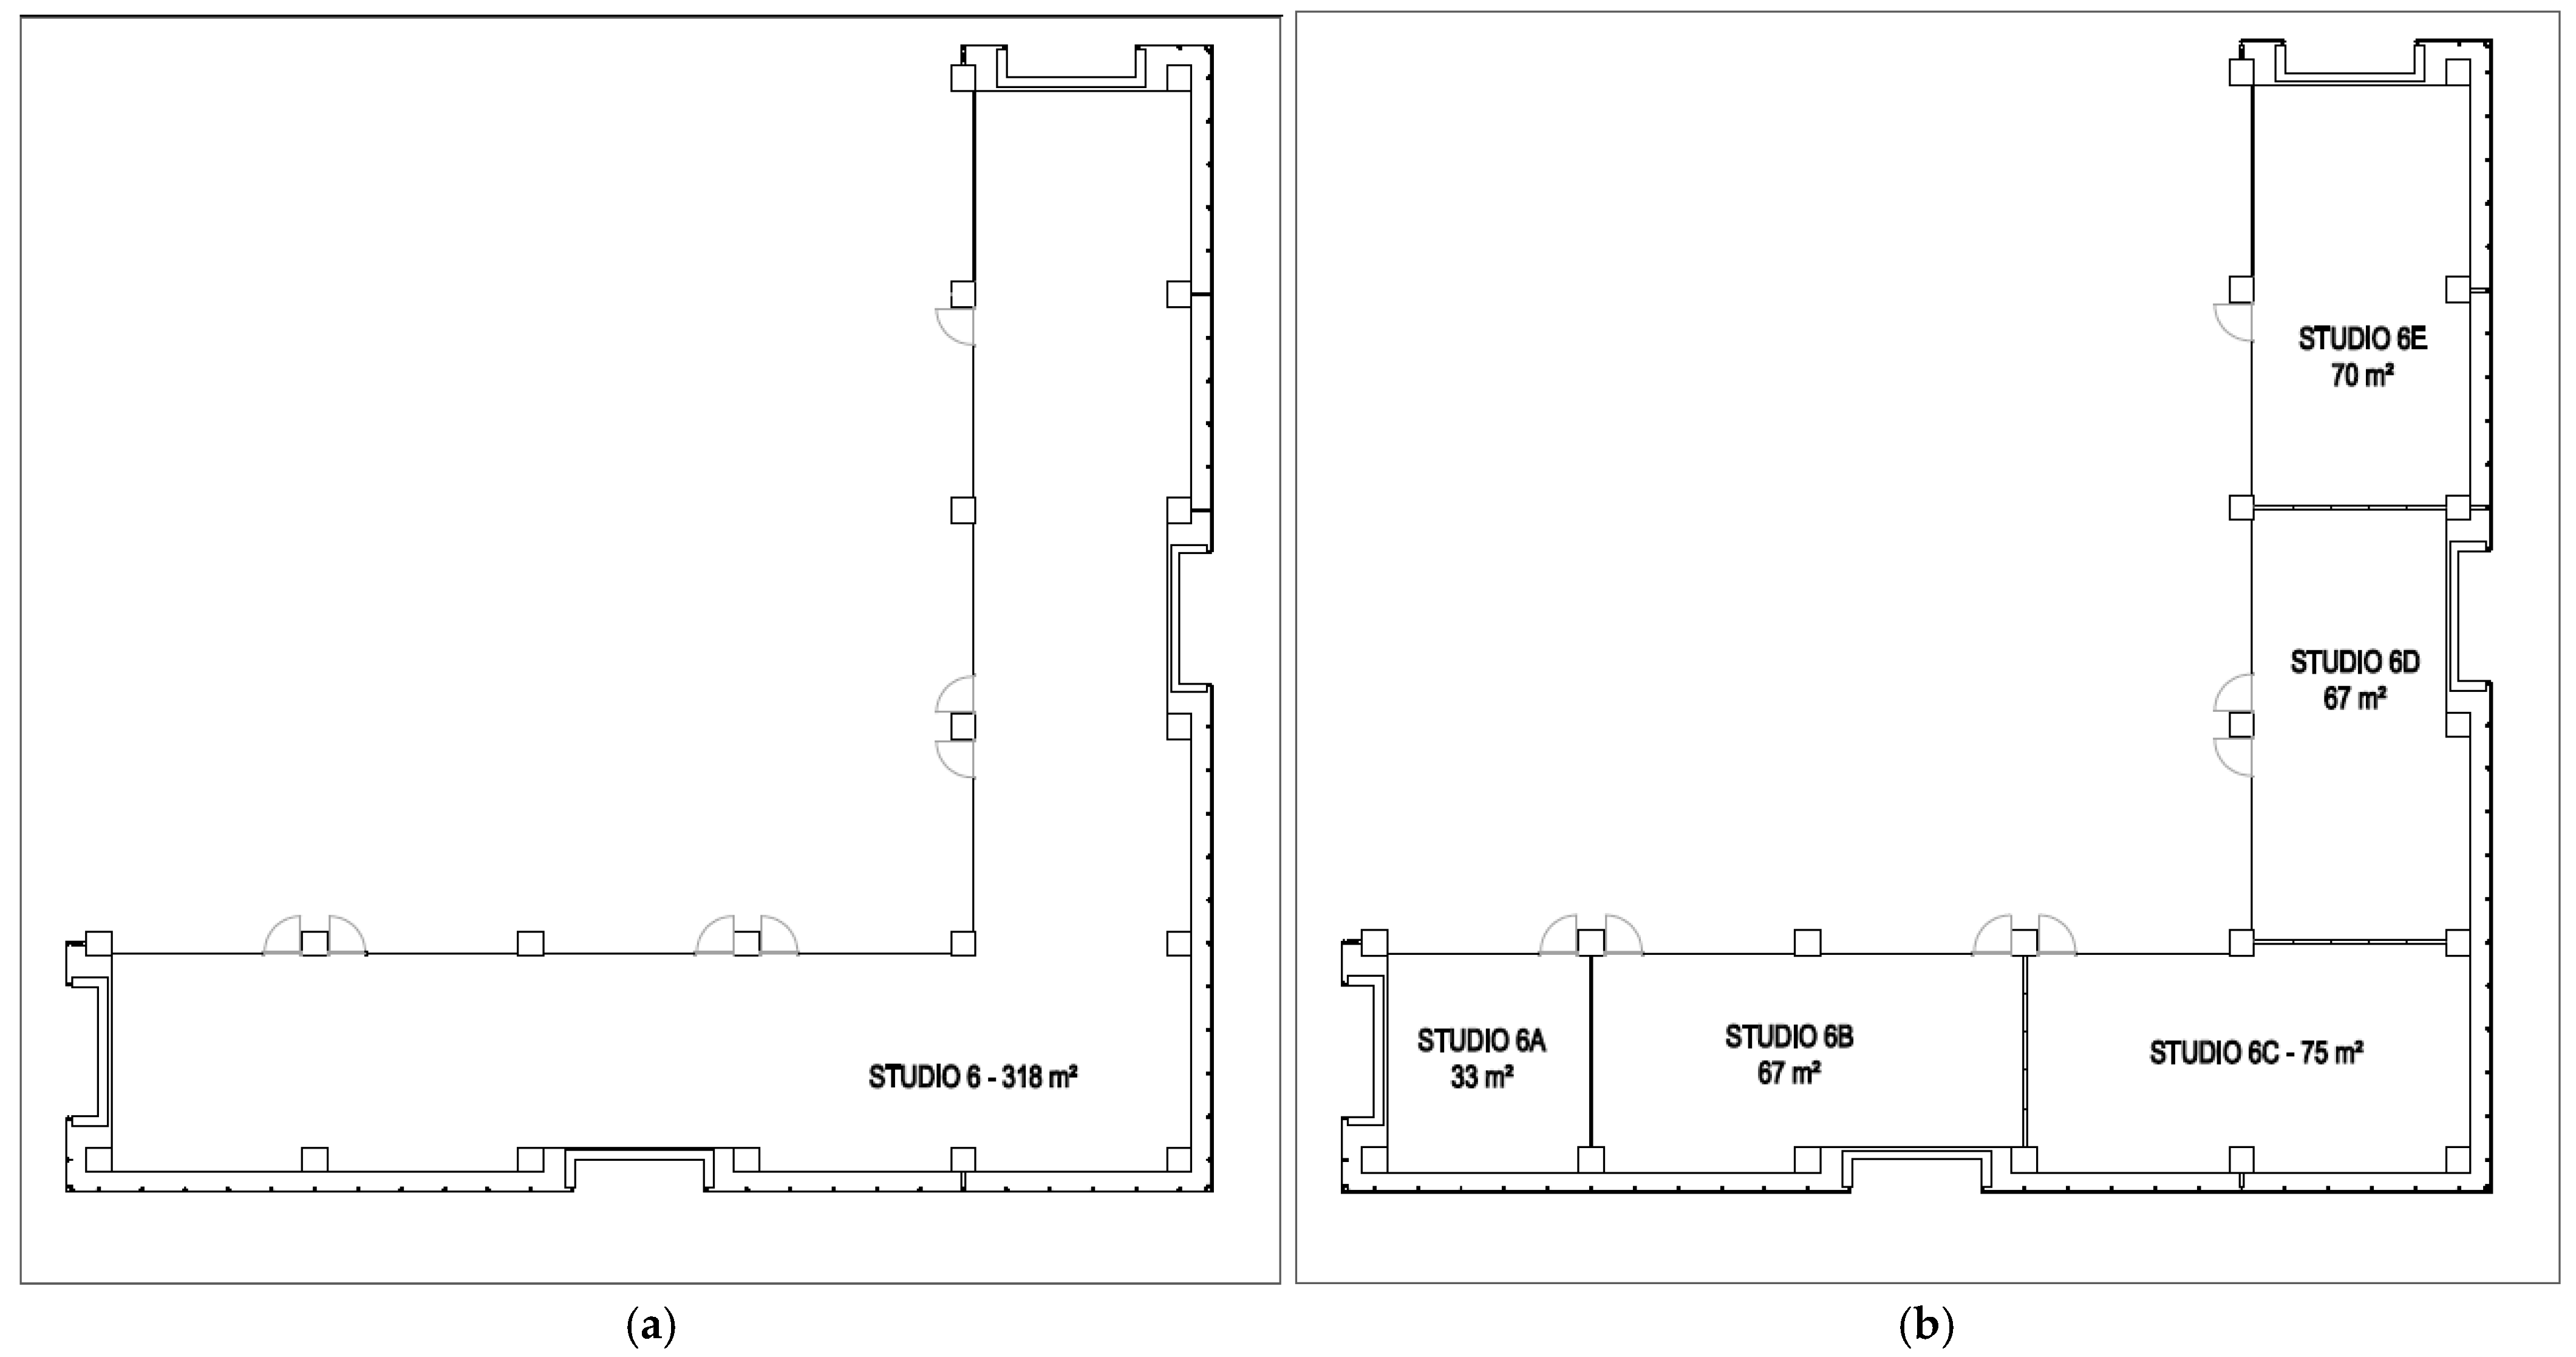
The survey was conducted within the architecture studio classrooms located at Bahcesehir University in Istanbul, Turkiye. Architecture studios are identical on each floor (3rd, 4th, 5th and 6th floor) of the Faculty of Architecture and Design, and their layout follows an L-shape form (Figure 1). Moveable partition walls are located in the studio, which allows space to be separated into smaller rectangular studios between 33 and 75 m2.
Figure 1.
Architectural studio classroom floor plans, (a) without and (b) with partition walls.
The entire façade of the studios is glass cladding and overlooking medium-density traffic roads. The studios are separated from the corridors by translucent glass partitions. Few opaque walls at farther ends of the studios are made of gypsum drywall. The floor finishes are linoleum, and the ceilings are finished with NRC (Noise Reduction Coefficient) 0.85 mineral wool suspended ceilings with only 10 cm of suspension. The clear floor height is 2.5 m, which provides the acoustic absorption of the suspended ceilings to be very effective within the space. The movable partition walls, which have 37 kg/m2 weight panels with rectangular steel frames and melamine panel coating, are hung with aluminum rails from the top and sealed with magnetic bands all around. Weighted sound reduction index (Rw) measured in laboratory conditions for this wall is 48 dB. The studios have a 6 m steady width and have axes every 6 m in the other direction.
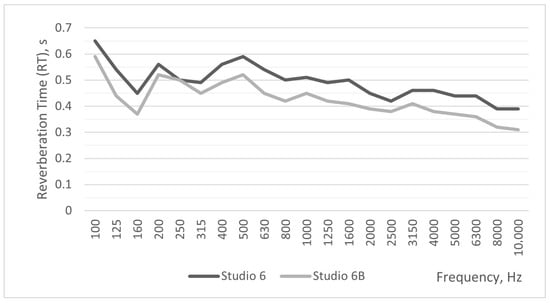
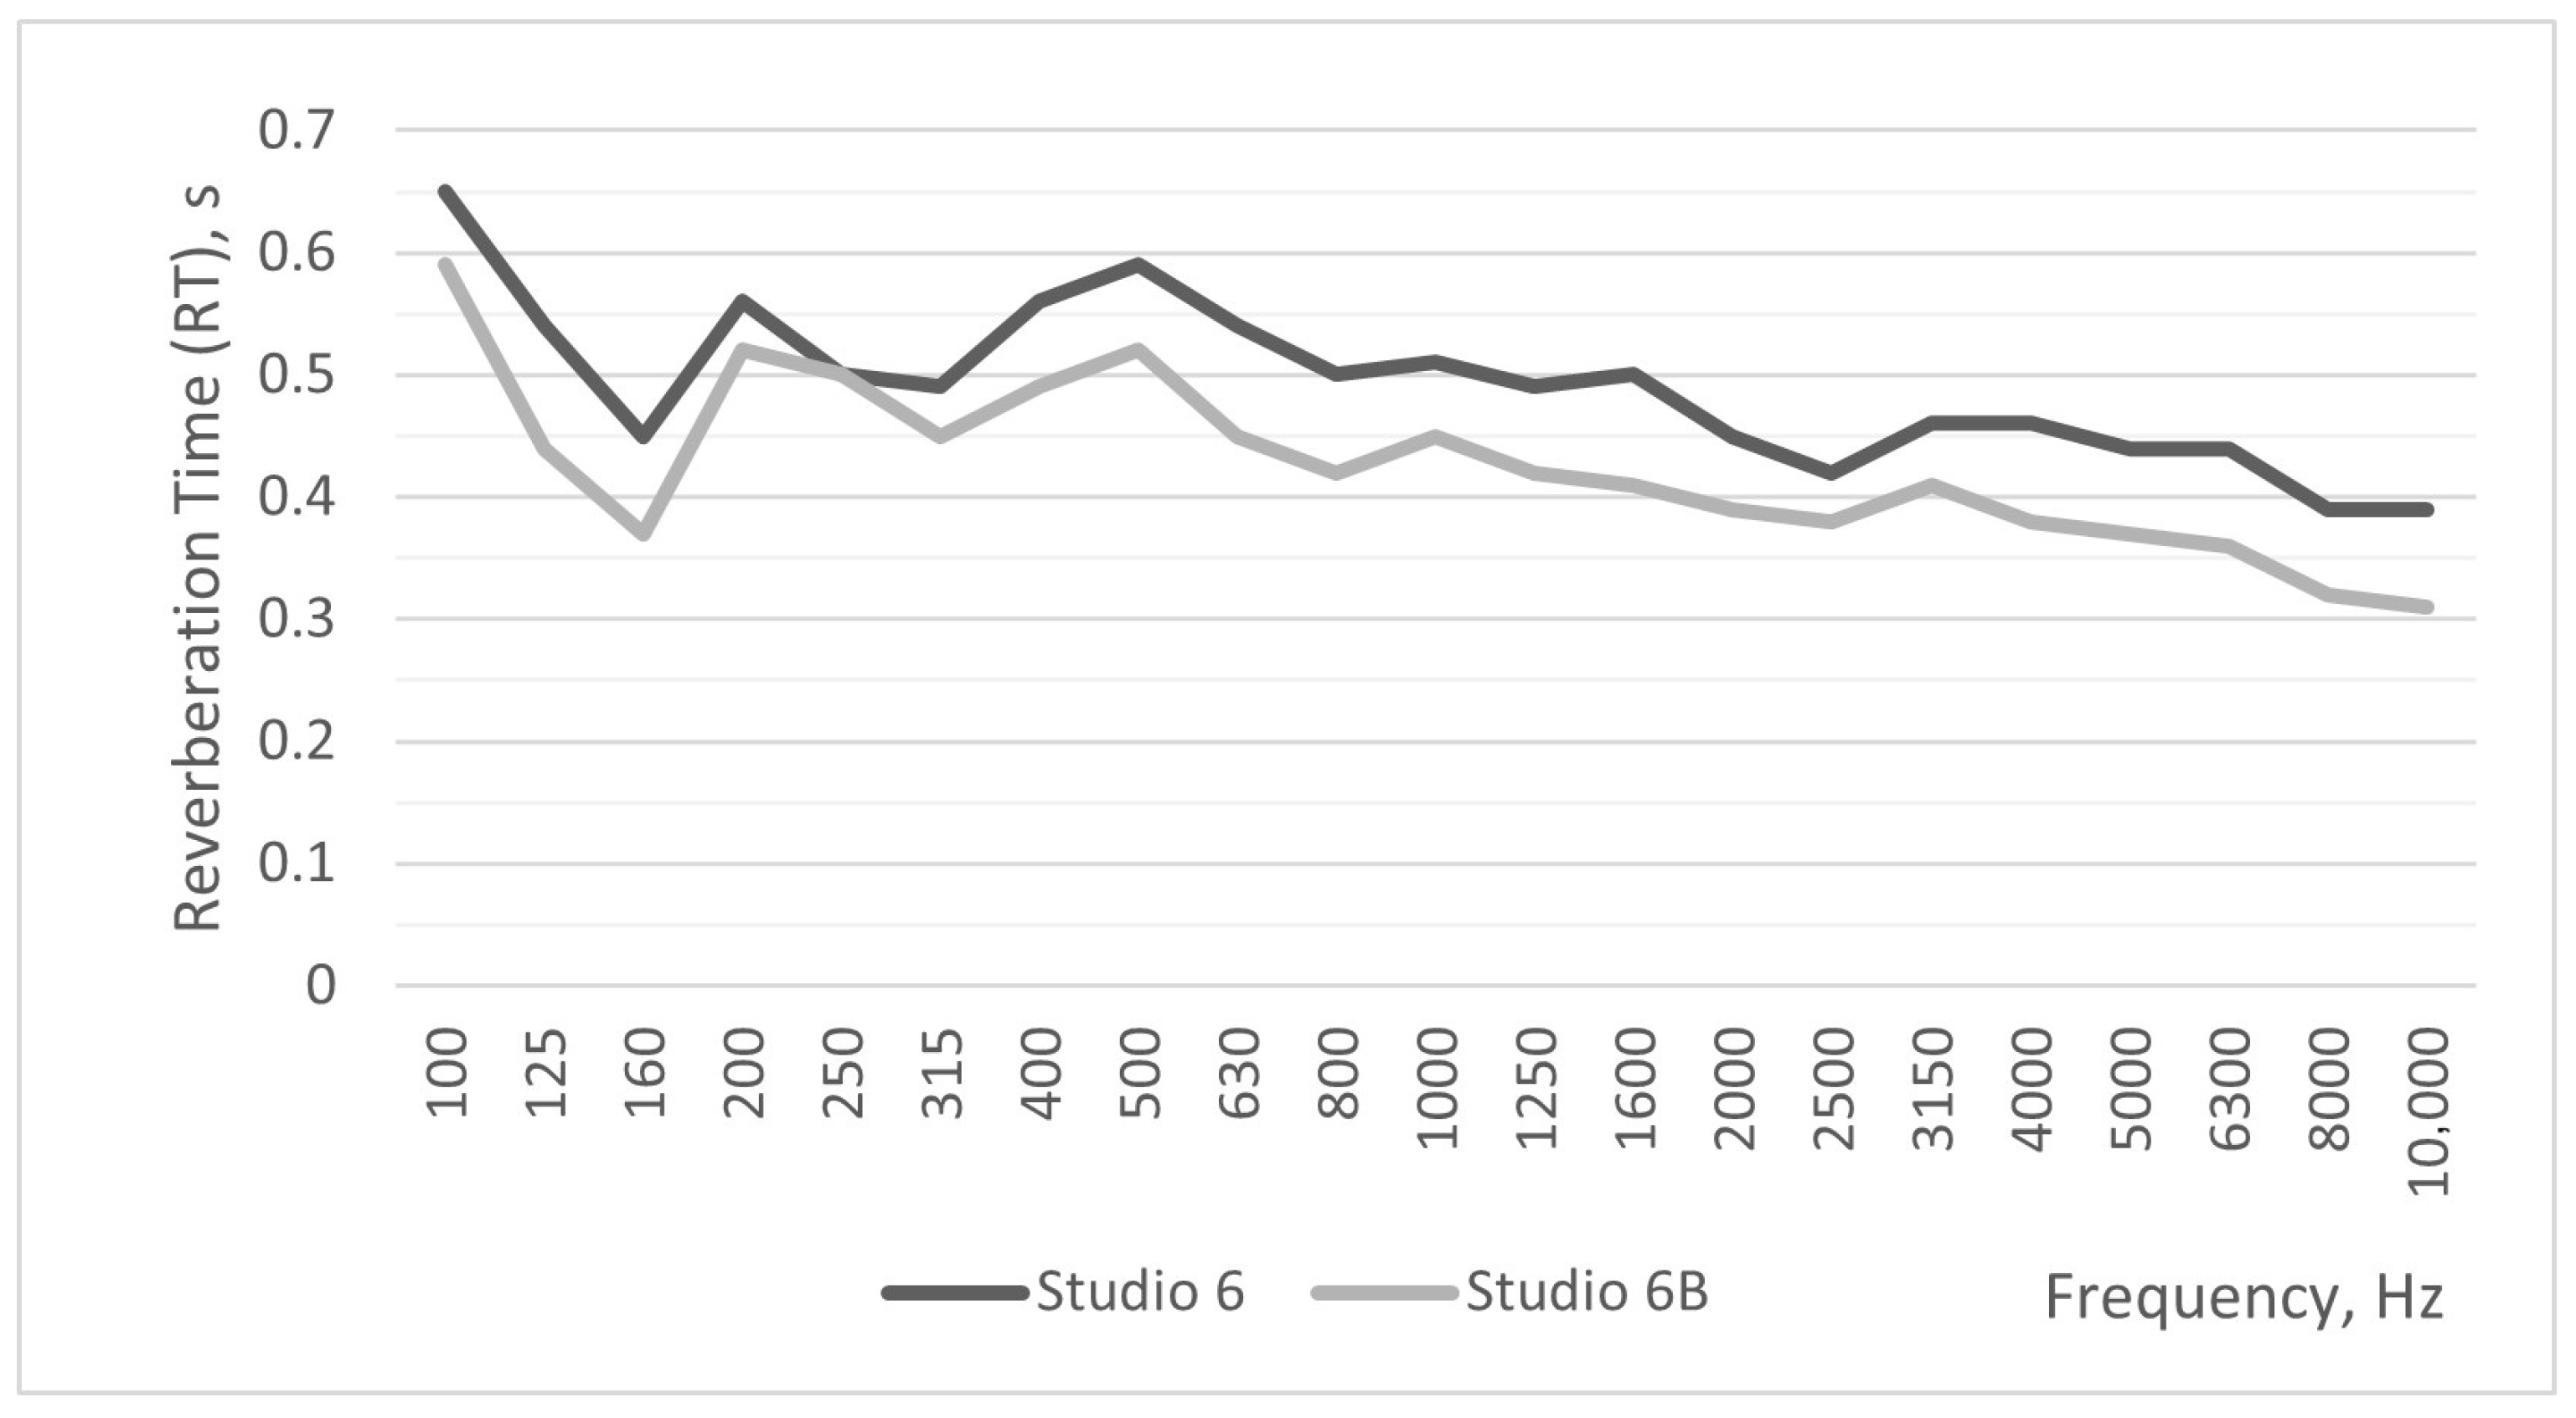
Reverberation time (RT) has been measured in accordance with ISO 3382-2:2008 [27] for the interconnected L-shaped studio and one of the smaller studios using a B&K 2270 sound level meter (HBK, Virum, Denmark). The measured reverberation levels are given in Figure 2. RT can be considered to be appropriate for educational spaces. This might be due to the strong effect of the low suspended ceiling. In terms of spectral distribution, the studios show similar profiles because the same materials are used in both the larger and smaller studios.
Figure 2.
Measured reverberation time of large (studio 6) and small (studio 6B) studios.
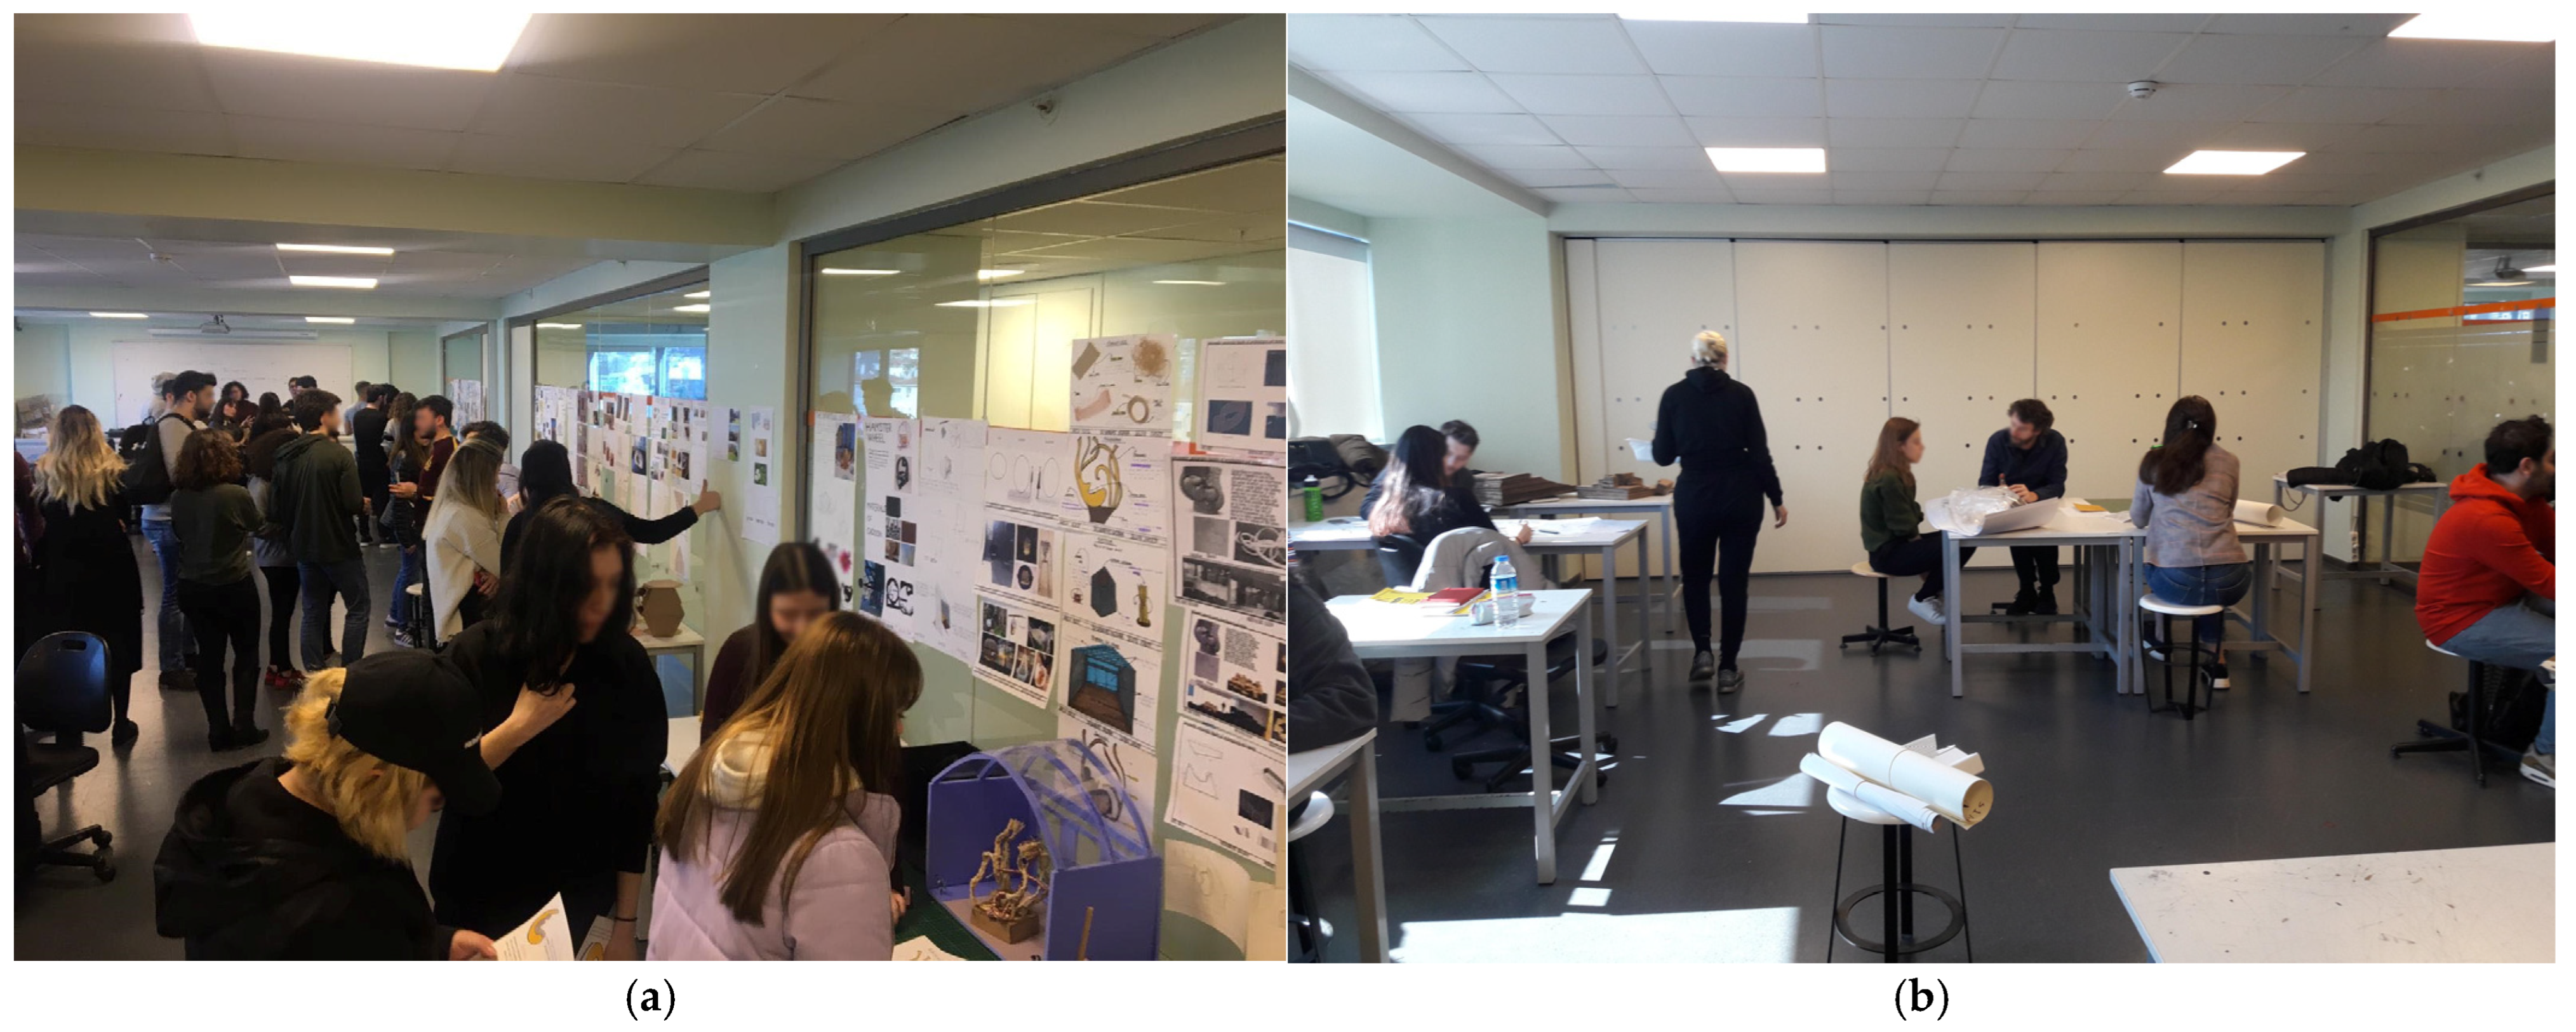
The survey was directed at first and fourth-grade students of architecture. Both grades take their classes for 8 h per week. The first-grade architectural design course is held once a week for 8 h, while the fourth-grade architectural design course is held twice a week for 4 h each. Students are also welcome to use the studio classrooms 24/7. During the course hours, the architecture studio reserved for the fourth-grade students tends to be separated by the movable partition walls, where groups of about 15 students with one advisor use each of the separated classrooms. These students sometimes work together on group discussions but mostly receive individual comments from their advisors. On the other hand, first-grade students spend more interactive course hours; therefore, they tend to use the studio with no partitions, adding up to an L-shaped studio with a total area of about 320 m2. Photographs from interactive studies of first-grade students and individual feedback of fourth-grade students at the studios are given in Figure 3.
Figure 3.
Photographs from (a) first-grade studio lesson and (b) fourth-grade studio lesson. Note: Individuals in the photograph have been fully anonymized to protect their privacy. Photo by [Mine Ascigil-Dincer].
First and fourth grade students clearly have different levels of education. However, there are other varying factors, such as physical volume of space, interaction between themselves and also their instructors and course format. In this study, all of these factors are integrated with the education level; grade-level differences cannot be attributed to education level alone.
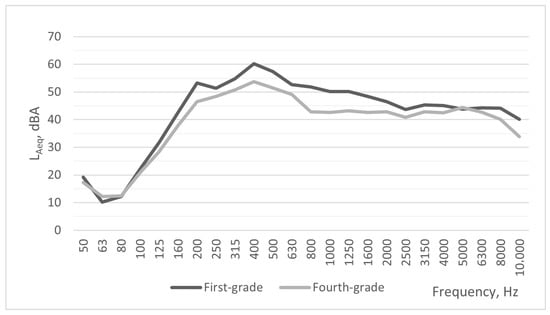
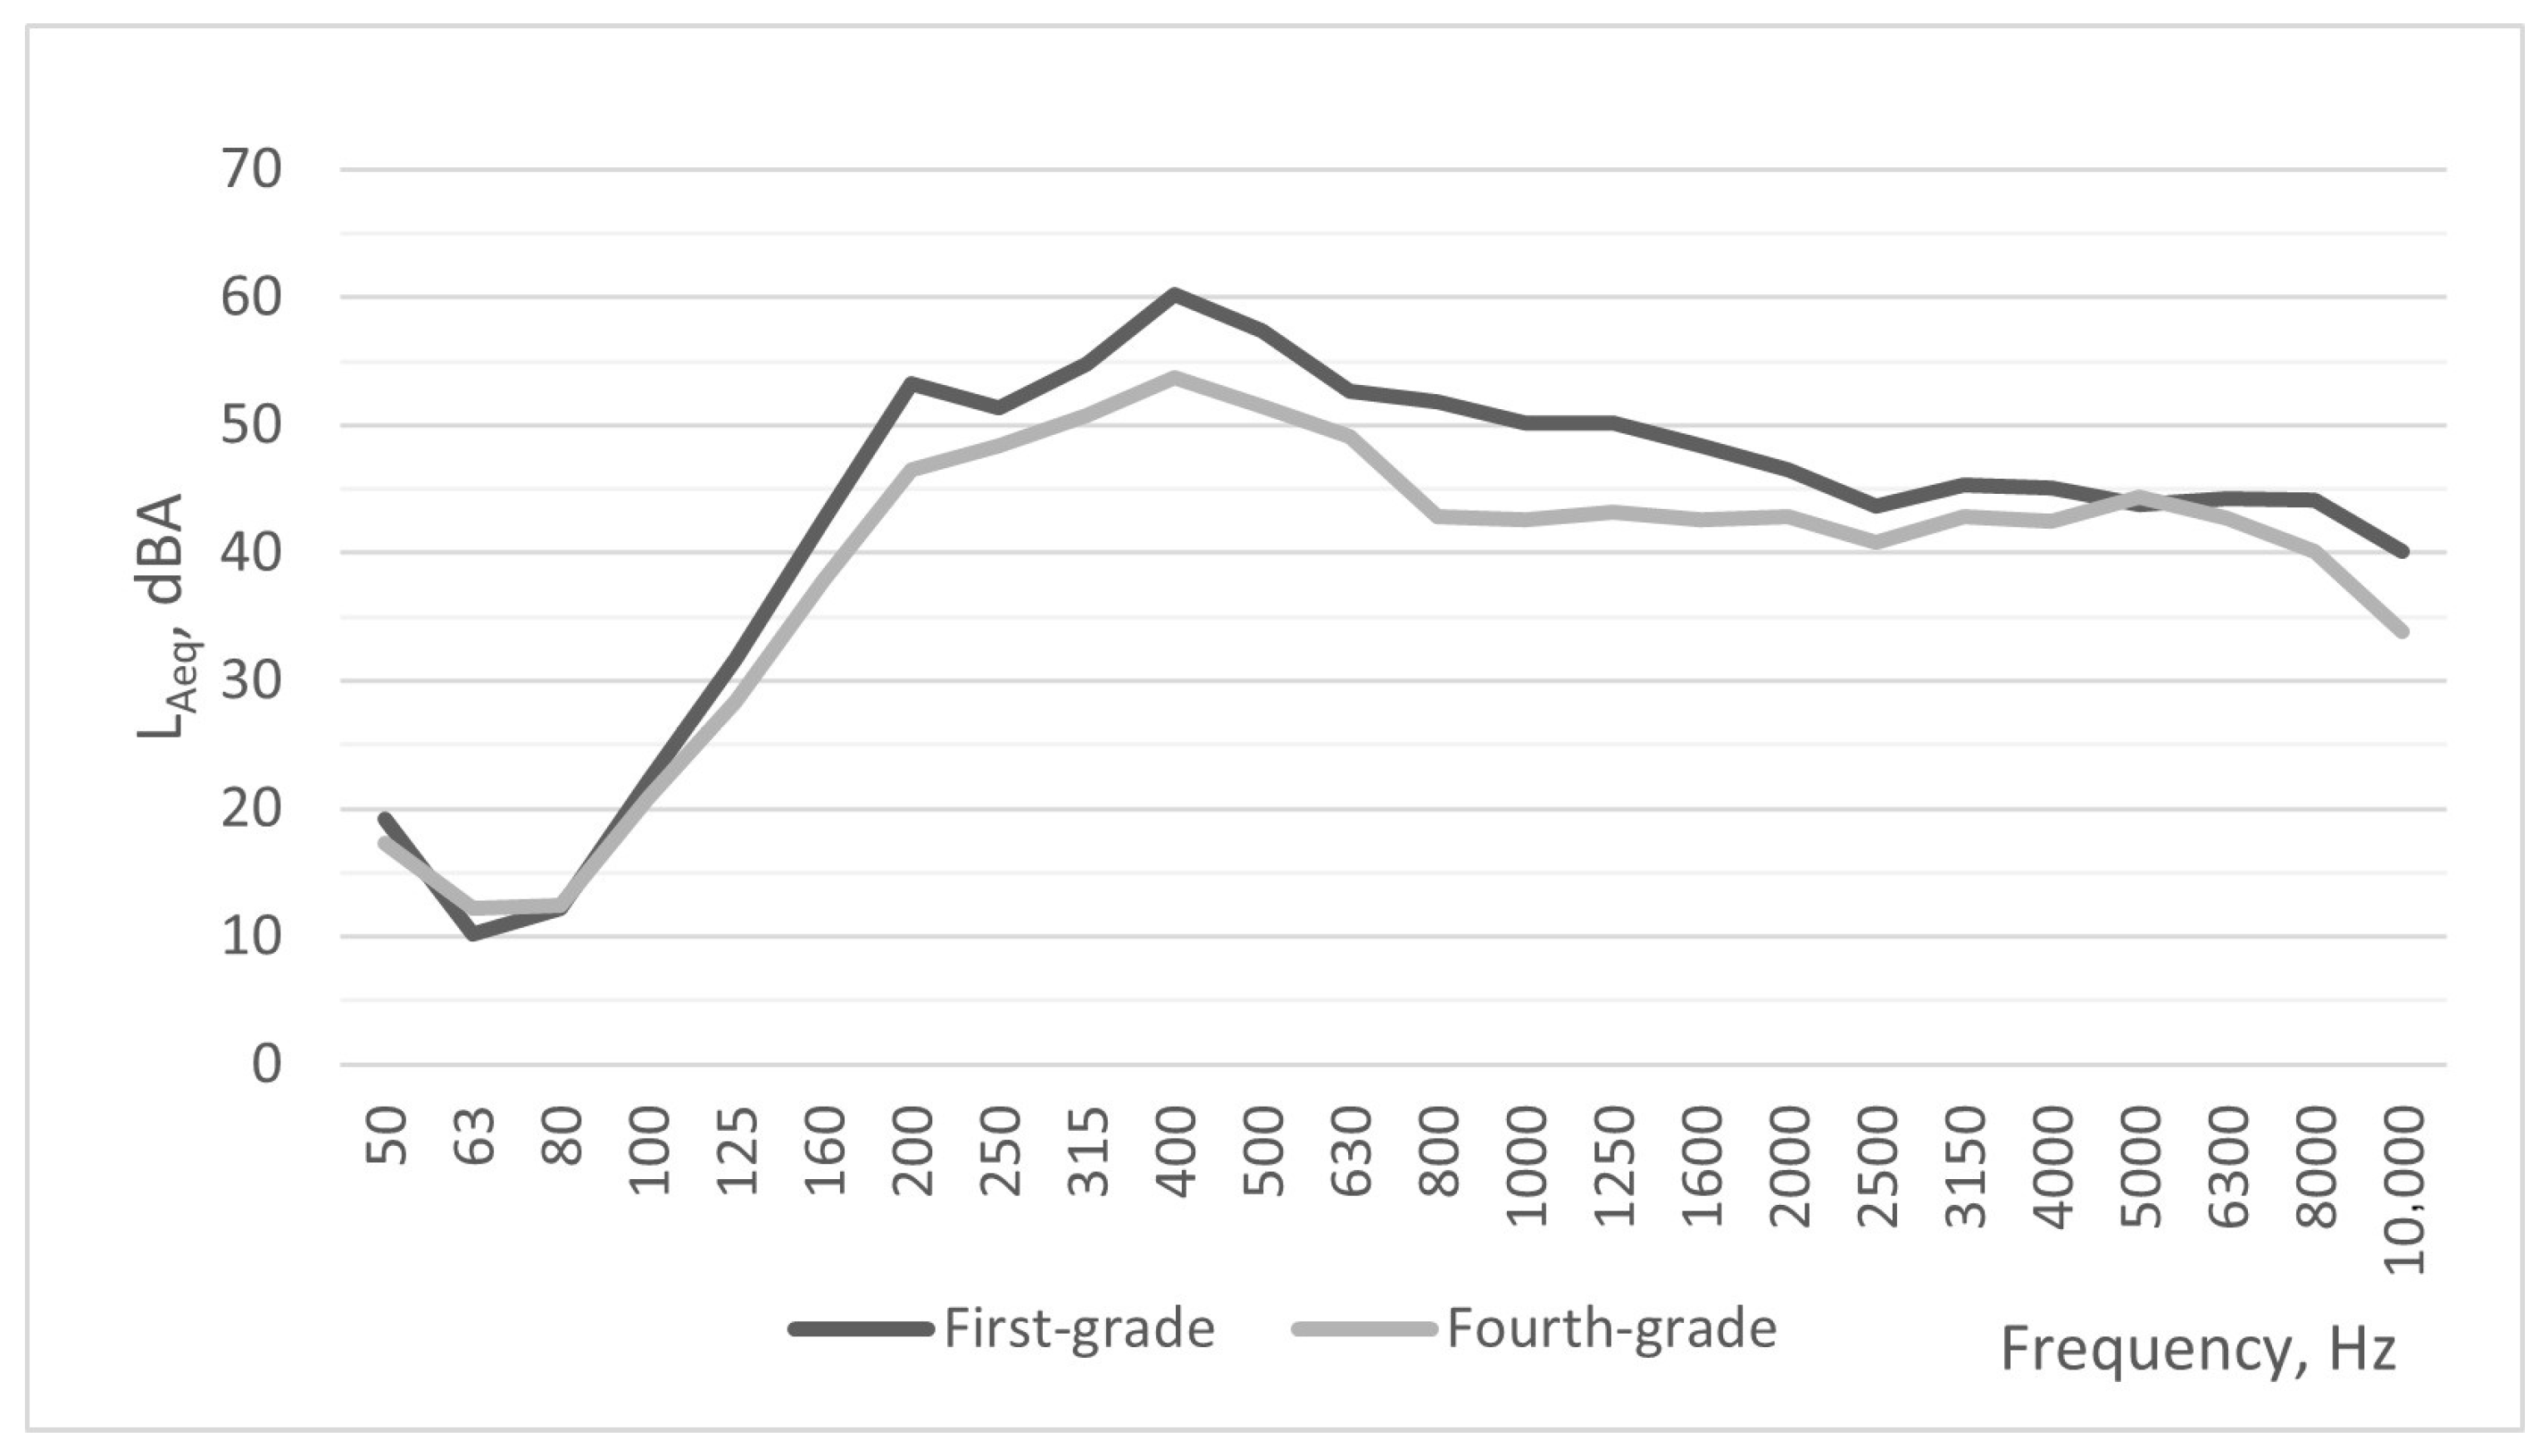
LAeq (A-weighted Equivalent Continuous Sound Level) was measured over 1 h during first- and fourth-grade courses using a B&K 2270 sound level meter. The measured reverberation levels are given in Figure 4. The values show an increase, mostly in human speech frequencies, for the first-grade studio.
Figure 4.
Measured LAeq (A-weighted Equivalent Continuous Sound Level) values during first- and fourth-grade courses.
Convenience sampling was used for participant selection. Studios were visited and questionnaires were distributed to all the students during class hours. Participation was voluntary. Students were asked whether they had an identified hearing problem prior to the survey; if so, they were not included. The survey was conducted on three different days of the same week during studio class hours, in the same studio where they were evaluating. The population of registered first-grade and fourth-grade students were 141 and 140, respectively. Standard sample-size formulas for a 95% confidence level and 5% margin of error were used as a benchmark for the target sample size; as participation was voluntary rather than random, these figures are reported as descriptive benchmarks rather than formal statistical guarantees.
2.2. The Tailored Framework
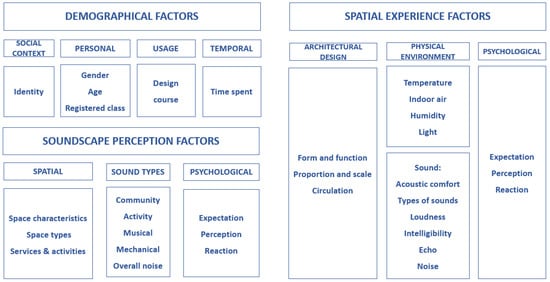
In order to go further in this investigation, identifying the factors affecting the three main features of this study: user, sound and space, has been achieved by establishing a new tailored framework, related to the case at hand, as shown in Figure 5. This study evaluates psychological aspects of Expectation, Perception, and Reaction, based on users’ demographic factors to comprehend how occupants perceive their indoor spaces.
Figure 5.
The tailored framework of soundscape perception, demographic and spatial experience aspects utilized in this study (adapted from [16]).
The tailored framework was mainly based on Aburawis and Dokmeci Yorukoglu’s model [16], which presented a set of new factors related to each of the soundscape perception and spatial experience variables.
This article introduced an integration of various previous research on spatial experience and soundscape perception. The combined factors of soundscape perception were given as spatial, temporal, sonic, personal, psychological and behavioral. The factors related to spatial experience were recommended as usage, user, architectural features, physical environment and social context [16].
Pascual et al. [28] found that the spatial experience is gained over a mixture of various social and psychological elements, including pleasantness, expectation, space identity, familiarity, and information. The literature has addressed a number of additional elements that affect the spatial experience in addition to these. These include environmental factors like sound, temperature, and lighting; design elements like layout, color, and materials; and social traits like age, gender, education level, and experience [29]. Chen and Ma [24] found that the impact of the soundscape in wide spaces may be categorized based on the viewpoints of users, including the influence on behavior and thinking skills, emotional impact, and attention. Expectations about the space and sounds were also found to be effective in soundscape perception [30].
Another base point was Dokmeci Yorukoglu and Kang’s [9] research, which determined variables of an indoor soundscape framework, focusing on spatial experience, to be used for creating an indoor soundscape questionnaire. This framework brought together space use, psychological and demographic aspects under the heading of contextual experience; functional, space and environmental aspects under the heading of built features; physical factors, acoustical and psychoacoustical factors under the heading of sound environment.
Aburawis and Dokmeci Yorukoglu’s study [16] classified soundscape perception factors and spatial experience factors separately and placed user factors such as usage/temporal (time spent, usage frequency, purpose) and personal/user (socio-cultural, identity) into these factor models. The questionnaire results [9] found demographic and usage factors to be quite effective in soundscape and spatial experience. In order to make the statistical analysis and comparisons more comprehensible, a third headline, demographic factors, was added to the framework, while soundscape perception and spatial experience aspect headlines were kept.
Demographic factors considered for this study were (1.1) social context [16,28], (1.2) personal [29], (1.3) usage [9,16] and (1.4) temporal [9,16]. Some of the demographic factors are stable in this study, such as the student identity and usage of space for design courses. Others, such as age, gender, registered class/grade and usage duration each week in the case indoor space, vary. Spatial experience can be evaluated through (2.1) architectural design factors [9,11,16], which architecture students are expected to be aware of; through (2.2) physical environment factors [9,11,16], such as thermal, visual and acoustics comfort conditions; and through (2.3) psychological factors [9,11], such as what users expect form the space, how they perceive it how they react to it. Soundscape perception factors are related to (3.1) spatial factors [16], for instance, space activities and characteristics; (3.2) sound source types [9] and (3.3) psychological factors [9,24,28,30], again through Expectation, Perception and Reaction.
This adopted framework was used to determine the factors to be studied in the questionnaire to comprehend their relationships with each other.
2.3. Questionnaire Design
This questionnaire design was based on Dokmeci Yorukoglu and Kang’s study [9], which presented an evaluation of the indoor soundscape of a public library environment through the contextual experience model. In this study, psychological factors, which are Expectation, Perception and Reaction, were studied in relation to the demographic characteristics of the space users, in order to understand their perception of the architecture studio classroom. The factors included in the indoor soundscape questionnaire were identified according to the tailored framework designed for this study.
The questionnaire was addressed to the first-grade and fourth-grade student architecture students in order to evaluate the differences in their assessment of the indoor soundscape of the architecture studio classrooms. The survey questions were subdivided into three sections:
- Demographic information.
- Spatial experience.
- Soundscape perception.
The first section, which is about demographic information, includes general individual facts about students, such as gender, age, education level (first or fourth grade) and time spent each week in the studios.
The second section, evaluates architectural design and physical environmental factors, which are listed under the Spatial experience variable, in terms of importance and quality. This section includes a 5-point Likert scale that allows students to rate 16 different factors related to architectural design (form and function, proportion and scale, circulation), physical environment (temperature, indoor air, humidity, light), and sound (acoustic comfort, types of sounds, loudness, intelligibility, echo, noise). The first table of questions aimed at evaluating users’ Expectation through the importance assessments, by asking them to rate the elements given, based on the level of importance in evaluating the Spatial experience in the architectural studio (Table 1). The second table in this section aimed at evaluating user’s Reaction to their architecture studio through the quality scores, by asking them this time to judge the elements on the quality in their own classroom (Table 2).
Table 1.
Question on the importance levels in assessing Spatial Experience. Q: Please rate the factors given below according to how important you think they are in evaluating the Space Experience in an architectural studio.
Table 2.
Question on the quality levels in assessing Spatial Experience. Q: Please rate the factors given below according to their quality in your architectural studio.
The final part is dedicated to the subjective assessment of sound sources through a 5-point Likert scale in order to evaluate soundscape perception. The 17 different sound sources that are identified within the case space took place in this part of the questionnaire. These sources were identified under five different groups: community (speech, laughter, whispering, group discussion, individual feedback), activity (mouse click, computer keyboard, model making, page-turning, walking/footsteps, doors slamming), musical (mobile phones, personal music player), mechanical (elevator, mechanical fan/ac, traffic noise), and overall noise. In this section, students are asked two different questions. The first one determines users’ Perception of sound sources in terms of annoyance (Table 3), while the second question determines their Reaction to sound in terms of disturbance/preference rates (Table 4).
Table 3.
Question on sound source annoyance to assess Soundscape Perception. Q: Please rate the factors given below according to how annoying you think they are to be in your architectural studio.
Table 4.
Question on sound source preference level to assess Soundscape Perception. Q: Please rate the factors given below according to how preferable they are to be in your architectural studio.
3. Findings and Discussion
The first and fourth-grade students were requested to fill out the surveys during their architectural design studio course hours. Of the 141 registered first-grade students, 107 volunteered to participate (76% response rate); of the 140 registered fourth-grade students, 84 volunteered (60% response rate). Based on standard sample-size formulas, these correspond to an approximate margin of error of 5% for the first-grade group, 7% for the fourth-grade group, and 4% for the combined sample of 191 out of 281. As the sample was voluntary rather than randomly selected, these figures serve only as a benchmark for sample precision and should not be interpreted as formal confidence intervals. This study relied on convenience and voluntary sampling within a single university architecture studio, which may introduce self-selection bias and limit generalizability. Reported margin-of-error values reflect sample size relative to population size and do not imply a representative probability sample.
Out of the 191 participants in total, 111 were female and 80 were male. The time range dedicated to the architectural design studio for both grades is 8 h. However, 44% of the participants stated that they spend more than 8 h each week using the architecture classroom. On the other hand, while 52% of the participants tend to spend 8 h in the studio, the other 4% leave in less time.
Responses for the spatial experience factors were analyzed. ‘Level of indoor air quality’ and ‘Brightness of lighting’ were ranked as the most important, while ‘Different types of sound’ and ‘Level of reverberation (echo)’ were ranked as the least important factors within the architecture studio. Factors with the highest quality ratings were ‘Brightness of lighting’ and ‘Way finding’ factors. ‘Acoustic comfort’ and ‘Level of indoor air quality’ factors were rated to have the lowest quality.
The measured reverberation time values (Figure 2) in large and small studios were adequate for room volumes and functions. This could be the reason ‘Level of reverberation (echo)’ was ranked as one of the least important factors; they may have found it more important if they were dealing with a troubled situation. The measured LAeq values (Figure 4) were quite high, so that may be the reason ‘Acoustic comfort’ was found to have low quality.
In addition, averages of the sound sources defining the architecture studio’s soundscape showed that ‘Laughter’ is perceived as the most annoying sound source by the space users, while ‘Page-turning’ was considered as not annoying. Averages regarding the preference/disturbance scale have revealed that students rated ‘Individual feedback’ as a preferable sound and ‘Doors slamming’ as the most disturbing one.
Table 5 shows the mean, median and standard deviation values for the importance and quality ratings of spatial experience factors and annoyance and preference ratings of soundscape perception factors.
Table 5.
Descriptive statistics for importance and quality of spatial experience and annoyance and preference of soundscape perception.
The results of the conducted questionnaire were statistically analyzed using IBM SPSS Statistics (Statistical Package for the Social Sciences) 20 software.
Although the data were homogeneous, the normality test (Asymp. Sig. < 0.05) indicated a significant departure from normality. Therefore, non-parametric tests were used, which are also appropriate given the ordinal nature of the Likert-scale data.
To assess internal consistency, ordinal alpha values based on polychoric correlations were calculated for each group. For the Quality subscales, three items (brightness of lighting, diversity of sound types, and level of crowding) were excluded from their respective composites, as higher scores on these items (very bright, very diverse, very empty) do not necessarily correspond to better quality outcomes in an architecture studio context and including them would impose an unjustified directionality assumption. Importance for spatial experience: physical environment questions (k = 4; α = 0.823), sound questions (k = 6; α = 0.735), architectural design questions (k = 6; α = 0.791). Quality levels for spatial experience: physical environment questions (k = 3; α = 0.748), sound questions (k = 5; α = 0.641), architectural design questions (k = 5; α = 0.723). Annoyance for soundscape: community questions (k = 5; α = 0.733), activity questions (k = 6; α = 0.863), musical questions (k = 2; α = 0.698), mechanical questions (k = 3; α = 0.716). Preference for soundscape: community questions (k = 5; α = 0.614), activity questions (k = 6; α = 0.876), musical questions (k = 2; α = 0.786), mechanical questions (k = 3; α = 0.791). Although most subscales reached or approached the conventional 0.70 threshold, sound quality, annoyance to musical sounds and preference for community sounds showed marginal internal consistency with α values between 0.614 and 0.698.
Inspection of polychoric factor loadings, which indicate each item’s contribution to its respective subscale, showed that most items loaded adequately (loadings generally above 0.55). However, two items showed notably weak loadings: noise from neighboring spaces within the sound quality subscale (loading = 0.240), and preference for individual feedback sounds within the community preference subscale (loading = 0.510). The weak loading of the noise item is consistent with the low ordinal alpha observed for the sound quality subscale. Noise from neighboring spaces may be perceived differently from other sound quality items, such as loudness, acoustic comfort, intelligibility or echo, which are parameters of room acoustics.
Given this, the relatively small number of items in some subscales (k = 2–3), and the case-study scope of this research, the questionnaire should be regarded as an exploratory instrument requiring further refinement and validation in future studies rather than a fully established measure.
3.1. Effects of Demographic Factors
Demographic factor differences were analyzed according to the different factors evaluated in this study. The Mann-Whitney U test is a non-parametric statistical test used to determine whether there are differences between two independent groups. It was used to understand the statistical differences in the expectations, perceptions and reactions of users according to their demographic features (gender and education level). The significant results of the Mann-Whitney U test are summarized in Table 6. Another non-parametric test, the Kruskal-Wallis test, which is used to determine whether there are statistically significant differences between three or more independent groups, was applied to identify these variances according to the ‘Time spent’ variable.
Table 6.
Means, U, significance level (p < 0.05 two tailed) and effect size (r) of Mann–Whitney U test on demographic factors (sample sizes: 80 male, 111 female, 107 first-grade, 84 fourth-grade).
Table 6 presents the statistically significant differences (p < 0.05, two-tailed) in importance, quality, annoyance, and preference factors between genders (male and female) as well as between education levels (first and fourth grades). As noted earlier, grade-level differences cannot be attributed solely to education level; factors such as physical space, course format, and human interactions may also play a role. Interpretation of the U values indicates that the lowest U values (for human scale quality and form–function quality) correspond to the greatest differences between first and fourth grade groups. The effect size (r) supports this interpretation. Human scale quality and form–function quality differed by grade-level differences, with a medium effect size (0.30 ≤ |r| < 0.50), whereas all other differences exhibited small effects (0.10 ≤ |r| < 0.30). The proportions of the physical space changed between the two grade levels, so these differences in human scale quality and form-function quality are to be expected.
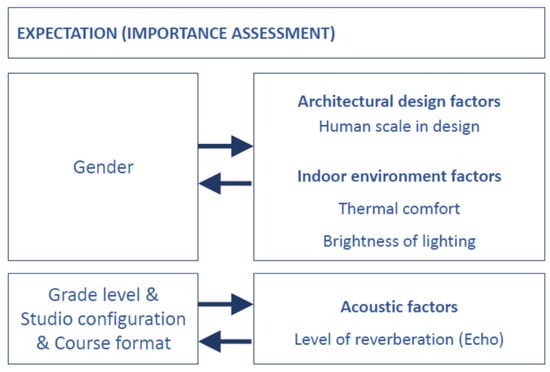
Users’ expectations (in terms of importance) of indoor environmental (‘thermal comfort’ and ‘brightness of light’) and architectural (‘human scale in design’) factors highlighted significant variances based on gender (Figure 6). These findings are similar to the ones presented by Dokmeci and Kang [9,25], who found that users’ expectation of the ‘level of thermal comfort’ differed according to their gender. Acoustic (‘reverberation level’) factor showed significant variance based on education level (Figure 6). Understandably, reverberation level expectation is significantly higher in the fourth-grade students because they receive education on acoustics in the second and third grades. The smaller studio classroom space and the course format may also contribute to this variance in expectation.
Figure 6.
Demographic factors differences regarding Expectation ratings (Importance) of the space factors.
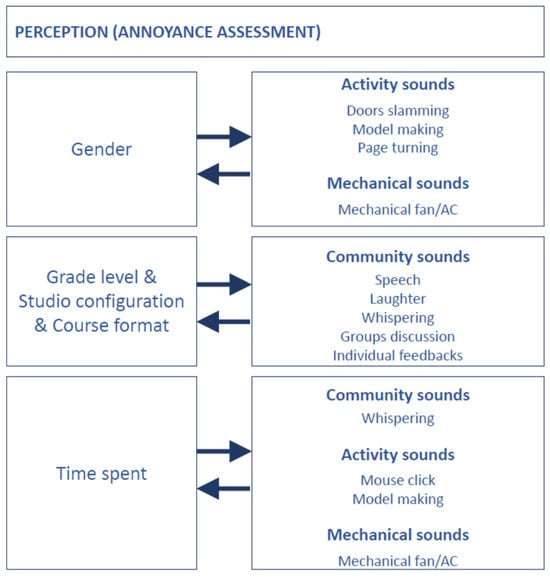
Fourth graders typically work in smaller studios, receive primarily individual feedback, and encounter lower LAeq levels (Figure 4). They are significantly more annoyed by speech, laughter, whispering and group discussions than first graders (p < 0.05). On the other hand, first graders work in a larger studio, participate in group discussions and experience higher LAeq levels (Figure 4). They are significantly more annoyed by individual feedback than fourth graders (p < 0.05), and they significantly prefer speech, laughter, model-making sounds, and fan sounds more than fourth graders (p < 0.05).
These findings may be related to the course process and nature of each of the students’ groups, as well as the arrangement of the movable partitions within the classroom. First-grade students work in an open-plan studio and focus on group work; therefore, individual feedback may be perceived as useless and increasing the general sound level. On the other hand, fourth-grade students work individually in smaller studios; therefore, hearing somebody else’s individual feedback does not annoy them, given that the general sound level is controlled and they feel that individual feedback is useful. Another variation was found based on users’ gender regarding their perception of annoyance from activity and mechanical sounds.
Findings have also revealed that spending time in the architectural studio affected the indoor sound perception of the users. According to Kruskal Wallis test, there were statistically significant differences between sound perception of users who spent different amounts of time (<8, 8 or >8 h per week) in the studio. While people who spend less than 8 h a week were statistically more annoyed by whispering (H(2) = 9.234, p = 0.010) and mouse clicking (H(2) = 7.786, p = 0.020), people who spend more than 8 h a week were statistically more annoyed by model making (H(2) = 7.266, p = 0.026) and mechanical fan sounds (H(2) = 8.151, p = 0.017). Epsilon-Squared (ε2) for these differences were 0.05, 0.04, 0.04 and 0.04, respectively, pointing to small effects (between 0.1 and 0.6). Post hoc pairwise comparisons were conducted. A statistically significant difference (p = 0.050) was observed for the whisper sound, whereas other comparisons were not statistically significant, possibly reflecting limited statistical power due to the small group (8 students who spent less than 8 h in the studio, 4%). Kruskal-Wallis differences for mouse clicking, model making, and mechanical fan sounds should be interpreted with caution, as the source of these differences could not be localized to specific group comparisons. A similar result was also found by Dokmeci Yorukoglu and Kang [9], who stated that whispering in a library is significantly correlated to the long time spent by the users in that space. Figure 7 presents a summary of these findings.
Figure 7.
Demographic factors differences regarding Perception ratings (Annoyance) of the sound sources.
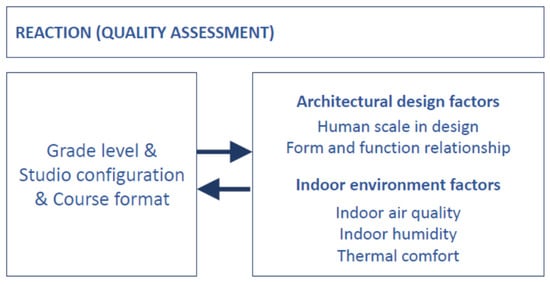
As presented in Figure 8, it has been found that participants’ ratings of the quality of environmental conditions (‘thermal comfort’, ‘indoor humidity’, ‘indoor air quality’) highlight their level of awareness based on their education level. Natural ventilation opportunities change when moving indoor partitions are closed, which may result in different thermal, humidity and air quality conditions. It may also be related to the difference in using these spaces for 4 h and 8 h a day, according to the course format. Supporting findings presented in Dokmeci Yorukoglu and Kang’s research [9] referred to the difference between Undergraduate, Master’s, and PhD degree students regarding their reaction to the space’s indoor air quality and indoor humidity conditions.
Figure 8.
Demographic factors differences regarding Reaction ratings (Quality) of the space factors.
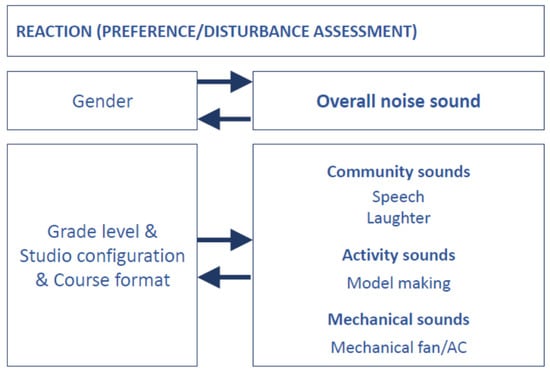
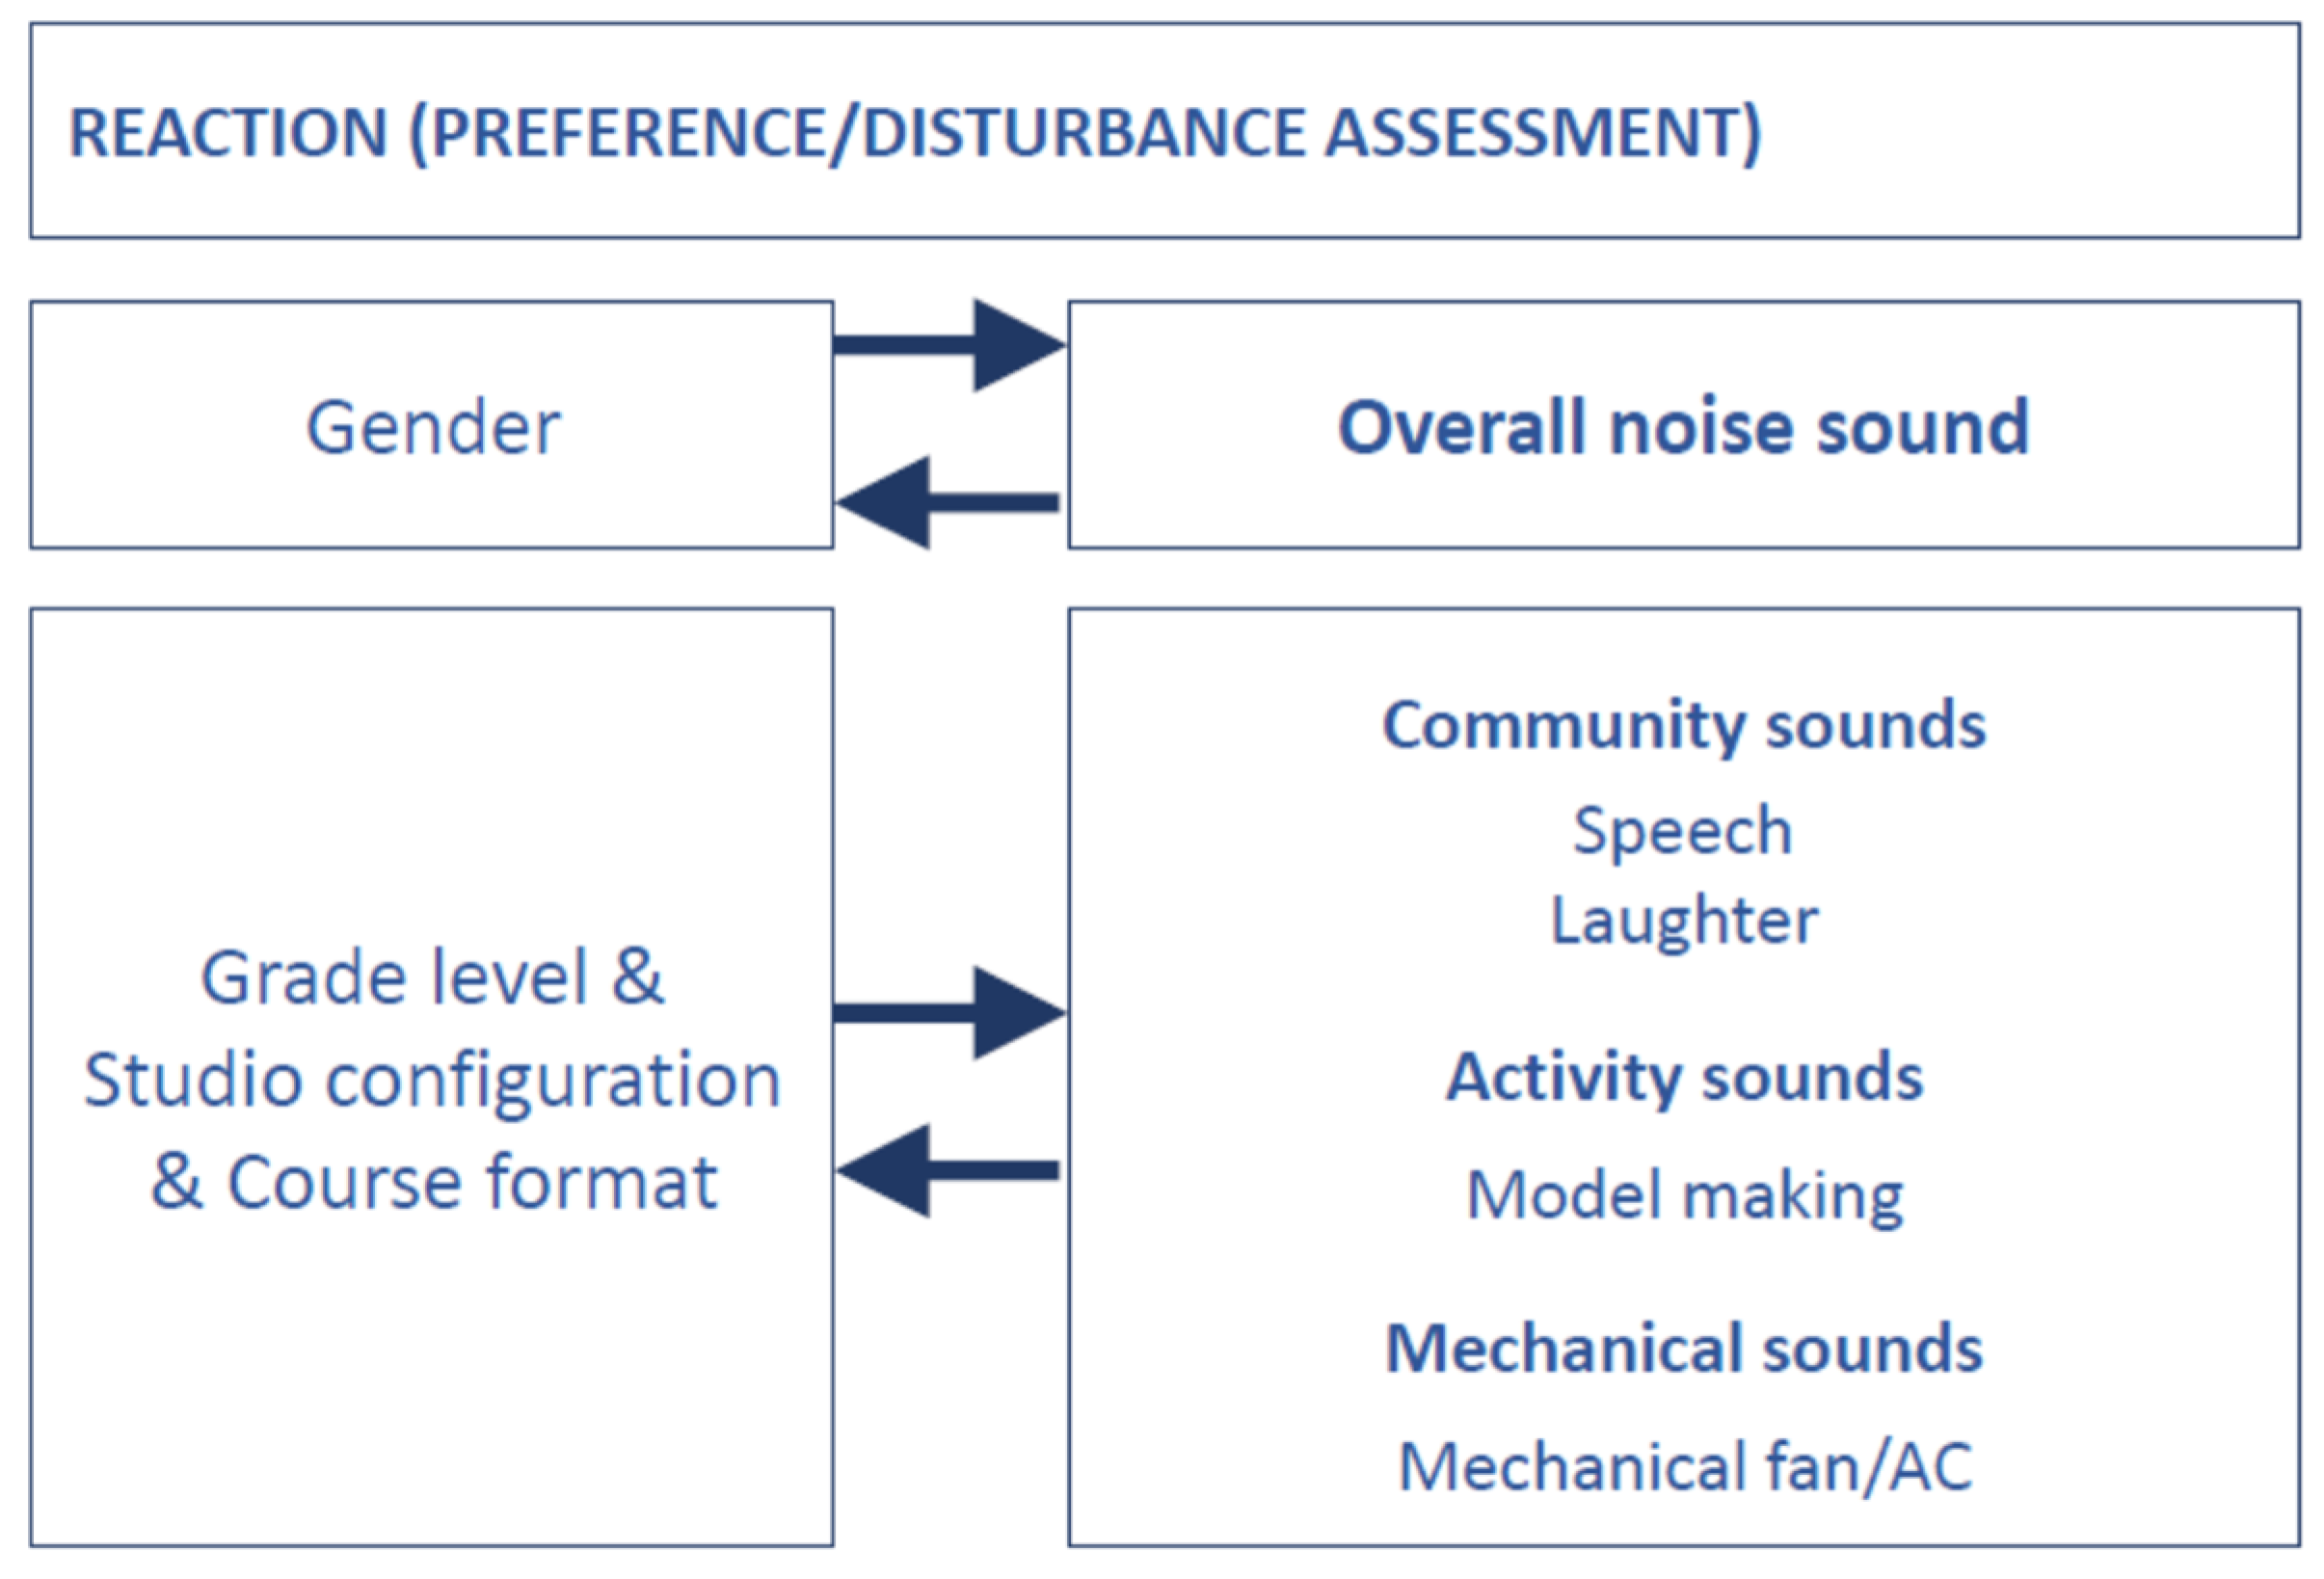
On the other hand, participants’ reactions to community, activity, and mechanical sounds varied by education level, whereas overall noise reaction varied by gender (Figure 9). Differences in reaction to sound sources by education level can be attributed to course format, due to varying group vs. individual feedback sessions and model-making practices. Similar findings were identified by Ikhwanuddin et al. [26], who found that space users perceive community and musical sounds as distracting.
Figure 9.
Demographic factors differences regarding Reaction ratings (Preference/Disturbance) to the sound sources.
3.2. Correlations of Spatial Experience Factors
Spearman correlation test was employed to analyze all the factors constituting the architecture studio environment. Table 7 presents Spearman’s correlation coefficients (rs) and significance between spatial experience elements regarding Quality and Importance.
Table 7.
Spearman’s correlations of spatial experience factors regarding Importance and Quality.
To address the possibility of false positives arising from the large number of statistical tests conducted, the Benjamini-Hochberg false discovery rate (FDR) procedure was applied to the p-values of the Spearman correlations within Table 7, with the family-wise false discovery rate set at q = 0.05. In addition, 95% confidence intervals (CIs) for each correlation coefficient were calculated using Fisher’s z-transformation, to provide a measure of the precision and plausible range of each estimate alongside the point estimate and significance level. All 28 correlations remained statistically significant after FDR correction (padj < 0.05), indicating that these associations are unlikely to be attributable to chance despite the large number of tests performed. The strongest associations were observed among Importance ratings for architectural design and physical environment factors (e.g., Importance Human Scale–Importance Form Function, rs = 0.599, 95% CI [0.499, 0.683]; Importance Air Quality–Importance Thermal, rs = 0.534, 95% CI [0.424, 0.628]), as well as among several Quality ratings (e.g., Quality Acoustic–Quality Loudness, rs = 0.474, 95% CI [0.356, 0.577]). For these moderate correlations, the confidence intervals exclude small/negligible values, supporting the interpretation that these represent meaningful associations. By contrast, several correlations between Quality and Importance ratings of the same or related factors (e.g., Quality Intelligibility–Importance Human Scale, rs = 0.148, 95% CI [0.006, 0.284]) were classified as very weak. Although these correlations remained statistically significant after FDR correction, their confidence intervals extend close to zero, indicating considerable uncertainty about the true strength of these associations. These weaker correlations should therefore be interpreted with caution and considered preliminary rather than as evidence of substantively important relationships.
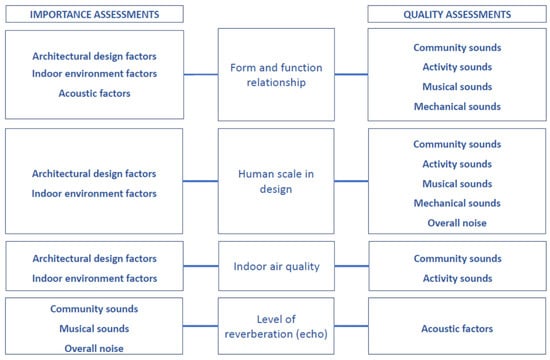
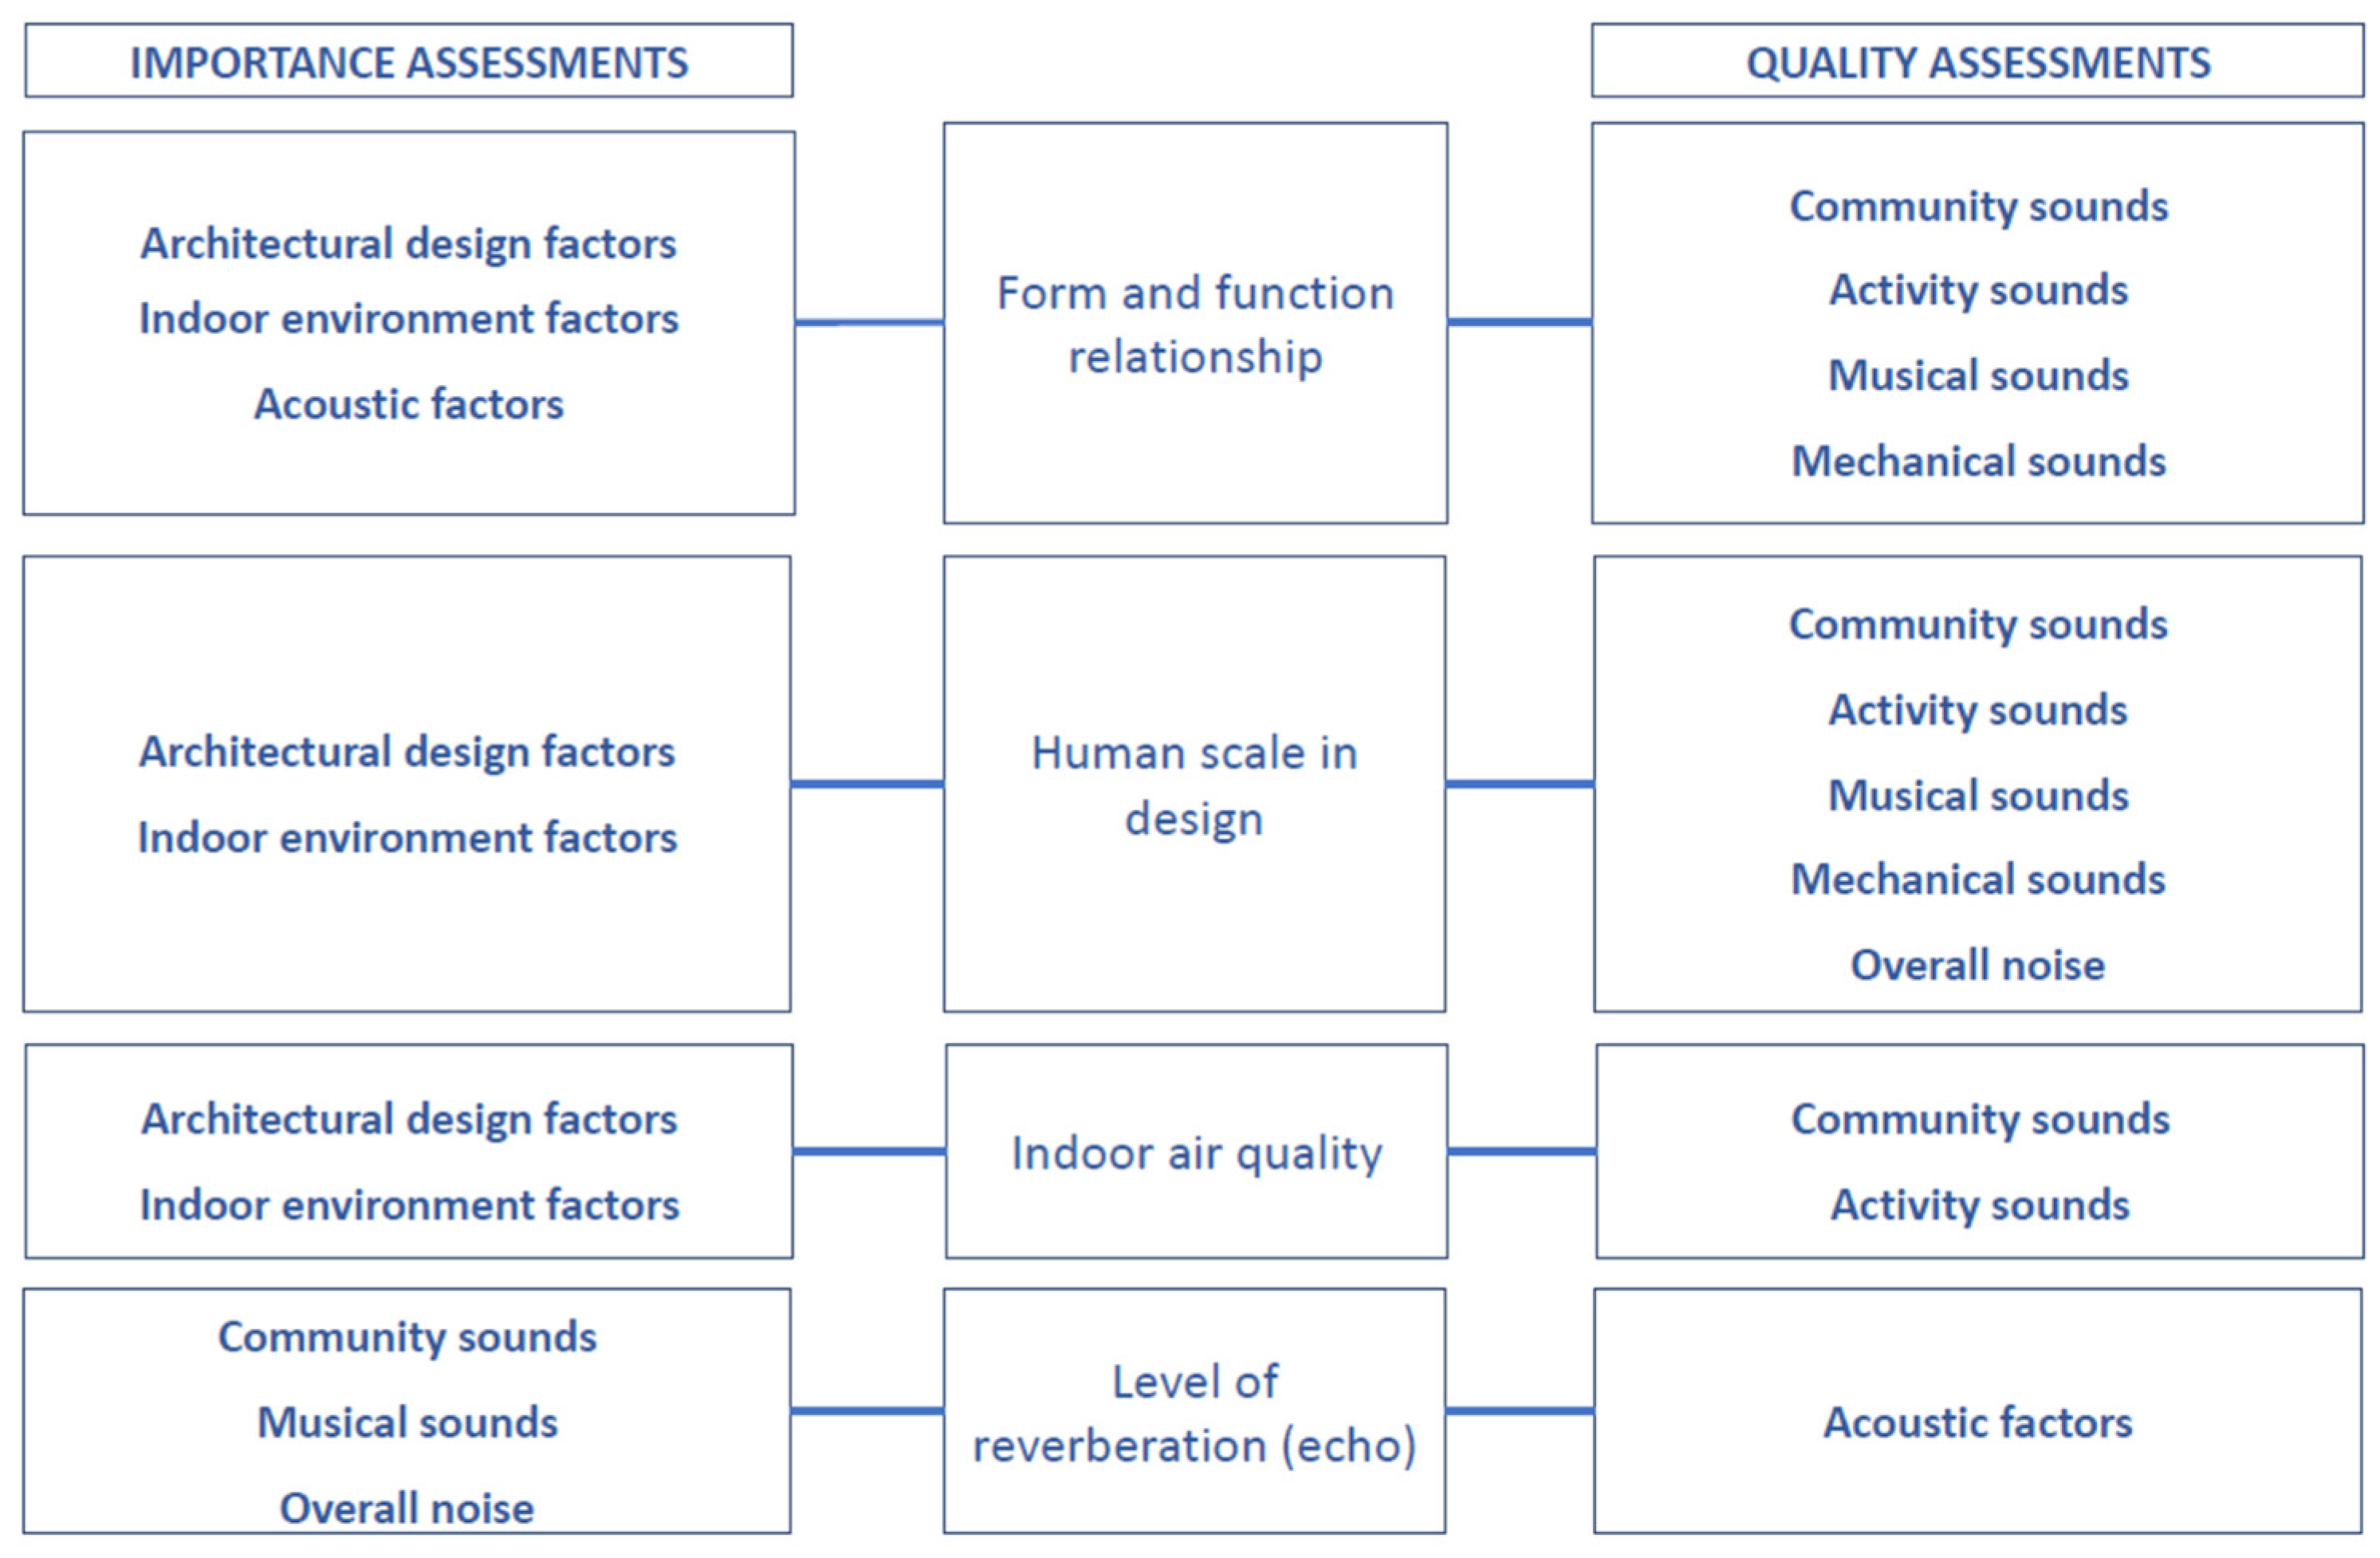
Significant correlations were found between spatial experience factors in terms of importance assessment. Architectural design and physical environment features were found to be correlated with the ‘human scale in design’ and ‘indoor air quality’ factors. In addition, ‘form and function relationship’ factor was found to be correlated to architectural, physical and acoustic factors. These findings suggest that the importance of all these factors is related to one another, which may in turn be associated with users’ experience within the space.
In terms of quality assessment, the space factor variables have been demonstrated to have correlations with the sound sources of the case space. ‘Human scale in design’ and ‘form and function’ variables were correlated with music, activity, community, and mechanical sound sources. Moreover, ‘indoor air quality’ showed significant correlations only with activity sounds and community sounds instead.
Statistical findings have also revealed that the reverberation quality was significantly related to mechanical, community, and overall noise sounds. In contrast, this variable’s importance assessment was found to be correlated with loudness and intelligibility. This suggests that acoustic factors are associated with one another, which may in turn be related to the perception of the acoustical environment. These are all summarized in Figure 10. The lines connecting these factors indicate statistically significant correlations; as this is a cross-sectional correlational design, the direction of any underlying relationship between these factors cannot be determined.
Figure 10.
Non-causal diagram of spatial experience elements that exhibit statistically significant correlations with sound sources and other spatial elements.
Moreover, several statistically significant correlations between different acoustic and architectural features were found within the scope of this research. The significant correlations found between the acoustic comfort feature and other architectural and acoustic variables suggest that the space factors defining an indoor environment are associated with the level of acoustic comfort. Similar results found by Dokmeci and Kang [25] disclosed correlations between the level of acoustic comfort and several space variables. All these findings highlight the role of occupants’ soundscape perception in relation to the quality of the spatial experience features, which underlines the relationship between sound perception and spatial experience.
3.3. Effects of Spatial Elements and Sound Sources on One Another
Correlations between spatial elements and sound sources were investigated. The significant results are presented in Table 8.
Table 8.
Spearman’s correlations between sound sources and spatial experience factors on each other.
The same FDR correction and confidence interval procedures described for Table 7 were applied to the correlations between sound source preference/annoyance ratings and spatial experience factors in Table 8. All 33 correlations remained statistically significant after Benjamini-Hochberg correction (padj < 0.05); however, the majority of these were classified as very weak (rs = 0.14–0.21), and the corresponding confidence intervals were wide and, in most cases, came close to including zero. The only correlation reaching a moderate strength was between preference for laughter and quality of density (rs = 0.306, 95% CI [0.171, 0.429]). While these correlations are unlikely, as a set, to be entirely attributable to chance (since they survive correction for the large number of tests performed) the small magnitudes and wide confidence intervals indicate considerable uncertainty about the true strength of these associations. These findings should therefore be interpreted as preliminary and exploratory, identifying candidate associations between sound source perception and spatial experience that warrant further investigation in future, larger-scale studies, rather than as confirmed, substantively important relationships.
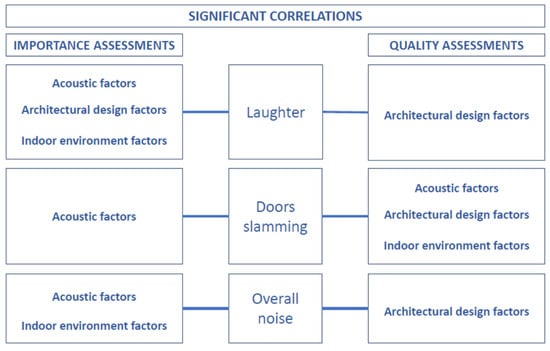
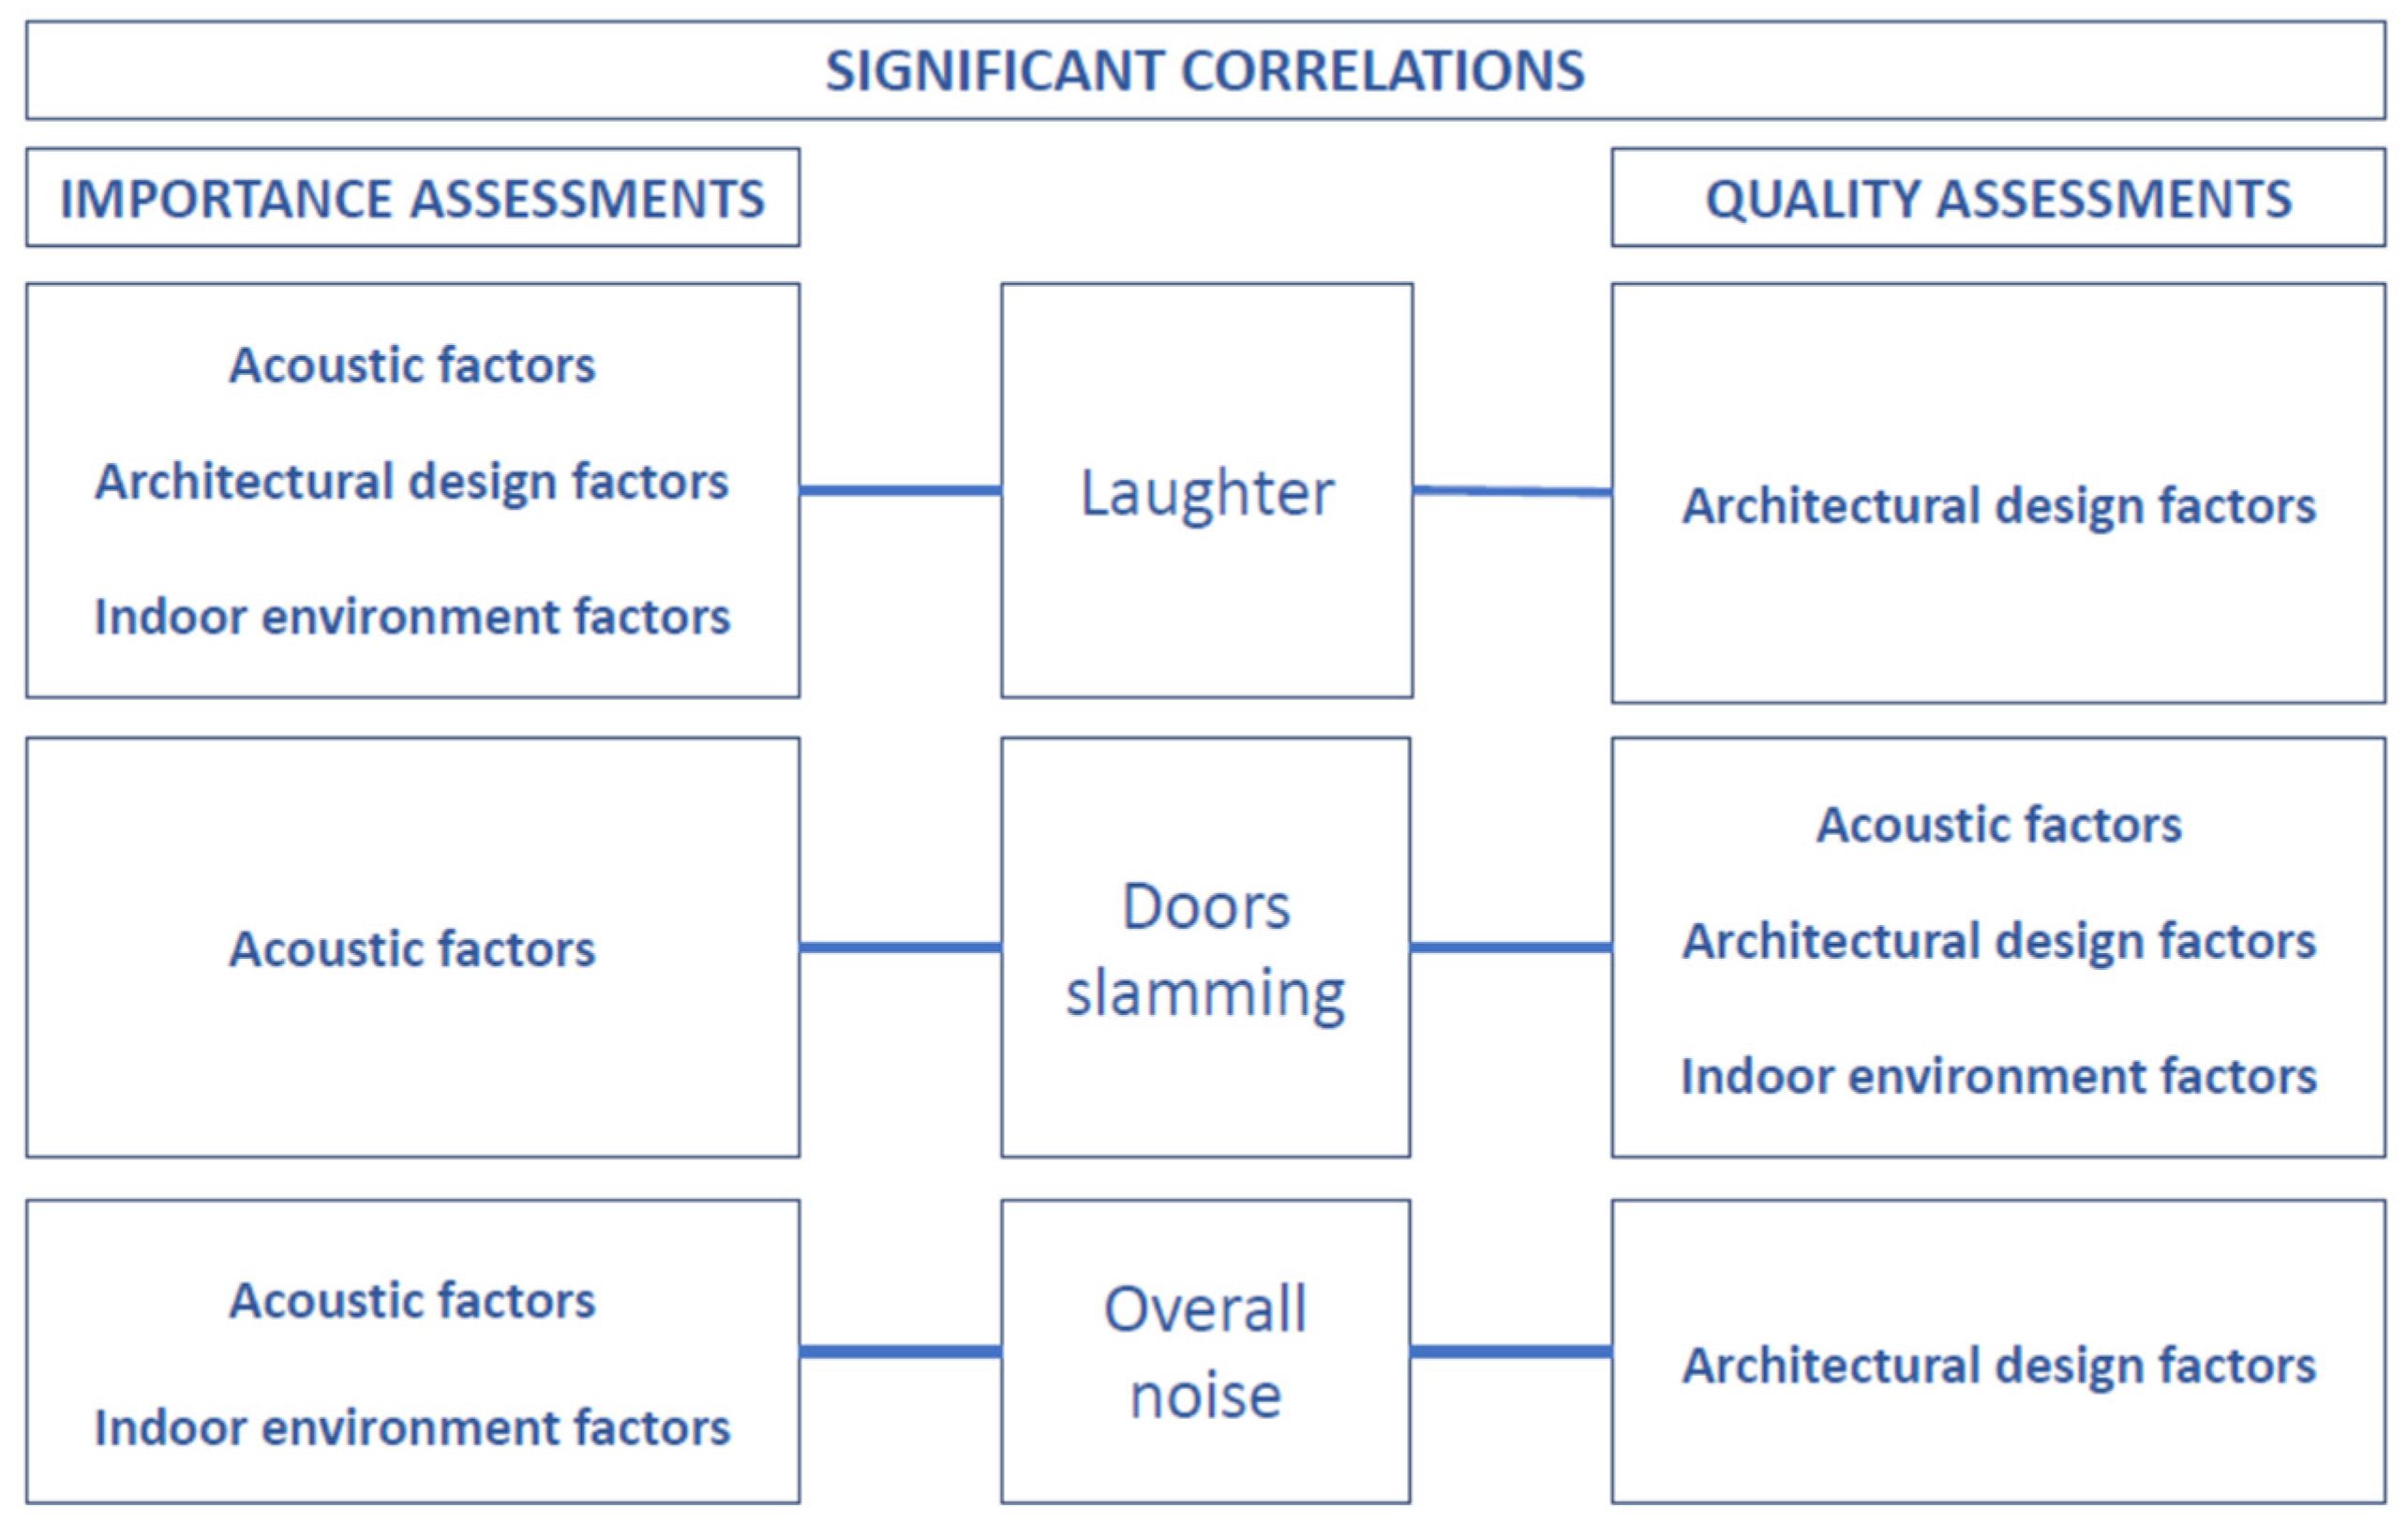
Statistically significant findings regarding sound source correlations showed that ‘individual feedbacks’ sound was correlated with acoustic and architectural elements. In contrast, the ‘group discussion’ sound was related to the indoor environmental and acoustic features. The existing variance between these two results may relate to differences in the acoustical source-path-receiver relationship between group discussion and individual feedback situations. Sound sources that were determined as the most annoying within the classroom soundscape were ‘laughter’, ‘doors slamming’, and ‘overall noise’. As presented in Figure 11, these sounds were found to have significant correlations with the architectural, acoustic and environmental variables. These results suggest a possible association between users’ auditory perception and physical, environmental, and architectural factors within an indoor space, though, as noted above, these correlations were generally weak and should be interpreted as preliminary. In Figure 11, the lines connecting factors indicate statistically significant correlations; as this is a cross-sectional correlational design, the direction of any underlying relationship between these factors cannot be determined.
Figure 11.
Non-causal diagram of statistically significant correlations of sound sources with spatial experience factors.
4. Conclusions
This research aimed to evaluate the spatial experience of users within architecture studios through the soundscape approach. To that end, a new indoor soundscape framework and method [9,16] were adapted and used. Applying it to a new indoor space, and comparing the previously found relationships were also intended.
Statistically significant findings revealed that demographic features affect users’ Expectation, Perception and Reaction regarding spatial experience and soundscape perception factors.
- Gender was found to affect expectation (importance assessment) of architectural design and indoor environment factors. The results indicate that gender also affects perception (annoyance assessment) of activity and mechanical sounds.
- Reverberation expectations and the perception of community sounds differed between first- and fourth-grade students; however, given that grade level in this study is confounded with physical volume, partition use, course format, and instructor interaction patterns, these differences should be interpreted as reflecting a combined effect rather than the effect of education level alone.
- Time spent in the related indoor space was found to affect sound perception.
- Evaluating spatial experience through expectation and perceived quality of architectural design and indoor environment framework was found to provide many meaningful relationships.
- Expectation of architectural design, especially designing according to human scale and form-function relations, were found to be correlated to expectation of many of the indoor environment factors.
- Perception of acoustical factors were found to be correlated with each other. Intelligibility quality was correlated with architectural design factors as well.
It was found that occupants’ auditory perception of the sound environment is associated with their experience within the indoor space through both design and environment.
In this study, the indoor soundscape methodology was applied in an educational environment. The findings corroborated previous results on the effects of demographic factors and the correlations between acoustic perception and spatial experience. It was determined that soundscape perception and spatial experience were associated with each other. Similar studies under different case studies will help to understand the perception of sound and space, and may lead to new design strategies to improve indoor experience.
Author Contributions
Conceptualization, M.E.F.; methodology, M.E.F.; software, M.E.F.; validation, M.A.-D.; formal analysis, M.E.F. and M.A.-D.; investigation, M.E.F.; resources, M.E.F.; data curation, M.E.F.; writing—original draft preparation, M.E.F. and M.A.-D.; writing—review and editing, M.A.-D.; visualization, M.E.F. and M.A.-D.; supervision, M.A.-D.; project administration, M.A.-D.; funding acquisition, M.A.-D. All authors have read and agreed to the published version of the manuscript.
Funding
This work was funded by Bahcesehir University Scientific Research Project Unit [grant number BAP.2018-03.02].
Institutional Review Board Statement
The study was conducted in accordance with the Declaration of Helsinki and approved by the Bahçeşehir University Committee for Scientific Research and Publication Ethics (2019/2, 28 February 2019).
Informed Consent Statement
Informed consent was obtained from all subjects involved in the study.
Data Availability Statement
The data presented in this study are available upon request from the corresponding author for ethical reasons. This work has been approved by Bahçeşehir University Committee for Scientific Research and Publication Ethics (2019/2).
Acknowledgments
This article is prepared from a thesis: “El Fakir, M. Evaluation of the Indoor Space Experience Through the Soundscape Perception Approach: Case Study Architecture Studios, Bahcesehir University, Istanbul, Turkiye, 27 June 2019.”. All the tables have been published previously in the thesis. Figures were changed for the manuscript. Publishing a thesis as an article does not constitute dual publication.
Conflicts of Interest
The authors declare no conflicts of interest. The funders had no role in the design of the study; in the collection, analyses, or interpretation of data; in the writing of the manuscript; or in the decision to publish the results.
Abbreviations
The following abbreviations are used in this manuscript:
| LAeq | A-weighted Equivalent Continuous Sound Level, dBA |
| NRC | Noise Reduction Coefficient |
| RT | Reverberation time, s |
| Rw | Weighted sound reduction index, dB |
| SPSS | Statistical Package for the Social Sciences |
References
- Lindborg, P. Psychoacoustic, physical, and perceptual features of restaurants: A field survey in Singapore. Appl. Acoust. 2015, 92, 47–60. [Google Scholar] [CrossRef] [Scilit]
- ISO 12913-1:2014; Acoustics—Soundscape—Part 1: Definition and Conceptual Framework. ISO: Geneva, Switzerland, 2014.
- Schafer, M. The Soundscape: Our Sonic Environment and the Turning of the World; Destiny Books: Rochester, VT, USA, 1977. [Google Scholar]
- Rodríguez-Manzo, F.E.; Garay-Vargas, E. The role of sound diffusing surfaces in the quality of the architectural space. In Proceedings of the International Symposium on Room Acoustics, Melbourne, Australia, 29–31 August 2010. [Google Scholar]
- Adams, M.D.; Davies, W.J.; Bruce, N.S. Soundscapes: An urban planning process map. In Proceedings of the InterNoise 2009, Ottawa, ON, Canada, 23–26 August 2009. [Google Scholar]
- Aletta, F.; Botteldooren, D.; Thomas, P.; Mynsbrugge, T.V.; De Vriendt, P.; Van de Velde, D.; Devos, P. Monitoring Sound Levels and Soundscape Quality in the Living Rooms of Nursing Homes: A Case Study in Flanders (Belgium). Appl. Sci. 2017, 7, 874. [Google Scholar] [CrossRef] [Scilit]
- Gozalo, G.R.; Carmona, J.T.; Morillas, J.B.; Gomez, R.V.; Escobar, V.G. Relationship between objective acoustic indices and subjective assessments for the quality of soundscapes. Appl. Acoust. 2015, 97, 1–10. [Google Scholar] [CrossRef] [Scilit]
- Hall, D.; Irwin, A.; Edmondson-Jones, M.; Phillips, S.; Poxon, J. An exploratory evaluation of perceptual, psychoacoustic and acoustical properties of urban soundscapes. Appl. Acoust. 2013, 74, 248–254. [Google Scholar] [CrossRef] [Scilit]
- Dokmeci Yorukoglu, P.N.; Kang, J. Development and testing of Indoor Soundscape Questionnaire for evaluating contextual experience in public spaces. Build. Acoust. 2017, 24, 307–324. [Google Scholar] [CrossRef] [Scilit]
- Dokmeci Yorukoglu, P.N.; Kang, J. Analysing sound environment and architectural characteristics of libraries through indoor soundscape framework. Arch. Acoust. 2016, 41, 203–212. [Google Scholar] [CrossRef] [Scilit]
- Ercakmak, U.B.; Dokmeci Yorukoglu, P.N. Comparing Turkish and European Noise Management and Soundscape Policies: A Proposal of Indoor Soundscape Integration to Architectural Design and Application. Acoustics 2019, 1, 847–865. [Google Scholar] [CrossRef] [Scilit]
- Indrani, H.C.; Ekasiwi, S.N.N.; Arifianto, D. Indoor soundscape model: Assessing contextual factors in open-plan offices on university campuses in Surabaya, Indonesia. Build. Environ. 2023, 237, 110267. [Google Scholar] [CrossRef] [Scilit]
- Kurukose Cal, H.; Aletta, F.; Kang, J. Perception of indoor and outdoor school soundscapes: A large-scale Cross-Sectional survey with UK teachers. Appl. Acoust. 2025, 227, 110219. [Google Scholar]
- Pellegatti, M.; Torresin, S.; Visentin, C.; Babich, F.; Prodi, N. Indoor soundscape, speech perception, and cognition in classrooms: A systematic review on the effects of ventilation-related sounds on students. Build. Environ. 2023, 236, 110194. [Google Scholar] [CrossRef] [Scilit]
- Hossain, M.R.; Manohare, M.; King, E.A. Systematic review of indoor soundscape assessments: Activity-based psycho-acoustics analysis. Build. Acoust. 2025, 32, 123–141. [Google Scholar]
- Aburawis, A.; Dokmeci Yorukoglu, P.N. An integrated framework on soundscape perception and spatial experience by adapting post-occupancy evaluation methodology. Build. Acoust. 2018, 25, 3–16. [Google Scholar] [CrossRef] [Scilit]
- Acun, V.; Yilmazer, S. A grounded theory approach to investigate the perceived soundscape of open-plan offices. Appl. Acoust. 2018, 131, 28–37. [Google Scholar] [CrossRef] [Scilit]
- Acun, V.; Yilmazer, S. Understanding the indoor soundscape of study areas in terms of users’ satisfaction, coping methods and perceptual dimensions. Noise Control Eng. J. 2018, 66, 66–75. [Google Scholar] [CrossRef] [Scilit]
- Watts, G.; Khan, A.; Pheasant, R. Influence of soundscape and interior design on anxiety and perceived tranquillity of patients in a healthcare setting. Appl. Acoust. 2016, 104, 135–141. [Google Scholar] [CrossRef] [Scilit]
- Mackrill, J.; Cain, R.; Jennings, P. Experiencing the hospital ward soundscape: Towards a model. J. Environ. Psychol. 2013, 36, 1–8. [Google Scholar] [CrossRef] [Scilit]
- Jeon, J.Y.; Jo, H.I.; Santika, B.B.; Lee, H. Crossed effects of audio-visual environment on indoor soundscape perception for pleasant open-plan office environments. Build. Environ. 2022, 207, 108512. [Google Scholar]
- Jo, H.I.; Jeon, J.Y. Influence of indoor soundscape perception based on audiovisual contents on work-related quality with preference and perceived productivity in open-plan offices. Build. Environ. 2022, 208, 108598. [Google Scholar]
- Cankaya Topak, S.; Yılmazer, S. A comparative study on indoor soundscape assessment via a mixed method: A case of the high school environment. Appl. Acoust. 2022, 189, 108554. [Google Scholar] [CrossRef] [Scilit]
- Chen, J.; Ma, H. An impact study of acoustic environment on users in large interior spaces. Build. Acoust. 2019, 26, 139–153. [Google Scholar] [CrossRef] [Scilit]
- Dokmeci, P.N.; Kang, J. A comparative case study of indoor soundscape approach on objective analyses and subjective evaluations of libraries. In Proceedings of the Acoustics 2012 Nantes Conference, Nantes, France, 23–27 April 2012; Société Française d’Acoustique: Paris, France, 2012. [Google Scholar]
- Ikhwanuddin, R.; Sarwono, J.; Sudarsono, A.S.; Utami, S.S. Library Soundscape: Higher Education Students’ Perception. In Proceedings of the Inter Noise 2017, Hong Kong, China, 27–30 August 2017. [Google Scholar]
- ISO 3382-2:2008; Acoustics—Measurement of Room Acoustic Parameters Part 2: Reverberation Time in Ordinary Rooms. ISO: Geneva, Switzerland, 2008.
- Herranz-Pascual, K.; Aspuru, I.; Garcia, I. Proposed Conceptual Model of Environmental Experience as Framework to Study the Soundscape. In Proceedings of the InterNoise 2010, Lisbon, Portugal, 13–16 June 2010. [Google Scholar]
- Hidayetoglu, M.L.; Yildirim, K.; Cagatay, K. The effects of training and spatial experience on the perception of the interior of buildings with a high level of complexity. Sci. Res. Essays 2010, 5, 428–439. [Google Scholar]
- Bruce, N.S.; Davies, W.; Adams, M.D. The effects of expectation on the perception of soundscapes. Appl. Acoust. 2014, 85, 1–11. [Google Scholar] [CrossRef] [Scilit]

Disclaimer/Publisher’s Note: The statements, opinions and data contained in all publications are solely those of the individual author(s) and contributor(s) and not of MDPI and/or the editor(s). MDPI and/or the editor(s) disclaim responsibility for any injury to people or property resulting from any ideas, methods, instructions or products referred to in the content. |
© 2026 by the authors. Licensee MDPI, Basel, Switzerland. This article is an open access article distributed under the terms and conditions of the Creative Commons Attribution (CC BY) license.