1. Introduction
Ultrasound imaging is widely used as a primary diagnostic modality for detecting calcified lesions such as gallbladder stones and kidney stones due to its real-time capability, cost-effectiveness, and non-ionizing nature [
1,
2]. Among the various sonographic features, posterior acoustic shadowing is considered one of the most important diagnostic indicators, particularly for identifying highly attenuating structures. This phenomenon arises when ultrasound waves encounter a strong acoustic impedance mismatch, leading to significant reflection and attenuation of the transmitted signal, and resulting in a characteristic dark region distal to the structure [
3]. Posterior acoustic shadowing is fundamentally governed by acoustic wave interactions at and beyond highly attenuating structures. When an ultrasound beam encounters a stone, acoustic impedance mismatch between the stone and surrounding soft tissue produces strong reflection at the interface. In addition, absorption and scattering within the stone and at its irregular boundary reduce the amount of acoustic energy transmitted to deeper regions. These processes collectively generate a distal hypoechoic region, which is visually recognized as posterior acoustic shadowing. Importantly, this shadow is not merely a uniform dark region; rather, it represents the cumulative effect of reflection, absorption, scattering, beam geometry, and frequency-dependent attenuation. Clinically, the presence and appearance of acoustic shadows are frequently used to differentiate pathological conditions and estimate lesion properties such as size and composition [
4]. However, despite its diagnostic importance, posterior acoustic shadowing is still predominantly assessed qualitatively, relying heavily on operator experience and subjective interpretation. This limitation introduces variability and reduces reproducibility, particularly in borderline or low-contrast cases.
From a physical perspective, posterior acoustic shadowing is not merely a homogeneous low-intensity region but rather a complex phenomenon influenced by multiple acoustic interactions, including absorption, reflection, scattering, and beam-related artifacts [
5]. Ultrasound images inherently contain speckle patterns, which arise from the constructive and destructive interference of backscattered waves from sub-resolution scatterers [
6,
7]. Although speckle has traditionally been regarded as noise, it has been increasingly recognized as a meaningful signal that reflects underlying tissue characteristics and structural heterogeneity [
8,
9]. Furthermore, shadow regions may still contain residual speckle, reverberation effects, and system noise, leading to non-uniform intensity distributions and subtle texture variations [
10]. These observations suggest that posterior acoustic shadows may encode additional structural information beyond simple attenuation, motivating the need for quantitative approaches capable of capturing such complexity.
Several studies have attempted to quantitatively analyze posterior acoustic shadowing using intensity-based statistics, probabilistic modeling, and texture analysis [
11,
12]. However, most existing approaches rely primarily on spatial-domain features, such as mean intensity, entropy, or gray-level co-occurrence matrix (GLCM)-based descriptors [
13]. These methods are inherently limited in capturing multi-scale structural variations, as ultrasound images exhibit frequency-dependent characteristics arising from the interaction of attenuation, scattering, and speckle [
14]. Moreover, many previous studies implicitly assume that posterior acoustic shadows are homogeneous regions, which neglects the presence of residual high-frequency components within the shadow. Importantly, these limitations indicate that posterior acoustic shadows cannot be fully characterized using spatial-domain features alone, as they inherently involve frequency-dependent structural variations. Therefore, an image-domain analysis framework is required that can separately quantify low-frequency components reflecting broad attenuation-related intensity variation and high-frequency detail components reflecting residual speckle, edge-like structures, and local heterogeneity within posterior acoustic shadow regions. In this study, these frequency components refer to spatial-frequency information extracted from B-mode images by wavelet decomposition, not to the transmitted ultrasound center frequency.
To address these limitations, this study proposes a wavelet-based quantitative framework for characterizing posterior acoustic shadow regions in ultrasound images. The discrete wavelet transform (DWT) provides a multi-resolution decomposition of the image into approximation (low-frequency) and detail (high-frequency) components, enabling simultaneous analysis of global intensity patterns and fine structural variations [
15]. In the context of ultrasound imaging, the approximation component primarily reflects the overall attenuation and brightness distribution, whereas the detail components capture edge information, speckle patterns, and high-frequency structural variations. Wavelet-based texture analysis has been widely used in medical image processing for capturing multi-scale structural information [
16]. By computing quantitative features such as total detail energy, total approximation energy, and their normalized ratios, the proposed method aims to quantify the relative contribution of high-frequency content within shadow regions. This approach allows for a more comprehensive representation of shadow characteristics compared to conventional intensity-based methods.
The novelty of this study does not lie in the development of a new wavelet transform or an ultrasound-specific wavelet basis. Rather, the contribution of this work is the acoustically interpretable application of wavelet energy distributions to posterior acoustic shadow regions, which remain primarily assessed by qualitative visual interpretation in routine ultrasound practice. By focusing on the internal frequency-domain structure of posterior shadows, this study investigates whether attenuation-related shadow patterns can be objectively quantified and related to expert-defined shadow confidence levels and anatomical stone location. Unlike previous approaches that primarily focus on shadow detection or segmentation [
17], this work emphasizes the quantitative characterization of shadow structure itself. The ultrasound data analyzed in this study were two-dimensional B-mode grayscale images. In these images, posterior acoustic shadowing is usually interpreted visually based on reduced brightness and morphological appearance. Wavelet-based quantification provides a multi-scale image-domain representation and allows broad attenuation-related intensity patterns and fine-scale structural components to be evaluated separately. Intensity-based descriptors, including ROI mean intensity, standard deviation, and entropy, were included as baseline spatial-domain features rather than as complete clinical diagnostic comparators. The purpose of this comparison was not to suggest that clinical ultrasound interpretation relies on mean intensity alone, but to evaluate whether simple global intensity statistics are sufficient to characterize posterior shadow structure compared with multi-scale wavelet energy descriptors. Ultimately, this framework has the potential to enhance diagnostic accuracy, reduce operator dependency, and contribute to the development of more robust computer-aided diagnosis systems in ultrasound imaging [
18].
2. Materials and Methods
2.1. Ultrasound Data Acquisition and Clinical Stratification
All ultrasound images were acquired using a clinical diagnostic ultrasound system (LOGIQ S7 R3 Expert, GE Healthcare, Chicago, IL, USA) equipped with a wide-band convex transducer (C1–5-D, bandwidth of 2–5 MHz). To ensure consistency and reproducibility across examinations, a standardized abdominal imaging protocol was applied throughout the study. The center frequency was set to approximately 3.5 MHz. The field of view was 69°, and the imaging depth ranged from approximately 10 to 14 cm depending on patient anatomy. All examinations were performed using a standardized abdominal preset to ensure consistency across acquisitions. To minimize variability, key imaging parameters including focal zone placement, overall gain, time gain compensation (TGC), and dynamic range were maintained as consistently as possible throughout all examinations. The overall gain was set to approximately 65–70%, and the dynamic range was approximately 60 dB. A consistent TGC profile was applied across all scans.
Ultrasound data were collected between 2022 and 2023 from patients with suspected kidney or gallbladder stones. The final image-level dataset consisted of 52 kidney stone ultrasound images and 66 gallbladder stone ultrasound images. All images were independently reviewed and verified by two physicians and three sonographers and were categorized into three expert-defined shadow confidence groups according to the degree of posterior acoustic shadowing: low confidence, corresponding to a 50–60% expected diagnostic probability; intermediate confidence, corresponding to a 60–80% expected diagnostic probability; and high confidence, corresponding to an expected diagnostic probability of >80%. The number of images in each group was as follows: kidney stones, low confidence
n = 14, intermediate confidence
n = 23, and high confidence
n = 15; gallbladder stones, low confidence
n = 10, intermediate confidence
n = 21, and high confidence
n = 35. These expert-defined confidence groups were used as reference categories for evaluating wavelet-based posterior acoustic shadow features [
19]. For gallbladder examinations, patients underwent routine fasting protocols to ensure adequate organ distension, while kidney imaging included both longitudinal and transverse scanning planes. Only frames in which both the echogenic focus and its corresponding posterior acoustic shadow were clearly visualized were selected for analysis. All images were independently reviewed by two physicians and three certified sonographers, each with more than 10 years of experience in abdominal ultrasonography. The reviewers confirmed the presence of stones and evaluated posterior acoustic shadow characteristics based on established clinical criteria. In routine clinical practice, posterior acoustic shadowing is a key sonographic feature of calcified structures, and its visual properties—such as intensity, continuity, and spatial extent—are commonly used as indirect indicators of stone composition and diagnostic certainty.
To systematically incorporate this clinical knowledge into the analysis framework, a shadow-based diagnostic confidence classification scheme was adopted. Rather than relying on model-derived probabilistic outputs, diagnostic confidence levels were defined based on expert visual assessment of posterior acoustic shadow characteristics. The classification criteria were defined based on the morphological and intensity characteristics of the posterior acoustic shadow region distal to the suspected stone. Low-confidence cases exhibited weak, discontinuous, or poorly defined attenuation patterns, often limited in axial extent and susceptible to speckle interference. Intermediate-confidence cases showed a continuous but partially attenuated shadow aligned with the echogenic focus, although its boundaries were not sharply defined. High-confidence cases demonstrated a well-defined, homogeneous hypoechoic region extending distally from the stone, with clear lateral boundaries and strong contrast relative to surrounding tissue. This qualitative grading scheme is conceptually consistent with conventional weak–moderate–strong shadow classifications and was mapped to structured confidence ranges to facilitate systematic evaluation. These expert-defined confidence labels were subsequently used as reference categories for evaluating the performance of the proposed automated framework.
In this study, wavelet-based quantification was applied exclusively to two-dimensional B-mode grayscale ultrasound images. No radiofrequency ultrasound data or other imaging modalities were included in the present analysis.
2.2. Wavelet-Based Quantification of Posterior Acoustic Shadow
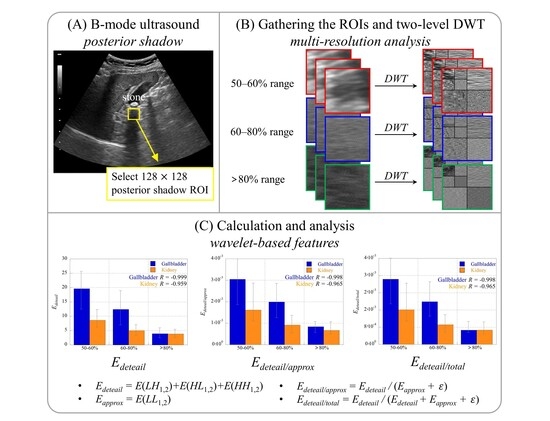
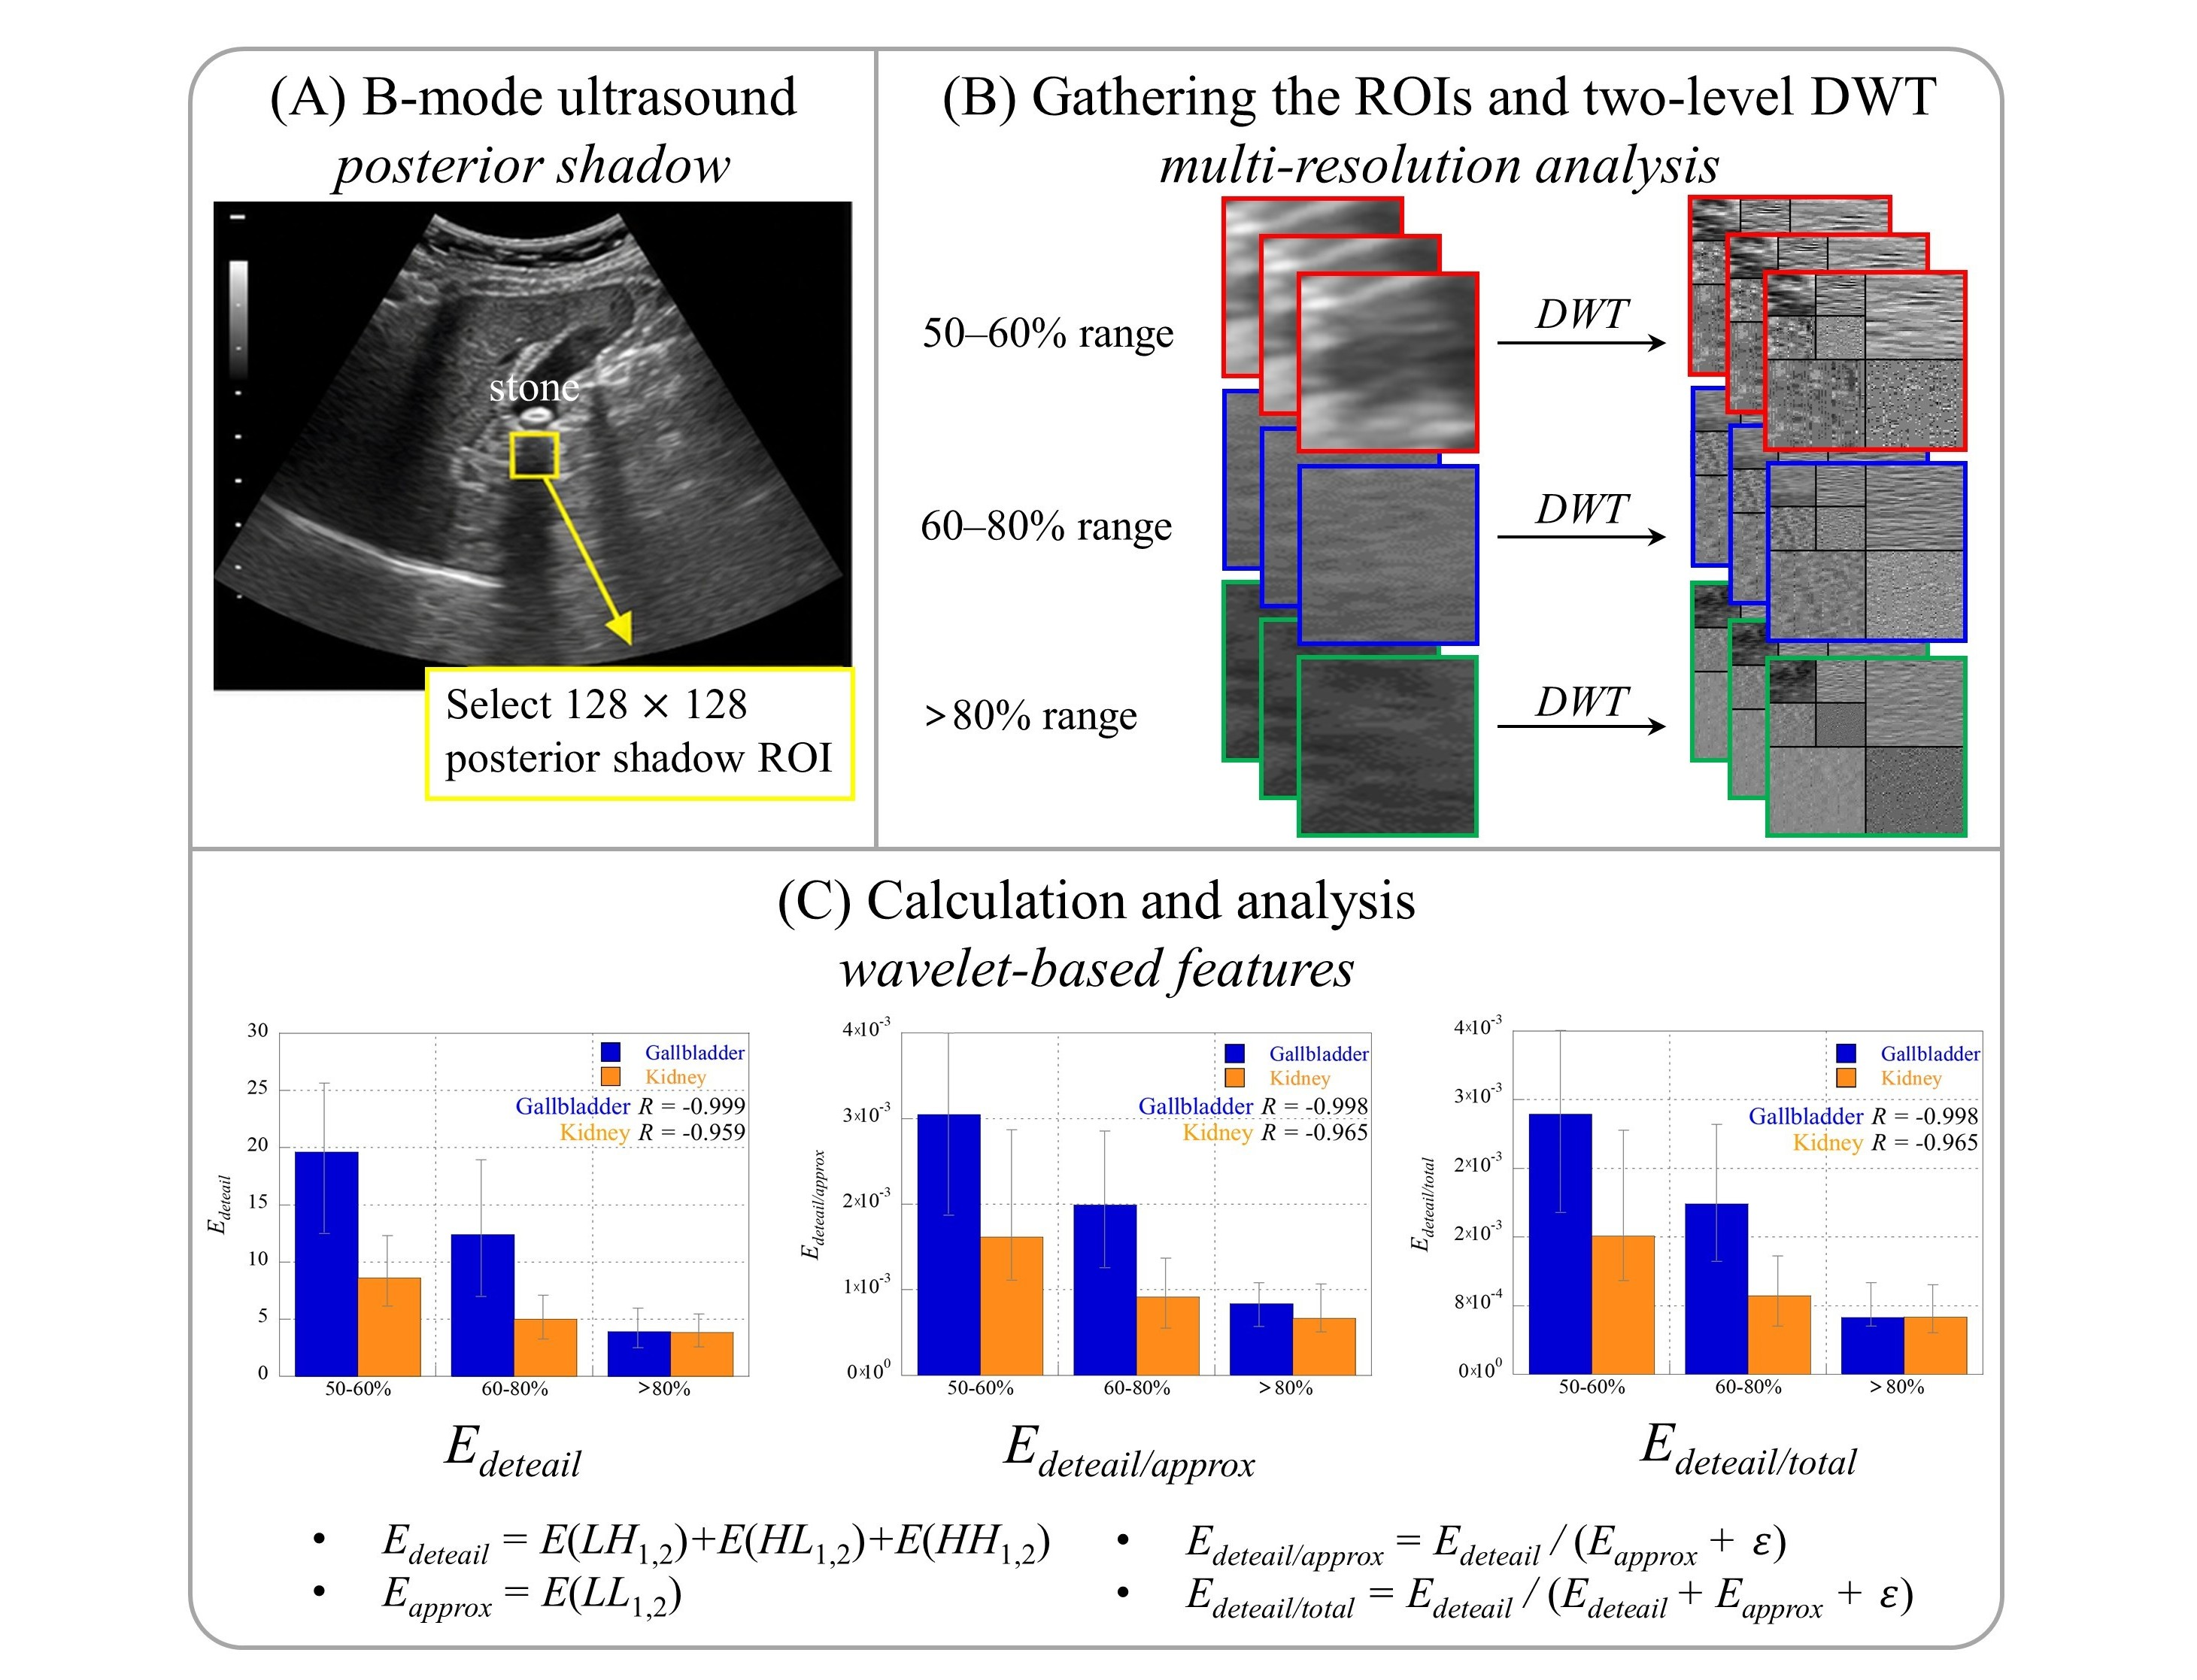
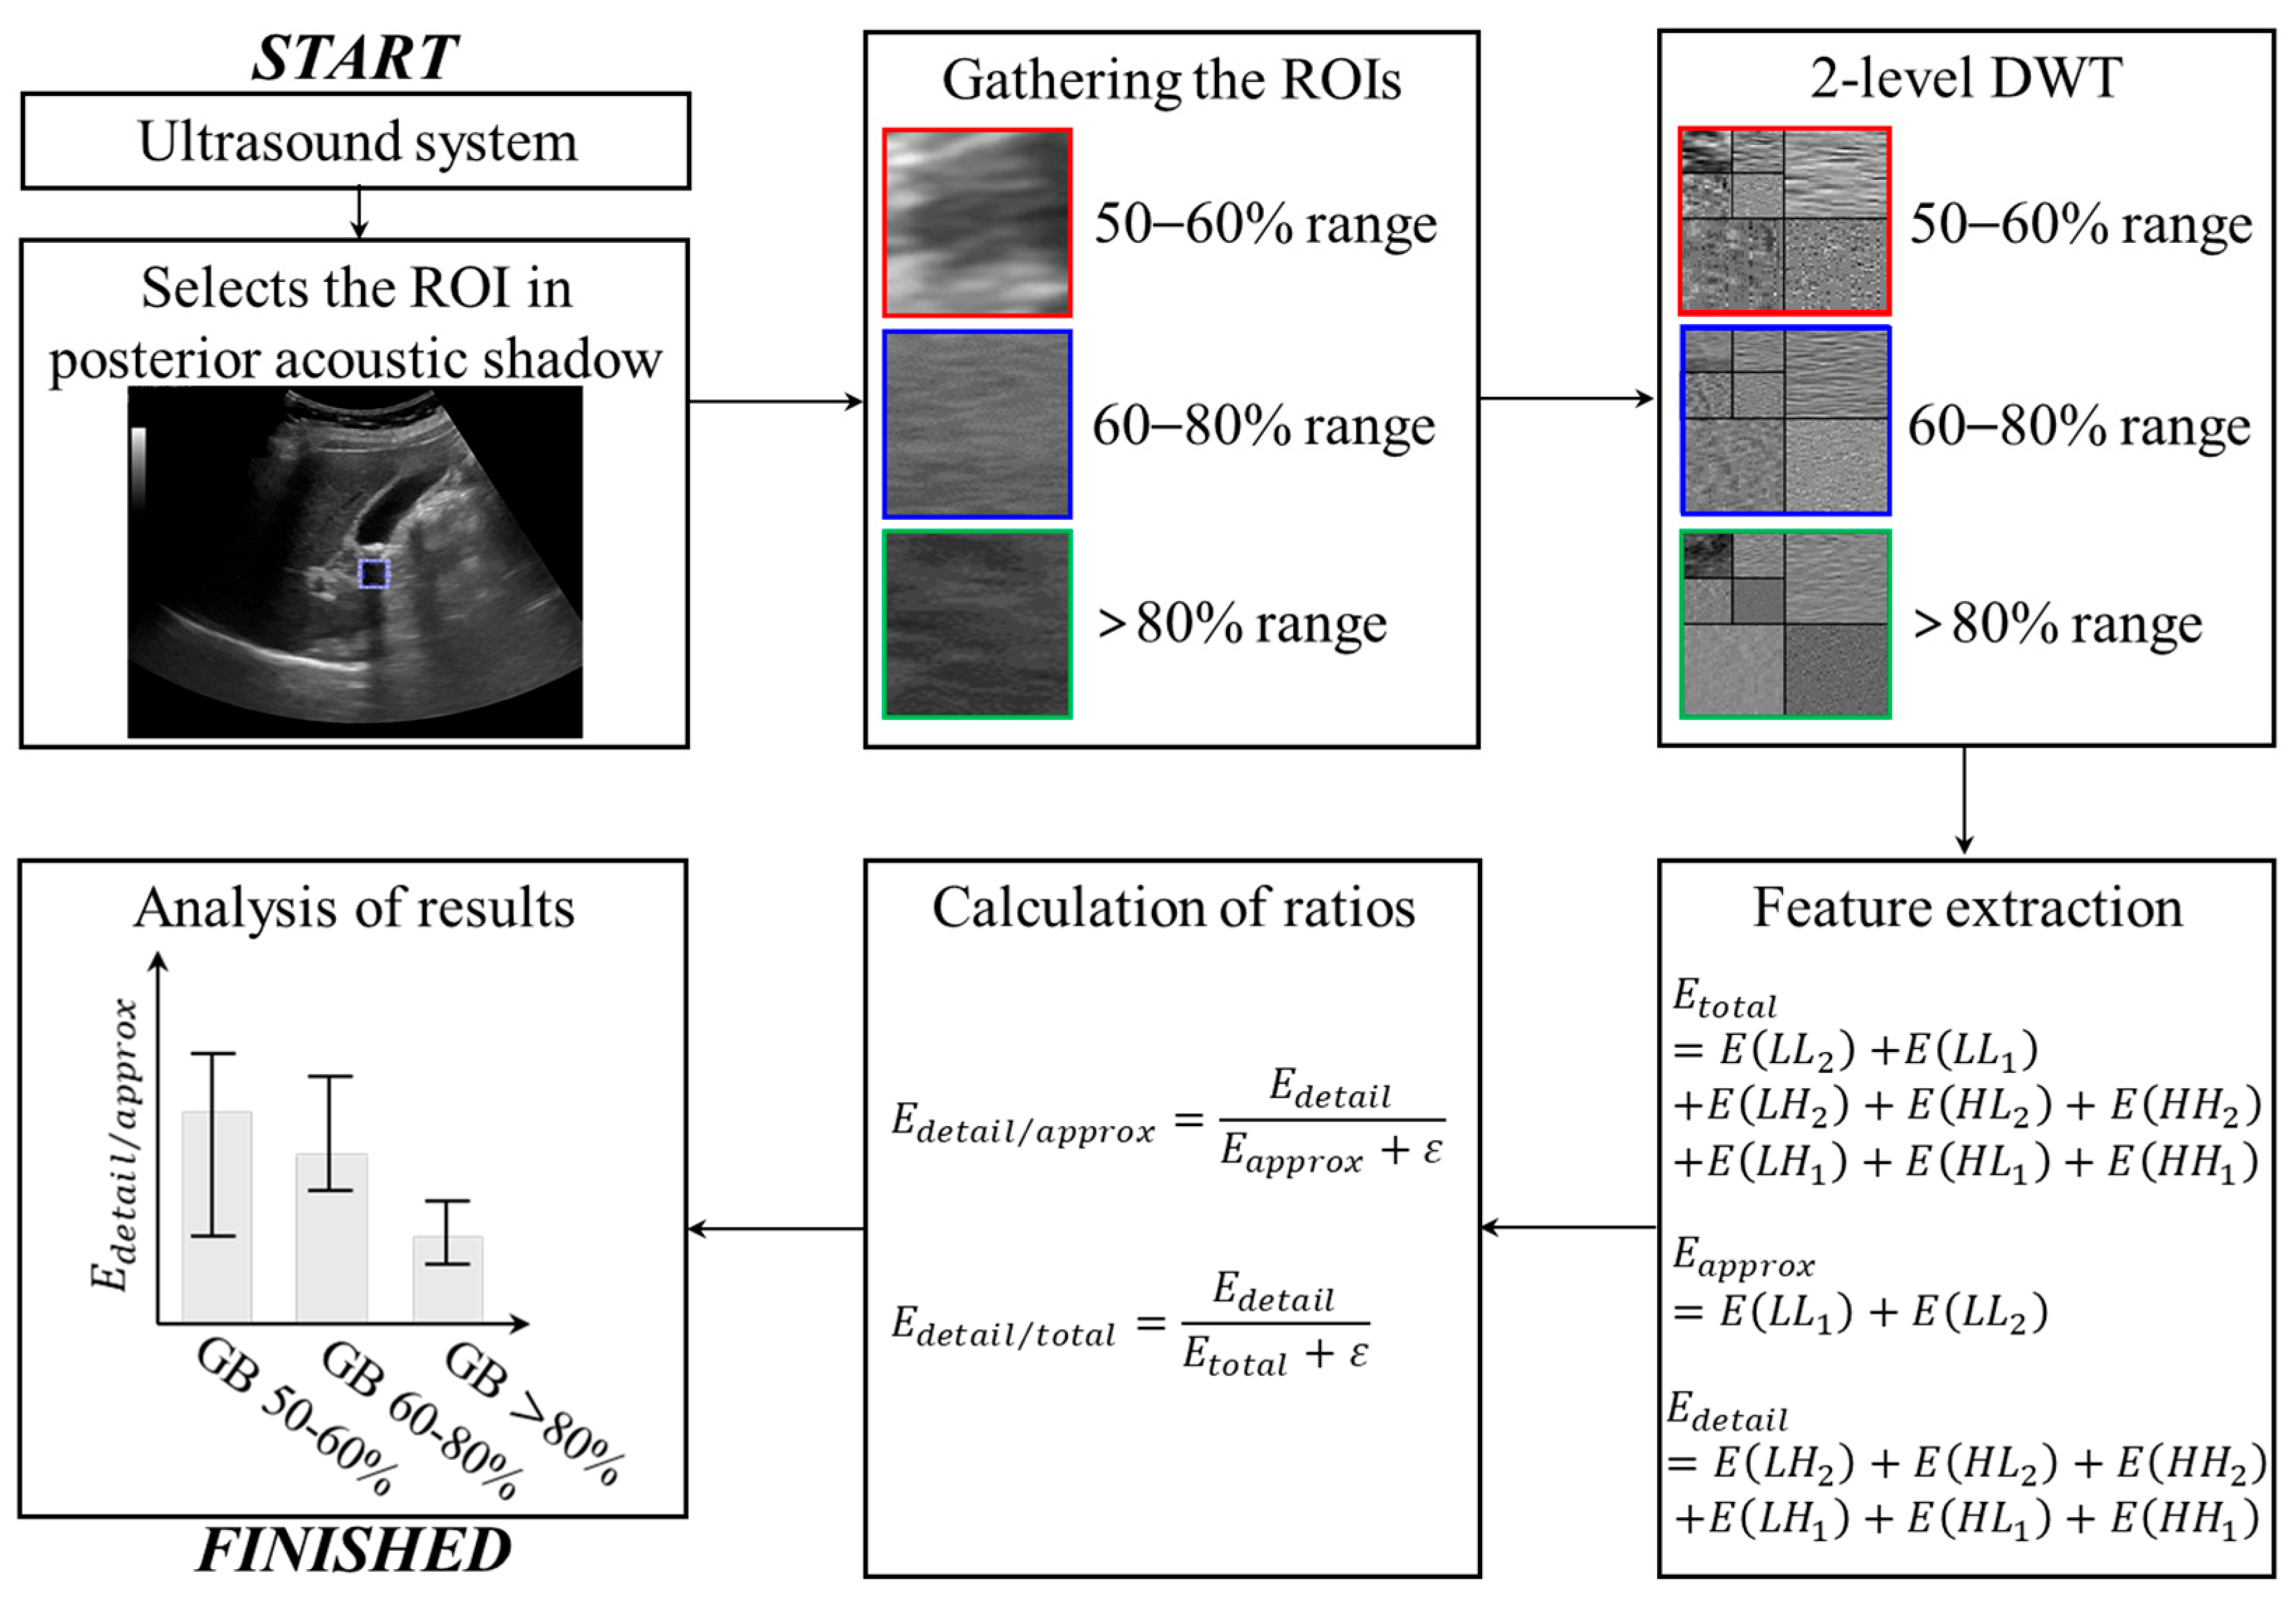
Figure 1 illustrates the proposed wavelet-based analysis framework and representative transformed image features. The framework consists of posterior acoustic shadow ROI selection from B-mode ultrasound images, ROI normalization, two-dimensional discrete wavelet transform, and extraction of wavelet-based and intensity-based quantitative features. To visually demonstrate the DWT process, representative B-mode shadow ROIs and their corresponding approximation and detail subband images were added. The approximation subband represents broad low-spatial-frequency intensity variation, whereas the detail subbands represent high-spatial-frequency components, including residual speckle, edge-like structures, and local heterogeneity within the posterior acoustic shadow region. After that, the rear shaded area is extracted (128 × 128 pixels) according to the determined region of interest (ROI) size. When ROI normalization was enabled, the extracted ROI was standardized by z-score normalization and then rescaled to the range of [0, 1]; otherwise, intensity values were directly normalized to [0, 1]. The ROI size was empirically selected by the research team to ensure consistency. To analyze the frequency characteristics of ROIs, a two-dimensional discrete wavelet transform (2D-DWT) was applied [
20]. A two-level 2D-DWT was performed using the Haar mother wavelet. The wavelet type, decomposition level, ROI size, and preprocessing procedure were fixed for all images to ensure comparability across groups. The 128 × 128 ROI was placed distal to the echogenic stone focus along the posterior acoustic shadow axis while avoiding adjacent anatomical boundaries whenever possible. In the present framework, the terms low-frequency and high-frequency refer to image-domain spatial-frequency components derived from the two-dimensional discrete wavelet transform, rather than to different transmitted ultrasound frequencies. The approximation subband represents broad, slowly varying intensity patterns within the posterior acoustic shadow region, whereas the detail subbands represent fine-scale spatial variations, including residual speckle, edge-like fluctuations, and local heterogeneity. These wavelet-derived spatial-frequency features were interpreted as indirect image-domain representations of acoustic shadow formation, including attenuation, scattering, and frequency-dependent suppression of residual signal components. The DWT decomposes an input image into subbands corresponding to different frequency components and spatial orientations. Given an input image
, the first-level 2D-DWT produces four subband images:
where
,
,
, and
are low-frequency component approximation, horizontal detail, vertical detail, and diagonal detail, respectively. Second-level 2D-DWT divides
of level 1 DWT back into
,
,
, and
.
Table 1 summarizes the meaning and representation of each component.
To quantify the distribution of frequency components, energy measures were computed for each subband. The energy of a subband
is defined as:
where
and
represent the dimensions of the subband. This formulation corresponds to the squared L
2-norm of the wavelet coefficients and is widely used as a measure of signal power in multi-resolution analysis [
21]. The total energy of the posterior acoustic shadow region was computed as:
This metric represents the overall signal power within the analyzed region and serves as a normalization reference for subsequent feature calculations. The approximation energy, corresponding to the low-frequency component of the image, was defined as:
The
subband captures large-scale intensity variations and slowly varying structures. In the context of ultrasound imaging, this component reflects the baseline intensity distribution and residual signal after attenuation. From a physical perspective, strong acoustic attenuation tends to suppress high-frequency components, resulting in a relative increase in the proportion of low-frequency energy. The detail energy was defined as the combined energy of high-frequency subbands:
These components capture fine-scale variations such as edges, speckle patterns, and local intensity fluctuations. In posterior acoustic shadow regions, high-frequency components are expected to be attenuated due to the frequency-dependent absorption and scattering of ultrasound waves. To quantify the relative dominance of high-frequency versus low-frequency components, the following ratio was defined:
where
is a small constant introduced to avoid numerical instability during division. These parameters provide an overall index of how much of the signal content within the posterior acoustic shadow is concentrated in higher-frequency detail components relative to lower-frequency or total components. In highly homogeneous and acoustically attenuated shadow regions, these ratios are expected to decrease because high-frequency information is progressively suppressed. Conversely, increased ratios may reflect more heterogeneous internal patterns or incomplete frequency attenuation. Both
and
were evaluated to quantify the relative contribution of high-frequency components. While these two measures are mathematically related and exhibited similar trends in this study, they differ in normalization:
reflects the ratio of detail to low-frequency components, whereas
represents the proportion of detail energy within the total signal. Equations describing the 2D-DWT decomposition and subband energy calculation were based on established wavelet theory and conventional signal energy definitions. In contrast, the derived features used in this study, including total detail energy and normalized detail-energy ratios, were formulated to quantify the relative contribution of high-frequency components within posterior acoustic shadow regions.
Based on the descriptions above, the proposed framework was implemented using a normal workstation (OS: Windows 10, CPU: AMD Ryzen 7 3700X, RAM: 256 GB, CPU clocked at 2.13 GHz) and MATLAB software (R2023a, MathWorks, Natick, MA, USA). Computational efficiency was evaluated by measuring the average processing time required for one 128 × 128 ROI, including ROI normalization, two-level 2D-DWT, and feature calculation. The average processing time was approximately 0.2 s per ROI on a standard workstation, indicating that the proposed feature extraction process is computationally lightweight.
2.3. Statistical Analysis
All quantitative results are presented as mean ± standard deviation. For visualization purposes, error bars in figures represent the standard error of the mean. To evaluate differences between gallbladder stone and kidney stone groups at each concentration range, Welch’s two-sample
t-test was employed [
22]. This test was selected to account for unequal sample sizes and potential heteroscedasticity between groups. To assess differences across probability ranges (50–60%, 60–80%, and >80%) within each group, one-way analysis of variance (ANOVA) was performed [
23]. When significant differences were identified, post-hoc pairwise comparisons were conducted using Welch’s
t-test with Holm correction to control for multiple comparisons [
24]. All statistical tests were two-tailed, and a
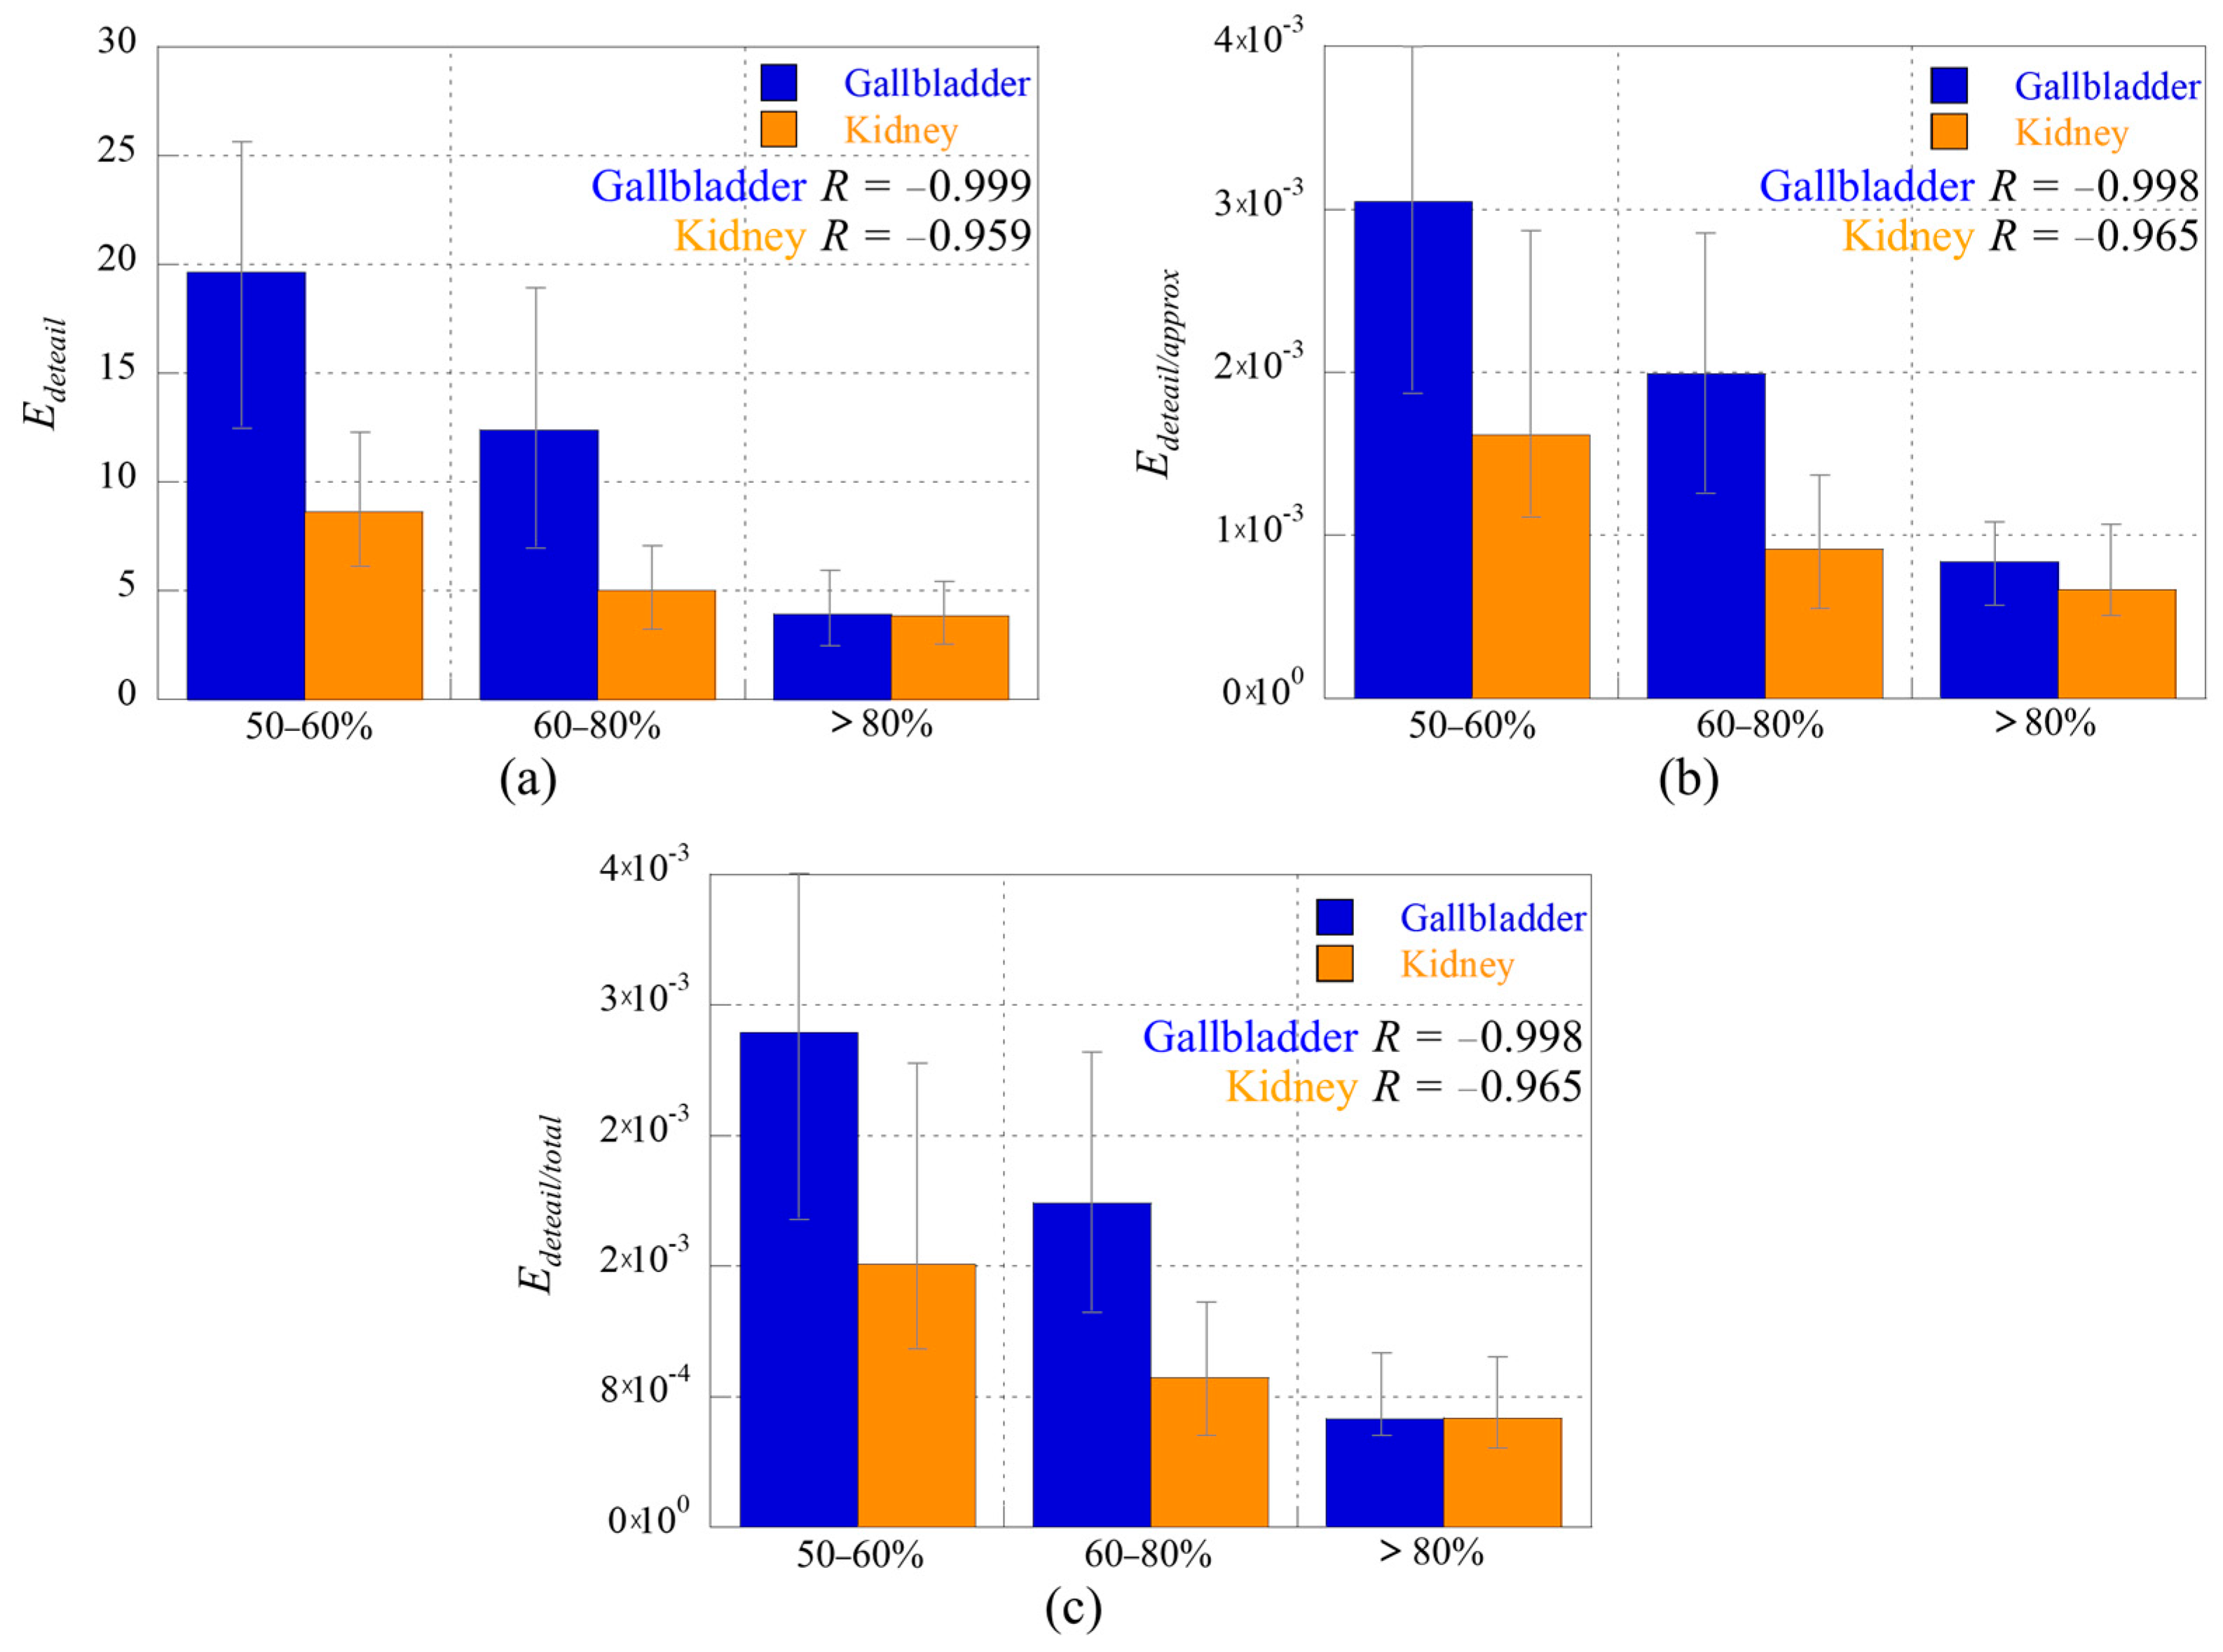
p-value < 0.05 was considered statistically significant. To evaluate monotonic trends across expert-defined shadow confidence groups, correlation analysis was additionally performed. Pearson correlation coefficients were calculated between the ordinal confidence scores and group-level mean feature values. This analysis was used to quantitatively support the visual trends observed in
Figure 2,
Figure 3 and
Figure 4.
3. Results
3.1. Wavelet-Based Feature Variation
Quantitative analysis of posterior acoustic shadow regions revealed statistically significant and consistent changes in wavelet-based features across shadow confidence levels in both gallbladder stone and kidney stone groups.
Figure 2 presents the bargraphs in the gallbladder and kidney stone: (a)
, (b)
, and (c)
.
In the gallbladder stone group. decreased progressively from 19.64 ± 7.21 in the 50–60% range to 12.38 ± 5.66 in the 60–80% range and 3.91 ± 1.72 in the >80% range, corresponding to an overall reduction of approximately 80.1% between the lowest and highest shadow confidence levels. Similarly, the normalized high-frequency indices decreased monotonically, with decreasing from 0.003044 ± 0.00121 to 0.001990 ± 0.00084 and further to 0.000663 ± 0.00029, representing a reduction of approximately 78.2%. The corresponding values for were 0.003030 ± 0.00120, 0.001984 ± 0.00083, and 0.000662 ± 0.00029, indicating a comparable reduction of approximately 78.1%. One-way ANOVA confirmed statistically significant differences across shadow confidence levels for (F = 8.064, p = 0.000802), (F = 6.008, p = 0.004217), and (F = 6.041, p = 0.004106). Post-hoc analysis demonstrated that the >80% group showed significantly lower values compared to both the 50–60% and 60–80% groups, whereas the difference between 50–60% and 60–80% was moderate but consistent.
In the kidney stone group, a similar decreasing trend was observed, although the magnitude of change was smaller than in the gallbladder stone group. decreased from 8.62 ± 3.11 (50–60%) to 4.99 ± 2.05 (60–80%) and 3.82 ± 1.64 (>80%), corresponding to an overall reduction of approximately 55.7%. The normalized ratios also decreased, with declining from 0.001617 ± 0.00058 to 0.000917 ± 0.00039 and 0.000666 ± 0.00028, representing a reduction of approximately 58.8%. Similarly, decreased from 0.001614 ± 0.00058 to 0.000916 ± 0.00039 and 0.000666 ± 0.00028. One-way ANOVA demonstrated statistically significant differences across shadow confidence levels for (F = 7.595, p = 0.002416), (F = 8.241, p = 0.001608), and (F = 8.241, p = 0.001608). Post-hoc comparisons indicated that the most significant decrease occurred between the 50–60% and higher concentration groups, whereas differences between 60–80% and >80% were smaller. To further quantify the monotonic trend across expert-defined shadow confidence groups, correlation analysis was performed using group-level mean values. For total detail energy, a strong negative correlation was observed with increasing shadow confidence in both gallbladder and kidney stone groups, with correlation coefficients of R = −0.999 and R = −0.959, respectively. Similar negative correlations were observed for the detail-to-approximation energy ratio, with R = −0.998 for gallbladder stones and R = −0.965 for kidney stones, and for the detail-to-total energy ratio, with R = −0.998 and R = −0.965, respectively. These results quantitatively support the decreasing trend of wavelet-based high-spatial-frequency features with increasing posterior shadow confidence.
3.2. Between-Group Comparison of Wavelet Features
Two-group comparisons demonstrated distinct differences between gallbladder stone and kidney stone groups in
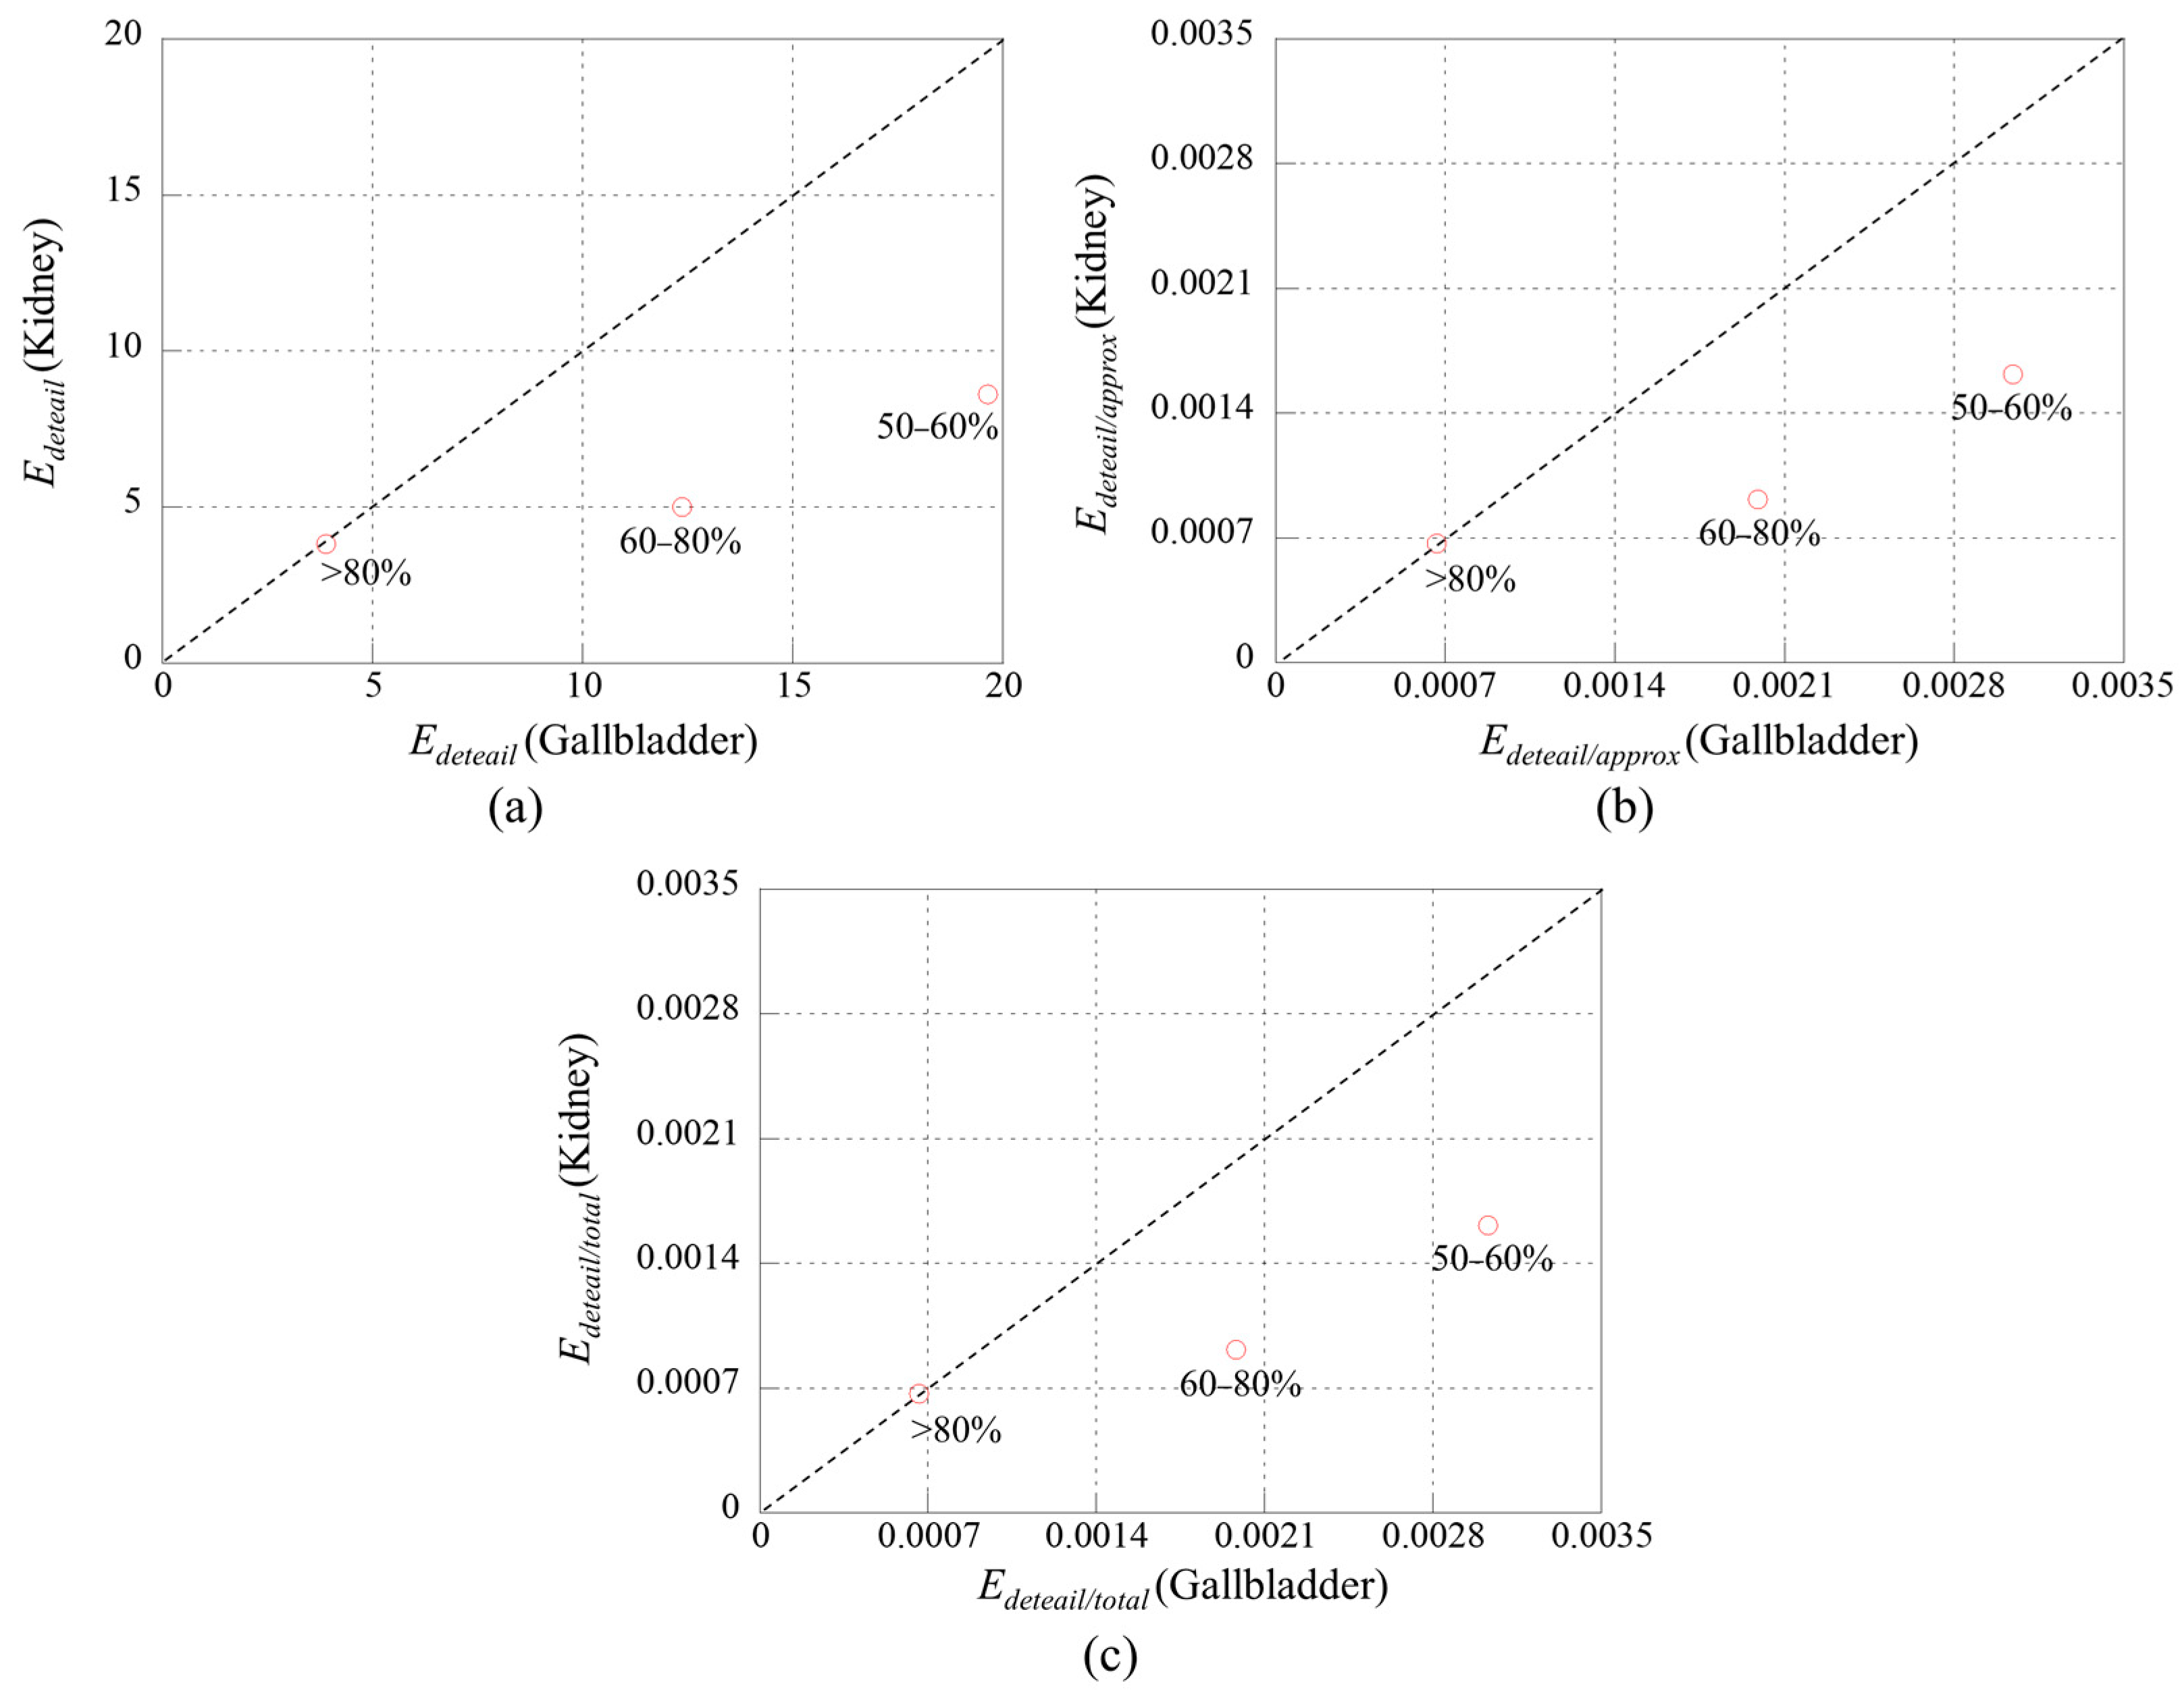
Figure 3.
As shown in
Figure 3a,
in the gallbladder group were consistently higher than those in the kidney group at 50–60% and 60–80%, corresponding to approximately 2.28-fold and 2.48-fold increases, respectively. However, at >80%, the values converged, showing less than 2.4% difference between the two groups. A similar pattern was observed for the ratio-based features. In both
and
in
Figure 3a–c, the gallbladder group exhibited higher values at 50–60% and 60–80%, whereas the differences progressively decreased with increasing concentration and became negligible at >80%. Notably, the scatter plots show that all data points are located below the identity line, indicating that wavelet-based features were consistently higher in the gallbladder group than in the kidney group at lower concentrations. At higher concentrations, the data points approach the identity line, demonstrating convergence of feature values between the two groups. Overall, these results indicate that while significant between-group differences exist under lower attenuation conditions, the wavelet-based characteristics of posterior acoustic shadow regions become increasingly similar as attenuation increases.
3.3. Intensity-Based Features
In addition to wavelet-based features, intensity-based descriptors, including ROI mean intensity, standard deviation, and entropy, were quantitatively analyzed. While energy-based features were used to quantify the magnitude of frequency components, entropy was introduced as a complementary measure to characterize the complexity of intensity distribution within the posterior acoustic shadow region. Unlike energy-based features, which directly reflect signal magnitude, entropy captures the statistical distribution of intensity values. Therefore, entropy was used as a supplementary descriptor rather than a primary physical indicator.
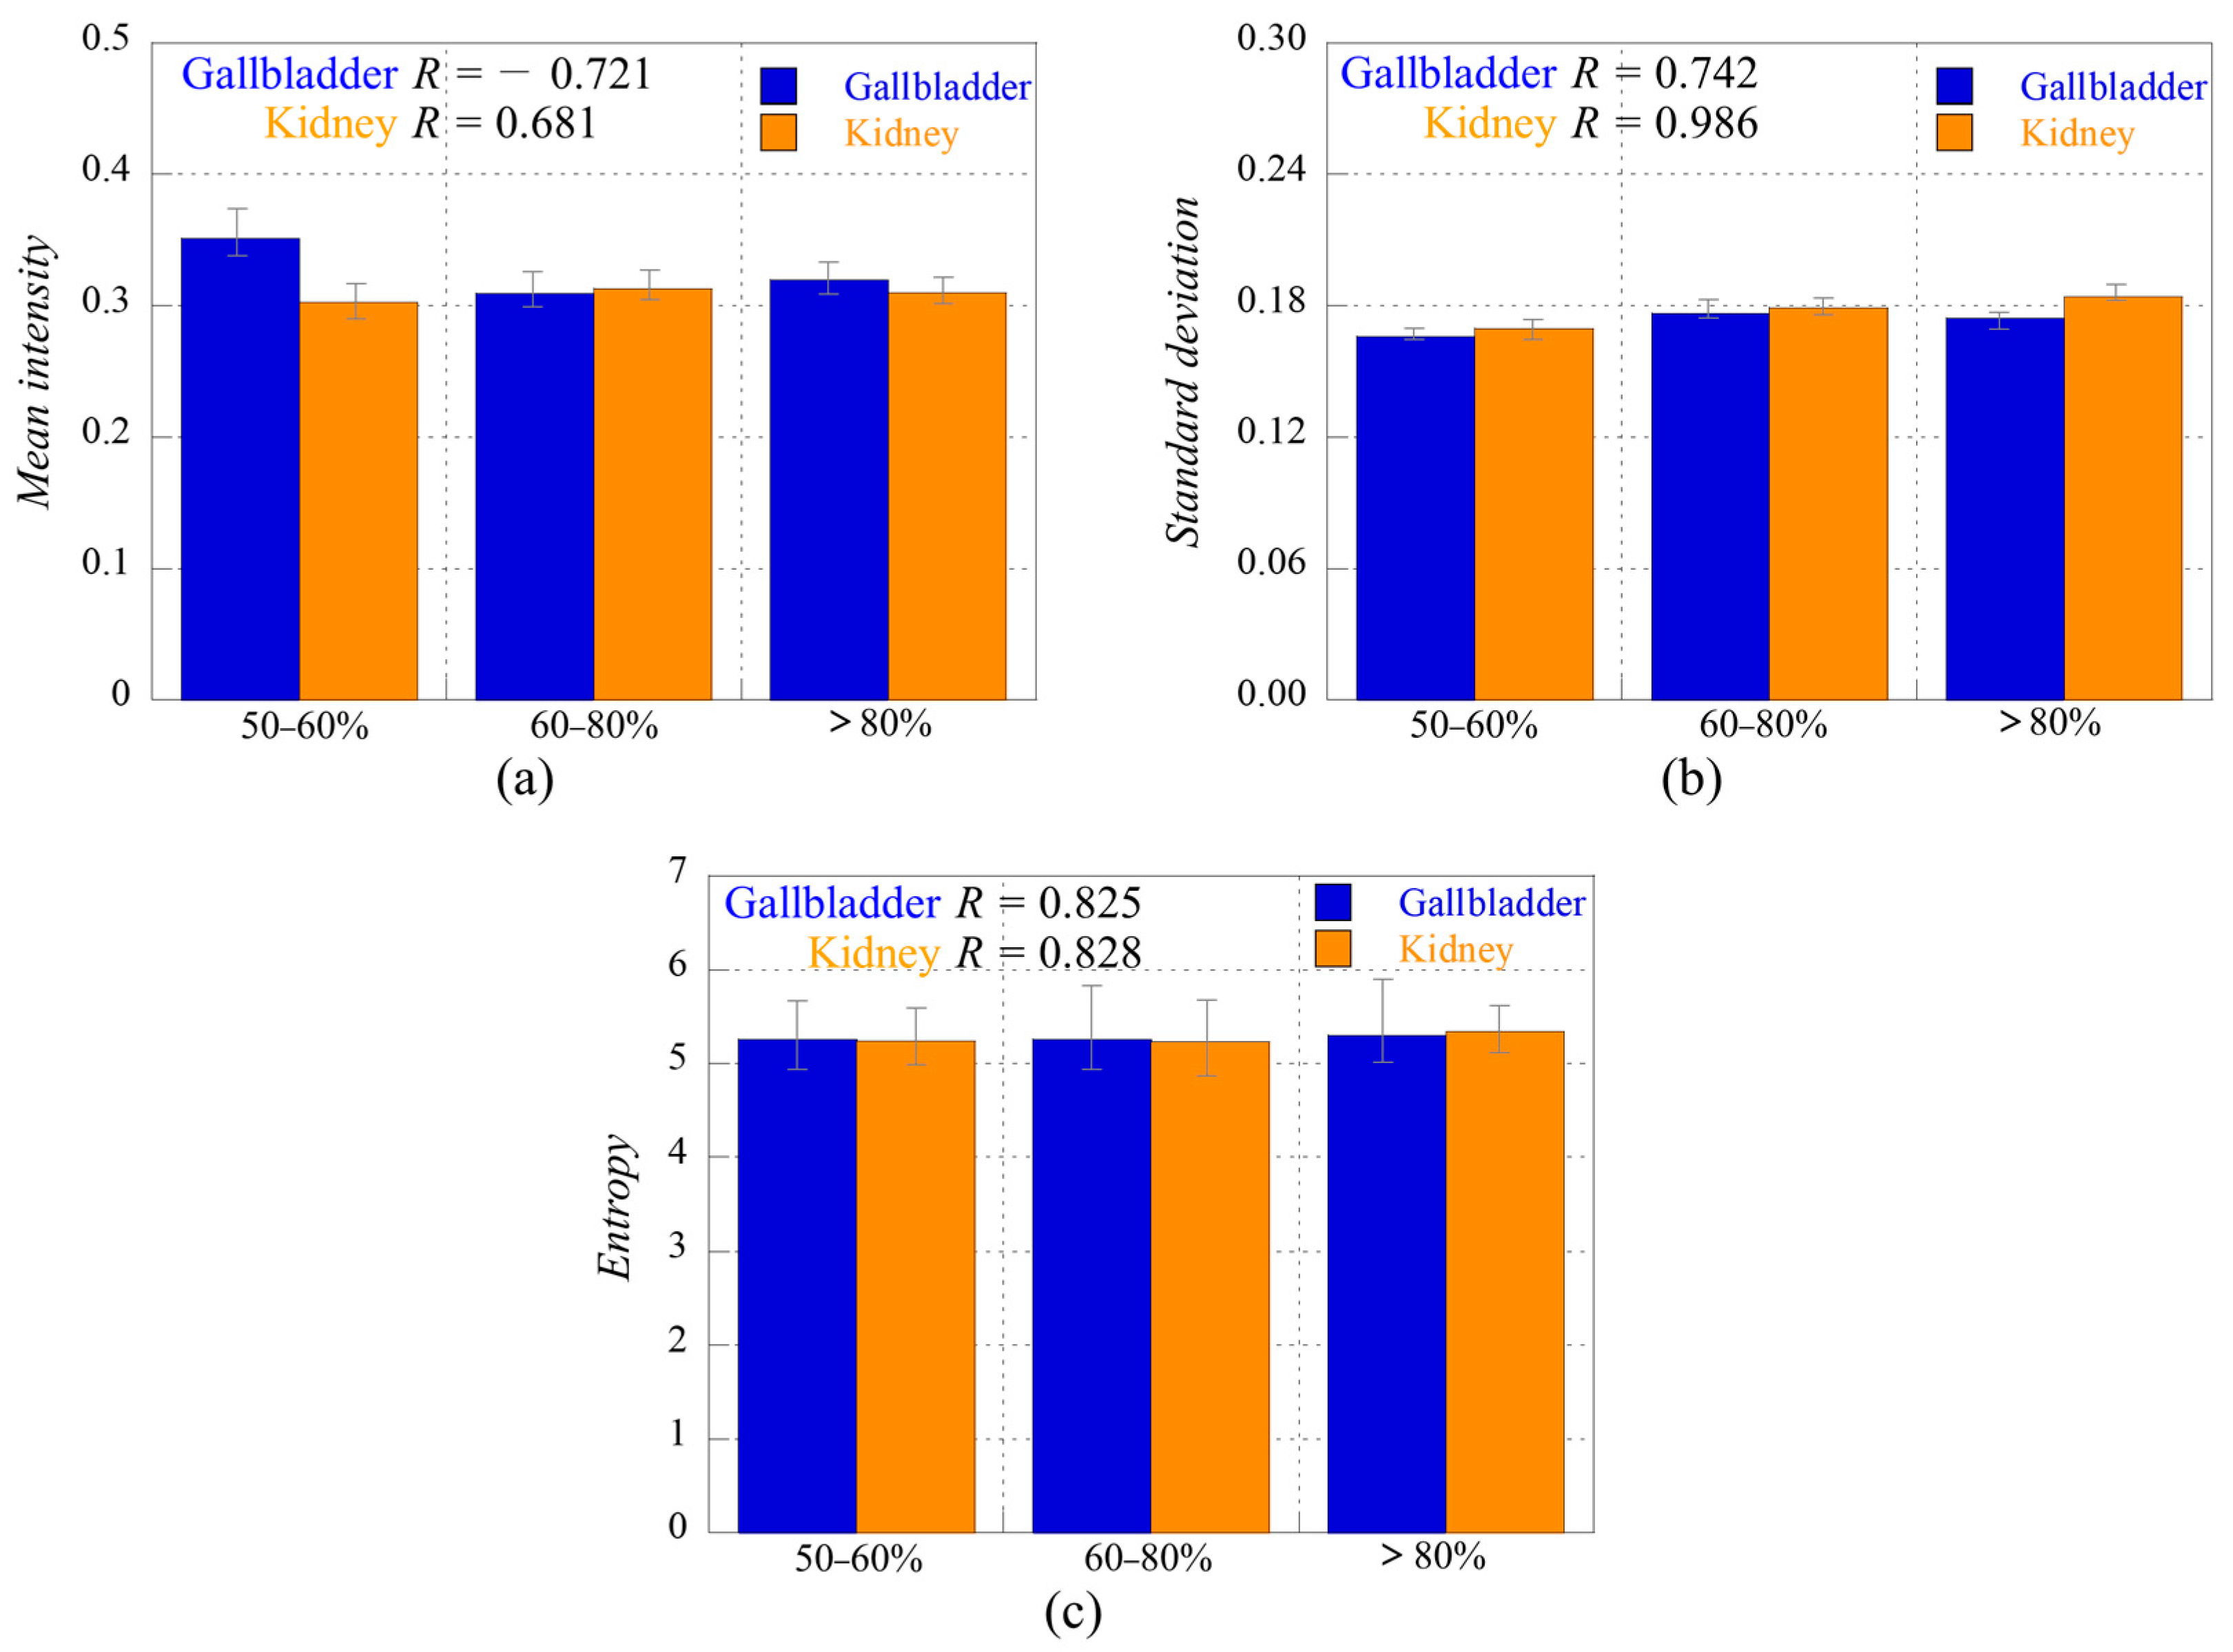
Figure 4 shows the intensity-based bar graph of features including (a) mean, (b) standard deviation, and (c) entropy in the gallbladder and kidney stone groups. In the gallbladder stone group, ROI mean intensity showed a decreasing trend from 0.3509 ± 0.0841 (50–60%) to 0.3095 ± 0.0699 (60–80%), followed by a slight increase to 0.3198 ± 0.0736 (>80%). ROI standard deviation remained relatively stable across shadow confidence levels, with values of 0.1658 ± 0.0267, 0.1767 ± 0.0355, and 0.1743 ± 0.0249, indicating minimal variation in intensity dispersion. ROI entropy exhibited negligible changes, with values of 5.2598 ± 0.2752, 5.2559 ± 0.4104, and 5.3015 ± 0.3257, suggesting that the overall intensity distribution remained largely unchanged. In the kidney stone group, ROI mean intensity showed a slight increase from 0.3026 ± 0.0599 (50–60%) to 0.3132 ± 0.0688 (60–80%), followed by a minor decrease to 0.3100 ± 0.0348 (>80%). ROI standard deviation values were 0.1697 ± 0.0271, 0.1791 ± 0.0261, and 0.1842 ± 0.0246, indicating a small increase in intensity variability with concentration. ROI entropy values were 5.2402 ± 0.2284, 5.2316 ± 0.2540, and 5.3393 ± 0.2052, showing no consistent monotonic trend.
Overall, intensity-based features exhibited minimal variation across shadow confidence levels and between groups, in contrast to wavelet-based features, which showed reductions of approximately 55–80% depending on the feature. These findings indicate that intensity-based descriptors have limited sensitivity for characterizing posterior acoustic shadow regions. Correlation analysis of intensity-based descriptors showed weaker or less consistent patterns than wavelet-based features. ROI mean intensity showed inconsistent correlation directions between gallbladder and kidney stone groups, with R = −0.721 and R = 0.681, respectively. ROI standard deviation showed positive correlations of R = 0.742 in the gallbladder group and R = 0.986 in the kidney group; however, the absolute changes were small. ROI entropy also showed positive correlations of R = 0.825 and R = 0.828, respectively, but remained within a narrow numerical range. These results indicate that intensity-based descriptors showed smaller and less interpretable changes than wavelet-based energy features.
4. Discussion
The present study demonstrates that posterior acoustic shadow regions contain quantifiable frequency-domain characteristics that can be interpreted in relation to the acoustic mechanisms of shadow formation. Posterior shadowing behind stones is produced by a combination of acoustic impedance mismatch, reflection, absorption, scattering, and frequency-dependent attenuation. At the stone–tissue interface, impedance mismatch causes a substantial portion of the incident ultrasound energy to be reflected. The remaining transmitted wave is further reduced by absorption and scattering, particularly when the stone has an irregular surface or heterogeneous internal structure. As a result, the region distal to the stone receives reduced acoustic energy and appears hypoechoic on B-mode ultrasound. The observed decrease in wavelet-based detail energy with increasing shadow confidence is consistent with this physical process, because high-frequency components are more strongly affected by attenuation and scattering than low-frequency components. A key finding of this study is the substantial decrease in wavelet-based detail features across shadow confidence levels.
decreased by approximately 80% in the gallbladder stone group and 55–60% in the kidney stone group, indicating progressive suppression of high-frequency components under increasing attenuation. This behavior is consistent with the physical principles of ultrasound propagation, where higher-frequency components are more susceptible to absorption and scattering, resulting in smoother and more homogeneous shadow regions. The reduction in wavelet detail energy should therefore be interpreted in the context of image-domain spatial-frequency analysis rather than as a direct measurement of transmitted ultrasound frequency components. Stronger posterior acoustic shadowing reduces residual backscattered and scattered signals distal to the stone, which can suppress fine-scale speckle-like and edge-like variations in the B-mode image. Consequently, the high-spatial-frequency detail subbands show reduced energy, whereas low-spatial-frequency approximation components become relatively dominant. This interpretation clarifies that the proposed framework does not exploit different ultrasound transmission frequencies, but instead quantifies spatial-frequency patterns embedded in B-mode images after acoustic shadow formation. In addition to within-group changes, clear differences between gallbladder and kidney groups were observed at lower shadow confidence levels. At 50–60% and 60–80%, the gallbladder group exhibited significantly higher wavelet-based features than the kidney group, with approximately 2.3–2.5-fold differences in
. However, these differences progressively decreased with increasing concentration, and at 80–100%, both groups converged to nearly identical values. This convergence suggests that under strong attenuation conditions, posterior acoustic shadow regions become dominated by low-frequency components, reducing the influence of underlying structural differences between stone types. The scatter plots in
Figure 3 further support this interpretation by illustrating the progressive approach of data points toward the identity line, indicating diminishing inter-group differences. This behavior highlights an important characteristic of posterior acoustic shadowing: while structural and compositional differences may be detectable under moderate attenuation, they become increasingly indistinguishable as attenuation strengthens.
Another important aspect of this study is the comparison between wavelet-based and intensity-based features. Although ROI mean, standard deviation, and entropy were analyzed, these intensity-based descriptors showed only minimal variation across shadow confidence levels. For example, ROI entropy remained within a narrow range (~5.23–5.34) for all conditions, and ROI mean values exhibited only minor fluctuations (~0.30–0.35). In contrast, wavelet-based features demonstrated large relative changes and strong statistical significance. This discrepancy indicates that intensity-based features are insufficient for capturing attenuation-induced structural changes in posterior acoustic shadow regions. From a physical perspective, attenuation primarily affects signal magnitude and frequency content rather than the overall distribution shape of intensity values. This explains why entropy remained relatively stable despite substantial reductions in wavelet-based energy features. Therefore, frequency-domain analysis provides a more sensitive and physically meaningful representation of shadow characteristics. It is also noteworthy that the two ratio-based features, and , exhibited nearly identical trends throughout the analysis. This is expected, as both metrics are mathematically related and reflect the relative contribution of high-frequency components. Given that detail energy was significantly smaller than approximation energy in posterior acoustic shadow regions, both ratios effectively describe the dominance of low-frequency components. This redundancy suggests that a single normalized ratio may be sufficient for practical applications without loss of interpretability.
Despite these promising findings, several limitations should be acknowledged. First, the proposed method relied on manually selected ROIs, which may introduce observer-dependent variability [
25,
26]. In ultrasound imaging, the boundaries of posterior acoustic shadow regions are often indistinct because of speckle noise, beam-related artifacts, heterogeneous surrounding tissues, and gradual signal attenuation. Therefore, ROI placement may vary according to the operator’s experience, interpretation of the shadow boundary, and selection criteria. Such variability can directly influence extracted wavelet features, particularly detail-energy components that are sensitive to local high-spatial-frequency patterns. This limitation is consistent with previous studies showing that ROI definition and ultrasound image preprocessing can significantly affect quantitative feature extraction and downstream interpretation [
25,
26]. Future studies should therefore incorporate automated or semi-automated shadow segmentation methods and evaluate inter- and intra-observer reproducibility.
Second, the inherent variability and limited standardization of ultrasound imaging may affect the robustness of both intensity-based and wavelet-based features. Unlike CT attenuation values, B-mode ultrasound intensities are not physically standardized and may vary depending on probe frequency, transmit power, gain, time-gain compensation, dynamic range, focal zone, imaging depth, beam angle, and vendor-specific image processing. Although acquisition parameters were kept as consistent as possible in this study, even subtle differences in imaging conditions can alter speckle patterns, local contrast, and apparent shadow morphology. Consequently, the extracted wavelet energy distributions should be interpreted as image-domain descriptors rather than direct physical measurements of acoustic attenuation or impedance. Previous ultrasound radiomics studies have similarly reported that feature stability is strongly influenced by acquisition settings and preprocessing methods [
27], highlighting a key challenge for quantitative ultrasound analysis.
Third, this study did not propose a new wavelet basis or an ultrasound-specific wavelet transform. A standard DWT-based framework was used to investigate whether posterior acoustic shadow regions contain acoustically interpretable spatial-frequency information. Therefore, the contribution of this study should not be interpreted as a new signal-processing theory, but rather as an application-specific quantitative characterization of posterior acoustic shadow patterns. In addition, the comparison with intensity-based descriptors was limited to basic spatial-domain features, including ROI mean intensity, standard deviation, and entropy. These descriptors were included as baseline quantitative features and do not represent the full range of clinical ultrasound interpretation or advanced computational ultrasound analysis. Future work should include broader comparisons with GLCM-based texture features, local binary patterns, attenuation-related parameters, radiomics features, model-based quantitative ultrasound parameters, and machine-learning-derived representations.
Fourth, the expert-defined shadow confidence groups used in this study were based on visual assessment of posterior acoustic shadow characteristics rather than direct measurements of stone composition, acoustic impedance, surface roughness, scattering coefficient, or attenuation coefficient. Therefore, the observed differences between gallbladder and kidney stone groups should not be interpreted as definitive evidence of composition-specific acoustic signatures. Instead, these findings should be considered as stone-location-associated posterior shadow patterns reflected in B-mode image-domain wavelet energy distributions. To establish a stronger acoustic basis, future studies should combine clinical ultrasound images with controlled phantom experiments, CT-based stone characterization, ex vivo acoustic measurements, or reference standards that directly quantify stone-specific acoustic properties.
Finally, the proposed method was evaluated on a relatively limited dataset and under specific imaging conditions, which may restrict its generalizability. In ultrasound-based analysis, model performance and feature behavior can vary depending on anatomical region, patient variability, and imaging protocols [
28]. In addition, although this study focused on wavelet-based features and basic intensity-based descriptors, future work should include broader comparison with additional quantitative ultrasound features, including GLCM-based texture features, local binary patterns, attenuation-related parameters, radiomics features, and machine-learning-derived representations. Furthermore, small sample sizes can limit statistical power and reduce the robustness of observed trends. Similar limitations have been reported in ultrasound-based machine learning and quantitative analysis studies, where dataset size and diversity are critical factors affecting generalization and clinical applicability. Future validation using larger multi-center datasets, multiple ultrasound systems, standardized acquisition protocols, and independent external test cohorts is required before the proposed framework can be considered for clinical translation.