


Abstract
High-temperature equipment in the petrochemical industry can develop multiple forms of damage during long-term service, with corrosion often accounting for a relatively high proportion. The presence of other damage forms complicates corrosion identification and equipment condition assessment. Accurate discrimination among damage types, followed by damage-severity prediction, is important for corrosion-risk screening and identifying equipment requiring priority inspection. Engineering inspection data commonly exhibit class imbalance, while damage severity has an inherent ordinal structure. These characteristics pose challenges to conventional classification models. Based on 660 operating and inspection records from high-temperature equipment, a mechanism–data fusion framework was developed for damage-type classification and damage-severity prediction. Mechanism-informed features describing damage evolution and data-driven risk encodings derived from the inspection records were used as model inputs. These two sources of information were further combined to form a comprehensive damage-driving index. Class imbalance was addressed through partial random over-sampling within each training fold to reduce the influence of uneven sample distributions. For damage-severity prediction, a cumulative ordinal neural network was employed together with a mechanism-consistency constraint guided by a label-independent physical trend index. Model performance was evaluated using stratified five-fold cross-validation, and ablation experiments were conducted to examine the contribution of individual modules. Benchmark comparisons and sensitivity analyses further assessed model performance and stability. With all components included, the mean accuracies for damage-type classification and damage-severity prediction reached 92.58% and 93.94%, respectively. Under the same data splits, both task-specific models outperformed their corresponding baseline methods, and the damage-severity model also performed better than the dedicated ordinal classifier. These findings indicate that the proposed framework can maintain reliable corrosion-identification performance across records containing multiple damage types and provide quantitative support for corrosion-risk screening and subsequent engineering assessment of high-temperature equipment.
1. Introduction
In the petrochemical industry, process equipment can develop multiple forms of damage during long-term service. In high-temperature equipment, corrosion often accounts for a relatively high proportion of the damage and therefore requires particular attention in equipment condition assessment. Other damage types are also identified during field inspections. Under these service conditions, elevated temperatures can accelerate oxidation and material degradation [1], while corrosive media may cause wall thinning or localized corrosion. Applied stress may further influence damage evolution [2,3]. Accurate assessment and prediction of equipment damage states characterized primarily by corrosion provide an important basis for maintaining structural integrity and managing equipment service life. This has also become an important research topic in corrosion monitoring and equipment degradation assessment. Operational and inspection records accumulated in practice provide a data basis for predicting corrosion and related damage states.
Machine learning offers a new means of extracting patterns of corrosion and material degradation from engineering data. Ma et al. reviewed the application of machine learning in material corrosion research, with particular attention to corrosion-data feature extraction and commonly used learning algorithms [4]. Chen et al. developed a two-stage machine learning model to predict the atmospheric corrosion behavior of alloys [5]. Li et al. investigated the relationship between alloy composition and the high-temperature oxidation resistance of Ni-based alloys [6]. Related methods have also been applied to pipeline failure assessment and corrosion risk identification [7,8]. These studies show that data-driven models can learn complex nonlinear relationships associated with corrosion and material degradation.
Field inspection data involve two distinct prediction targets. Damage type represents the primary form of damage, whereas damage severity describes its progression from mild to severe. The former is a multiclass classification task, while the latter has an inherent ordinal structure. Existing studies generally address only one of these targets and rarely examine their differences within a common data framework. When damage severity is treated as a conventional multiclass problem, the relative ordering among severity levels cannot be fully utilized.
Class imbalance is another characteristic of field inspection data. Corrosion records are relatively abundant, whereas some damage types contain far fewer samples. A similar imbalance occurs among the damage severity levels. Such distributions can bias a model toward frequently observed classes. Resampling methods can reduce the bias caused by class imbalance, although their suitability depends on the structure of the input variables [9,10]. Field records contain both continuous and categorical variables, so direct interpolation may generate variable combinations with limited engineering meaning. A balancing strategy should therefore respect the original forms of the variables and remain strictly separated from the validation data.
Operating parameters characterize the service conditions of equipment, whereas information on materials and process media reflects differences among samples. When raw variables are used alone, cumulative service effects are often not explicitly represented. Research on data fusion indicates that information from different sources can form complementary representations at the feature level and improve the characterization of equipment condition [11]. In corrosion assessment, the fusion of sensor data and surface images has also improved the characterization of corrosion states [12]. These studies provide a basis for combining operating information with engineering knowledge, although the fusion strategy must remain compatible with the available data.
Theory-guided data science provides a methodological basis for this type of feature construction. Miao et al. predicted the maximum pitting depth of pipelines by introducing interaction features with theoretical meaning [13]. Wu et al. incorporated physical priors into the prediction of the residual strength of corroded pipelines [14]. More broadly, previous studies have shown that domain knowledge can be represented as input features or incorporated into model training through constraints [15,16]. Following these ideas, mechanism-informed features are constructed from temperature effects and cumulative service exposure. Risk differences associated with process media and materials are estimated from the training data. These two sources of information are then fused into a comprehensive damage-driving index, supplementing the representation provided by the original operating variables.
Damage severity prediction must also account for the inherent ordering of the severity levels. Rank-consistent ordinal regression learns ordinal relationships through cumulative threshold tasks and better preserves ordering information than conventional classification methods [17]. Research on monotonic neural networks provides an approach for coordinating model outputs with prior trends [18]. Accordingly, damage severity prediction is formulated as a cumulative ordinal task in this study, and a label-independent physical trend index is used to construct a consistency constraint. Ordinal modeling learns the boundaries between adjacent severity levels, whereas the consistency constraint discourages predictions that clearly conflict with the expected trend of damage evolution.
Existing studies have laid a foundation for corrosion data analysis and the incorporation of mechanism knowledge into equipment condition prediction. However, for field inspection records of high-temperature equipment, distinguishing corrosion from other damage types within a unified data framework and predicting damage severity using ordinal relationships still require further investigation. Data-driven risk encoding relies on training labels and is therefore susceptible to information leakage. Resampling also changes the class distribution of the training data. To ensure reliable model evaluation, risk encoding and data balancing are both performed within the training folds of cross-validation.
To address these issues, this study proposes a mechanism–data fusion framework for predicting corrosion and related damage states in high-temperature equipment using 660 operating and inspection records. The damage-type model distinguishes corrosion from other forms of damage recorded during inspection, whereas the damage-severity model characterizes the severity of the equipment condition. The modeling process incorporates mechanism information reflected by the service conditions, while class distribution and ordinal structure are addressed according to the characteristics of the two prediction tasks. Model performance is evaluated through cross-validation and comparative experiments. The proposed framework aims to improve the recognition of corrosion and related damage states and provide quantitative support for corrosion-risk screening and subsequent engineering assessment of high-temperature equipment.
2. Theory and Methods
2.1. Partial Random Over-Sampling Strategy
The damage-type and damage-severity labels in the inspection dataset have imbalanced class distributions. Training directly on the original distribution may cause the learned decision boundaries to be influenced primarily by classes containing more observations, thereby reducing the recognition of less frequent damage states. The dataset also combines continuous operating variables with categorical information concerning materials and process media. A fold-local partial random over-sampling strategy was therefore adopted to improve minority-class representation while preserving the observed combinations of the original variables.
Random over-sampling increases the contribution of minority classes by drawing existing records with replacement [19]. In the partial strategy used in this study, the number of replicated records is controlled according to the difference between each class and the largest class in the corresponding training fold. Let nk denote the original number of observations in class k, and let nmax denote the number of observations in the largest class. The target number of observations for class k is calculated as
where is the target class size after over-sampling and ρ is the over-sampling strength. The round operation converts the calculated value to an integer. A value of (ρ = 0) preserves the original class distribution, whereas (ρ = 1) expands every minority class to the size of the largest class.
The main experiments used (ρ = 0.30) for damage-type classification and (ρ = 0.15) for damage-severity prediction. The lower value used for severity prediction limits the number of repeated records and preserves more of the observed frequency structure among the ordered severity levels. The influence of different values of ρ was further examined through sensitivity analysis.
When ( > nk), a total of ( − nk) records are randomly selected with replacement from the existing observations in class k. All original training records are retained, and the largest class remains unchanged. Each selected record is replicated as a complete observation, so its operating parameters, material category, and process-medium information remain associated in their original form. The replicated records adjust the relative contribution of each class during model training and are not treated as additional independent observations during performance evaluation.
The procedure was performed independently within each training fold of the stratified five-fold cross-validation. Fold-specific preprocessing and risk encoding are completed using the training data before over-sampling is applied. The corresponding validation fold retains its original class distribution and does not participate in sample counting or record selection. This separation prevents information generated during resampling from entering the validation process and allows out-of-fold performance to be evaluated on the original inspection records [20].
2.2. Multilayer Perceptron (MLP) Damage State Prediction Model
An MLP learns nonlinear mappings between input features and output labels and is suitable for damage-state prediction involving heterogeneous engineering variables. In this study, a shallow MLP was used for the five-class damage-type task and the four-level damage-severity task.
For the i-th sample, the model input feature vector is expressed as
where is the raw input feature of the i-th sample; denotes the constructed fusion-feature vector comprising the mechanism-informed features and data-driven risk encodings. The model completes classification prediction through the input layer, hidden layers, and output layer, and its basic computation process is as follows.
(1) Hidden layer feature mapping: Let the input of the l-th hidden layer be h(l−1), and the output be h(l). The hidden layer computation is then
where W(l) is the weight matrix of the l-th layer, b(l) is the bias vector, is the nonlinear activation function, and h(0) = xi. The rectified linear unit (ReLU) is used as the hidden-layer activation function.
(2) Output layer computation: After hidden layer mapping, the output layer obtains the unnormalized scores of sample i for each category:
where Zi = [zi1, zi2, …, ziK], and K is the number of predicted categories.
(3) Class probability computation: To obtain the predicted probability that a sample belongs to each category, the Softmax function is used to normalize the output scores:
where pic denotes the probability that the i-th sample is predicted as class c, and zic is the output score of the corresponding category.
(4) Classification loss function: For the conventional multiclass formulation used in the baseline models, the classification loss is defined by cross-entropy:
where N is the number of training samples, K is the number of categories, and yic is the one-hot encoding of the true label. When sample i belongs to class c, yic = 1, otherwise yic = 0; pic is the class prediction probability output by the model. The cross-entropy loss measures the difference between the true label and the predicted probability distribution.
2.3. Mechanism–Data Feature Construction
Damage in high-temperature equipment is affected by service conditions and by variations in equipment materials and process media. Although the raw variables describe these factors individually, they provide limited representation of their combined influence on damage evolution. The temperature activation factor and the high-temperature and high-pressure cumulative exposure index are derived from the operating variables, while information on process medium and material is transformed into data-driven risk encodings. These variables are subsequently integrated into a comprehensive damage-driving index and are treated as a unified fusion feature module in the ablation experiments.
(1) Temperature activation factor
Under high-temperature conditions, corrosion reactions and material degradation processes usually exhibit pronounced temperature sensitivity. Existing studies have used the Arrhenius relationship in high-temperature oxidation and corrosion kinetics analysis to describe the connection between temperature and the rate constant and have taken temperature, time, and material composition as important input variables for predicting high-temperature oxidation rates [1,6]. Based on the idea of Arrhenius temperature sensitivity, an empirical temperature activation factor is constructed to characterize the promoting effect of increasing temperature on the damage evolution process:
where k is the rate constant, A is the pre-exponential factor, Ea is the apparent activation energy, R is the gas constant, and T is the thermodynamic temperature. This relationship indicates that a change in temperature causes an exponential change in the rate level. Based on this idea, the temperature activation factor is constructed as
where Ti is the operating temperature, Tref is the mean temperature of the training set, and Ts is the standard deviation of the training-set temperature. This feature characterizes the accelerating effect of increasing temperature on the damage evolution process. Compared with directly using the operating temperature, this transformation provides a nonlinear representation of temperature sensitivity under high-temperature conditions.
(2) High-temperature and high-pressure cumulative exposure index
Equipment damage evolves under the combined effects of thermal exposure, mechanical loading, and service time. Studies of stress–corrosion interactions have shown that the applied stress level can alter material corrosion behavior and affect damage evolution [2]. In their study of corrosion-fatigue life under high-temperature and high-pressure water conditions, Bhardwaj and Shukla [3] incorporated environmental variables such as temperature and pressure as model inputs, further supporting the relevance of thermal exposure and mechanical loading to damage prediction. To obtain dimensionless quantities, service time and operating pressure are normalized by their respective reference values as follows:
where Yref and Pref are the reference values of operating time and operating pressure, respectively. Combined with the temperature activation factor, the high-temperature and high-pressure cumulative exposure index is constructed as
where DTPY,i denotes the cumulative exposure degree under the coupled action of temperature activation, pressure-bearing level, and service time.
(3) Data-driven risk encoding of process medium and material
The process medium and equipment material are important categorical variables in damage-state prediction for high-temperature equipment. Studies on corrosion prediction and material degradation have shown that transforming such engineering information into learnable features can help data-driven models identify damage differences under varying service conditions [6]. In the original dataset, the process medium and equipment material are recorded as categorical variables. One-hot encoding distinguishes individual categories but does not directly reflect the damage risk observed for each category in the historical inspection data. A process-medium risk encoding and a material risk encoding are therefore constructed to incorporate these categorical variables into the prediction model as continuous risk-related inputs.
Drawing on regularized target encoding [21], category statistics obtained from the training data are used to construct the process-medium risk encoding. Let nc denote the number of training samples belonging to process-medium category C. The quantities rc and rglobal denote the mean normalized damage severity for category C and the entire training set, respectively, while m is the smoothing parameter. The process-medium risk encoding is defined as
The resulting encoding combines the damage statistics of a process-medium category with the overall damage severity of the training data. For a category containing relatively few samples, the overall statistic reduces fluctuations in its risk estimate. As the number of samples increases, the estimated value increasingly reflects the damage characteristics of that process-medium category.
The material risk encoding is constructed using the same method. For material category M, nM denotes the number of samples belonging to that category in the training data, and rM denotes its mean normalized damage severity. The material risk encoding is defined as
The resulting encoding represents the damage risk associated with material category M in the training data, allowing the material information to enter the prediction model as a continuous input. Within each outer training fold, the process-medium and material risk encodings are generated through internal cross-fitting. For each internal partition, the encoding mappings are estimated from the remaining training partitions and then applied to the held-out partition. A training record therefore does not contribute its own label to its encoded value. The outer validation fold is transformed only using mappings fitted on the complete outer training fold.
(4) Comprehensive damage-driving index
In this study, the name, components, and mathematical form of the comprehensive damage-driving index were defined for the present prediction task. Its construction was motivated by multisource condition representation [11] and combines the two mechanism-informed features with the process-medium and material risk encodings. Before fusion, the four components were placed on a common scale using parameters estimated from the corresponding training fold. Equal weights were adopted to avoid retrospective selection based on validation performance, and alternative weighting schemes were examined in the sensitivity analysis.
The comprehensive damage-driving index is defined as
where Di is the comprehensive damage-driving index of sample i, is the high-temperature and high-pressure cumulative exposure index, is the process-medium risk encoding, and is the material risk encoding.
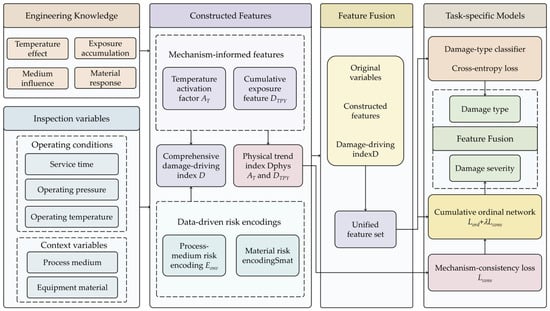
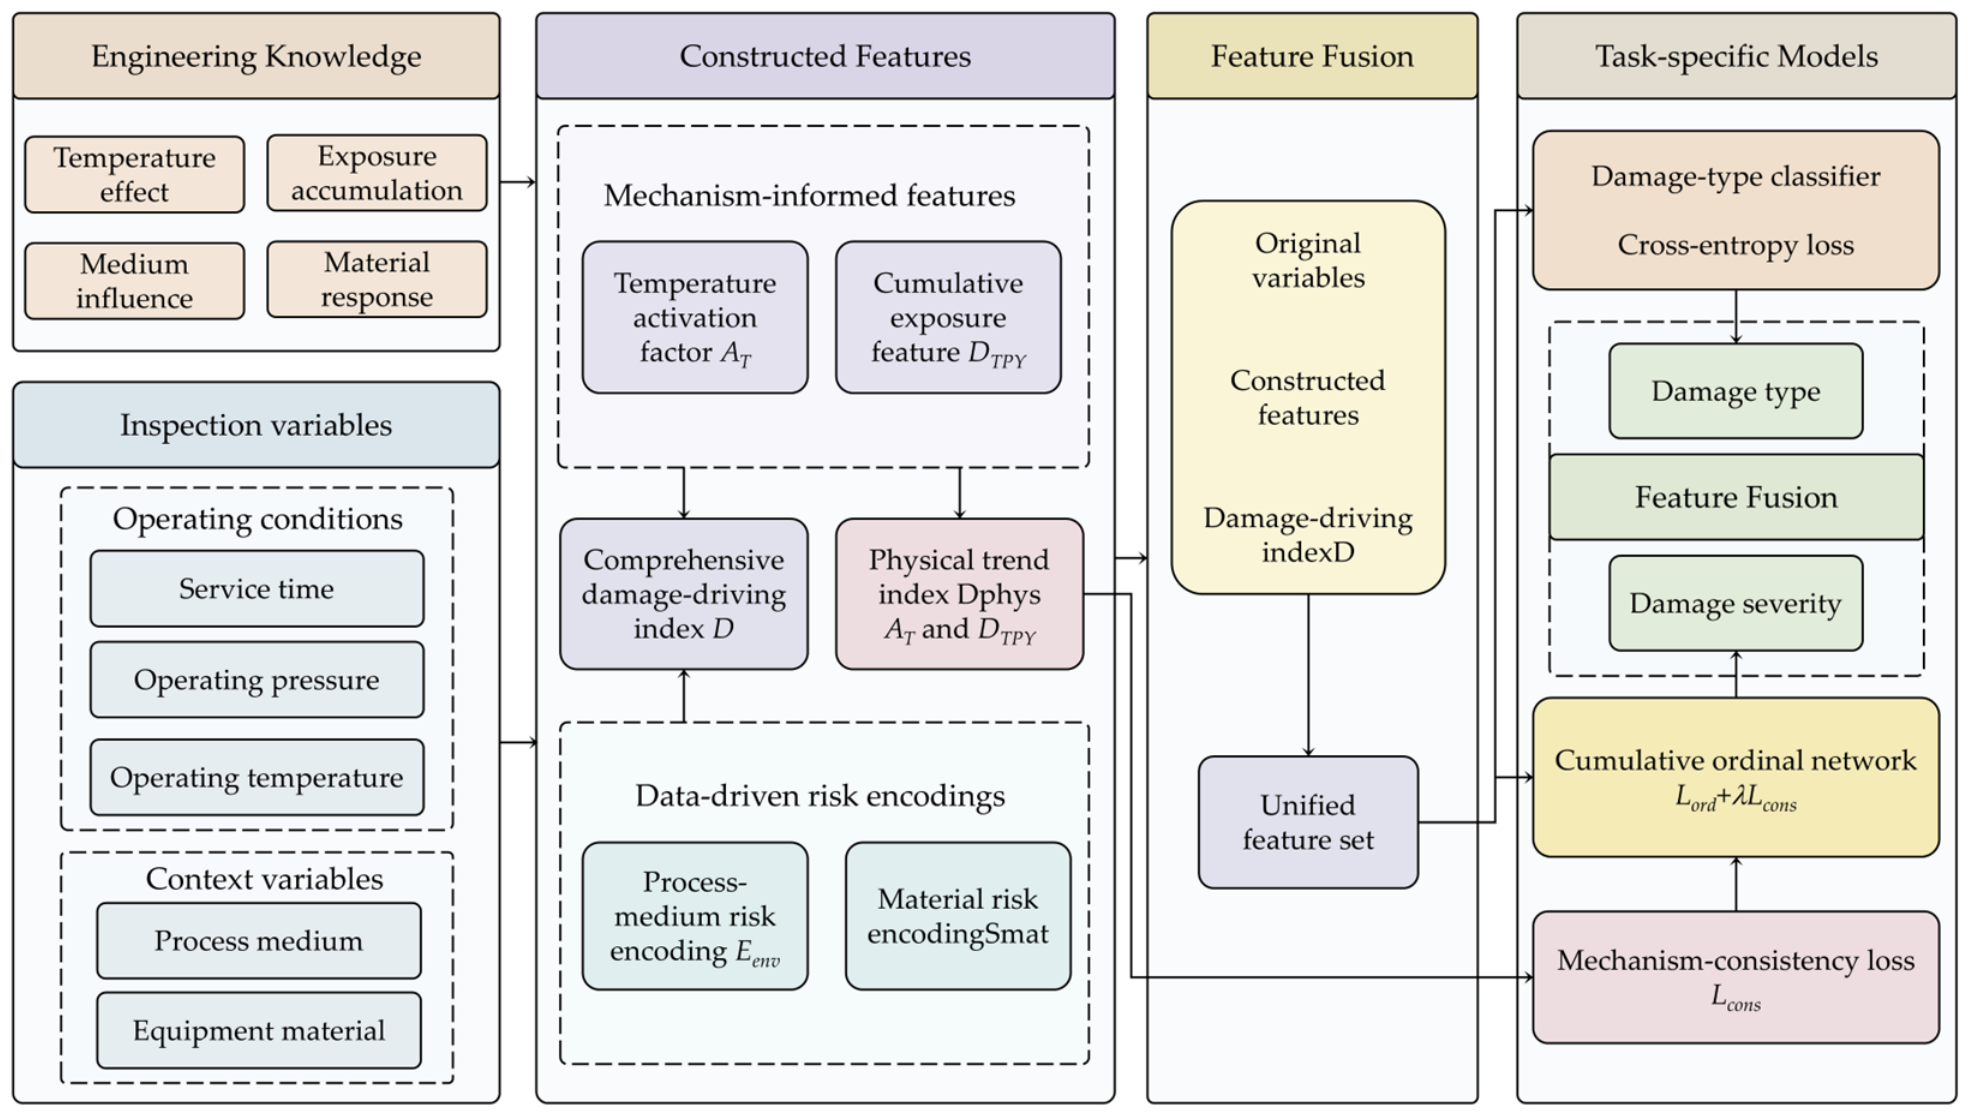
From the perspective of mechanism–data fusion, the comprehensive damage-driving index is a fusion feature constructed under the guidance of domain knowledge. Previous studies have shown that scientific knowledge and physical information can be incorporated into machine learning models through features or constraints, thereby improving their engineering validity and interpretability [15]. In the present method, the comprehensive damage-driving index is used as an input feature, whereas the damage trend required by the consistency constraint is determined from operating features that are independent of the damage labels. The relationships among mechanism-feature construction, data fusion, and the consistency constraint are illustrated in Figure 1.
Figure 1.
Framework of mechanism–data feature fusion and the consistency constraint.
2.4. Mechanism-Consistency Constraint
Ordinal classification uses the inherent order among damage-severity levels and improves the representation of progressive damage states [22]. In the proposed damage-severity model, a cumulative ordinal output is combined with a mechanism-consistency constraint. Ordinal learning captures the progression between adjacent damage-severity levels, while the consistency constraint reduces deviations between the predictions and the expected damage-evolution trend.
(1) Cumulative ordinal output and expected severity: For a prediction task with K ordered damage-severity levels, the model produces K − 1 cumulative probabilities. The kth output represents the probability that the damage severity of sample i exceeds level k. Based on these probabilities, the normalized expected severity of the sample is calculated as follows:
where Si is the normalized expected severity of sample i and qik is the corresponding cumulative probability. A larger Si indicates a higher predicted damage severity. During training, each damage label is converted into K − 1 cumulative binary targets, from which the ordinal loss is calculated.
(2) Construction of sample-pair physical-trend ranking
To keep the consistency constraint independent of the supervised risk encodings, sample ranking is based on the label-independent physical trend index Dphys. This index is obtained by averaging the normalized temperature-activation factor and cumulative-exposure index and represents the relative damage trend associated with the operating conditions. A sample pair is included in consistency training only when the difference between its physical trend indices is sufficiently large:
where Ω denotes the set of sample pairs used for the consistency calculation and δ is the pair-selection threshold. For a pair (i, j), a larger Dphys indicates that sample i has a higher relative damage-driving level under its operating conditions. The threshold reduces the influence of uncertain rankings between samples with similar physical trend indices.
(3) Mechanism-consistency loss
For a sample pair (i, j), a higher physical trend index for sample i should be accompanied by a correspondingly higher predicted severity. Based on this relationship, the mechanism-consistency loss is defined as follows:
where γ denotes the minimum required difference between the predicted severities. No penalty is introduced when Si and Sj satisfy the expected order and margin. When the predicted results deviate from the ordering indicated by the physical trend, the consistency loss increases with the magnitude of the deviation. Similar monotonic constraints have been incorporated into neural-network training to improve consistency between model outputs and domain knowledge [23].
(4) Total loss function: The training objective of the damage-severity prediction model consists of the ordinal loss and the mechanism-consistency loss:
where Ltotal is the total training loss, Lord is the binary cross-entropy loss associated with the cumulative ordinal outputs, Lcons is the mechanism-consistency loss, and λ controls the relative contribution of the two terms. Through joint optimization, the model learns the ordered damage-severity levels while reducing predictions that clearly conflict with the physical trend. Previous studies have shown that incorporating domain knowledge into model training as a constraint can improve the engineering validity and interpretability of data-driven models [24].
2.5. Damage State Prediction Procedure and Evaluation Method
2.5.1. Damage State Prediction Method
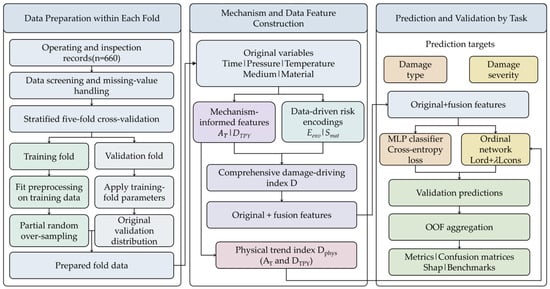
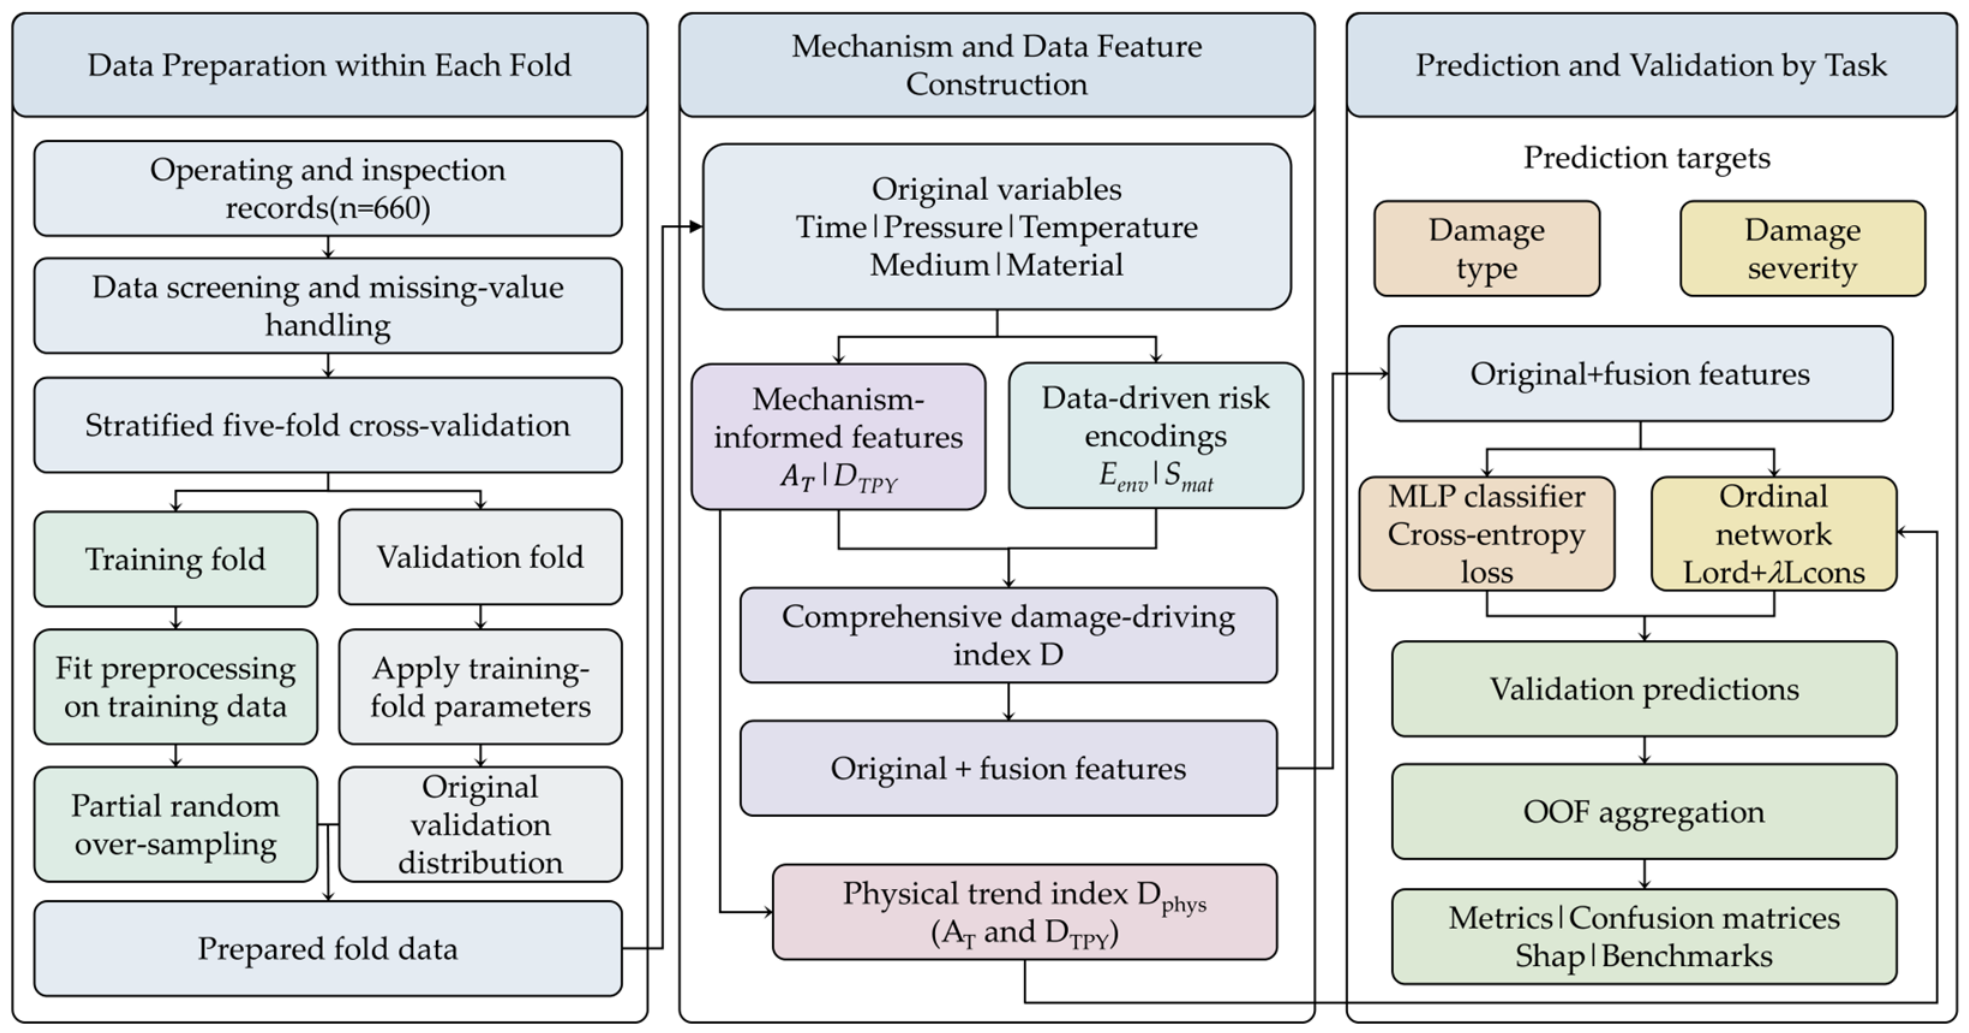
Based on the algorithms in the previous section, prediction models for the damage type and damage severity of high-temperature equipment are established. The equipment damage state prediction procedure is shown in Figure 2, and the specific steps are as follows.
Figure 2.
Flowchart of damage state prediction.
(1) Raw data preprocessing.
Equipment operating records, basic information, and inspection results are collected, and consistency checking and missing-value processing are performed on the raw data. The prediction problem is divided into two tasks, damage-type classification and damage-severity prediction, with a separate label set defined for each task.
(2) Cross-validation and data balancing.
The complete dataset is evaluated using stratified five-fold cross-validation. In each fold, the parameters required for data preprocessing are determined from the training fold and then applied to the corresponding validation fold. Class balancing is performed only within the training fold through moderate resampling of the observed samples, without generating interpolated samples.
(3) Mechanism–data feature fusion.
Following the feature-construction method described above, mechanism-informed operating features and data-driven risk encodings are generated within each training fold and combined with the original input variables to form the fused feature space. The statistical parameters and category mappings required for feature construction are determined from the training fold and subsequently used to transform the corresponding validation fold.
(4) Damage state prediction.
For damage-type prediction, the fused features are input into the MLP classifier. For damage-severity prediction, the final model adopts a cumulative ordinal output and is jointly trained using the ordinal loss and the mechanism-consistency loss based on the physical trend index.
(5) Damage state output.
In each fold, the trained model predicts the validation samples that were not used for model fitting. The predictions from the five validation folds are then combined to form out-of-fold predictions covering the complete dataset. The damage type and damage severity are determined from the probabilities produced by their respective models.
2.5.2. Model Evaluation Method
Model performance is evaluated using stratified five-fold cross-validation. The evaluation metrics include accuracy, macro-averaged precision, macro-averaged recall, macro-averaged F1 score, and the Kappa coefficient. The metrics are reported as the mean and standard deviation across the five folds, while the confusion matrices and associated evaluation curves are generated from the combined out-of-fold predictions.
For each class, TP, FP, TN, and FN denote true positives, false positives, true negatives, and false negatives, respectively. Table 1 shows their arrangement under a one-versus-rest evaluation. Accuracy, precision, recall, and F1 score are then calculated using Equations (16)–(19).
where Accu, Prec, Rec, and F1 are the accuracy, precision, recall, and F1 score, respectively. Precision, recall, and F1 score are calculated separately for each category, and their macro-averaged values are used to evaluate the overall predictive performance across all categories. The Kappa coefficient measures agreement between the predicted and observed classes after accounting for agreement expected by chance; values closer to 1 indicate stronger agreement.
Table 1.
Confusion matrix.
For the ordinal damage-severity task, Ordinal mean absolute error (MAE) and quadratic weighted kappa (QWK) were additionally used for evaluation. Ordinal MAE measures the average deviation between the predicted and observed levels, with a lower value indicating better performance. QWK assigns greater penalties to errors spanning multiple levels, and a value closer to 1 indicates stronger ordinal agreement.
The Kappa coefficient used for multiclass evaluation is calculated as follows:
where Pe is the expected agreement rate, L is the total number of samples, xi is the sum of the elements in the i-th row of the confusion matrix, and yi is the sum of the elements in the i-th column of the confusion matrix.
3. Data Analysis and Preprocessing
The dataset contains 660 operating and inspection records from in-service high-temperature equipment. Each record includes service conditions, process medium, equipment material, damage type, and damage severity. The damage labels follow the condition descriptions documented during inspection. Representative records are presented in Table 2.
Table 2.
Partial damage state sample dataset.
The damage type represents the principal form of damage identified in the inspection record, while damage severity describes the overall seriousness of the observed condition. Each record contains one damage-type label and one damage-severity label. The classifications recorded during inspection are retained in this study, and the engineering meaning of each damage type is summarized in Table 3.
Table 3.
Engineering definitions of the damage-type labels.
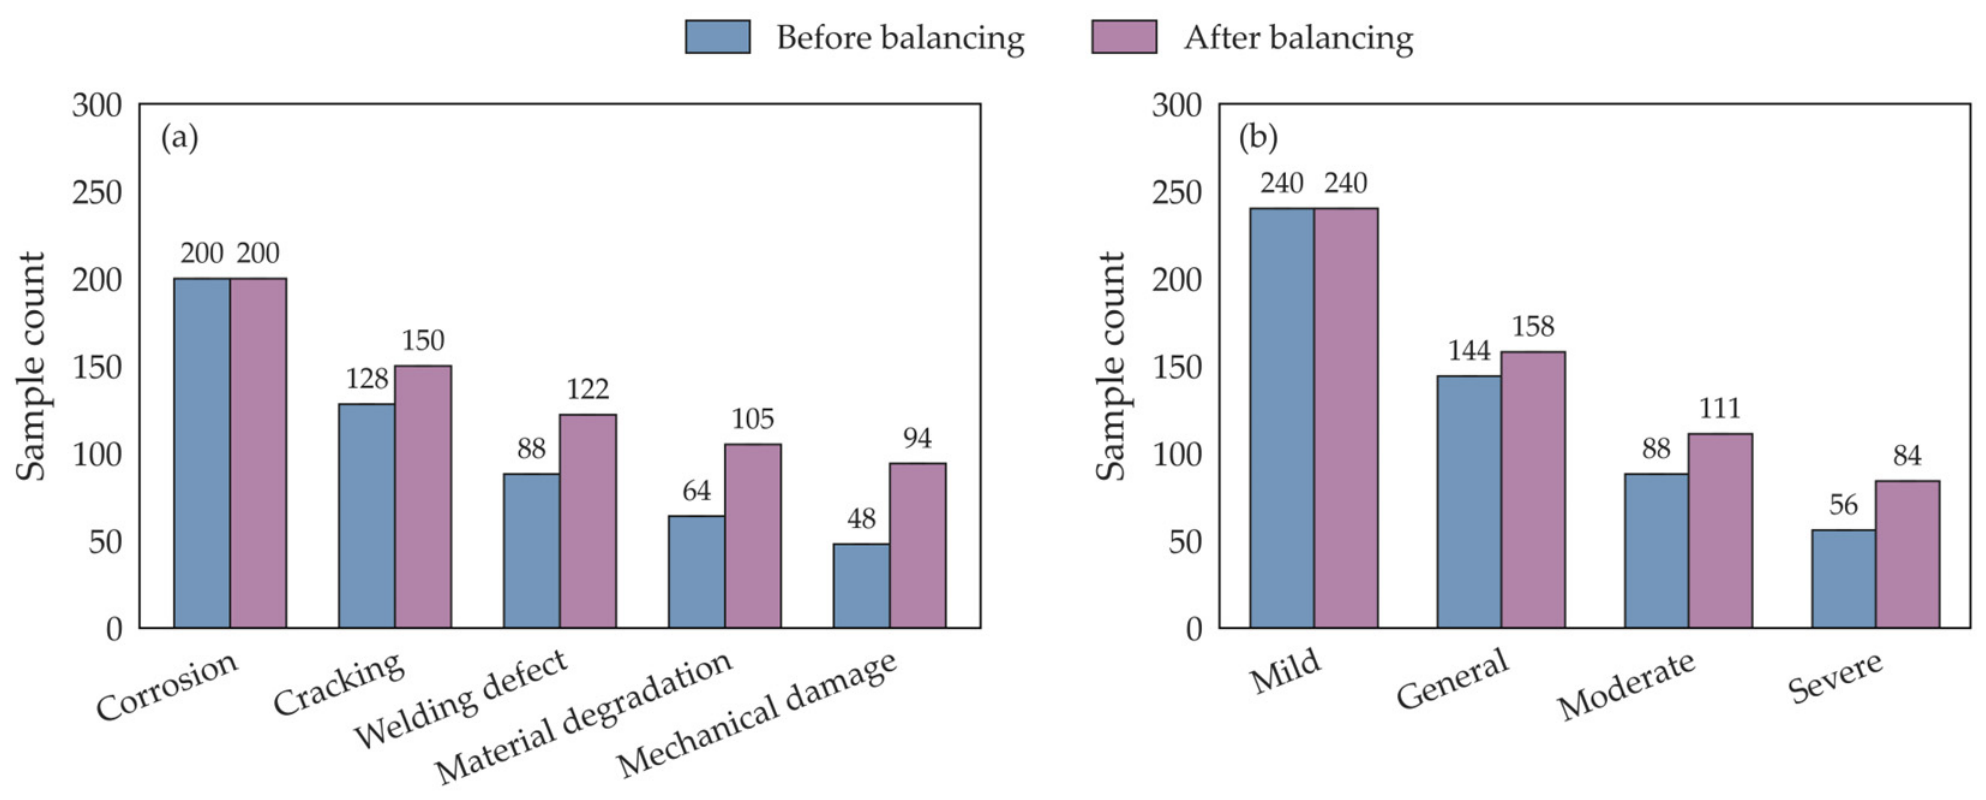
Among the 660 records, the numbers of samples classified as corrosion, cracking, welding defect, material degradation, and mechanical damage are 250, 160, 110, 80, and 60, respectively. The Mild, General, Moderate, and Severe levels contain 300, 180, 110, and 70 records, respectively. Both prediction tasks therefore exhibit class imbalance. Categories with more samples may have a greater influence on model training, whereas less frequent categories are generally more difficult to identify.
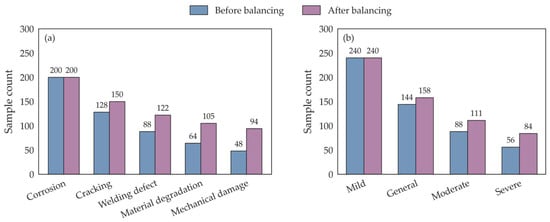
To reduce class imbalance, partial random over-sampling was applied only within each training fold. Minority-class records were sampled with replacement until each class reached the target size defined in Section 2.1, while all original training records were retained and the largest class remained unchanged. No interpolated samples were generated, and each validation fold retained its original class distribution. The mean class distributions across the five training folds before and after resampling are presented in Figure 3.
Figure 3.
Mean class distributions in the five training folds before and after partial random over-sampling: (a) damage-type classification; (b) damage-severity prediction.
The resampling procedure reduces the differences in sample size among the classes while retaining part of the original distribution structure. All resampled observations are used only for model training, and model performance is evaluated on validation folds that have not been resampled.
4. Model Validation, Results and Discussion
Ablation experiments were conducted separately for damage-type and damage-severity prediction to evaluate the contribution of each model component. The damage-type task included T0–T3. T0 was the baseline model using only the original features; T1 added fold-local partial random over-sampling; T2 combined the original features with the complete mechanism–data fusion feature module; and T3 further incorporated data balancing. The damage-severity task included S0–S4. S0–S3 followed a similar incremental design, while S4 extended S3 by introducing a joint module consisting of cumulative ordinal modeling and a mechanism-consistency constraint. The same stratified five-fold split was used for all models. Feature scaling, risk encoding and resampling were performed exclusively within each training fold. Model performance is reported as the mean and standard deviation across the five folds, whereas the confusion matrices and interpretation results are based on out-of-fold results covering all 660 records.
4.1. Prediction Results of Equipment Damage Type
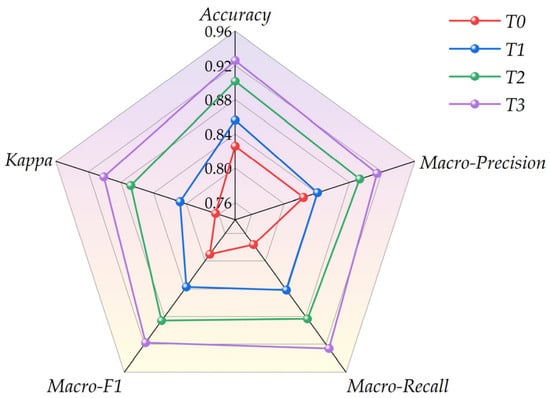
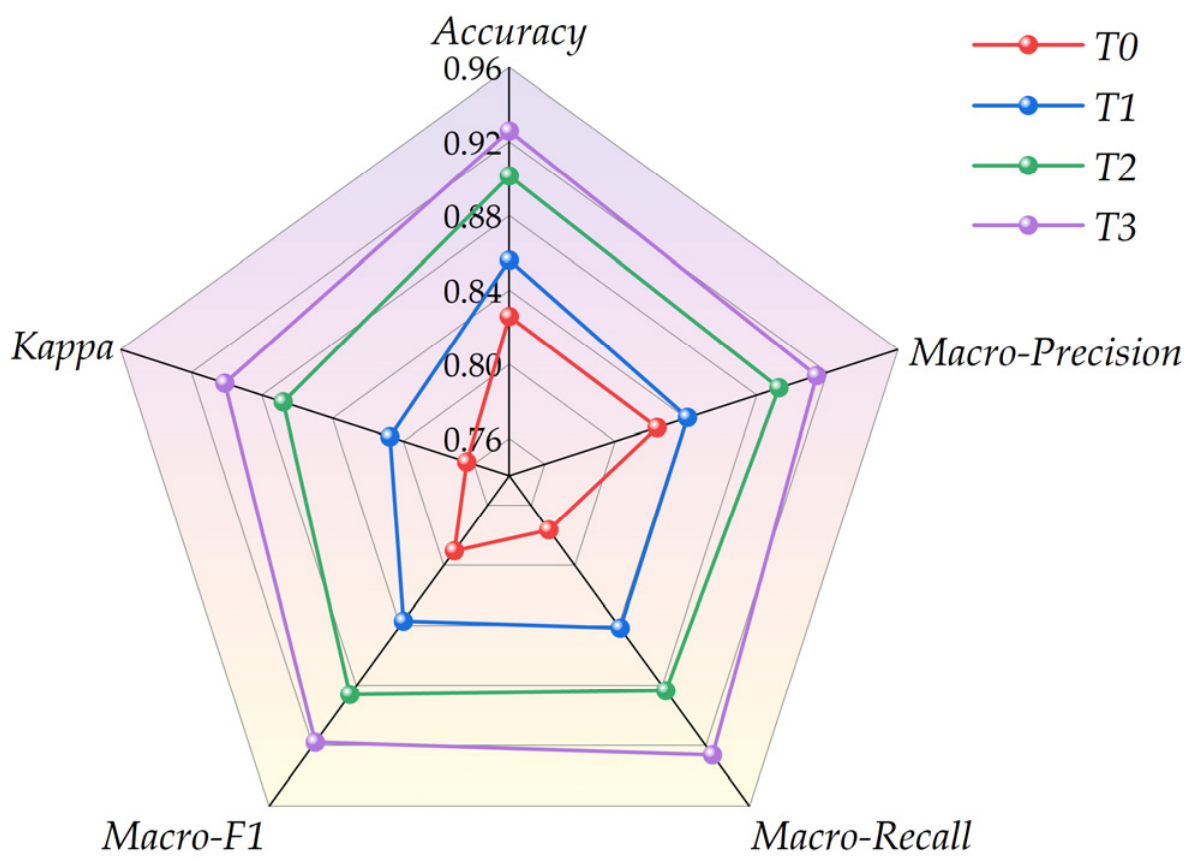
Table 4 and Figure 4 show an overall improvement in damage-type prediction as additional information was progressively incorporated into the model. The effect of fold-local data balancing was mainly reflected in the increase in Macro-Recall, suggesting that the less represented damage classes received greater attention during model training. A more pronounced improvement resulted from the mechanism–data fusion features, which increased Accuracy from 82.58% for T0 to 90.15% for T2. When the fusion features and data balancing were combined, T3 achieved the best overall performance, with an Accuracy of 92.58% and a Macro-F1 of 91.77%. This pattern indicates that the original operating parameters provided basic discriminatory information, while the integrated representation of service exposure, medium-related risk and material differences enabled the model to distinguish damage types arising under different operating conditions more effectively.
Table 4.
Five-fold cross-validation results of the damage-type ablation models.
Figure 4.
Radar comparison of the mean five-fold cross-validation performance of the damage-type ablation models.
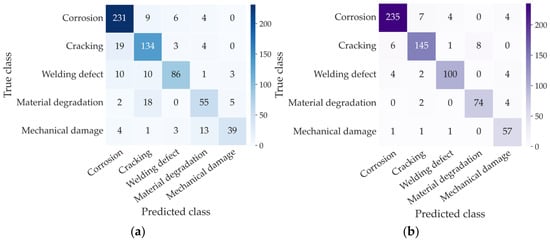
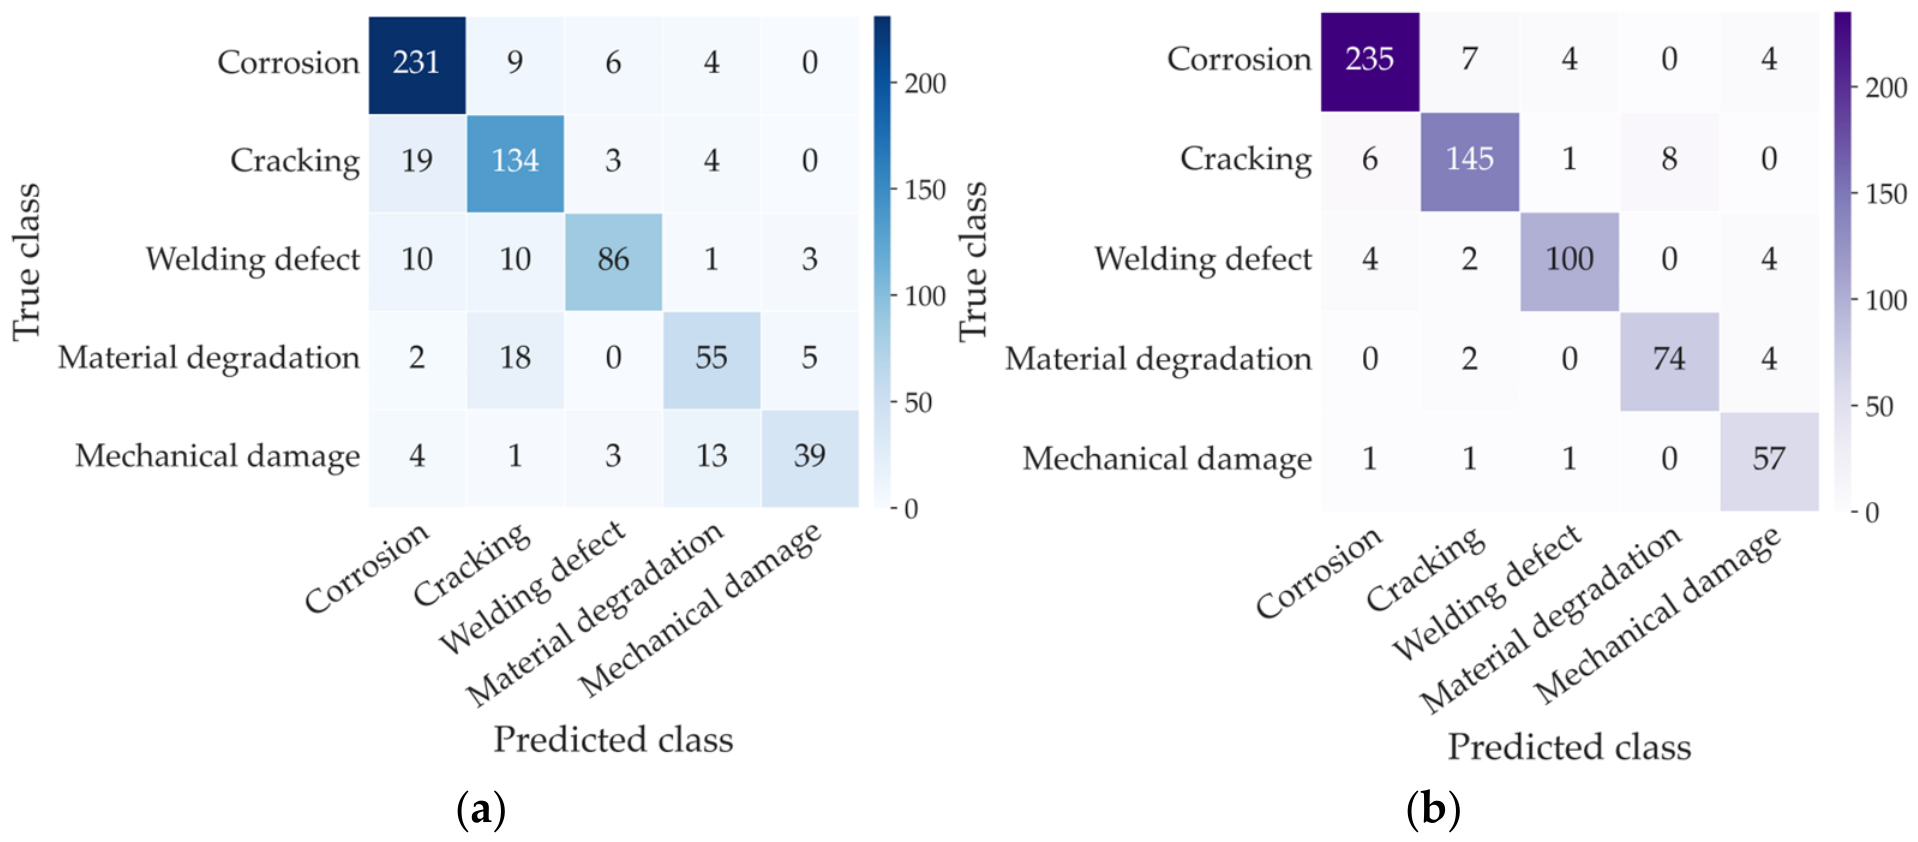
Figure 5 further illustrates these improvements at the class level. Compared with T0, T3 reduced the number of misclassified out-of-fold records from 115 to 49 among the 660 observations. The corrosion class retained strong recognition performance, with a Precision of 95.53% and a Recall of 94.00%, while the Recall values for material degradation and mechanical damage also increased considerably. The final model therefore achieved broader recognition of the less represented classes while maintaining reliable corrosion identification.
Figure 5.
Out-of-fold confusion matrices for damage-type prediction: (a) T0 baseline model; (b) T3 full model.
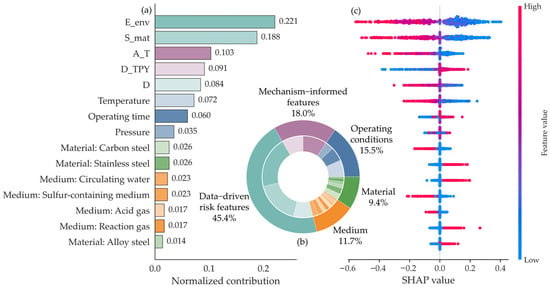
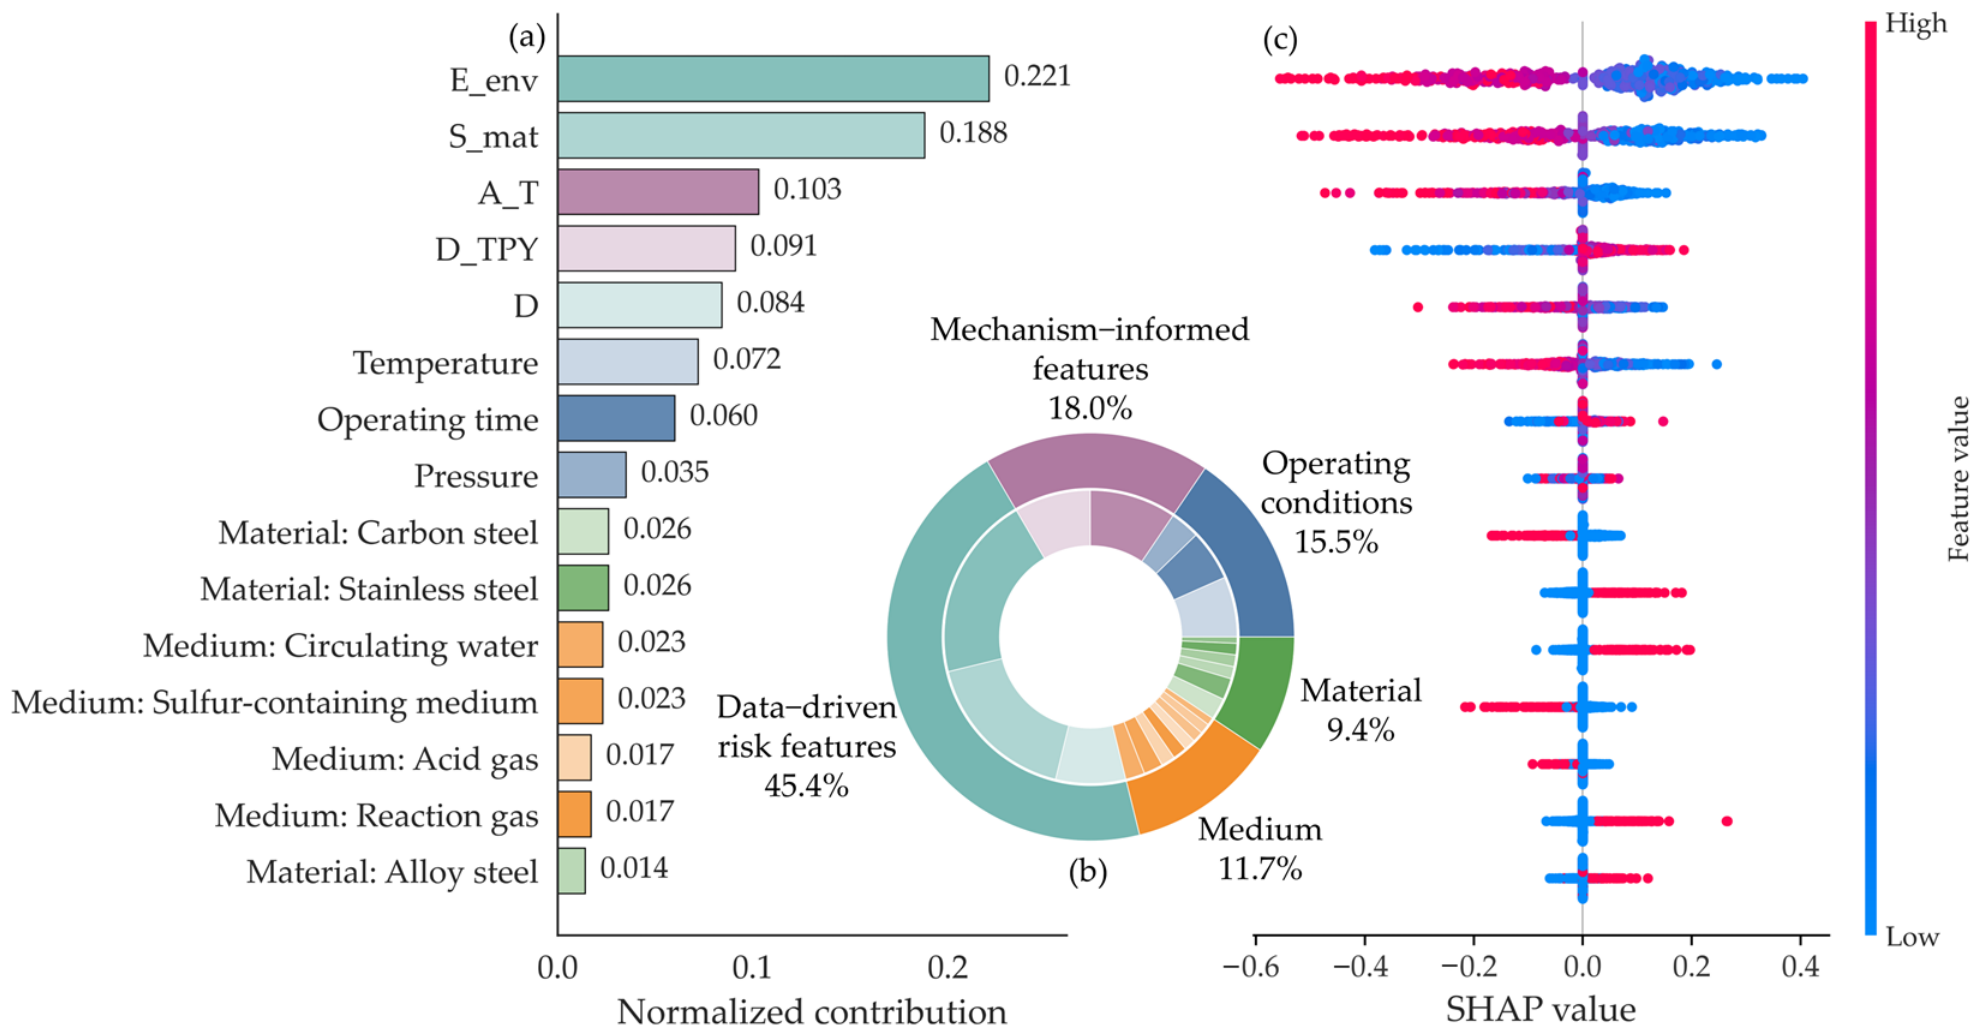
Figure 6 explains the predictions of T3 from the perspective of feature contribution. The SHapley Additive exPlanations (SHAP) results aggregated from all 660 out-of-fold records show that the model decisions were jointly influenced by operating conditions, mechanism-informed features and data-driven risk encodings. For corrosion prediction, information related to the process medium and material altered the model response to the corrosion class, while temperature and cumulative service exposure provided complementary information about the conditions associated with damage development. This combined contribution is consistent with previous corrosion-prediction studies emphasizing the coupled effects of environment, material and service conditions. In the present study, SHAP contributions are interpreted as model-level statistical associations that explain the basis of the predictions.
Figure 6.
Feature importance and SHAP analysis for damage-type prediction: (a) normalized feature importance; (b) hierarchical feature contributions; (c) SHAP beeswarm plot.
4.2. Prediction Results of Equipment Damage Severity
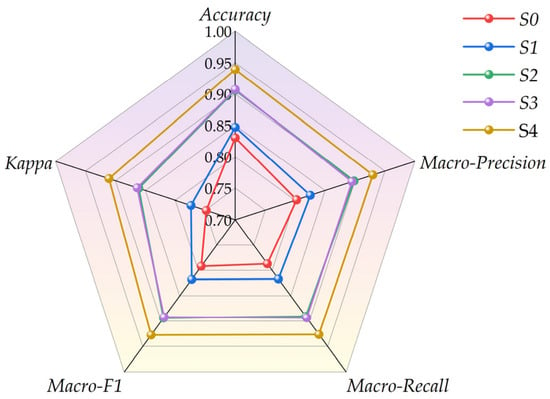
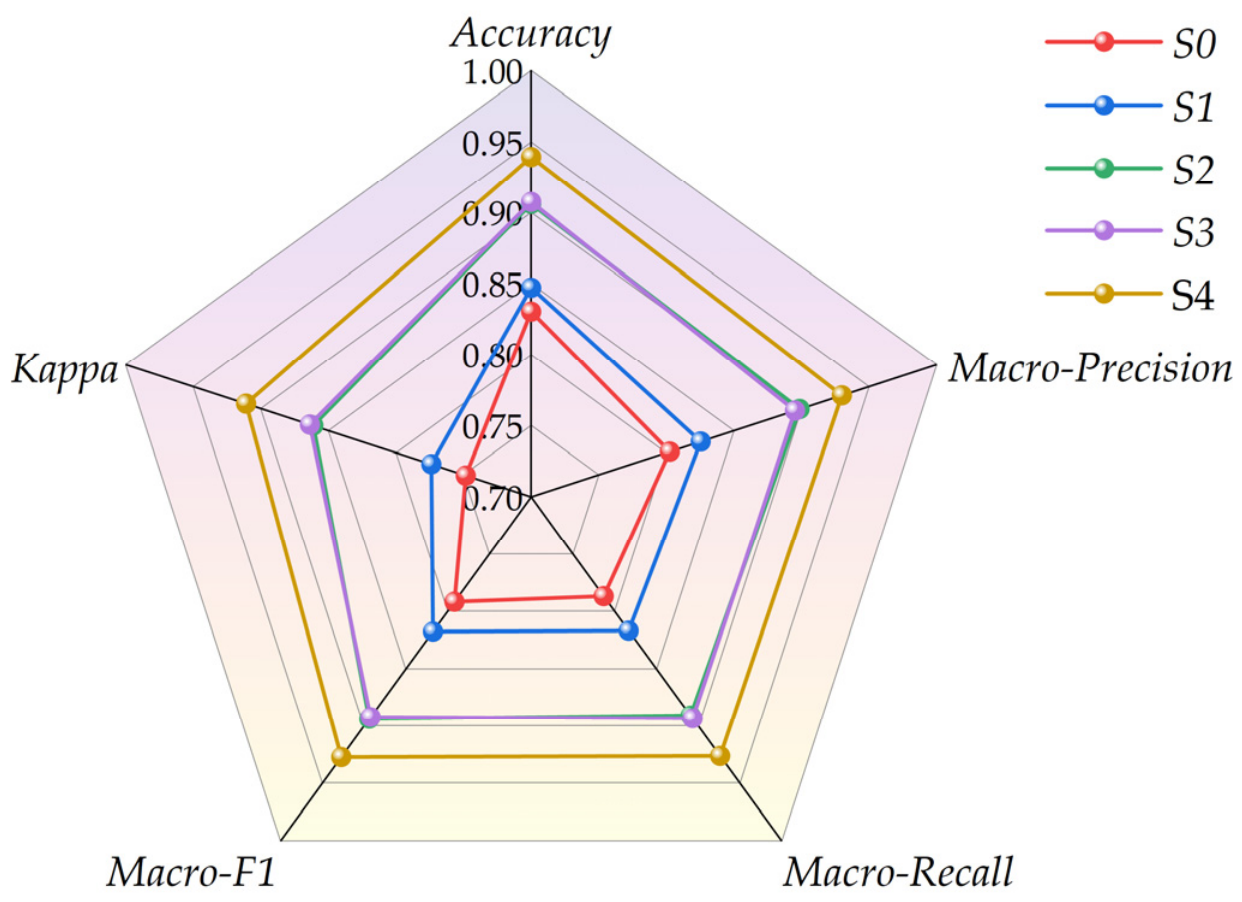
Table 5 and Figure 7 present the ablation results for damage-severity prediction. Fold-local data balancing produced a moderate improvement from S0 to S1. A more pronounced change was observed after the mechanism–data fusion features were introduced, increasing Accuracy from 83.03% for S0 to 90.61% for S2. S2 and S3 showed similar performance, suggesting that the fusion features had already provided substantial information for severity discrimination. With cumulative ordinal modeling and the mechanism-consistency constraint included, S4 achieved an accuracy of 93.94%, compared with 90.76% for S3, while its macro-F1 reached 92.72%. S4 also reduced the Ordinal MAE to 0.0606 and achieved a QWK of 0.9709. The small standard deviations obtained by S4 indicate stable performance across the five validation folds. Overall, the fusion features improved the basic discrimination of damage severity, while ordinal modeling and the consistency constraint further exploited the progressive relationship among severity levels.
Table 5.
Five-fold cross-validation results of the damage-severity ablation models.
Figure 7.
Radar comparison of the mean five-fold cross-validation performance of the damage-severity ablation models.
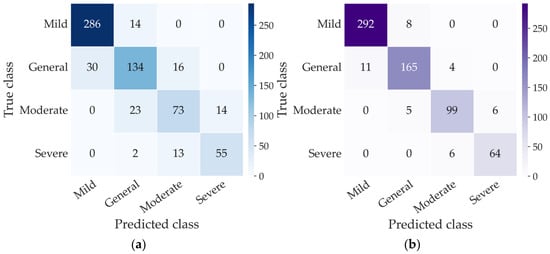
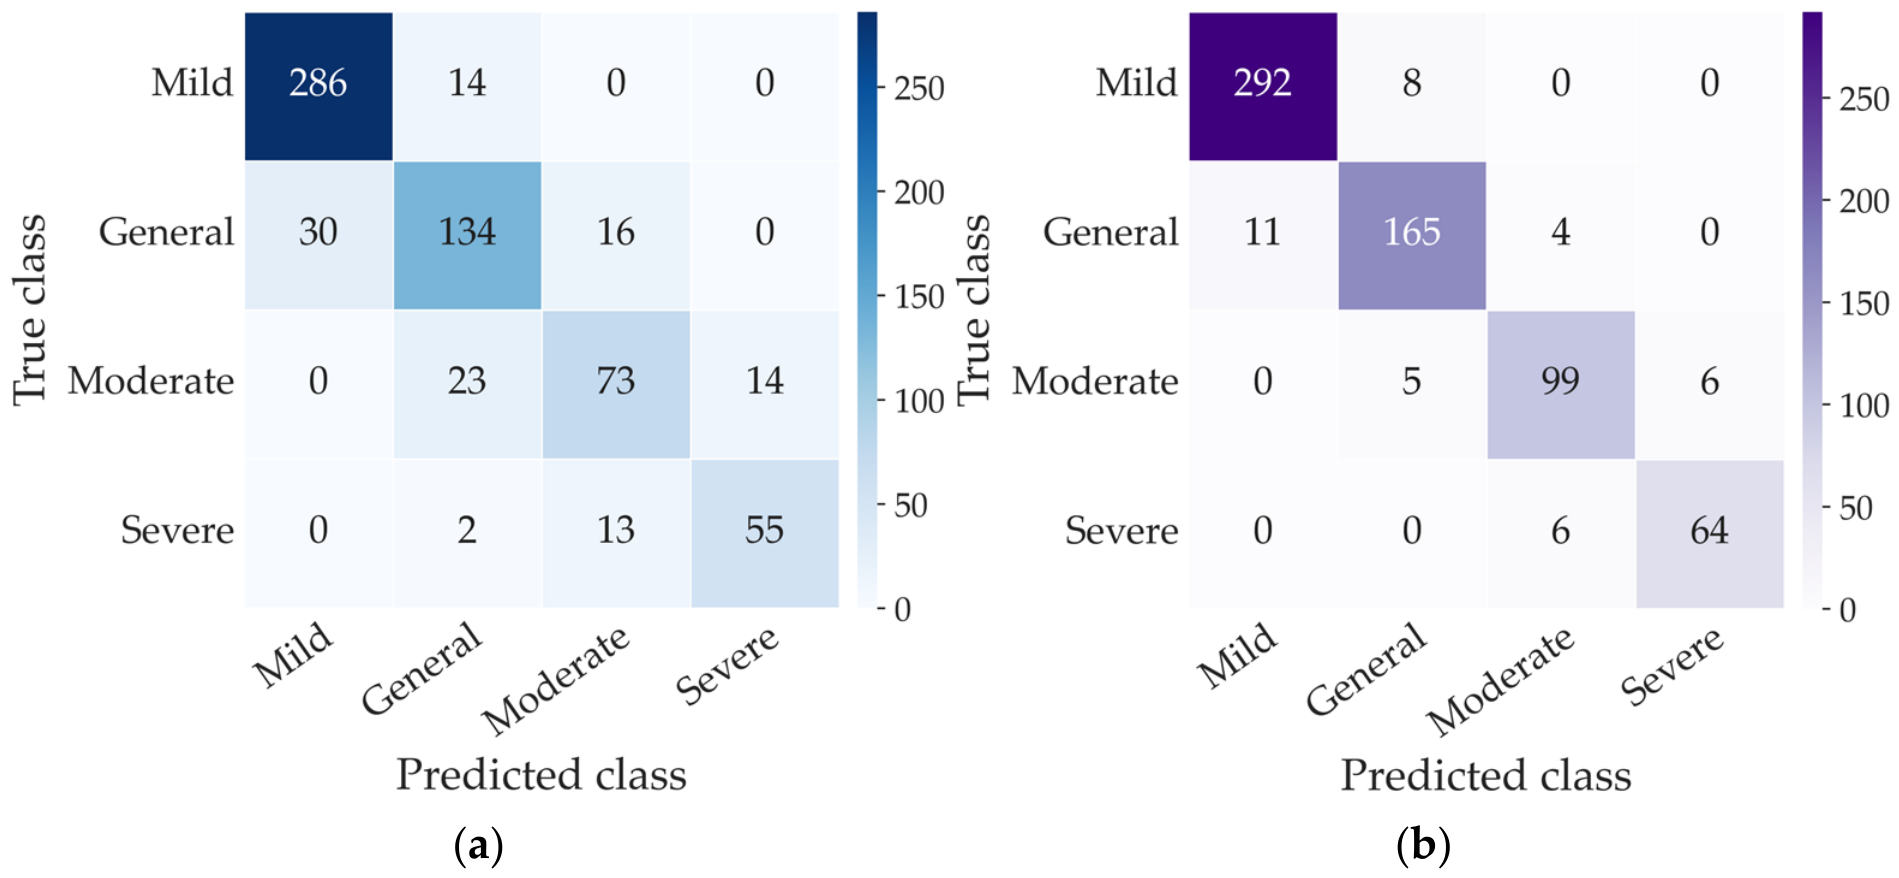
Figure 8 further illustrates the discrimination of the different damage-severity levels. S0 produced 112 misclassifications among the 660 out-of-fold predictions, whereas S4 reduced this number to 40. The improvement was particularly evident for moderate and severe damage, for which Recall increased from 66.36% and 78.57% to 90.00% and 91.43%, respectively. All remaining errors produced by S4 occurred between adjacent severity levels, with no misclassification spanning two or more levels. This change is practically relevant to the condition assessment of corrosion and related material degradation, as underestimating severe damage may affect subsequent inspection and maintenance priorities. The confusion matrices therefore show that S4 increased the number of correct predictions while also controlling the magnitude of errors along the ordinal scale.
Figure 8.
Out-of-fold confusion matrices for damage-severity prediction using all 660 records. (a) S0; (b) S4.
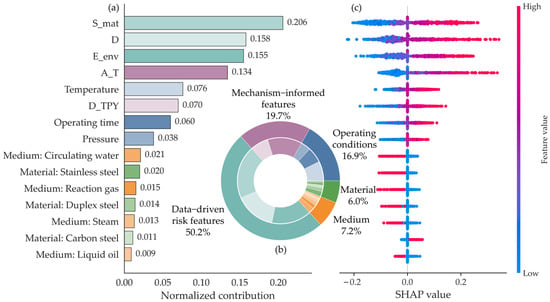
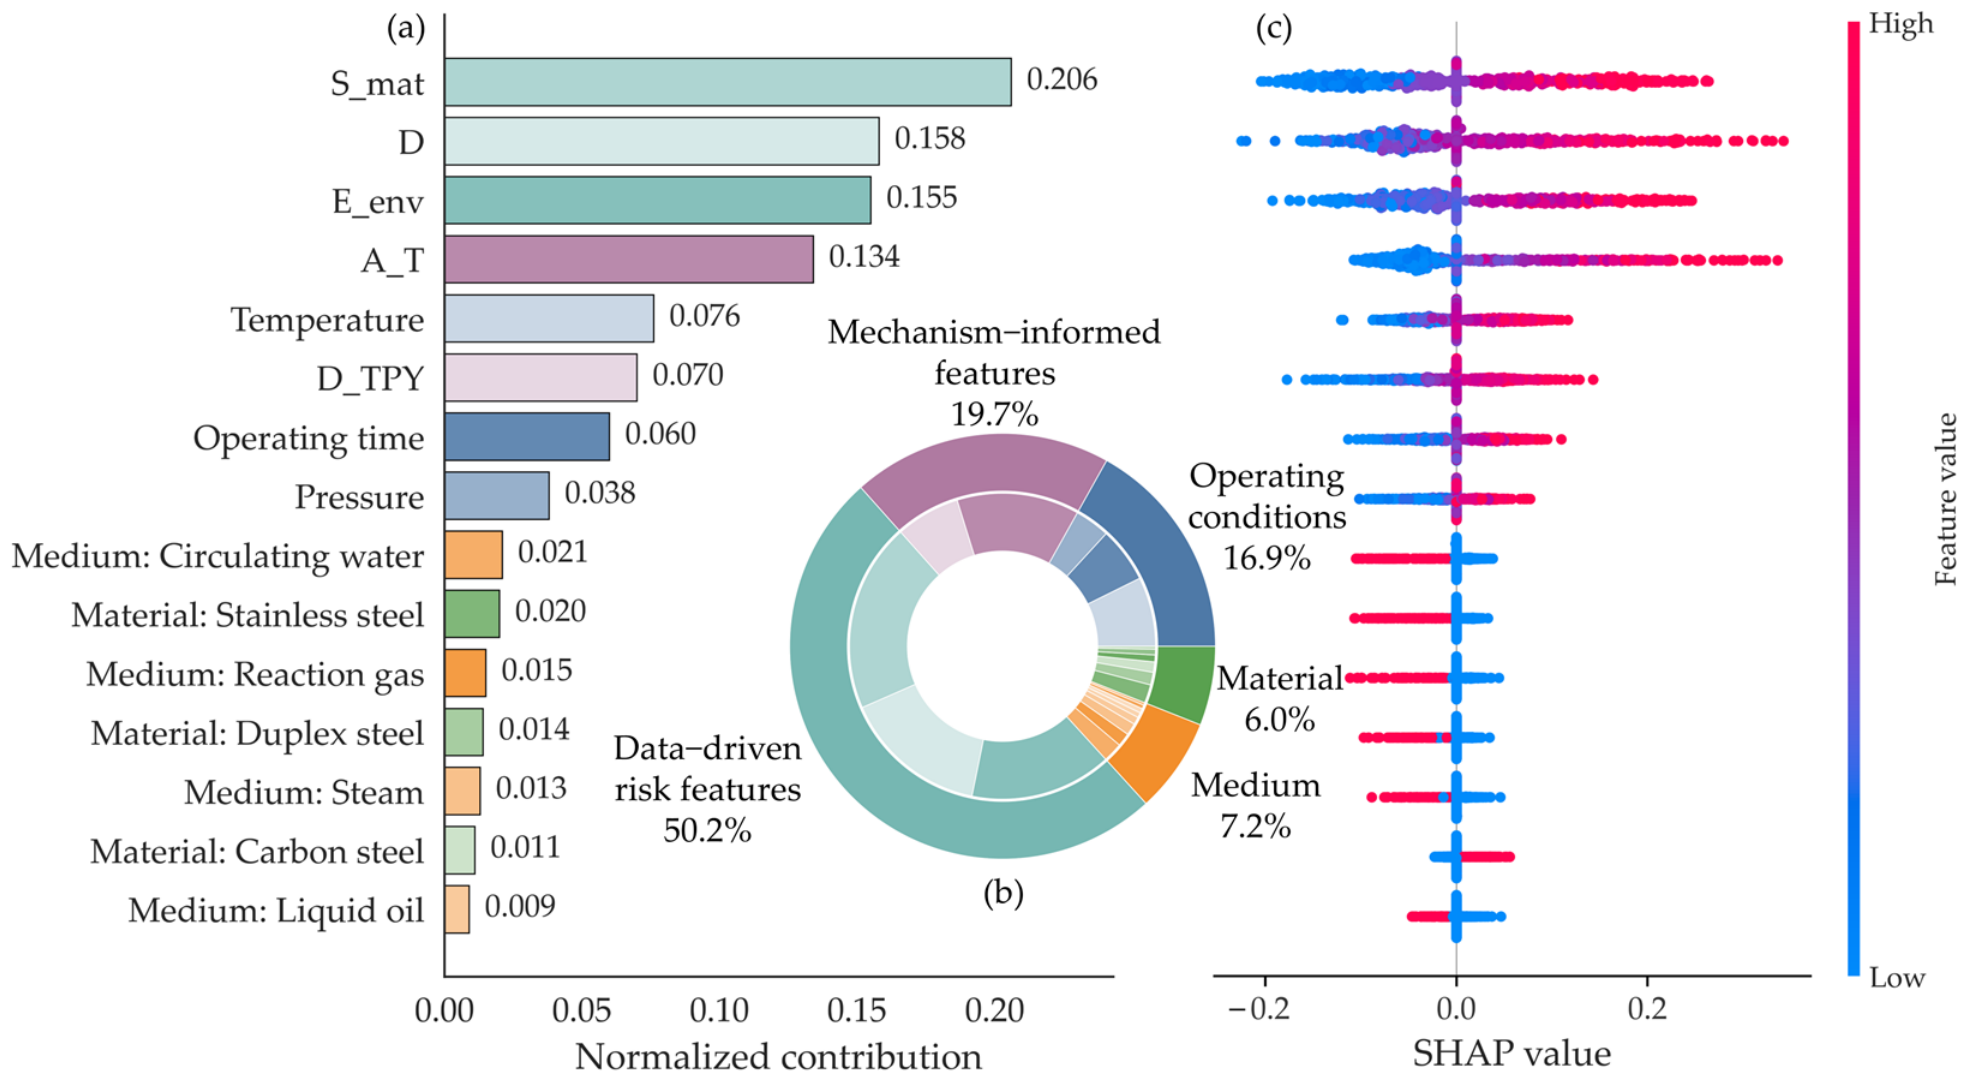
Figure 9 interprets S4 using the same out-of-fold SHAP procedure as that employed for damage-type prediction. Each record was explained by the model from its corresponding validation fold, after which the absolute SHAP values of all 660 records were aggregated to evaluate overall feature contributions. Because damage severity is ordinal, the expected severity level predicted by the model was used as the explanation target. Positive SHAP values shift the prediction toward a higher severity level, whereas negative values shift it toward a lower level. The results show that the model jointly used the original operating variables, mechanism-informed features and data-driven risk encodings, while the comprehensive damage-driving index further integrated this information. These SHAP contributions represent model-level statistical associations and help explain the basis of the severity predictions.
Figure 9.
Feature importance and SHAP analysis for damage-severity prediction: (a) normalized feature importance; (b) hierarchical feature contributions; (c) SHAP beeswarm plot.
4.3. Comparison with Benchmark Models
To determine whether the observed gains depended on a particular model family, all comparison methods were evaluated using the same five-fold splits. Tree-based methods were examined for both tasks, while the damage-severity comparison also included conventional multiclass and ordinal alternatives. The results are summarized in Table 6 and Table 7.
Table 6.
Model performance for damage type prediction.
Table 7.
Model performance for damage severity prediction.
Among the comparison methods, HistGradientBoosting achieved the highest damage-type accuracy of 88.33%, with a macro-F1 of 86.78%. T3 reached 92.58% and 91.77%, respectively. The improvement was therefore reflected in both overall accuracy and class-balanced performance.
For damage-severity prediction, S4 achieved an accuracy of 93.94% and a macro-F1 of 92.72%. Its Ordinal MAE was 0.0606 and its QWK was 0.9709, compared with 0.2045 and 0.8922 for ordinal logistic regression. The remaining errors were confined to adjacent severity levels, consistent with the confusion matrix in Figure 8.
4.4. Discussion
The ablation results showed that the mechanism–data fusion features were the main source of improvement in damage-type prediction, while data balancing further improved the recognition of less represented classes. The complete model achieved a Precision of 95.53% and a Recall of 94.00% for corrosion, indicating a high level of corrosion-recognition performance. For damage-severity prediction, S2 and S3 performed similarly, whereas S4 achieved a more pronounced improvement, suggesting that this task benefited from the ordinal information among damage-severity levels. This difference reflected the distinct information requirements of the two prediction tasks and was consistent with the general findings of data-fusion and ordinal-classification studies.
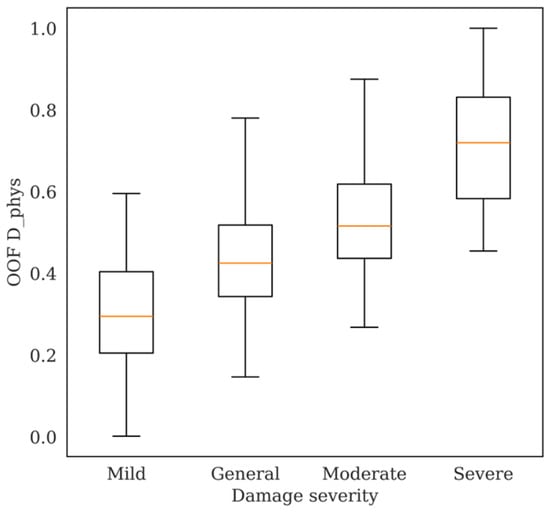
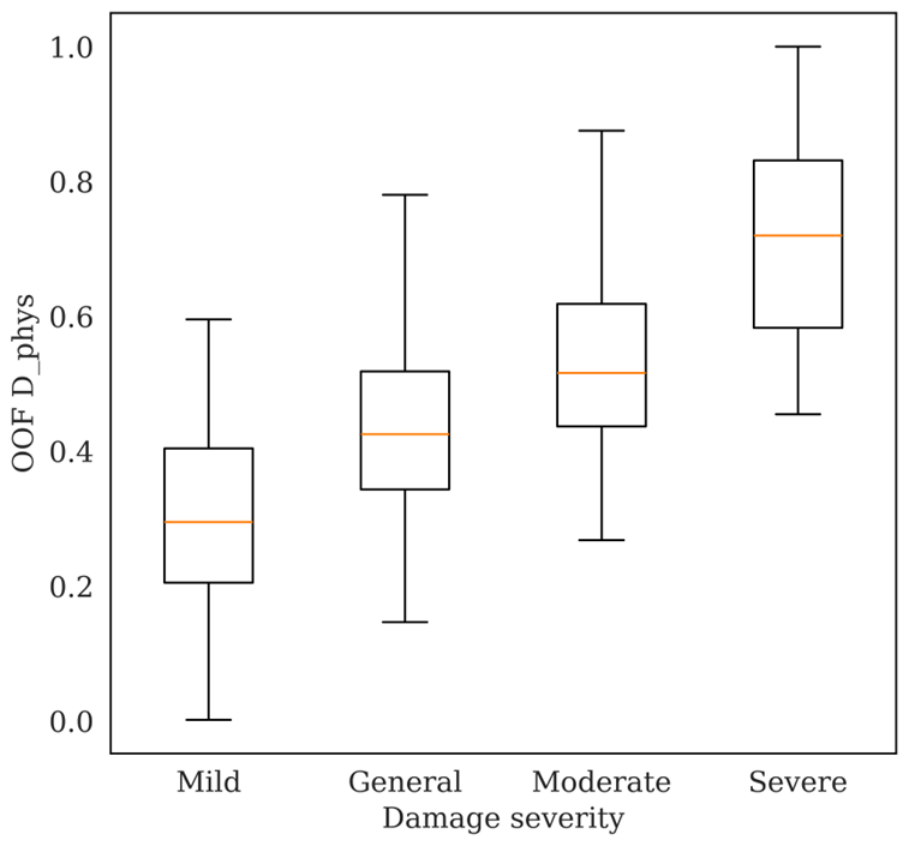
Data analysis showed that Dphys was positively correlated with the observed damage severity, with a Spearman correlation coefficient of 0.6682. A proportion of sample pairs still exhibited ordering violations, suggesting that damage evolution follows an overall trend while retaining equipment-specific variation. The consistency constraint guided the model to learn this general trend while accommodating individual differences in the engineering data. The distributions of Dphys across the damage-severity levels are presented in Figure 10.
Figure 10.
Distribution of the label-independent physical trend index Dphys across damage-severity levels.
The case λ = 0 represents the cumulative ordinal model alone. Increasing λ from 0 to 0.8 reduced the prediction-order violation rate from 18.84% to 15.14%, while the mean accuracy changed from 93.79% to 93.94%. The main experimental conclusions also remained stable under different weighting schemes for the comprehensive damage-driving index and different data-balancing strengths. The corresponding curves and complete numerical results are provided in the Supplementary Materials.
The SHAP results showed that the model decisions were jointly supported by the original operating conditions and the constructed features. Information on process medium and equipment material influenced the prediction of different damage types, while temperature and cumulative service exposure provided complementary contributions. This distribution of feature contributions indicated that the model captured differences in service conditions among the equipment and accounted for the cumulative effects of long-term exposure. The SHAP contributions represent model-level statistical associations learned from the inspection records and help explain the basis of the predictions. In practical applications, model predictions can be combined with nondestructive examination and engineering assessment to identify equipment requiring priority attention. Future work may incorporate prospective inspection records to further evaluate model applicability across different equipment populations.
5. Conclusions
This study developed a mechanism–data fusion framework for classifying corrosion and related damage types and predicting damage severity using 660 operating and inspection records from high-temperature equipment. The models were evaluated through stratified five-fold cross-validation, ablation experiments and sensitivity analyses. The following conclusions were drawn:
(1) A temperature activation factor and a high-temperature and high-pressure cumulative exposure index were constructed to represent the effects of temperature and long-term service exposure on damage development. Information on process media and equipment materials was transformed into data-driven risk encodings and subsequently combined with the mechanism-informed features to form the comprehensive damage-driving index. These constructed features captured damage-related information that was difficult to express directly through the original operating parameters and provided the main contribution to the improvement in model performance.
(2) For damage-type prediction, data balancing supported the recognition of less represented classes. With the complete feature set, T3 achieved an accuracy of 92.58% while maintaining strong corrosion-recognition performance. To account for the ordinal nature of damage severity, S4 incorporated cumulative ordinal modeling and a mechanism-consistency constraint. It achieved an accuracy of 93.94%, with all remaining misclassifications confined to adjacent severity levels.
(3) The SHAP analysis showed that the model predictions were jointly supported by operating conditions, mechanism-informed features and data-driven risk encodings. The sensitivity analyses further indicated that the main experimental conclusions remained stable under changes in the consistency-constraint strength, the weights of the comprehensive index and the data-balancing strength. In practical applications, records associated with corrosion or severe damage may be prioritized for wall-thickness examination and earlier reinspection, while final maintenance decisions should remain supported by nondestructive examination and engineering assessment.
Supplementary Materials
The following supporting information can be downloaded at https://www.mdpi.com/article/10.3390/cmd7040060/s1, Figure S1: Sensitivity to the mechanism-consistency weight λ. (a) Accuracy with five-fold standard deviations; (b) Spearman correlation between predicted severity and the label-independent physical trend index; and (c) prediction-order violation rate. Figure S2: Sensitivity to the weighting scheme of the comprehensive damage-driving index. Error bars show five-fold standard deviations. The equal-weight setting assigns 0.25 to each component. Figure S3: Sensitivity to the partial random over-sampling strength ρ for (a) damage-type classification and (b) damage-severity prediction. Error bars show five-fold standard deviations. The main experiments used ρ = 0.30 for damage-type classification and ρ = 0.15 for damage-severity prediction. Table S1: Complete numerical results of the sensitivity analyses, including (a) consistency weight λ, (b) index weighting, (c) damage-type resampling strength ρ, and (d) damage-severity resampling strength ρ. Table S2: Complete benchmark and ordinal-model comparisons, including (a) damage-type prediction and (b) damage-severity prediction.
Author Contributions
Conceptualization, J.L. (Jiaxuan Li), S.L., J.L. (Jinghai Li) and L.C.; methodology, J.L. (Jiaxuan Li), J.Y., C.S., H.L., Z.D. and L.C.; software, J.L. (Jiaxuan Li); validation, J.L. (Jiaxuan Li), S.L., Q.W., C.S., H.L., Z.D. and L.C.; formal analysis, J.L. (Jiaxuan Li) and C.S.; investigation, J.Y., Q.W. and L.C.; resources, S.L., Q.W. and L.C.; data curation, J.Y., Q.W. and L.C.; writing—original draft preparation, J.L. (Jiaxuan Li); writing—review and editing, all authors; visualization, J.L. (Jiaxuan Li); supervision, J.L. (Jinghai Li) and Z.D.; project administration, S.L., Z.D. and L.C.; funding acquisition, S.L., Q.W., C.S. and L.C. All authors have read and agreed to the published version of the manuscript.
Funding
This research was funded by Beijing Natural Science Foundation, grant number L259006; Shaanxi Province Market Supervision System Tech R&D Project, grant number 2025KY21.
Data Availability Statement
The data presented in this study are available on request from the first author and corresponding author.
Conflicts of Interest
Shaopeng Li is employed by Sinopec Engineering Incorporation. The remaining authors declare no conflicts of interest.
Abbreviations
The following abbreviations are used in this manuscript:
| MLP | Multilayer Perceptron |
| SHAP | SHapley Additive exPlanations |
| ReLU | Rectified Linear Unit |
| MAE | Mean Absolute Error |
| QWK | Quadratic Weighted Kappa |
| XGBoost | Extreme Gradient Boosting |
| LightGBM | Light Gradient Boosting Machine |
References
- Taylor, C.D.; Tossey, B.M. High Temperature Oxidation of Corrosion Resistant Alloys from Machine Learning. npj Mater. Degrad. 2021, 5, 38. [Google Scholar] [CrossRef] [Scilit]
- Wang, R.; Chu, G.; Zhang, J.; Liu, R.; Wang, Y.; Sun, L.; Cao, Z.; Song, L.; Ma, F. Influence of Stress on Corrosion Behavior and Evolution Model of Q235 Steel in Marine Environments. Int. J. Press. Vessel. Pip. 2025, 214, 105388. [Google Scholar] [CrossRef] [Scilit]
- Bhardwaj, H.K.; Shukla, M. Corrosion Fatigue Life Prediction of Multiple Austenitic Stainless Steel Grades in High-Temperature, High-Pressure Water Environments Using a Ga-Optimized Neural Network. Sci. Rep. 2025, 15, 39526. [Google Scholar] [CrossRef] [Scilit] [PubMed]
- Ma, S.; Du, Y.; Wang, S.; Su, Y. Application of Machine Learning in Material Corrosion Research. Corros. Rev. 2023, 41, 417–426. [Google Scholar] [CrossRef] [Scilit]
- Chen, Q.; Wang, H.; Ji, H.; Ma, X.; Cai, Y. Data-Driven Atmospheric Corrosion Prediction Model for Alloys Based on a Two-Stage Machine Learning Approach. Process Saf. Environ. Prot. 2024, 188, 1093–1105. [Google Scholar] [CrossRef] [Scilit]
- Li, C.; Xu, K.; Lou, M.; Wang, L.; Chang, K. Machine Learning-Enabled Prediction of High-Temperature Oxidation Resistance for Ni-Based Alloys. Corros. Sci. 2024, 234, 112152. [Google Scholar] [CrossRef] [Scilit]
- Zhang, Y.; Yang, L.; Fang, H.; Ma, Y.; Ning, B. Assessment for Burst Failure of Subsea Production Pipeline Systems Based on Machine Learning. Ocean Eng. 2024, 304, 117873. [Google Scholar] [CrossRef] [Scilit]
- Xu, L.; Wen, S.; Huang, H.; Tang, Y.; Wang, Y.; Pan, C. Corrosion Failure Prediction in Natural Gas Pipelines Using an Interpretable Xgboost Model: Insights and Applications. Energy 2025, 325, 136157. [Google Scholar] [CrossRef] [Scilit]
- Chawla, N.V.; Bowyer, K.W.; Hall, L.O.; Kegelmeyer, W.P. Smote: Synthetic Minority over-Sampling Technique. J. Artif. Intell. Res. 2002, 16, 321–357. [Google Scholar] [CrossRef] [Scilit]
- LemaÃŽtre, G.; Nogueira, F.; Aridas, C.K. Imbalanced-Learn: A Python Toolbox to Tackle the Curse of Imbalanced Datasets in Machine Learning. J. Mach. Learn. Res. 2017, 18, 1–5. [Google Scholar]
- Wang, H.; Barone, G.; Smith, A. Current and Future Role of Data Fusion and Machine Learning in Infrastructure Health Monitoring. Struct. Infrastruct. Eng. 2024, 20, 1853–1882. [Google Scholar] [CrossRef] [Scilit]
- Wu, W.; Xu, D.; Liu, L.; Wang, B.; Cheng, X.; Zhang, X.; Li, X. Fusion of Multi Source Data for Atmospheric Corrosion Evaluation Using Sensors and Image Recognition. npj Mater. Degrad. 2025, 9, 13. [Google Scholar] [CrossRef] [Scilit]
- Miao, X.; Zhao, H. Maximum Pitting Corrosion Depth Prediction of Buried Pipeline Based on Theory-Guided Machine Learning. Int. J. Press. Vessel. Pip. 2024, 210, 105259. [Google Scholar] [CrossRef] [Scilit]
- Wu, T.; Miao, X.; Song, F. Residual Strength Prediction of Corroded Pipelines Based on Physics-Informed Machine Learning and Domain Generalization. npj Mater. Degrad. 2025, 9, 12. [Google Scholar] [CrossRef] [Scilit]
- Karpatne, A.; Atluri, G.; Faghmous, J.H.; Steinbach, M.; Banerjee, A.; Ganguly, A.; Shekhar, S.; Samatova, N.; Kumar, V. Theory-Guided Data Science: A New Paradigm for Scientific Discovery from Data. IEEE Trans. Knowl. Data Eng. 2017, 29, 2318–2331. [Google Scholar] [CrossRef] [Scilit]
- Karniadakis, G.E.; Kevrekidis, I.G.; Lu, L.; Perdikaris, P.; Wang, S.; Yang, L. Physics-Informed Machine Learning. Nat. Rev. Phys. 2021, 3, 422–440. [Google Scholar] [CrossRef] [Scilit]
- Cao, W.; Mirjalili, V.; Raschka, S. Rank Consistent Ordinal Regression for Neural Networks with Application to Age Estimation. Pattern Recognit. Lett. 2020, 140, 325–331. [Google Scholar] [CrossRef] [Scilit]
- Nguyen, A.-P.; Moreno, D.L.; Le-Bel, N.; Rodríguez Martínez, M. Mononet: Enhancing Interpretability in Neural Networks Via Monotonic Features. Bioinform. Adv. 2023, 3, vbad016. [Google Scholar] [CrossRef] [Scilit] [PubMed]
- Batista, G.E.; Prati, R.C.; Monard, M.C. A Study of the Behavior of Several Methods for Balancing Machine Learning Training Data. ACM SIGKDD Explor. Newsl. 2004, 6, 20–29. [Google Scholar] [CrossRef] [Scilit]
- Kaufman, S.; Rosset, S.; Perlich, C.; Stitelman, O. Leakage in Data Mining: Formulation, Detection, and Avoidance. ACM Trans. Knowl. Discov. From Data (TKDD) 2012, 6, 1–21. [Google Scholar]
- Micci-Barreca, D. A Preprocessing Scheme for High-Cardinality Categorical Attributes in Classification and Prediction Problems. SIGKDD Explor. Newsl. 2001, 3, 27–32. [Google Scholar] [CrossRef] [Scilit]
- Kook, L.; Herzog, L.; Hothorn, T.; Dürr, O.; Sick, B. Deep and Interpretable Regression Models for Ordinal Outcomes. Pattern Recognit. 2022, 122, 108263. [Google Scholar] [CrossRef] [Scilit]
- Zhu, B.; Ren, S.; Weng, Q.; Si, F. A Physics-Informed Neural Network That Considers Monotonic Relationships for Predicting Nox Emissions from Coal-Fired Boilers. Fuel 2024, 364, 131026. [Google Scholar] [CrossRef] [Scilit]
- Wu, Y.; Sicard, B.; Gadsden, S.A. Physics-Informed Machine Learning: A Comprehensive Review on Applications in Anomaly Detection and Condition Monitoring. Expert Syst. Appl. 2024, 255, 124678. [Google Scholar] [CrossRef] [Scilit]

Disclaimer/Publisher’s Note: The statements, opinions and data contained in all publications are solely those of the individual author(s) and contributor(s) and not of MDPI and/or the editor(s). MDPI and/or the editor(s) disclaim responsibility for any injury to people or property resulting from any ideas, methods, instructions or products referred to in the content. |
© 2026 by the authors. Licensee MDPI, Basel, Switzerland. This article is an open access article distributed under the terms and conditions of the Creative Commons Attribution (CC BY) license.