


Abstract
Models are described for calculating the crack initiation times for Alloy 600 and Type 304 SS in PWR and BWR primary coolant circuits, respectively. In PWRs, initiation is defined in terms of the grain boundary oxidation concept of Scott and Le Calvar, whereas in BWRs, cracks are envisioned to nucleate from corrosion pits. In contrast, in BWRs, we envision cracks to nucleate from corrosion pits, with the difference in the two systems being primarily due to electrochemical factors. Thus, in BWR primary coolant and the absence of hydrogen water chemistry (HWC), the oxidizing conditions due to the radiolytic production of H2O2 cause the ECP to be significantly more positive than the critical pitting potential. Accordingly, the nucleation and growth of pits due to passivity breakdown and the establishment of differential aeration between the pit nucleus’s internal and external environments, which results in growth of pits to the critical size necessary to satisfy the Kondo criteria for transition of a pit into a crack, is judged to be a realistic scenario. Contrariwise, in PWR primary coolant, the ECP is so negative [≈−1.0 Vshe] due to the large amount of pressurizing H2 present in the circuit [20–60 cm3(STP)/kg H2O] that the nucleation and growth of pits is not possible. However, Totsuka and Smialowska found that MA Alloy 600 suffers hydrogen-induced cracking (HIC) at an ECP < −0.85 Vshe, demonstrating that, in service with a high hydrogen concentration, brittle fractures will occur. The initiation sites were not identified. The crack initiation models for Alloy 600 in PWRs and Type 304 SS in BWRs reproduce the effects of the following independent variables: applied stress, temperature, cold work, grain boundary segregations, water chemistry, pH, and electrochemical potential. The origins of the observed scatter in experimentally measured crack initiation times are discussed, and the challenges of developing a more general crack initiation model (GCIM) are identified. From a mathematical viewpoint, the most significant challenge arises from the nested distributions involving the many parameters and expressions within the GCIM that are either distributed because of an imprecise definition or because some experimentally determined input parameters are experimentally scattered. Additionally, the evolution of semi-elliptical surface cracks resulting from the electrochemical crack length (ECL) being shorter than the classical mechanical crack length (MCL) must be incorporated if the GCIM is to find utility in the water-cooled nuclear power industry where semi-elliptical surface cracks are normally observed.
1. Introduction
Crack initiation has been described as the “last great problem in predicting the evolution of SCC damage in reactor coolant circuits” [1] because it represents a significant fraction of the observed failure time and has proven intractable to treat in a minimally complicated manner [1,2,3,4,5,6,7,8,9,10,11,12,13,14,15,16,17,18,19,20,21,22,23,24,25,26,27,28,29,30,31,32,33,34,35,36,37,38,39,40,41,42,43,44,45,46,47,48,49,50,51,52,53,54,55,56]. An acceptable failure time prediction cannot be achieved without accurately calculating the initiation time. Furthermore, the field has been almost entirely dominated by mechanics, particularly linear elastic fracture mechanics (LEFM), with little attention paid to chemistry and even less to electrochemical factors, despite the well-demonstrated significance of the latter two through experiments and theory [3,5,6,7,8,9,10]. Although LEFM has dominated the mechanical aspects, small-scale yielding (SSY) has been attempted with moderate success [4,6,10,11,12,14], as cracks often nucleate at blunt pits and surface gouges. The mechanism(s) of Scott and Le Calvar [3] and Scott and Combrade [5] for the internal oxidation of Alloy 600 comprise one such mechanism for crack initiation that has combined mechanics and chemistry/electrochemistry, albeit in a less than analytical manner. However, it has received widespread experimental support as a viable mechanism for environmentally assisted cracking (EAC) in PWRs. We developed an analytical model for calculating the crack initiation time in pressurized water reactors (PWRs), as described later in this paper. The model postulates that water penetrates the emergent grain boundaries and reacts with the Cr of Alloy 600 to form a point-defective Cr2O3 oxide layer that wedges open the grain boundary, with the rate of growth of the oxide being described by the point defect model (PDM) for passivity and passivity breakdown [18,21,23,28,31,34,36,57,58].
On the other hand, for BWRs, cracks are envisioned to nucleate in Type 304 SS from corrosion pits or other stress raisers (e.g., machining marks), when the depth of the pit attains a critical value that is consistent with the prevailing stress such that the Kondo criteria are satisfied, including that KI > KISCC. The nucleation of the pit is described in terms of the point defect model, and pit growth is modeled by the coupled environment pitting model (CEPM) and the coupled environment fracture model (CEFM) [40,42,46,48,49], which are essentially identical models without a stress/strain-activated metal dissolution process at the cavity bottom for the CEPM. As noted above, the crack initiation models for Alloy 600 in PWRs and Type 304 SS in BWRs reproduce the effects of the following independent variables: applied stress, temperature, cold work, grain boundary segregations, water chemistry, pH, and electrochemical potential. Once the cracks have nucleated in both alloys, the crack growth rate is modeled by the coupled environment fracture model (CEFM).
To emphasize the differences in the two systems (BWR vs. PWR), we note that, in PWRs, initiation is attributed by Scott and Le Calvar to their emergent grain boundary oxidation concept. In contrast, in BWRs, we envision cracks to nucleate from corrosion pits, with the difference in the two systems being primarily due to electrochemical factors, as outlined below. Thus, in BWR primary coolant and the absence of hydrogen water chemistry (HWC), the oxidizing conditions due to the radiolytic production of H2O2 cause the ECP to be more significant than the critical pitting potential. Accordingly, the nucleation and growth of pits due to passivity breakdown and the establishment of differential aeration between the pit nucleus’s internal and external environments, which would ensure growth of pits to the critical size necessary to satisfy the Kondo criteria for transition of a pit into a crack, is judged to be a realistic scenario. Contrariwise, in PWR primary coolant, the ECP is so negative [≈−1.0 Vshe] due to the large amount of pressurizing H2 present in the circuit [20–60 cm3(STP)/kg H2O] that the nucleation and growth of pits is not possible, despite the lower critical potential for the onset of HIC of ECPHIC = −0.85 Vshe [43]. Accordingly, cracks must nucleate at pre-existing flaws, such as emergent grain boundaries wedged open by oxide growth on the slit-like cavity’s internal walls, as Scott et al. proposed. Totsuka and Smialowska [43] found, however, that MA Alloy 600 suffers hydrogen-induced cracking (HIC) at an ECP < −0.85 Vshe, demonstrating that, in service with a high hydrogen concentration, brittle fractures will occur. The initiation sites were not identified.
Attempts to measure the crack initiation times (CITs) for materials in reactor coolant circuits generally produce highly scattered data, suggesting that a fundamental limit may exist in the measurement accuracy and the prediction of CITs [2,3,4,5,6,7,8,9,10,11,12,13,14,15,16,37,40,41,42,44,45,46,47,48,49,50,53,54,55,56]. If so, attempts to measure increasingly more accurate CITs may prove futile and, therefore, a waste of precious resources, including both time and money. In this paper, the authors outline why such a limitation may exist in practice and briefly discuss what information may be gleaned from crack initiation time data, even if the sought-after accuracy is not attainable.
2. Development of a Crack Initiation Model for PWRs
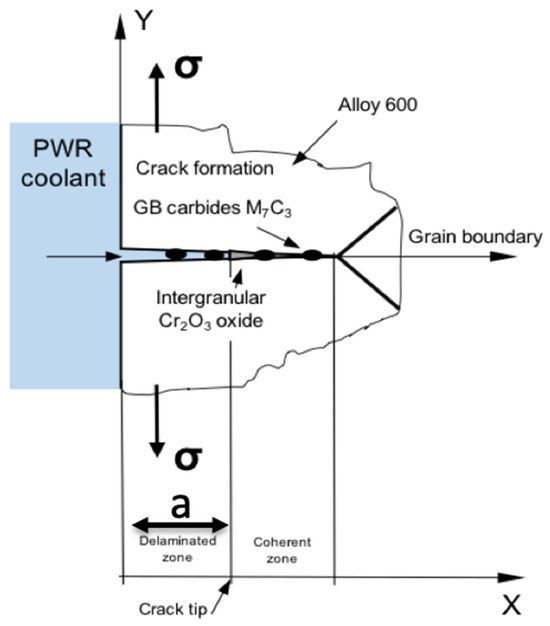
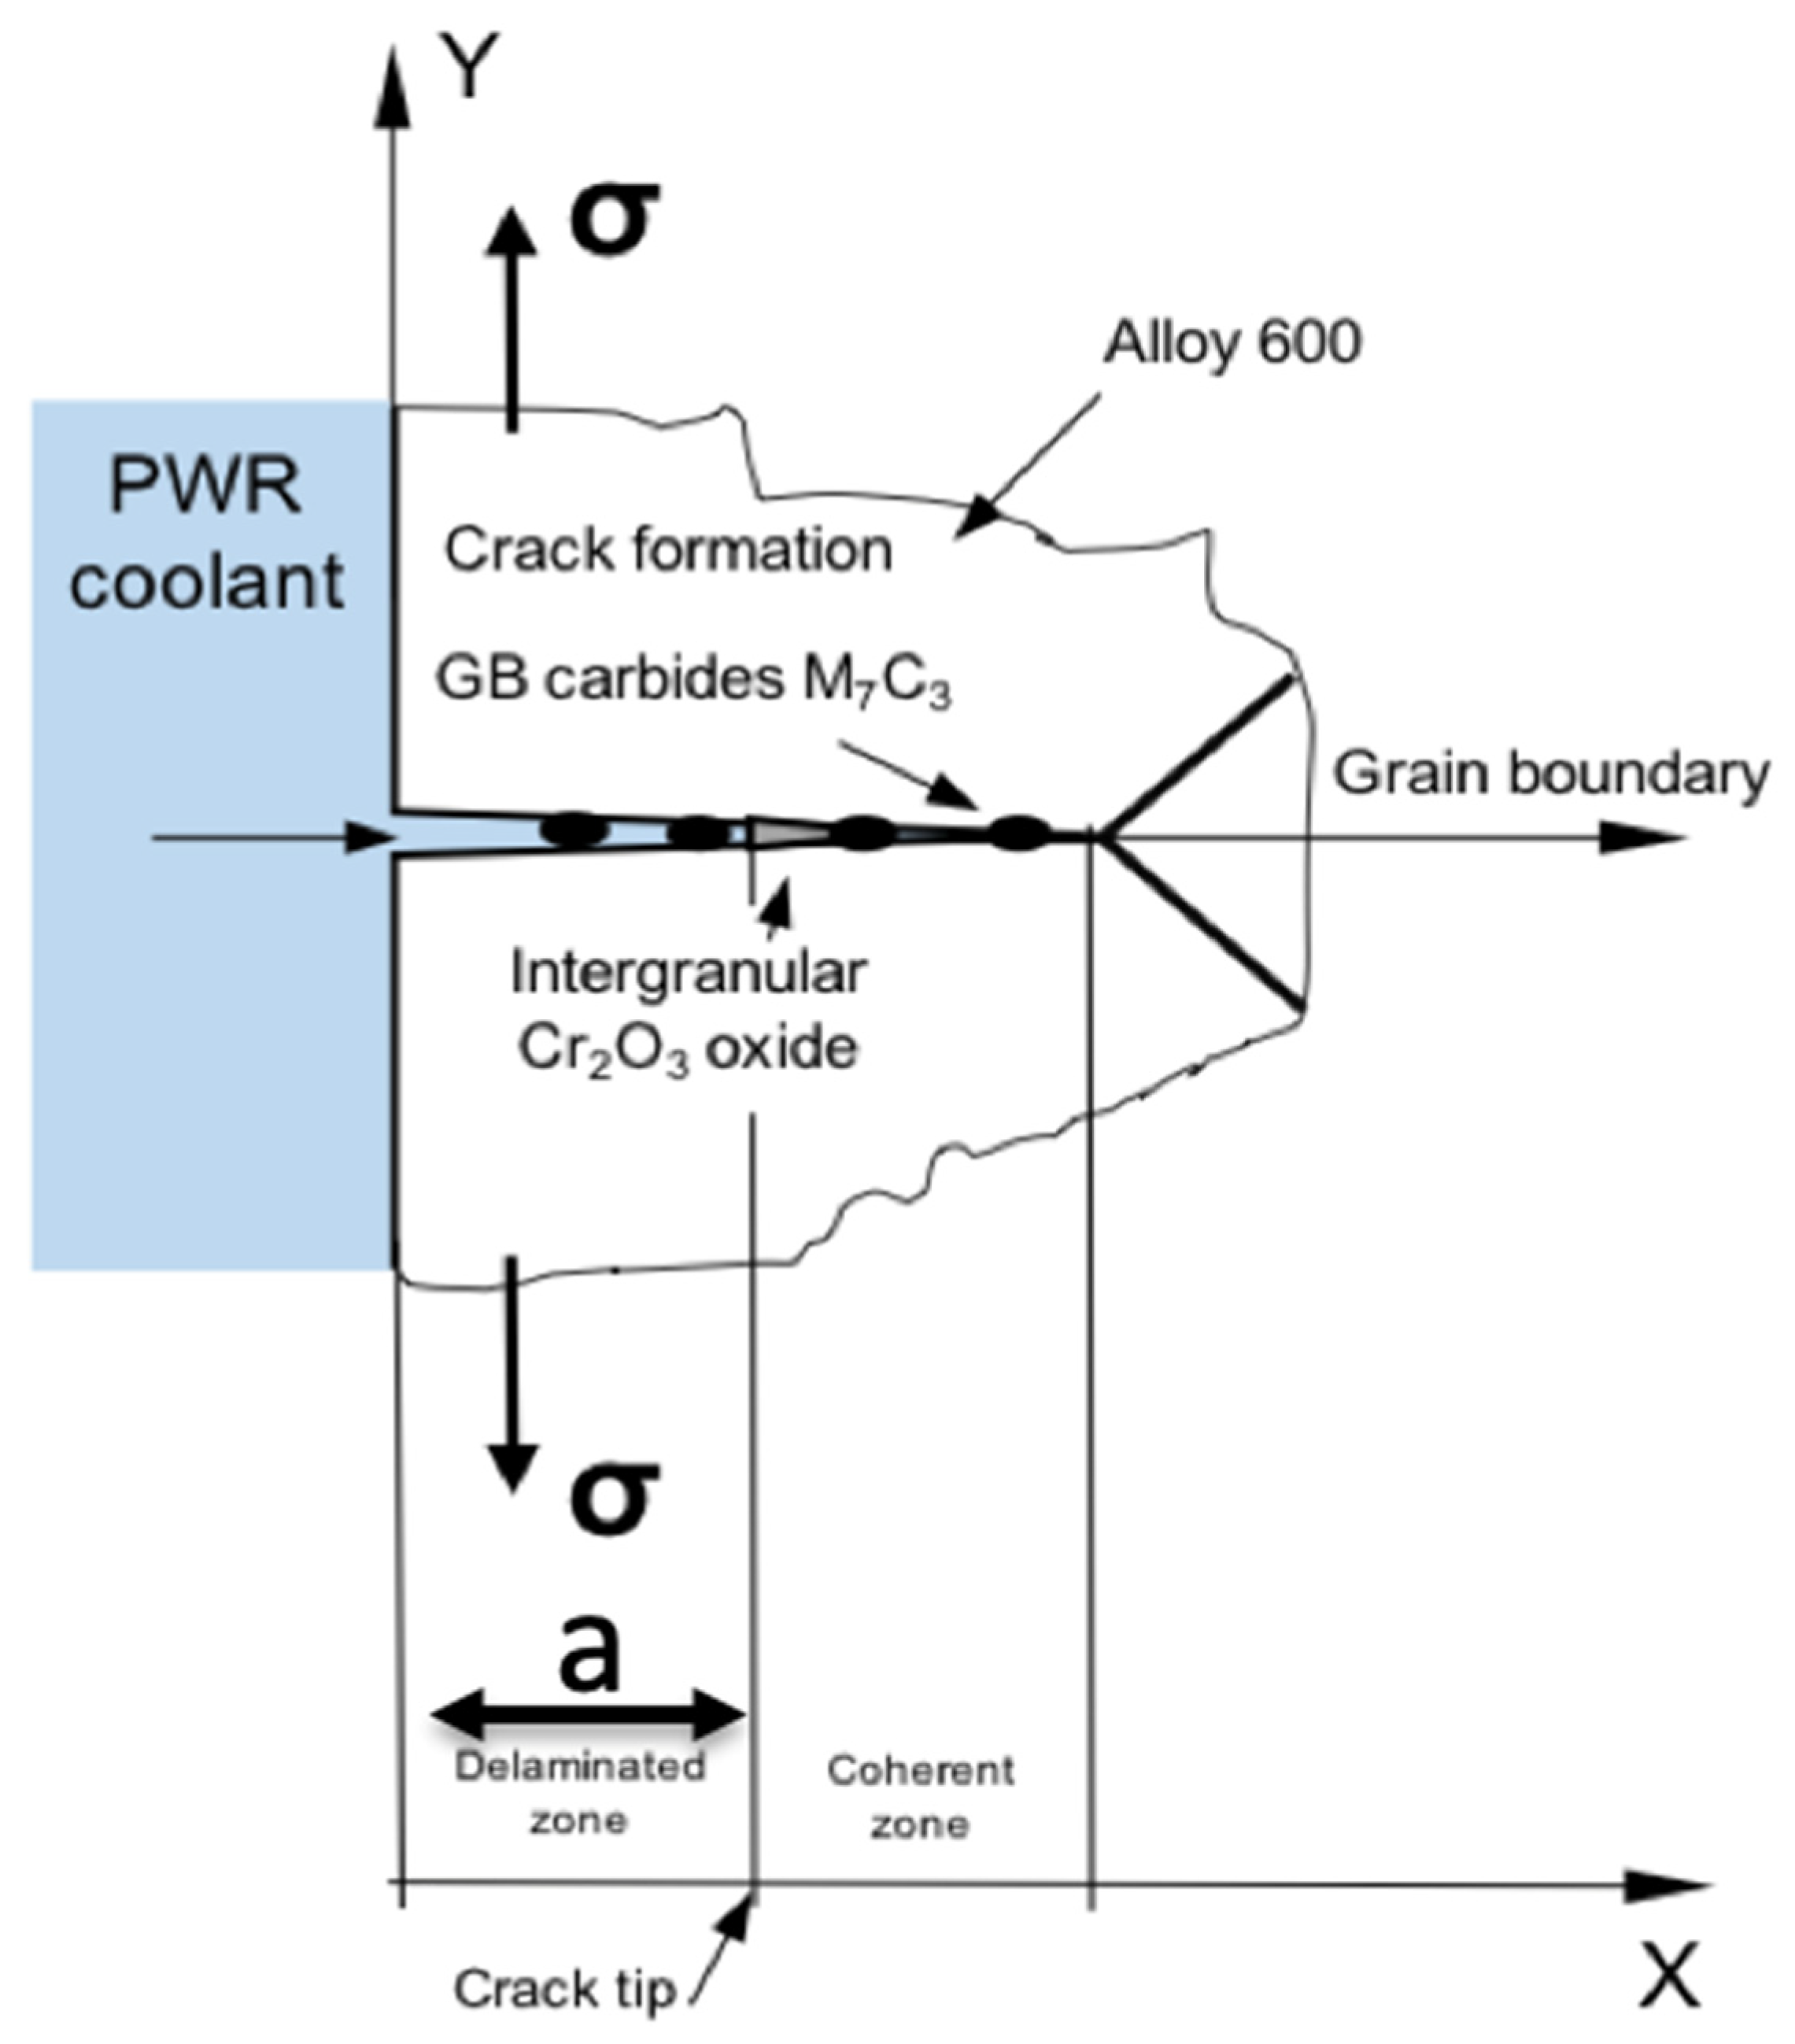
A literature survey revealed that the internal oxidation of Alloy 600 has received the most experimental support as a viable mechanism for the initiation of stress corrosion cracking in PWRs [3,5]. Based on the information collected from the literature, we developed a model for calculating the crack initiation time in PWRs. The model postulates that the water penetrates the emergent grain boundaries and reacts with the Cr of Alloy 600, forming a Cr2O3 oxide layer that wedges the grain boundary (Figure 1). The model can reasonably reproduce the effects of independent variables: applied stress, temperature, cold work, grain boundary segregations, water chemistry, pH, and electrochemical potential. As shown elsewhere, the CEFM is highly deterministic, with the predicted crack growth rate effectively constrained by natural laws [51]. The model is implemented in C, resulting in the computer code PWR_INI [51]. Features of the code PWR_INI are:
Figure 1.
Schematic of failure mechanism based on internal grain boundary oxidation.
- The code models crack initiation time based on the internal oxidation of grain boundaries in pressurized water reactors [3,5].
- The code is written in C and can be compiled on Windows and MAC OSX platforms [51].
- The Wilkinson and Vitek model [53,54] calculates the mechanical creep rate (MCR).
- The program calculates the Cr2O3 thickness using the PDM and applies the Griffith criterion for modeling the delamination of grain boundaries [15].
- The model includes the effects of cold work and grain boundary carbide structure on the initiation time.
The failure mechanism is illustrated in Figure 1. The process can be summarized as follows:
- The high-temperature PWR coolant penetrates the emergent grain boundaries, particularly at boundaries of low adhesion.
- The water reacts with the grain boundary Cr of Alloy 600 to form Cr2O3 in an electro-oxidation process (2Cr + 3H2O → Cr2O3 + 6H+ + 6e−).
- The growing oxide scale has a Pilling–Bedworth ratio of (2.07 > 1) [52], which decreases the cohesive strength of the grain boundary by wedging.
- The grain boundary fractures when the energy of the applied stress exceeds its cohesive strength, as the Griffith law describes [15].
- The crack grows toward the following grain boundary inclusion, and the damaging process starts over.
- At some point, the delaminated length of the grain boundary is such that KI > KISCC for the prevailing stress (residual plus operating), and the pit transitions into a microcriterion per the Kondo criteria. From then on, the length of the crack may be calculated using the CEFM, as described above.
- On any actual surface, the initiation sites activate progressively in a birth, living, death scenario that results in the extent of damage as described by the damage function [histogram of number of cracks of a specified length, e.g., Lmin < L < Lmax vs. crack length, L = (Lmin + Lmax)/2], in a manner that has already been achieved for pitting corrosion [58,59].
The model can be divided into two main parts: the electrochemical model and the mechanical model, as described below. The electrochemical part of the model employs the point defect model [17,18,19,20,21,22,23,24,25,26] to calculate the growth rate of the Cr2O3 film at grain boundaries in terms of various electrochemical parameters as a function of the corrosion potential, pH, and temperature. The mechanical basis of the model is the Griffith fracture criterion [15], from which one can calculate the external energy necessary for the delamination of the grain boundary. In our model, we modified the Griffith criterion to consider the effect of the growing oxide layer on the energy balance.
The point defect model (PDM) [17,18,19,20,21,22,23,24,25,26] describes the rate of growth of the chromic oxide within the separated grain boundary as:
where L is the thickness of the Cr2O3 layer; k3, and k7 are the rate constants for oxide growth and dissolution, respectively; Ω is the mole volume of Cr2O3 per cation; and n is the kinetic order of dissolution concerning the concentration of H+ (). The parameter, , is the standard-state hydrogen ion concentration. The rate constants are given in the form:
where is the standard rate constant and , , and are coefficients that are defined in the PDM in terms of more fundamental parameters. Note that, for = 1 to 3, is negative, but for = 4 to 7, , corresponding to point defect generation and annihilation reactions at the metal/barrier layer (m/bl) and barrier layer/solution (bl/s) interfaces, respectively. The values of all these parameters were determined by optimizing the PDM on electrochemical impedance spectroscopic data for passive Alloys 600 and 690 and for passive Types 304L and 316L stainless steels in PWR and BWR primary coolant at temperatures up to 300 °C [51,56]. Thus, according to Equation (2), k3 increases exponentially with increasing ECP, decreases with increasing barrier layer thickness (L), and decreases exponentially with increasing pH, while is independent of L. In the steady state, the impact of the ECP on k3 exactly counteracts the effects of L, such that k3 becomes a constant, as does the barrier layer thickness (Lss) [20]. The rate constant k7 also depends exponentially on the ECP. Still, this condition exists only if a change in the oxidation state of Cr occurs upon ejection from the barrier layer [e.g., Cr(III) → Cr(VI)], and it also does not depend on L.
Regarding the mechanical aspects of the model, we adopted the Griffith criterion for the fracture of a grain boundary [15], viz. , where is the surface energy and is the “clean” grain boundary energy. For the presence of the oxide, this criterion is modified to , where is the grain boundary energy of the oxide. The elastic energy () due to the applied stress () is:
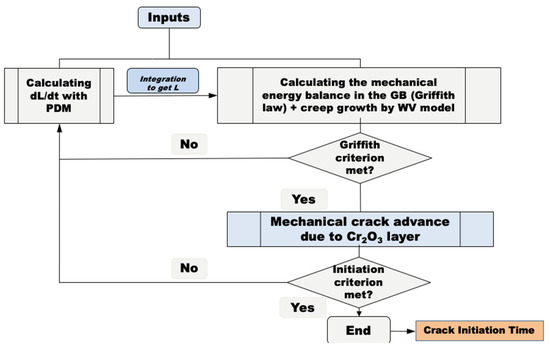
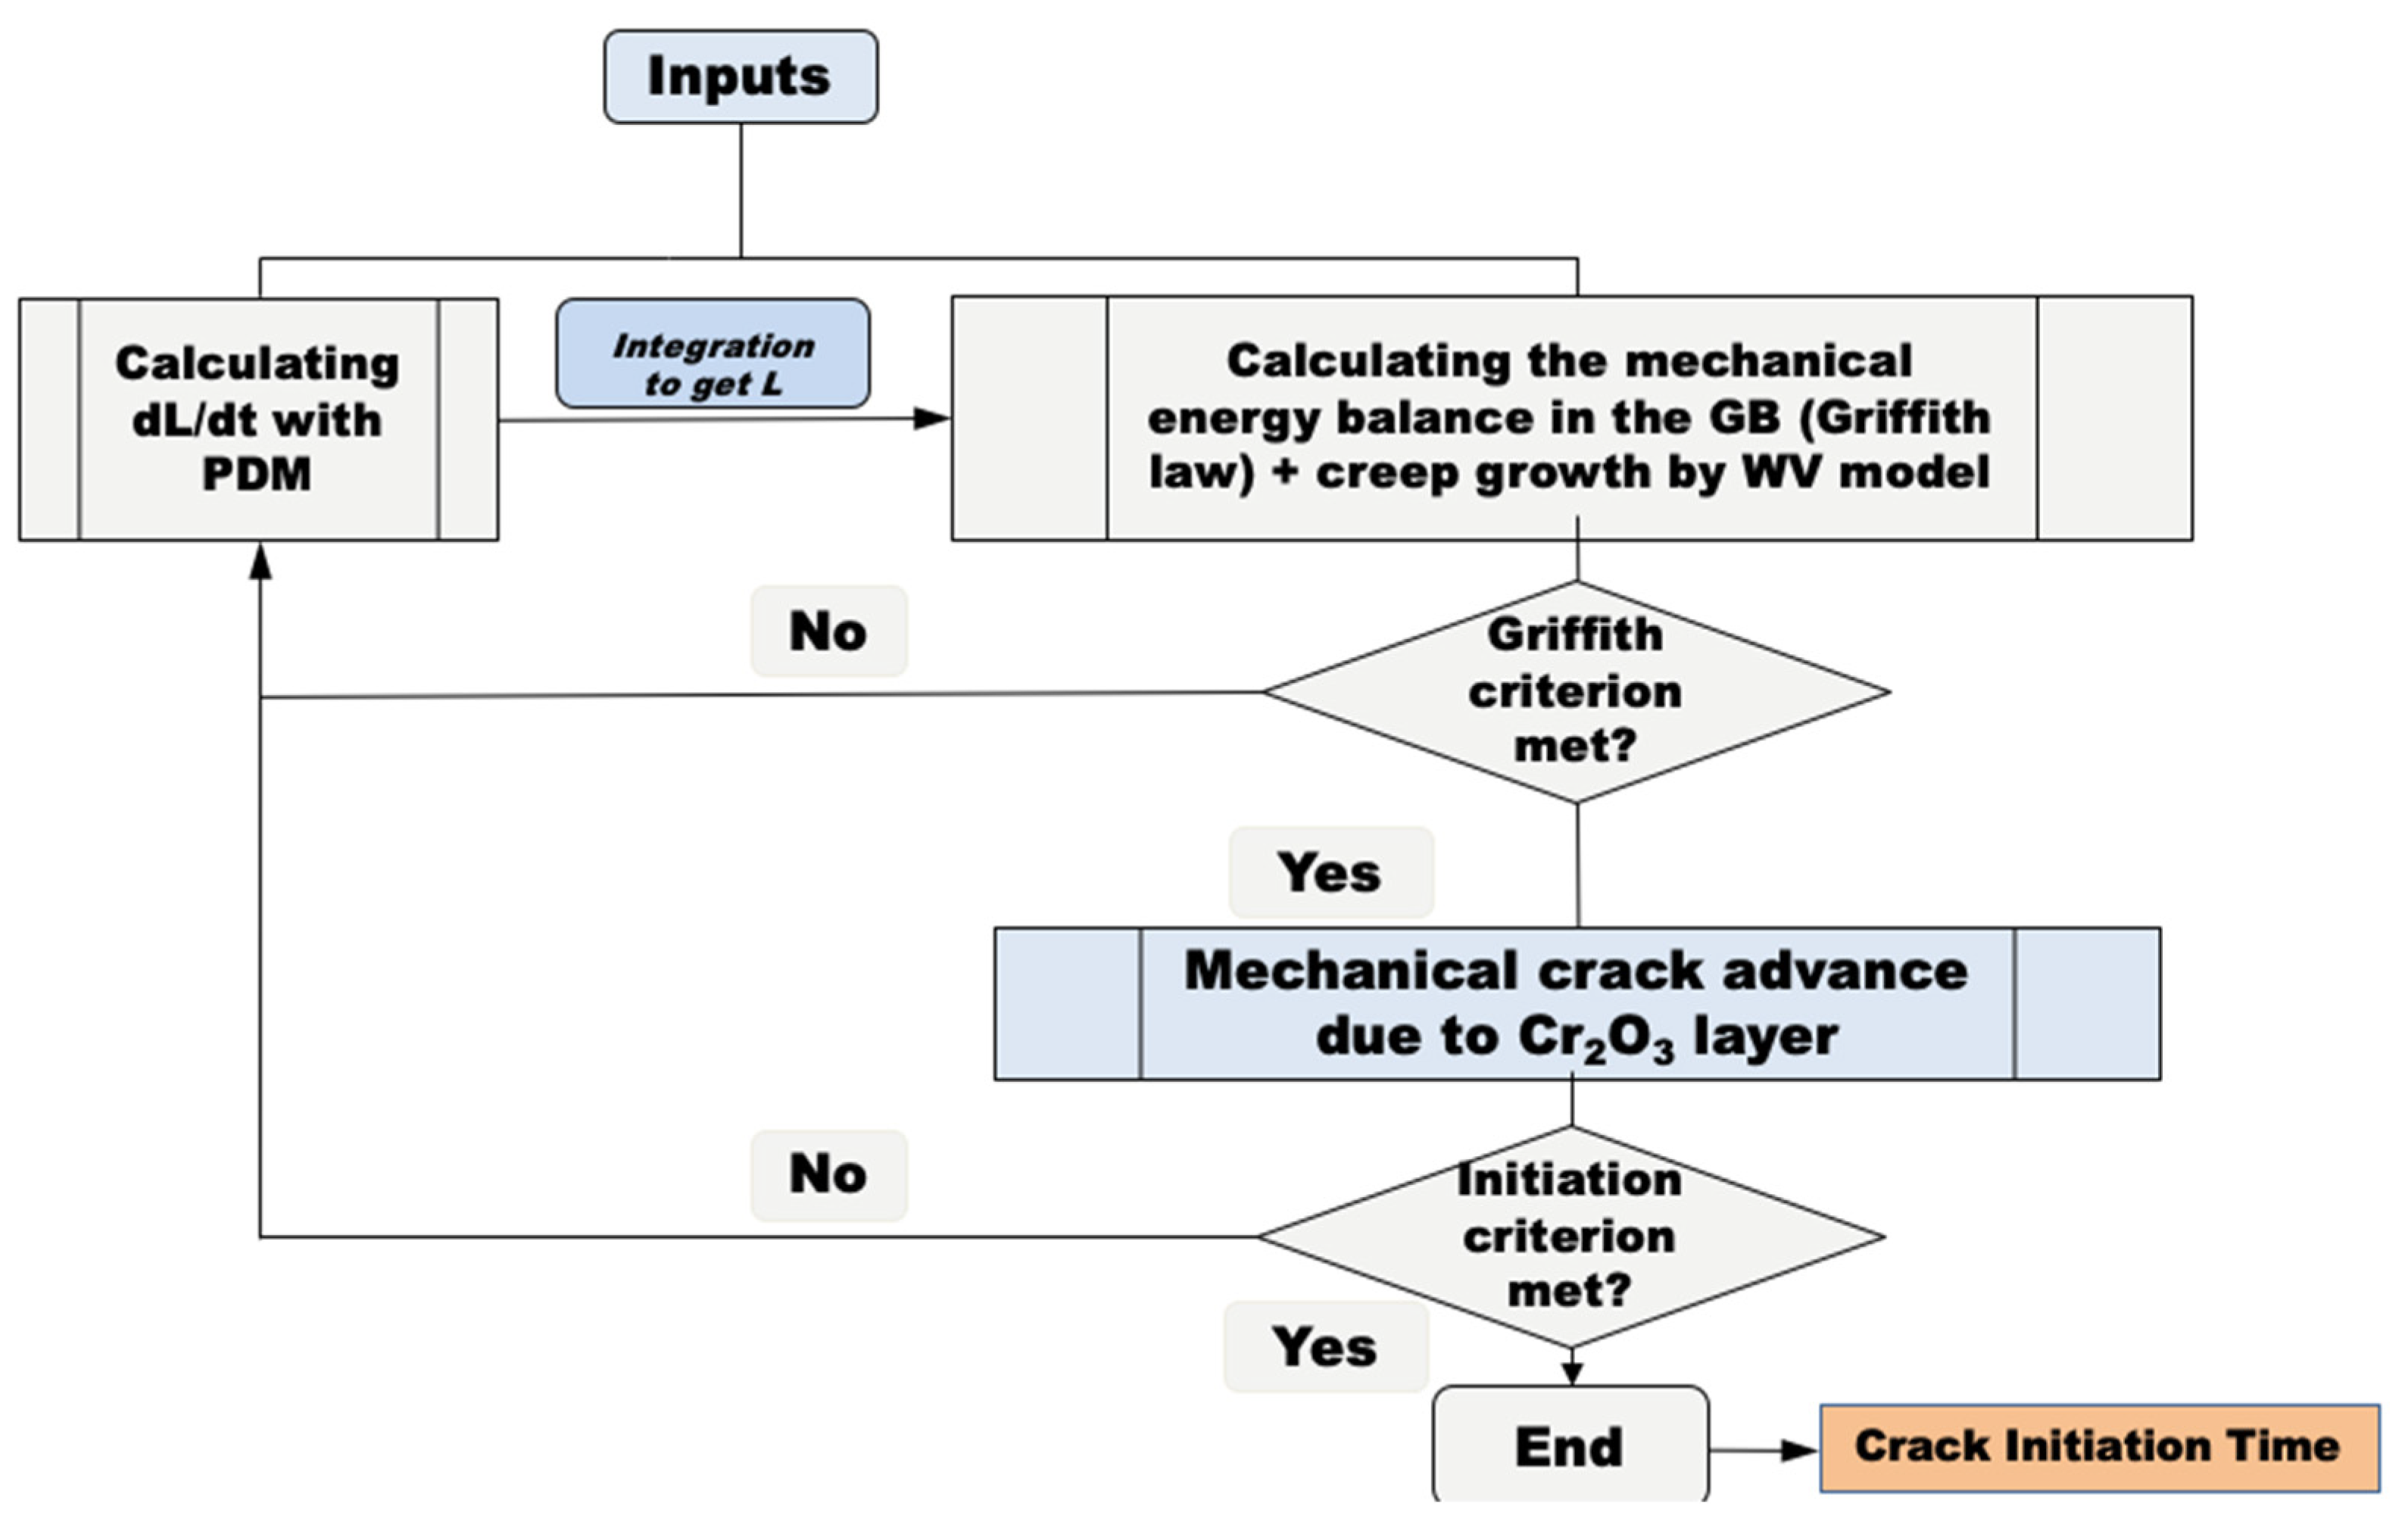
where is Poisson’s ratio and a is the crack length (Figure 1). The elastic strain energy of the growing oxide is , where is the elastic stress and is the elastic strain. The algorithm we developed for solving the initiation time is shown in Figure 2. The model continuously checks the value of KI as the crack grows due to internal oxidation and mechanical creep [53,54]. When KI > KISCC, the model treats the failure in terms of macroscopic, linear elastic fracture mechanics to yield the crack initiation time.
Figure 2.
Algorithm of the solution for the internal oxidation-based crack initiation time.
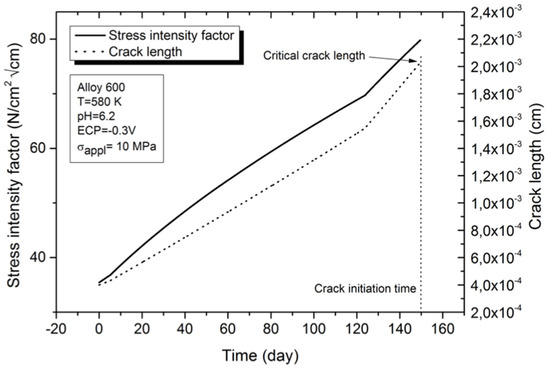
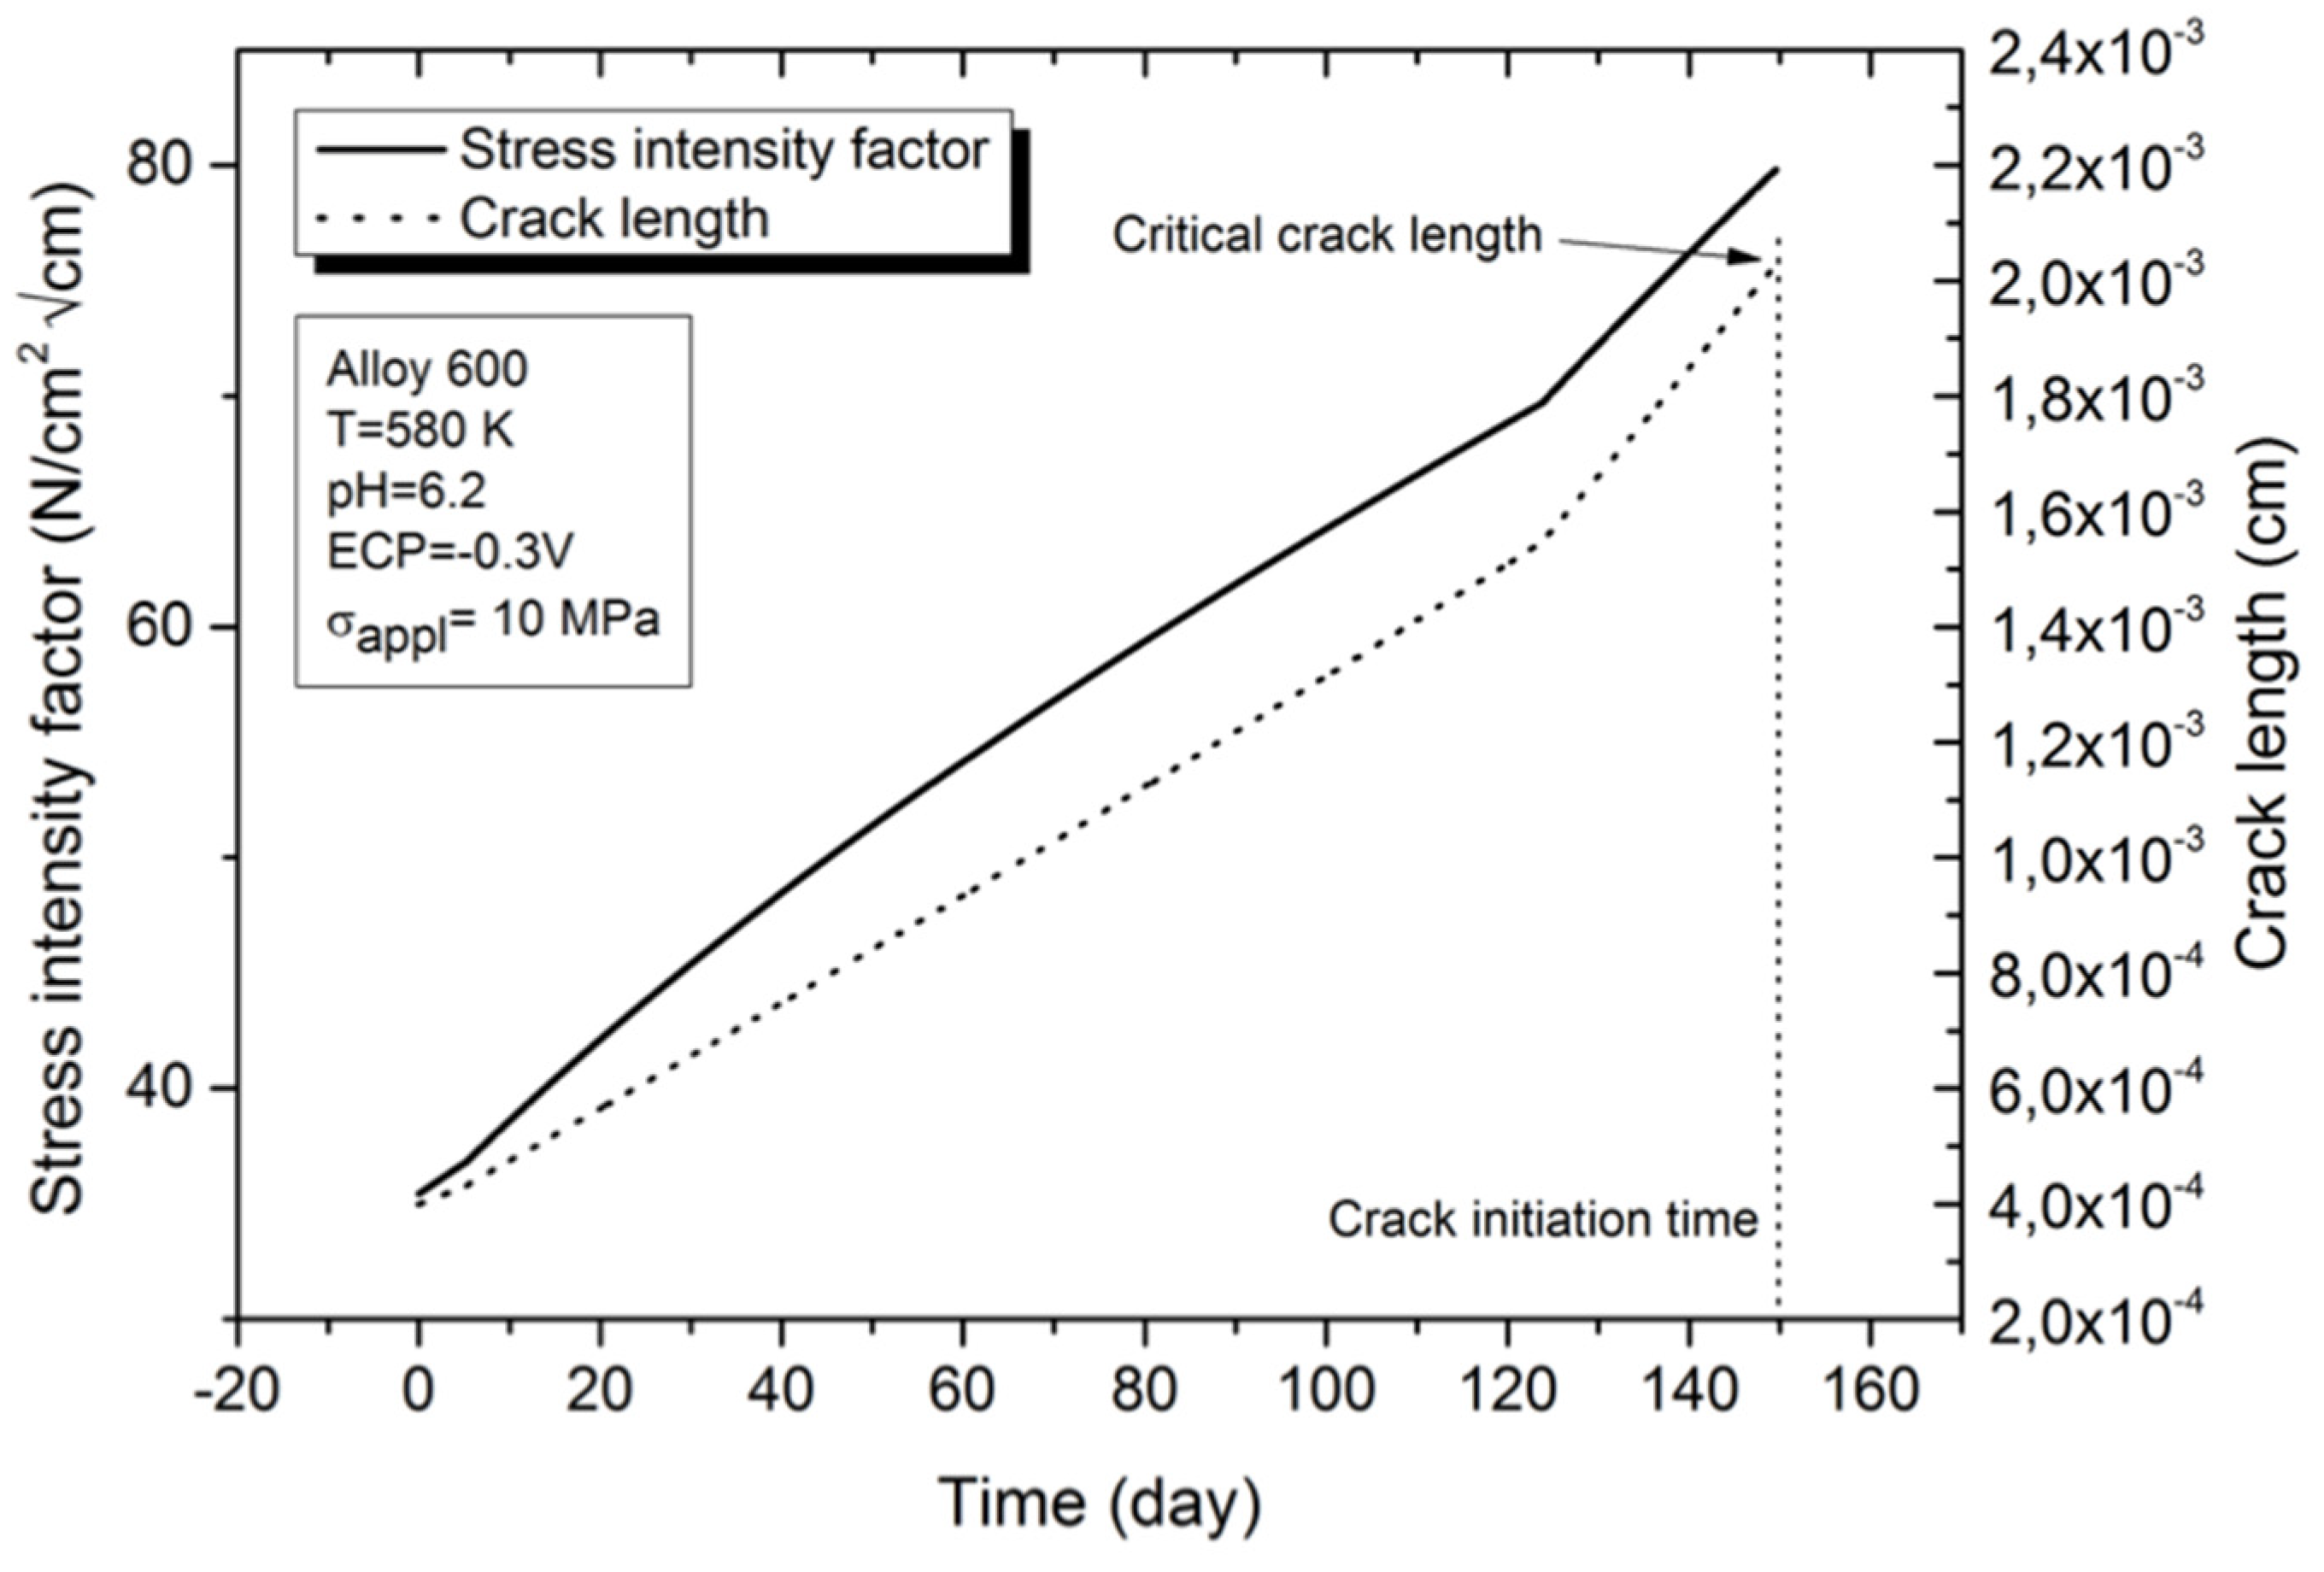
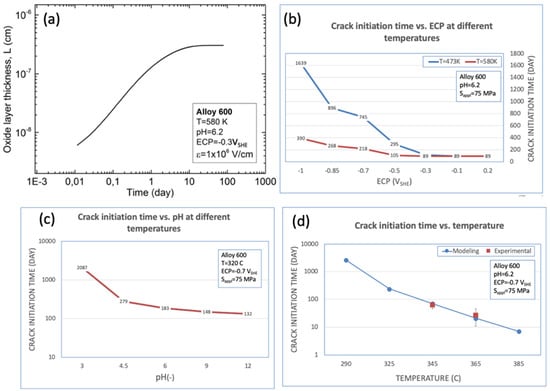
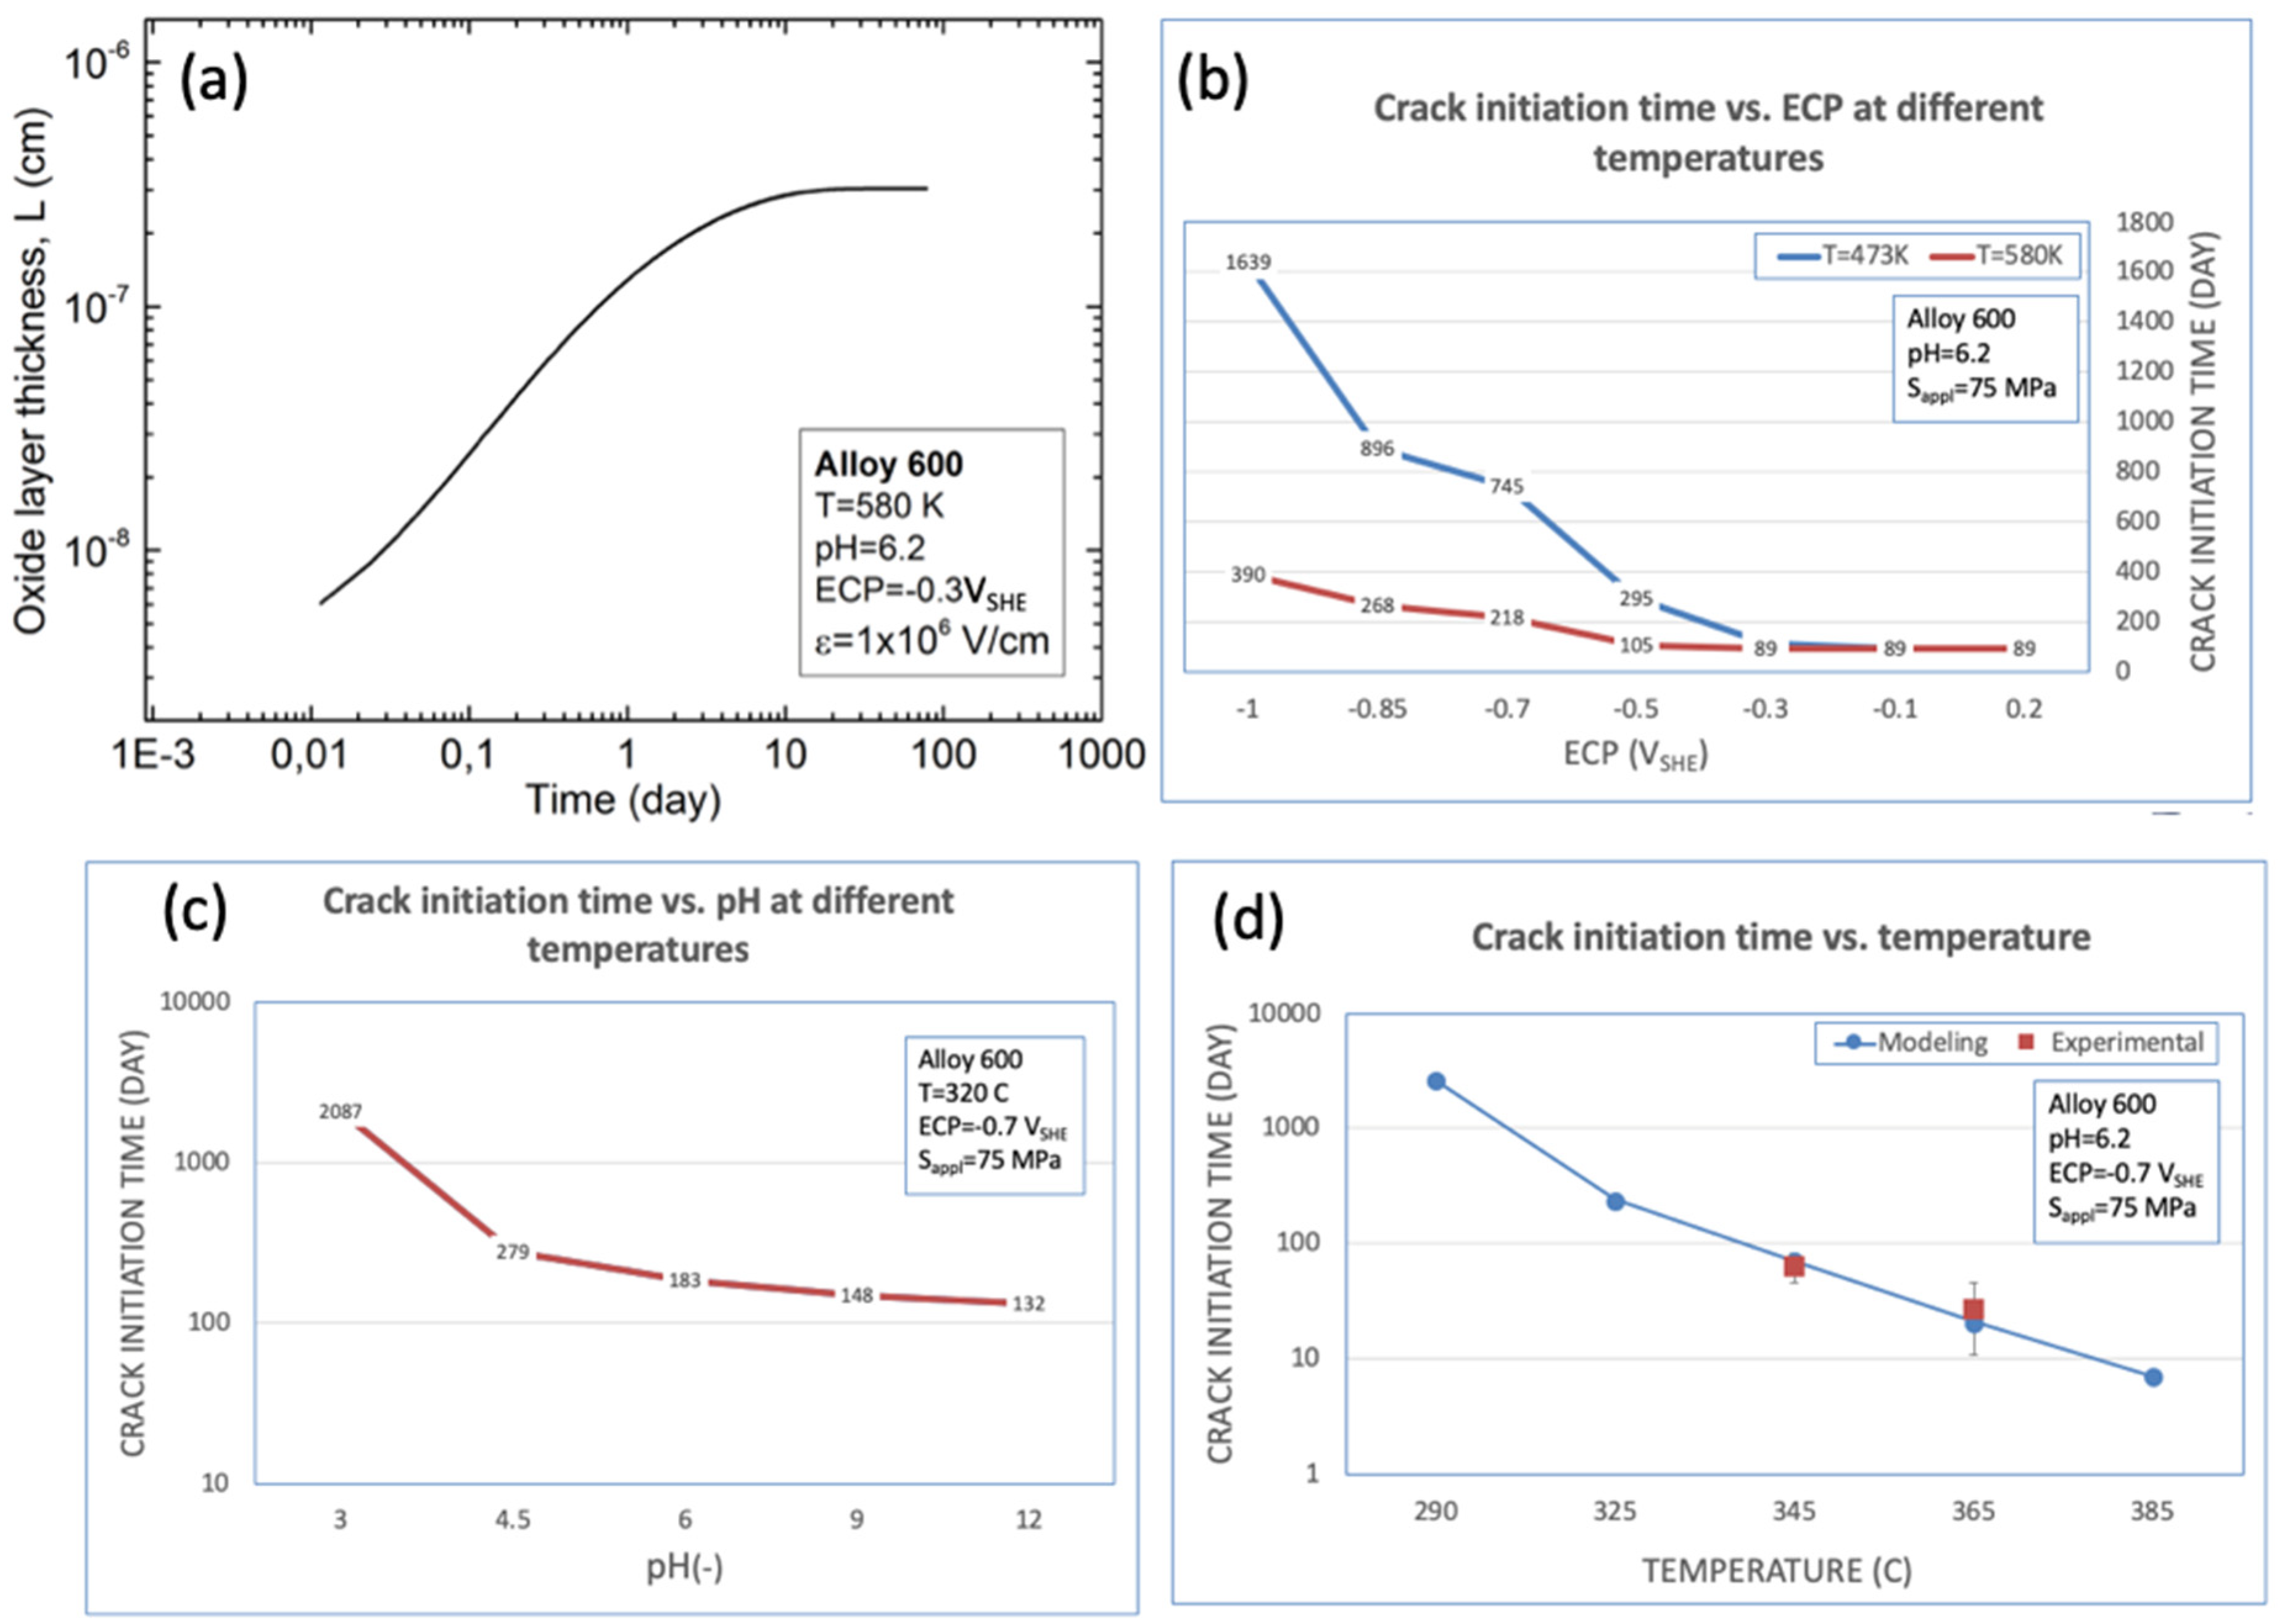
Thus, the first step of the calculation is to determine the growth rate at a particular time using the environmental variables as inputs (ECP, pH, temperature). Integrating the growth rate of the passive film within the emerging grain boundary cavity leads to changes in the barrier layer thickness and stress intensity factor over time, as illustrated in Figure 3. This figure, as expected, reveals a close correlation between L and KI. Figure 4a predicts that, over approximately 240 h, the oxide thickness increases more or less linearly with time before reaching a steady state. The resulting wedging results in an increase in the crack length and stress intensity factor until the critical conditions are achieved, and a stress corrosion crack nucleates when KI exceeds KISCC. Thus, assuming a specific crack shape [44] and external mechanical load, the stress intensity factor increases with increasing crack length. It is essential to recognize that, upon using this crack initiation criterion (initiation when KI > KISCC), the initiation time is sensitive to the external load, as a sufficiently high external load can cause a higher stress intensity factor than the critical value. This highlights the importance of incorporating the correct crack shape factor into the model. The CEFM predicts the evolution of semi-elliptical surface cracks based on the SCC crack growth rate (CGR), which depends on the electrochemical crack length at a constant KI [44], in good agreement with field observations in various systems, including water-cooled nuclear reactors [57].
Figure 3.
Predicted variation in crack length and stress intensity factor vs. time [6,7].
Figure 4.
The predicted growth of the Cr2O3 barrier layer of the passive film within the emergent grain boundary (a) and calculated crack initiation time as a function of the ECP (b), pH (c) and temperature (d) [48].
The calculated initiation times are shown in Figure 4b–d as functions of the ECP, pH, and temperature, respectively. Increasing the ECP is predicted to decrease the CIT because the value of k3 increases, albeit at a decreasing rate as growth proceeds, resulting in the sigmoidal shape. The decrease in the CIT with increasing pH is because the oxide within the wedged grain boundary dissolves less rapidly (see Equation (1)). Hence, the oxide thickens more rapidly, resulting in more rapid wedging. Finally, the CIT is predicted to decrease with increasing temperature because the rate constants, k3, and k7, are temperature-dependent, with the temperature dependence of k3 being more significant than that of k7.
Figure 4b shows the effect of the ECP on the crack initiation time for different temperatures. According to the PDM, increasing the ECP increases the film’s growth rate [56]. The internal oxidation model [60] postulates that the oxide film wedges the grain boundaries, thereby developing macroscopic cracks, which results in a decrease in the initiation time as the film growth rate increases, as depicted in Figure 4b. The crack initiation time is also a sensitive function of the pH and temperature, as seen in Figure 4c,d, respectively. These high sensitivities are understandable in light of the temperatures present in various components of the model, such as the PDM, which affects the growth rate of the film in the mechanical creep rate model, and the pH, which impacts the Cr2O3 dissolution rate at the bl/s interface. Figure 4d also aligns with the experimental data reported in the literature [57,58,60].
3. Coupled Environment Fracture Model
Because the crack growth rate in both BWR and PWR primary coolant environments can be traced back to the original CEFM, which was developed strictly to describe CGR in BWR primary coolant alone, it is necessary to briefly summarize the basis of the model to provide context for the reader. Additional details are provided in refs. [36,39,40].
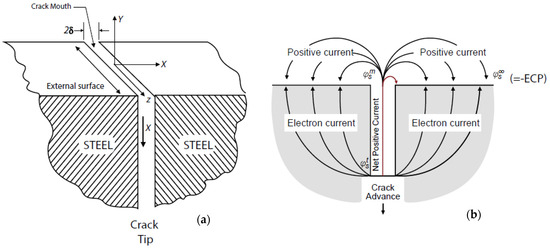
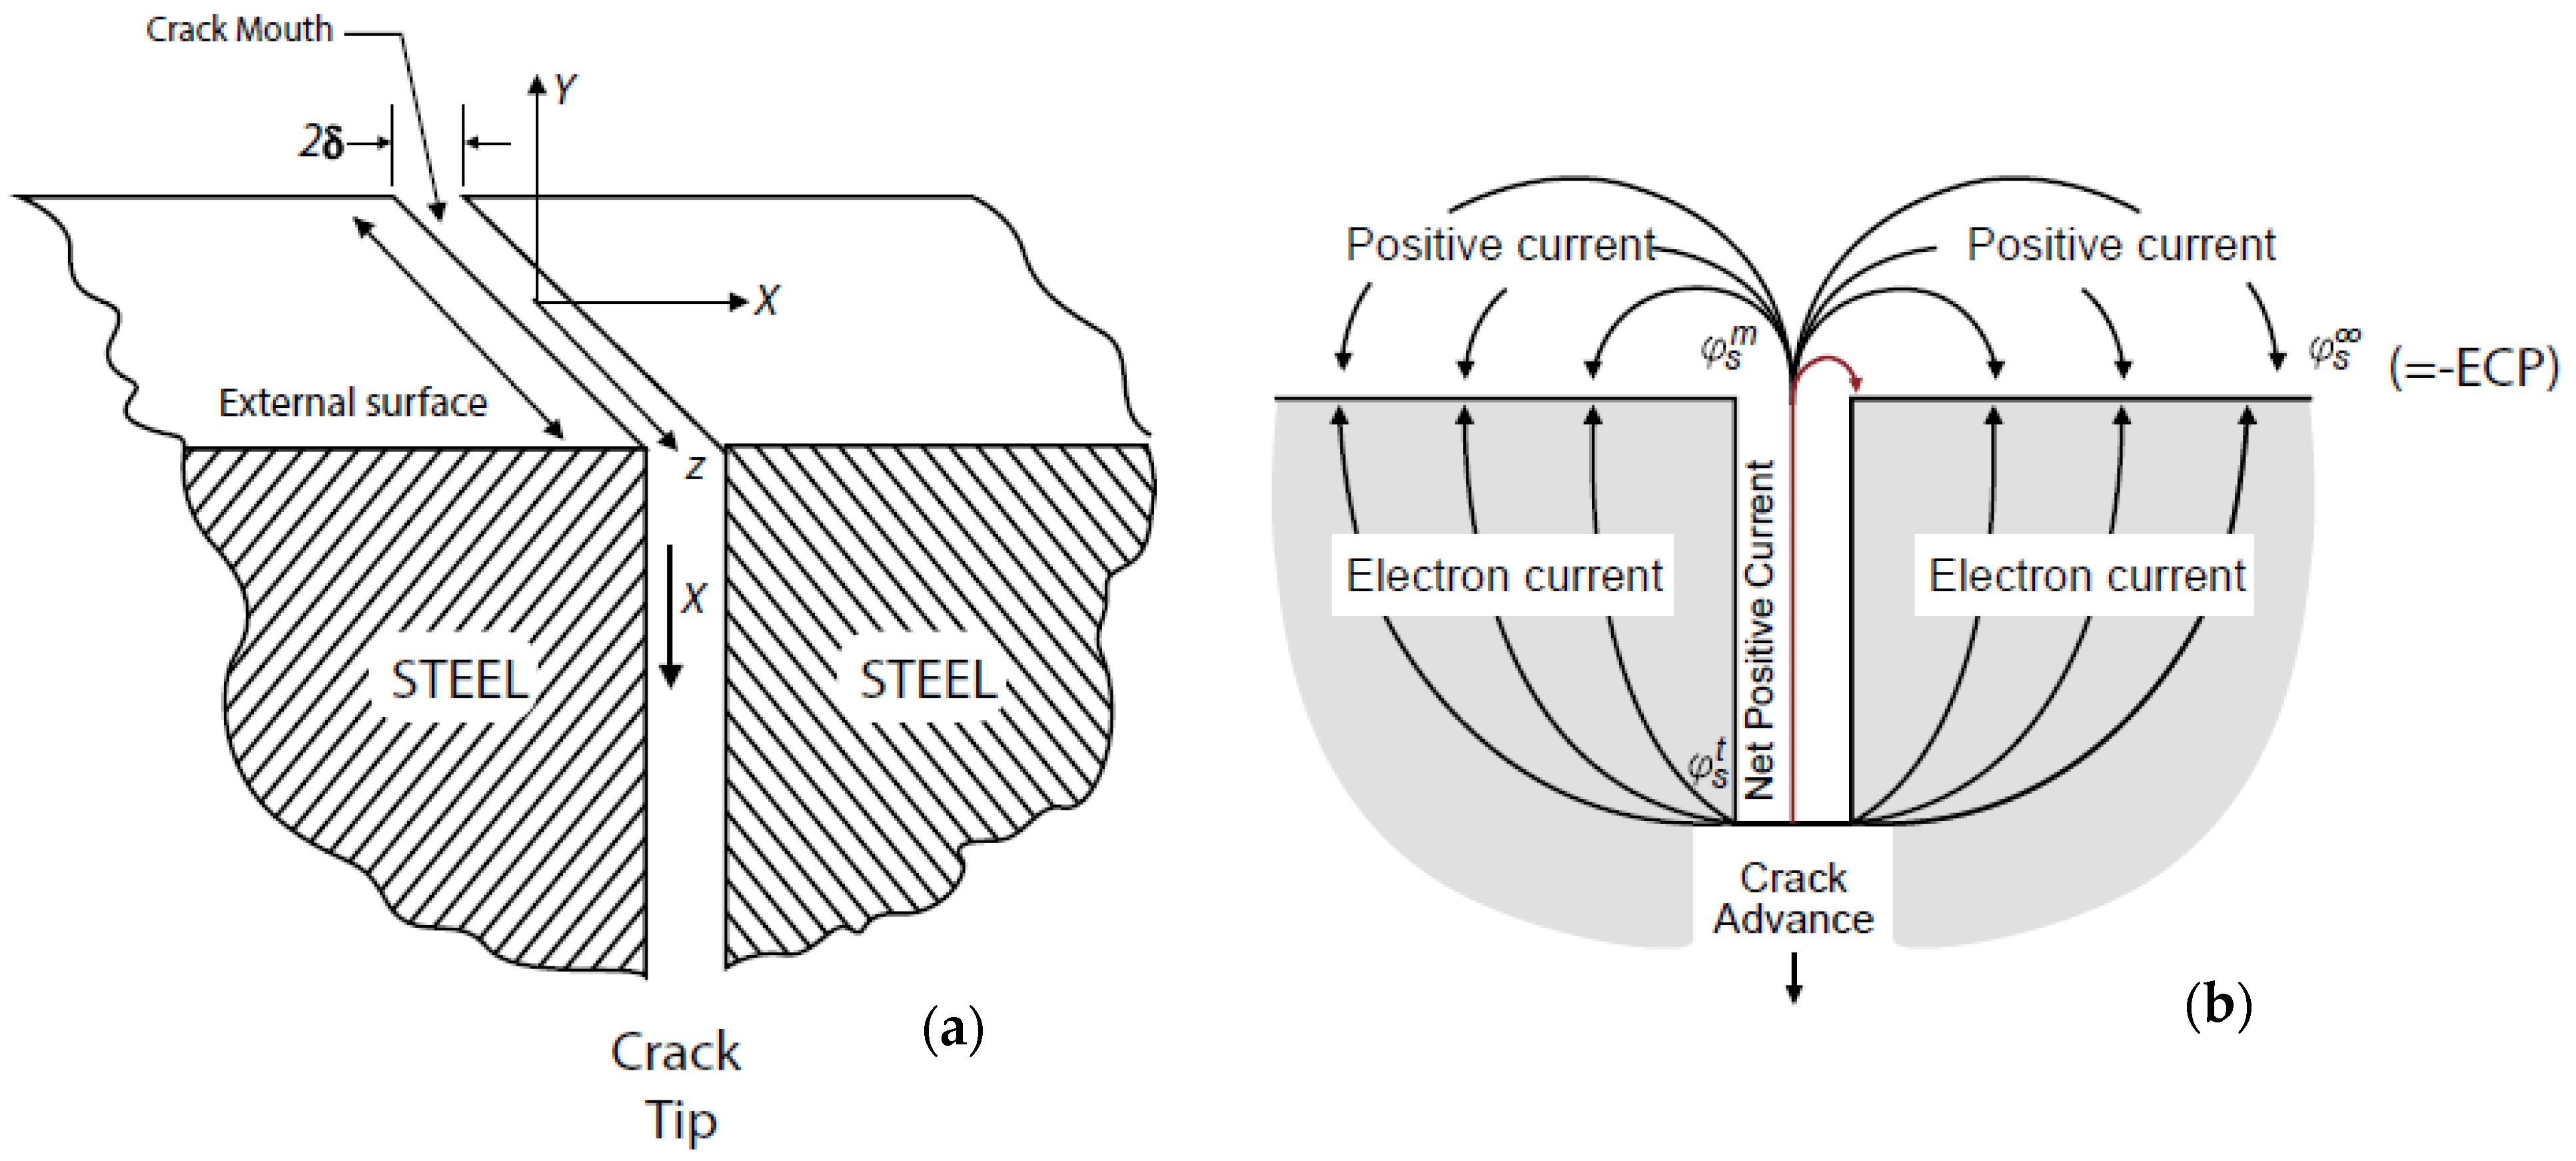
Figure 5a,b illustrate the physio-electrochemical basis of the CEFM [39,40,42,48,49]. The model recognizes that, under open-circuit conditions, the anodic current generated within the crack (primarily within the region of the crack tip) must be quantitatively annihilated by the electron current flowing through the metal from the crack tip to the external surface by appropriate cathodic reactions (e.g., oxygen reduction or hydrogen evolution).
Figure 5.
(a) Schematic of a crack in a metal defining the coordinate system employed in developing the CEFM [39,40,42,48,49]. (b) CEFM showing the redox reactions occurring on the surface external to the crack, the flow of the electron current through the metal (the “coupling current”) and the ionic current through the solution from the crack tip to the external surfaces, where the charge transfer redox reactions annihilate them.
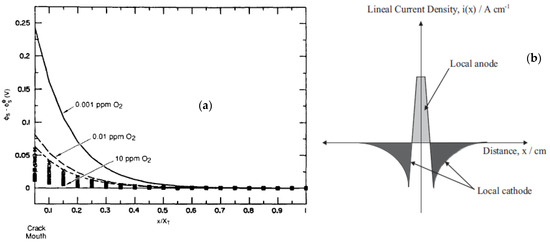
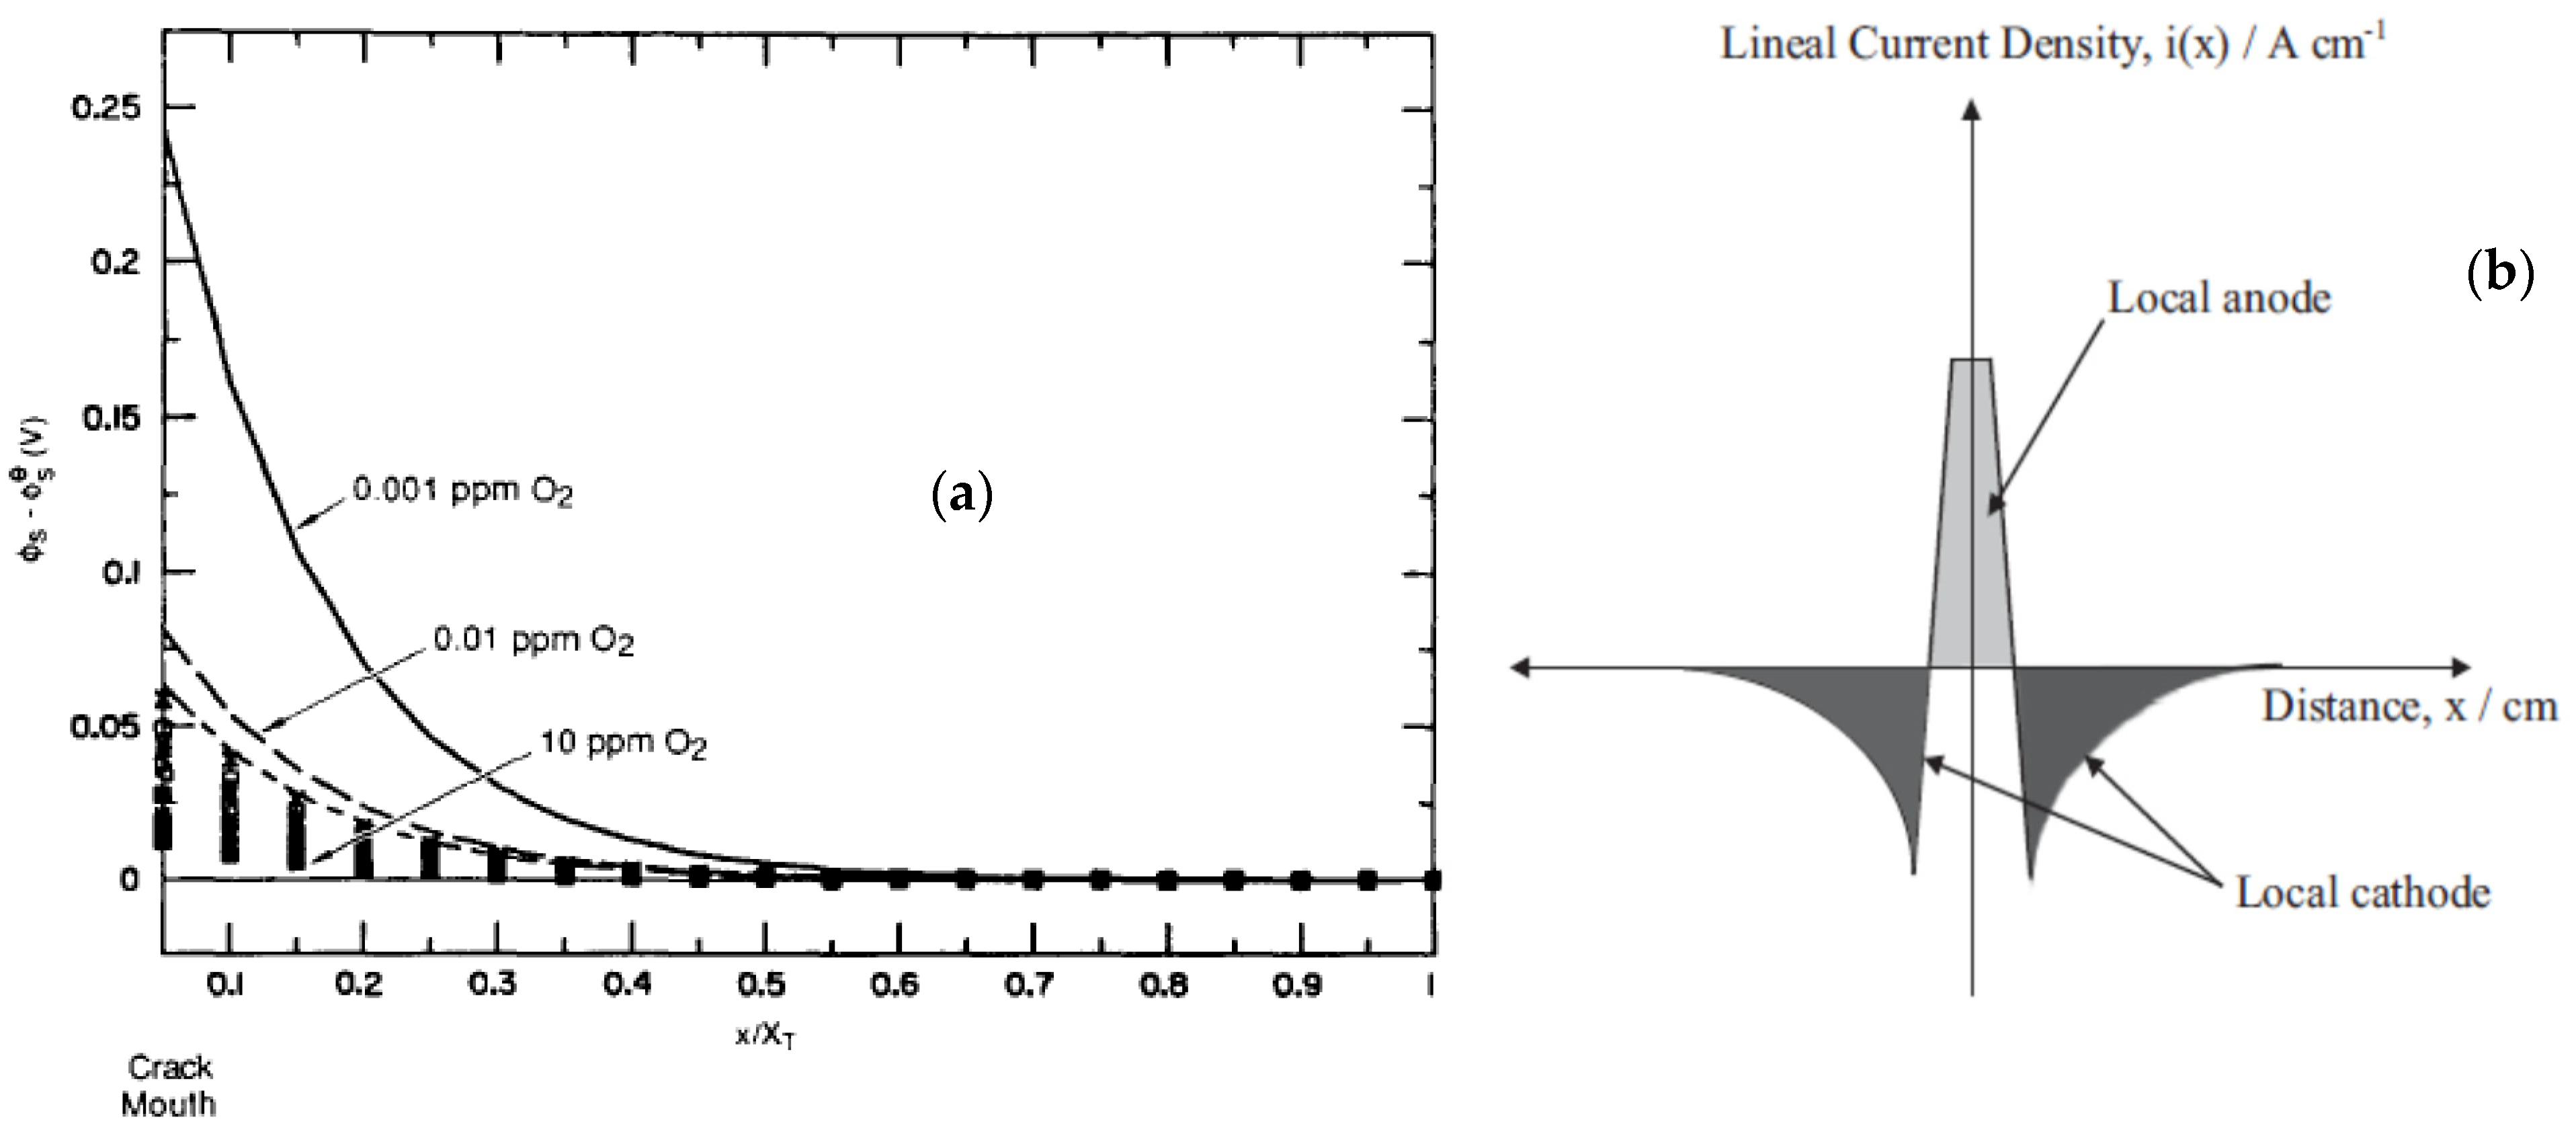
Figure 6a illustrates the variation in the potential in the solution on the external surface as a function of the oxygen concentration and distance from the crack mouth [39,40]. The quasi-exponential decay of the potential with distance is evident, with the dark-shaded and light-shaded areas representing equal charge under open-circuit conditions due to charge conservation, as shown in Equation (4).
Figure 6.
(a) Calculated distribution of the potential in the solution on the external surface as a function of distance from the crack mouth as a function of the concentration of oxygen in the solution at 288 °C. Other parameter values employed in the calculation are given by Macdonald and Urquidi-Macdonald [27]. (b) Schematic of the current density across the crack at charge conservation (dark and light-shaded areas are equal), after refs. [39,40].
This condition allows the potential in the solution at the crack mouth to be estimated [36,39,40]. Note that, if the dark-shaded area in Figure 6b increases for whatever reason (e.g., increase in [O2] or flow velocity), the light-shaded area must increase correspondingly, signifying an increase in the CGR.
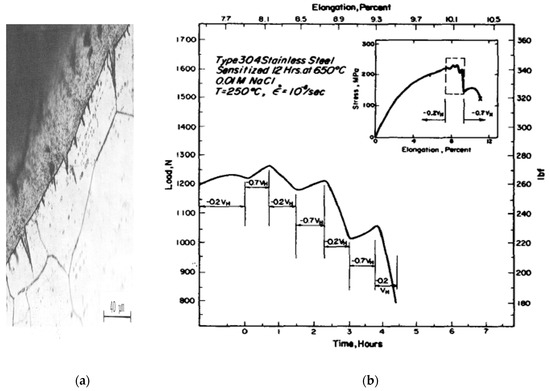
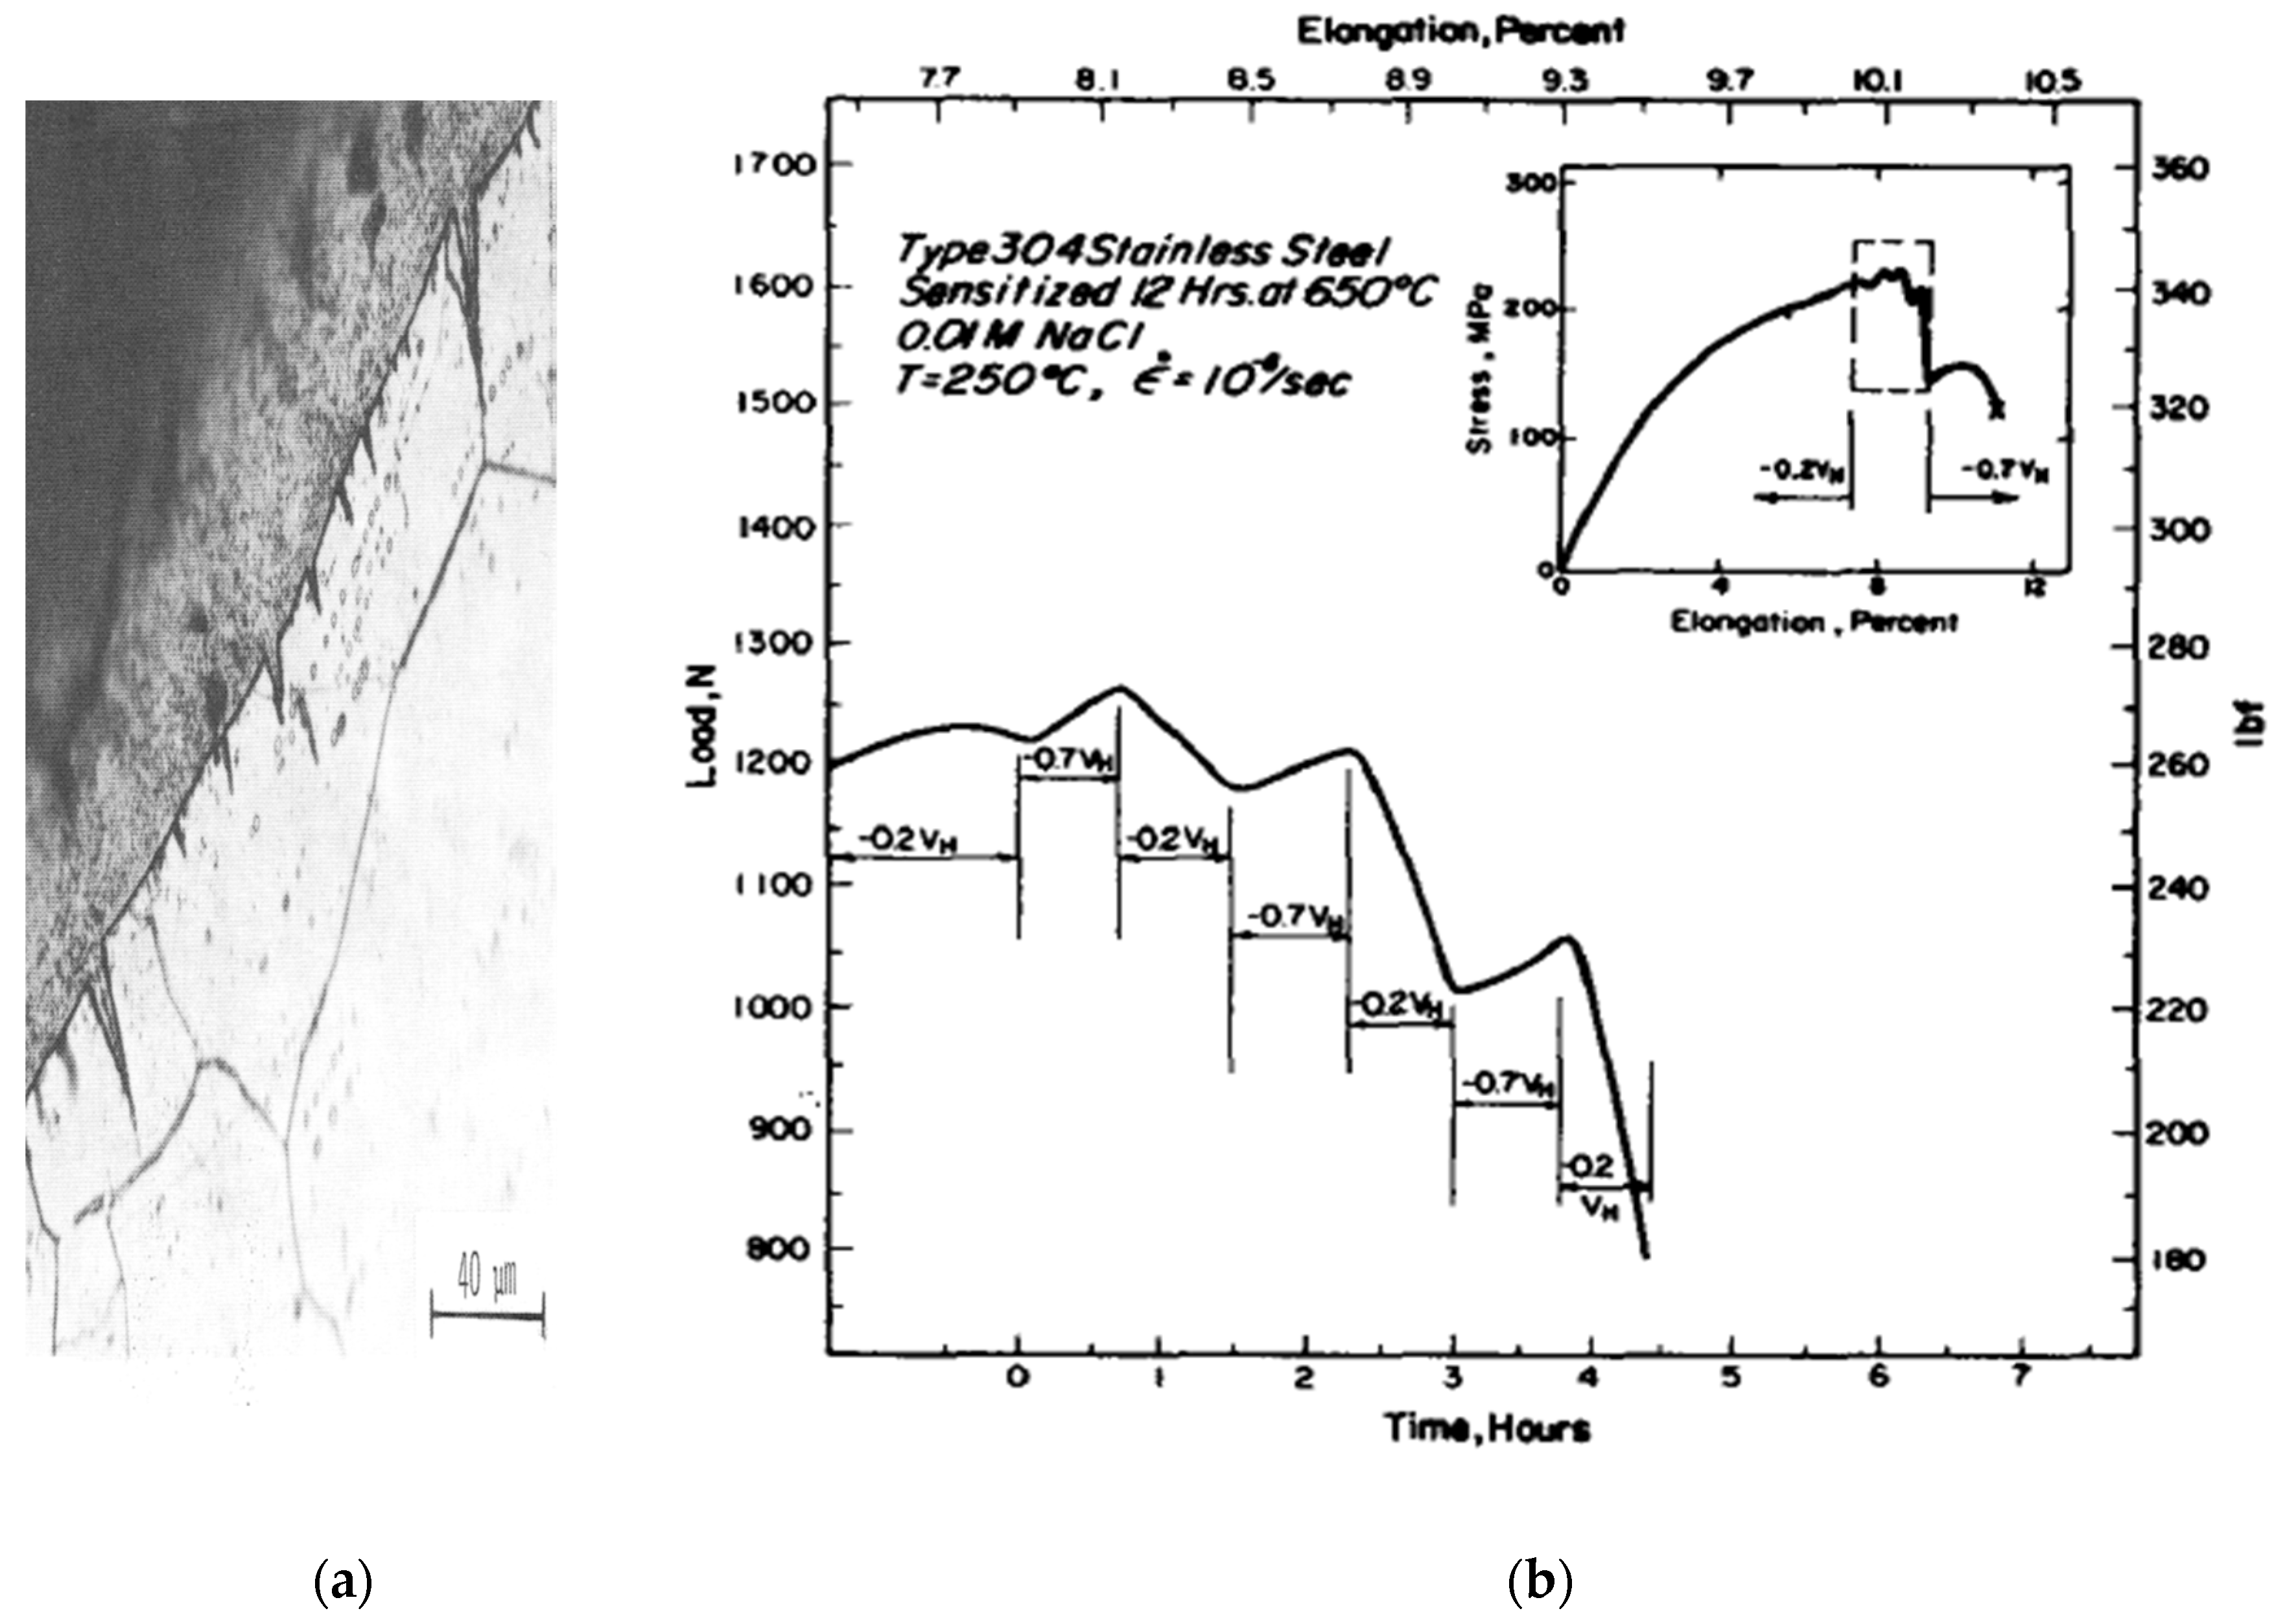
Finally, shown in Figure 7 is a micrograph of initiating cracks on the surface of a sensitized Type 304 SS SSR specimen (Figure 7a) and elongation percent curve for a specimen from the same experiment as the ECP is stepped cyclically above (−0.2 VH = −0.2 Vshe) and below (−0.7 Vshe) the critical potential (estimated to be −0.4 Vshe) [2]. The triangular shape of the cavity suggests a considerable strain component in determining the cavity shape. The initiation points on the surface are attributed to intra-grain MnS inclusions or Cr23C6 precipitates. The initial cavities propagate transgranularly until the cavity tip intersects a chromium-depleted grain boundary in the thermally sensitized matrix and then propagate transgranularly until the cavity tip intersects a chromium-depleted grain boundary in the thermally sensitized matrix, and subsequently propagate intergranularly thereafter. The precipitate (MnS and Cr23C6) areal density corresponds to about 3 × 10⁹/m2. Importantly, Figure 7a shows that distribution exists in the depths of the transgranular crevices, with a few being dominant, which is in keeping with the theory [35].
Figure 7.
(a): Micrographs of a specimen for which straining was interrupted at –20% elongation at 250 °C under an applied potential of –0.3 VSHE, showing the presence of small and inactive cracks, prior to the rapid growth of intergranular cracks [35]. (b): Nominal stress vs. elongation curves for sensitized Type 304 stainless steel in a 0.01 M NaCl solution at 250 °C in which the potential was cycled between −0.2 and −0.7 Vshe [35].
Of significant interest in Figure 7a is that many of the cavities in sensitized Type 304 SS in BWR primary coolant take the form of separated grain boundaries, not unlike those in Alloy 600 in PWR primary coolant. We attribute this to the weakening of emergent grain boundaries upon excessive straining such that, under high-strain conditions, the model of Scott and Combrade [3,5] may also be adequate for estimating the CIT under high-strain conditions.
Figure 7b illustrates that SCC may be stopped, resulting in increasing stress, or started (decreasing stress) by switching the potential to −0.7 Vshe or +0.2 Vshe, respectively. This demonstrates that IGSCC in thermally sensitized Type 304 SS is primarily an electrochemical phenomenon, as concluded elsewhere [41], while Alloy 600 proves to be predominantly mechanical [42] in nature. Critical potentials exist for IGSCC in sensitized Type 304 SS and Alloy 600 in simulated BWR and PWR primary coolant, respectively, with intergranular cracking occurring at ECP values greater than the upper critical potential for IGSCC (ECPIGSCC = −0.23 VSHE at 288 °C) for Type 304 SS and below the lower critical potential for HIC (ECPHIC −0.85 VSHE at 300 °C) for mil-annealed Alloy 600 that have been used to mitigate the propagation of IGSCC damage in these alloys in the field [35]. Parenthetically, the mechanisms of IGSCC propagation in both cases involve significant hydrogen-induced cracking of the alloy in front of the crack tip, with Alloy 600 being more substantial than that for Type 304 SS in their respective environments [36,41,42]. Finally, no induction time is apparent for starting and stopping the crack upon cycling the potential (Figure 7b). This means that the concentration profiles of ionic species (particularly H+ and Cl−) respond very quickly to changes in the ECP. An estimate of the crack relaxation time can be gleaned from the expression , where x is the length over which diffusion responds and D is the diffusivity of the dominant ion. By selecting x = 10−6 cm and D = 5 × 10⁻⁵ cm2/s, we estimated the diffusivity relaxation time as 0.25 μs, which was not discernable on the time scale employed here.
4. Crack Initiation Model for BWRs
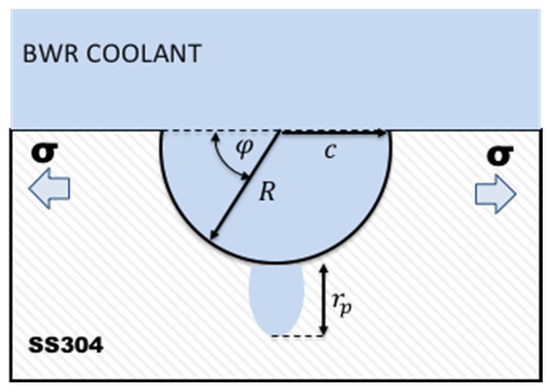
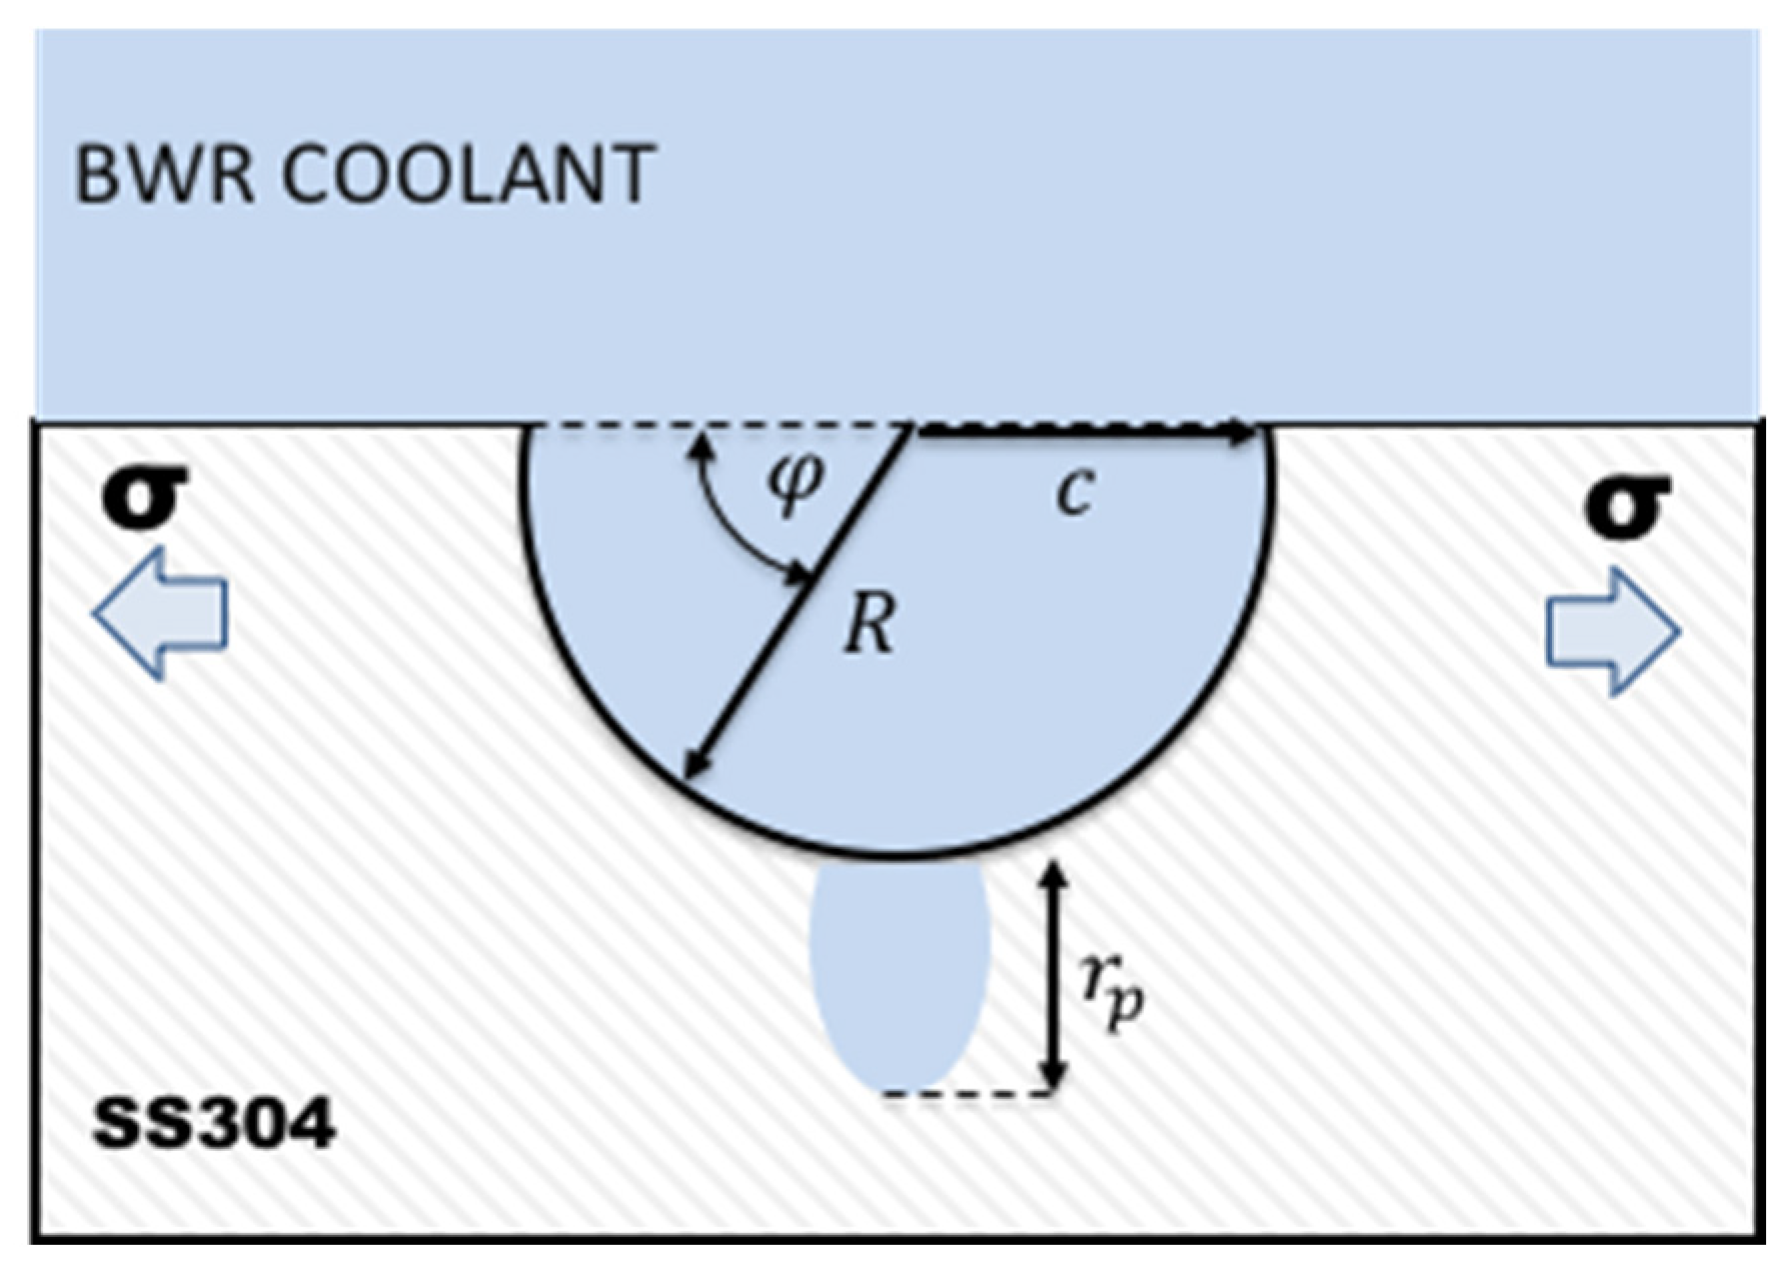
To our knowledge, a viable, mechanism-based model for crack initiation in BWRs has never been previously developed. Experimental investigations have shown that cracks in sensitized Type 304 SS in simulated BWR primary coolant environments are often observed in SSRTs to nucleate within an emergent grain face (probably from a corrosion pit), grow transgranularly until they intersect a grain boundary, and then grow intergranularly [2]. Our goal was to develop a model for calculating the crack initiation time in BWRs that considers the properties of the crack external environment in addition to the impact of mechanical loading. We developed a model that predicts the time that it takes to nucleate and grow a critical pit; i.e., one whose stress intensity factor exceeds KISCC for the prevailing stress, including both residual and operational stresses. The CEFM was modified to calculate the growth rate of a hemispherical pit in terms of the properties of its external and internal environments, which are electrochemically coupled. Figure 8 shows the postulated hemispherical pit in Type 304 SS exposed to a BWR coolant.
Figure 8.
Geometrical features of the proposed hemispherical pit crack initiation site.
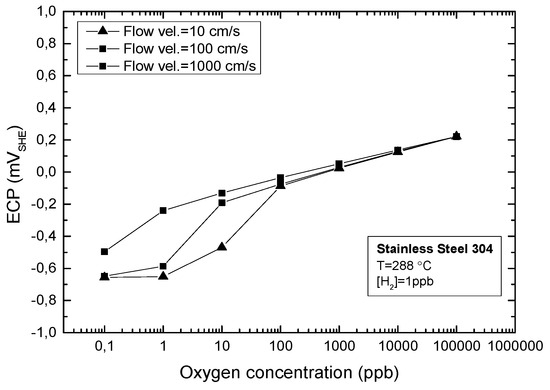
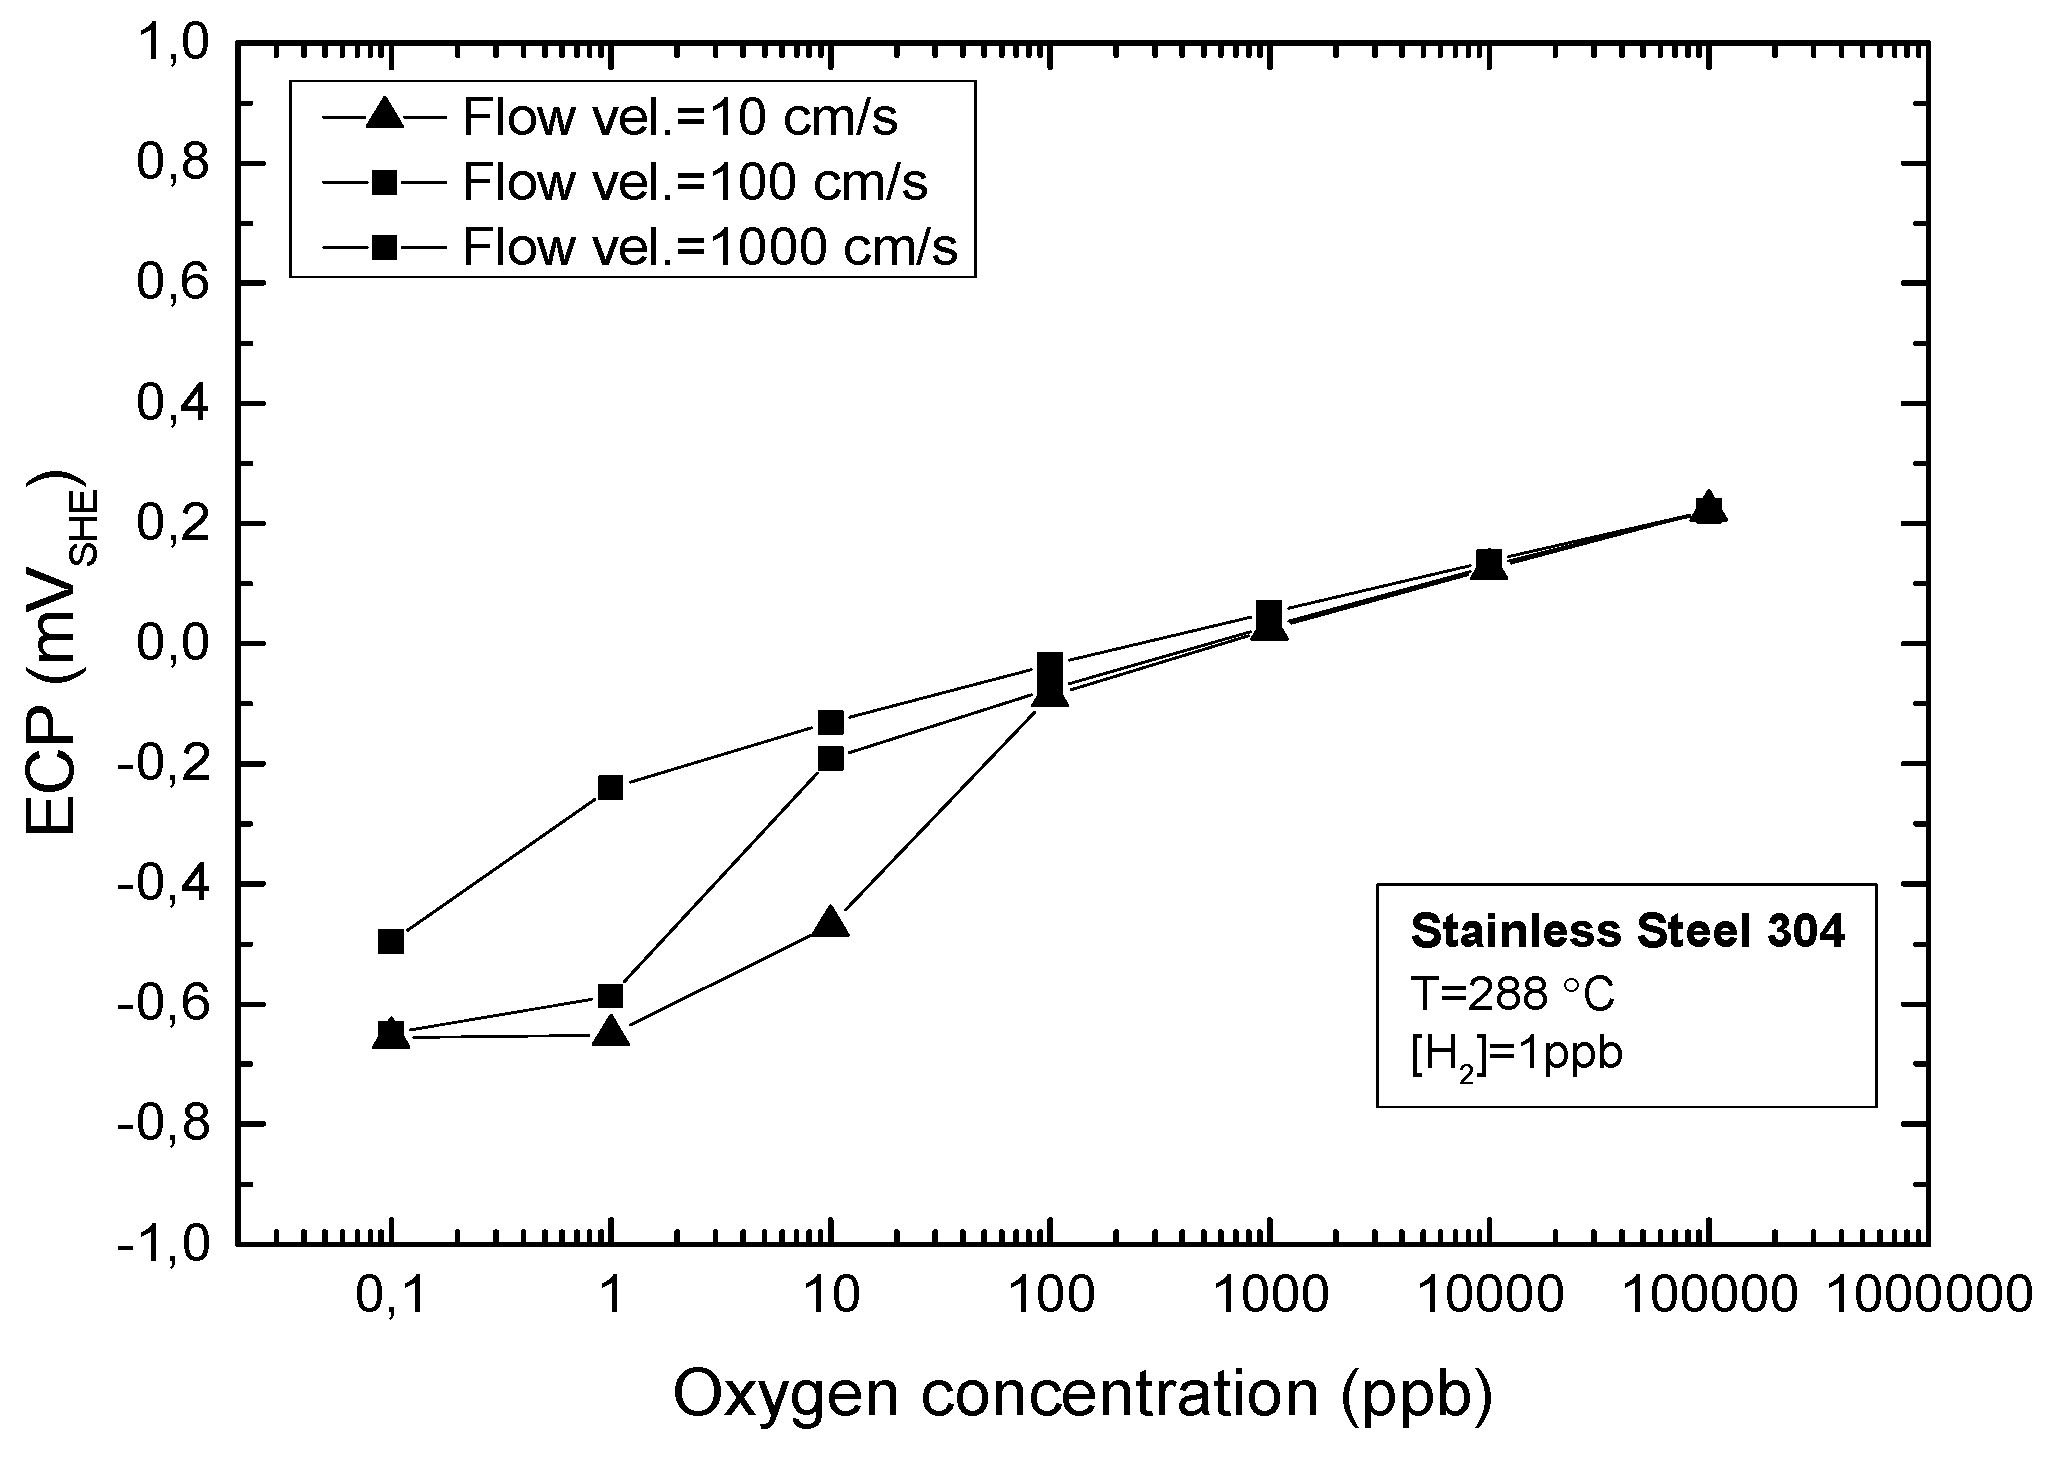
Figure 9 shows that the ECP is a sensitive function of the oxygen concentration and flow velocity, particularly at the low concentrations typical of BWR primary coolant ([O2] < 100 ppb). Under these conditions, the ECP is predicted to shift in the positive direction by 500 mV solely due to an increase in flow velocity, thereby exacerbating IGSS by displacing the ECP above the critical potential. This may be a significant factor in high-flow-rate regions of a BWR primary coolant circuit, such as the jet pumps and the downcomer.
Figure 9.
As per the coupled environment pitting model (CEFM), the ECP is a function of [O2] for various flow velocities [61], Top plot is v = 1000 cm/s.
According to Irwin’s linear elastic analysis [55], the stress intensity factor along the crack front can be calculated by the following expression:
where is the applied stress. All other parameters are shown in Figure 8. For a hemispherical shape, A more sophisticated fracture mechanical analysis requires consideration of the effect of small-scale plasticity by incorporating the plastic zone size in the pit front:
where is the yield stress. Recognizing that the size of the plastic domain in the front of the pit has a small amount of resistance against the stress, we can extend the pit depth by rp as:
We can express the critical pit depth by setting KI = KISCC, and recognizing that KI attains its maximal value for :
We developed coupled environment models for IGSCC (CEFM) and pitting (CEPGM) [46], and variants thereof, that calculate the growth rate of a pit as well as the pit depth (integrated pit growth rate) as a function of time, with the crack initiation criteria defined by Rpit= Rcrit. The electrochemical considerations of the model can be summarized as follows: (1) a uniform current density distribution is assumed on the surface of the hemispherical pit; (2) active dissolution of the alloy within the nucleus is attributed to the low pH and presence of Cl−; and (3) the pit’s internal environment is strongly coupled (via differential aeration) to the external environment, resulting in the flow of a net positive current through the solution from the internal environment to the external surface. This current is annihilated by the flow of an electron current through the metal in the same direction (the coupling current), with both currents being mutually annihilated on the external surface by the prevailing cathodic reaction (oxygen reduction and/or hydrogen evolution) [37,38,39,40,41,42,43,44,45,46,47,48,49,50,51,52,53,54]. Tafel’s equation is used to calculate the current density on the pit’s internal surface, with the potential in the solution at the pit mouth being derived from the condition expressed by Equation (4), where is the net current density (the sum of the partial current densities for all anodic and cathodic reactions), including those on the internal and external surfaces. This is because decreases roughly exponentially with distance away from the pit mouth, and a numerical analysis showed that the integral needs only be evaluated over less than 10 pit radii away from the pit mouth [37,40,41].
4.1. Effect of Electrochemical Variables
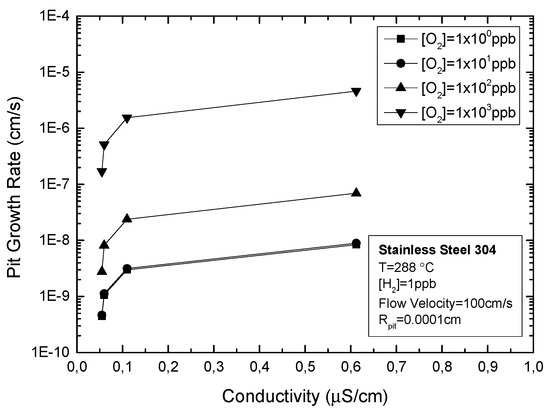
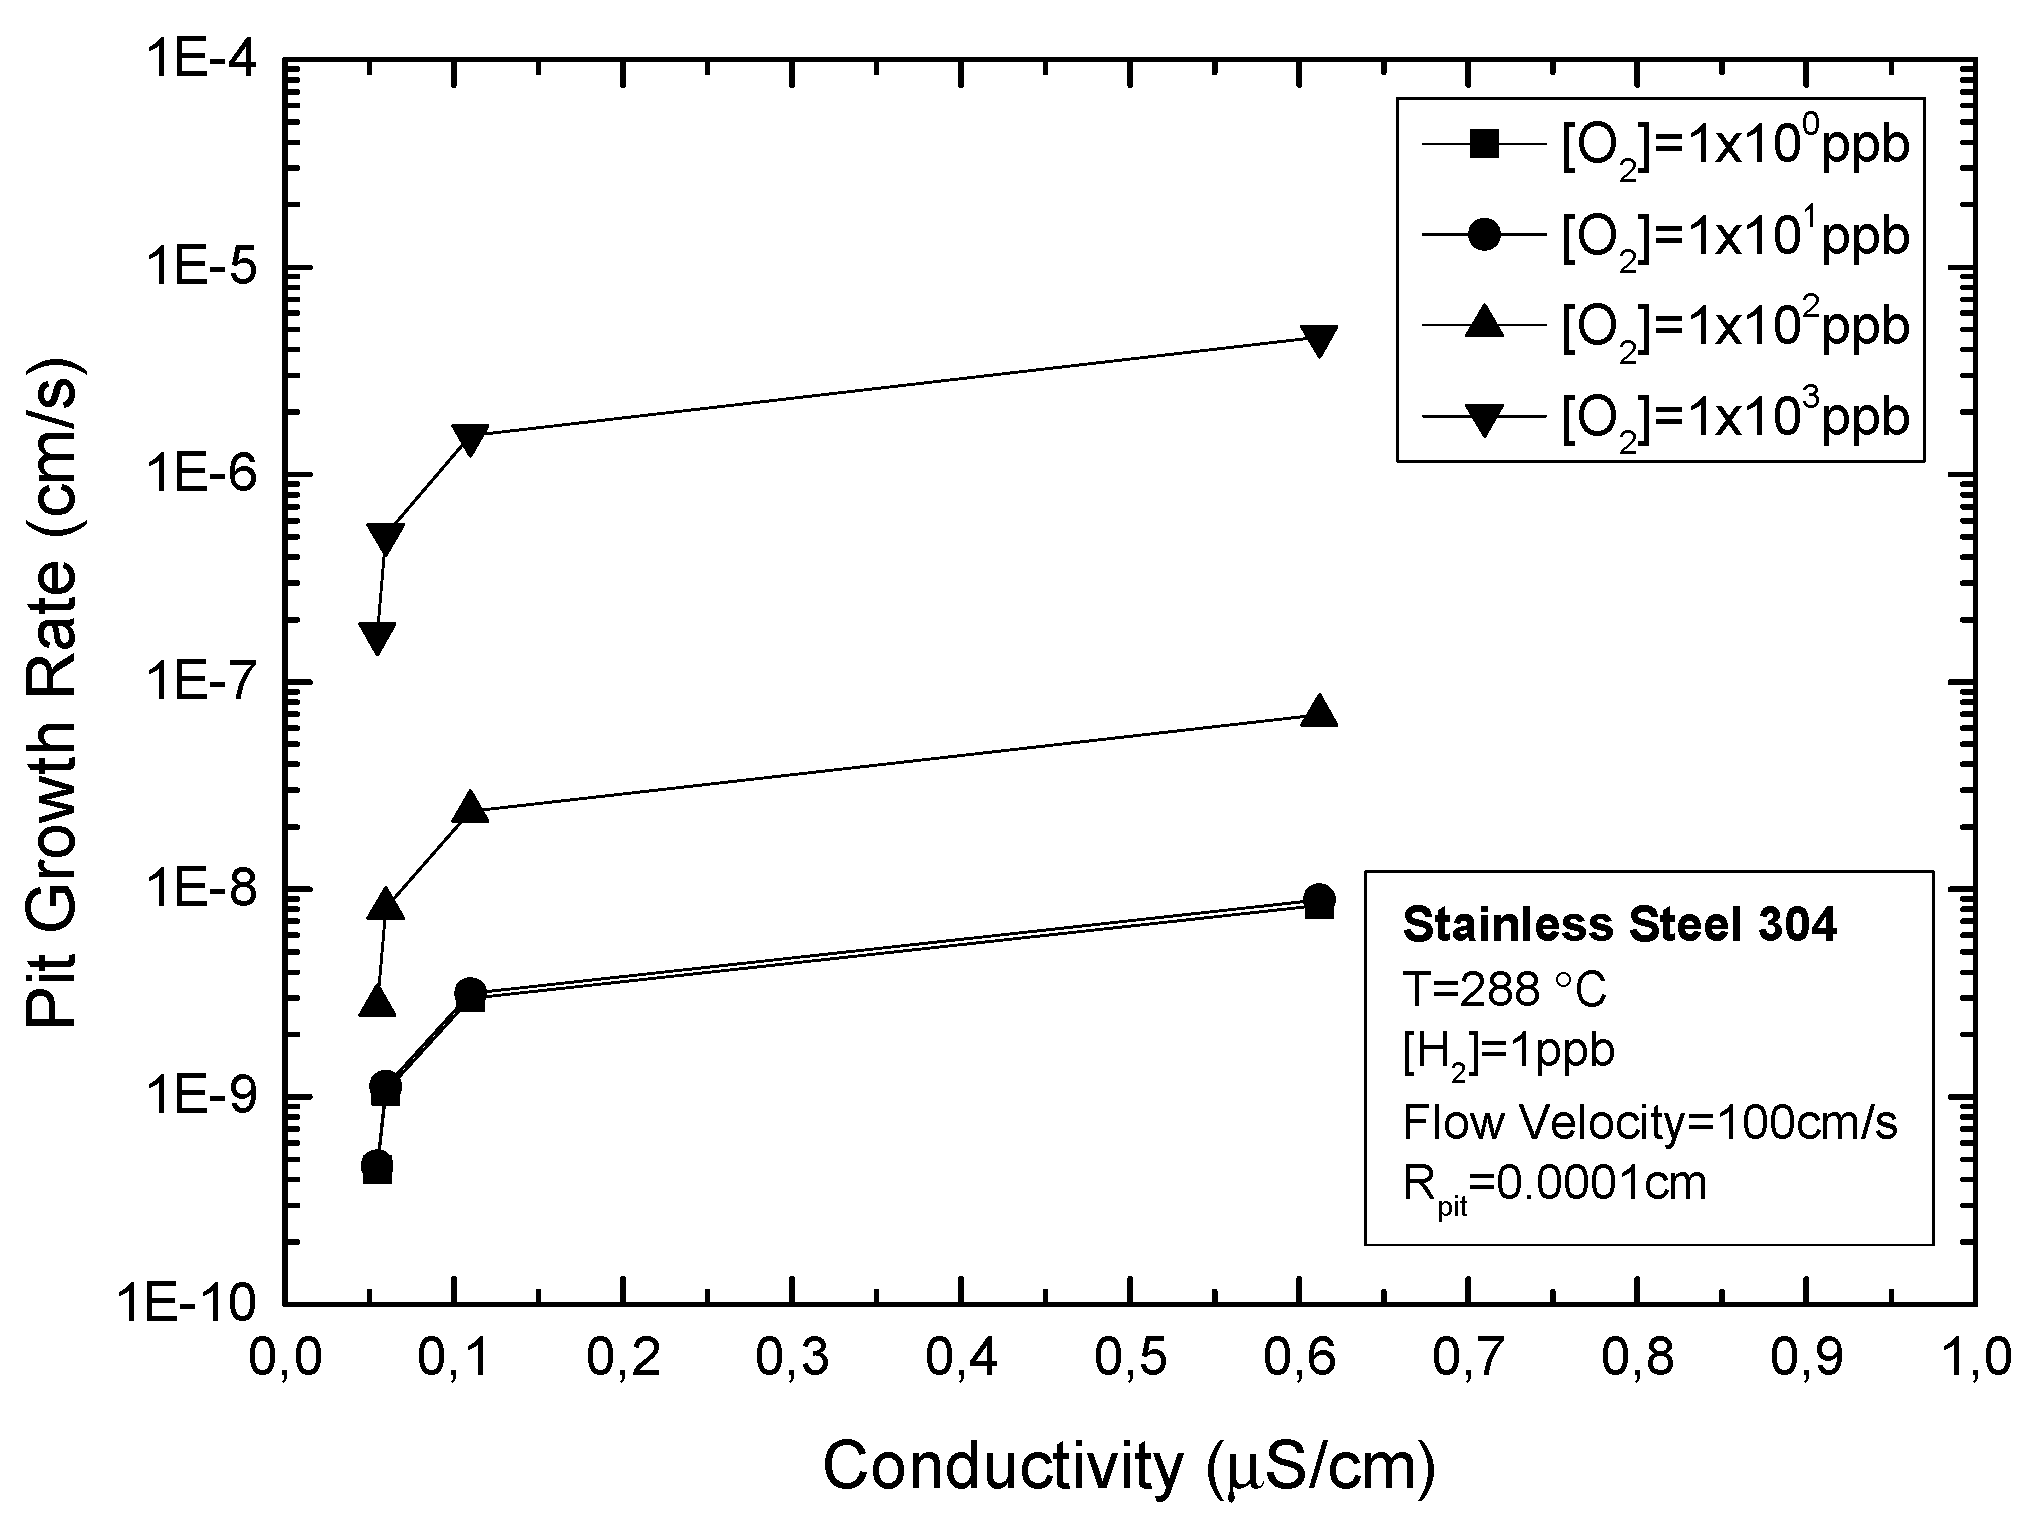
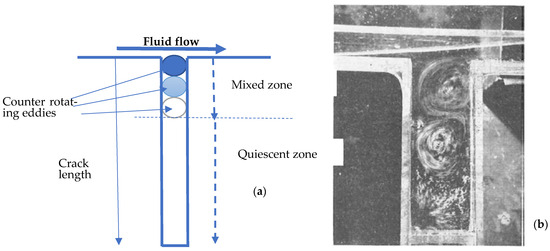
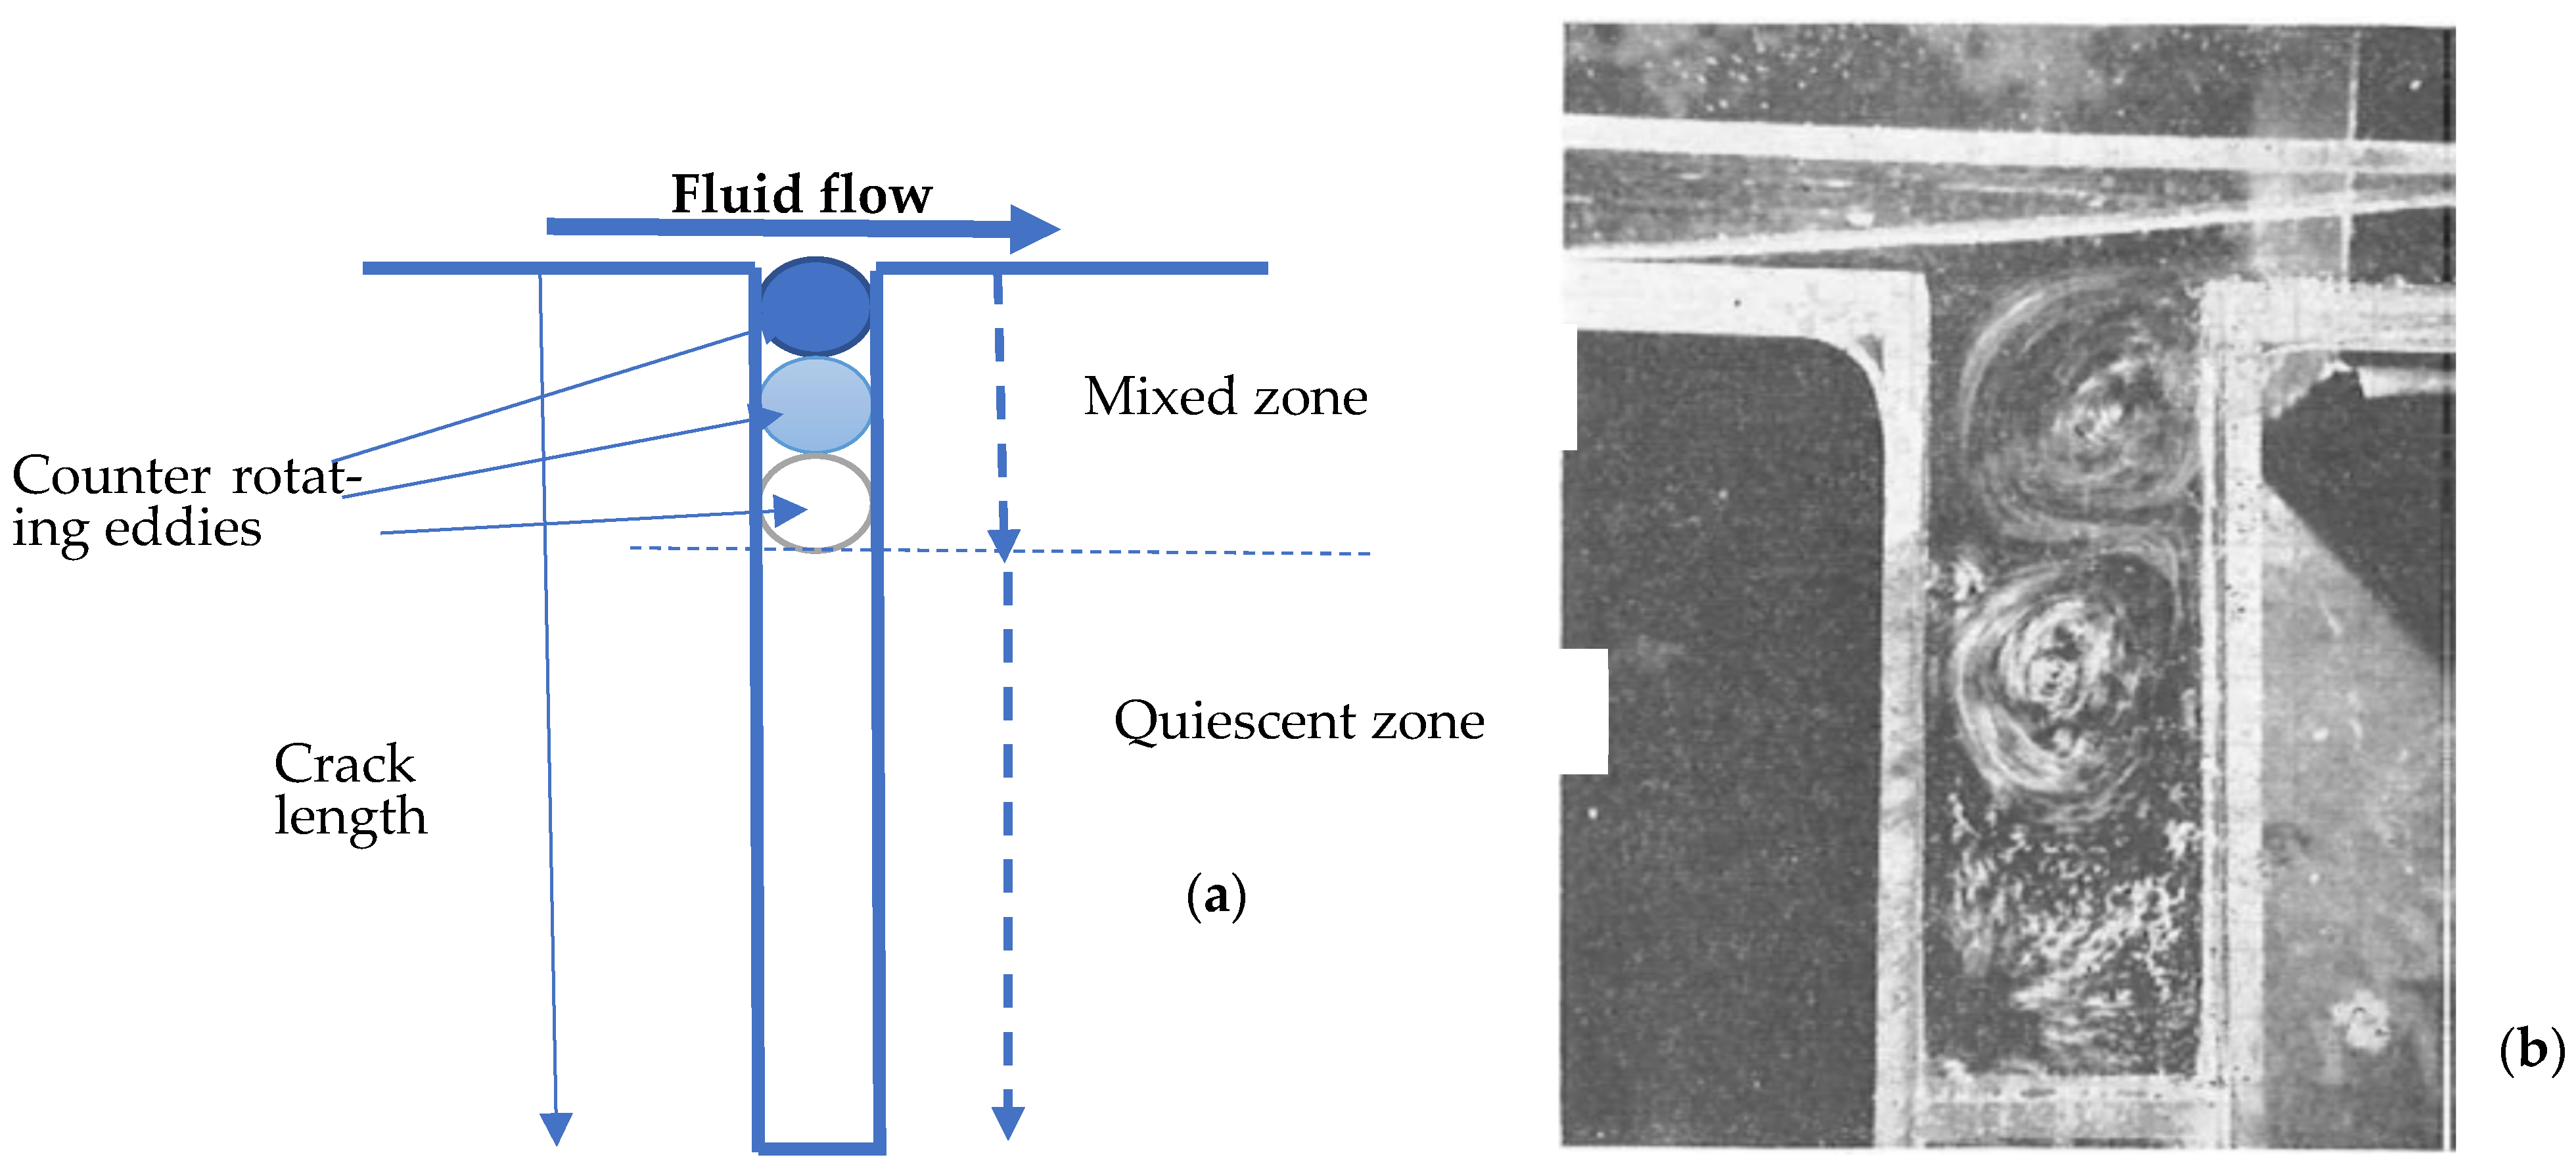
The PGR is a strong function of conductivity and, to a lesser extent, the linear flow velocity of the coolant across the surface. The predicted dependence on conductivity is due to the increased throwing power of the coupling current from the pit mouth, allowing a larger area on the external surface to be available for annihilating the coupling current through cathodic reactions of oxygen reduction and hydrogen evolution. The dependence on flow velocity is due to the increase in mass transport of oxygen to the external surface, which determines the limiting cathodic current density [51]. The calculation does not consider the “washing out” of the pit, which might be necessary for open, low-aspect-ratio pits. However, flow across the pit mouth creates counter-rotating eddies within the confines of the cavity, with the intensity decreasing roughly exponentially with distance into the pit. After about five pit diameters into the pit, the solution becomes quiescent, and the surface above that point should be counted as part of the external surface with a concomitant decrease in the electrochemical crack length (ECL) and, hence, an increase in the cavity growth rate [51].
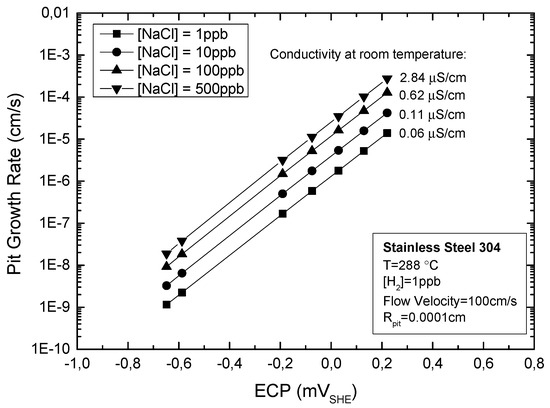
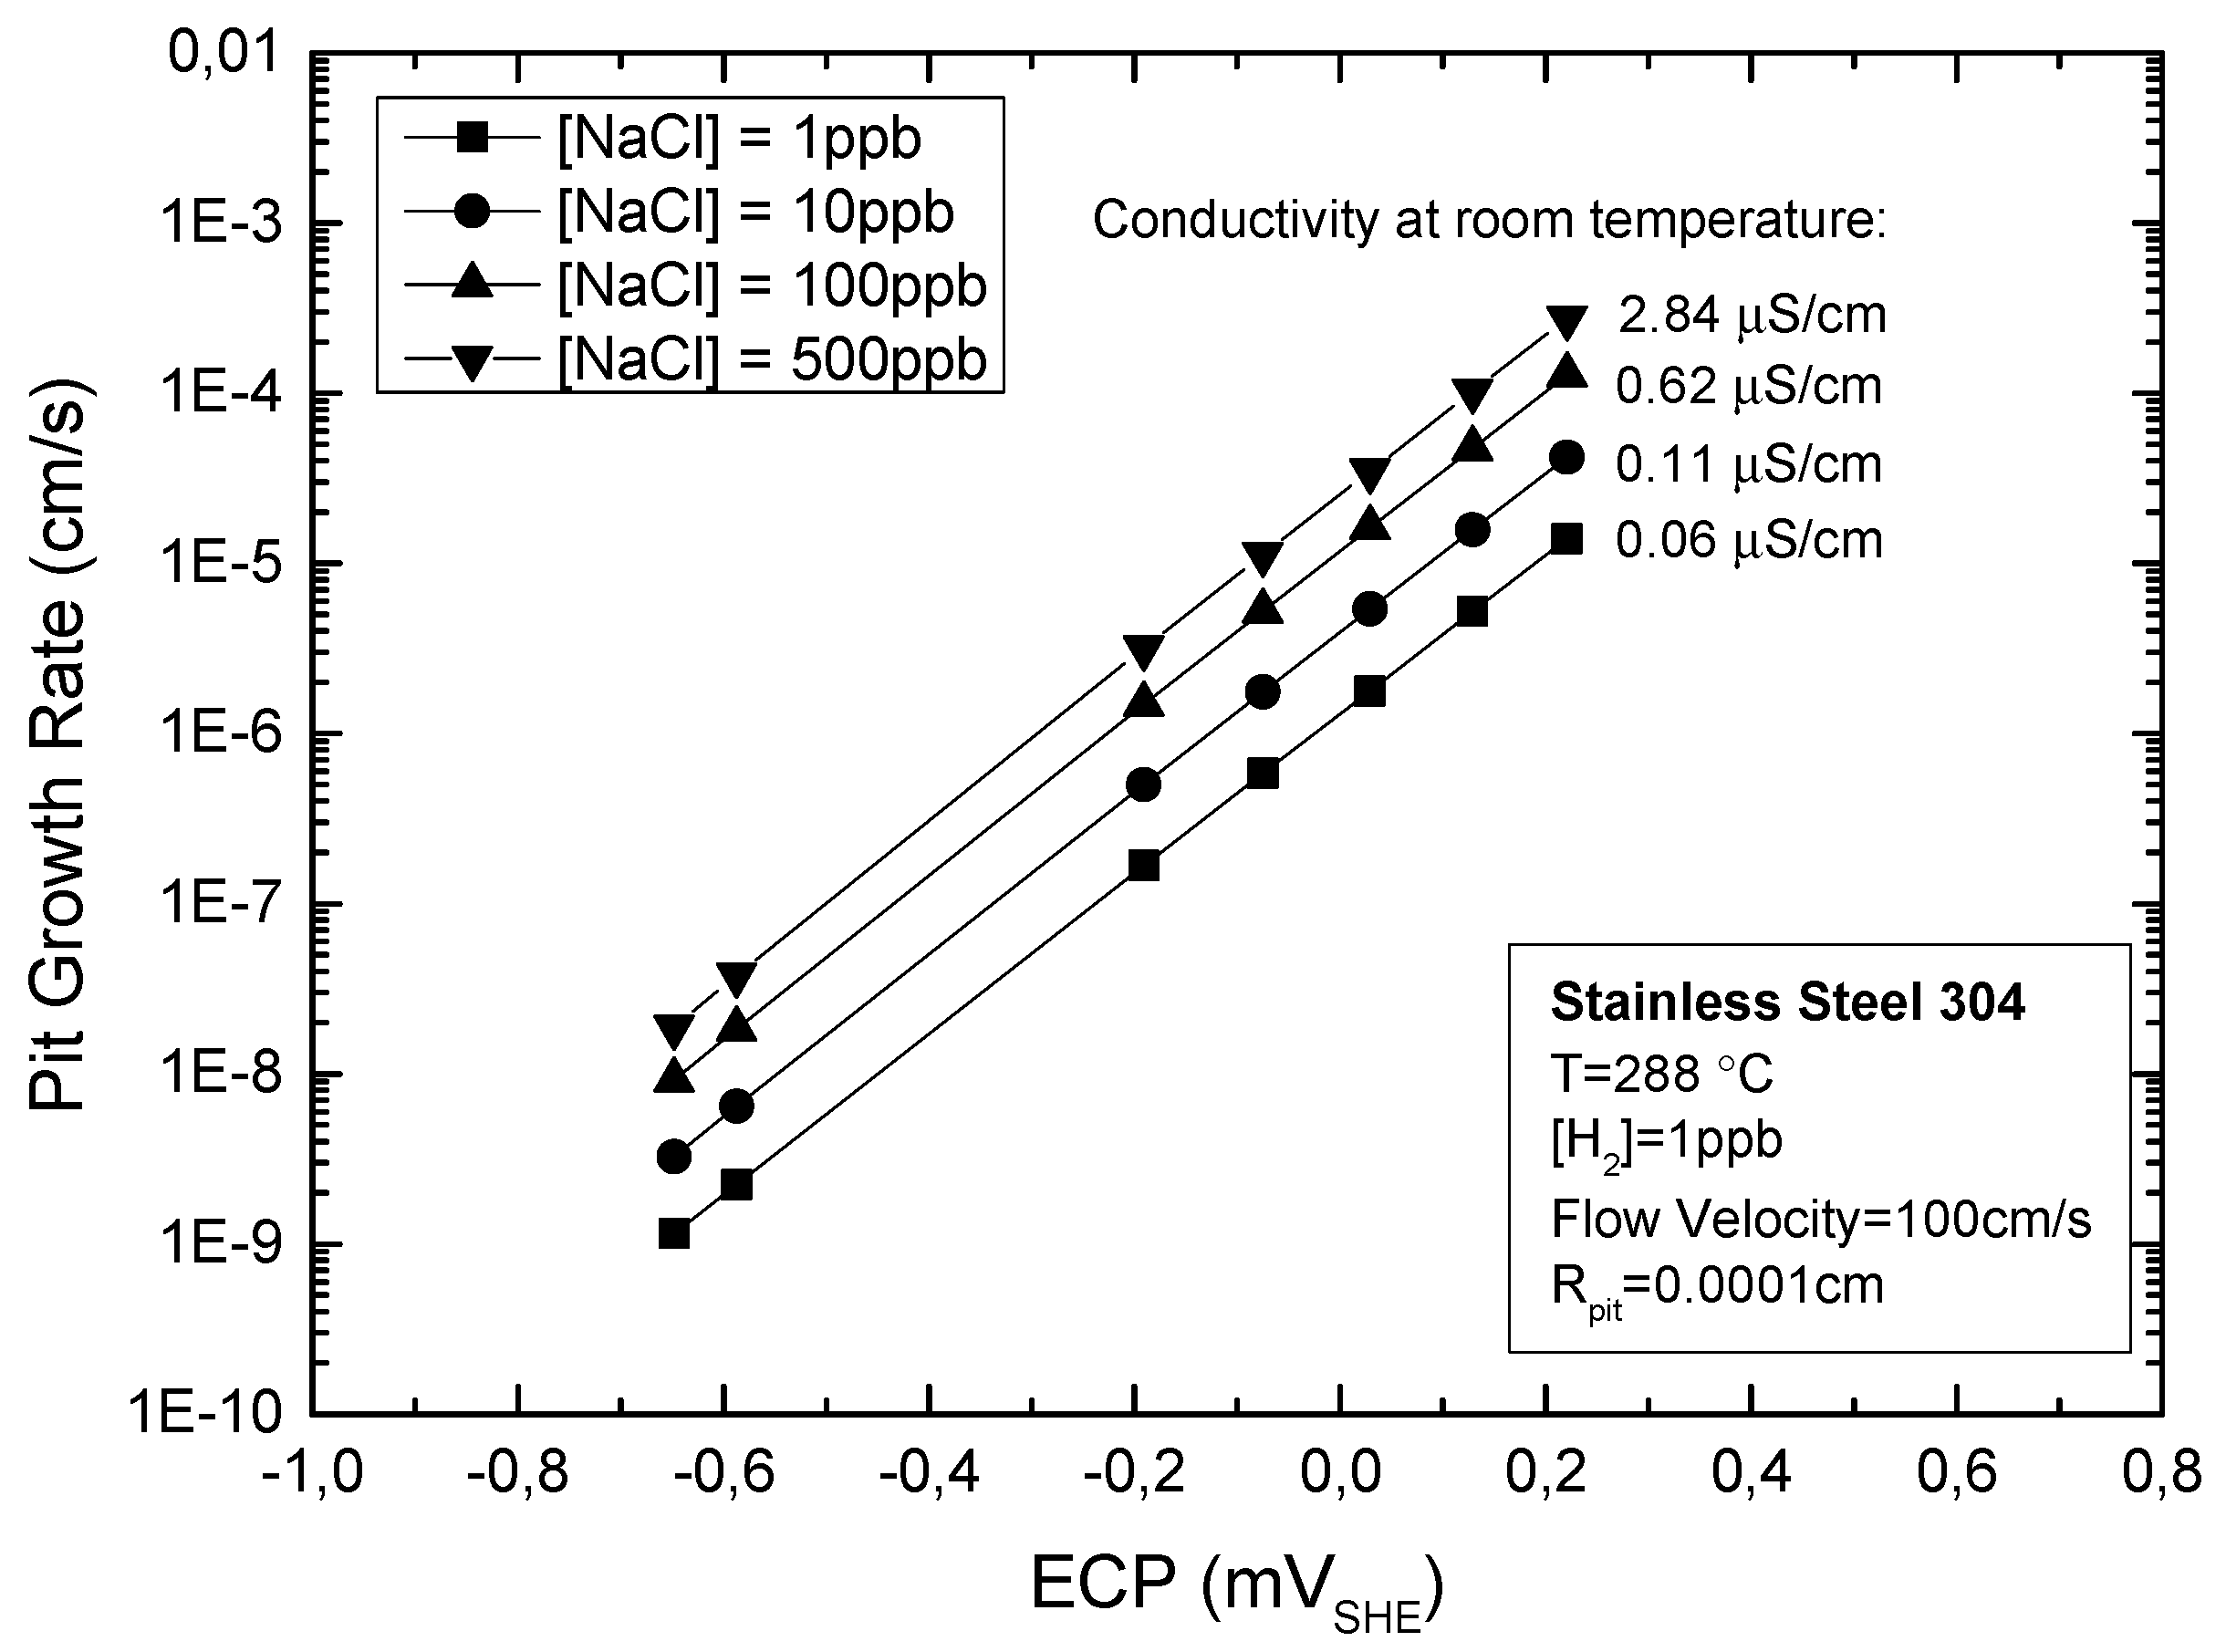
The pit growth rate (PGR) values in terms of the ECP obtained for four different NaCl concentrations for Type 304 SS are compared in Figure 10. As the model confirms, increasing the NaCl concentration increases the solution conductivity and, hence, the PGR. The ECP is a strong function of [O2], [H2O2], and [H2], resulting in a sigmoid dependence of the ECP on [O2] (see, for example, Figure 9) [51]. The pit growth rate (PGR) increases exponentially with increasing ECP and is a strong conductivity function as compared to coupled environment models [51], particularly at low conductivities (Figure 7). The ECP decreases strongly (becomes more negative) as the temperature increases in agreement with experiments [51]. The PGR, like the CGR, also decreases strongly with decreasing ECP. The decrease in the ECP with increasing temperature offsets the increase in the PGR (CGR) due to activation, resulting in an apparent reduction in the PGR with increasing temperature. Consequently, the CGR passes through a maximum at approximately 150 °C [51].
Figure 10.
Variation in PGR with solution conductivity [51].
As noted above, an increase in temperature results in the displacement of the ECP toward more negative values, thereby decreasing the pit growth rate and increasing the crack initiation time. It is essential to note that the ECP, as calculated by the mixed potential model [61], is strongly dependent on temperature. This dependence competes with that due to activation of the metal dissolution rate at the cavity tip in determining the net PGR. Future work will include calculations with arbitrarily imposed ECP values to investigate the effect of the ECP on the PGR, independently of temperature.
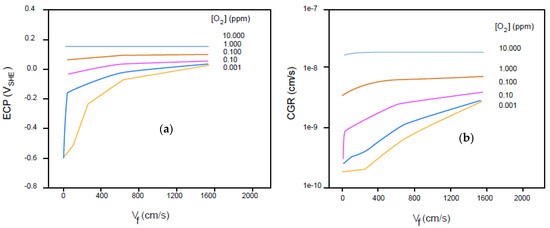
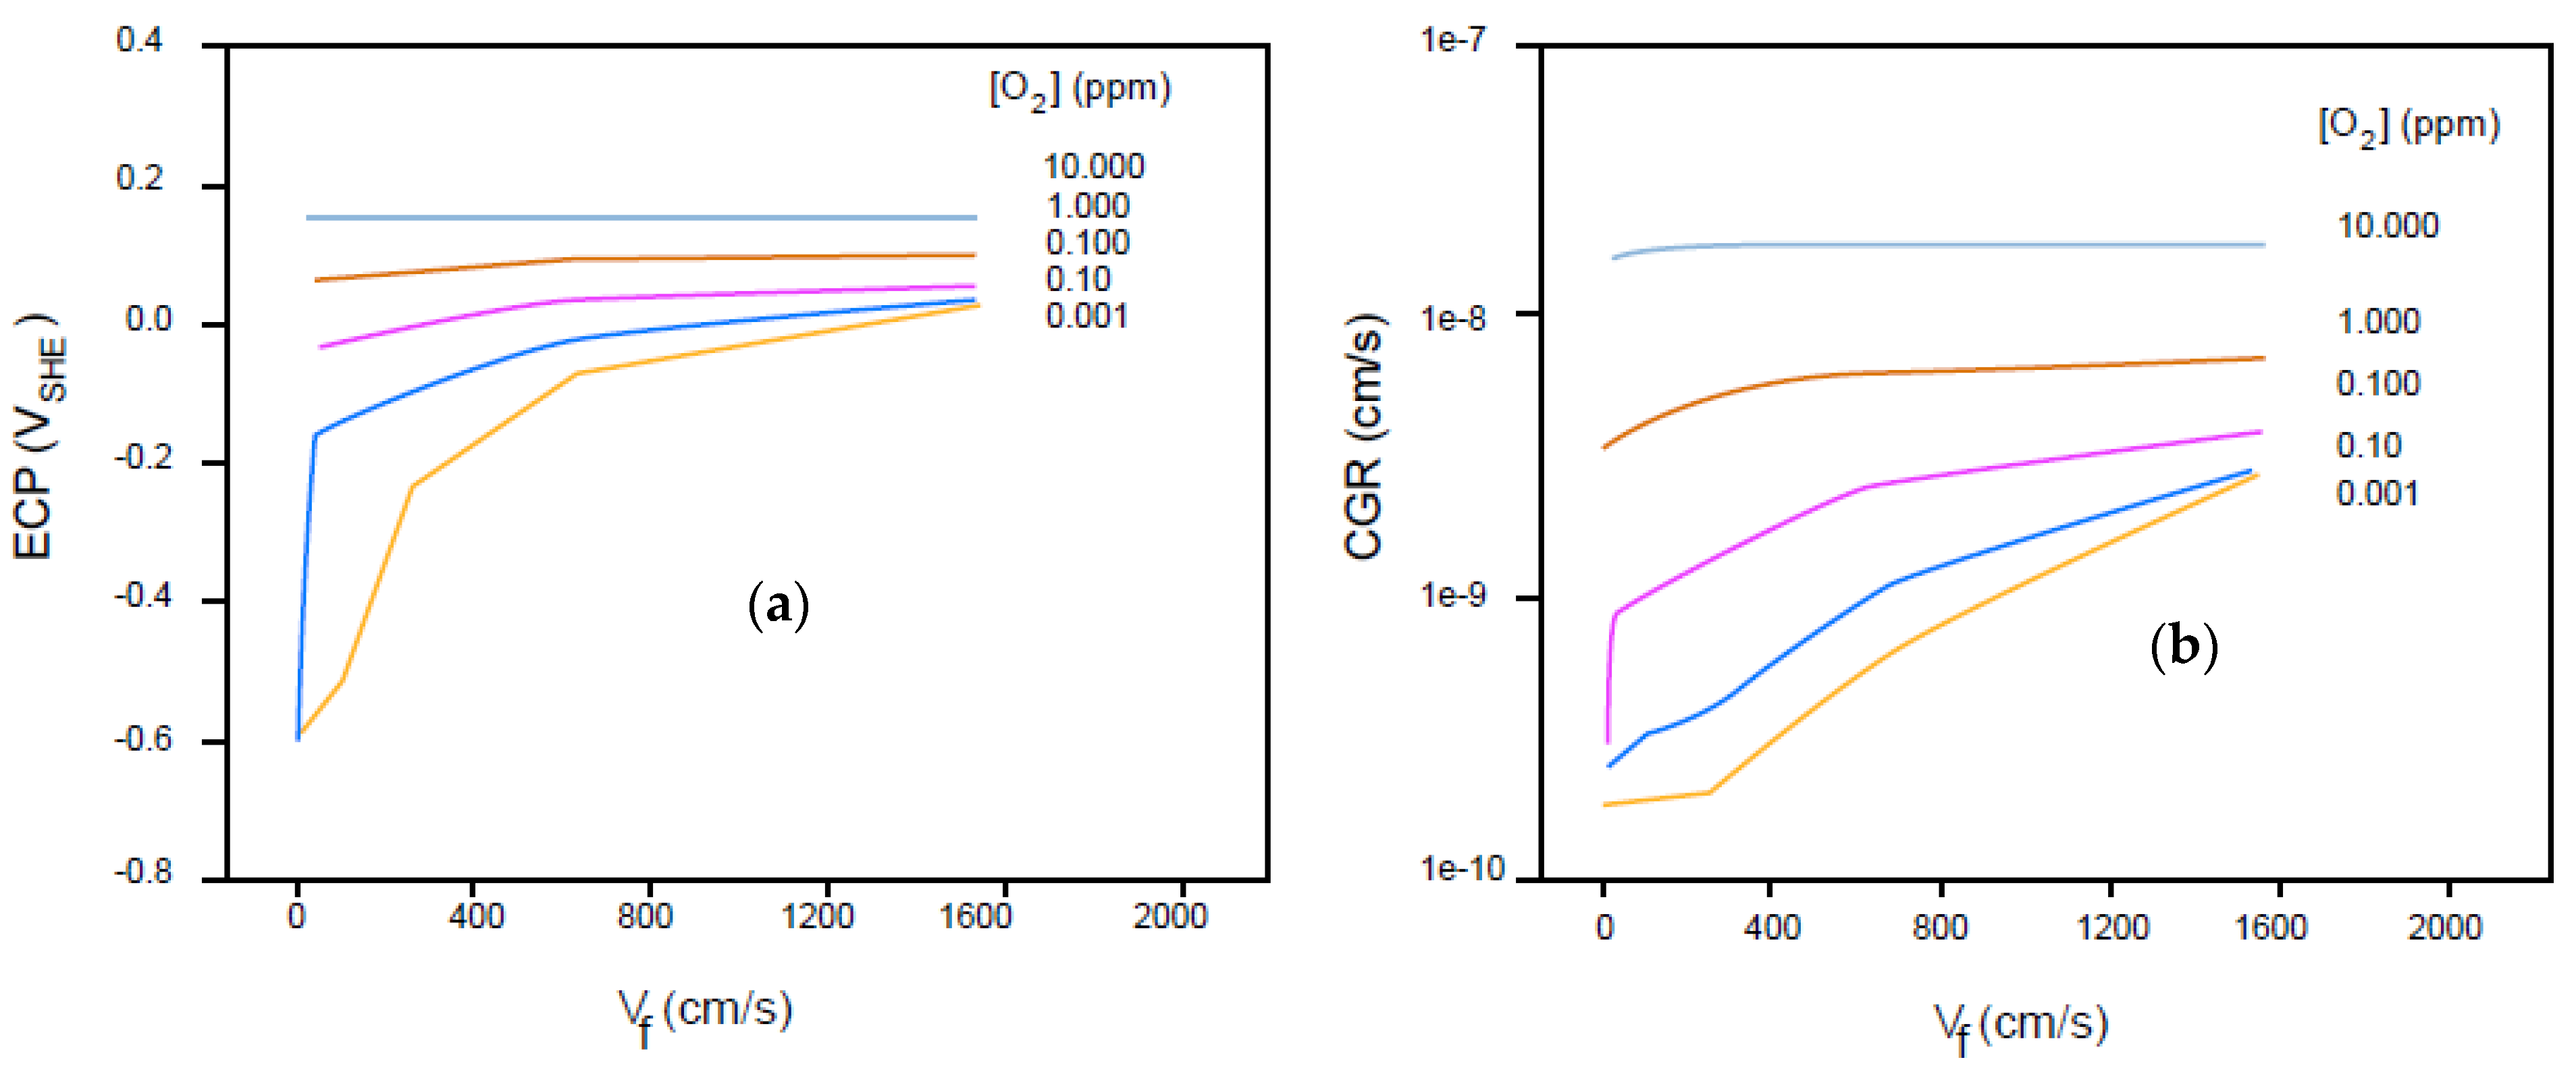
Figure 11 shows the impact of the flow velocity on the ECP and the crack growth rate (CGR) (synonymous with the PGR in the absence of stress) corresponding to different oxygen concentrations. The effect of the flow velocity at low oxygen concentrations is more significant, as described by the generalized Butler–Volmer model [40,41,61].
Figure 11.
Effect of flow velocity on the ECP (a) and IGSCC CGR in sensitized Type 304 SS as a function of [O2] in simulated BWR coolant (b) at 288 °C [28]. The aspect ratio (AR) = 500. Adapted from [51].
Specific plots of the PGR as a function of the ECP for a range of solution conductivities are displayed in Figure 12. Not unexpectedly, the form of the plot at each conductivity is Tafelian, because the cavity advances in depth by metal dissolution within the pit or because the PGR is controlled by the redox reaction occurring on the surface externally to the pit. Of course, in the steady state, these currents must be equal (see Figure 6b).
Figure 12.
Variation in PGR in terms of ECP for different conductivity values at 288 °C [51].
4.2. Effect of Flow Velocity
One little-recognized independent variable is the flow velocity of the coolant across the crack mouth [51]. The flow induces rotational and counter-rotational eddies to form within the crack, as illustrated in the crack, thereby ensuring efficient mixing in a region of several eddy diameters into the crack, as shown schematically in Figure 13a. A photograph of the eddies, as reported [5] is shown in Figure 13b. At greater depths, the solution is quiescent. The phenomenon can be treated analytically as the penetration of the external environment into the crack, resulting in a decrease in the length of the quiescent zone (electrochemical crack length, ECL), as noted above. According to the CEFM [46], a decrease in the ECL leads to an increase in the IGSCC CGR and PGR, with the effect being added to the rise in the CGR/PGR resulting from the enhanced rate of mass transfer of the cathodic depolarizer (e.g., O2) to the external surface.
Figure 13.
Impact of fluid flow on the electrochemical crack length (ECL) [6]. (a) Schematic of the counter-rotating eddy structure within a crack. (b) Experimental illustration of flow-induced rotating eddies in a cavity of AR = 3 [51]. ©1966 ASME. This image is hereby used courtesy of the ASME.
For very-low-aspect-ratio (length/width) cavities, the eddies may extend to the crack tip, in which case the aggressive solution (e.g., high [Cl−] and [H+]) becomes flushed from the system, and SCC stops. In that case, the crack nucleus extends by creep, as evidenced by the cavity geometry shown in Figure 7a, which shows a distinct strain contribution. Rough estimates suggest that the critical number of flow-induced eddies for a parallel-sided cavity may be as high as 50, with the aspect ratio (AR) being of that order [8]. The number of eddies in a real intergranular crack in sensitized stainless steel is reckoned to be much less than for a parallel-sided crack because the eddy diameter must decrease with depth into the crack as the crack width decreases.
4.3. Effect of Mechanical Variables
The variation in the critical pit radius for IGSCC/PGR in sensitized Type 304 SS, obtained by Equation (7) with the applied stress, is shown in Figure 14. The applied stress significantly influences the critical pit radius at low stress levels, but gradually decreases with increasing stress at higher levels. This dependence primarily reflects the change of KI with R, as expressed by Equation (7).
Figure 14.
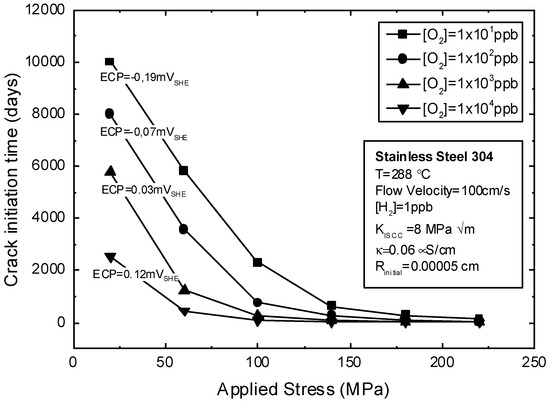
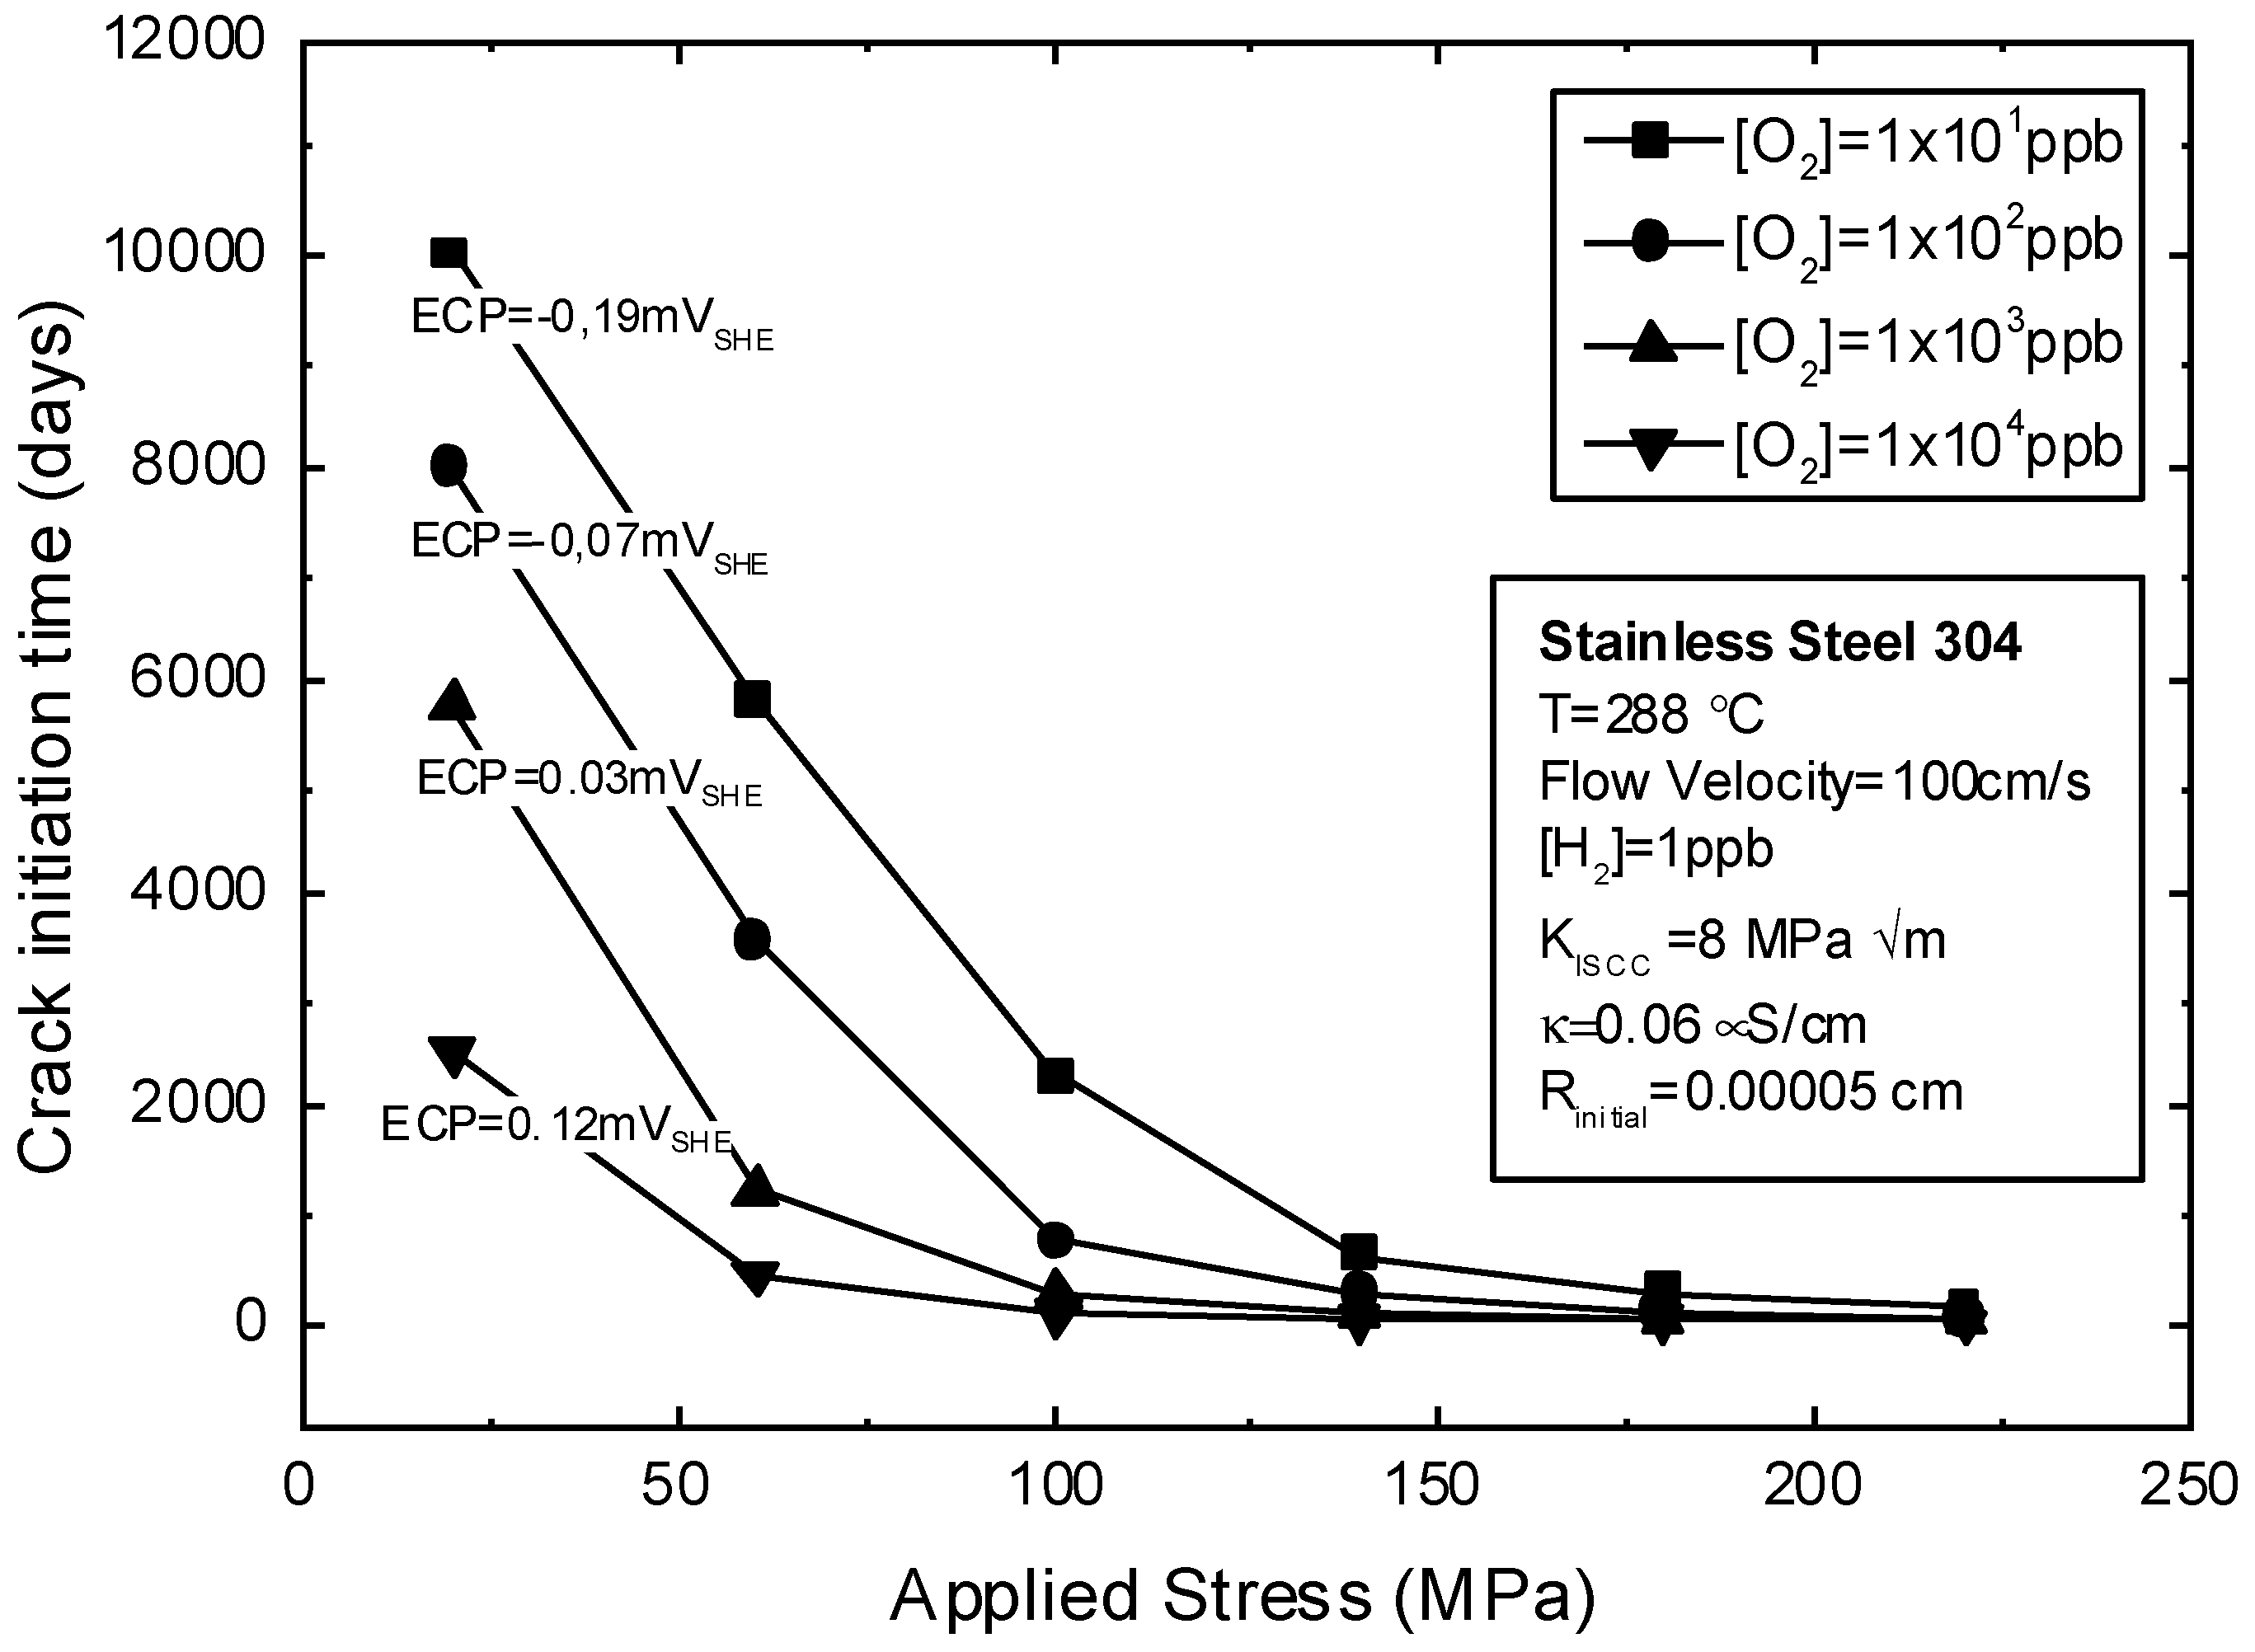
Effect of applied stress on crack initiation time with ([51] before none]).
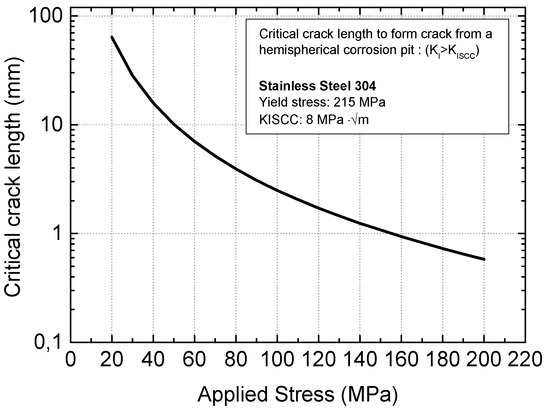
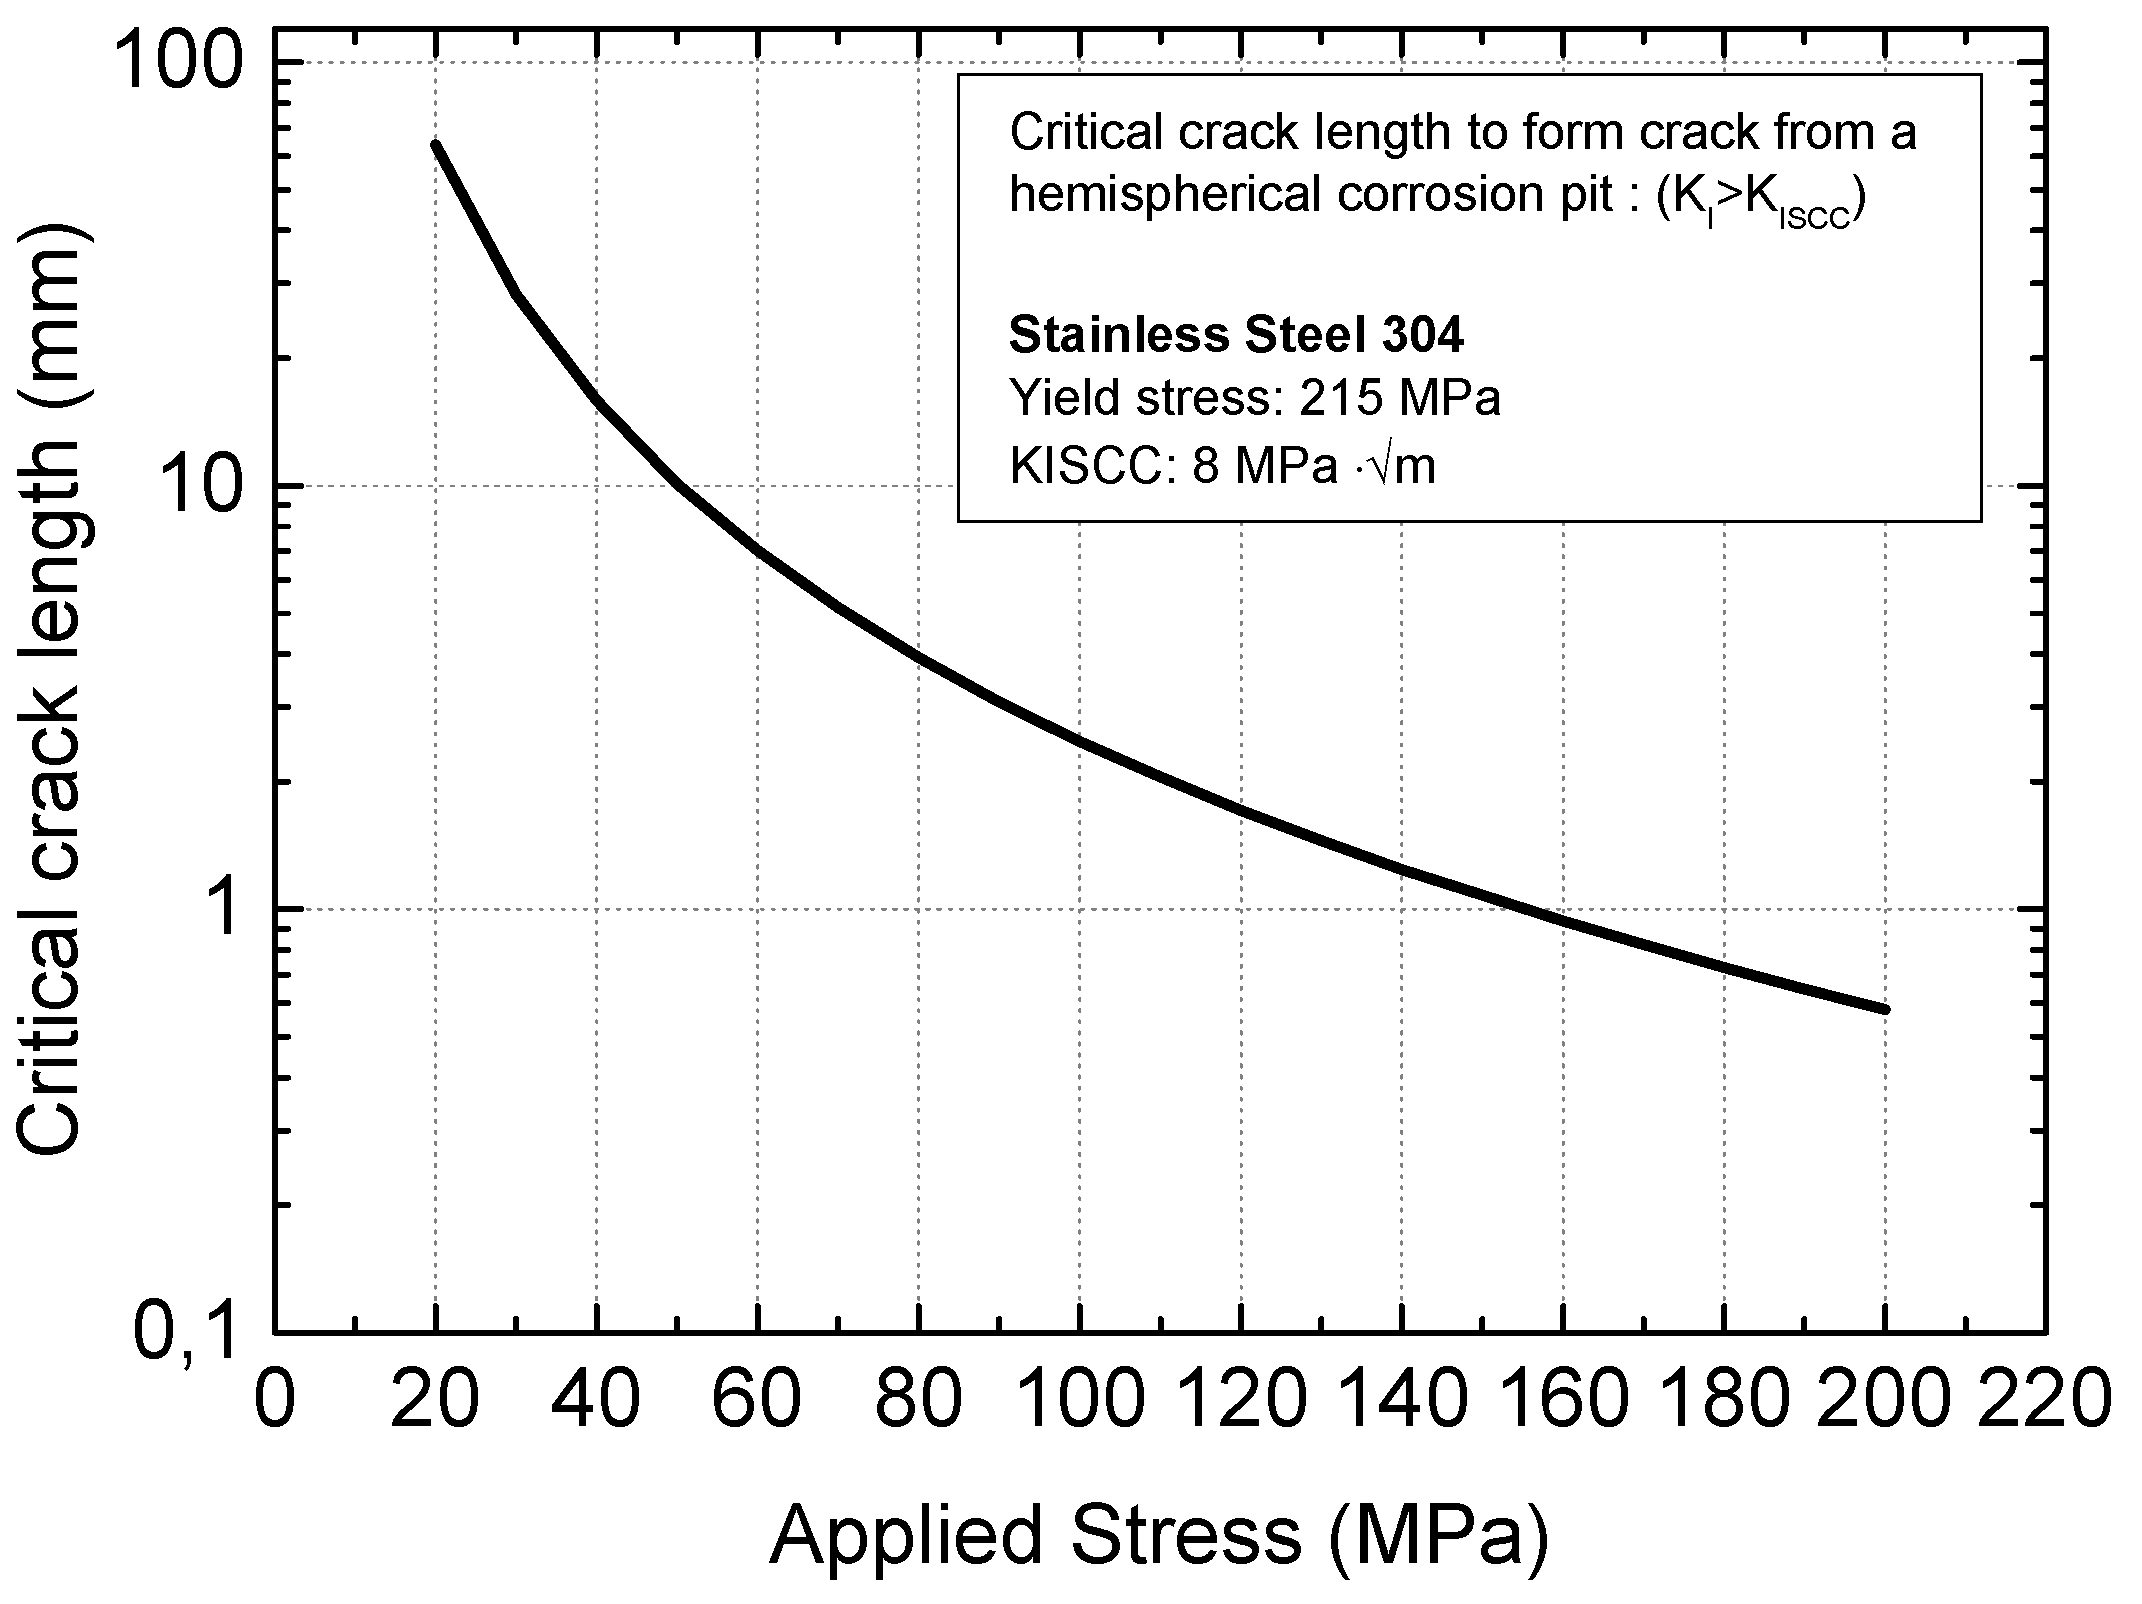
The effect of applied stress on the crack initiation time as a function of the ECP is displayed in Figure 15. This figure also reflects the high sensitivity of the critical crack length (pit radius for a hemispherical pit) and, therefore, the crack initiation time in the lower range of the applied stresses. The significant impact of the ECP is also evident in the same applied stress range.
Figure 15.
Effect of applied stress on the critical crack length for nucleation of a stress corrosion crack in Type 304 stainless steel in a simulated BWR primary coolant [51].
It is essential to note that this effect is typically observed in the field of stress corrosion cracking, as the stress intensity factor has a similar impact on the crack growth rate near KISCC. It reaches a plateau as KI increases toward higher values. The crack initiation time is predicted to decrease significantly with increasing applied stress, but it is also a sensitive function of the ECP. This emphasizes the need for accurate estimates of residual and operational stress, as well as the ECP, when predicting crack initiation times in operating water-cooled nuclear reactors. The pit growth rate is expected to increase exponentially with the ECP, just like the CGR. The PGR increases with decreasing pit radius, as is the case for SCC, with a decreasing crack length. This is due to the smaller IR potential drop down the pit/crack cavity in a manner identical to decreasing ECL in a growing crack.
Figure 15 also shows that the ECP has a significant impact on the crack initiation time at low mechanical stress levels; however, its effect becomes muted at higher stresses. This behavior also corresponds to a general observation in the field of stress corrosion cracking. At extremely high mechanical loading levels, the electrochemical contribution is almost negligible, and vice-versa; the mechanical effect loses its significance with intensive electrochemical conditions. The KI for the pit is a strong function of the ECP because of the firm positive dependence of the PGR on the ECP. Likewise, the pit radius is a strong, positive function of the ECP. Once the pit radius and KI exceed critical values, a crack nucleates.
4.4. Theory of the Distribution in Crack Initiation Time
Attempts to measure the crack initiation times (CITs) for materials in reactor coolant circuits generally produce highly scattered data, suggesting that a fundamental limit may exist in the measurement accuracy and the prediction of CITs [6,7]. If so, attempts to measure increasingly accurate CITs for a practical failure time analysis may prove futile and, hence, a waste of precious resources, both in terms of time and money, because there appears to be a fundamental limit to how accurately they can be measured. In this section, we outline why such a limitation may exist and briefly discuss what information may be gleaned from crack initiation time data, even if the sought-after accuracy is not attainable.
4.5. Physico-Electrochemistry of Crack Initiation
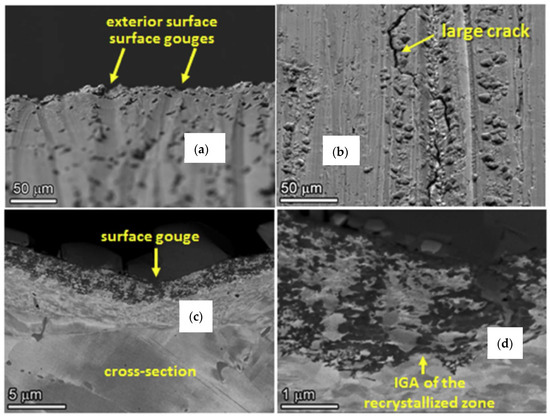
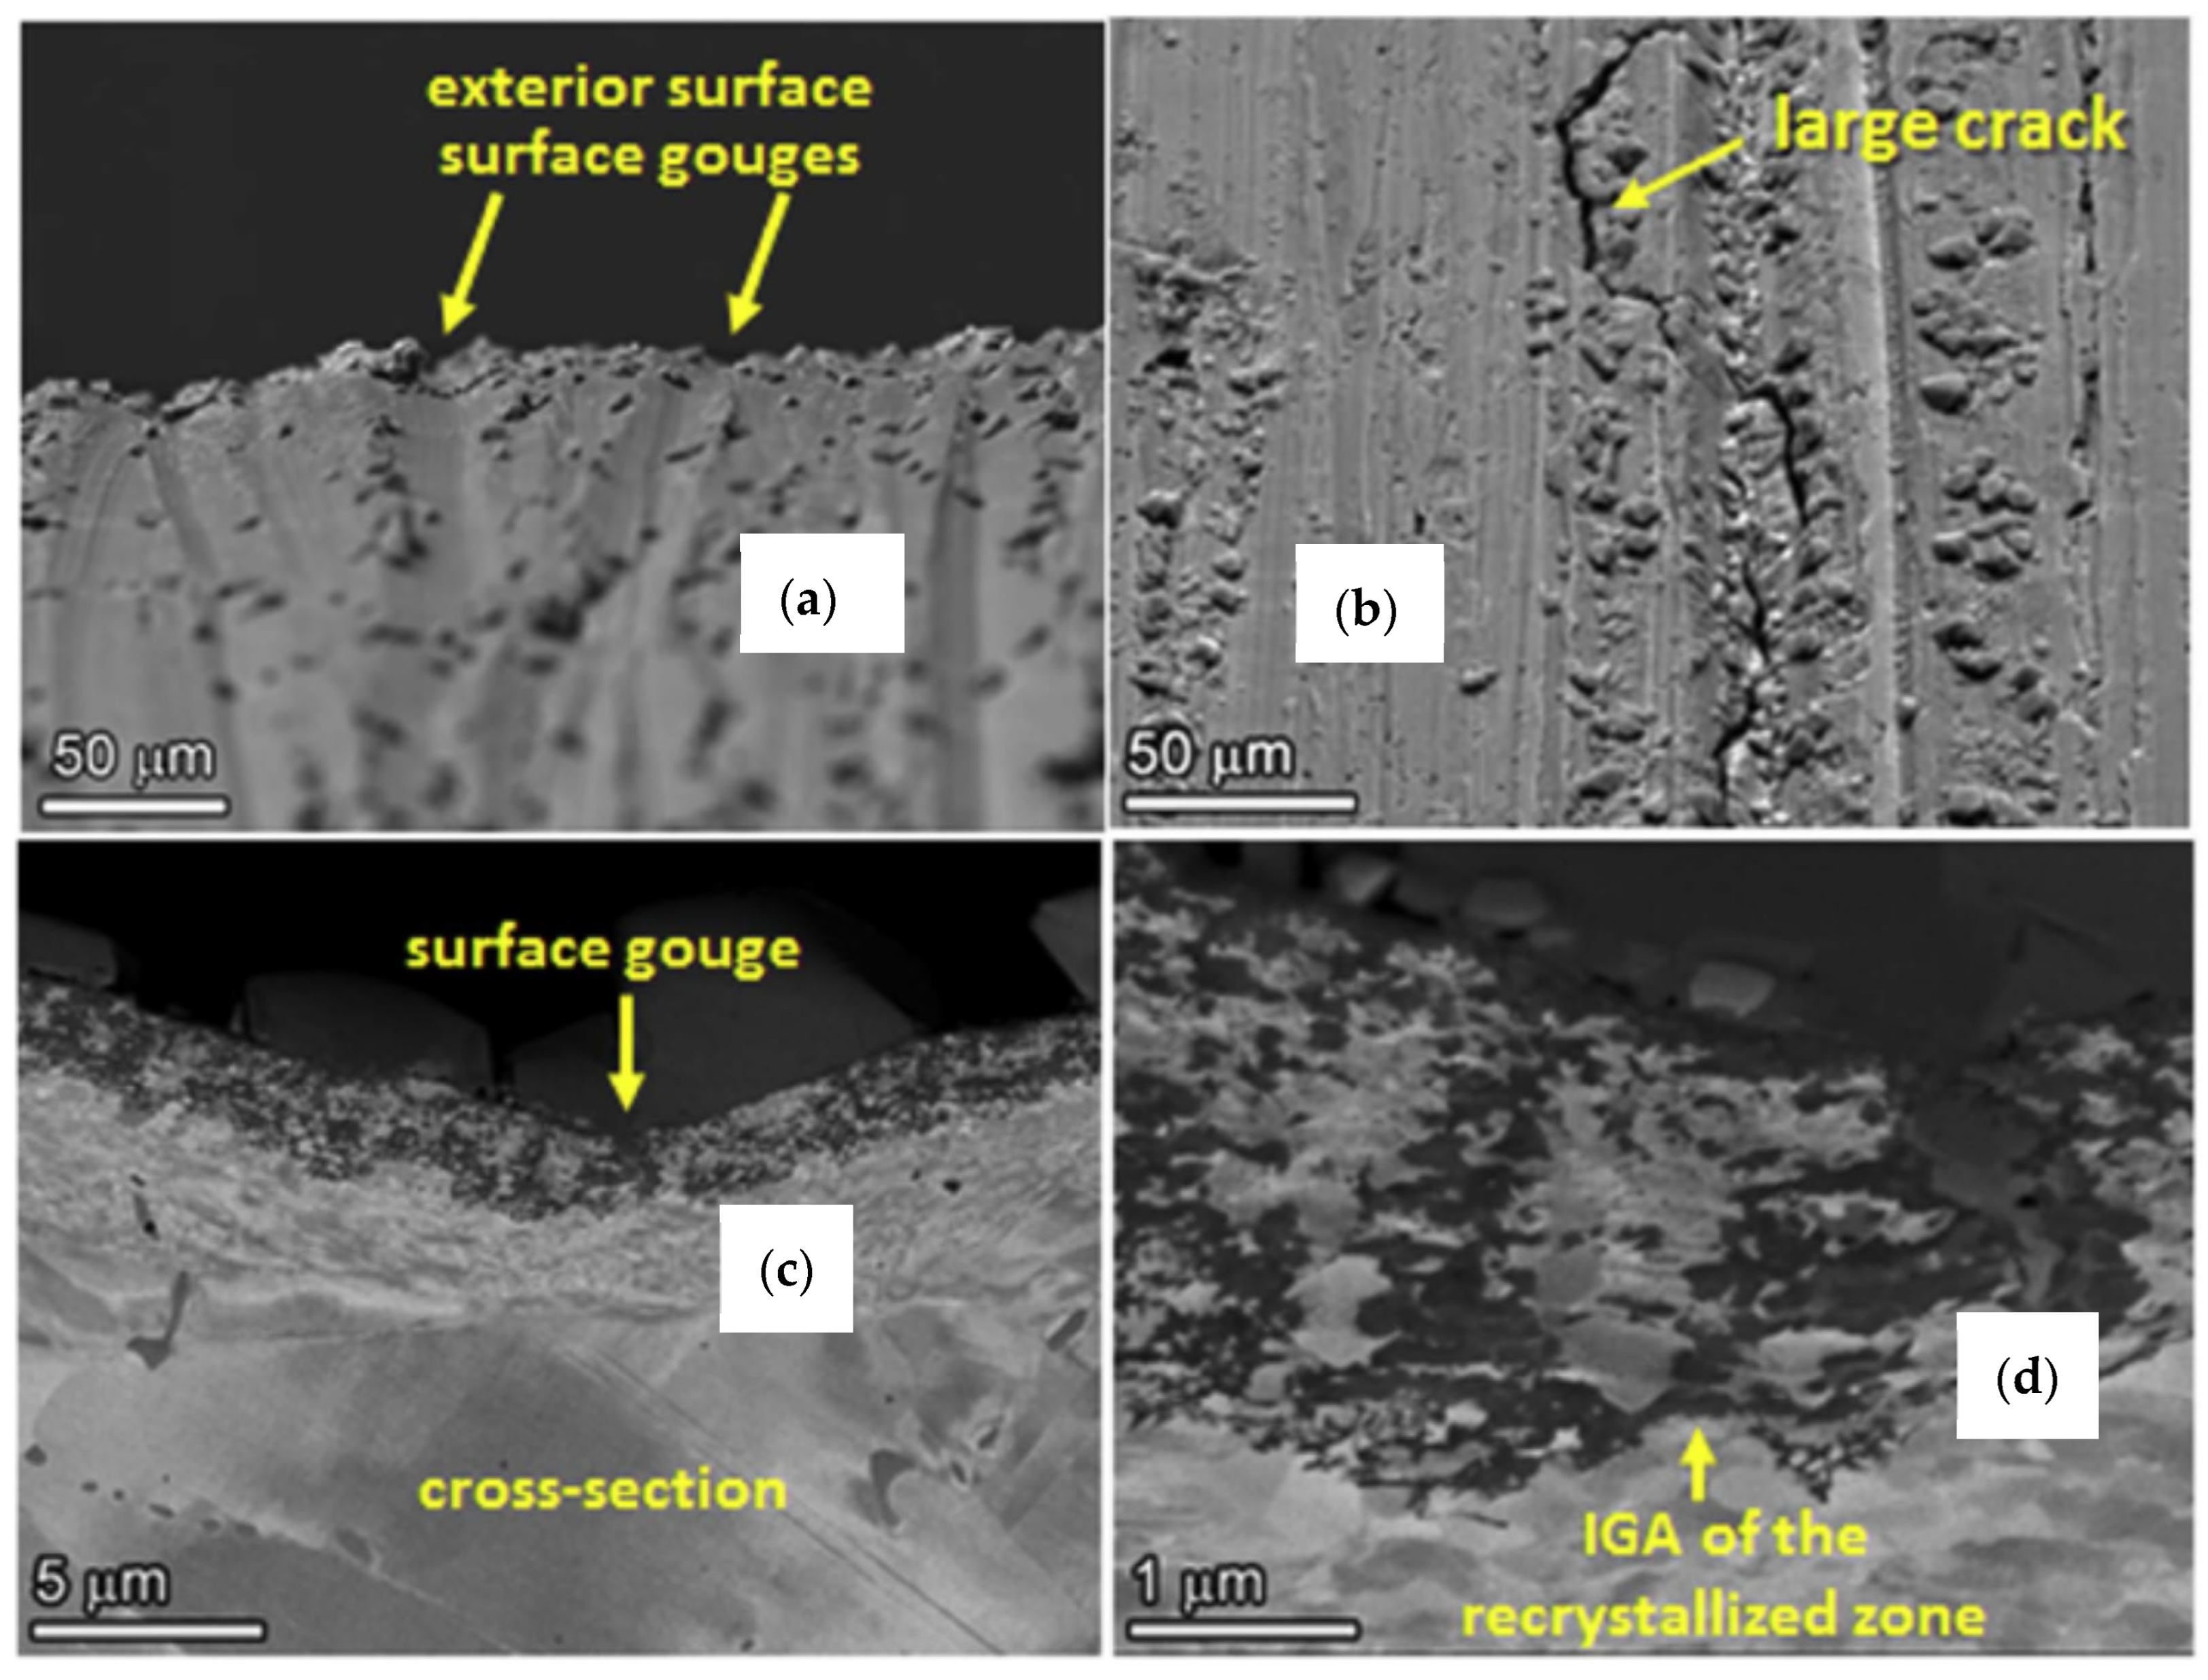
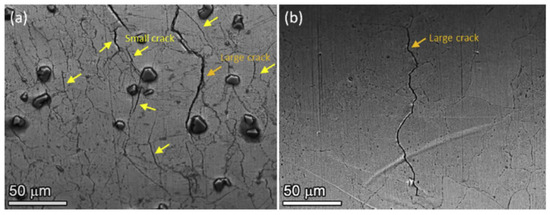
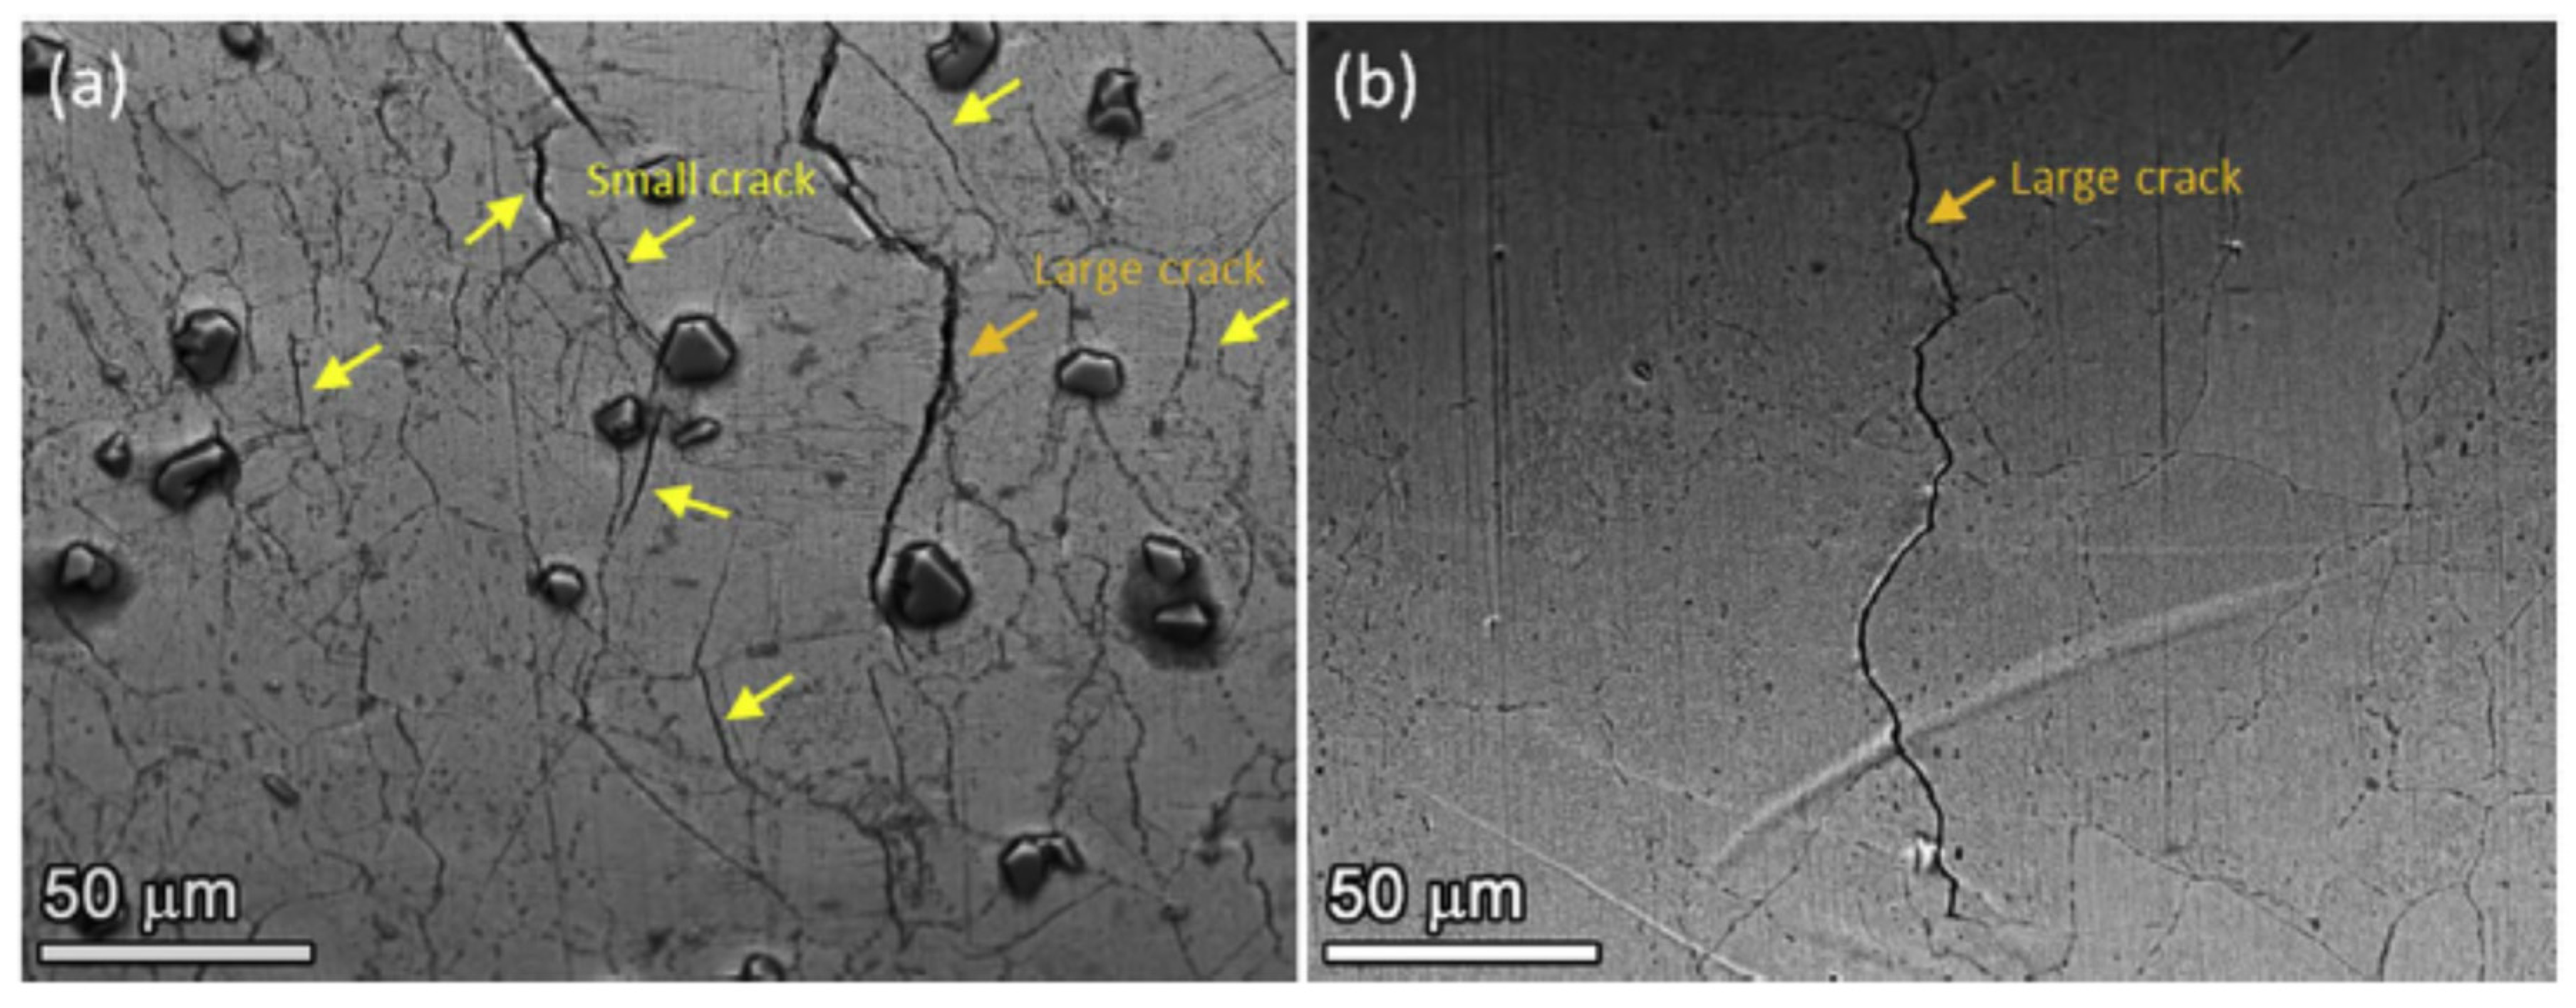
One of the problems inherent in describing crack initiation is to specify the exact nature of the initiation site in terms of geometry and chemistry. As shown in Figure 16 and Figure 17, the surfaces of sensitized Type 304 SS and mill-annealed (MA) Alloy 600 are far from being atomically smooth; instead, the morphology is dominated by gouges and other machining features, as well as corrosion-induced roughening, including emergent intergranular attack (IGA) in the surface recrystallization zone of the MA material.
Figure 16.
SEM-SE images of the surface (a,b) and BSE images showing the cross-section (c,d) of a 60-grit finish plate specimen of MA Alloy 600 after exposure to simulated PWR primary coolant [6,7].
Figure 17.
SEM-SE images of the surface showing surface cracks and high energy, emergent grain boundaries of multiple sizes after exposure of MA Alloy 600 to synthetic PWR primary coolant (a) small cracks, (b) large cracks [7,26].
Figure 17a shows that the surface also contains cracks, which are perhaps more accurately described as intergranular penetrations. These intergranular penetrations can form without the application of stress (see also Figure 17b), serving as nucleation sites for IGSCC when the component is subjected to mechanical loading. In general, the surface of Alloy 600 exposed to PWR primary coolant containing 10–50 cm3 (STP)/kg H2O of hydrogen does not form cracks from passivity breakdown events because the ECP is far below the critical breakdown potential, because the pH is relatively high (pH ≈ 7 at 300 °C), and because the chloride concentration is very low. Thus, pits can generally be discounted as crack nucleation sites in MA Alloy 600 in PWR primary coolant, although they occur (Figure 17a). Given that a sharp surface crack has a much more significant stress intensity factor than does a blunt surface gouge, it is fair to assume that, for a given stress, IGSCC will tend to nucleate at the former rather than the latter. The essential question, then, is: What is the mechanism of surface crack formation? Scott and Le Calvar [3] and Scott and Combrade [5] have addressed this question by assuming that water penetrates emergent grain boundaries and forms oxides on the internal boundaries, thereby wedging open the boundaries until KI > KISCC. However, Scott et al. [3,5] did not express this model in analytical form, so the initiation time could not be calculated. This was done in the present work, and we now have an analytical model for this crack initiation process.
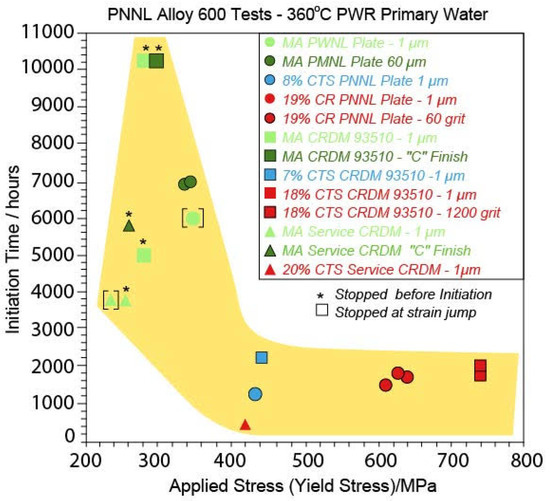
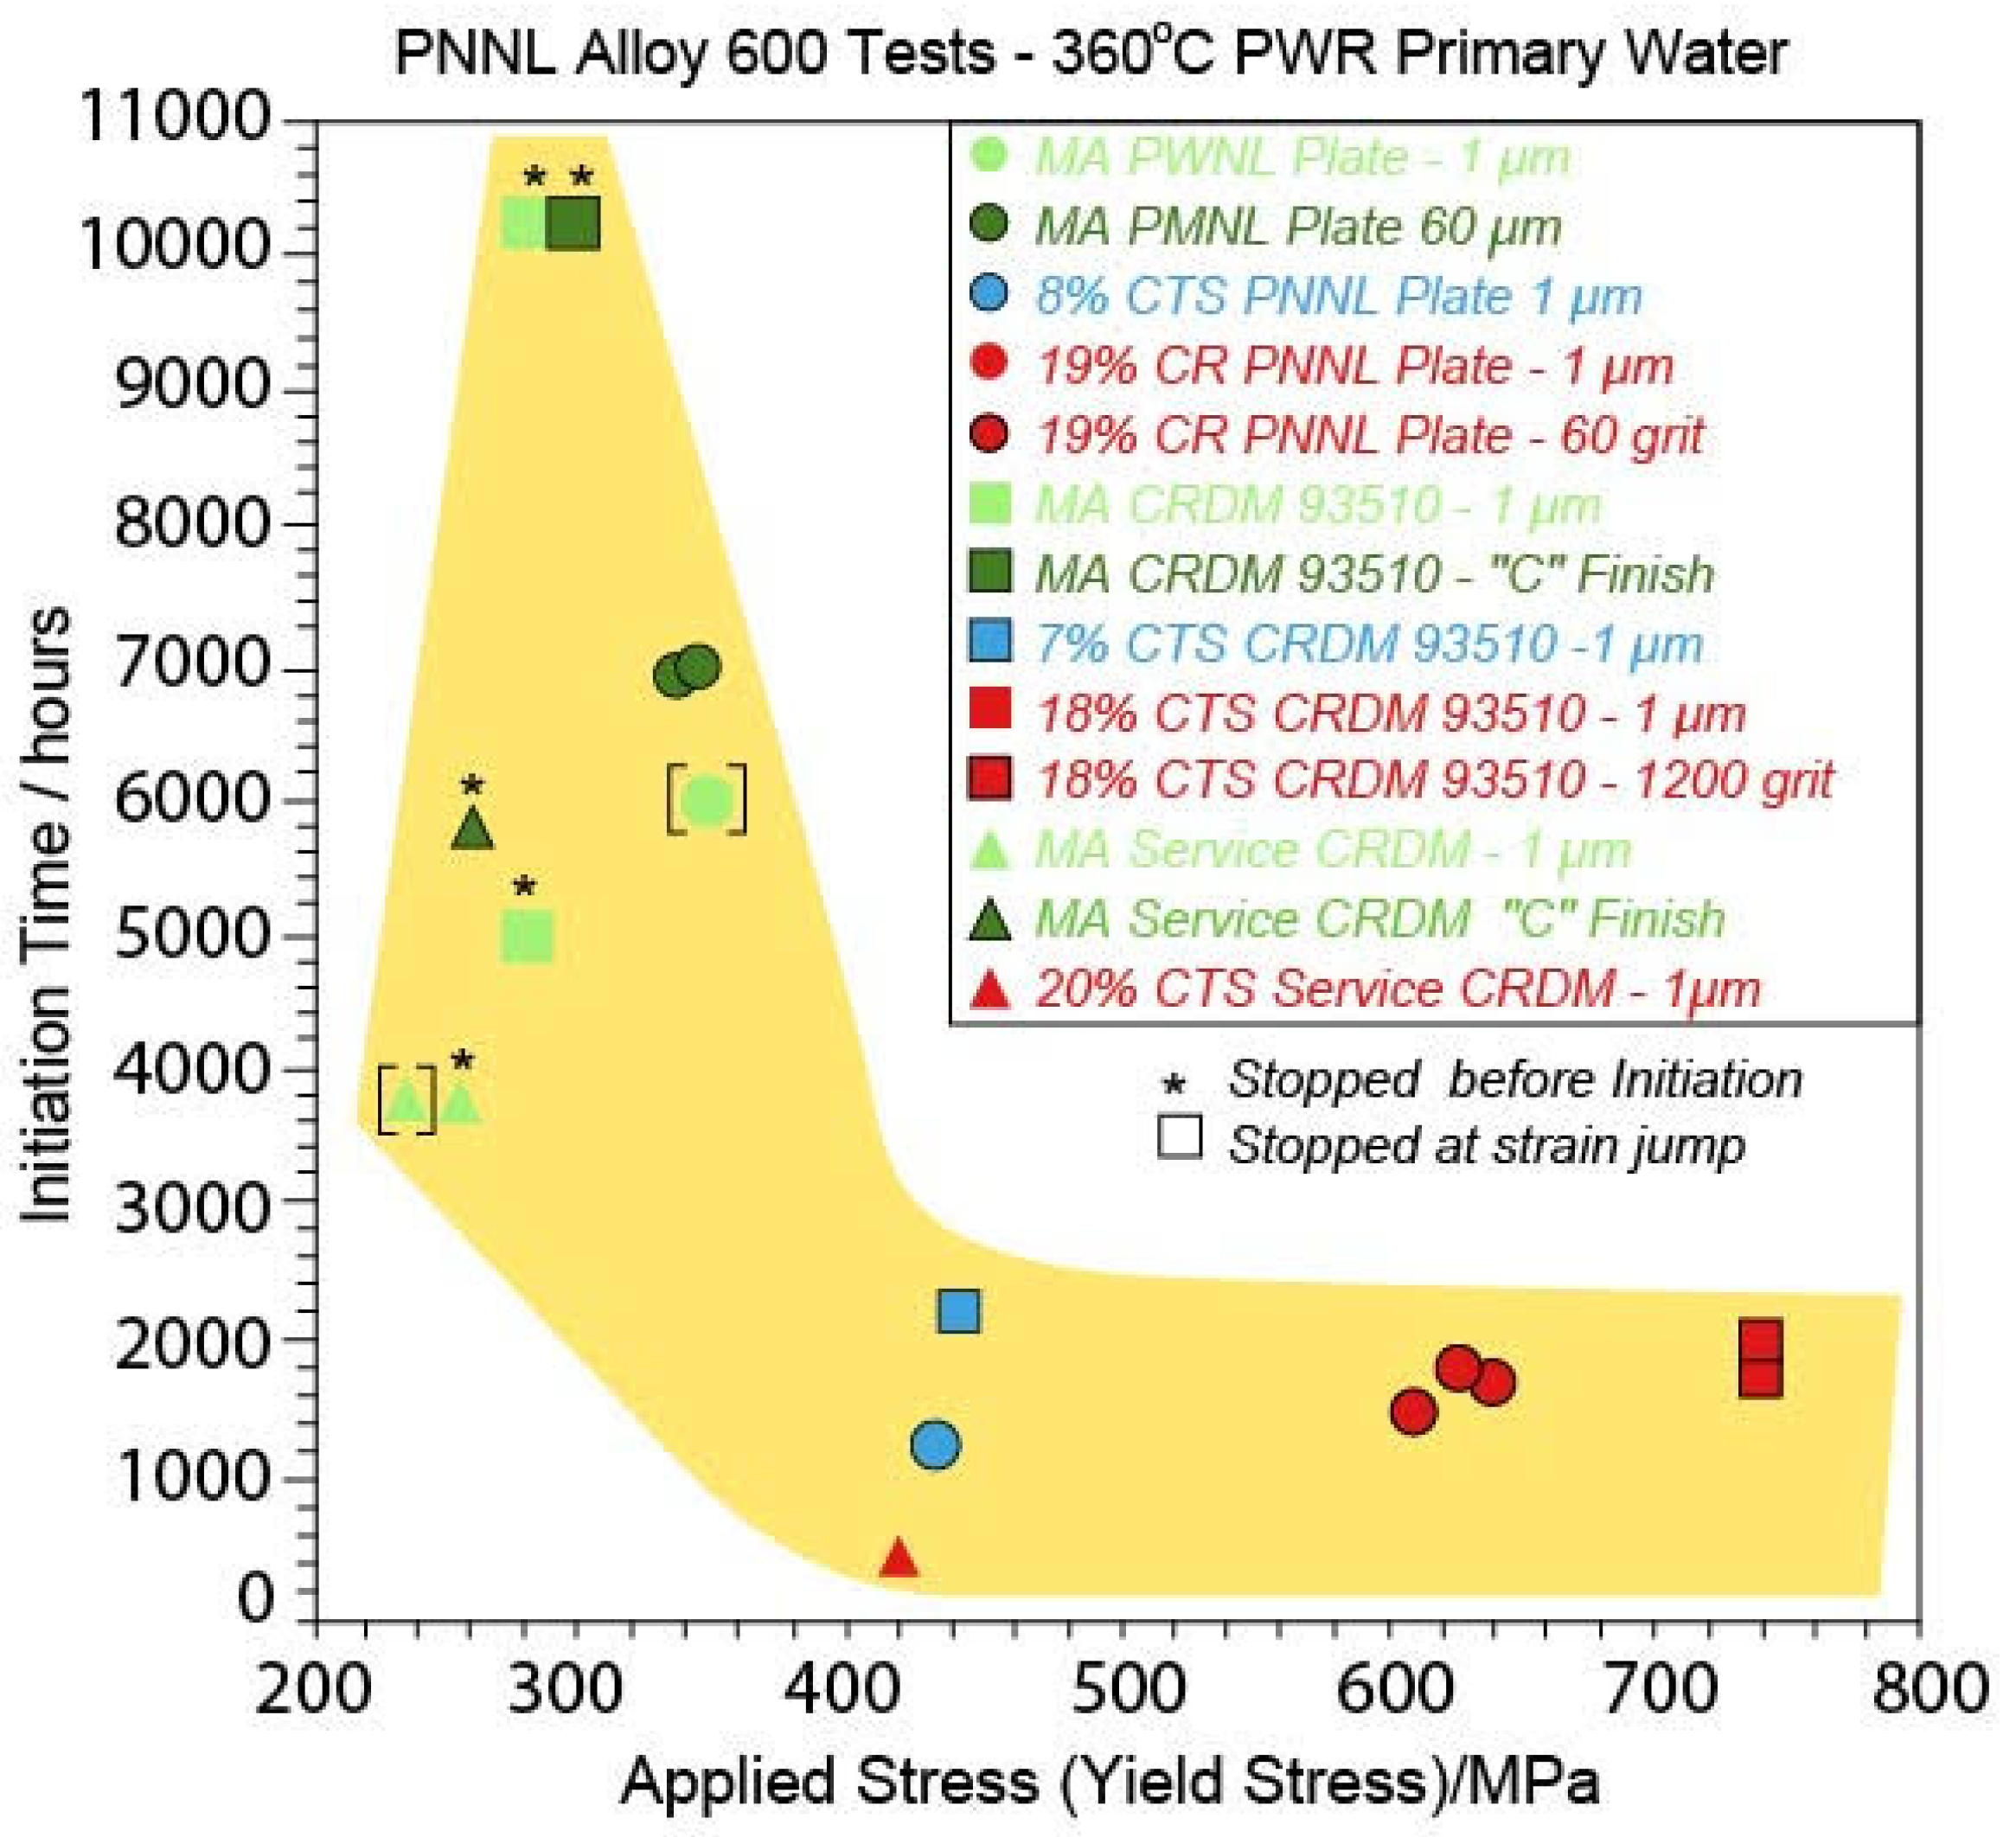
Measured crack initiation time (CIT) data for stainless steels and Alloys 600/690/182 in high-temperature aqueous solutions simulating BWR primary and PWR primary coolants [pure water and B(OH)3/LiOH, respectively] have been reported by several research groups; for example, by Bruemmer et al. [6,7]. The data plotted in Figure 18 demonstrate that, for applied stresses below 450 MPa, the initiation time is a very sensitive function of stress, CIT = a/σm, where the exponent m appears to be 3–4. Since the yield stress shown in Figure 18 corresponds to the yield stress under the conditions of each experiment, the variation in the CIT presumably reflects variations in another parameter, such as temperature. A similar plot is given by Bruemmer et al. [6,7] for the measured CIT as a function of hardness. The critical question then arises: Is the scatter in the measured CIT reflective of experimental uncertainty, or does it reflect a fundamental limitation imposed by the statistical nature of the phenomenon? Although the data are scattered for the reasons outlined in the theory below, a consensus has been achieved on the strong dependencies of the CIT on stress, cold work [6,7], and the ECP, all of which, in principle, can be controlled in an operating reactor.
Figure 18.
Measured crack initiation time as a function of applied stress in PWR primary coolant at 360 °C. The yellow shade defines the bounds of the data, after Bruemmer et al. [6,7].
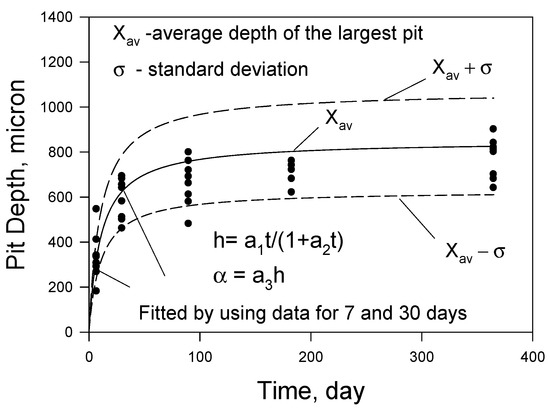
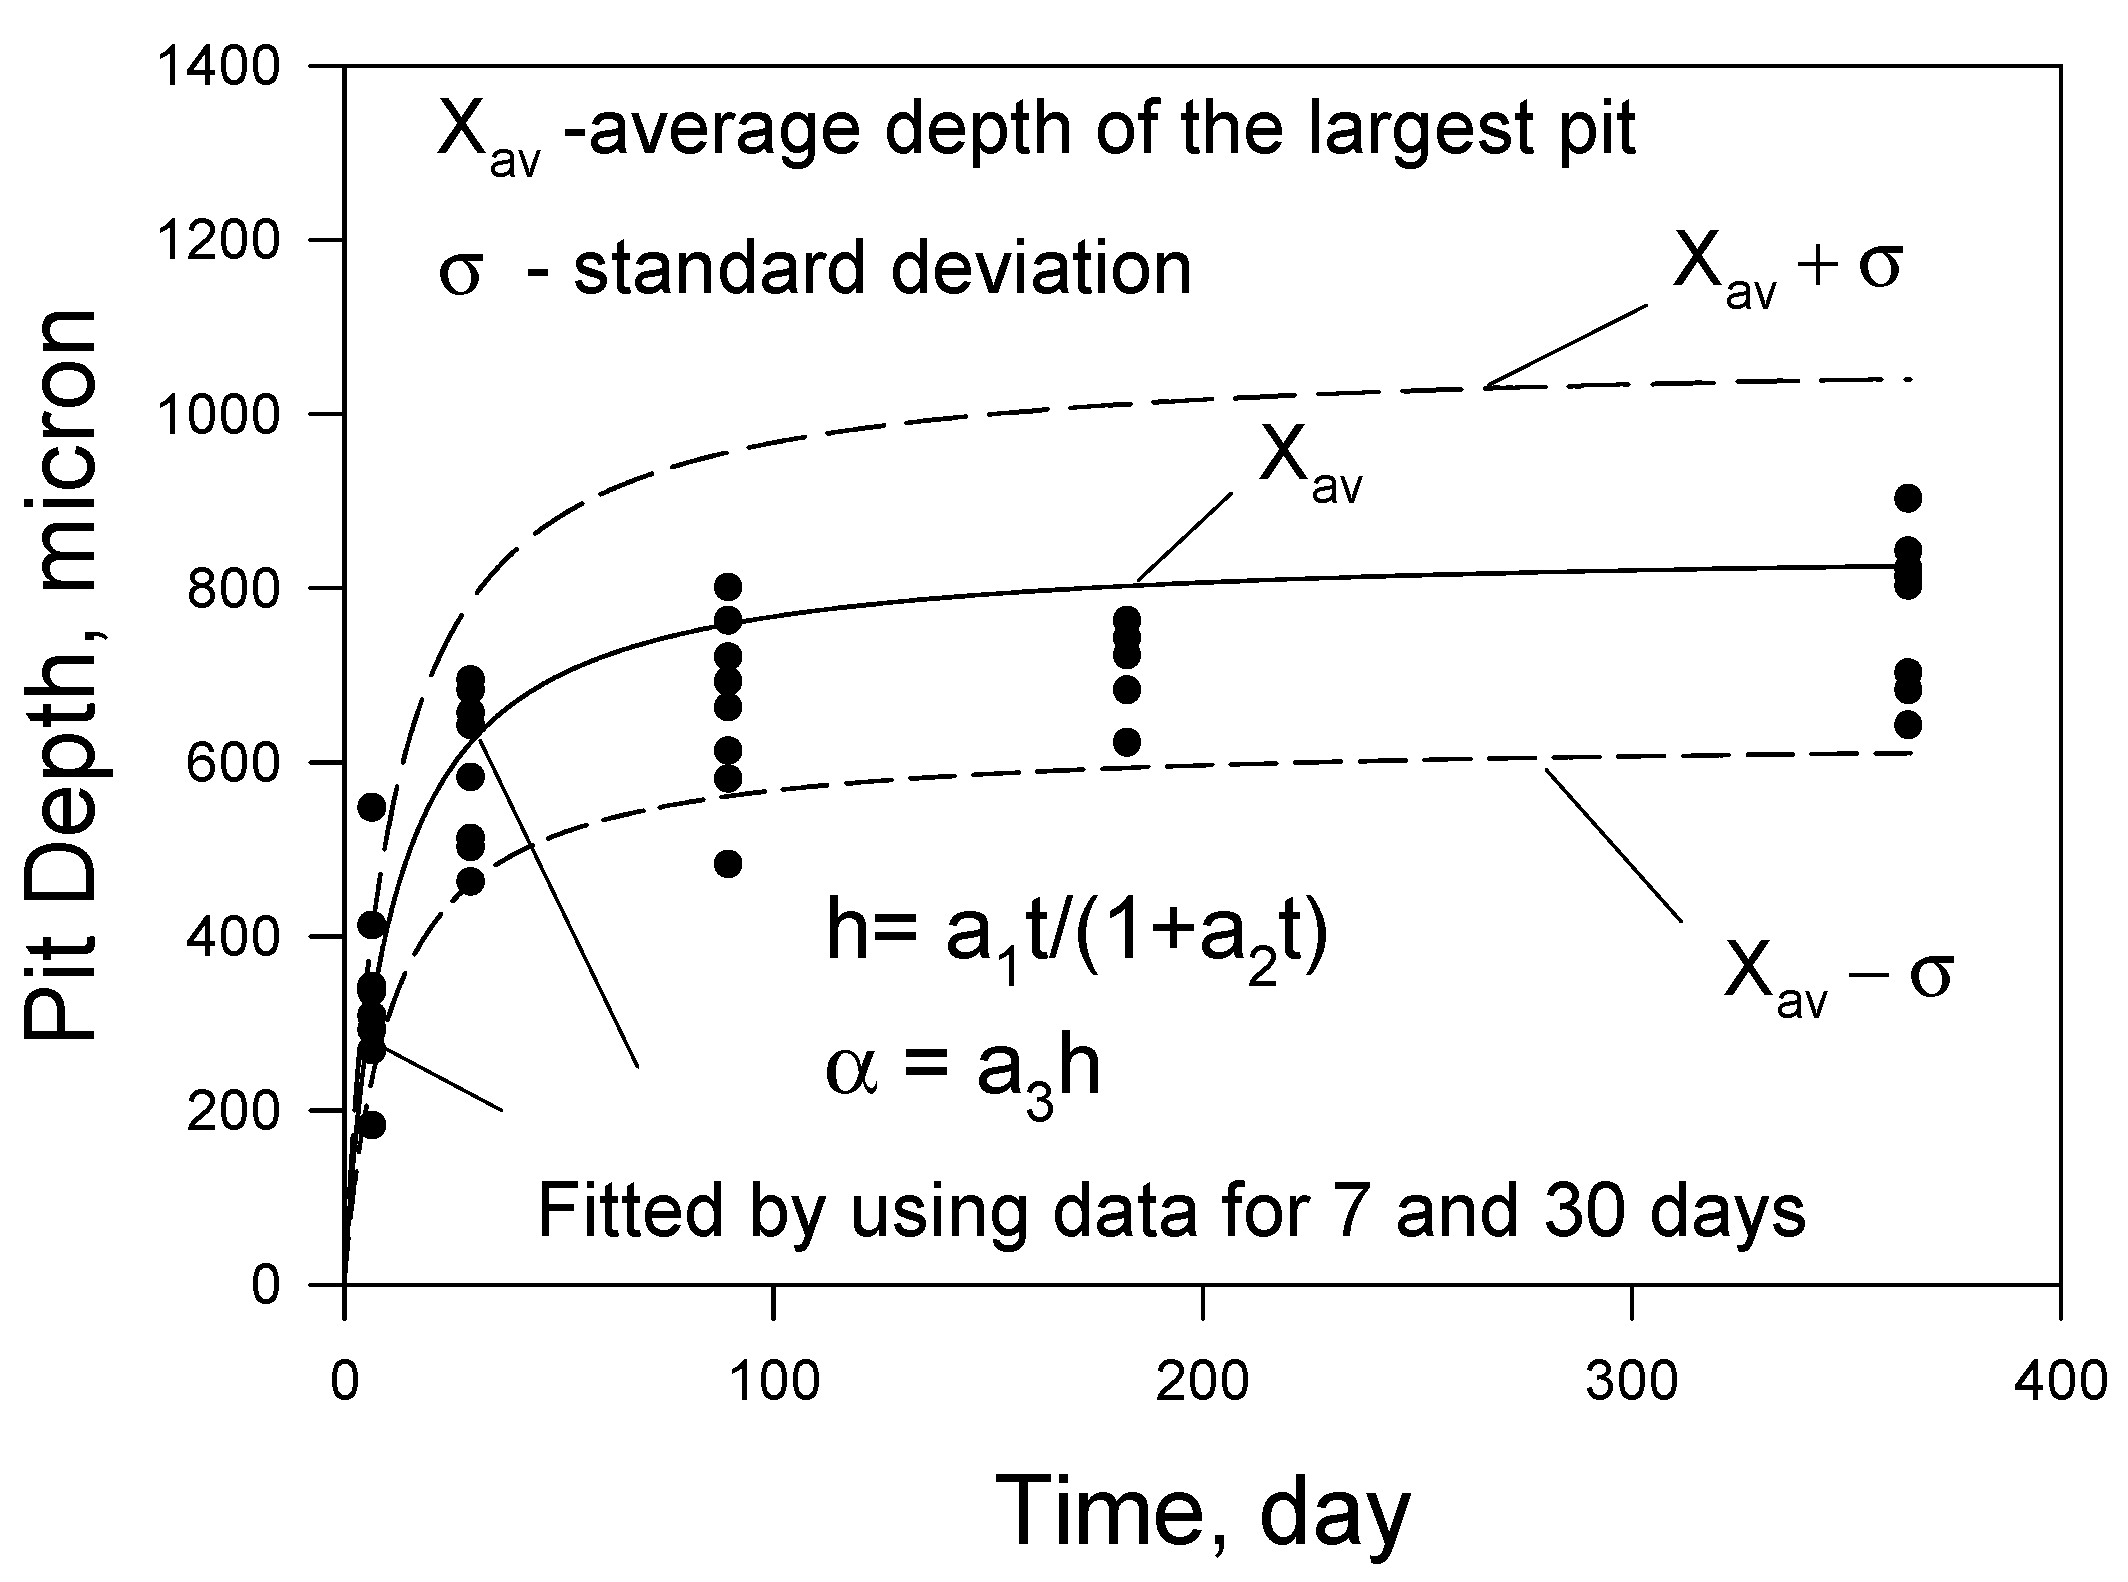
It is evident from Figure 18 that the crack initiation time is a highly distributed quantity, where the yellow-shaded area is meant to define the range over which the data are distributed. Insufficient data are available to describe the nature of the distribution precisely, so we must resort to theory in the form of a damage function analysis [37,38,62,63,64] for guidance in this matter. Cracks nucleate at stress risers in the form of corrosion pits in BWR primary coolant circuits and at emergent, open grain boundaries in the case of PWR primary coolant circuits. In both cases, the initiation site is a cavity of critical depth, Lcrit, such that KI > KISCC for the prevailing stress. Accordingly, crack nucleation in BWR and PWR primary coolant circuits can be described under a common theoretical framework that satisfies the Kondo criteria [65]. Deterministic extreme value statistics (DEVS), a DFA protocol component, predicts that the pit depth approaches a plateau asymptotically with time after extended exposure periods, as shown in Figure 19 [32,63]. While these data are specifically for an aluminum alloy, the same trend is displayed for stainless steels, nickel-based alloys, and other materials. The shape of this curve is due to pits repassivating (dying) as the population (ensemble) of pits evolves (cf, the evolution of an aging human population where the maximum age of individuals does not change significantly with time at the upper extreme, i.e., we all tend to die before reaching an age of 100, regardless of when we were born). The data are plotted as the mean (average) ± one standard deviation, corresponding to a 68% confidence level.
Figure 19.
The mean depth of the most bottomless pit in ALCAN aluminum alloy in Kingston tap water, as a function of time. Fitting to experimental data (black circles) was performed using the hyperbolic dependencies, Dots represent experimental data, lines model fitted/predicted [37,38].
Stress corrosion cracking and corrosion fatigue cracks often nucleate at corrosion pits, which act as stress risers such that . Thus, at the critical condition, , the critical crack length becomes:
where Y is the geometric factor that accounts for the pit shape and is the mean, local surface stress. On any actual surface, the initiation sites are subject to a wide distribution of local residual stress states due to machining operations, cold working, etc., such that there exists a distribution in , which we identify with . Because of the relationship between and , as expressed by Equation (5), a corresponding distribution in critical crack length exists, (Rcrit).
A possible theoretical approach to describe the distribution of crack initiation times due to variations in surface tensile stress is outlined below. Let us assume that the potential crack initiation sites (population, N) on the surface are distributed generally for the local surface stress, i.e.,
where is the mean stress for the population of the initiation sites and is the standard deviation in the normal distribution of the initiation sites regarding stress (residual + applied). The chain rule then gives the distribution in the initiation time as:
From Equation (5), we have:
The term dLcrit/dtinit is readily calculated from the pit growth rate function for a pit of depth, , as:
Substitution of Equations (5)–(7) into Equation (8) then yields the distribution in the crack initiation time as:
In this expression, the first factor introduces statistics into the problem via the assumed normal distribution (Equation (10)) (although other distributions may be employed), the second introduces mechanics, and the third [], which has yet to be specified analytically, introduces electrochemistry, all three of which must be contained within a successful theory for crack initiation. An examination of Equation (12) indicates that the rate of crack initiation should increase enormously with the surface (residual and applied) stress (a cubic relationship) and with the PGR, , and hence, must increase exponentially with the ECP. These theoretically based expectations are mainly in agreement with experience, although the lack of accurate experimental data renders a quantitative comparison impossible. Finally, we note that Equation (14) deals only with the surface stress distribution. Additional distribution arises from variations in the electrochemical parameters, specifically the distribution in passivity breakdown voltage, which reflects an underlying distribution of cation vacancy diffusivity at potential breakdown sites on the surface [57].
A careful analysis suggests that the initiation of a crack of finite length on the surface of a passive alloy may be broken down into the following stages: (1) Surface reconstruction in which pre-existing flaws (e.g., emergent grain boundaries in the case of MA Alloy 600) transform to allow access by the solution followed by the initial growth of a wedging oxide film). (2) Passivity breakdown as described by the PDM to form a metastable stress concentrating nano pit on the surface. (3) Stabilization of a small fraction of metastable nano pit nuclei via the establishment of differential aeration due to the existence of a low-resistance path though the “lacey” pit cover between the pit nucleus’s internal and external environments. (4) Evolution of the nano pit’s geometry from the iterative prediction of the anodic partial current density on the pit’s internal surface. Thus, in Figure 5, the hemispherical geometry ensures that the current density is constant at all points on the internal pit surface, i.e., the PGR is continuous, and the hemispherical geometry will continue to evolve. However, many different pit geometries are observed in practice, so an extensive range of the pit growth rate is expected in the population of nucleated nano pits. (5) As seen from Equation (7), the critical pit depth is a strong function of several parameters, all of which, in turn, are sensitive to the pit geometry. This is expected to introduce a distribution in critical conditions for the transition of a pit into a crack. Additional distribution arises from variations in electrochemical parameters, specifically the distribution in the passivity breakdown voltage, which reflects an underlying distribution of cation vacancy diffusivity at potential breakdown sites on the surface [58,59]. The theory for these distributions is well-developed, and it accounts for the observed distributions in the breakdown voltage and induction time quantitatively whenever tested.
Equivalently,
where
and are refers to the characteristic induction times defined in the original publications by Urquidi-Macdonald and Macdonald [58,59]. Thus, developing a general crack initiation model involves nested distributions interconnected by the parameters and expressions involved. Such complexity is rarely encountered in theoretical corrosion science, but we are convinced that it will yield a satisfactory solution.
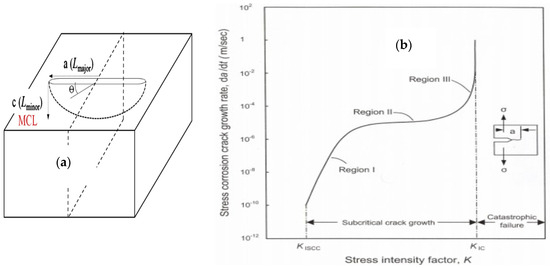
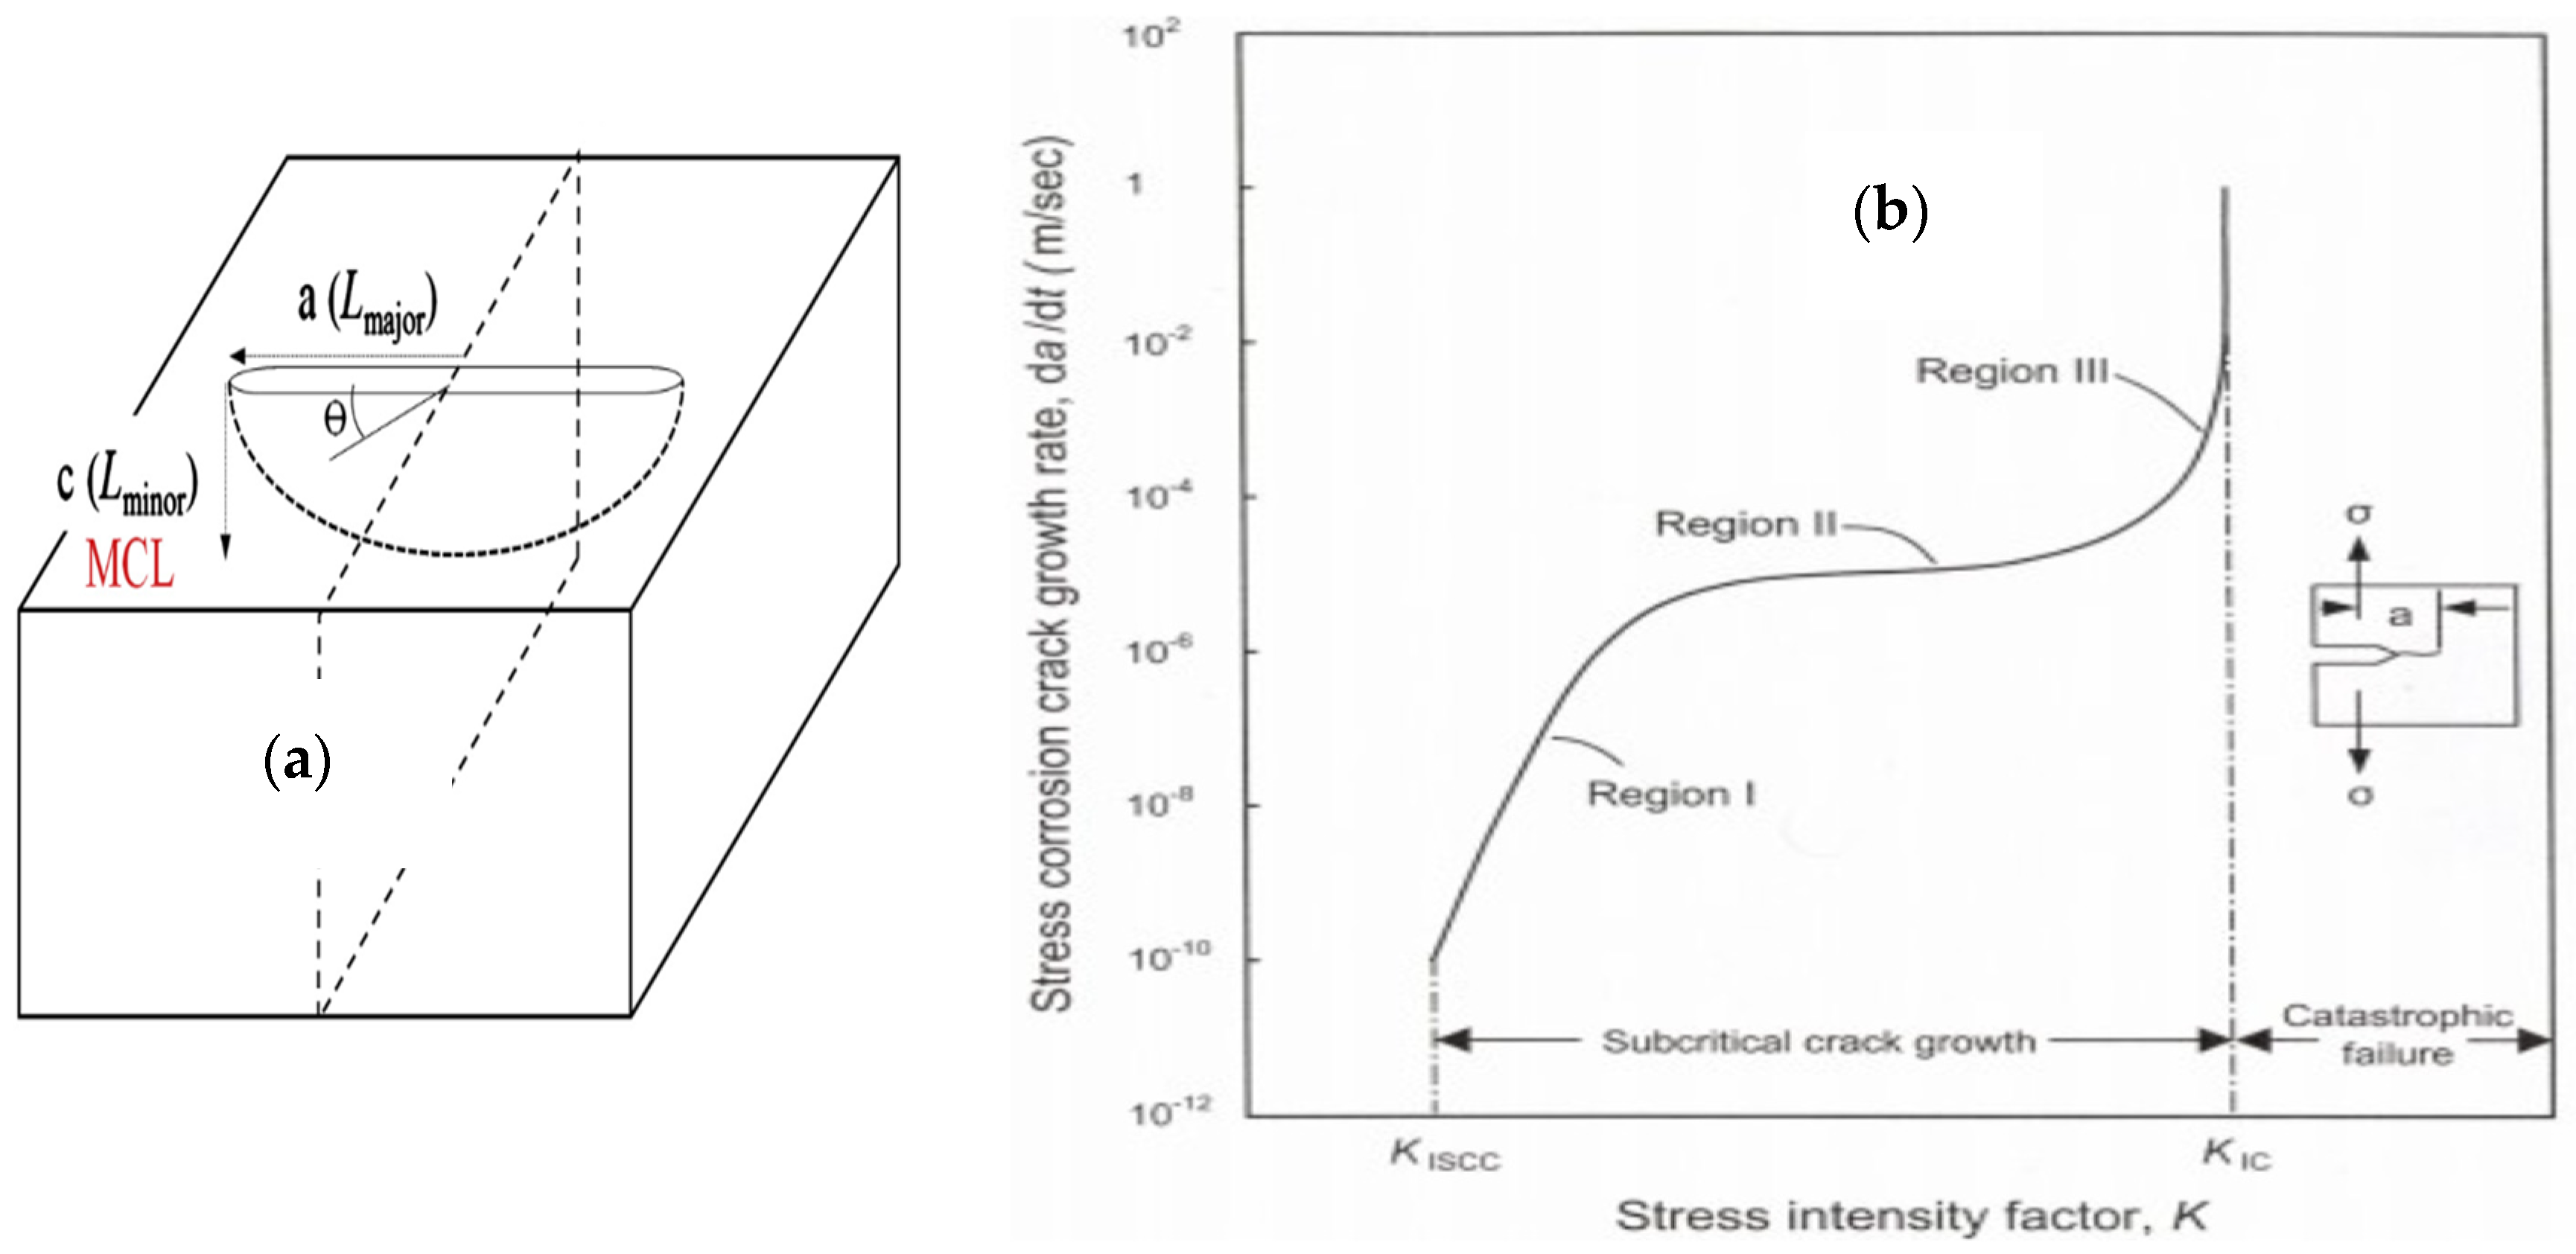
As noted above and as predicted by Lee et al. [44] and Balachov and colleagues [66], surface cracks grow semi-elliptically with the significant axis coinciding with the surface (Figure 20a). According to LEFM, the semi-elliptical shape evolves due to variation in the stress intensity function with an angle −π/4 < θ < π/4 from the origin, but Lee et al. [44] found this explanation to be untenable when considered in light of dLmech/dt vs. KI, where the mechanical CGR, dLmech/dt, is essentially independent of the stress intensity factor during the Stage II region (Figure 20b). A more realistic explanation is due to the difference between the mechanical and electrochemical crack lengths (Figure 20 [44]).
Figure 20.
(a) Schematic of a surface crack growing semi-elliptically in a plane surface. MCL corresponds to the mechanical crack length between the loading point and the crack front of a C(T) specimen, whereas the ECL refers to the shortest distance through the crack internal electrolyte and the crack front. (b) Idealized da/dt vs. stress intensity factor (KI), as measured with a C(T) specimen (insert) [44].
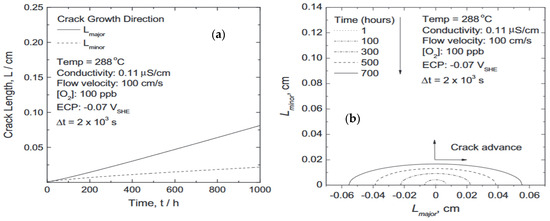
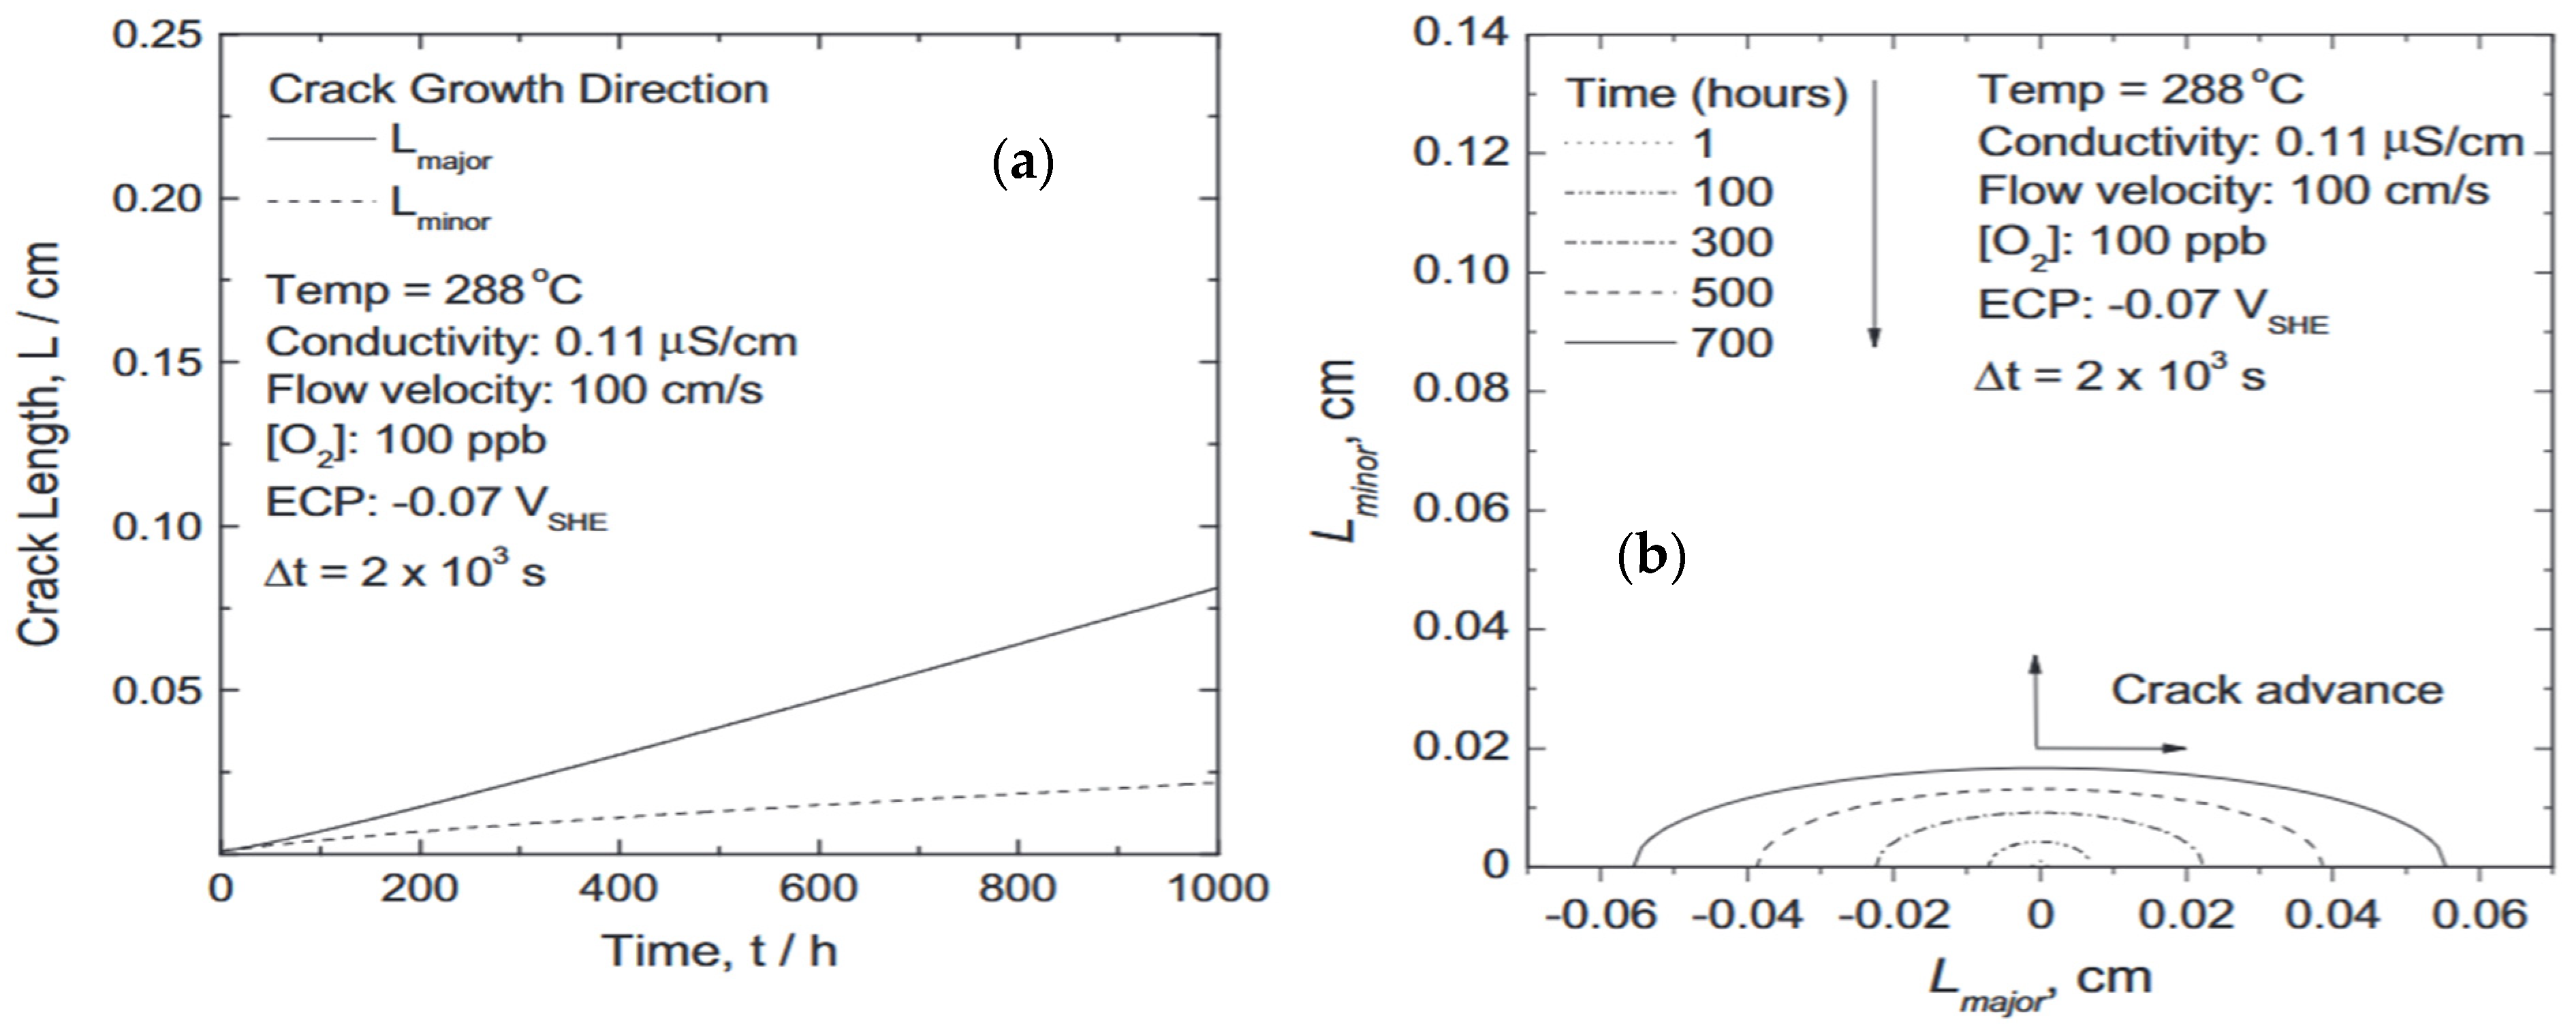
Finally, the effects imposed by the electrochemical crack length (ECL) being different from the mechanical crack length (MCL), and hence, the evolution of semi-elliptical surface cracks, must be incorporated into any GCIM if real situations are to be accurately described. Thus, Figure 21a illustrates how the major and minor axes of the semi-ellipse change with exposure time, noting that the ECL (Lmajor) is constant at the intersection of the crack with the external surface. At the same time, the MCL (Lminor) increases as the crack grows. Since, in this case, the ECL decreases with increasing exposure time, the CGR correspondingly decreases along the minor axis. A necessary corollary is that, to describe stress corrosion cracking accurately, two crack lengths are required: the mechanical crack length (MCL), defined as the distance between the crack front and the loading point, and the electrochemical crack length, which corresponds to the shortest distance between the crack front and the external surface. This adds yet another layer of complexity to the problem.
Figure 21.
(a) Growth of the major (Lmajor) and minor (Lminor) axes with time for the evolution of (b) semi-elliptical surface crack in sensitized Type 304 SS in simulated BWR primary coolant [44].
In closing, the authors propose that a general theory of crack initiation (GTCI) be based on a DFA as described by the pits being represented by the diffusion-less transport of particles into the substrate metal occurring in various stages for individual pits, but collectively in a birth, live, die scenario for the ensemble of pits [62,63,64,65]. In this way, the CIT corresponds to the age of the cavity when specific clearly defined criteria, such as Kondo’s criteria, are met.
5. Summary and Conclusions
Models were developed for calculating the crack initiation times for Alloy 600 and Type 304 stainless steel (SS) in PWR and BWR primary coolant circuits, respectively. Our findings are summarized as follows:
- In PWRs, initiation is accepted as being defined by Scott and Le Calvar’s grain boundary oxidation concept. In contrast, in BWRs, cracks are envisioned to nucleate from corrosion pits, which is attributed to the difference in the ECP. Accordingly, cracks must nucleate in the PWR primary coolant at pre-existing flaws, such as emergent grain boundaries and pre-existing cracks wedged open by oxide growth on the internal walls of the slit-like cavity, as proposed by Scott et al.
- In BWR primary coolant, and in the absence of hydrogen water chemistry (HWC) and the presence of oxidizing conditions due to the radiolytic production of H2O2, the ECP is greater than the critical pitting potential; the nucleation and growth of pits due to passivity breakdown and the establishment of differential aeration between the pit nucleus’s internal and external environments ensures growth of pits to the critical size necessary to nucleate cracks according to the Kondo criteria.
- Totsuka and Smialowska found, however, that MA Alloy 600 suffers from hydrogen-induced cracking (HIC) at an ECP < −0.85 Vshe, demonstrating that, in service with high hydrogen concentrations, brittle fractures will occur. The initiation sites were not identified.
- Finally, from the work of Lin et al., no induction time is apparent for starting and stopping the crack upon cycling the potential (Figure 7b). This means that the concentration profiles of ionic species (particularly H+ and Cl−) respond very quickly to changes in the ECP. A “back-of-the-envelope” estimate of the crack relaxation time can be gleaned from the expression t = D/x2, where x is the length over which diffusion responds. D is the diffusivity of the dominant ion. By selecting x = 10−6 cm and D = 5 × 10⁻⁵ cm2/s, we estimate the diffusivity relaxation time as 0.25 μs, which is not discernable on the time scale employed here.
- The crack initiation models for Alloy 600 in PWRs and Type 304 SS in BWRs reproduce the effects of the following independent variables: applied stress, temperature, cold work, grain boundary segregations, water chemistry, pH, and electrochemical potential.
- The origins of the observed scatter in experimentally measured crack initiation times are discussed, and the challenges of developing a more general crack initiation model (GCIM) are identified.
- From a mathematical viewpoint, the most significant challenge arises from the nested distributions involving the many parameters and expressions within the GCIM.
- The distributions occur from the imprecise definition of model parameters or because some experimentally determined input parameters are inherently scattered.
- A damage function analysis (DFA) should be expanded to incorporate multi-layered outer layers (“supra layers”) resulting from changes in the conditions that exist in the external environment of the anticipated lifetime of the component.
- To accurately describe stress corrosion cracking, two crack lengths are used: the mechanical crack length (MCL), which is defined as the distance between the crack front and the loading point, and the electrochemical crack length that corresponds to the shortest distance between the crack front and the external surface.
- Additionally, the evolution of semi-elliptical surface cracks resulting from the electrochemical crack length (ECL) being shorter than the classical mechanical crack length (MCL) must be incorporated if the GCIM is to find utility in the water-cooled nuclear power industry.
- Of significant interest in Figure 7a is that many of the cavities in sensitized Type 304 SS in BWR primary coolant take the form of separated grain boundaries, not unlike those in Alloy 600 in PWR primary coolant. We attribute this to the weakening of emergent grain boundaries under excessive strain, such that Scott and Combrade’s model may also be adequate for estimating the CIT under high-strain conditions.
- A note of caution: Does the spherical assumption overestimate or underestimate the risk of crack initiation? It underestimates the risk and overestimates the allowable life/safety margin.
Direction of Future Work on the Subject
- Better pit and crack morphology representation.
- Stronger coupling of electrochemistry, radiolysis, and mechanics.
- Microstructure-aware and alloy-specific models:
- Grain boundary and inclusions.
- Alloy-by-alloy calibration.
- Deterministic–probabilistic and data mining of well-carrying experiments in the laboratory integration.
- High-fidelity implementation in plant-scale codes.
Funding
This work is supported by USDOE under Award DE-NE0008541.
Data Availability Statement
All data used in this analysis are reported in the References cited, especially in ref. [51].
Acknowledgments
Mirna Urquidi-Macdonald’s invaluable assistance in revising and proofreading the article is gratefully acknowledged.
Conflicts of Interest
The authors declare no conflicts of interest in preparing this paper.
References
- Macdonald, D.D. (University of California at Berkeley, Berkeley, CA, USA); Engelhardt, G.R. (OLI Systems Incorporated, Morris Plains, NJ, USA). Private Communication, 1995. [CrossRef] [Scilit]
- Cragnolino, G.; Lin, L.F.; Macdonald, D.D.; Szklarska-Smialowska, Z. Stress Corrosion Cracking of Sensitized Type 304 Stainless Steel in High-Temperature Chloride Solutions. Corrosion 1981, 37, 616–627. [Google Scholar]
- Scott, P.M.; Le Calvar, M. Some possible mechanisms of intergranular stress corrosion cracking of alloy 600 in PWR primary water. In Proceedings of the 6th International Symposium on Environmental Degradation of Materials in Nuclear Power Systems Water Reactors, San Diego, CA, USA, 1–5 August 1993; The Minerals, Metals and Materials Society: Warrendale, PA, USA, 1993; p. 657. [Google Scholar]
- Orynyak, V.; Kozlov, A.; Bogdan, A.; Krasowskii, A.; Gopkalo, O. Investigation of the mechanisms of cracks initiation and growth in the SG 1000. In Proceedings of the Transactions, SMiRT-23, Manchester, UK, 10–14 August 2015; Division II, p. 704. [Google Scholar]
- Scott, P.M.; Combrade, P. On the Mechanism of Stress Corrosion Crack Initiation and Growth in Alloy 600 Exposed to PWR Primary Water. In Proceedings of the 11th International Conference on Environmental Degradation of Materials in Nuclear Power Systems—Water Reactors, Stevenson, WA, USA, 1–14 August 2003; pp. 29–38. [Google Scholar]
- Toloczko, M.B.; Olszta, M.J.; Zhai, Z.; Bruemmer, S.M. Stress corrosion crack initiation measurements of Alloy 600 in PWR primary water. In Proceedings of the 17th International Conference on Environmental Degradation of Materials in Nuclear Power Systems—Water Reactors, Ottawa, ON, Canada, 9–12 August 2015. [Google Scholar]
- Zhai, Z.; Toloczko, M.B.; Olszta, M.J.; Bruemmer, S.M. Stress corrosion crack initiation of alloy 600 in PWR primary water. Corros. Sci. 2017, 123, 76–87. [Google Scholar] [CrossRef] [Scilit]
- Katona, R.M.; Karasz, E.K.; Schaller, R.F. A Review of the Governing Factors in Pit-to-Crack Transitions of Metallic Structures. Corrosion 2023, 79, 72–96. [Google Scholar] [CrossRef] [Scilit]
- Turnbull, A.; Wright, L.; Crocker, L. New insight into the pit-to-crack transition from finite element analysis of the stress and strain distribution around a corrosion pit. Corros. Sci. 2010, 52, 1492–1498. [Google Scholar] [CrossRef] [Scilit]
- Turnbull, A.; Zhou, S. Pit to crack transition in stress corrosion cracking of a steam turbine disc steel. Corros. Sci. 2004, 46, 1239–1264. [Google Scholar] [CrossRef] [Scilit]
- Nicolas, A.; Co, N.E.C.; Burns, J.T.; Sangid, M.D. Predicting fatigue crack initiation from coupled microstructure and corrosion morphology effects. Eng. Fract. Mech. 2019, 220, 106661. [Google Scholar] [CrossRef] [Scilit]
- Wanga, X.; Schiavone, P. Elastic field for a blunt crack in a decagonal quasicrystalline material. Eng. Fract. Mech. 2019, 220, 106657. [Google Scholar] [CrossRef] [Scilit]
- Kuang, Z.B. The stress field near the blunt crack tip and the fracture criterion. Eng. Fract. Mech. 1982, 16, 19–33. [Google Scholar] [CrossRef] [Scilit]
- Creager, M.; Paris, P.C. Elastic field equations for blunt cracks with reference to stress corrosion cracking. Int. J. Fract. Mech. 1967, 3, 247–252. [Google Scholar] [CrossRef] [Scilit]
- Li, X.-F.; Fan, T.-Y.; Sun, Y.-F. A decagonal quasicrystal with a Griffith crack. Philos. Mag. A 1999, 79, 1943–1952. [Google Scholar]
- Lazzarin, P.; Tovo, R. A unified approach to the evaluation of linear elastic stress fields in the neighborhood of cracks and notches. Int. J. Fract. 1996, 78, 3–19. [Google Scholar] [CrossRef] [Scilit]
- Chao, C.Y.; Lin, L.F.; Macdonald, D.D. A Point Defect Model for Anodic Passive Films-(I) Film Growth Kinetics. J. Electrochem. Soc. 1981, 128, 1187–1194. [Google Scholar] [CrossRef] [Scilit]
- Lin, L.F.; Chao, C.Y.; Macdonald, D.D. A Point Defect Model for Anodic Passive Films-(II) Chemical Breakdown and Pit Initiation. J. Electrochem. Soc. 1981, 128, 1194–1198. [Google Scholar] [CrossRef] [Scilit]
- Chao, C.-Y.; Lin, L.F.; Macdonald, D.D. A Point Defect Model for Anodic Passive Films-(III) Impedance Response. J. Electrochem. Soc. 1982, 129, 1874–1879. [Google Scholar] [CrossRef] [Scilit]
- Macdonald, D.D. The Point Defect Model for the Passive State. J. Electrochem. Soc. 1992, 139, 3434–3449. [Google Scholar] [CrossRef] [Scilit]
- Ellerbrock, D.J.; Macdonald, D.D. Passivity Breakdown on Solid vs. Liquid Gallium. J. Electrochem. Soc. 1994, 141, 2645–2649. [Google Scholar] [CrossRef] [Scilit]
- Macdonald, D.; Zhang, L. On the Transport of Point Defects in Passive Films. Electrochim. Acta 1997, 43, 679–691. [Google Scholar]
- Haruna, T.; Macdonald, D.D. Breakdown of Passive Films on Metals: Explanation Based on the Point Defect Model. Corros. Eng. 1998, 47, 93–106. [Google Scholar] [CrossRef] [Scilit]
- Macdonald, D.D.; Engelhardt, G.R. The Point Defect Model for Bi-Layer Passive Films. ECS Trans. 2010, 28, 123–144. [Google Scholar] [CrossRef] [Scilit]
- Macdonald, D.D. The History of the Point Defect Model for the Passive State: A Brief Review of Film Growth Aspects. Electrochim. Acta 2011, 56, 1761–1772. [Google Scholar] [CrossRef] [Scilit]
- Lu, P.; Engelhardt, G.R.; Kursten, B.; Macdonald, D.D. The kinetics of nucleation of metastable pits on metal surfaces: The Point Defect Model and its optimization on data obtained on stainless steel, carbon steel, iron, aluminum and Alloy-22. J. Electrochem. Soc. 2016, 163, C156–C163. [Google Scholar] [CrossRef] [Scilit]
- Ghanbari, E.; Saatchi, A.; Lei, X.; Macdonald, D.D. Studies on Pitting Corrosion of Al–Cu–Li Alloys Part III: Passivation Kinetics of AA2098–T851 Based on the Point Defect Model. Materials 2019, 12, 1912. [Google Scholar] [CrossRef] [Scilit]
- Ghanbari, E.; Saatchi, A.; Lei, X.; Macdonald, D.D. Studies on Pitting Corrosion of Al-Cu-Li Alloys Part II: Breakdown Potential and Pit Initiation. Materials 2019, 12, 1786. [Google Scholar] [CrossRef] [Scilit]
- Xu, A.; Dong, C.; Wei, X.; Li, X.; Macdonald, D.D. The aggressive behavior study of Cl− on the defect structure of passive films on copper. RSC Adv. 2019, 9, 15772–15779. [Google Scholar] [CrossRef] [Scilit]
- Lei, X.; Saatchi, A.; Ghanbari, E.; Dang, R.; Li, W.; Wang, N.; Macdonald, D.D. Studies on Pitting Corrosion of Al-Cu-Li Alloys Part I: Effect of Li Addition by Microstructural, Electrochemical, In-situ, and Pit Depth Analysis. Materials 2019, 12, 1600. [Google Scholar] [CrossRef] [Scilit]
- Zhou, S.; Yan, Q.; Tang, C.; Mao, F.; Pu, J.; Macdonald, D.D. Effect of the chloride on passivity breakdown of Al-Zn-Mg alloy. Corros. Sci. 2020, 163, 108254. [Google Scholar] [CrossRef] [Scilit]
- Engelhardt, G.R.; Macdonald, D.D. Monte-Carlo Simulation of Pitting Corrosion with a Deterministic Model for Repassivation. J. Electrochem. Soc. 2020, 167, 013540. [Google Scholar] [CrossRef] [Scilit]
- Macdonald, D.D. On the Existence of our Metals-Based Civilization: I. Phase Space Analysis. J. Electrochem. Soc. 2006, 153, B213. [Google Scholar] [CrossRef] [Scilit]
- Macdonald, D.D.; Lei, X. Theoretical Interpretation of Anion Size Effects in Passivity Breakdown. J. Electrochem. Soc. 2016, 163, C738–C744. [Google Scholar] [CrossRef] [Scilit]
- Ghanbari, E.; Saatchi, A.; Macdonald, D.D. The Role of Al Interstitials on the Passivation of AA2098-T851 Based on the Mixed Potential Model. In Proceedings of the CORROSION 2018, Phoenix, AZ, USA, 15–19 April 2018; NACE International: Houston, TX, USA, 2018; p. 11026. [Google Scholar]
- Ghanbari, E.; Kovalov, D.; Saatchi, A.; Kursten, B.; Macdonald, D.D. The Influence of Halide Ions on the Passivity Breakdown of Carbon Steel Based on the Point Defect Model. In Proceedings of the CORROSION 2018, Phoenix, AZ, USA, 15–19 April 2018; NACE International: Houston, TX, USA, 2018; p. 11025. [Google Scholar]
- Lu, P.C.; Macdonald, D.D.; Urquidi-Macdonald, M.; Yeh, T.K. Theoretical Estimation of Crack Growth Rates in Type 304 Stainless Steel in BWR Coolant Environments. Corrosion 1996, 52, 768–785. [Google Scholar]
- Macdonald, D.D. The Role of Determinism in the Prediction of Corrosion Damage. Corros. Mater. Degrad. 2023, 4, 212–273. [Google Scholar] [CrossRef] [Scilit]
- Macdonald, D.D.; Engelhardt, G.R. Predictive Modeling of Corrosion. In Shrier’s Corrosion; Richardson, J.A., Ed.; Elsevier: Amsterdam, The Netherlands, 2010; Volume 2, pp. 1630–1679. [Google Scholar]
- Macdonald, D.D.; Urquidi-Macdonald, M. An Advanced Coupled Environment Fracture Model for Predicting Crack Growth Rates. Chapter 4-Control, Mitigation, and Prediction of Stress Corrosion Cracking. In Proceedings of the Parkins Symposium on Fundamental Aspects of Stress Corrosion Cracking, Cincinnati, OH, USA, 20–24 October 1991; TMS: Warrendale, PA, USA, 1991; pp. 443–455. [Google Scholar]
- Macdonald, D.D.; Urquidi-Macdonald, M. A coupled environment model for stress corrosion cracking in sensitized Type 304 stainless steel in LWR environments. Corros. Sci. 1991, 32, 51–81. [Google Scholar] [CrossRef] [Scilit]
- Shi, J.; Wang, J.; Macdonald, D.D. Prediction of crack growth rate in Type 304 stainless steel using artificial neural networks and the coupled environment fracture model. Corros. Sci. 2014, 89, 69–80. [Google Scholar] [CrossRef] [Scilit]
- Totsuka, N.; Szklarska-Smialowska, Z. Effect of Electrode Potential on the Hydrogen-Induced IGSCC of Alloy 600 in an Aqueous Solution at 350 C. Corrosion 1988, 44, 124. [Google Scholar] [CrossRef] [Scilit]
- Lee, S.K.; Kramer, D.; Macdonald, D.D. On the shape of stress corrosion cracks in sensitized Type 304 SS in Boiling Water Reactor primary coolant piping at 288 °C. J. Nucl. Mater. 2014, 454, 359–372. [Google Scholar] [CrossRef] [Scilit]
- Macdonald, D.D. The Electrochemical Nature of Stress Corrosion Cracking, Stress Corrosion Cracking of Nickel Based Alloys in Water-Cooled Nuclear Reactors; Woodhead Publishing: Cambridge, UK, 2016. [Google Scholar]
- Lee, S.-K.; Lv, P.; Macdonald, D.D. Customization of the CEFM for Predicting Stress Corrosion Cracking in Lightly Sensitized Al-Mg alloys in Marine Applications. J. Solid State Electrochem. 2013, 17, 2319–2332. [Google Scholar] [CrossRef] [Scilit]
- Kovalov, D.; Fekete, B.; Engelhardt, G.R.; Macdonald, D.D. Prediction of corrosion fatigue crack growth rate in alloys. Part I: General corrosion fatigue model for aero-space aluminum alloys. Corros. Sci. 2018, 141, 22–29. [Google Scholar] [CrossRef] [Scilit]
- Shi, J.; Fekete, B.; Wang, J.; Macdonald, D.D. Customization of the coupled environment fracture model for predicting stress corrosion cracking in Alloy 600 in PWR environment. Corros. Sci. 2018, 139, 58–67. [Google Scholar] [CrossRef] [Scilit]
- Fekete, B.; Ai, J.; Yang, J.; Han, J.S.; Maeng, W.Y.; Macdonald, D.D. An advanced coupled environment fracture model for hydrogen-induced cracking in Alloy 600 in PWR primary heat transport environment. Theor. Appl. Fract. Mech. 2018, 95, 233–241. [Google Scholar] [CrossRef] [Scilit]
- Lee, S.K.; Macdonald, D.D. Theoretical aspects of stress corrosion cracking of Alloy 22. J. Nucl. Mater. 2018, 503, 124–139. [Google Scholar] [CrossRef] [Scilit]
- Macdonald, D.D.; Yang, J.; Fekete, B.; Balachov, I.; Spencer, B.W. Development and Integration of Light Water Reactor (LWR) Materials Corrosion Degradation Codes into Grizzly; DOE/NEUP Report, Award DE-NE0008541; U.S. Department of Energy (DOE): Washington, DC, USA, 2019.
- Pilling, N.B.; Bedworth, R.E. The Oxidation of Metals at High Temperatures. J. Inst. Met. 1923, 29, 529–591. [Google Scholar]
- Wilkinson, D.S. Models for Creep Crack Growth. In Deformation of Ceramics Materials II; Tressler, R.E., Bradt, R.C., Eds.; Plenum Press: New York, NY, USA, 1984; p. 507. [Google Scholar]
- Wilkinson, D.S.; Vitek, V. The propagation of cracks by cavitation: A general theory. Acta Metall. 1982, 30, 1723. [Google Scholar] [CrossRef] [Scilit]
- Cantor, B. The Equations of Materials; Oxford Academic: Oxford, UK, 2020. [Google Scholar]
- Yang, J.; Li, Y.; Xu, A.; Fekete, B.; Macdonald, D.D. The electrochemical properties of alloy 690 in simulated pressurized water reactor primary water: Effect of temperature. J. Nucl. Mater. 2019, 518, 305–315. [Google Scholar] [CrossRef] [Scilit]
- Macdonald, D.D.; Urquidi-Macdonald, M. Distribution Functions for the Breakdown of Passive Films. Electrochim. Acta 1987, 31, 1079–1086. [Google Scholar] [CrossRef] [Scilit]
- Macdonald, D.D.; Urquidi-Macdonald, M. Theoretical Distribution Functions for Breakdown of Passive Films. J. Electrochem. Soc. 1987, 134, 41–46. [Google Scholar] [CrossRef] [Scilit]
- Kondo, Y. Prediction of Fatigue Crack Initiation Life Based on Pit Growth. Corrosion 1989, 45, 7–11. [Google Scholar] [CrossRef] [Scilit]
- Shi, J.; Wang, J.; Macdonald, D.D. Prediction of primary water stress corrosion crack growth rates in Alloy 600 using artificial neural networks. Corros. Sci. 2015, 92, 217–227. [Google Scholar] [CrossRef] [Scilit]
- Macdonald, D.D. Viability of Hydrogen Water Chemistry for Protecting In-Vessel Components of Boiling Water Reactors. Corrosion 1992, 48, 194–205. [Google Scholar] [CrossRef] [Scilit]
- Macdonald, D.D.; Urquidi-Macdonald, M. The Electrochemistry of Nuclear Reactor Coolant Circuits. In Encyclopedia of Electrochemistry; Bard, A.J., Stratmann, M., Macdonald, D.D., Schmuki, P., Eds.; Vol 5 Electrochemical Engineering; Wiley-VCH Verlag GmbH & Co. KGaA: Weinheim, Germany, 2007; pp. 665–720. [Google Scholar]
- Engelhardt, G.R.; Woollam, R.C.; Macdonald, D.D. Deterministic Prediction of Localized Corrosion Damage in Oil and Gas Pipelines. ECS Trans. 2013, 50, 141–153. [Google Scholar] [CrossRef] [Scilit]
- Macdonald, D.; Urquidi-Macdonald, M. Corrosion Damage Function–Interface Between Corrosion Science and Engineering. Corrosion 1992, 48, 354–367. [Google Scholar] [CrossRef] [Scilit]
- Zhang, Y.-C.; Urquidi-Macdonald, M.; Engelhardt, G.R.; Macdonald, D.D. Development of Localized Corrosion Damage on Low Pressure Turbine Disks and Blades: III. Application of Damage Function Analysis to the Prediction of Damage. Electrochim. Acta 2011, 69, 19–29. [Google Scholar] [CrossRef] [Scilit]
- Balachov, I.; Fekete, B.; Macdonald, D.D.; Spencer, B. Lifetime estimation of a BWR core shroud in terms of IGSCC. Nucl. Eng. Des. 2020, 368, 110831. [Google Scholar] [CrossRef] [Scilit]
Disclaimer/Publisher’s Note: The statements, opinions and data contained in all publications are solely those of the individual author(s) and contributor(s) and not of MDPI and/or the editor(s). MDPI and/or the editor(s) disclaim responsibility for any injury to people or property resulting from any ideas, methods, instructions or products referred to in the content. |
© 2026 by the authors. Licensee MDPI, Basel, Switzerland. This article is an open access article distributed under the terms and conditions of the Creative Commons Attribution (CC BY) license.