


Abstract
Textile technologies are revolutionising with Industry 4.0. This research aims to introduce a novel real-time monitoring system in the knitting sector using the Internet of Things and machine learning technologies to measure and display productivity precisely through an interactive dashboard. Sensors were integrated into a circular knitting machine to track productivity and performance. A comparative statistical analysis through three processing phases demonstrates the high accuracy and precision of the current system, as evidenced by minimum variance and error values. The t-test results validate a non-significant difference between actual and device-measured production. Thus, it enables real-time monitoring, preventive maintenance, and cost-effective quality in knitting machines.
1. Introduction
In recent years, the way professionals approach problem-solving has undergone a few modest changes due to the Industry 4.0 revolution, which is currently taking place globally. The Internet of Things (IoT), Machine Learning (ML), Artificial Intelligence (AI), Smart Manufacturing, Cloud computing, and Cyber-Physical Systems (CPS), among other Industry 4.0 innovative components, have already started to focus their study on textiles and fashion [1]. Kevin Ashton claims that the Internet of Things (IoT) is a technological development that ushers in a new era of pervasive connectivity, processing, and communication [2]. The “Internet of Things” refers to networked sensors and actuators connected to computing systems [3]. Moreover, IoT builds a network by connecting various data-generating devices [4]. Machine-to-machine (M2M) connection and the Internet of Things (IoT) will close the gaps between the industrial and telecom sectors. A huge number of sensors, actuators, and various smart devices networked with one another via a ubiquitous, high-performance, and highly reliable communication network are the key building blocks of an effective and broad IoT [5].
IoT is revolutionising the textile sector by promoting sustainability, quality, and efficiency. It enables a data-centric approach that optimises several aspects of the textile production process. Rathore et al. [6] declared that IoT applications in textiles include inventory management, real-time process monitoring, quality control, and predictive maintenance for machines. These applications enable textile companies to make informed decisions, adapt to market dynamics, and enhance product quality. There are several IoT applications in the textile industry, such as fashion, E-textiles, spinning, weaving, knitting, and clothing production. Implementing IoT in spinning, weaving, knitting, and clothing mills may greatly improve process optimisation, and reduce failures. From fibre manufacturing to the final fabric, IoT is used in various industrial processes [7].
Examples of Internet of Things applications in the spinning industry include Rieter’s introduction of SPIDERweb modular, which allows any number of components to be connected. This system was used to monitor a spinning machine. Modules can be easily added at any time in the future. Additional sensors and Reiter-supplied proprietary equipment are needed to maximise the system’s capabilities. Therefore, the Rieter spinning mills will adopt Industry 4.0 [8]. Manglani et al. [9] reported that a case study for the spinning industry is being carried out to aid in assessing its IoT solutions and to determine how other textile industry sectors may profit from their application. The case study summarised IoT technologies from ITMA 2011 to 2019 in the spinning industry. IoT provides specialised solutions at each level of the textile production process. In spinning, IoT maximises energy usage, anticipates and avoids malfunctions, and guarantees that gear operates at peak efficiency [10].
For IoT applications in the weaving industry, IoT is being used in several ways. For example, Pacific Textiles uses real-time data analytics to achieve the ideal fabric colour, improve company procedures, and facilitate future expansion. Predictive data and analysis, which lower equipment downtime, boost equipment efficiency, and meet daily production targets, are made feasible by integrating sensors into textile manufacturing equipment. It also allows textile businesses to take back market share [11]. In addition, IoT automates loom functions and keeps an eye on cloth quality while weaving. IoT-enabled knitting machines increase accuracy and reduce errors [12]. Furthermore, the Industry 4.0 solution axisWEAVE4.0 provides online analytics and monitoring for various weaving machines, including rapier, waterjet, and air-jet looms. Providing computerised dashboards and reports to weaving machines significantly enhances quality, productivity, and profitability [13].
Some applications of IoT in the fashion industry include, for instance, Liu et al. [14], who studied the obstacles of digital technology deployment in the fashion business, discussing ways to improve supply chain models using lean and agile methodologies using virtual networks, standardised information, and big data technologies. As a result, online monitoring can give real-time data for optimal strategy execution. Liu and Yuan investigated the fashion business and the growth of virtual fashion [15]. Collaborations with video games, mobile applications, virtual icons, virtual showrooms, and virtual apparel labels were all investigated in this study. It explored the possible advantages of virtual fashion, such as waste reduction, catering to different fashion preferences, and adjusting to changing consumer behaviours in the digital era. Furthermore, the fashion sector leverages the Internet of Things (IoT) to create novel applications such as smart apparel and linked retail inventory management, offering consumers customised and inventive experiences [16]. Online monitoring in the textile business should improve sustainability, inclusiveness, and transparency, corresponding with virtual fashion’s environmental friendliness, diversity promotion, and waste reduction benefits.
IoT technology is progressively being integrated into knitted fabric producers’ manufacturing processes to increase efficiency in the knitting sector. Knitting machines integrated with Internet of Things sensors provide online monitoring of industrial facilities. Fabric manufacturing plants employ IoT technologies to do preventive machine maintenance. Shima Seiki’s fabric knitting and cutting technology may be combined with the company’s proprietary product lifecycle management software for more effective production management. In addition to controlling yarn inventory, BMS Vision’s Knit Master solution supports monitoring and managing knitting mill machines [17]. A web-based knitting machine monitoring tool called “Inteos Networker” is offered by Memminger-IRO. It can track productivity and performance using controller sensors for yarn feeding, needle breakage, and machine performance [18]. Elkateb et al. [19] introduced an innovative IoT and ML-based online monitoring system for knitting machines, enabling precise productivity measurement through an intuitive dashboard supported by statistical analysis. It enables real-time tracking, issue resolution, and preventive maintenance in knitting mills, enhancing overall efficiency. Elkateb et al. [20] introduced a pioneering approach to estimating production rates for double-knitting machines through an online monitoring system. Using IoT and ML, they developed a novel formula that incorporates data from stitch length and yarn feeder sensors, improving the accuracy of production calculations.
Finally, IoT applications provide improved supply chain visibility and predictive maintenance advantages. High deployment costs, data security issues, and the requirement for personnel retraining to run IoT devices successfully are all obstacles. This study has two primary objectives. Firstly, it aims to produce an Egyptian prototype of a real-time monitoring system for double knitting machines using IoT and ML principles. The second goal of the research is to evaluate the performance, effectiveness and functionality of a recently developed online monitoring tool. This study aims to analyse the precision and accuracy of the system, proving its practical functioning through statistical analysis of the system’s data. Finally, this research intends to determine the system’s broader implications and any further benefits it may provide, such as its impact on machine efficiency and product quality. Moreover, its ability to streamline manufacturing, reduce waste, and develop technology would be emphasised as further benefits for the knitting sector. Thus, this study discusses the gap of limited monitoring systems for such machines, presenting a solution to improve efficiency and production in the knitting business.
2. Experimental Work
2.1. Material
A 100% polyester filament yarn 70 denier is used to produce interlock fabric weight 70 (GSM).
The experiments were carried out in an Egyptian knitting factory.
2.2. Methods
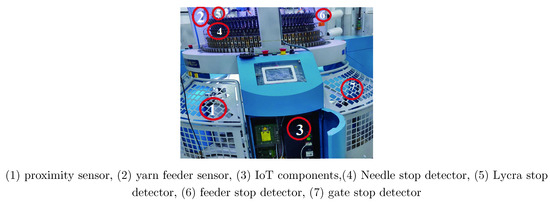
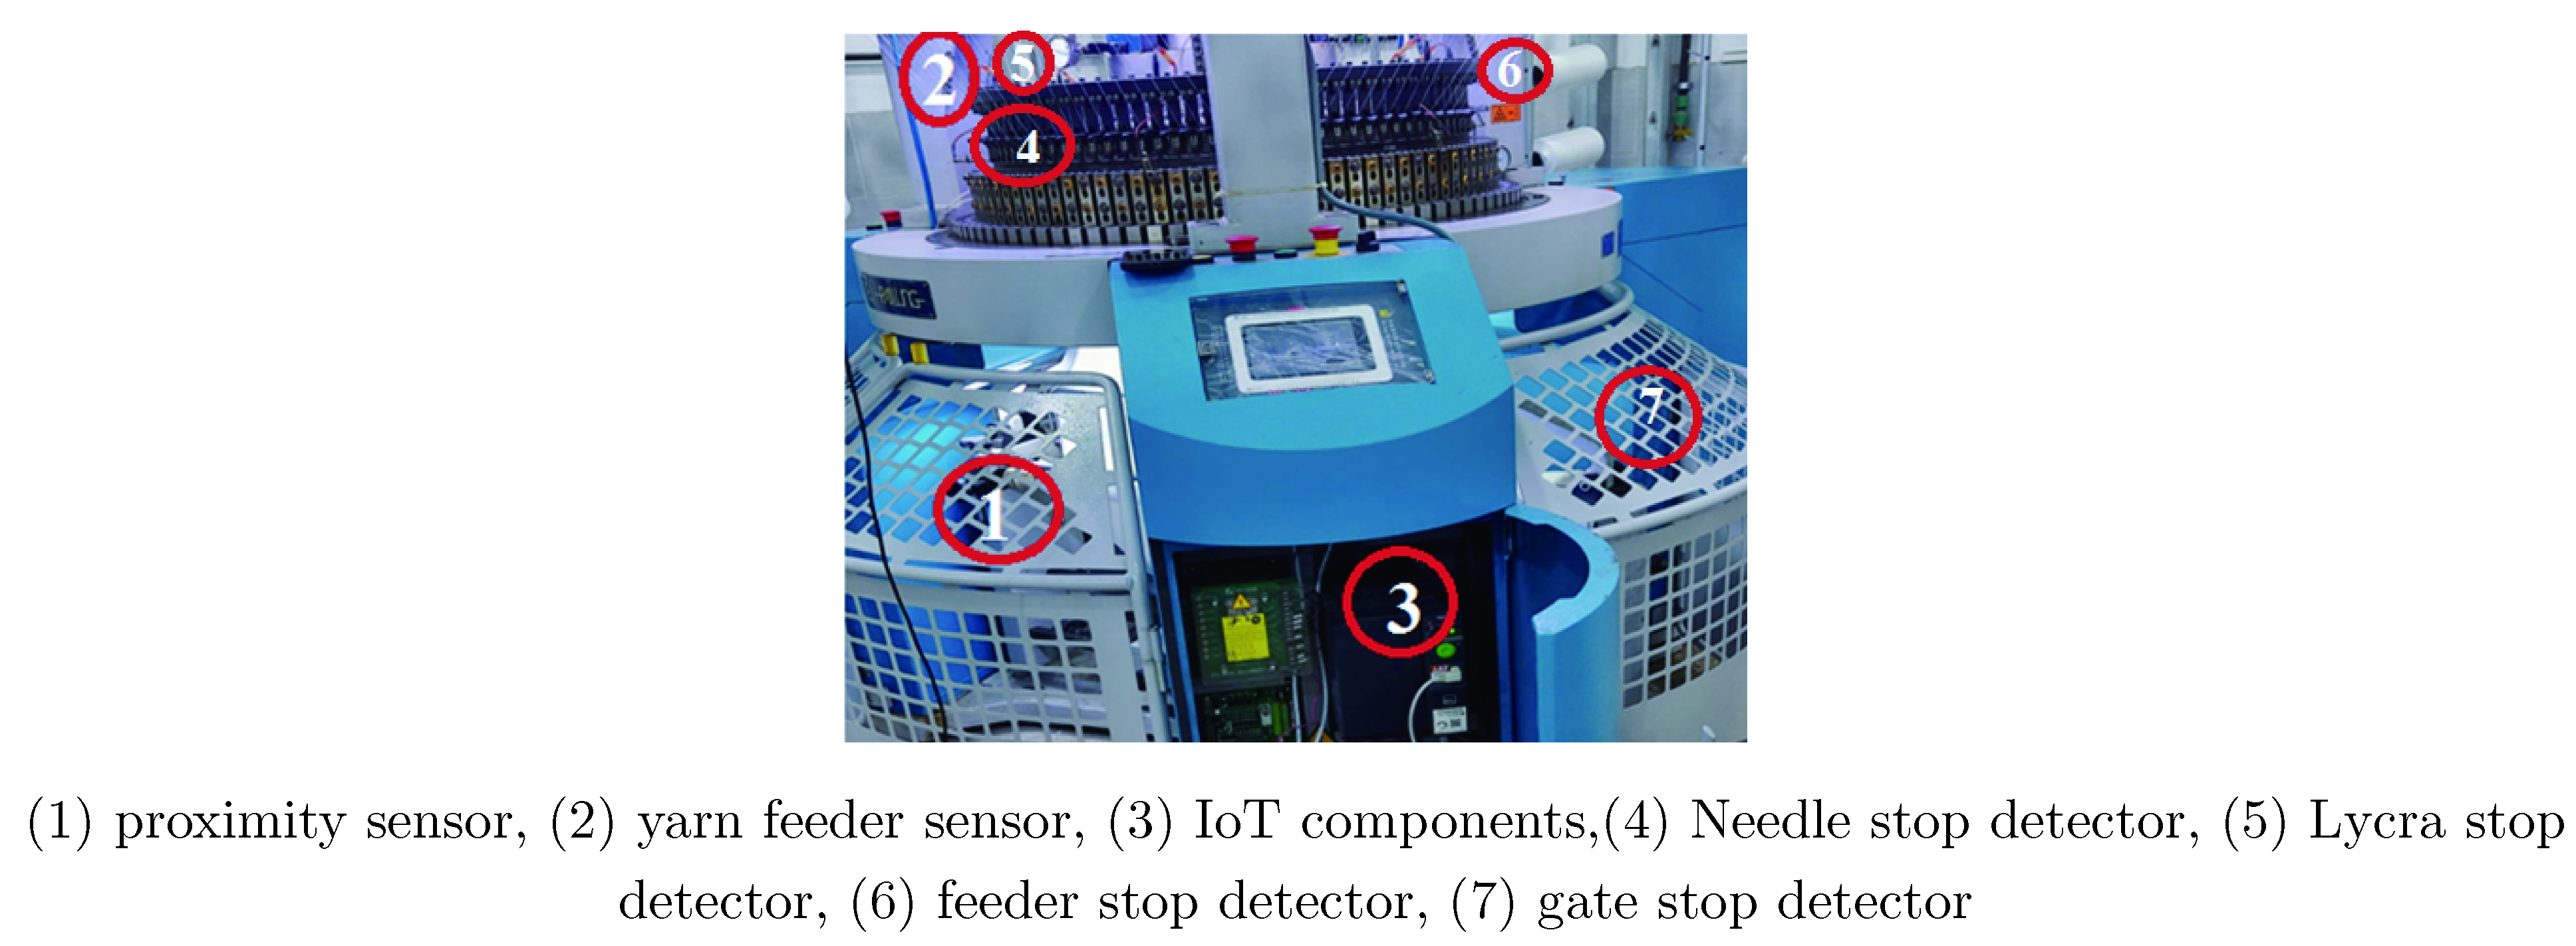
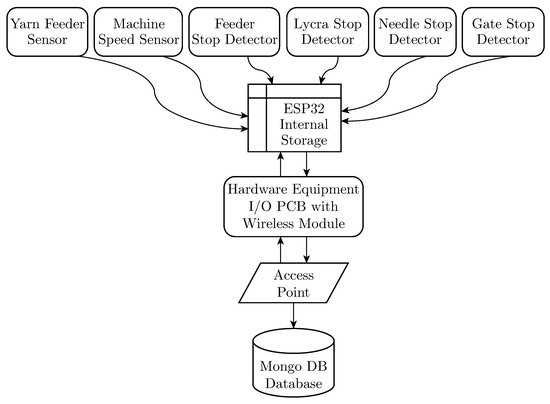
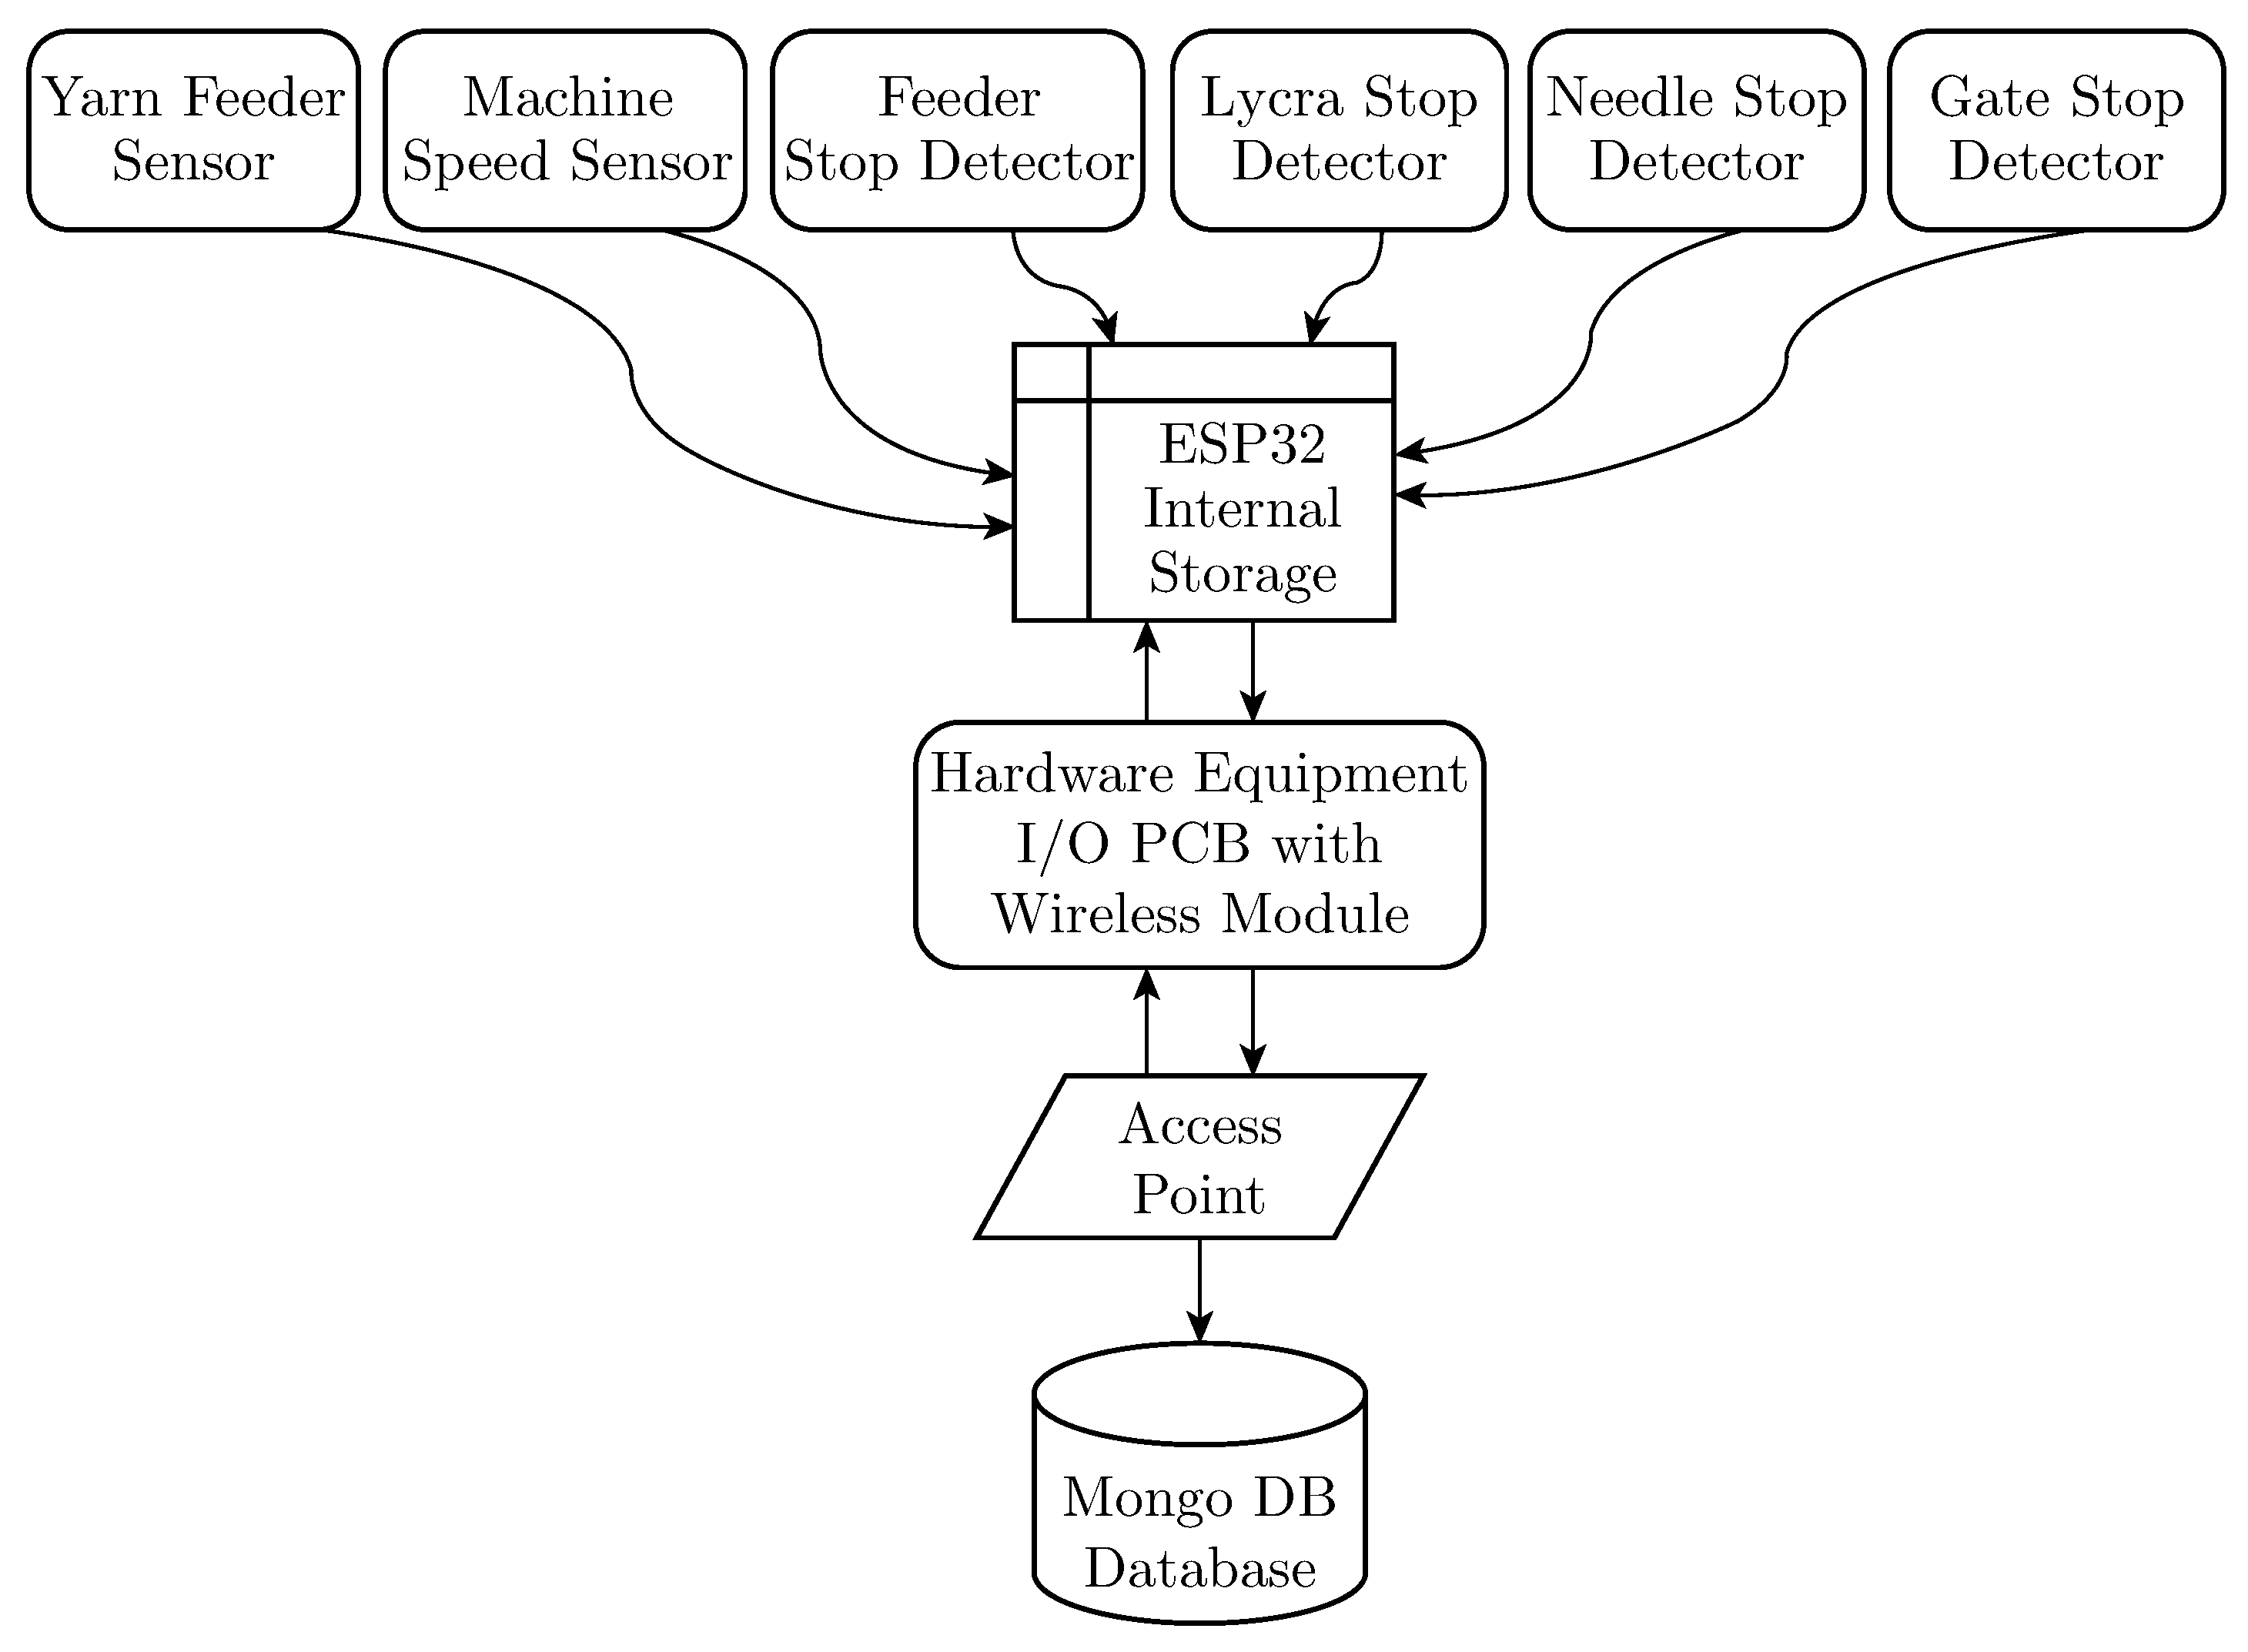
The experimental procedure uses the PAI LUNG “Knitel” double knitting machine, which has 96 feeders, a machine diameter of 30 inches at gauge 24, two dial tracks, and two cylinder tracks [19]. Figure 1 illustrates a prototype of a real-time monitoring device created on a circular knitting machine. In contrast, the monitoring system records revolution data using integrated sensors such as proximity sensor and yarn feeder sensor, as well as detectors of stops for yarn feeder, Lycra yarn, gate and needles. Figure 2 shows a flow diagram of the system setup of an IoT-based real-time system of circular knitting machines. The system uses a custom-built PCB (printed circuit board) with an ESP32 microcontroller and various sensors to detect machine stops. It is deployed on the knitting machines and collected data in MongoDB for analysis and machine learning-based monitoring. It provides real-time monitoring, enabling predictive maintenance and reducing unplanned downtime.
Figure 1.
A Prototype of the knitting machine’s real-time monitoring device.
Figure 2.
System configuration.
The MQTT broker component, ESP32, PCB, React-planet dashboard, Wi-Fi module, proximity sensor, yarn feeder sensor, stops’ detectors, as well as backend connectors from the MQTT broker to the dashboard, server and mobile application comprise the entire technological elements. MQTT (Message Queuing Telemetry Transport) is a device that allows devices to post and subscribe to information. As a result, it is ideal for machine-to-machine (M2M) communication since it is designed for low-bandwidth, high-latency conditions [21]. ESP32 is a popular microcontroller module designed by Systems. It is intended for various Internet of Things (IoT) applications. It includes Wi-Fi and Bluetooth connection, making it appropriate for wireless communication and data sharing in IoT projects [22]. A dashboard is a visual interface in an online monitoring system that displays real-time statistics, key performance indicators (KPIs), and pertinent information in a simple and accessible manner. It is critical in enabling educated data visualisation, real-time monitoring, decision-making, performance tracking, and detecting deviations [23].
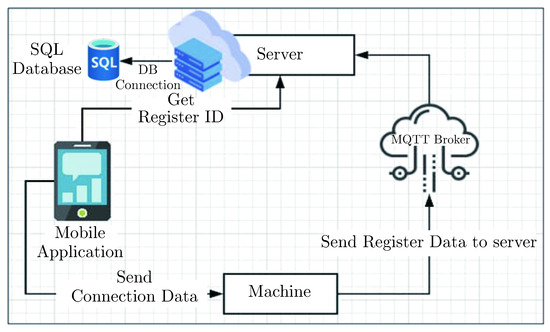
Figure 3 shows the architecture of the data transfer procedure, with the MQTT broker serving as the machine’s interface and the server as the mediator. It explains IoT components and how an MQTT broker and an ESP32 transfer production data from the machine to the server. Then, the server stores, processes, and displays the data in tables and graphs through a dashboard. The server provides information to this application to address difficulties and rectify problems, allowing managers to use the mobile application to operate the machine, track and monitor productivity, and fix problems. The proposed online monitoring system uses a proximity sensor and a yarn feeder sensor to count the number of rotations per minute. Using the ESP32 and MQTT, data is transmitted to the server and kept there for analysis. The range of real speeds of the knitting machine and the yarn feeder sensor are (19-21) rpm and (1250-1350) rpm, respectively. Besides, the machine is set to produce eight fabric rolls each day with a production rate of (6.9-7.4) kg per hour with a stitch length of approximately (2-2.2) mm and a target weight of (19-22) kg per roll. The device captures and populates the data using the MQTT system’s data collecting for the proposed online monitoring system. In this study, the designed prototype of a developed monitoring device is used to collect the machine speed and the yarn feeder sensor revolution. Then, the production rate is calculated, and stoppage rates are monitored using stop detector sensors for yarn feeder, Lycra yarn, gate, and needles. Thus, this system can enable the evaluation of machines’ productivity and performance, introducing a breakthrough in the knitting industry.
Figure 3.
IoT Framework: Data transmission via MQTT broker.
2.3. System Limitations and Challenges
2.3.1. Hardware Issues and Solutions
The initial hardware setup faced voltage errors, incorrect sensor readings, and instability. These issues were resolved through meticulous PCB board track resoldering and highlighted the need for regular maintenance. This alignment ensured accurate data acquisition.
2.3.2. Software Challenges and Solutions
- The ESP configuration loss upon system restart was a significant software challenge. Machineconfigurations were stored in EEPROM to ensure data persistence.
- Data rate optimisation was crucial to manage substantial data volume. So, transitioningfrom sending data every second to once per minute significantly reduced data rates.
- Challenges arose from server connectivity issues caused by power or internet disruptions.So, an independent power source is introduced for data storage to ensure continuous operation.
This comprehensive approach addressed hardware and software challenges, ensuring system stability, data integrity, and uninterrupted productivity tracking. It resolved hardware issues through maintenance, optimised software, and introduced a data collector for protection.
3. Statistical Analysis
The device’s performance was assessed by measuring its precision and accuracy using statistical indicators. The term “device precision” refers to the consistency and reproducibility of measurements. It assesses a device’s ability to replicate results under steady settings, often using the standard deviation. Precision is essential for accurate data gathering in various domains [24]. Device Accuracy refers to measurements aligning closely with true values, addressing systematic errors or biases [25].
3.1. Statistical Indicators
Several statistical indicators were used to assess the precision and accuracy [19, 26, 27]. These statistics are Average (), Standard deviation (δ), Coefficient of Variation (CV), Mean absolute error (MAE) and Mean absolute percentage error (MAPE), which are calculated by the following Eqs. (1)-(5).
Where: () is the true and actual production value “measured by operator”, and () is to the measured production value by the online device.
3.2. Testing of Significant Effect
T-test is applied to evaluate the significant difference due to using this proposed system according to the P-value. So, a non-significant t-test between true and device-measured values suggests high accuracy.
3.3. Testing Performance through Improvements
Run charts offer a clear visual representation of data over time, enabling users to observe trends and identify anomalies. They also serve as effective performance monitoring tools for tracking changes and assessing positive outcomes. The Runs chart is used to assess the performance improvements through three phases regarding mean and control limits.
4. Results and Discussion
4.1. System Outcomes
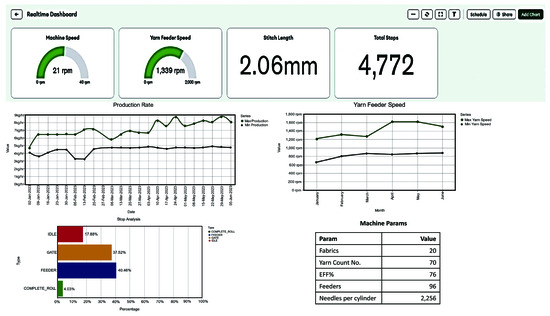
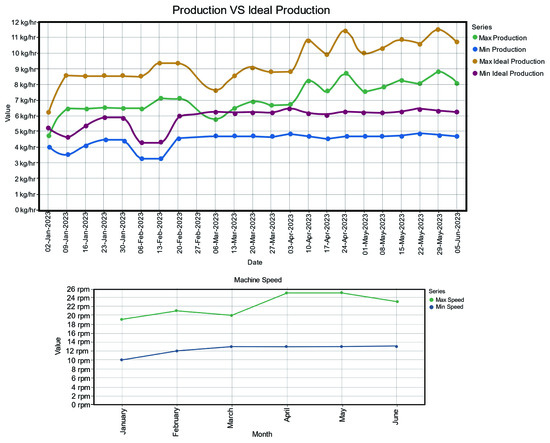
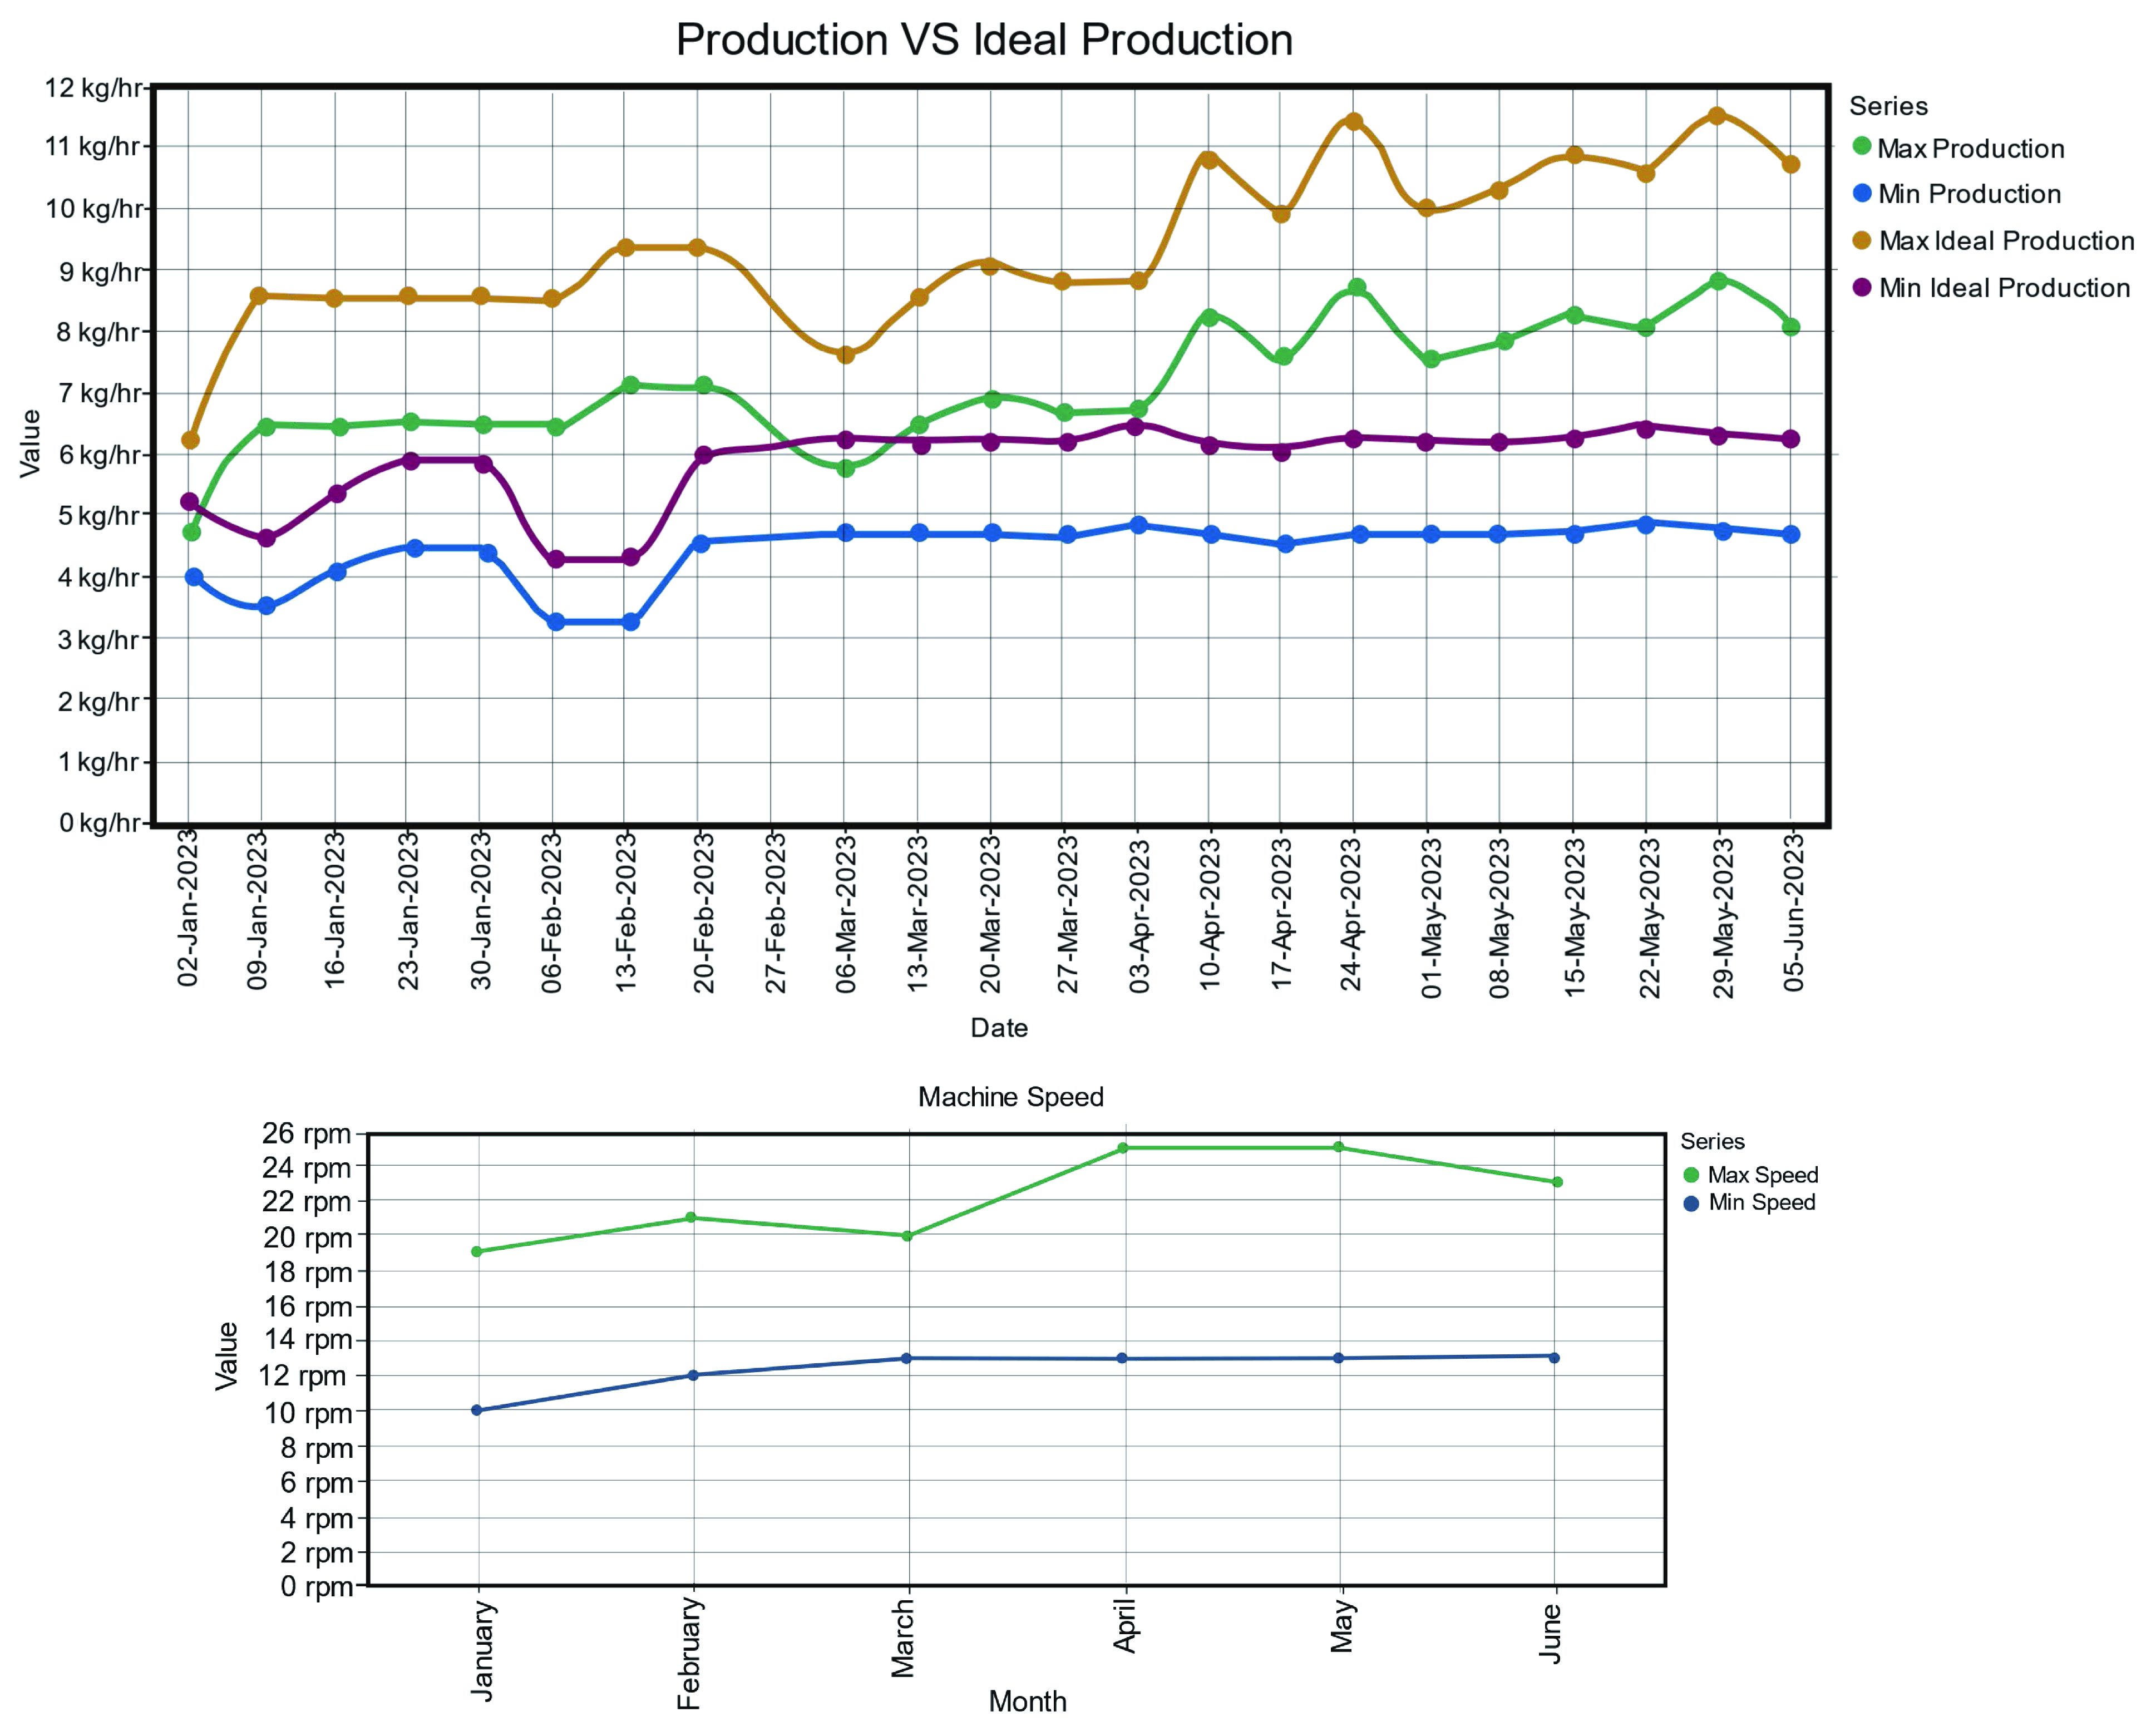
The system’s dashboard, as shown in Figure 4, enables a detailed visualisation of the productivity and operating dynamics of the double knitting machine. It displays all manufacturing data per hour daily, including constant variables such as feeder and needle count and yarn linear density. It also shows variable parameters measured by the installed sensors during the manufacturing time, such as average machine speed (21), yarn feeder speed (1339 rpm), and stitch length (2.06 mm). Moreover, it presents machine productivity and performance by analysing stoppages, including idle time, yarn feeder issues, Lycra yarn problems, and gate-related stoppages, collectively reflecting the machine’s overall performance. Furthermore, it compares theoretical and real output, demonstrating the production progress. Figure 5 shows an extra comparative statistics dashboard for average machine speed and productivity data during a specified period. This data helps with preventative maintenance by predicting problems and preventing them from occurring.
Figure 4.
System’ interactive dashboard.
Figure 5.
Analytical dashboard.
4.2. System Evaluation
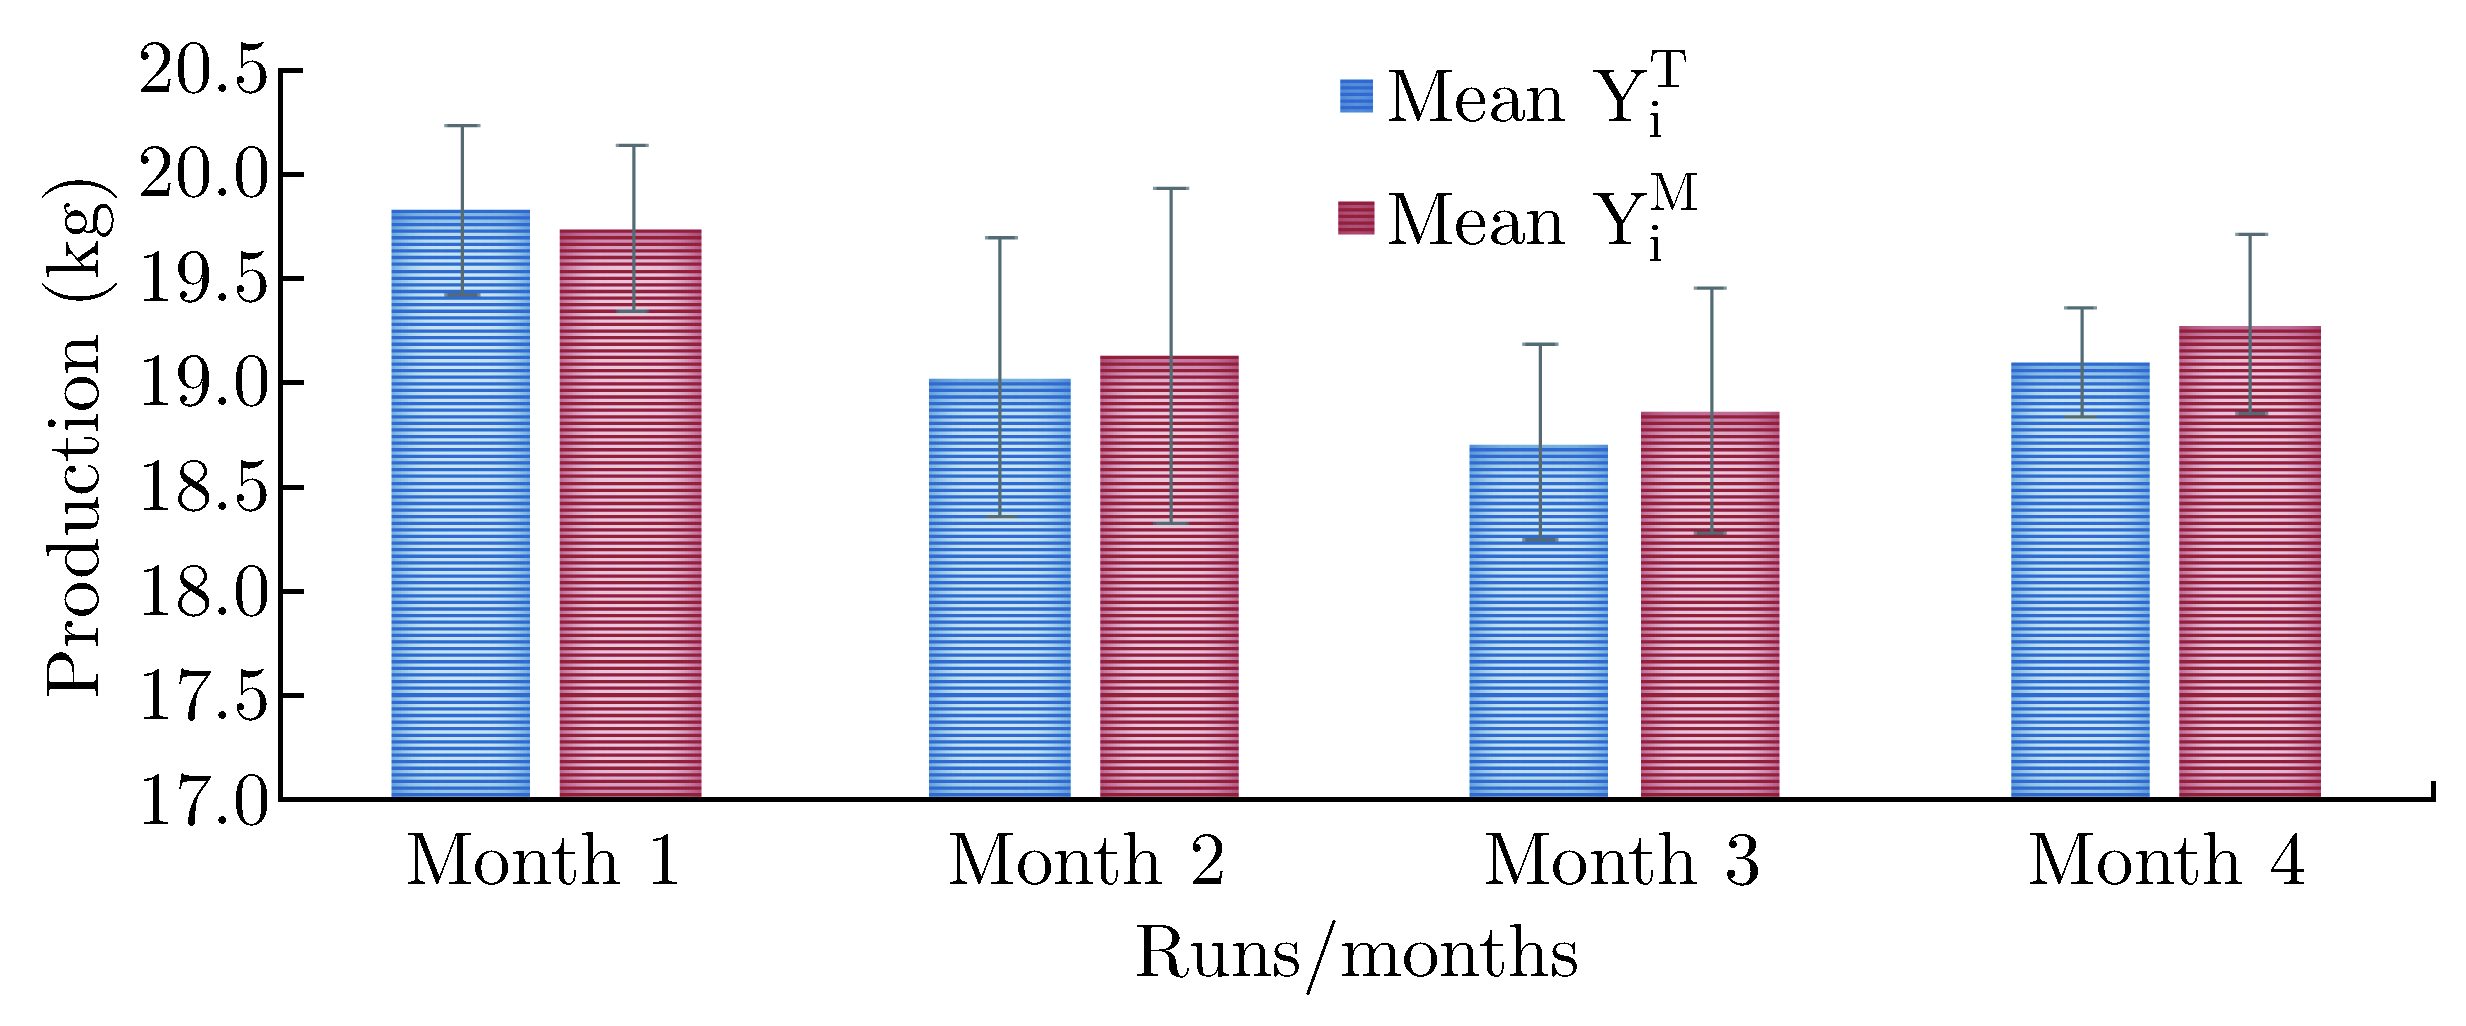
The system’s performance was assessed over a year, divided into three distinct phases of improvement processing based on the resolution of hardware and software difficulties. In each phase, 120 readings were collected over four months, each taken from a random sample of rolls (one roll per day). A comparative analysis of statistical indicators for each phase reveals that the first phase lacked accuracy and precision. The system has adequate precision and accuracy in the second phase, which occurred after the first improvement. Finally, the last phase represents the system’s current state after the second improvement, indicating high accuracy and high precision. These findings are supported by the values of AV, Stdev, CV, MAE, and MAPE for each phase, as shown in Table 1 between production rates measured by labour () and the device (). In the last phase, which represented the device’s current condition, its precision in estimating and measuring output production was comprehensively tested using a variety of statistical indicators. The following are the findings of this performance statistics analysis: Actual production had an AV of 19.17, whereas monitoring system production had an AV of 19.26. These graphs demonstrate the amazing similarity between measured and actual values. Besides, the system’s outstanding accuracy in output measurements is shown by low error values of MAE (0.29) and MAPE (1.52).
Table 1.
A Summary of device performance through improvement stages using statistical indicators.
Moreover, the monitoring system, which is currently in its final phase, measured the standard deviation of Stdev (0.65) and CV (0.03) of result production values, which refer to less variance between measured values, indicating high precision of the device of measuring productivity.
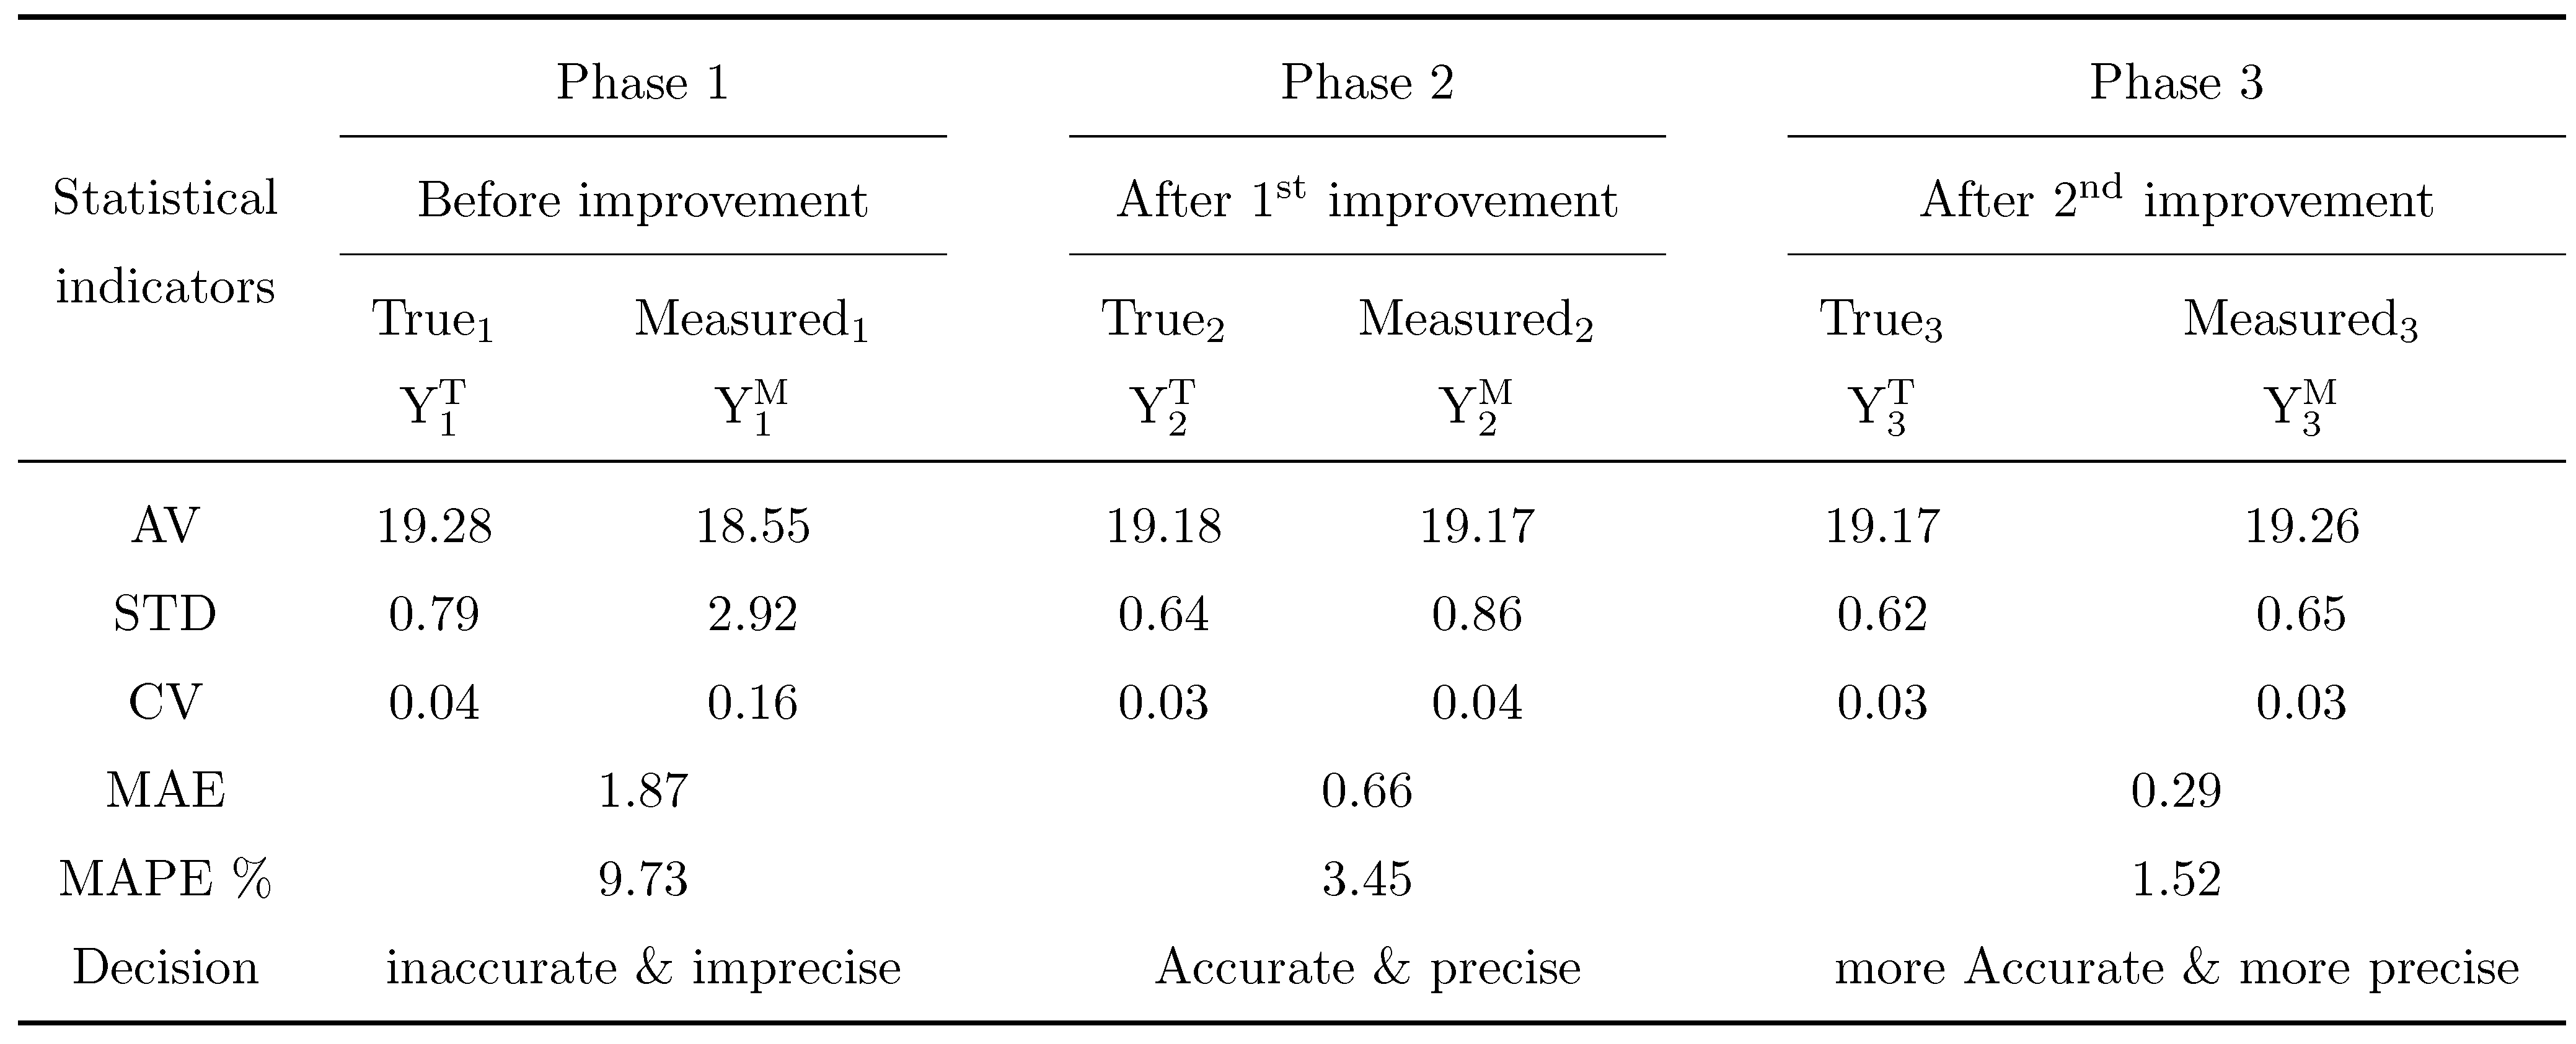
Furthermore, Table 2 displays a summary of the t-test between the device-measured production () and real production () for the three phases. The outcomes P-values are (0.00, 0.43 and 0.15) for the first, second and third phases. These outcomes show a non-significant difference between () and (), indicating high accuracy. As a result, this device highlights the industry’s reliability, monitoring machine speed and productivity. So, it is strongly recommended for precise productivity assessment, minimising waste, and facilitating problem-solving in knitting mills.
Table 2.
T-Test between actual production and measured production through improvement stages.
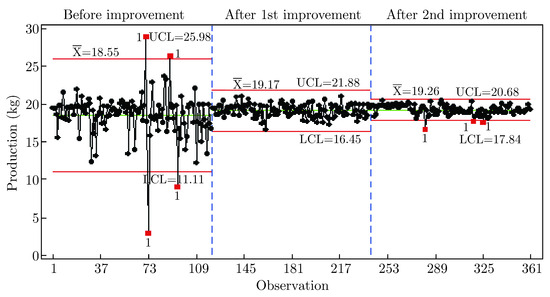
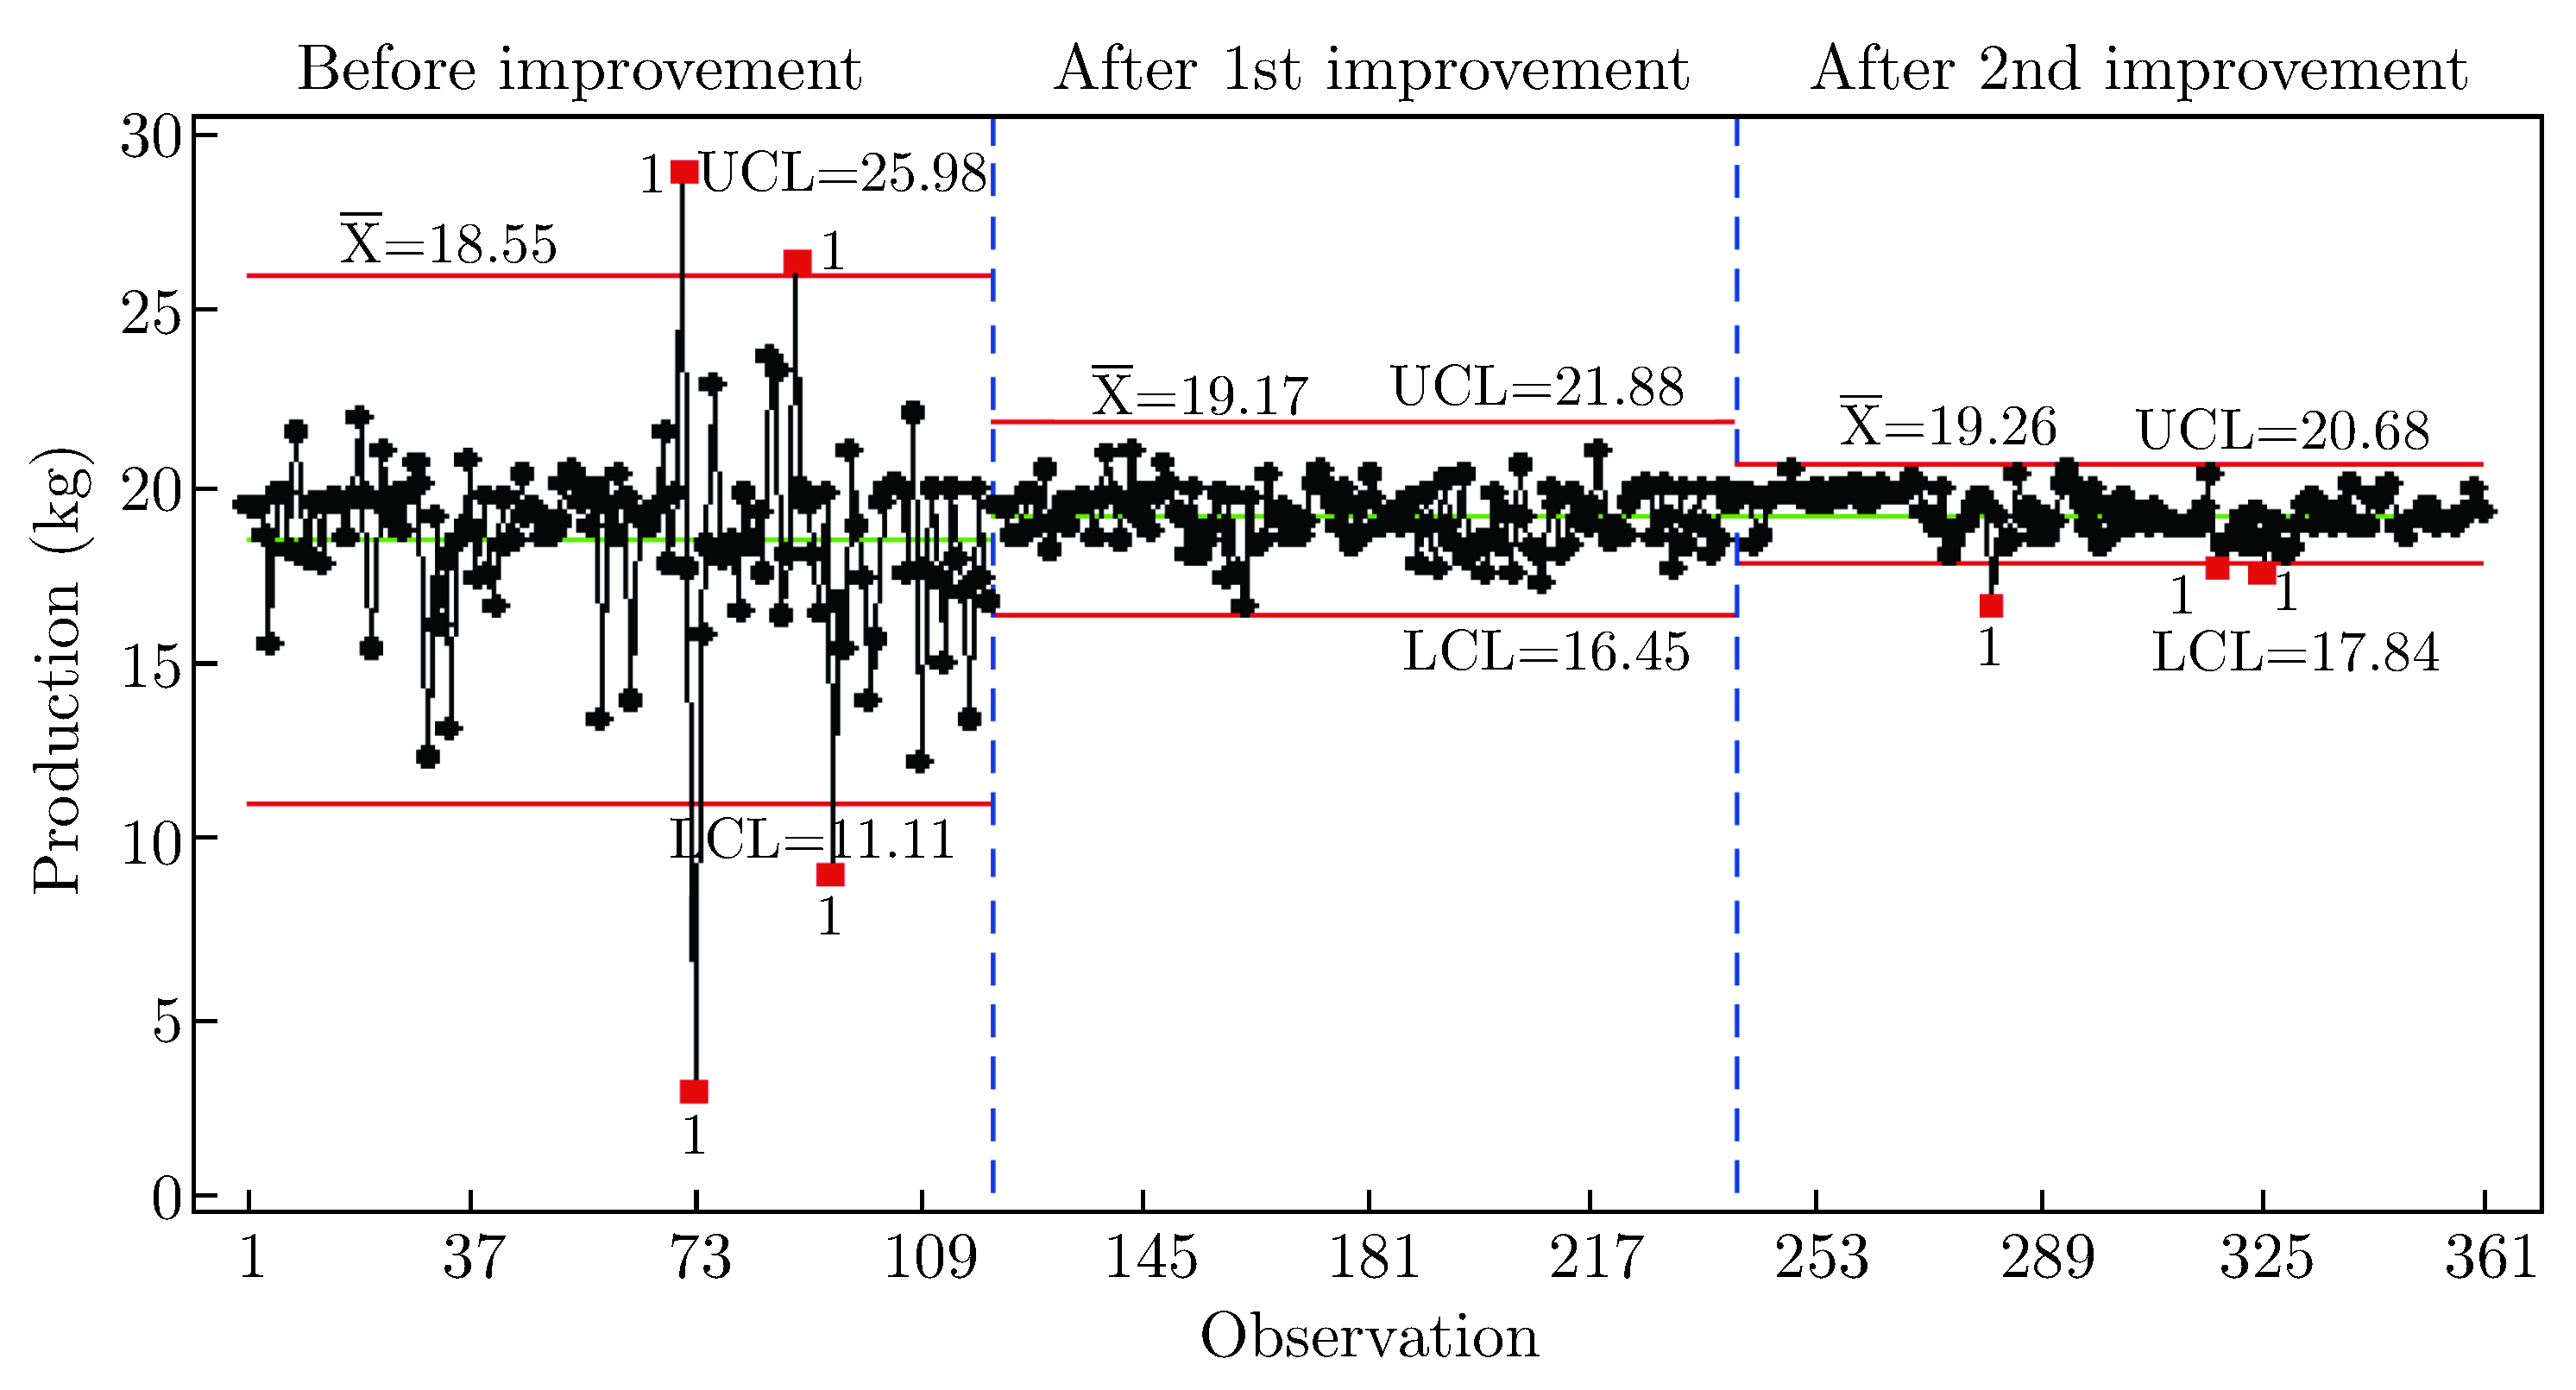
The run chart is a helpful tool for assessing improvements, as shown in Figure 6. It provides insights into the system’s progress by comparing its performance across three phases, focusing on key metrics like X-bar, LCL, and UCL. These metrics, which are represented as (18.55, 11.11, and 25.98) for the 1st phase, (19.17, 16.45, and 21.88) for the 2nd phase, and (19.26, 17.84, and 20.68) for the 3rd phase, clearly illustrate a reduction in variation at the 2nd and 3rd phases. This reduction can be attributed to successfully implementing solutions addressing hardware and software challenges. As a result, this proposed device accurately and precisely evaluates the productivity of knitting machines with high performance. It also aids in preventative maintenance since it may predict difficulties and prevent them from occurring.
Figure 6.
Run chart of total production during improvement stages (kg).
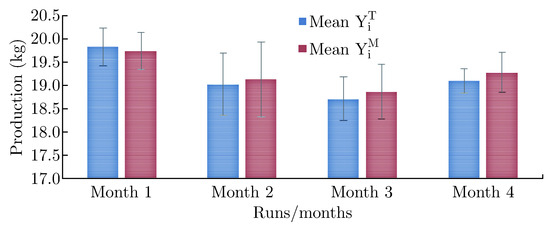
Implementing the real-time monitoring system reduces the cost of poor quality. Figure 7 shows a comprehensive four-month analysis of machine performance during the 3rd Phase, comparing production rates measured by labour () and the device (). The graph, accompanied by error bars representing variations, highlights that mean values of and remain consistently close: (19.83 and 19.74), (19.04 and 19.14), (18.72 and 18.87), and (19.11 and 19.28) for the first, second, third, and fourth months, respectively. Minimal Mean Absolute Error (MAE) values between and , measuring (0.09, 0.10, 0.15, and 0.17) for months 1 through 4 confirm the device’s precision. Analysing monthly productivity variations of and using standard deviation reveals consistent values: (0.41 and 0.40), (0.66 and 0.79), (0.47 and 0.58), and (0.26 and 0.42) for the respective months. These variations are primarily attributed to fluctuations in machine speed, impacting output productivity. Remarkably, the similar standard deviation values for both and affirm the device’s precision, aligning its measurements closely with manual methods employed in mills. Consequently, this device aptly measures knitting machine productivity with exceptional accuracy and precision while facilitating preventative maintenance through issue prediction and avoidance [19].
Figure 7.
Comparative analysis of mean monthly production (actual and measured) vs. error bars and Stdev [19].
5. Conclusion
This study presents an innovative real-time monitoring system for knitting machines based on IoT and ML technologies. The production rate is calculated, and stoppage rates are monitored using integrated sensors in the knitting machine. So, it facilitates real-time monitoring of the machine’s productivity and performance. The system has developed, and its performance is measured through three phases: before improvement, after 1st improvement and after 2nd improvement, “current state”. Various solutions were introduced during these phases to address the hardware and software challenges. Evaluation of performance regarding precision and accuracy occurred using statistical indicators and T-tests. In addition, the Run chart compares the performance of each phase using an average of productivity and control limits as metrics. Presently (in the current phase), the system has a dashboard for performance measurement with high accuracy, excellent precision and low standard deviation. Despite certain challenges, the system showcases remarkable precision, with a low MAE of 0.29 and MAPE of 1.52. Its reliability is reinforced by a low standard deviation (0.65) and a non-significant P-value (0.15). It is highly endorsed for precise knitting machine productivity measurement, enabling engineers to track productivity and fix problems simultaneously. It also aids in preventative maintenance, facilitating affordable, highquality output and cost-effective, highquality output for knitting mills. Thus, this system revolutionises the knitting industry by enhancing machine productivity and performance assessment. Future research should explore real-time data processing and predictive analytics for operational efficiency and optimisation, expanding its application scale.:
Acknowledgement
This paper is based upon work supported by the Science, Technology & Innovation Funding Authority (STDF) under grant number 43467.
References
- Min, X.; Jeanne, M.; Suk, H. The fourth Industrial revolution: Opportunities and Challenges. Int. J. Finan Res. 2018, 9(2), 90–95. [Google Scholar] [CrossRef] [Scilit]
- Ding, G.; Wang, L.; Wu, Q. Big Data Analytics in Future Internet of Things. National Natural Science Foundation of China, 2013: 1-6.
- McKinsey & Company. The Internet of Things: Mapping the Value Beyond the Hype, 2015. https://www.mckinsey.de/.
- Cyril, C.; Jimenez, M.; Mosser, S.; Riveill, M. An Architecture To Support The Collection Of Big Data In The Internet Of Things. IEEE 10Th World Congress On Services 2014, 442–449. [Google Scholar] [CrossRef] [Scilit]
- Caramés, T.; Lamas, P. Towards The Internet of Smart Clothing: A Review on IoT Wearables and Garments for Creating Intelligent Connected E-Textiles. Electronics 2018, 7, 405. Available online: https://www.mdpi.com/journal/electronics. [CrossRef] [Scilit]
- Rathore, M.; Ahmad, A.; Paul, A.; Rho, S.; Jeon, G. Real-time big data analytics: Applications and challenges. J. Supercomput. 2016, 72(8), 3073–3093. [Google Scholar]
- Application of IoT in Textile Industry, 2020. Available online: https://textilevaluechain.in/in-depth-analysis/articles/textile-articles/application-of-IoT-in-textile-industry/.
- Rengel, M. SPIDERweb – The Way to an Economic Spinning Mill, 2016. Available online: http://www.textileassociationindia.org/wp-content/uploads/2016/02/SPIDERweb-The-Way-to-an-Economic-Spinning-Mill.pdf.
- Manglani, H.; Hodge, G.; Oxenham, W. Application of the Internet of Things in the textile industry. Text. Prog. 2019, 51(3), 225–297. [Google Scholar] [CrossRef] [Scilit]
- Ahmed, U.; Mahmud, S.; Hu, J. A survey of network design problems and joint design approaches in wireless mesh networks. J. Netw. Comput. Appl. 2018, 100, 25–51. [Google Scholar]
- Available online: https://www.payoda.com/textile-industry-knit-IoT-for-improved-results/.
- Moin, K.; De, S. Internet of Things in textiles and clothing supply chain: Applications and challenges. Comput. Ind. Eng. 2018, 114, 74–86. [Google Scholar]
- axis WEAVE 4.0: Online Monitoring And Analytics For Weaving. Available online: https://www.ategroup.com/ecoaxis/smart-manufacturing-solutions/textiles/.
- Liu, Z.; Song, Q.; Cao, K.; Wang, Y.; Li, Y. Discover the digital technology application in fashion business models. J. Fiber Bioeng. Inform. 2020, 13(3), 137–150. [Google Scholar] [CrossRef] [Scilit]
- Liu, S.; Yuan, G. The Virtual Fashion in the Global Apparel Industry in the Post-Epidemic Era. J. Fiber Bioeng. Inform. 2022, 15(2), 117–130. [Google Scholar] [CrossRef] [Scilit]
- Chen, M.; Hao, Y.; Hwang, K.; Wang, L.; Cho, Y. Secure and efficient identity-based anonymous authentication scheme for the industrial internet of things. IEEE Transactions on Industrial Informatics 2017, 13(1), 489–496. [Google Scholar]
- The Business Research Company. Use Of IoT And 3D Knitting In The Knitted Fabrics Industry, 2019. Available online: https://blog.tbrc.info/2019/05/global-knitted-fabrics-market/.
- Inteos Networker. Available online: https://www.memminger-iro.de/en/ueberwachung/networker.php?thisID=251.
- Elkateb, S.; Métwalli, A.; Shendy, A. An Innovative Online Monitoring System in Knitting Industry. The 16th Textile Bioengineering and Informatics Symposium, August 22-25, 2023; Blended Conference. pp. 412–419, ISSN 1942-3438. [Google Scholar] [CrossRef]
- Elkateb, S.; Métwalli, A.; Shendy, A.; Moussa, K.; Abu-Elanien, A. Online Monitoring-Based Prediction Model of Knitting Machine Productivity. Fibres Text. East. Eur. 2023, 31(4), 46–52. [Google Scholar] [CrossRef]
- MQTT-message-queue-telemetry-transport. Available online: https://abhiappmobiledeveloper.medium.com/.
- ESP32-C3, Wireless Adventure: A Comprehensive Guide to IoT. Espressif Systems. 2023. Available online: https://www.espressif.com/.
- A Complete Guide of Digital Dashboard: Make Your Business Prosper In the Digital Era. 2023. Available online: https://www.finereport.com/en/dashboard-tools/digital-dashboard.html.
- Blerkom, M. Measurement and Statistics for Teachers, 2nd edition; Taylor & Francis, 2009. [Google Scholar]
- Boyes, W. Instrumentation reference book, 4th edition; Butterworth-Heinemann/Elsevier, 2010. [Google Scholar]
- Walpole, R.; Myers, R. Probability & Statistics for Engineers & Scientists, Ninth edition; Pearson Education, Inc, 2012. [Google Scholar]
- Elkateb, S. Prediction of Mechanical Properties of Woven Fabrics by ANN, FIBRES & TEXTILES in Eastern Europe. July 2022; 30, 4, pp. 54–59. [CrossRef] [Scilit]

© 2023 Textile Bioengineering and Informatics Society. This article is an open access article distributed under the terms and conditions of the Creative Commons Attribution (CC BY) license (https://creativecommons.org/licenses/by/4.0/).