


Abstract
In the present study, the potential applications of Cu thin films and Ag/Cu bilayer thin films obtained by the pulsed laser deposition (PLD) technique are investigated in terms of the physicochemical effects resulting from their interaction with an aqueous solution containing Reactive Blue 21 (RB21) dye and sodium bicarbonate (NaHCO3). The thin-film deposition process was carried out using a Q-switched Nd:YAG laser system operating at a wavelength of λ = 532 nm, with a pulse duration of τ = 10 ns, a repetition rate of ν = 10 Hz, a pulse energy of E = 180 mJ, a laser spot diameter of d = 336 μm, and an angle of incidence of α = 45°. Two types of thin films were prepared: a Cu thin film and an Ag/Cu bilayer thin film. The thermal effects induced by the interaction of the laser beam with the target materials were investigated by numerical simulations performed in COMSOL, allowing the evaluation of melt-phase formation for each material separately and providing a better understanding of the morphology and topography of the deposited thin films. The simulation results were validated through scanning electron microscopy (SEM) observations and surface roughness analyses. The two thin films were subsequently treated with an aqueous solution containing 10 g/L RB21 dye and 10 g/L NaHCO3. Physicochemical analyses performed after treatment, including scanning electron microscopy (SEM), optical microscopy (OM), profilometry, Fourier transform infrared spectroscopy (FTIR), energy-dispersive X-ray spectroscopy (EDS), X-ray Photoelectron Spectroscopy (XPS) and UV–Vis spectroscopy, revealed significant degradation of the RB21 dye accompanied by corrosion of the thin films, with the corrosion process being more pronounced in the case of the Cu thin film. The obtained results indicate that the method analyzed in this study may represent an alternative approach for the decomposition of recalcitrant organic dyes using thin Cu films, without relying on conventional photocatalytic processes. Equally important are the potential applications of the RB21/NaHCO3 solution as an etching and patterning medium for thin Cu layers, while the Ag overlayer may provide a protective effect during such processes. These findings may contribute to the development of novel fabrication techniques for optoelectronic components, including solar cells, photovoltaic windows, and other industrial and laboratory applications.
1. Introduction
With this paper, we present the results of our study on the interactions on the surface of copper thin films and silver/copper bilayer thin films produced by pulsed laser deposition (PLD) with an aqueous solution containing sodium bicarbonate and Reactive Blue 21. The aim of the study is to test the catalytic ability of copper thin film and silver/copper bilayer thin films and if the method is suitable for etching the copper thin films for further applications. It also aims to study if the Ag overlayer may provide a protective effect during such processes.
Copper thin films are a versatile and essential material in various industries, particularly in electronics and optoelectronics. They are known for their high purity, stability, and processing versatility, making them ideal for applications such as electrical conductivity. Copper thin films offer precise control over electrical conductivity, which is crucial for high-performance electronics and data storage applications. These films are engineered for smooth surfaces and uniform layer thickness, which is vital for the production of stable and adherent layers. Copper thin films can be used to achieve transparency or spectral selectivity, making them suitable for applications like heat reflectors and window coatings [1]. Techniques such as electrochemical deposition (ECD) allow for the fabrication of smooth surface copper films, which are used in printed circuit boards and touchscreen technology [1,2].
Copper thin films produced on dielectric substrates by pulsed laser deposition showed different morphologies and optical absorption behaviors [3]. Based on the quality of the copper pulsed laser deposition, the method was investigated to produce copper-based photocathodes [4]. The conductive ink based on copper nanoparticles or copper complexes offers a cheap alternative with high conductivity for flexible electronics, with synthesis and sintering methods adapted to prevent oxidation and allow processing at low temperatures. Methods have been designed to produce copper ink, such as thermal sintering at low temperatures compatible with plastic or paper substrates, photonic or laser sintering, which selectively heats the copper nanoparticles without damaging the substrate, or chemical sintering, using reducing agents to facilitate particle coalescence at lower temperatures [5,6,7].
The use of copper thin films is not only limited to electronics but also extends to research and development, where they facilitate studies into novel interconnected materials and next-generation storage media. Their high purity and stability make them a cornerstone material for both industrial manufacturing and scientific advancement. Copper conductive ink, based on copper nanoparticles or copper complexes, offers a cheap alternative with high conductivity for flexible electronics, with synthesis and sintering methods adapted to prevent oxidation and allow processing at low temperatures. Methods have been designed to produce copper ink, such as thermal sintering at low temperatures compatible with plastic or paper substrates, photonic or laser sintering, which selectively heats the copper nanoparticles without damaging the substrate, or chemical sintering, using reducing agents to facilitate particle coalescence at lower temperatures [5,6,7]. Copper-based inks are gaining popularity in the electronics industry due to their high conductivity, low cost, and suitability for large-scale manufacturing. Recent advancements have focused on surface and interface designs to enhance the stability and conductivity of copper-based inks, making them suitable for a range of electronic applications, including transparent conductive electrodes, sensors, optoelectronic devices, and thin-film transistors [6].
The thin films obtained by the PLD method are actually composed of clusters of nano- and microparticles deposited successively. This structure gives them special properties, including a high surface-to-volume ratio. In this regard, copper thin films exhibit catalytic properties, antibacterial, antioxidant, and antifungal activities, as well as cytotoxicity and anticancer properties [8]. The use of PLD technology is very suitable for the production of complex and easily manageable oxides. For the development of copper-based electrocatalysts for biosensor applications, multiphase copper oxide thin films were fabricated on an Si (100) substrate using the PLD technique. The Cu-0 electrode showed a good sensitivity for glucose detection and the highest selectivity for glucose detection among various organic, inorganic, and biological molecules [9]. Also, through pulsed laser deposition (PLD), a nanocomposite thin film of silver/copper oxide was fabricated and used in the reduction of nitrophenol, nitrophenols being known as the main pollutants in industrial and agricultural waste due to their water solubility. The Ag/CuO films were deposited on a quartz substrate. Nd:YAG was used as the laser source in the PLD technique, with a wavelength of 532 nm to obtain a nanocomposite with high-performance catalytic activity [10]. Also, through the PLD technique, thin films were fabricated by ablating a high-purity copper target mounted on platinum in ultra-high vacuum (UHV). The samples demonstrated excellent photocatalytic degradation efficiency of dyes in wastewater [11].
Theoretical studies on copper complexes have focused on their molecular structure, properties, and potential applications in solar cells [12].
The interaction between copper and bicarbonate can lead to chemical reactions as a result of the process of copper dissolution, which can cause the material to be perforated, depending on the concentration and conditions of the solution [13,14]. These interactions have been studied over time, both to prevent damage to copper pipes [14] and for other types of processes, as well as for using the reaction in a beneficial way. Thus, the process of anodizing copper in sodium bicarbonate solutions was explored to form nanowires composed of crystalline Cu2O, CuO, Cu(OH)2, and malachite Cu2CO3(OH)2 [14,15]. This process provides a method for nanostructuring copper oxides to be used in various applications, including CO2 reduction reactions, photoelectrochemical water splitting, and improving the performance of direct methanol fuel cells [16].
When dissolved in a sodium bicarbonate solution, copper goes into its ionic state in which it can react with sodium bicarbonate, but in small amounts. The compound formed is copper(II) bicarbonate with the chemical formula Cu(HCO3)2, which is unstable, especially in the presence of heat or ultraviolet light. It decomposes to form carbon dioxide and copper(II) Carbonate. Although copper(II) bicarbonate does not have special uses, the reaction itself is of interest for research due to its effects. In this study, we present the purpose of using NaHCO3 in testing a new method for etching copper thin films obtained by the pulsed laser deposition (PLD) method. Other properties will be also explored based on the results. Reactive Blue 21 dye, a copper coordination compound, was used in the bicarbonate solution for a better evaluation of the results, based on a similar study previously conducted that showed the catalytic effect of the thin silver film in the reaction between the RB21 dye and bicarbonate [17].
2. Materials and Methods
2.1. Method of Work
The pulsed laser deposition technique (PLD) was used to produce the copper thin film and the silver/copper bilayer thin film.
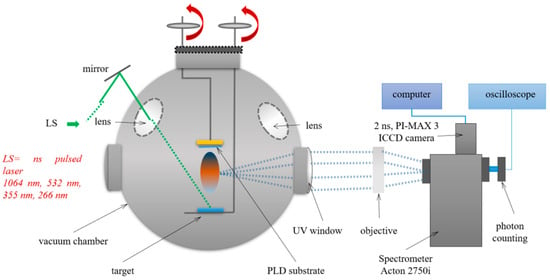
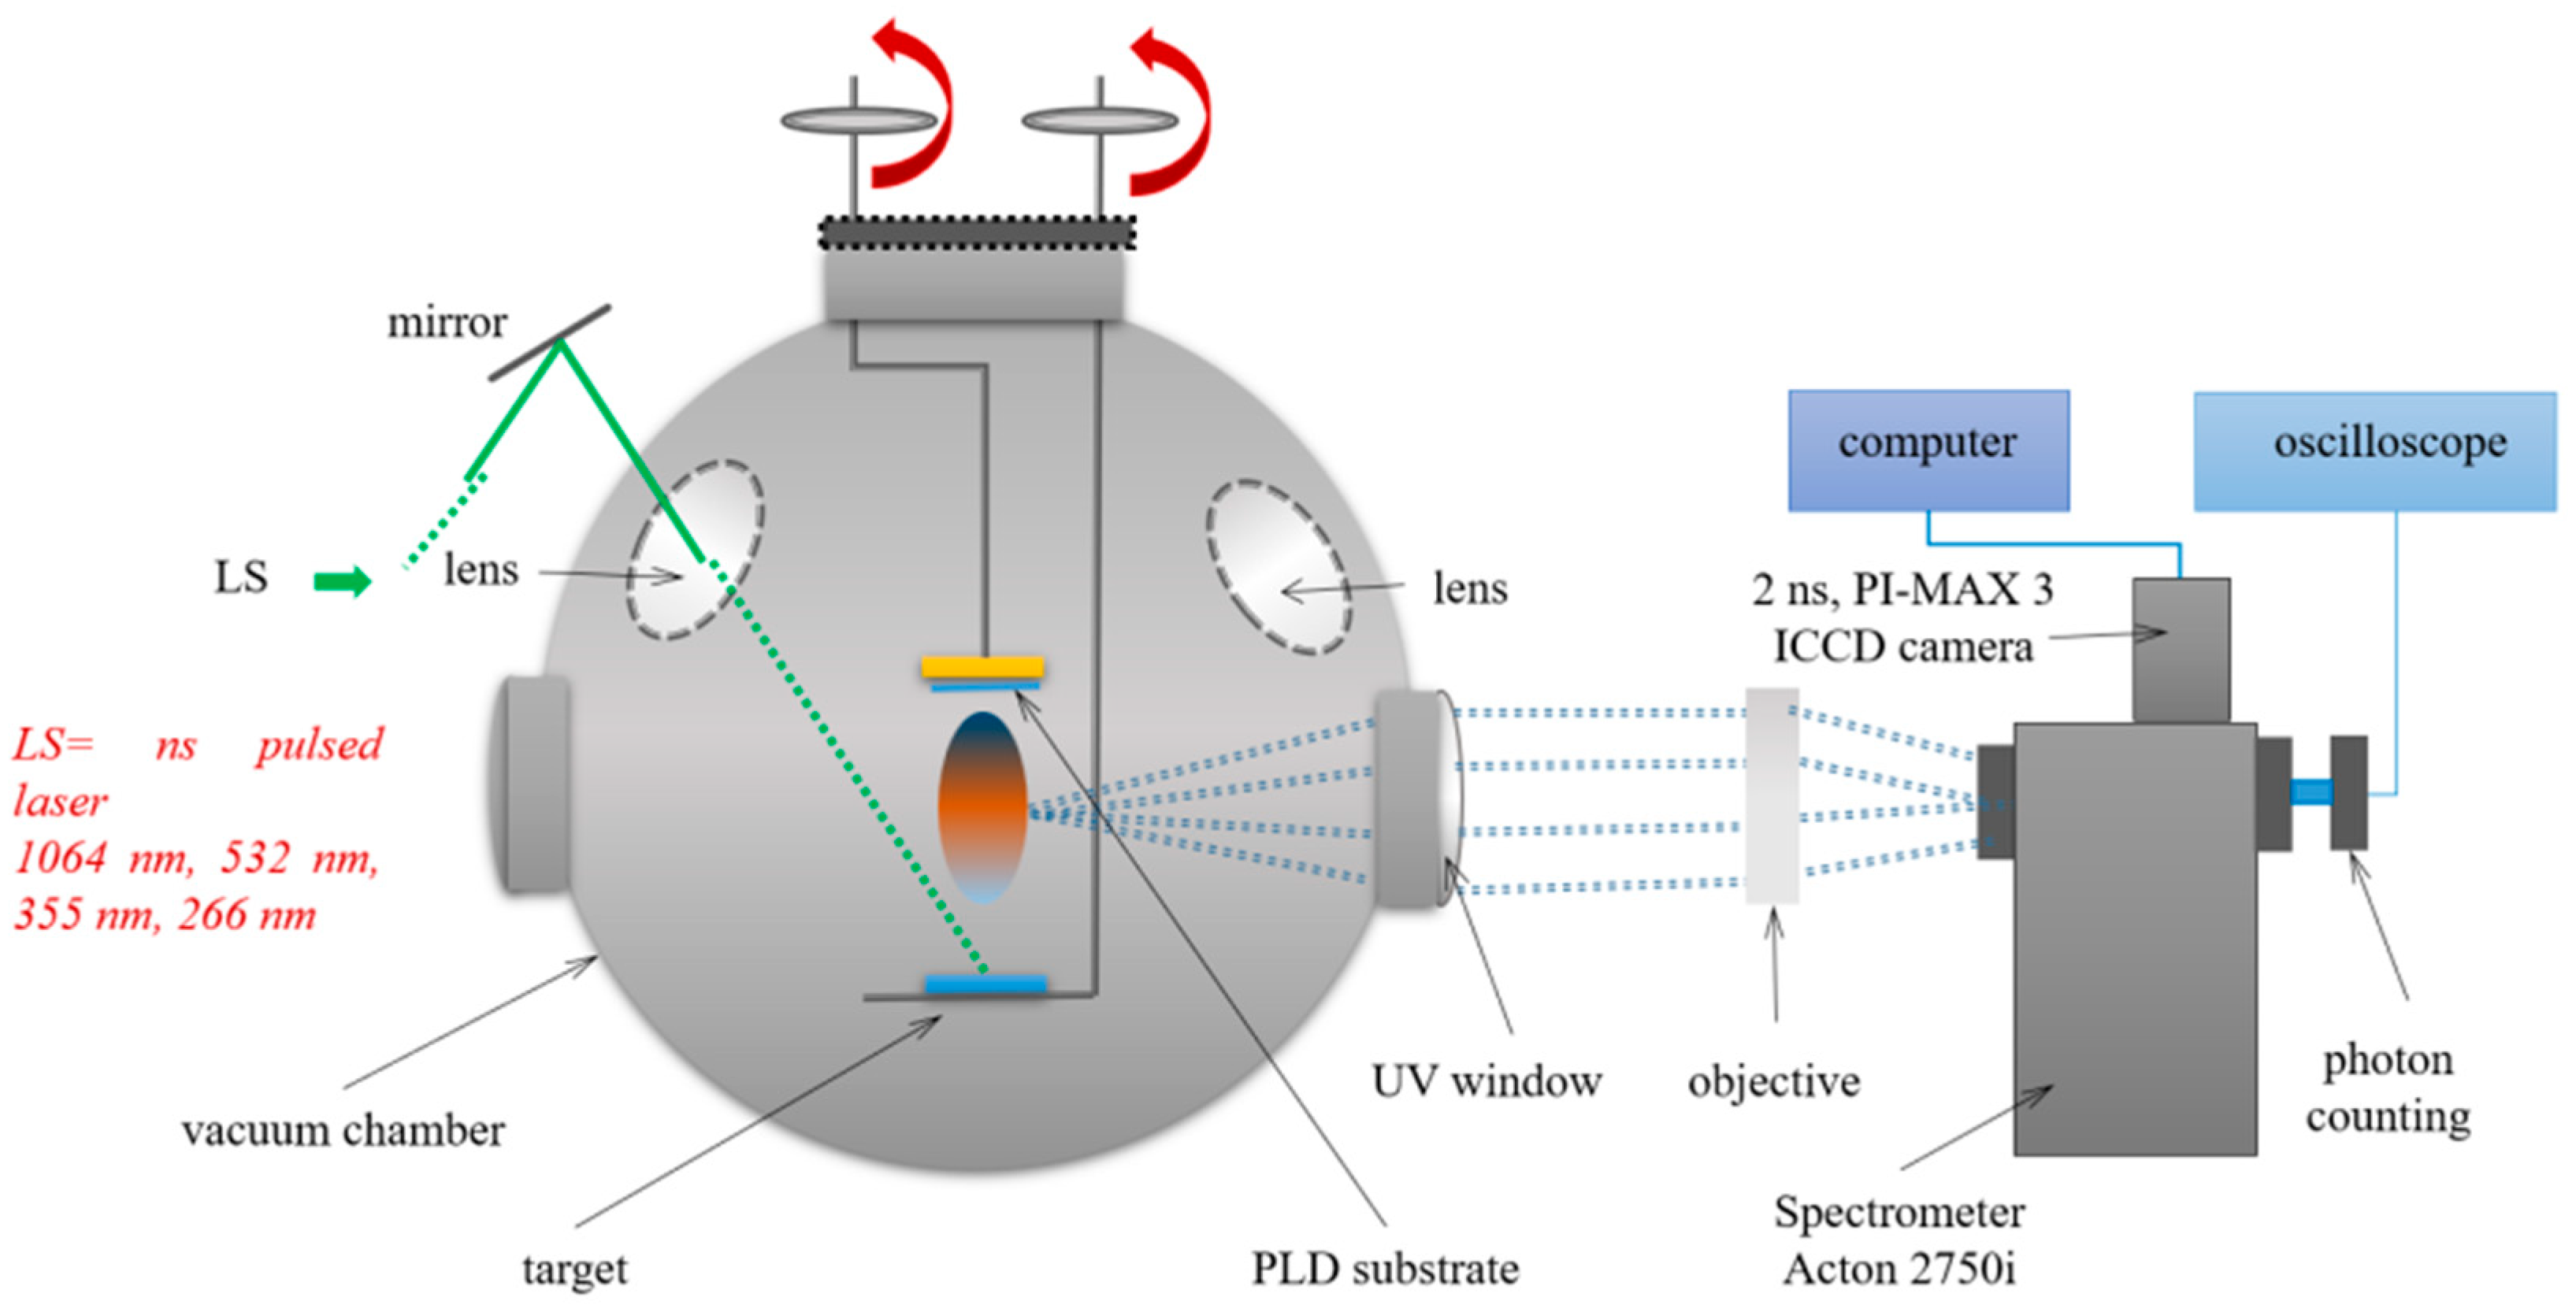
The PLD process was performed in the same conditions as per Cocean et al. 2017 [17], with the laser system part of the installation presented in Figure 1. The laser system is a Quantel laser system, the YG 981E/IR-10 model that is a Q-switched Nd:YAG laser produced by Quantel, Les Ulis, France. The laser beam of λ = 532 nm wavelength with a spot dimension of d = 336 μm, pulsed width τ = 10 ns with repetition rate ν = 10 Hz, laser energy per pulse E = 180 mJ/pulse, was set to hit the target at an angle of α = 45°. The pressure in the deposition chamber was brought to p = 3 × 10⁻² Torr with the help of the vacuum pump. The distance d = 2 cm was set between the target and the glass slab used as deposition support. During the deposition of t = 30 min for each of the samples, the targets were moved along a spiral trajectory in accordance with their round shape to avoid piercing them and also so that the material resulting from ablation would not be affected or to reduce the effects produced by the redeposits resulting from the previous ablation process. The movement of the target was computer aided.
Figure 1.
Schematic representation of the pulsed laser deposition installation.
2.2. Materials
The Cu thin film and the Ag/Cu bilayer thin film prepared by the PLD method were obtained from a copper target and the silver target with Ni and Fe impurities [17].
An aqueous solution of the CI RB21 dye (a copper coordination compound) with a concentration of 10 g/L was prepared. Separately, a saturated solution of sodium bicarbonate with a concentration of 10 g/L in warm water (40 °C) was prepared, after which it was allowed to cool to room temperature (24 °C). Equal amounts of 100 mL from the two solutions were mixed. Then, from the resulting RB21-NaHCO3 solution, 0.5 mL were dripped onto each of the Cu and Ag/Cu thin films and on a glass slab (same as the one used as deposition support). The resulting samples were noted as R-Cu and R-Ag/Cu, and the resulting materials from solution leakage after interaction with thin film were noted as Q-Cu and Q-Ag/Cu.
The resulting aqueous solutions of Reactive blue 21 (10 g/L) and NaHCO3 (10 g/L) were dripped on the glass slab; namely, RB21-NaHCO3 and the RB21 dye were the control samples.
The aqueous solutions of RB21 and NaHCO3 were prepared with deionized and distilled water (18.2 MΩcm) obtained through a purification and deionization system produced by Barnstead EasyPureII Milli-Q, Thermo Fisher Scientific, Waltham, MA, USA.
2.3. Methods of Analysis
The interaction of the targets with the laser beam was evaluated by numerical simulation in COMSOL 5.6-01 software version (COMSOL AB, Stockholm, Sweden).
The morphology and the elemental composition of the surface of the thin films were analyzed with Scanning Electron Microscopy (SEM) (JEOL, Tokyo, Japan) coupled with Energy Dispersive X-Ray (EDS) performed with a Vega Tescan LMH II, Brno, Czech. For the electron spectroscopy, an SE detector was used at 30 kV filament supply and a working distance of 15.5 mm.
Fourier Transform Infrared Spectroscopy (FTIR) analysis of the functional groups was performed on the samples of dried material collected from each surface of the Cu and Ag/Cu thin films covered with the RB21-NaHCO3 solution (R-Cu and R-Ag/Cu) and from the surface of the deposition support (glass slab) next to the thin film where the solution leaked from the thin film (Q-Cu and Q-Ag/Cu). The spectra of the studied samples were compared with the control samples RB21-NaHCO3 and the RB21 dye. The Bomem MB154S FT-IR Spectrometer at an instrumental resolution of 4 cm−1 (Bomem, ABB Group, Saint-Laurent, QC, Canada) was used. Each sample was then incorporated into about 280 mg of potassium bromide (KBr) used as suspension media and was pressed into a stainless-steel ring of 12 mm inner diameter using a pneumatic pressing device at 100 atm pressure. The ring with the pellet was placed in the sample holder of the spectrometer.
Profilometry with a DektakXT Stylus Profilometer (Bruker, Bruker Nano Surfaces Division, 3400 East Britannia Drive, Suite 150, Tucson, AZ 85706, USA) was carried out on the thin films after washing them with distilled water to remove the material resulting after treatment with the RB21-NaHCO3 solution. The roughnesses (profile) of the thin films after treatment were compared with the roughnesses (profile) before treatment. The measurements were carried out under the following conditions (Table 1):
Table 1.
Details of profilometry measurements.
The optical microscopy (OM) was performed using a Namicon ISMM1000 trinocular inverted metallographic microscope (INSIZE, Suzhou, China) equipped with a MotiCam camera (10+, 10.0 MP), specialized in microscopic analysis, and Motic Images Plus 3.0 (×86) software, version 3.0.12.41 (Motic, China-Group Co., Ltd. 2015, Hong Kong, China).
The UV–Vis absorption spectra of the analyzed solutions were recorded in the range of 200–800 nm using a Shimadzu UV-1800 spectrophotometer (Kyoto, Japan). The sample was introduced into a quartz cuvette with a volume of 3 mm and at a scan rate of 800 nm/min, with a slit width of 1 nm.
The surface elemental composition was investigated by XPS analysis, performed with a PHI 5000 VersaProbe photoelectron spectrometer (Ulvac-PHI, Inc., Chikasaki, Japan) using monochromated AlKα radiation (1486.7 eV) to acquire the XPS spectra. The calibration of the binding energies was carried out using the C 1s core level signal (BE = 284.6 eV). The accuracy of the measured binding energy is within ±0.2 eV.
For the generation of graphs through the processing of data obtained from simulations with COMSOL and those obtained through FTIR, profilometry, UV-Vis, and XPS measurements, the software Origin Pro 2022, version 9.0.0.225 Academic (OriginLab Corporation, Northampton, MA 01060, USA), was used.
3. Results and Discussion
3.1. Numerical Simulation in COMSOL
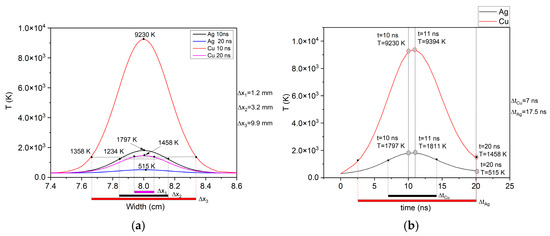
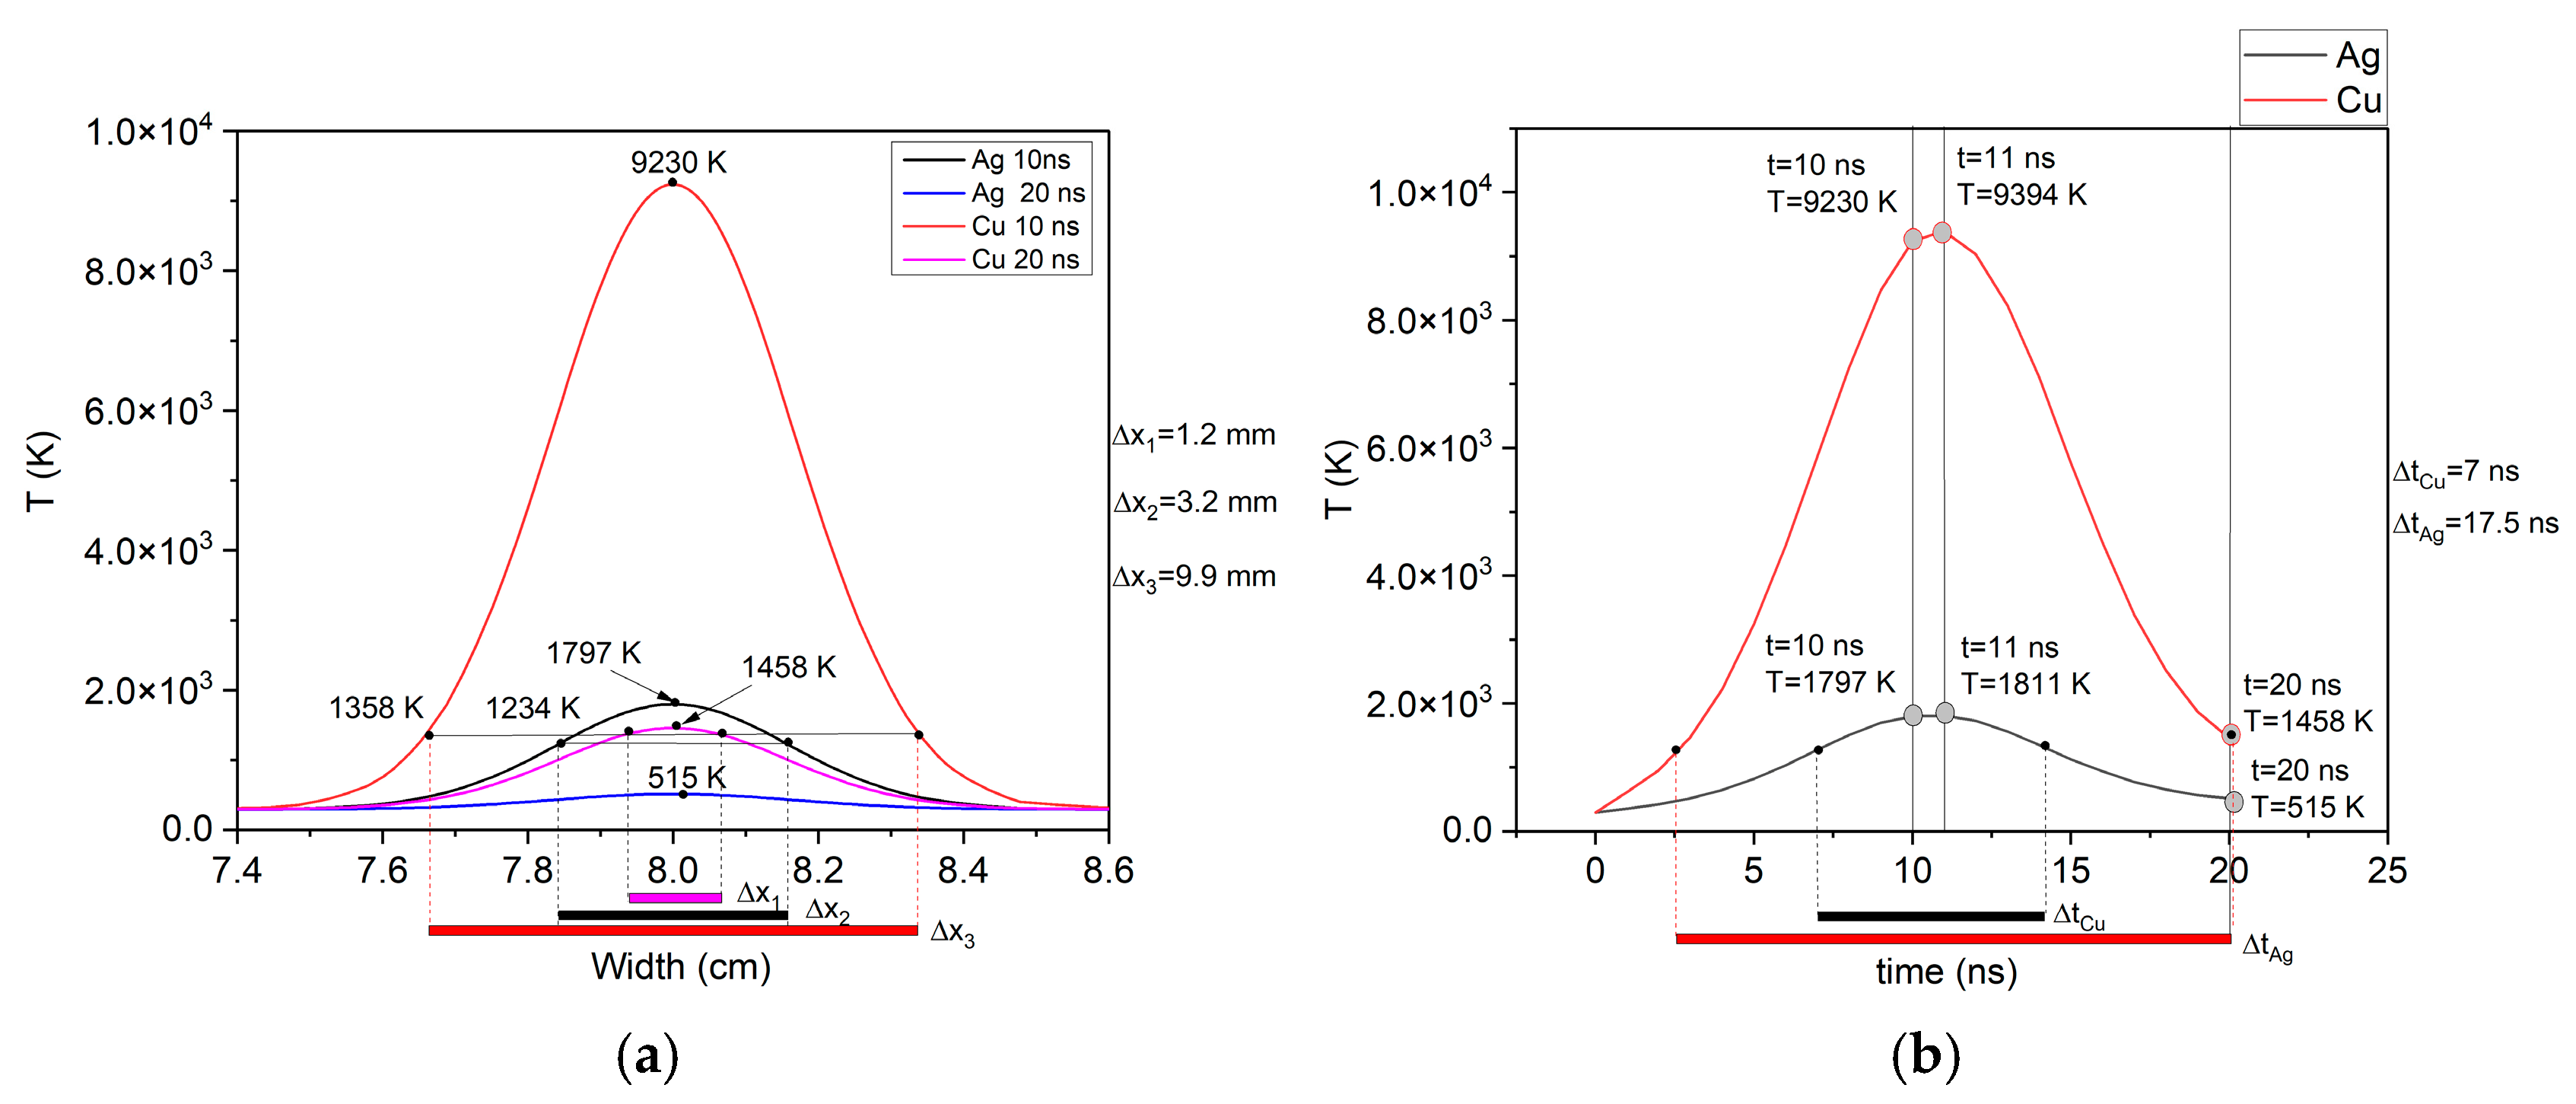
For a better explanation of the deposition phenomena, it is also necessary to understand the thermal phenomena on the target surface in the spot of incidence of the laser beam, in order to evaluate the magnitude of ablation as well as the fluid phase of the resulting material. Since the temperature developed during the interaction of the laser beam with the material cannot be measured due to the very short action time, it was estimated through the results of numerical simulation in the COMSOL software. The theoretical and mathematical model used was according to Cocean et al. 2017 [18] and Cocean et al. 2024 [17]. Figure 2 shows the results of the numerical simulation in COMSOL that reflect the thermal effects in space and time produced on the Cu target and on the Ag target in space (Figure 2a) and in time (Figure 2b). The numerical simulation takes into account the laser parameters according to those used for experimental deposition and the material constants and parameters of the two materials used as targets (Cu and Ag). The optical parameters of Cu and silver materials were taken from the database for λ = 532 nm [19,20], namely the refractive index n(Cu) = 1.1159 and n(Ag) = 0.054007, while the extinction coefficients were k(Cu) = 2.5956 and k(Ag) = 3.4290, values to which correspond the absorption coefficients α(Cu) = 6.1311 × 105 cm−1 and α(Ag) = 8.0996 × 105 cm−1. The absorption coefficients are important both for calculating the heat source and the thermal effect resulting from the interaction of the laser beam with the target material, as well as for being able to optimize the meshing for finite element calculation so that no values of interest are lost, but also so that the computer’s working memory is not overloaded. The other material parameters, including thermal properties such as heat capacity at constant pressure, were taken from the COMSOL software library as functions of temperature, extrapolating with the closest function for temperature values higher than those provided in the functions supplied by COMSOL. Regarding the dependence of optical parameters on temperature, it was not necessary to introduce a function to describe the thermo-optic effect because only a single pulse was simulated.
Figure 2.
The results of the COMSOL simulation of the interaction of the laser beam with the Cu and Ag targets regarding the thermal effect expressed by: (a) the variation of the temperature in Kelvin T(K) on the surface of the target around the point of incidence of the laser beam on the target (x = 8 cm in the presented graph), where Δx represents the spot size on the target surface where the laser beam produces temperatures higher than the melting point of the analyzed materials (Cu and Ag), and (b) the variation of the temperature in Kelvin T(K) over 20 ns, where Δt represents the time during which the temperature at the center of the interaction spot of the laser beam with the target remains greater than or equal to the melting point of the analyzed material (Cu and Ag).
As a reference for evaluating the thermal effect, the melting points of the two materials were taken into account (M.P. Cu = 1357.77 K; M.P. Ag = 1234.95 K). The melting point was considered in this numerical study as the temperature above which the fluid phase results in the laser ablation process and which is important for the deposition, also influencing the amount of material deposited. For comparing the results obtained for the two materials, the dimensions on which the conditions for the formation of the liquid phase are met on each target were also measured at two times (t = 10 ns and t = 20 ns) and which are indicated on the graph by Δx. Also, the results of the thermal effect were compared through the time during which the conditions for the existence of the fluid phase were met (temperature greater than or equal to the melting point), this parameter being indicated on the graph with Δt.
The thermal effect during the irradiation of the target with a pulsed laser beam results from a complex combination of optical and thermal phenomena, taking into account both optical and thermal parameters as well as their changes with temperature [18].
For the Cu target, the simulation results show a maximum of 9394 K at time t = 11 ns and values of 9230 K during the pulse (t = 10 ns) and 1458 K at the end of the studied interval (t = 20 ns). The time interval during which the liquid phase occurs was calculated to be 17.5 ns, and the spot size where the solid phase threshold is reached ranges between Dx = 9.9 mm at time t = 10 ns and Dx = 1.2 mm at time t = 20 ns. Regarding the silver target, a maximum temperature resulting from the interaction with the laser radiation of 1811 K was observed at time t = 11 ns, and a pulse temperature (t = 10 ns) of 1797 K, which ensures the production of the liquid phase. At the end of the studied interval (t = 20 ns), the temperature at the center of the laser-irradiated spot drops well below the melting point of silver (T = 515 K). From the studied time interval, the time during which the liquid phase occurs is Δt = 7 ns. The area of the spot affected by the laser irradiation that reaches temperatures greater than or equal to the melting point is at time t = 10 ns, equal to Δx = 3.2 mm.
These values show an estimated ablation yield relative to the fluid phase much higher for copper compared to silver. Much higher temperatures resulting on the surface of the Cu target during laser irradiation led to the production of a fluid with lower viscosity, which should be reflected in a deposit with lower amplitude roughness, and the obtained thin film should be more consistent, with a greater thickness than in the case of silver.
3.2. Scanning Electron Microscopy and Energy Dispersive X-Ray (SEM-EDS)
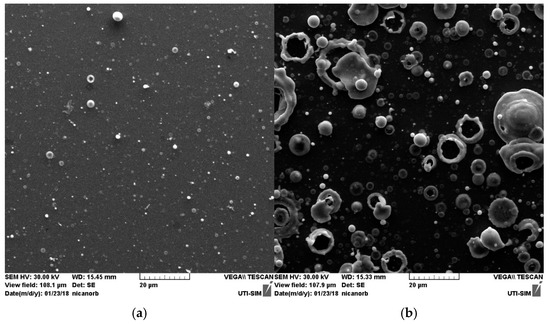
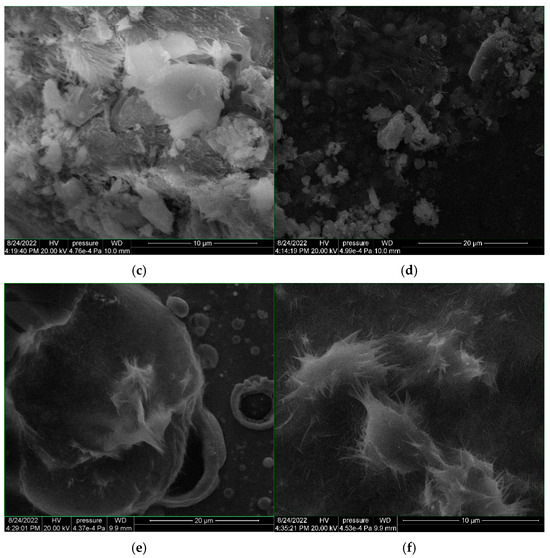
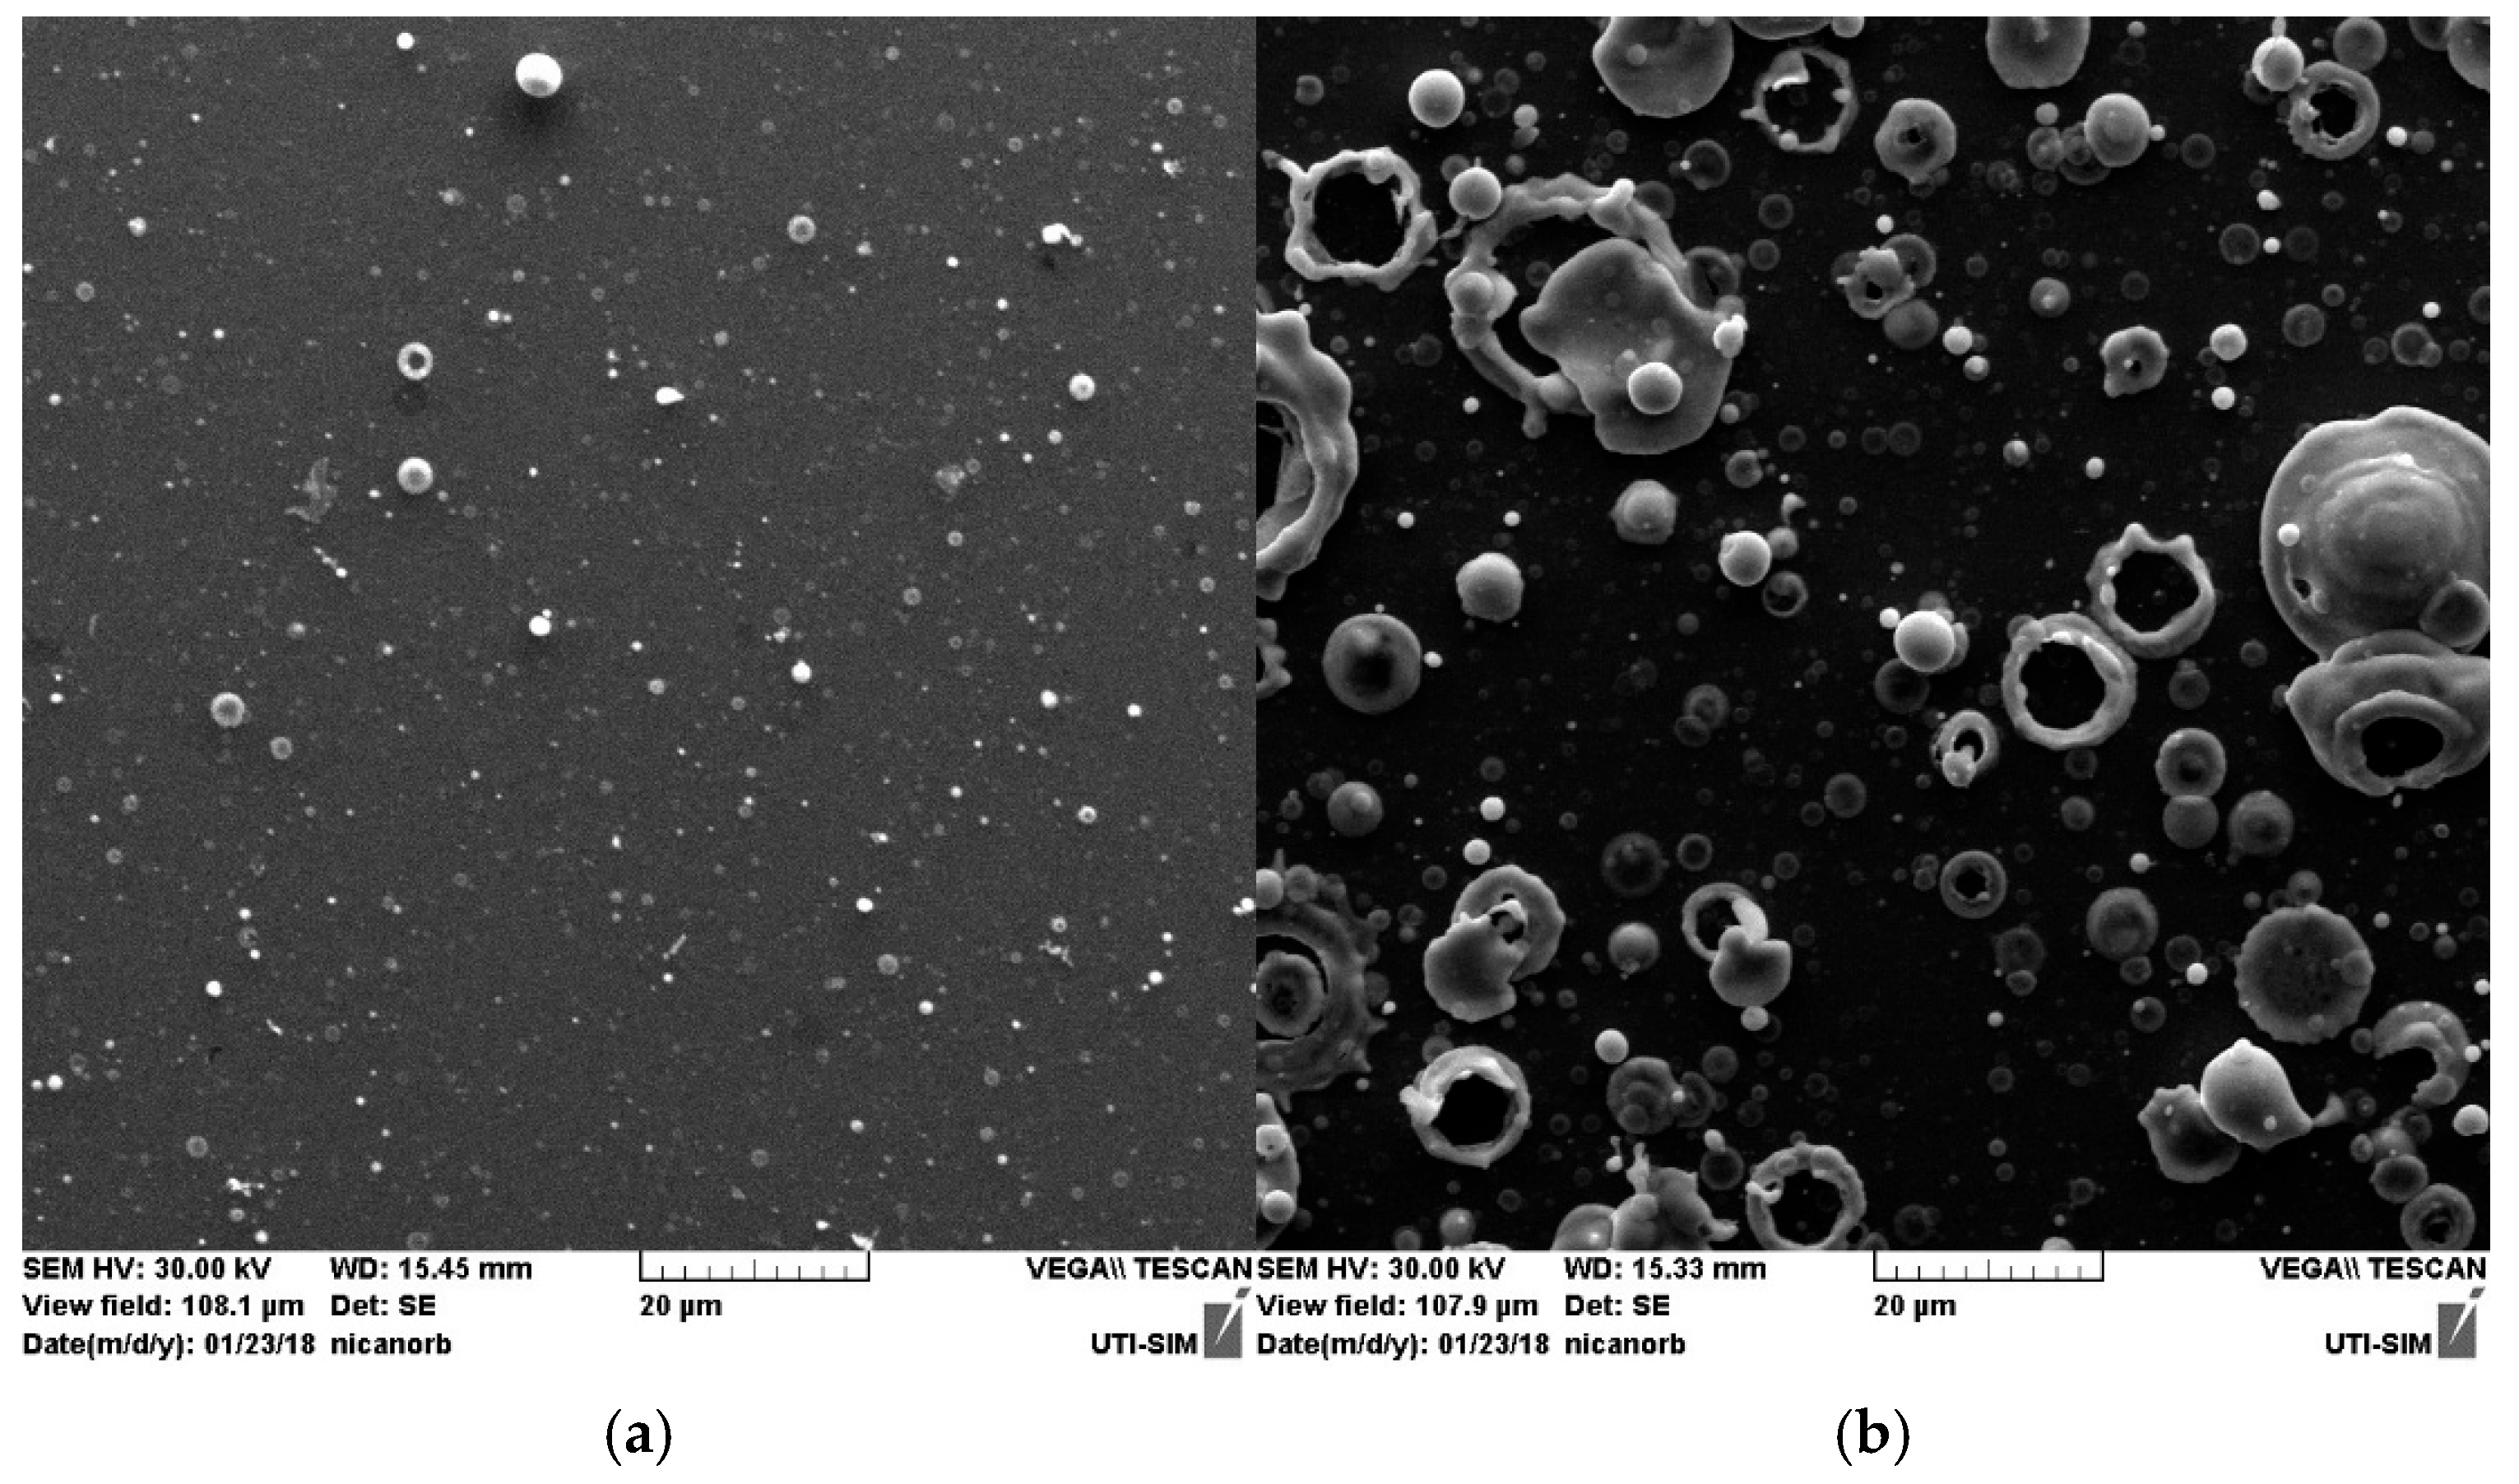
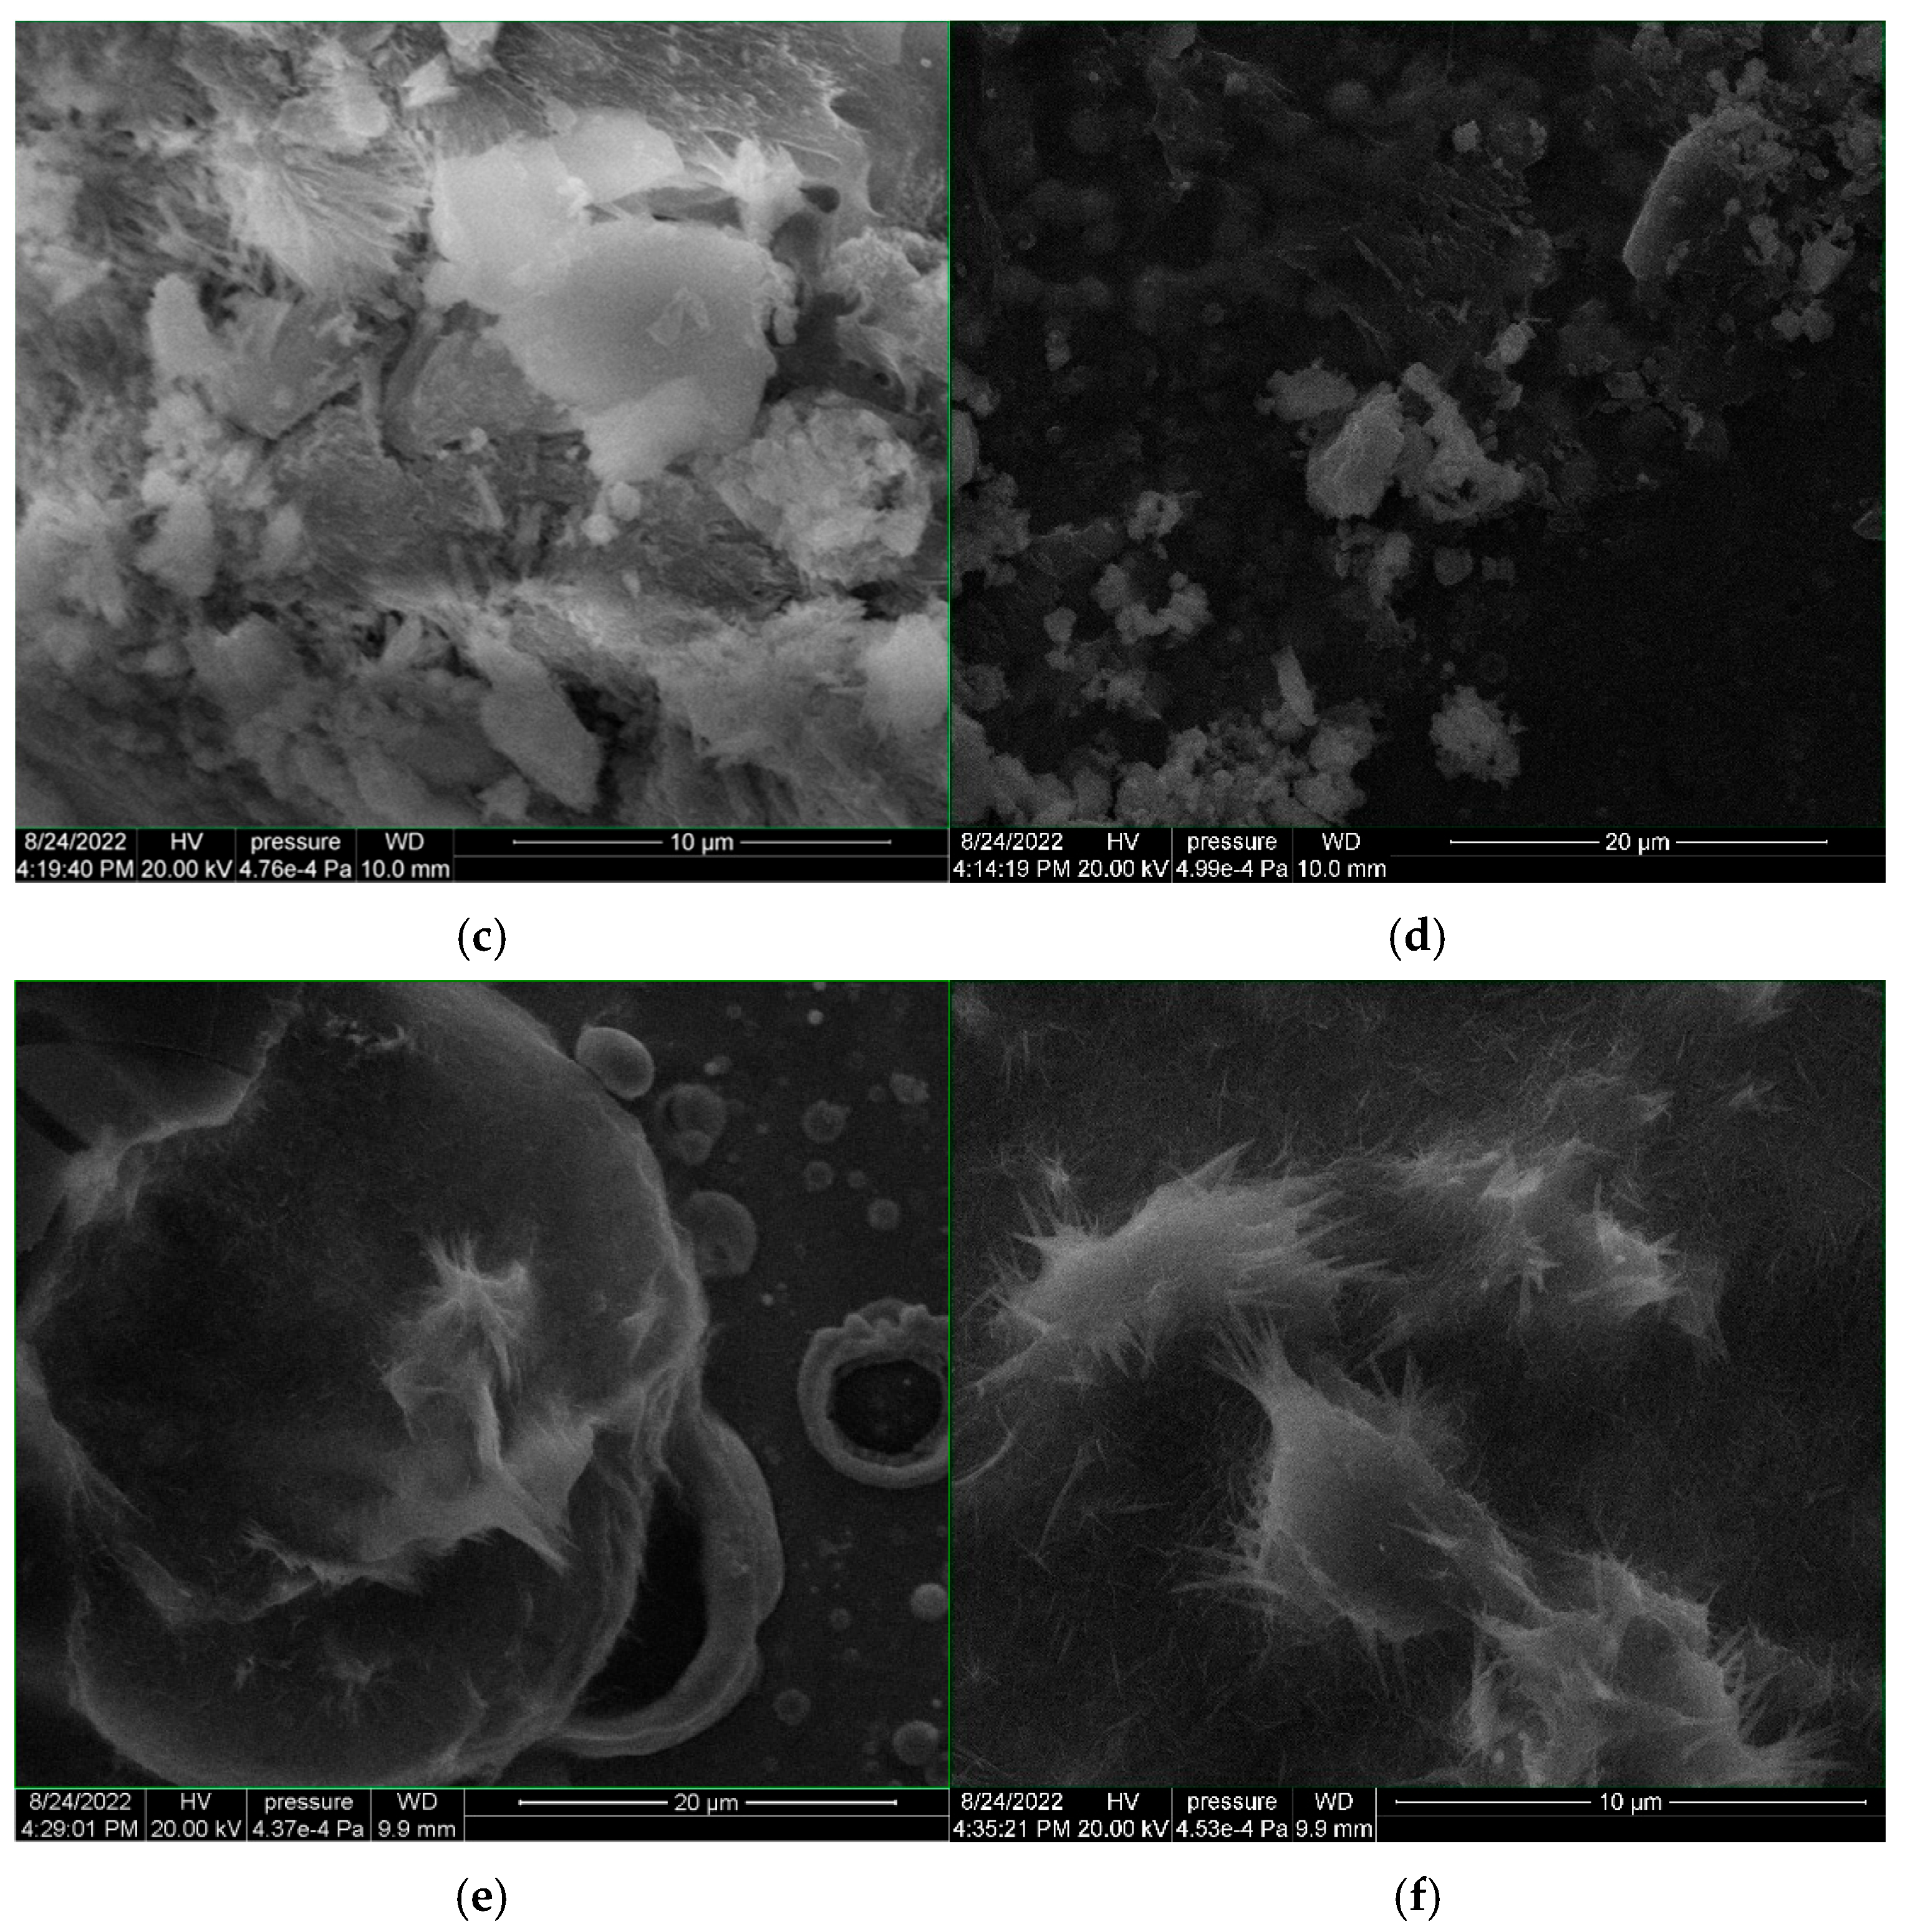
In the SEM images from Figure 3a,b, the Cu thin film is smoother and more uniform in its morphology compared to the Ag/Cu bilayer thin film. For the latter, the aspect of the surface is given by the top layer, which is silver, and it is similar to the thin film obtained in a previous study reported by Cocean et al., 2024 [17]. The Cu thin film [Figure 3a] presents round-shaped particles, similar to pearls of maximum 3 μm diameter that are in small number, and the large majority of the particles have diameters less than 1 μm, meaning hundreds of nanometers, as also Lorusso et al., 2023 reported for the thin films they obtained by PLD even though they used a UV laser beam and different parameters and conditions [4]. The silver thin film on top of the copper thin film in the Ag/Cu sample (Figure 3b) shows numerous structures in the range of 10–20 μm. These structures are explained as being the result of the fluid instabilities [17], and it can be seen that they are ring-shaped (crown-splash), pearl-shaped and aggregated structures. Most of the structures are around 5 μm in diameter and less. The difference between the surface morphology of the thin Cu film and that of Ag obtained by laser ablation and deposition lies in the efficiency of producing the fluid phase as well as in the quality of the fluid phase (lower viscosity) of copper compared to silver, as shown by the COMSOL simulation results presented in Section 3.1. The Cu-RB21 sample presents crystalline structures on all the analyzed areas (Figure 3c,d), reflecting a good dispersion of the RB21-NaHCO3 aqueous solution that could be influenced by the copper when compared with the lower dispersion that was obtained on the silver thin film reported by Adeloju et al., 1994 [14]. The good spreading of RB21-NaHCO3 aqueous solution can be explained by the copper dissolution due to NaHCO3, resulting in copper ions. The copper ions enter into reaction with the bicarbonate, replacing the sodium ions. However, the amount of copper that reacts is small due to the high reducing potential of copper compared to that of sodium [13]. Also, the morphology of the Cu thin film shows fewer droplet and crown splash type structures, and they are also smaller in size compared to those in the morphology of the Ag thin film [17] and the Ag/Cu bilayer thin film. The RB21-NaHCO3 on the Ag/Cu bilayer thin film (Figure 3e,f) appears to be less dispersed, similar to what was observed for the silver thin film [17].
Figure 3.
SEM images of the Cu thin film (a), Ag/Cu bilayer thin film (b) and the thin films treated with RB21-NaHCO3 aqueous solution: RB21-NaHCO3 on Cu thin film (c,d); RB21-NaHCO3 on Ag/Cu bilayer thin film (d,e). The deposits obtained by dripping the RB21-NaHCO3 solution onto the Ag/Cu bilayer thin film (e,f) exhibit acicular structures that do not resemble either those formed on the Ag thin film [17] or those obtained on the Cu thin film (b,c).
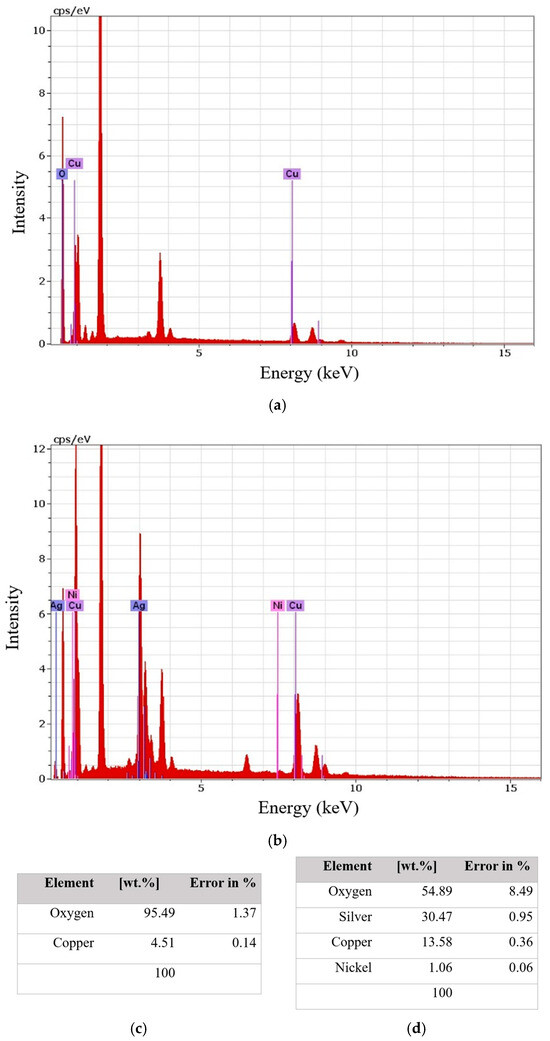
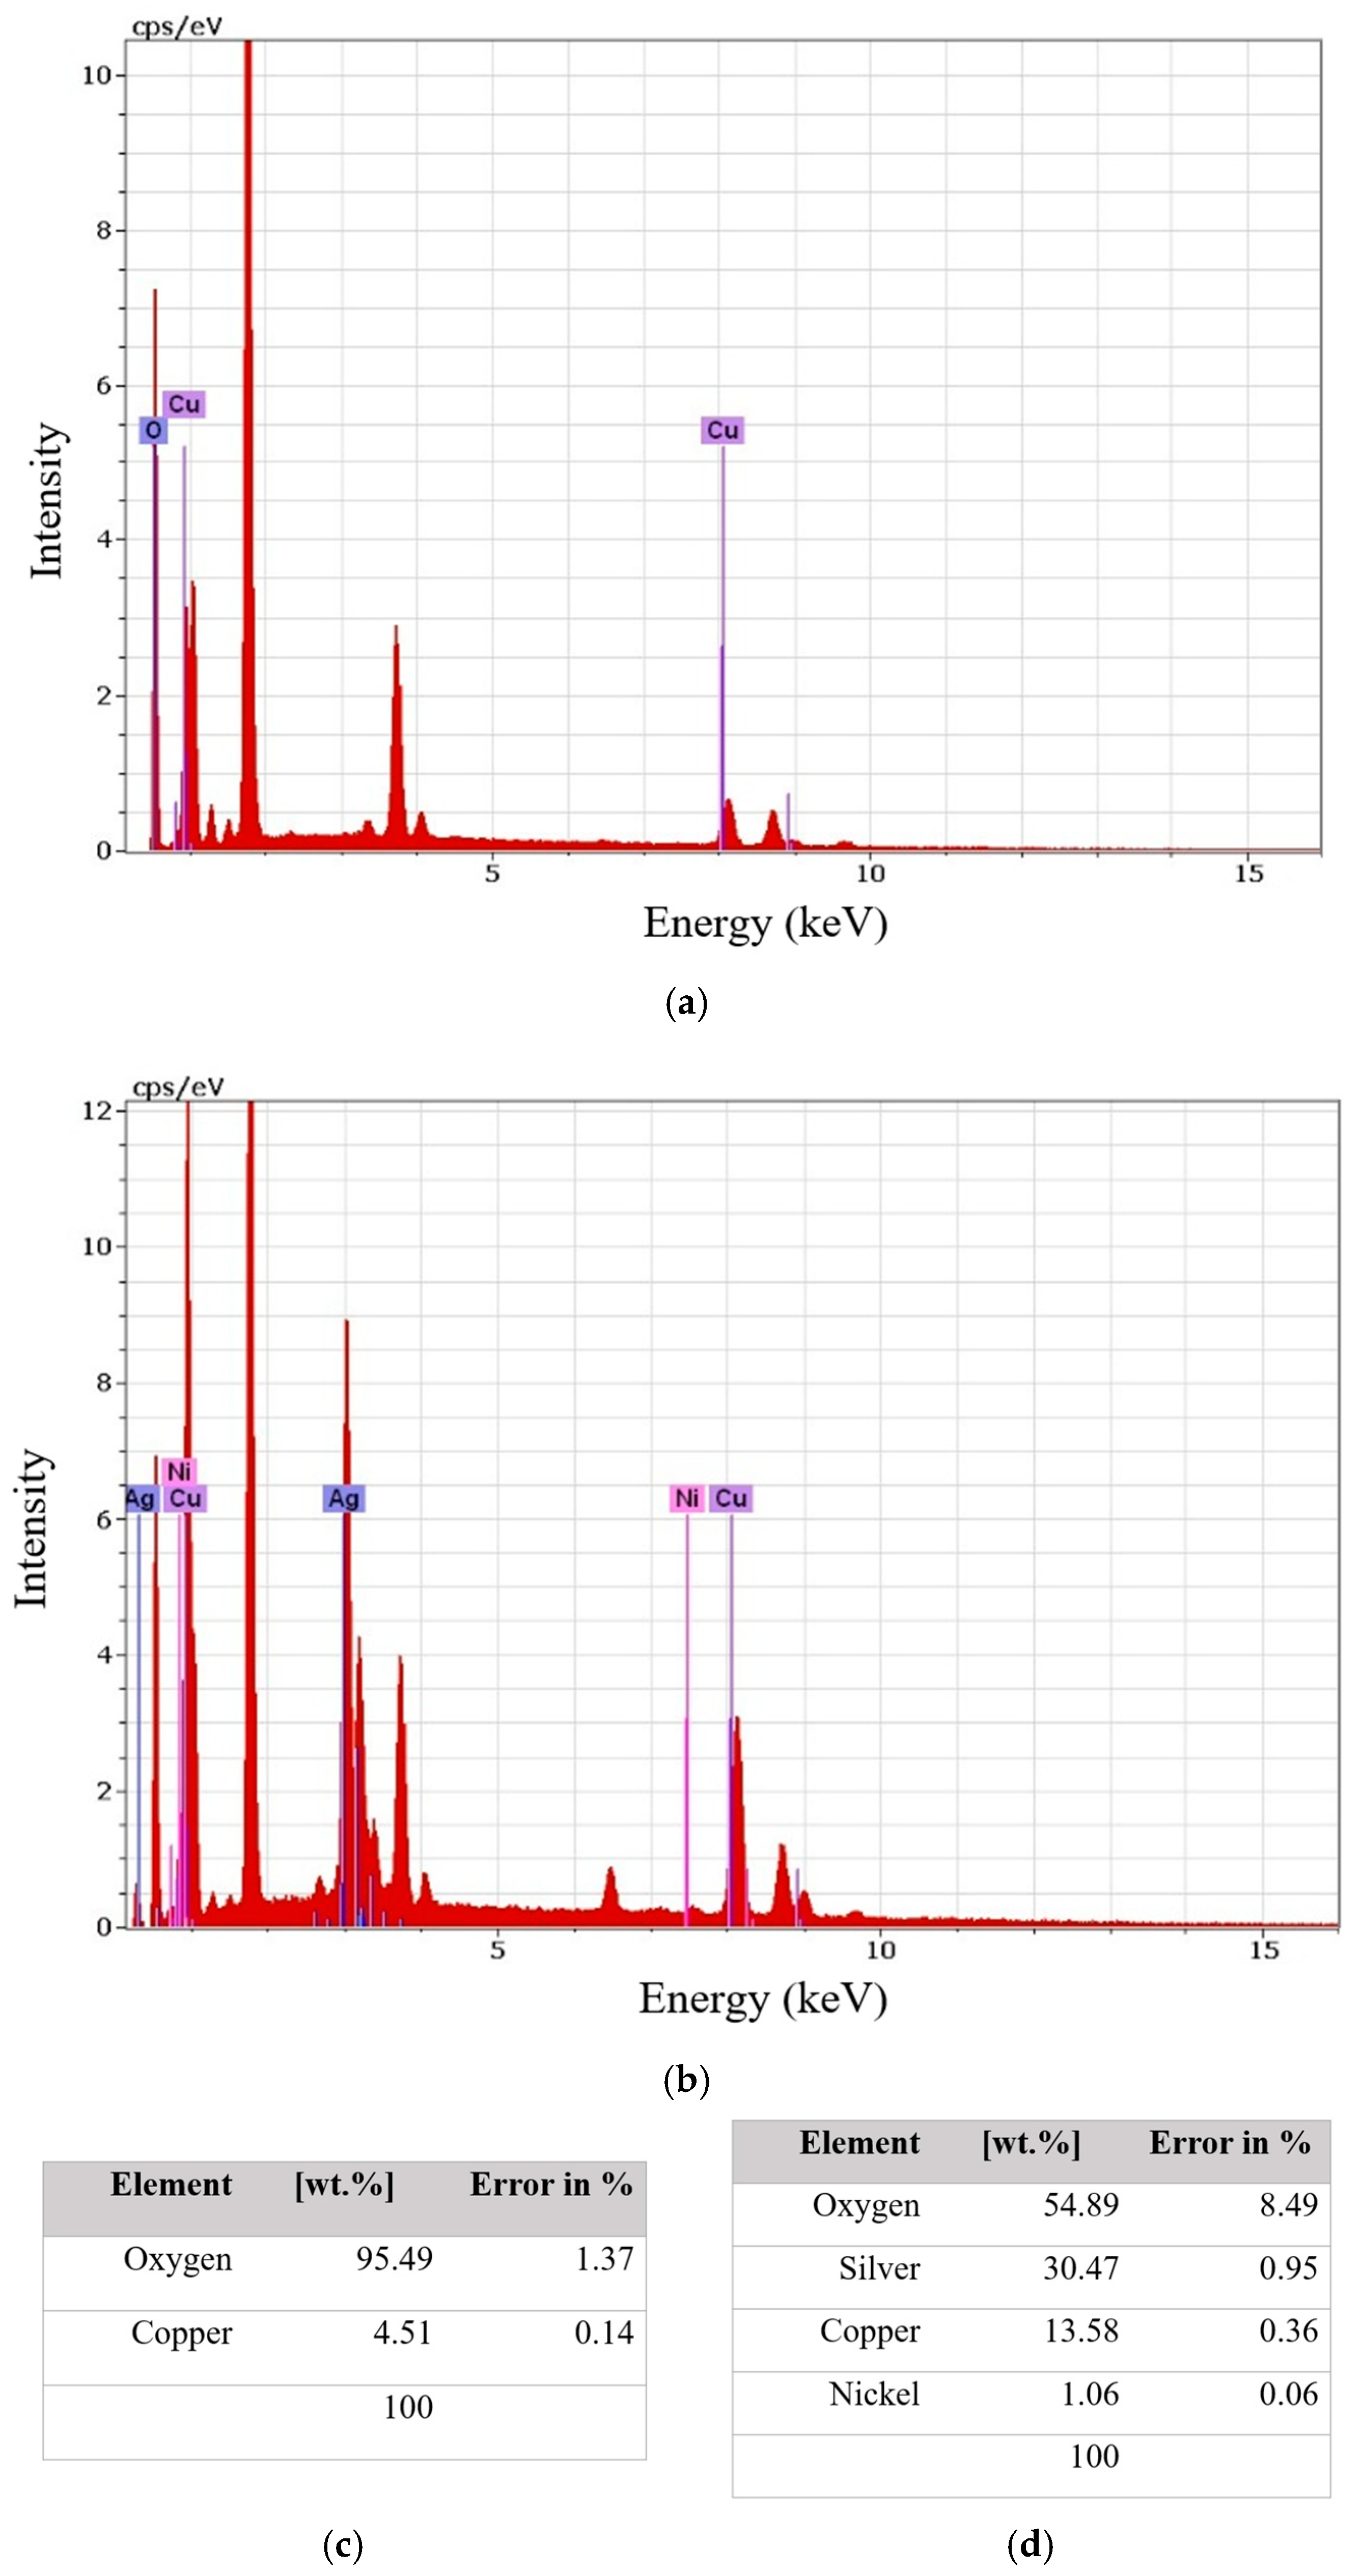
The EDS spectrum of the Cu thin film (Figure 4a,c) exhibits a strong oxygen signal of 95.5 wt.%. Since the PLD film has nanometer-scale thickness while the EDS interaction volume reaches several micrometers, the detected oxygen originates from both the native oxide formed after exposure to air and the underlying glass substrate. Therefore, the oxygen content should not be interpreted quantitatively as the composition of the deposited Cu thin film itself. Compared with the Ag/Cu bilayer thin film sample (52 wt.% O), the higher oxygen signal is nevertheless consistent with the greater tendency of copper to undergo surface oxidation under ambient conditions.
Figure 4.
EDS spectra of the Cu thin film (a) and of the Ag/Cu bilayer thin film; (b) Cu thin film elemental composition (c) and Ag/Cu bilayer thin film elemental composition showing also the impurities of Ni (d).
It should be noted that the Cu and Ag/Cu bilayer thin films deposited by PLD have nanometer-scale thicknesses (as will be shown in the Section 3.4), whereas the interaction volume of the electron beam during SEM-EDS analysis at 30 kV extends to approximately 3–5 μm. Since the films were deposited on a glass substrate (SiO2), which contains a high oxygen content, the measured oxygen signal includes contributions from both the thin film and the substrate. Therefore, the oxygen concentration determined by EDS should be interpreted qualitatively rather than as the exclusive oxygen content of the deposited layers.
3.3. FT-IR Spectroscopy
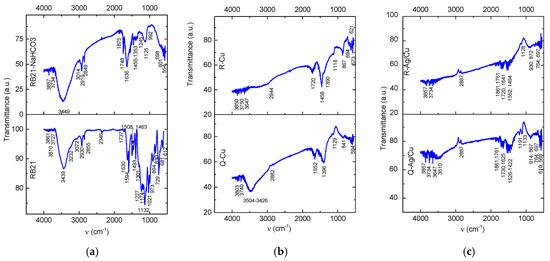
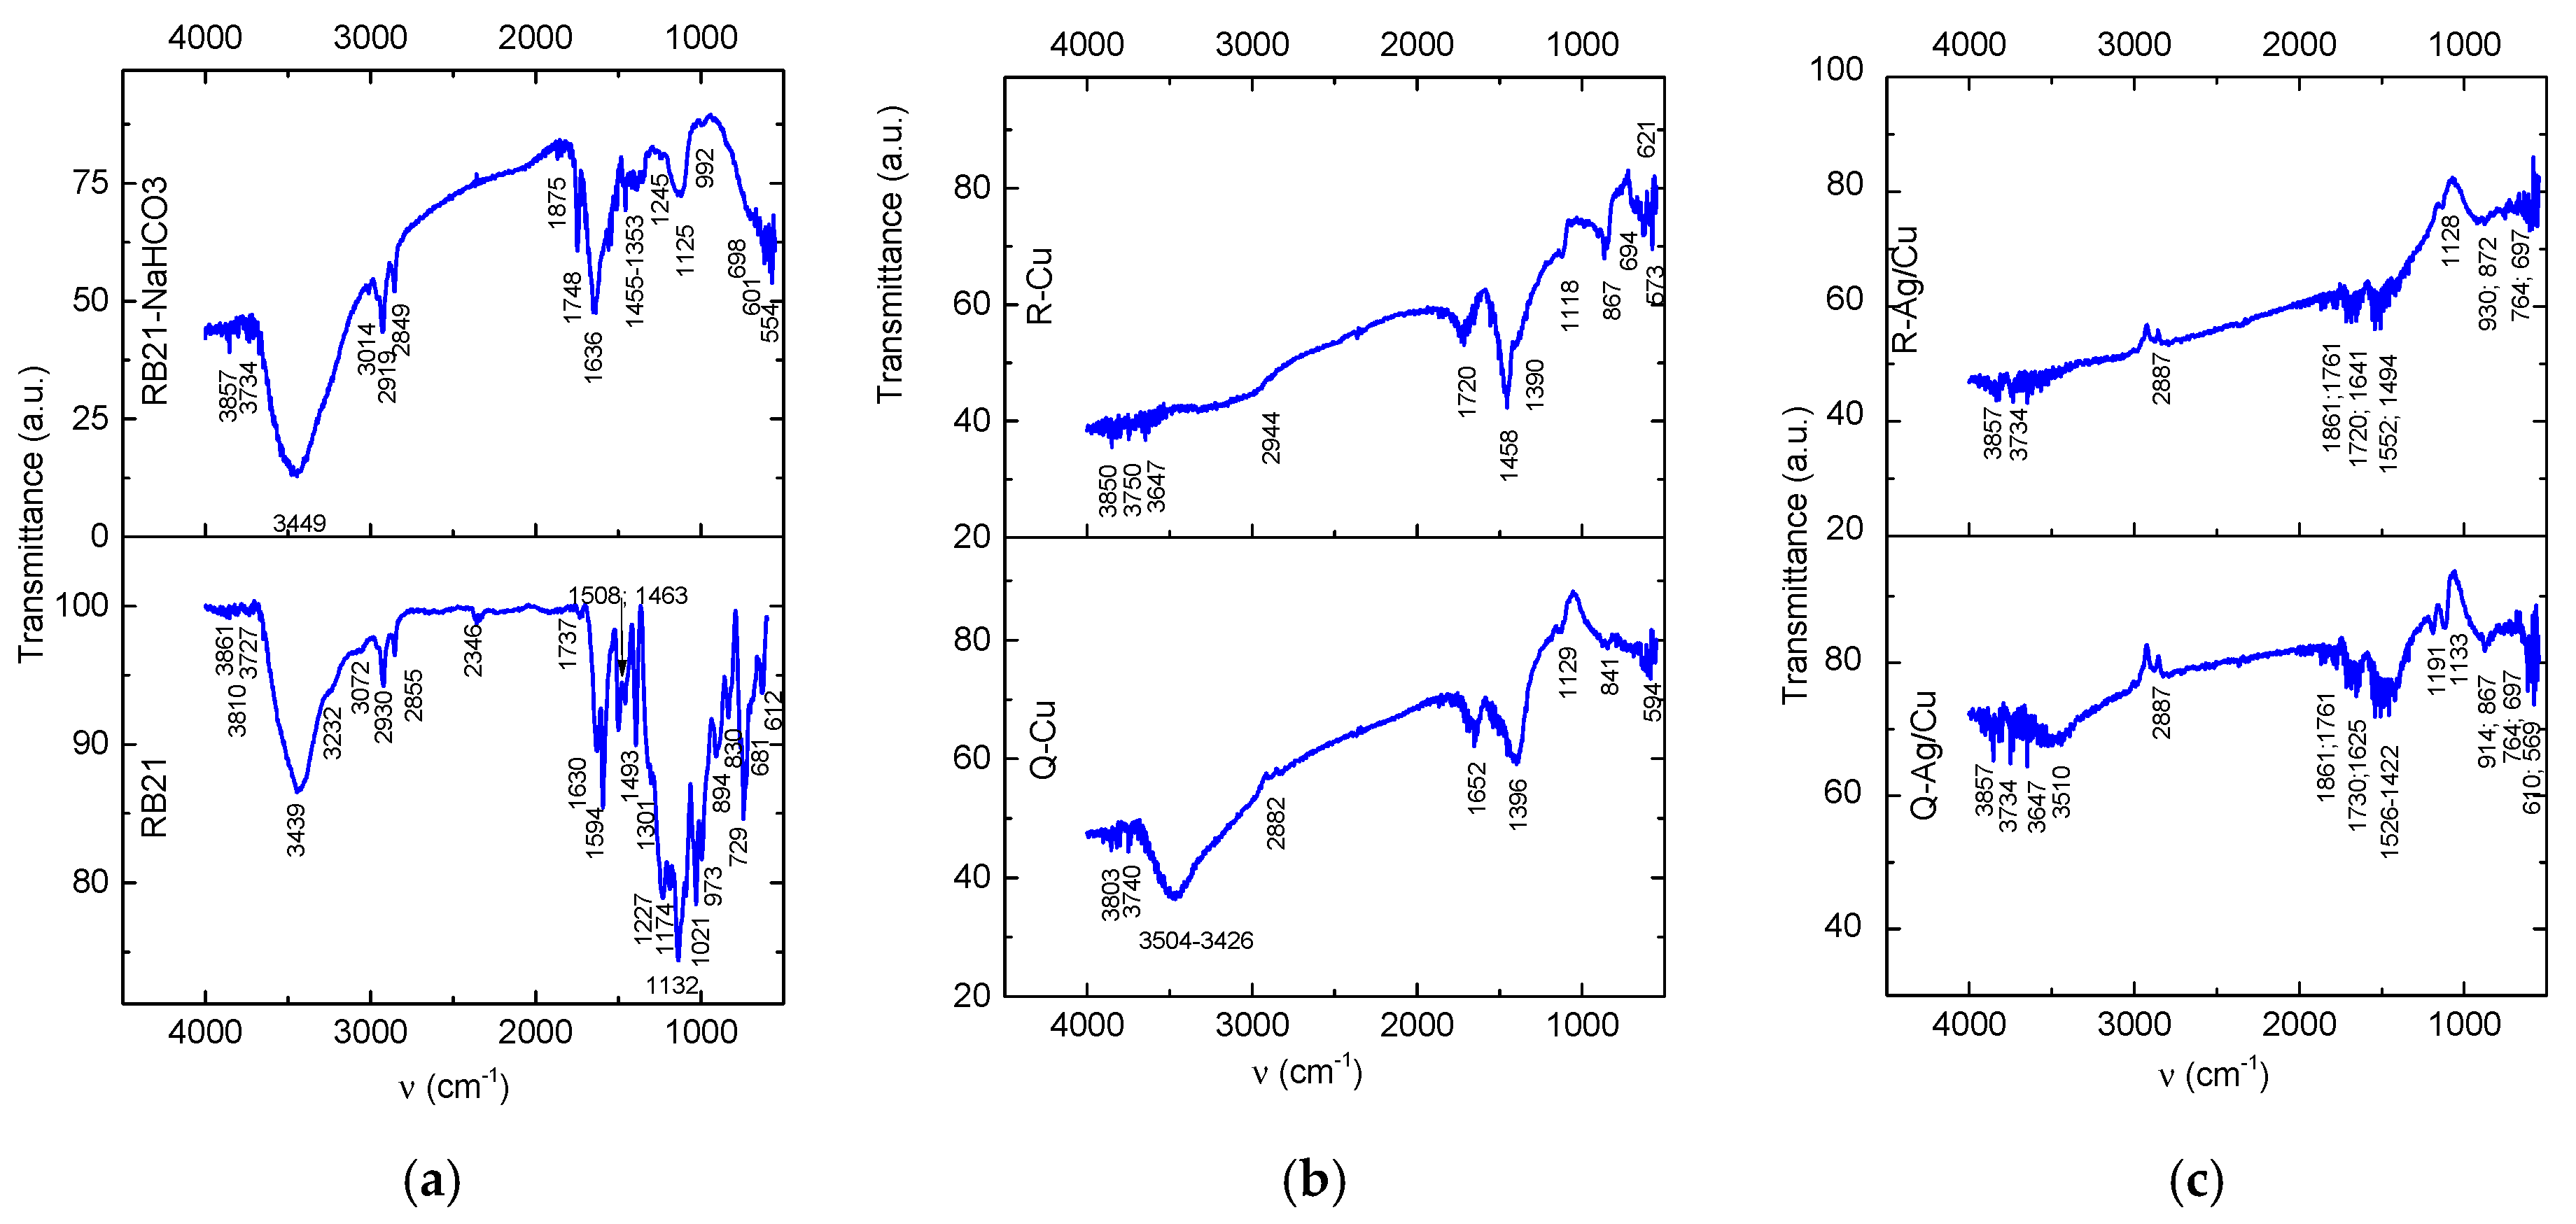
In the spectra presented in Figure 5 with the bands of vibration listed in Table 2, the bands assigned to O-H free stretching were noted at 3861 cm−1, 3810 cm−1, 3727 cm−1 (RB21), 3857 cm−1, 3734 cm−1 (RB21-NaHCO3), 3850 cm−1, 3760 cm−1, 3647 cm−1 (R-Cu), 3803 cm−1, 3740 cm−1 (Q-Cu), 3857 cm−1, 3734 cm−1 (R-Ag/Cu) and 3857 cm−1, 3743 cm−1, and 3647 cm−1 (Q-Ag/Cu). The O-H and N-H free and bonded strong stretching vibrations were observed at 3449 cm−1 (RB21) and 3439 cm−1 (RB21-NaHCO3) in the control samples, while bands reduced in intensity were noted at 3504 cm−1–3426 cm−1 and 3510 cm−1 for the Q-Cu and Q-Ag/Cu, respectively. They are missing for the R-Cu and R-Ag/Cu samples. These changes in the spectra indicate severe modification in both the chromophore and the chromogen structures. The vibrations assigned to N-H bending and to the pyrrole heteroatomic rings skeleton at 1594 cm−1 and 1508 cm−1 in RB21 are missing in RB21-NaHCO3, R-Cu and Q-Cu, but there are bands at 1552 cm−1 and 1526 cm−1 for R-Ag/Cu and Q-Ag/Cu, respectively, which can be assigned to nitro groups (N-O) stretching.
Figure 5.
FTIR spectra of the control samples RB21 and RB21–NaHCO (a); Q–Cu and R–Cu samples (b); and Q–Ag/Cu and R–Ag/Cu samples (c).
Table 2.
The FT–IR bands of vibrations of the functional groups in the RB21, RB21–NaHCO3 control samples and in the R–Cu, Q–Cu, R–Ag/Cu and Q–Ag/Cu samples.
The aromatic rings evidenced by the 3072 cm−1 C-H aromatic stretching for RB21 and 3014 cm−1 for RB21-NaHCO3 are no longer observed to R-Cu, Q-Cu, R-Ag/Cu and Q-Ag/Cu. They may not be visible because they overlap with the broadband in that area, which extends to the 2900 cm−1–2887 cm−1 aliphatic region in all spectra. This hypothesis is supported by the presence of vibrations at 1652 cm−1, 1641 cm−1, and 1625 cm−1 in the Q-Cu, R-Ag/Cu, and Q-Ag/Cu spectra, respectively, these vibrations being attributed to C-H aromatic bending vibrations. In the R-Cu spectrum, the band corresponding to the C-H bending is missing.
The aliphatic C-H stretching denoted by the medium-intensity doublet bands at 2930 cm−1, 2855 cm−1 in the RB21 spectrum and 2919 cm−1, 2849 cm−1 in the RB21-NaHCO3 (Figure 5a), become very weak and single in the tested samples: 2944 cm−1 (R-Cu), 2882 cm−1 (Q-Cu) and 2887 cm−1 (R-Ag/Cu and Q-Ag/Cu). In the fingerprint area, the corresponding bands for CH3 asymmetric and CH2 bending are indicated by the bands at 1493 cm−1, 1463 cm−1 in the RB21 spectrum, 1455 cm−1 in the RB21-NaHCO3; 1458 cm−1 (R-Cu), 1422 cm−1 (R-Ag/Cu) and 1494 cm−1 (Q-Ag/Cu) and for CH3 symmetric bending; they overlap with the sulfonic and sulfonamides groups for CH3 symmetric and CH2 bending at 1301 cm−1 (RB21), 1353 cm−1 (RB21-NaHCO3), 1390 cm−1 (R-Cu) and 1396 cm−1 (Q-Cu).
The Carbonate (CO32−) groups are evidenced in the RB21-NaHCO3 spectrum (Figure 5a) by the 1748 cm−1 and 1462 cm−1 bands, the latter also indicating the lattice modes [17]. The crystalline structure of the NaHCO3 is denoted by the ascending spectrum baseline, which is also assigned to the carbonates as Mie scattering effects, which are also observed for the R-Cu, Q-Cu, R-Ag/Cu and Q-Ag/Cu baselines of the spectra (Figure 5b,c). In the R-Cu, Q-Cu and R-Ag/Cu spectra, the C=O group in carbonates is denoted by the bands at 1861 cm−1, 1761 cm−1, 1730 cm−1 and 1720 cm−1, while in the Q-Ag/Cu spectrum, the band is missing.
The sulfonic groups (SO3) substituted on the copper (II) phthalocyanine chromophore and the sulfone groups (SO2) in the sulfonamides of the chromogen are denoted by the 1301 cm−1 in the RB21 spectrum and 1353 cm−1 in the RB21-NaHCO3 spectrum. In the R-Cu and Q-Cu spectra, the shifts of the bands at 1390 cm−1 and 1396 cm−1 (higher wavenumbers) can be assigned to transitions to sulfate groups (SO42−). In the R-Ag/Cu and Q-Ag/Cu spectra, the vibrations in the range of sulfonic and sulfone groups are missing, and no vibrations in the range of groups with sulfur and oxygen are observed. The absence in the spectra of the samples R-Cu, Q-Cu, R-Ag/Cu and Q-Ag/Cu of the C-N stretching vibrations noted at 1227 cm−1 for the RB21 dye and at 1245 cm−1 for the RB21/NaHCO3 also indicate changes in the copper phthalocyanine chromophore within the structure of C.I. Reactive Blue 21.
The changes in the RB21 dye IR spectrum (Figure 5a) in its interaction with the NaHCO3 denoted by the spectral bands for the RB21-NaHCO3 are found as being highly enhanced when the aqueous solution of the two compounds enter in contact with the thin films of copper (R-Cu and Q-Cu samples) and with the Ag/Cu bilayer thin films (R-Ag/Cu and Q-Ag/Cu). Both thin films induce chemical transformations of high aggressiveness on the RB21 dye, with decomposition results similar to each other and to those observed in the presence of the silver thin film presented earlier [17]. The catalytic effect of thin copper films and the Ag/Cu bilayer thin films is proven to be the same as it was for the thin silver film [17].
3.4. Profilometry
The topography of the surfaces of thin copper films and double silver/copper thin films produced by the PLD method was studied through the analysis of peak and valley profile measurements and the statistical calculation of characteristic parameters.
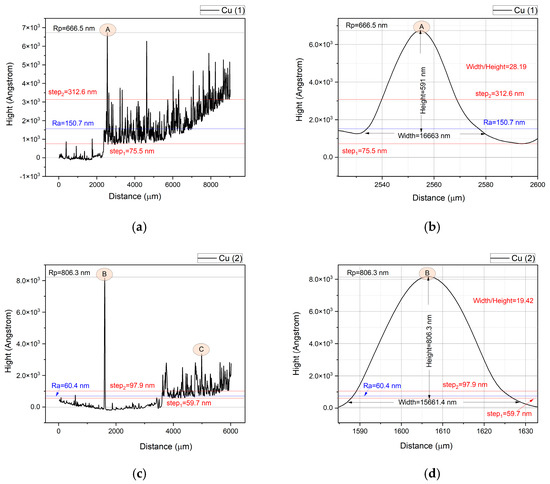
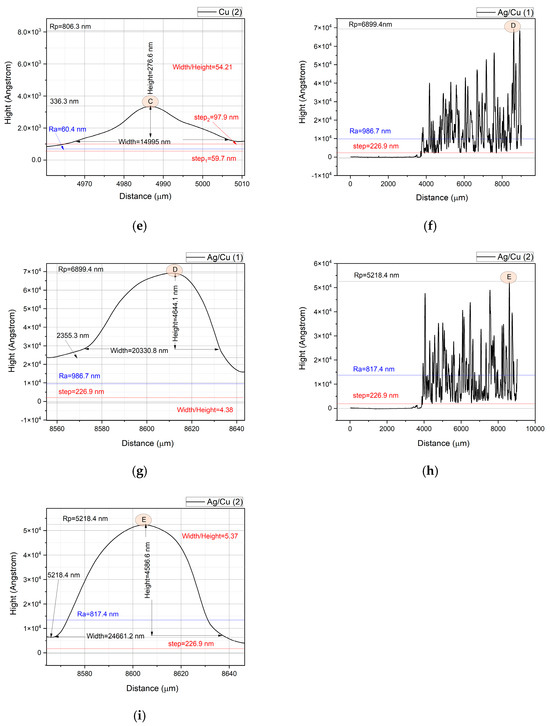
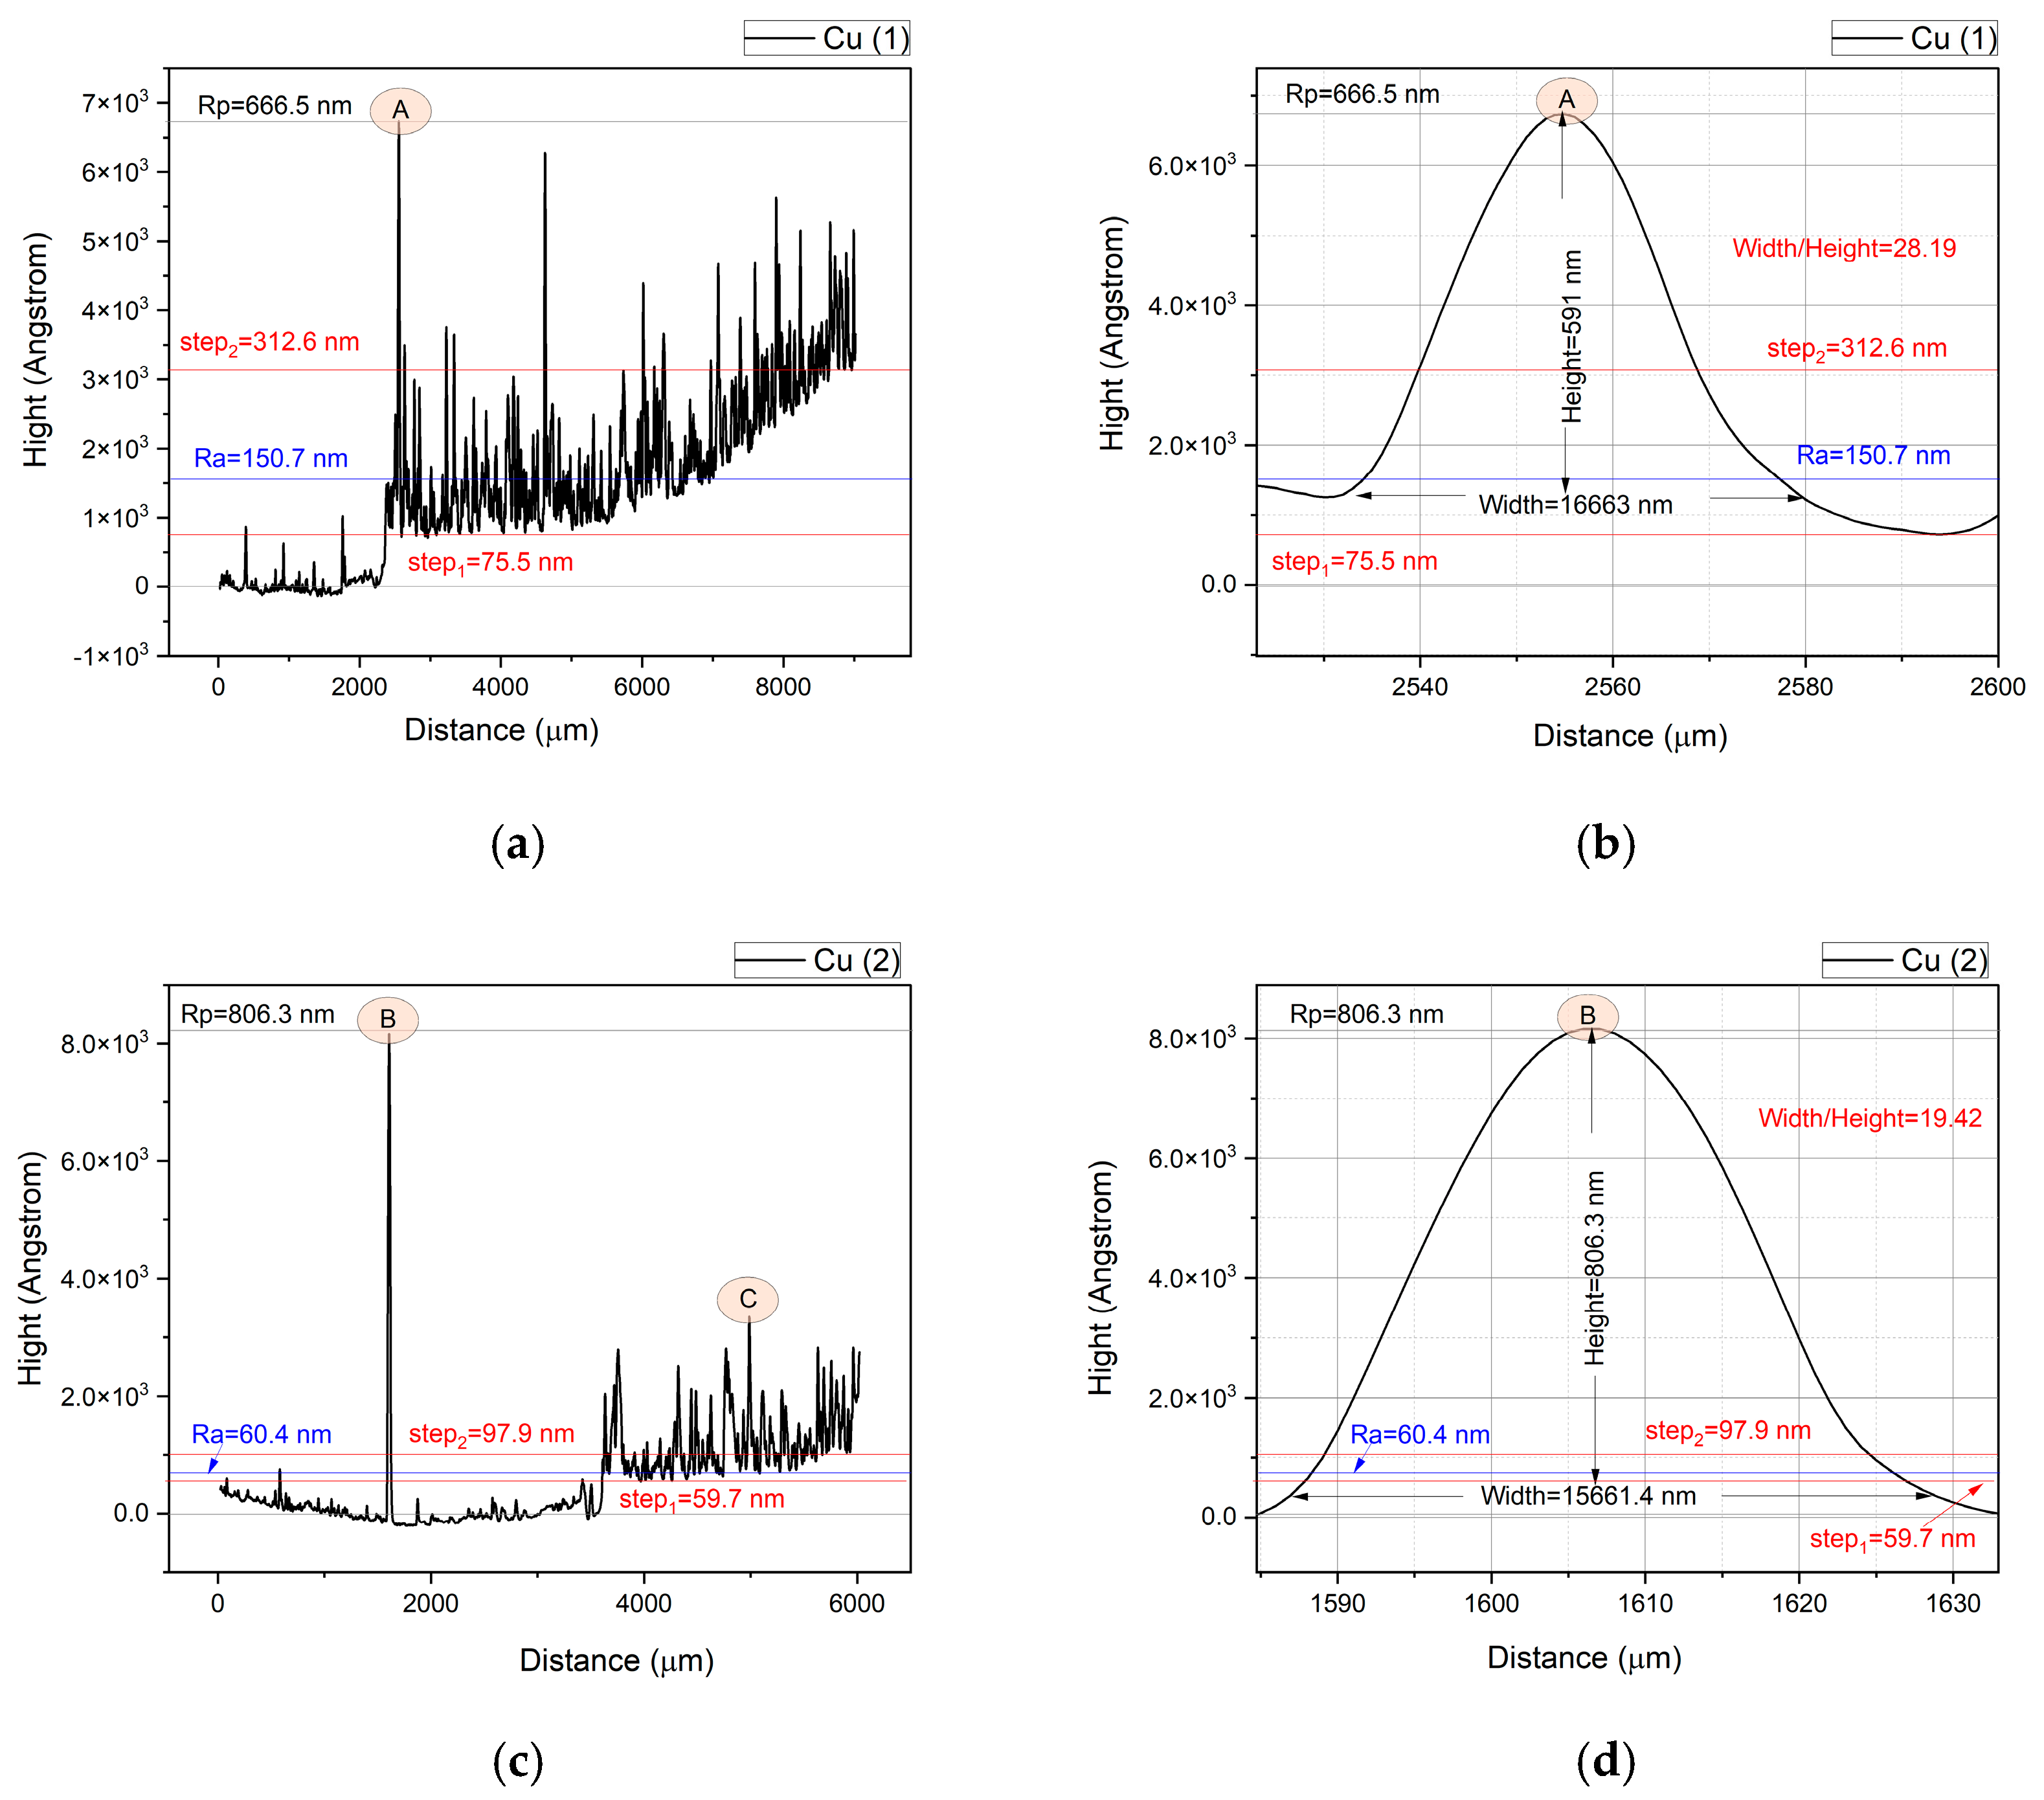
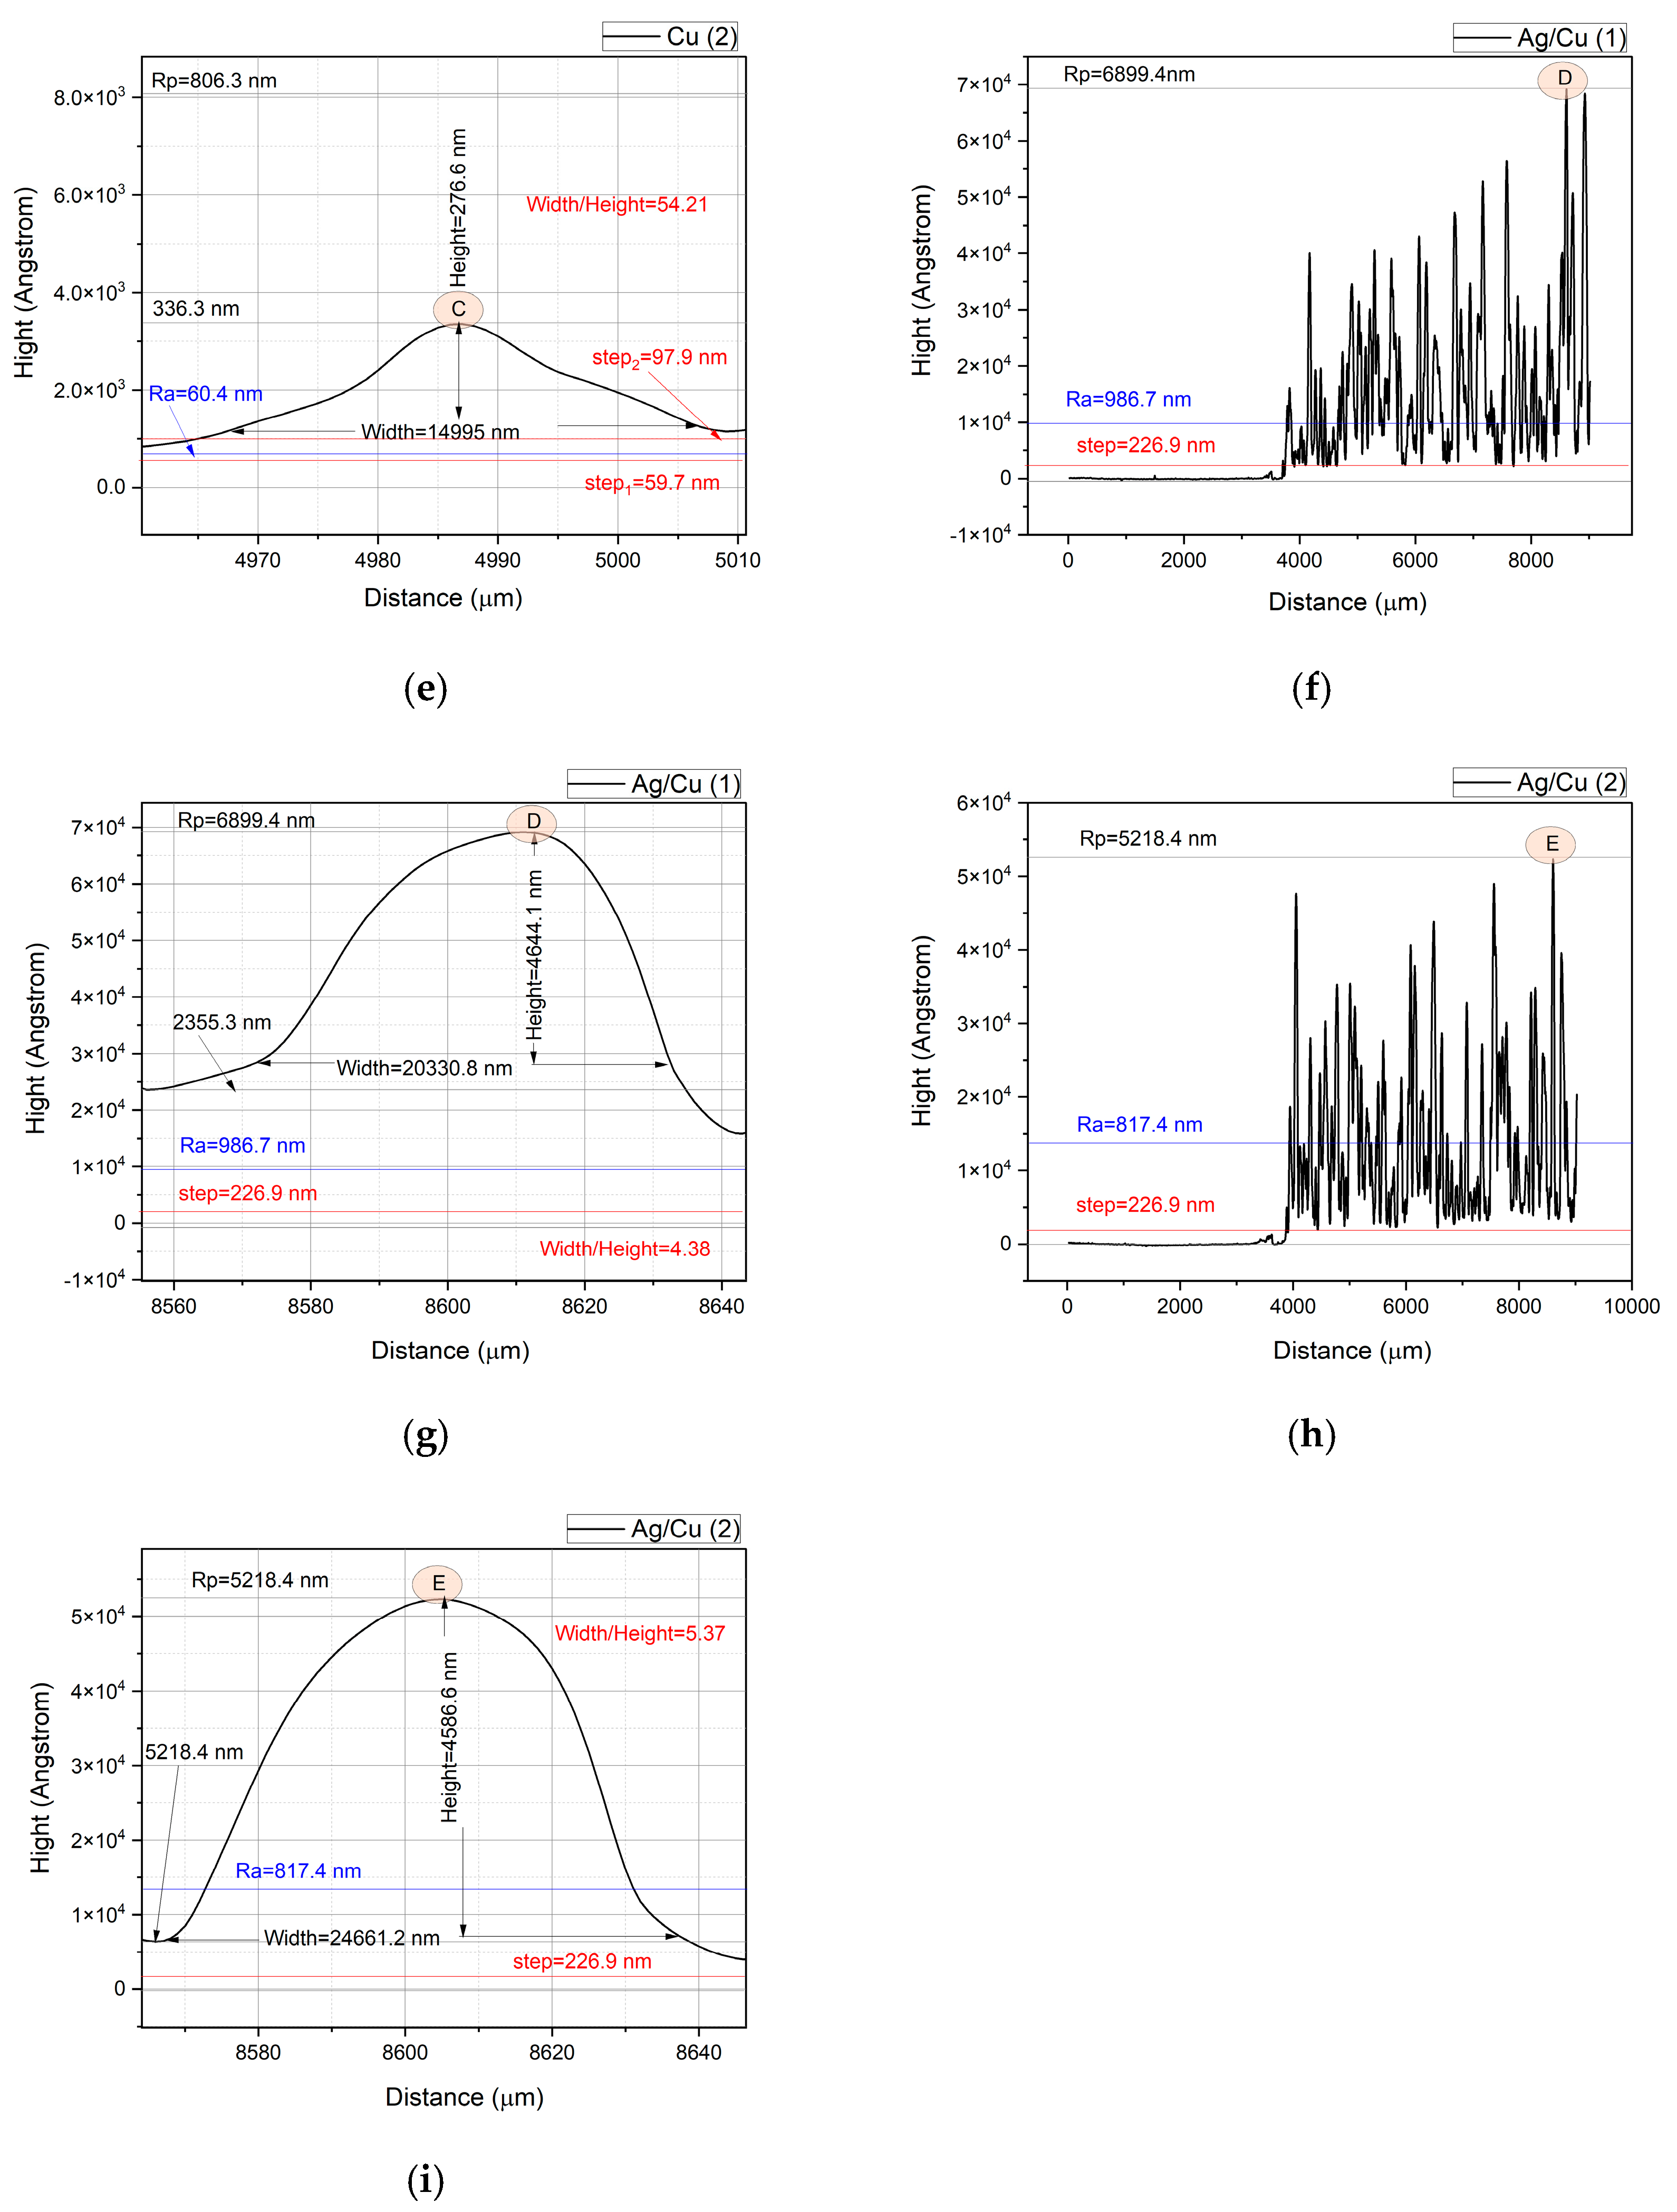
The thickness of the thin films was evaluated by measuring the profile starting from their edge, where it was possible to observe the step denoting the change in the height of the baseline of the profile. Thus, the copper thin film on the area denoted as Cu(1) shows a first step of 75.5 nm in height, and after 1 cm in length in a horizontal direction, the base line rises up to 312.6 nm in height (step 2) along an upward slanting direction (Figure 6a). This profile indicates that the deposition of the copper on the substrate is more concentrated, i.e., greater thickness, to the middle of the substrate used for thin film deposition. On a different area, Cu(2), the copper thin film presents the same pattern of the baseline, with only less difference between step1 (59.7 nm) and step2 (97.9 nm). Also, when compared the two areas on the copper thin film, Ra = 150.7 nm, which is the peaks’ arithmetical mean height of the Cu(1) area, is higher than Ra = 60.4 nm of the Cu(2) area, despite the Rp = 666.5 nm value of maximum peak height of the Cu(1) area being less than Rp = 806.3 nm of the Cu(2) area (Figure 6a,c). Regarding the thickness of the Ag/Cu bilayer thin film, the profiles of the two analyzed areas show a step of 226.9 nm corresponding to the edge of the thin film, following a horizontal direction of the baseline. The highest peaks of the surface profile of the Ag/Cu bilayer thin film have values of Rp = 6899.4 nm for Ag/Cu(1) and Rp = 5218.4 nm for the area Ag/Cu(2), which are approximately 10 times higher than those observed on the surface of the copper thin film. Also, the values of the arithmetic mean on the two areas on the surface of the Ag/Cu bilayer thin film are approximately 10 times higher, namely 986.7 nm on Ag/Cu(1) and 817.4 nm on Ag/Cu(2).
Figure 6.
The profiles of the Cu thin film on area 1 (a,b) and on area 2 (c–e) and of the double-layered Ag/Cu bilayer thin film on area 1 (f,g) and on area 2 (h,i). The step is the change in the height of the baseline, Rp is the maximum peak height, Ra is the arithmetical mean height level. The width and the height refer to the analyzed peaks.
To better understand the aspect of the roughness of the studied surfaces, peaks from the profile obtained through the measurements performed were analyzed. In this way, the proportions between the width and height (Width/Height ratio) of the peaks have values of 28.19 for the peak A on the Cu(1), 19.42 for the peak B on the Cu(2), 54.21 for the peak C on the Cu(2), 4.38 for the peak D of the Ag/Cu(1), and 5.37 for the peak D of the Ag/Cu(2) (Figure 6b,d,e,g,i). The calculated Width/Height ratios are the smallest, because the selected peaks are the maximum peaks on the analyzed surface area. The information obtained consists of the fact that, in general, droplets have Width/Height ratios much smaller than these. The Width/Height ratio shows that the width of the droplets on the surface of the thin copper film is much greater than their height. Comparatively, the Ag/Cu bilayer thin films show droplets with Width/Height ratios 4 to 10 times smaller, meaning that they present a more textured surface, with a higher solution retention capacity and a larger contact area with the liquid.
The parameters of the surface roughness of the measured areas on the two samples of thin films are presented in Table 3.
Table 3.
The thickness and parameters of the surface roughness of Cu areas 1 and 2 and of Ag/Cu areas 1 and 2.
The roughness of all the analyzed areas of the samples—Cu(1), Cu(2), Ag/Cu(1) and Ag/Cu(2)—is characterized by a positive skewness (Rsk > 0). In the right-skewed (positively skewed) distribution, most data points cluster on the left, with a long tail to the right. The tails represent the probability or frequency of values that are extremely high or low compared to the mean. This means a few unusually high values pull the mean upward, and it indicates that a larger number of peaks are below the mean line of the roughness.
Kurtosis as a measure of the tailedness of a distribution shows how often outliers occur. The kurtosis variation for the Cu thin film surface roughness from Rku = 2.76 to 13.48 on the two measured areas indicates non-uniform distribution of the peaks and pits (extreme values) from a platykurtic (thin tails) distribution (Rku < 3) to a high leptokurtic (fat tails) distribution (Rku >> 3). That means that some areas the Cu thin film present fewer peaks and valleys than a normal distribution and more peaks and valleys than the normal distribution on other areas. The kurtoses of 6.08 and 5.34 of the two areas measured on the Ag/Cu bilayer thin film show a leptokurtic (thin tails) distribution of the extreme values [25].
The profile analysis of the two thin films complements the analysis of surface morphology using the SEM technique, providing information about the surface relief and ability of the thin films to retain the aqueous solutions with which they are treated. The results of the roughness measurements are consistent with the estimates obtained by simulating the laser irradiation process of the two targets, the production of the fluid phase, and its quality in the ablation process.
Subsequently, the analysis of the profile of the two thin films after treatment aims to evaluate how the aqueous RB21-NaHCO3 solution produces corrosion on their surfaces.
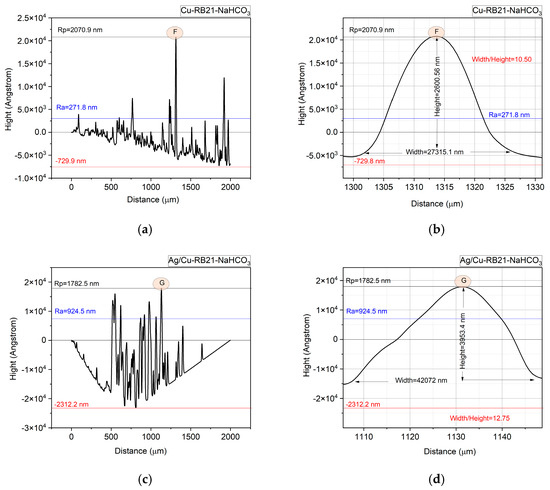
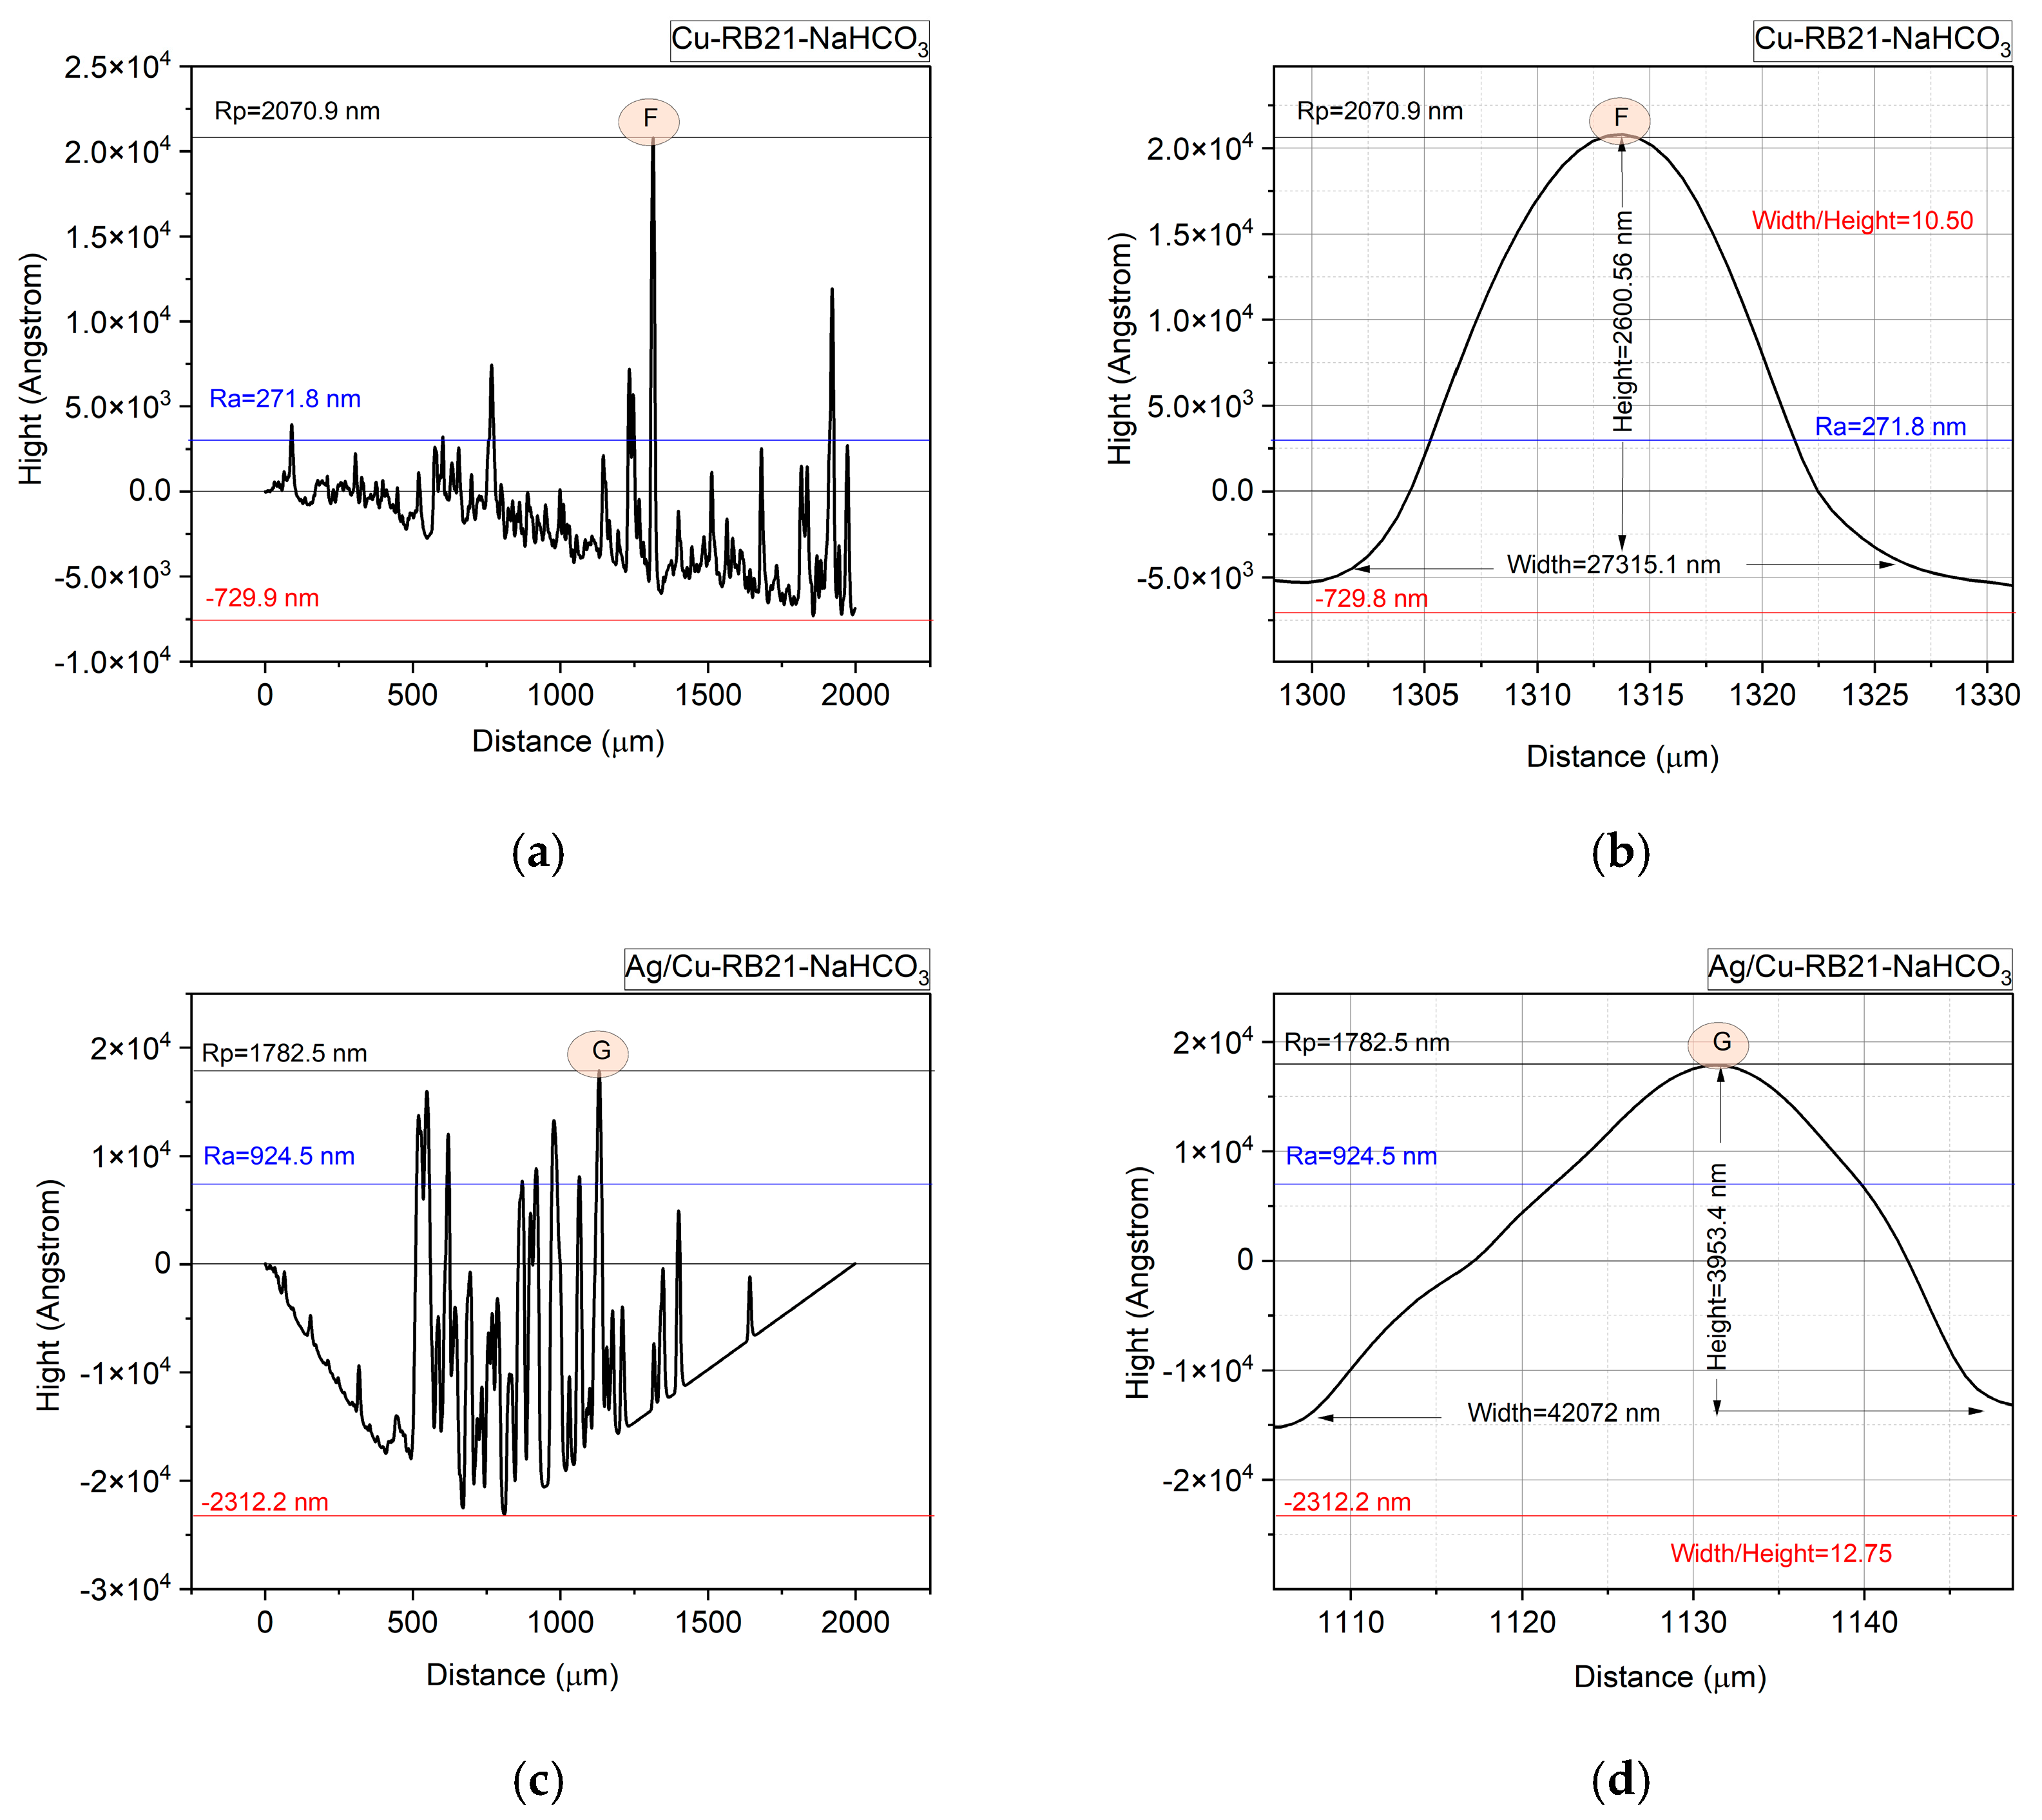
The profiles after treatment with RB21-NaHCO3 (Figure 7) show a high degradation of the Cu thin film and of the Ag/Cu bilayer thin film. The corrosive effect of the treatment solution on the thin layers of Cu and the Ag/Cu bilayer thin film is highlighted by the baseline that slopes downward to the right for the thin Cu thin film and by a deep valley in the case of the Ag/Cu bilayer thin film, where residual peaks are observed, probably from the thin layer prior to treatment with the solution. The changes in the height of the maximum peak after treatment at the value of Rp = 2070.9 nm for Cu-RB21-NaHCO3 show an increase of approximately three times compared to that determined on the copper thin film, and at the value of Rp = 1782.5 nm for Ag/Cu-RB21-NaHCO3, which shows a decrease of almost 4 times compared to the bilayer thin film. These are due to the different actions of the RB21-NaHCO3 solution on the surfaces of copper and silver in modifying their roughnesses. Regarding the mean values, a significant change is observed for the Cu-RB21-NaHCO3 sample, for which the arithmetic mean of the height Ra = 271.8 nm represents an increase of almost 2 times and more than 4 times compared to the initial thin film, while the mean value Ra = 924.5 nm of the Ag/Cu-RB21-NaHCO3 sample remained almost the same as the initial thin film. Thus, it can be deduced that corrosion occurred in the pits (valleys), also due to changes in the size of the pits. In this regard, increases in the maximum pit height value were recorded, 35 times higher for the Cu-RB21-NaHCO3 sample, for which Rv = 730.6 nm, compared to the initial thin copper film, for which Rv = 20.6 nm; meanwhile, for the Ag/Cu-RB21-NaHCO3 sample, the maximum pit height value Rv = 2311.6 nm is 70 times higher than Rv = 33 nm recorded for the initial double Ag/Cu bilayer thin film.
Figure 7.
Profiles of the thin films after treatment with RB21 dye and NaHCO3 aqueous solution: Cu-RB21-NaHCO3 (a,b) and Ag/Cu-RB21-NaHCO3 (c,d).
By calculating the Width/Height ratios for the highest peak in the roughness profiles for the two thin layers after treatment with the aqueous RB21-NaHCO3 solution, values of 10.50 are obtained for the Cu-RB21-NaHCO3 sample and 12.75 for the Ag/Cu-RB21-NaHCO3 sample. These results show a decrease of 2 to 5 times in the Width/Height ratio for Cu-RB21-NaHCO3 and an increase of 2 times for Ag/Cu-RB21-NaHCO3.
The left-skewed (negatively skewed) results obtained for the roughnesses of the two films after treatment with RB21–NaHCO3 aqueous solution (Table 4) show that most data points cluster on the right, with a long tail to the left. A few unusually low values pull the mean downward. The negative skewness (Rsk < 0) resulting for the Cu-RB21-NaHCO3 sample and for the Ag/Cu-RB21-NaHCO3 sample shows that both thin films were subjected to notable corrosive degradation, which led to the arrangement of several peaks below the median line, in contrast to the positive skewness noticed for the thin films before their treatment with the RB21-NaHCO3 solution. Corrosion occurred over the entire surface of the thin copper film, as well as with the formation of pits in the case of the thin Ag/Cu film, as can be seen in Figure 7a,c. The pitting effect on the bilayer Ag/Cu thin film is linked to its rougher surface, which was highlighted by the smaller width/height ratio.
Table 4.
Parameters of the surface roughness of the Cu-RB21-NaHCO3 sample and of the Ag/Cu-RB21-NaHCO3 sample.
The kurtosis value of Rku = 5.65 for the Cu-RB21-NaHCO3 being greater than 3 indicates that the distribution of the extreme values is leptokurtic (fat tails) [19], while Rk = 1.94 for the Ag/Cu-RB21-NaHCO3 shows that the distribution of the extreme values is platykurtic (thin tails) [25].
Comparing the profilometric results of the surface roughness of the studied films for the initial thin films and after their treatment with the RB21-NaHCO3 solution, it can be observed that corrosion reduced the extreme values, also leading to the lowering of the peaks to a level below the mean line. Also, the fact that the corrosion process led to the increase in the depth of the pits on the surface of the thin films is due to the accumulation and longer retention of the solution in the pits, which allows the chemical process to take place for a longer period of time.
3.5. Optical Microscopy (OM)
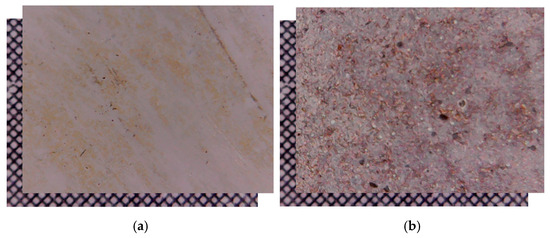
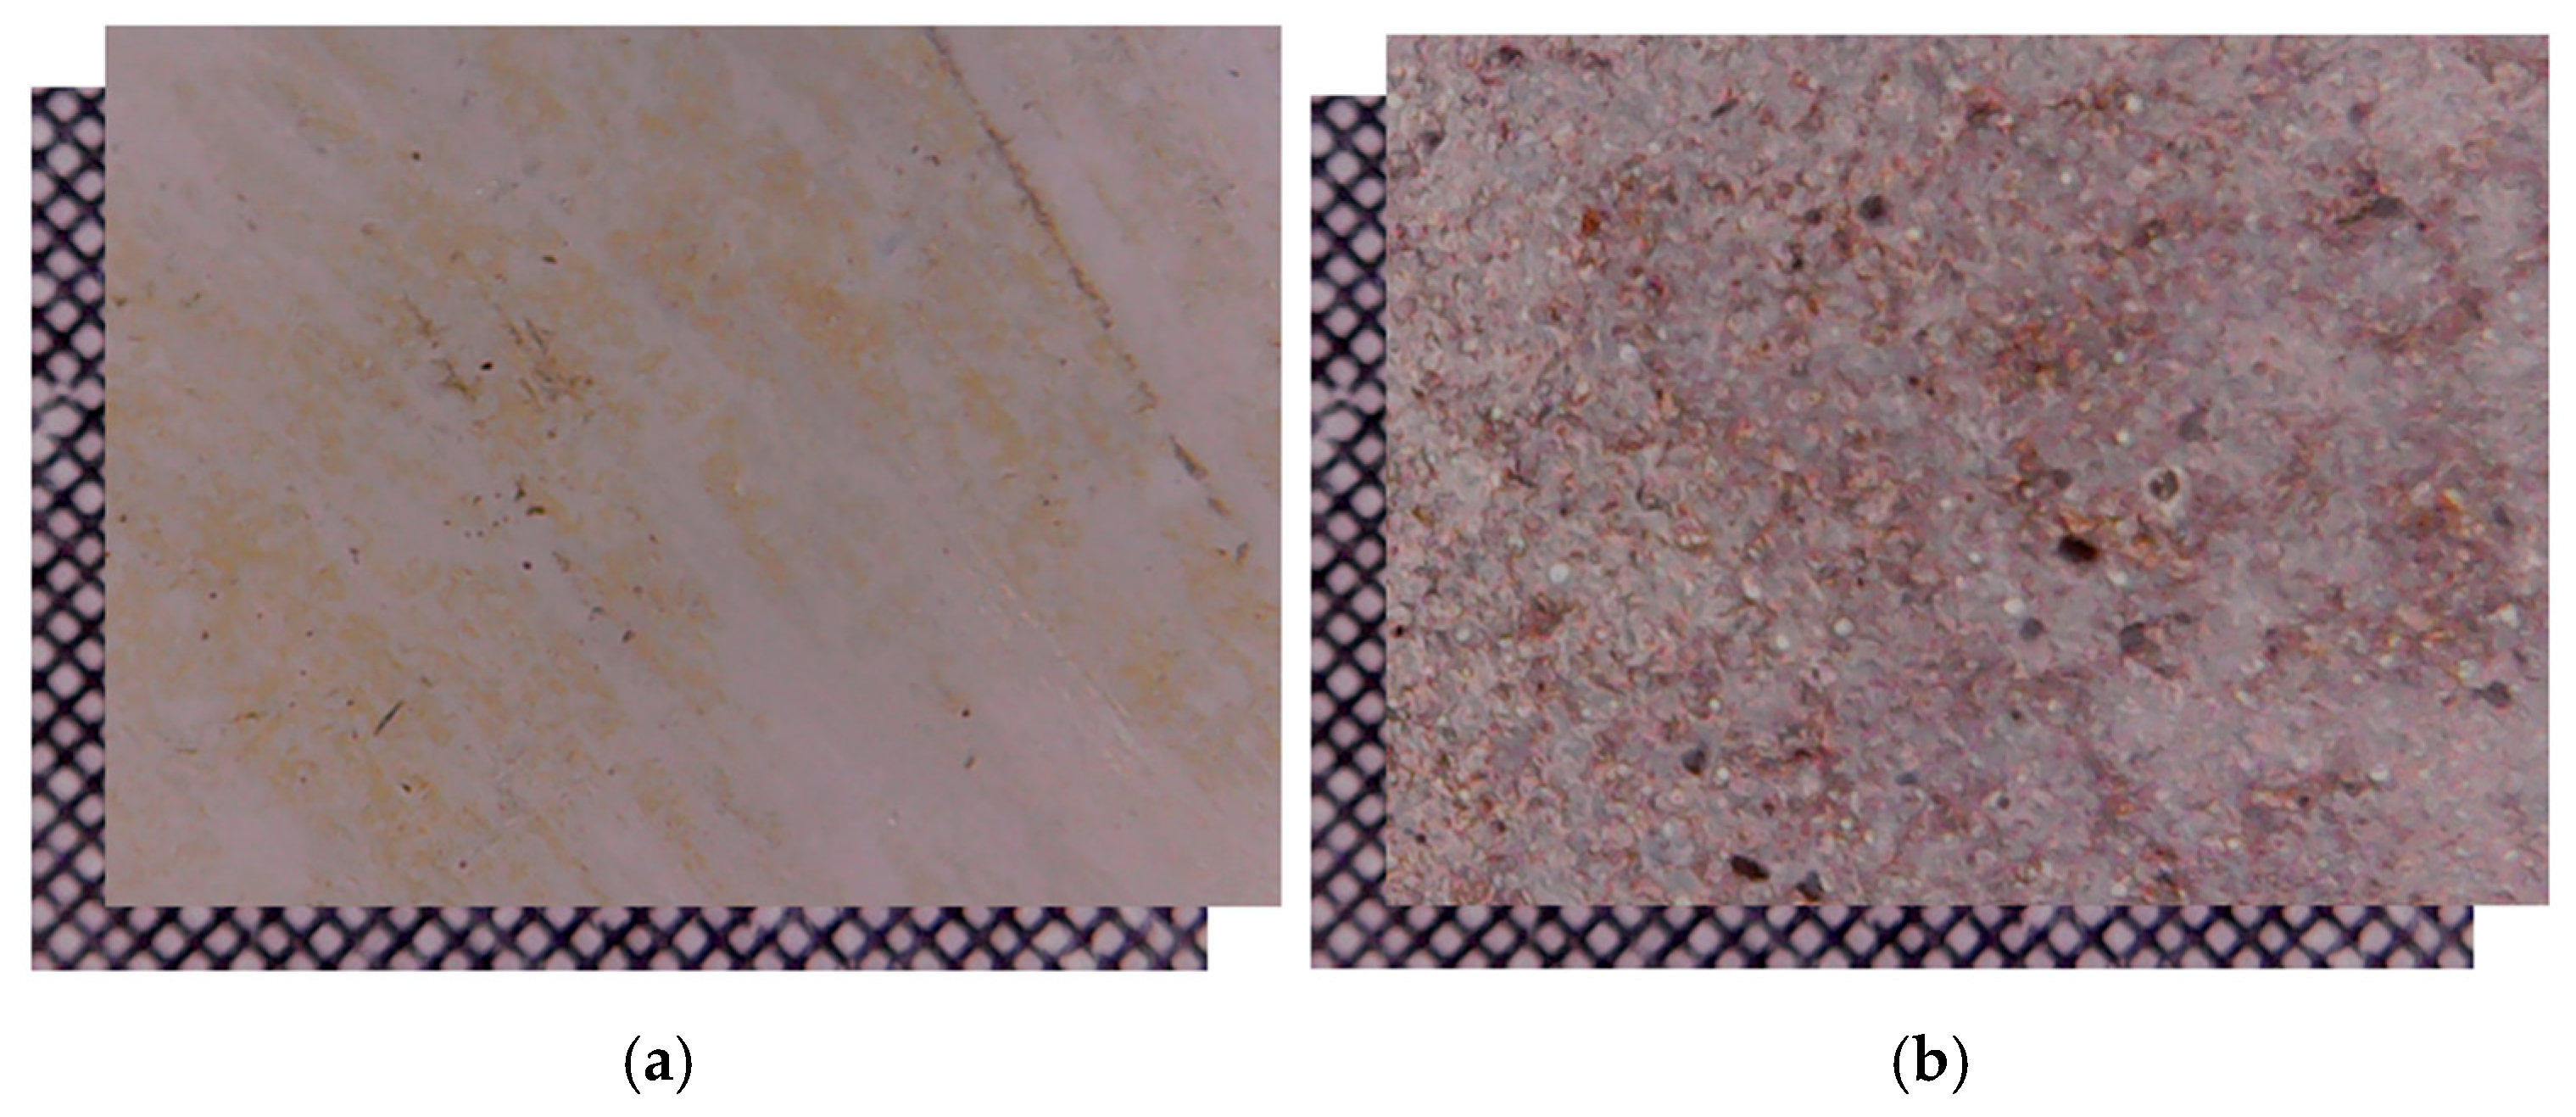
Optical microscopy (OM) highlighted high corrosion on the Cu-RB21-NaHCO3 sample resulting from the thin copper film after treatment with an aqueous RB21-NaHCO3 solution, as observed in Figure 8a, while the Ag/Cu-RB21-NaHCO3 sample resulting from the treatment of the Ag/Cu bilayer thin film with an aqueous RB21-NaHCO3 solution (Ag/Cu-RB21-NaHCO3), as seen in Figure 8b, shows a more compact structure that can be attributed to lower corrosion.
Figure 8.
OM images of the copper thin film after treatment with RB21-NaHCO3 aqueous solution (Cu-RB21-NaHCO3) (a) and of the double-layered Ag/Cu bilayer thin film after treatment with RB21-NaHCO3 aqueous solution (Ag/Cu-RB21-NaHCO3) (b) compared with a grid scale of 0.1 × 0.1 mm.
The OM images are consistent with the results of the SEM analysis and with the roughness measurements, which also show that the RB21-NaHCO3 solution produced more pronounced corrosion on the thin copper film than on the thin double Ag/Cu bilayer thin film.
3.6. UV–Vis Spectroscopy
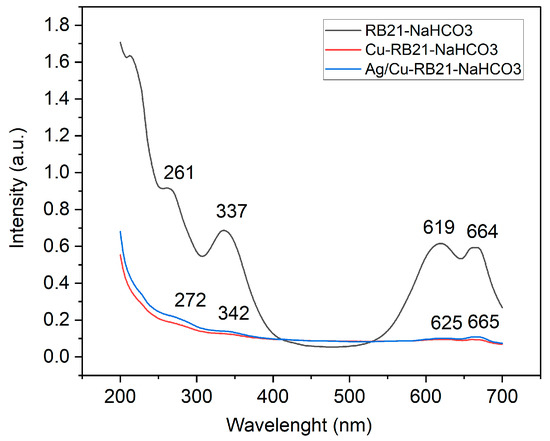
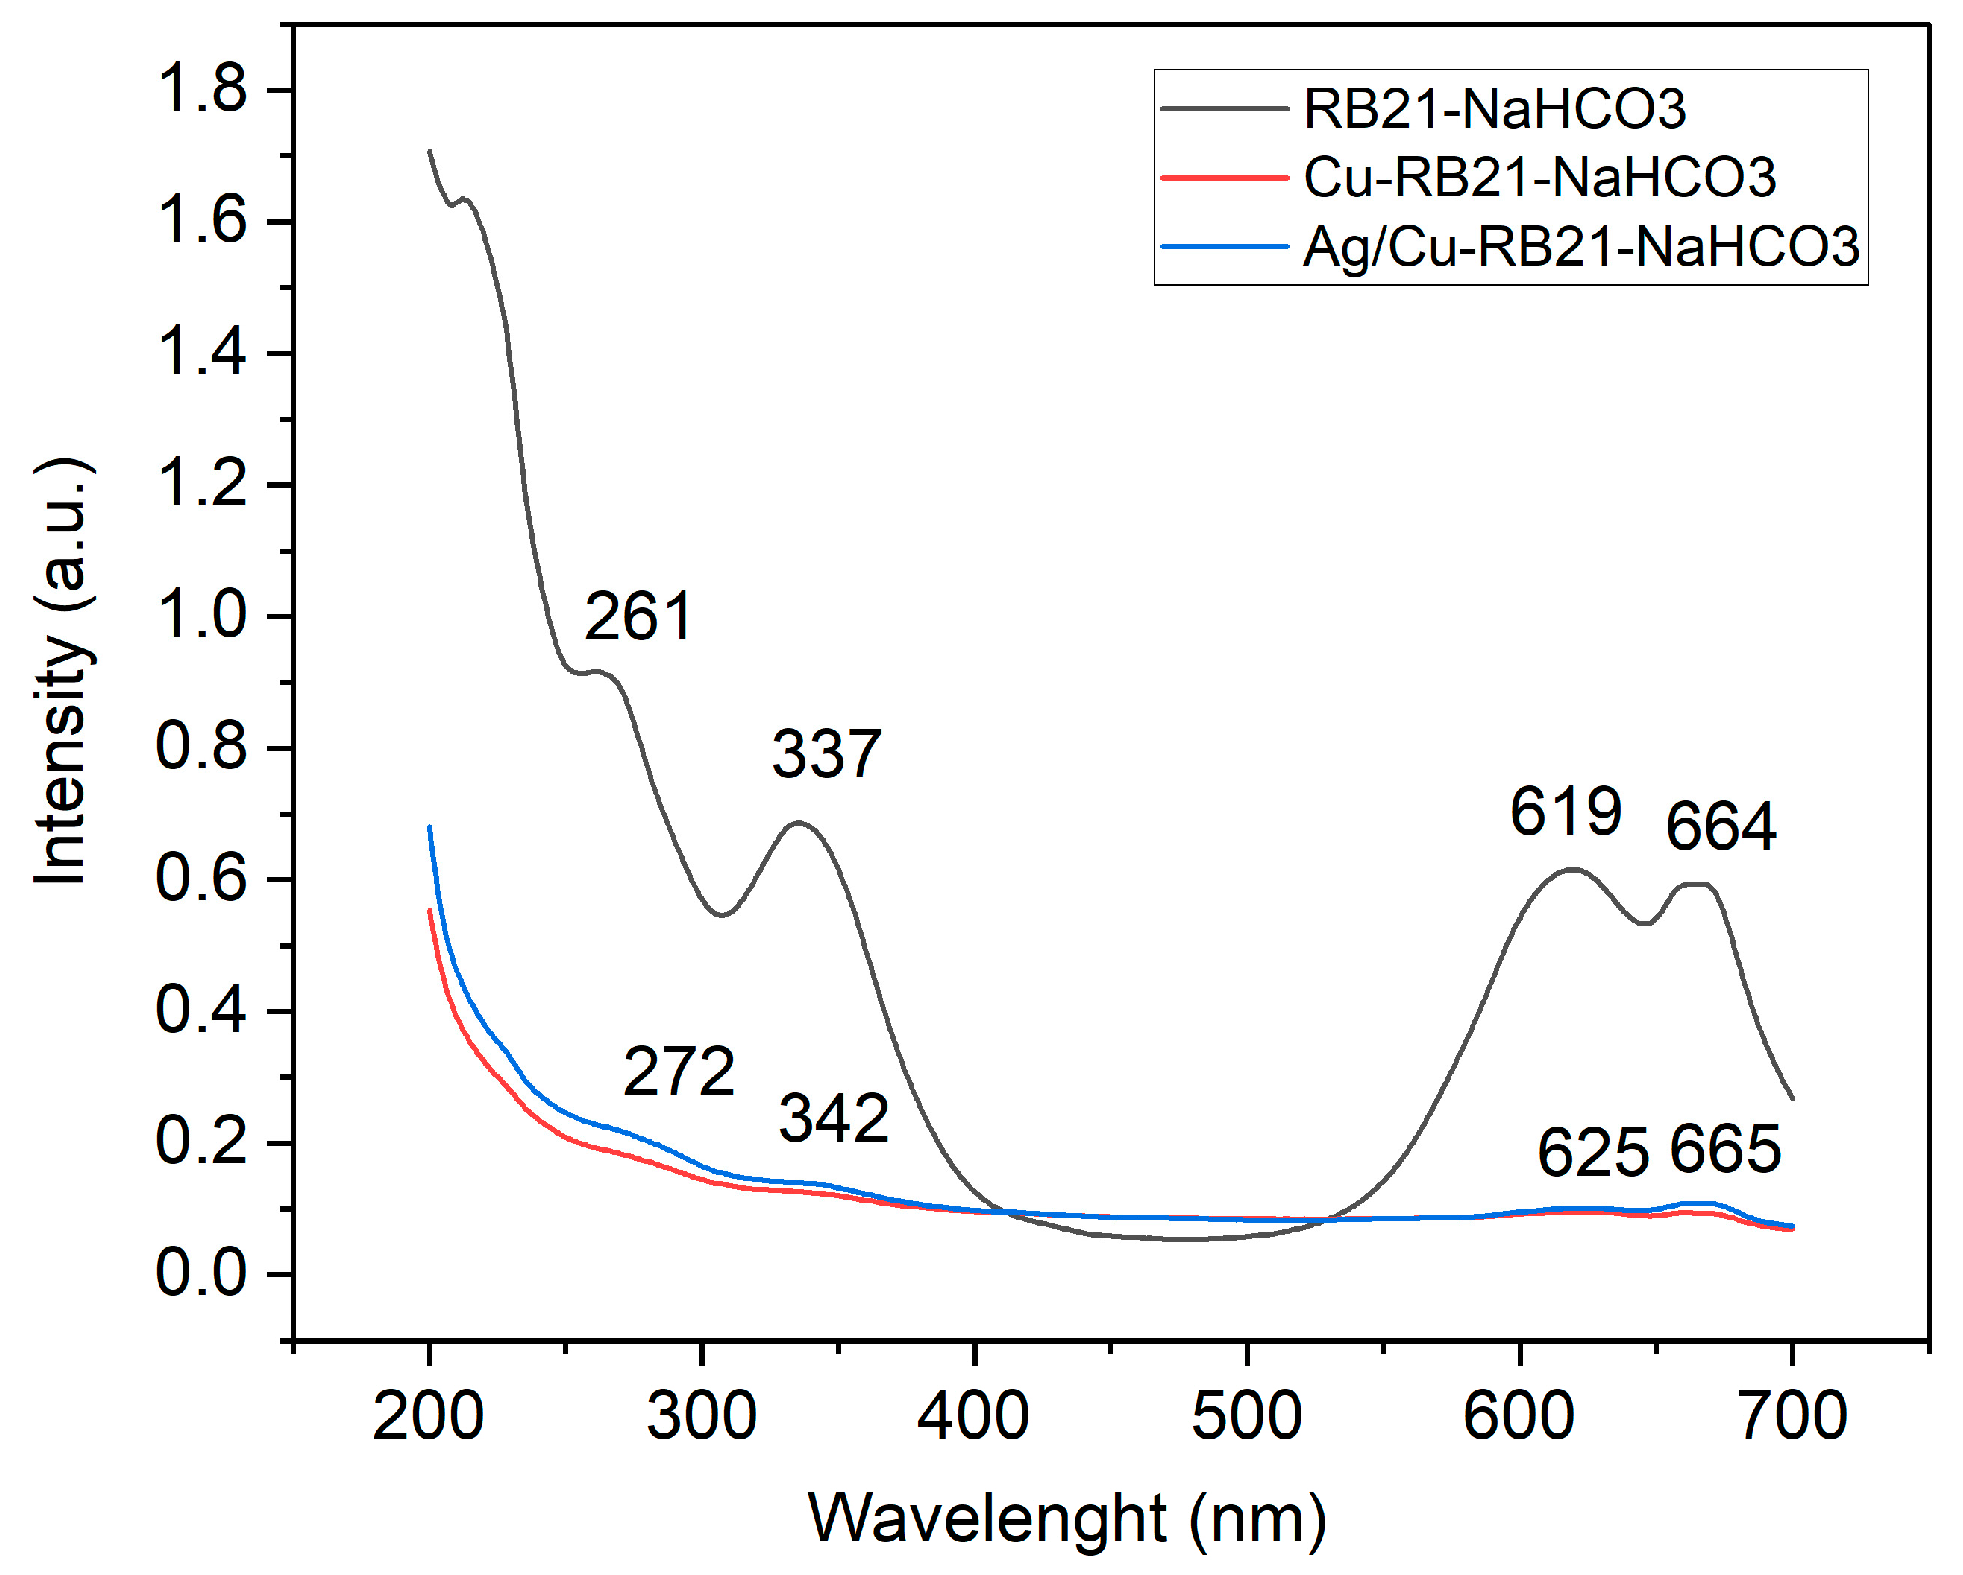
Figure 9 shows the UV–Vis spectra, which indicate an advanced decomposition of the dye compared to the RB21-NaHCO3 control sample. In the visible range, shifts of the peaks from 619 nm and 664 nm to 625 nm and 665 nm, respectively, are observed in the corresponding spectra of the Cu-RB21-NaHCO3 and Ag/Cu-RB21-NaHCO3 samples, as well as a reduction in intensity. These spectral changes in the visible range show a shift towards higher wavelength values (bathochromic effect), the color of the absorbing material (the solution resulting after the interaction of RB21-NaHCO3 with the surface of thin films of Cu and Ag/Cu). The decrease in intensity reflects a hypochromic shift. Both effects indicate changes at the level of the chromophore –SO2NH–Benz.–SO2CH2CH2OH of the RB21 dye, which is consistent with the results of the FTIR analysis.
Figure 9.
UV–Vis spectra showing the high decomposition of the RB21 dye in NaHCO3 when in contact with different metallic thin films: Silver (Ag-RB21-NaHCO3 spectrum), Copper (Cu-RB21-NaHCO3 spectrum) and the Ag/Cu bilayer (Ag/Cu-RB21-NaHCO3 spectrum) compared to the RB21-NaHCO3 control sample.
Changes in conjugation or the conjugation effect are observed in the UV domain by the shifting of the peaks from 261 nm and 337 nm in the spectrum of the RB21-NaHCO3 control sample to 272 nm and 342 nm in the spectra, respectively, of the solutions resulting after interaction with the two thin films. As with the visible range, a drastic decrease in intensity is observed. The conjugation effect indicates changes within the chromogen of the RB21 dye.
The bathochromic effect observed for the peaks in the UV range indicates changes in the auxochromes of the dye molecule (methyl, hydroxyl, amino groups) regarding their interaction with the π electron conjugation system.
The visible absorption intensities from the spectra in Figure 9 for the initial RB21-NaHCO3 solution show values of I01 = 0.615 a.u. at 619 nm and I02 = 0.593 a.u. at 664 nm. For the solutions after interacting with the thin layers, the visible peak intensities were measured as follows: for Cu-RB21-NaHCO3, I11 = 0.101 a.u. at 625 nm and I12 = 0.093 a.u. at 665 nm, and for Ag/Cu-RB21-NaHCO3, I21 = 0.101 a.u. at 625 nm and I22 = 0.108 a.u. at 665 nm. Based on these intensities, we can evaluate the value level of degradation (Dij%) of RB21 with the formula
This results in values for the reduction of the absorption degree in the visible range corresponding to the level of degradation when passing the solution over thin films as follows: D11 = 83.57%, D12 = 84% for Cu-RB21-NaHCO3 and D21 = 81.78%, D22 = 83.57%.
3.7. X-Ray Photoelectron Spectroscopy (XPS)
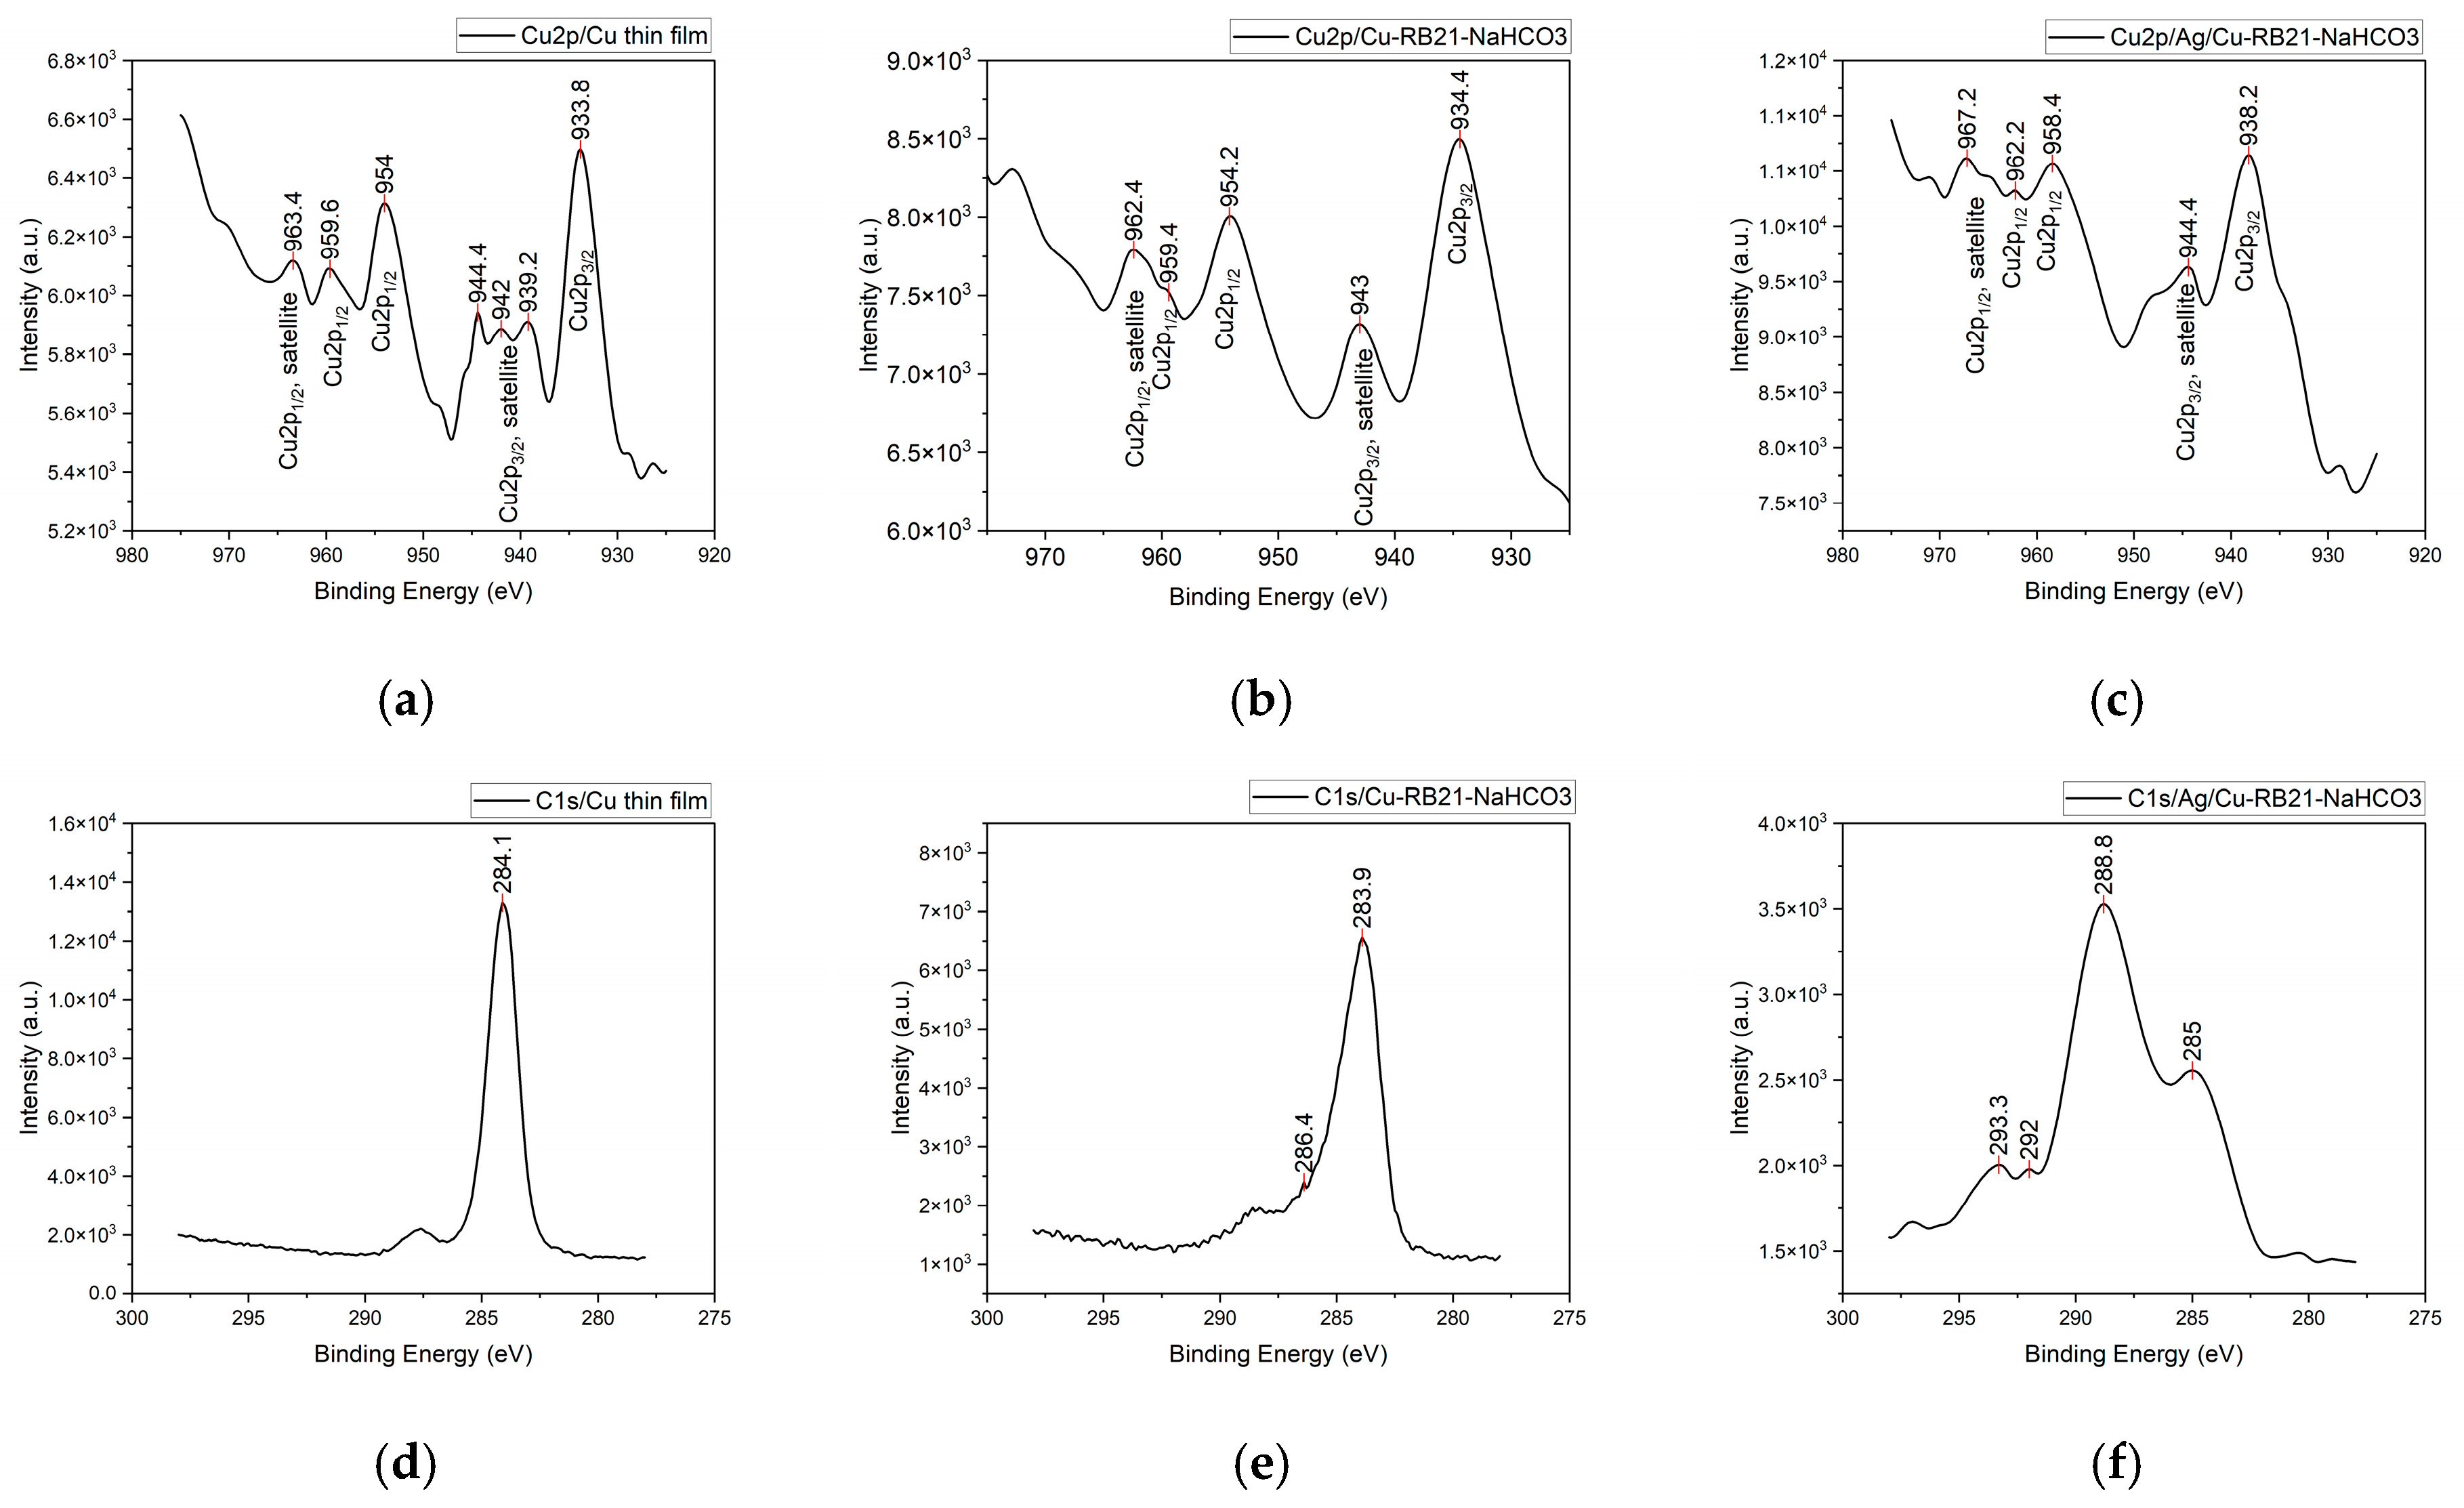
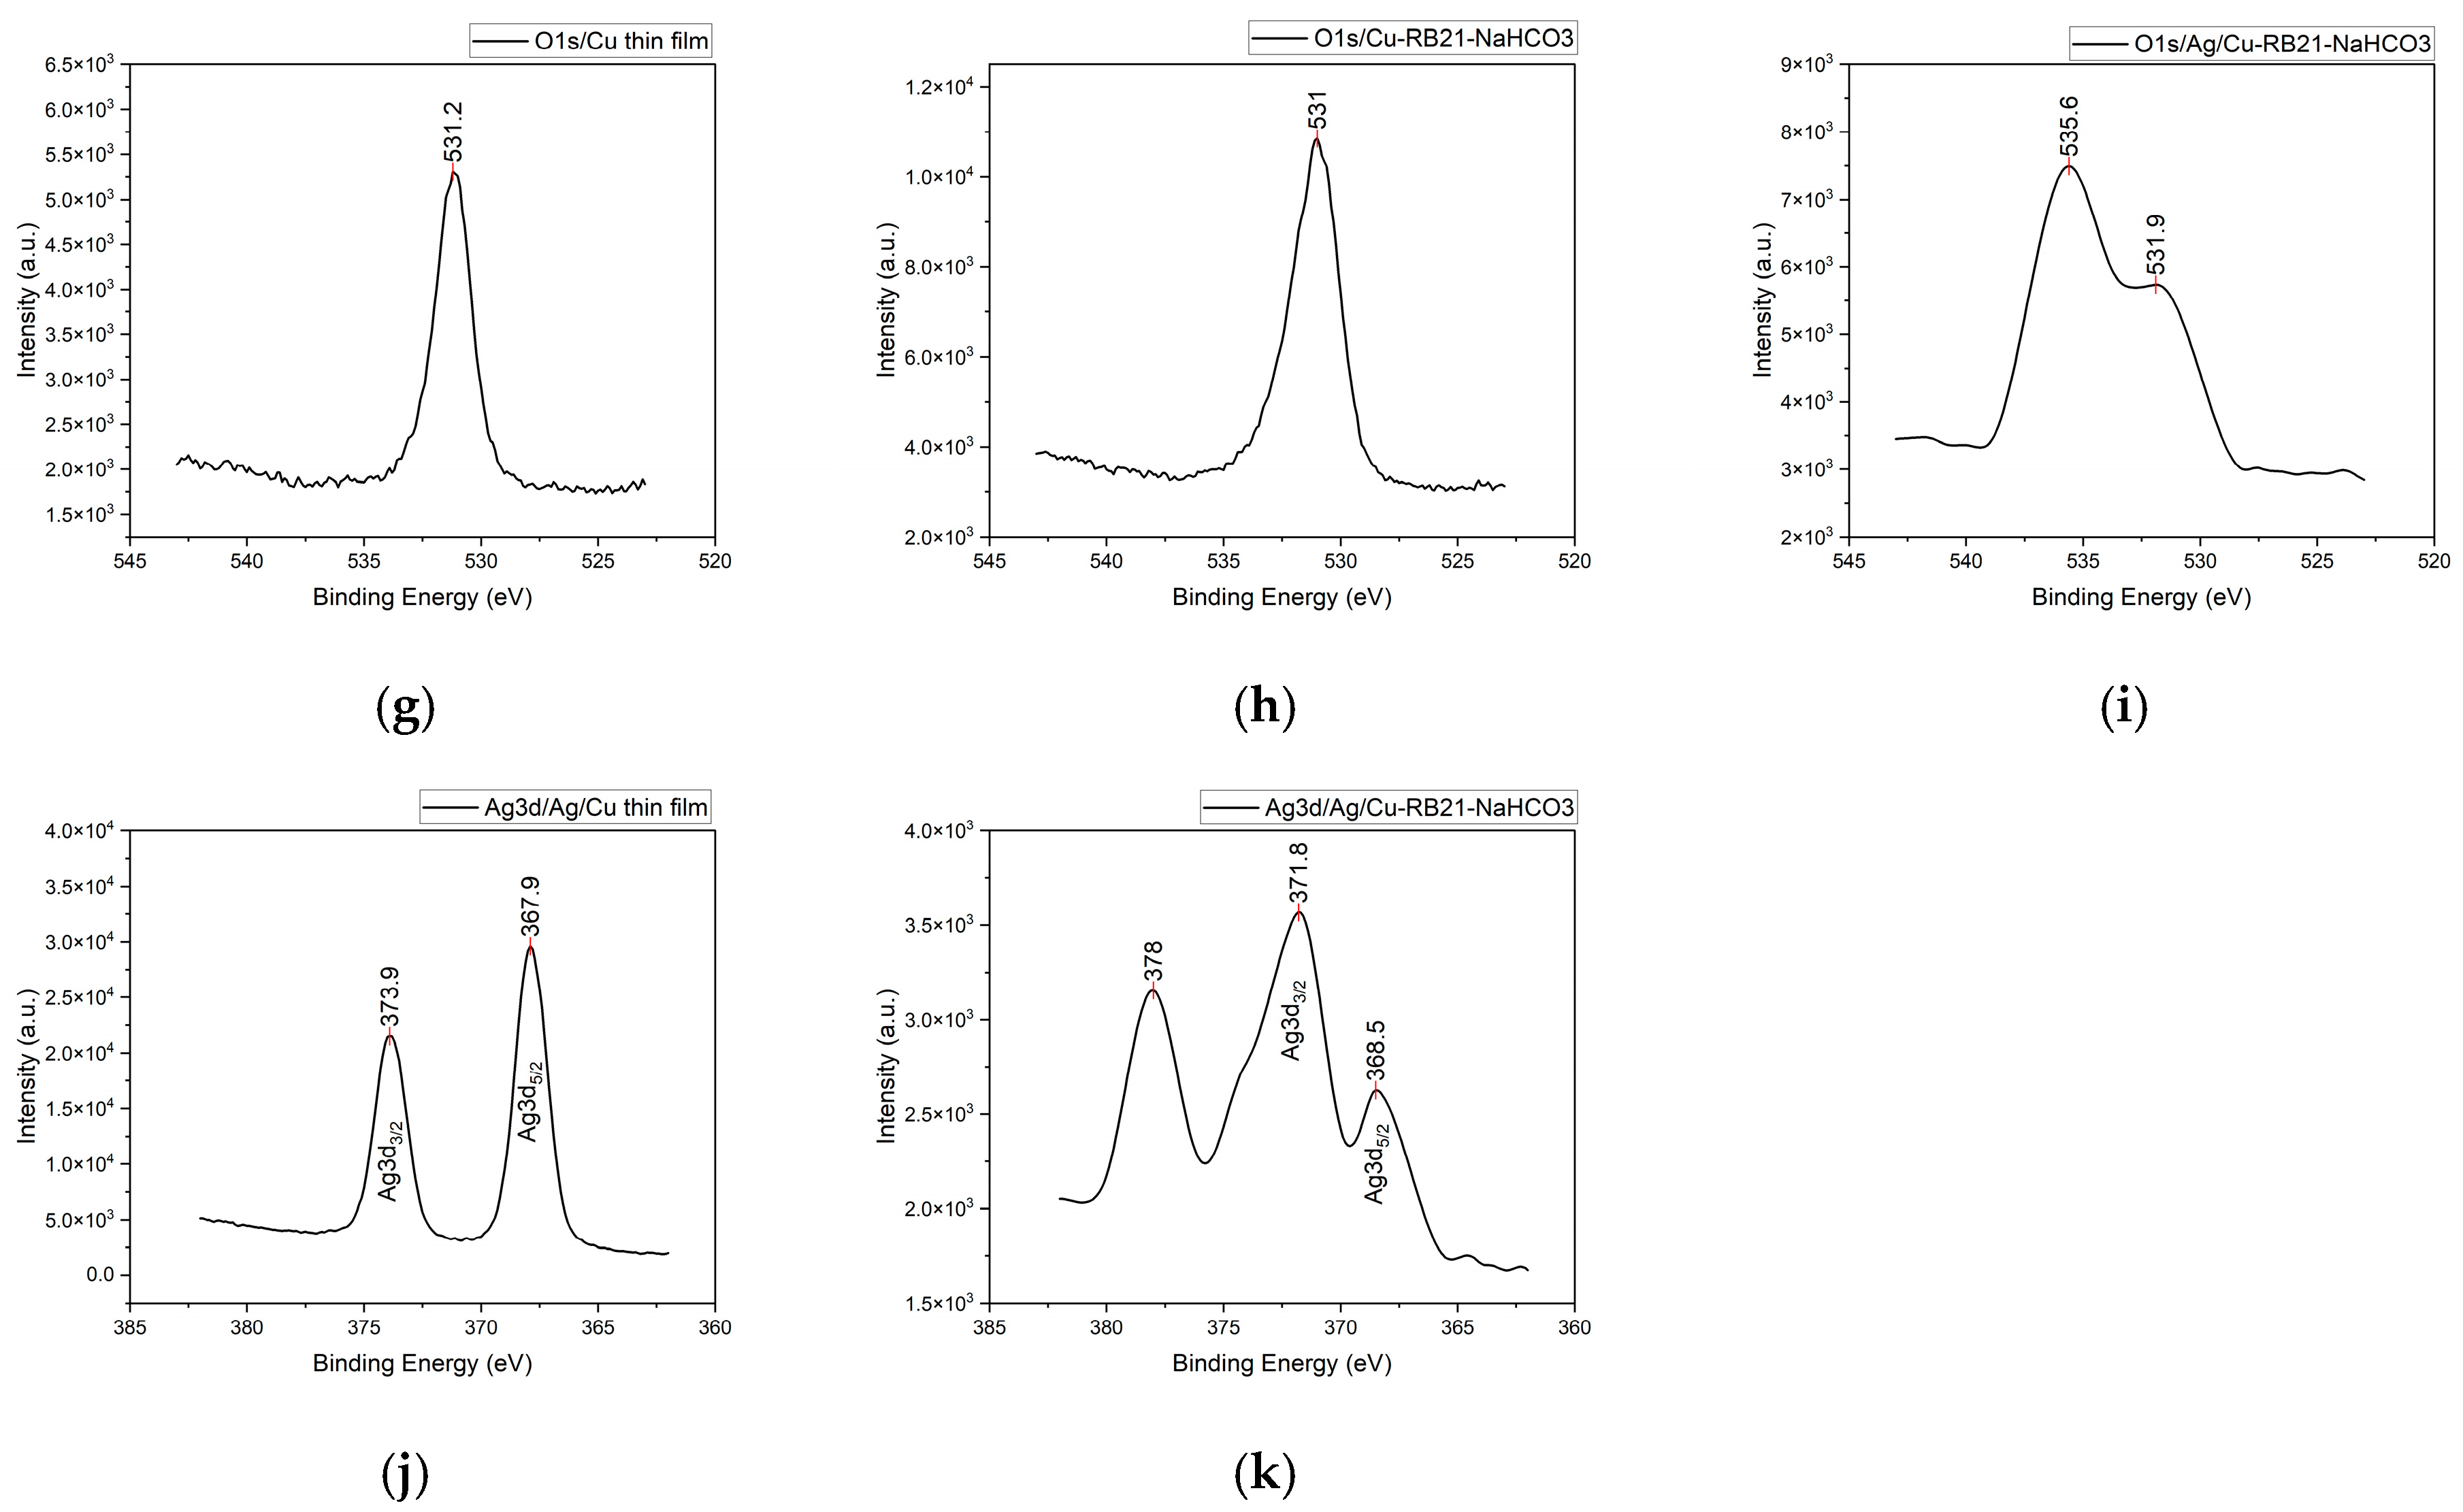
The XPS analysis was performed on the two types of untreated samples, the Cu thin film and Ag/Cu bilayer thin film, and after interaction with the aqueous RB21-NaHCO3 solution (the Cu-RB21-NaHCO3 and Ag/Cu-RB21-NaHCO3 samples), aiming to track the chemical species produced during pulsed laser deposition and their changes after treatment with the solution, as well as any possible solution retention/adsorption.
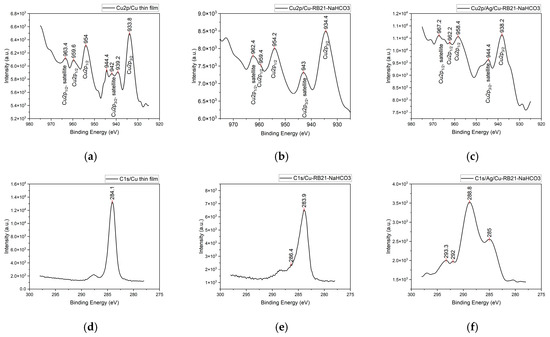
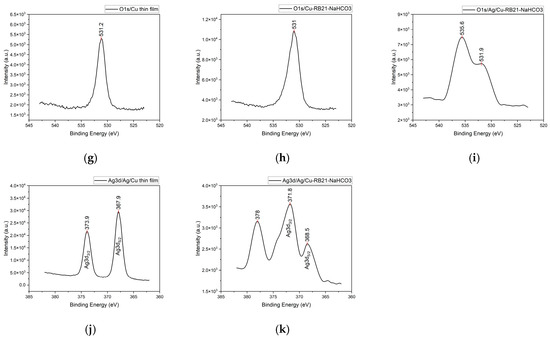
The results presented in Figure 10 are compiled in Table 5 and the NIST database [26] was used to assign the chemical formulas.
Figure 10.
The binding energies and the XPS spectral lines of the elements: Cu in the samples Cu thin film (a), Cu-RB21-NaHCO3 (b), Ag/Cu-RB21-NaHCO3 (c); C in the samples Cu thin film (d), Cu-RB21-NaHCO3 (e), Ag/Cu-RB21-NaHCO3 (f); O in the samples Cu thin film (g), Cu-RB21-NaHCO3 (h), Ag/Cu-RB21-NaHCO3 (i) and Ag in the samples Ag/Cu thin film (j), Ag/Cu-RB21-NaHCO3 (k).
Table 5.
XPS spectral lines and their binding energies.
The peaks for the Cu2p spectral lines in the spectrum of the Cu thin film can be attributed to both copper oxides and metallic copper, with only minor overlapping shifts from one species to another. The presence of CuO is indicated by the presence of the Cu2p3/2 satellite spectral line given by the binding energy peaks with values of 944.4 eV, 942 eV, and 939.2 eV. The peaks at 954 eV and 933.8 eV represent the binding energies of Cu2p1/2 and Cu2p3/2, respectively, for both Cu2O and metallic copper. The binding energies of metallic Cu at 952.5 eV for Cu2p1/2 and at 932.7 eV for Cu2p3/2 overlap with the peaks assigned to the oxides. The presence of peaks at 959.6 eV and 963.4 eV, corresponding to the spectral lines of Cu2p1/2 and the Cu2p1/2 satellite specific to CuO, further confirms the coexistence of metallic copper with its oxides. However, the formation of copper oxide during thin film deposition is less likely because the deposition chamber was maintained under vacuum; rather, it is an oxidation process when the sample is exposed to the open atmosphere.
After interacting with the aqueous RB21-NaHCO3 solution, changes were observed in the copper chemical species, but these do not involve bonds with dye molecules or any of its decomposition residues. In addition to copper oxides, Cu(OH)2 was identified by the binding energy of 934.4 eV, overlapping with the peak binding energy of CuO.
When the Ag/Cu bilayer thin film interacts with the RB21-NaHCO3 solution, the changes that can be noted are at the level of the silver, where slight shifts of the peaks are observed for both the Ag 3d3/2 line (371.8 eV) and Ag 3d5/2 line (368.5 eV). This can be interpreted as partial oxidation to AgO, since these peaks may also include overlapping peaks from the metallic silver spectral lines.
The analysis of the C1s spectral lines shows peaks at 284.1 eV, 284.3 eV (Cu thin film), 283.9 eV, for Cu-RB21-NaHCO3, 284.1 eV for the Ag/Cu bilayer thin film, and 288.8 eV and 293.3 eV (Ag/Cu-RB21-NaHCO3), specific to graphite or some organic macromolecular compounds, which may be impurities from handling and/or target production, with very small shifts. The binding energy at 286.4 eV is assigned to adsorbed CO or CO2. The peak at 293.3 eV can also be attributed to calcium carbonate. Regarding the O1s spectral lines, peaks for binding energies at 531 eV can be associated with the presence of CuO, which was already confirmed by the Cu2p peaks. The peak at 531 eV also appears for the Ag/Cu bilayer thin film. Additionally, of interest is the peak at 536.5 eV, specific to the carbonate functional group, which likely originates from NaHCO3 or Na2CO3, since the Cu2p spectral lines did not indicate copper carbonate. Copper spectral lines in malachite exhibit peaks at 954.8 eV and 936.3 eV [27].
The results of the FTIR, UV–Vis, and XPS analyses show changes in the chemical structure of RB21, but they do not show changes in the thin layers of copper and the Ag/Cu bilayer. According to the experimental analyses presented, the process that takes place in the thin films is a dissolution favored by their morphological structure resulting from the PLD process, which consists of successive deposition of nanoparticles [28]. Overall, the physicochemical processes that take place when treating thin layers with the RB21-NaHCO3 solution consist of the partial dissolution of copper and silver from the thin films, as well as the chemical degradation of RB21 under the catalytic action of the copper and silver thin films. Regarding the Ag/Cu bilayer thin film, the results obtained from XPS analysis show corrosion of the top film (the Ag one) down to the Cu film. These results suggest that by etching with an ink based on the RB21-NaHCO3 solution, it might be possible to create an alternating pattern of Ag and Cu on the double film surface that could be used in optoelectronic applications.
4. Conclusions
This study showed differences between the morphological aspects of deposition with pulsed laser of copper and silver thin films when the same laser parameters and working conditions were used.
Treating both thin films (Cu thin film and Ag/Cu bilayer thin film) with an aqueous solution of RB21 and NaHCO3, chemical reactions between the two substances occurred in solution, strongly enhanced by the Cu and Ag/Cu bilayer thin films, with high decomposition of the RB21 dye. This may be a good way to clean the residual dyeing baths directly in the vats and thus avoid the discharge of water excessively contaminated with organic dye into the sewer. This finding could provide an alternative to photocatalytic treatment on copper films of wastewater containing organic dyes.
The different degrees of corrosion of thin films made from different materials when treated with the RB21-NaHCO3 solution could allow the development of layered materials that can be etched by printing for their functionalization. To the extent that the long-term stability of the aqueous RB21-NaHCO3 solution is proven, this will make it possible to use it as ink for corrosion printing. The highly corrosive effect of the solution of RB21 and NaHCO3 on Cu thin films may be adapted for use on printing machines and become a possibility to develop a new etching method for electronic applications, including for solar cells fabrication and also for solar windows, which is a promising technology for the future.
The numerical simulation in COMSOL contributed to anticipating and then explaining the experimental results, with the two study methods (simulation and experiment) being in agreement.
Author Contributions
Conceptualization, C.P., I.C., A.C. and S.G. (Silviu Gurlui); methodology, A.C.; Software, A.C., validation, A.C., formal analysis, C.P., S.G. (Silvia Garofalide), G.C., D.A.P., I.M., N.C. and M.D.; investigation, C.P., S.G. (Silvia Garofalide), G.C., D.A.P., I.M. and A.C.; resources, D.A.P.; data curation, I.C., A.C. and S.G. (Silviu Gurlui); writing—original draft preparation, I.C. and A.C., writing—review and editing, I.C. and S.G. (Silviu Gurlui); visualization, C.P.; supervision, S.G. (Silviu Gurlui); project administration, I.C.; funding acquisition, S.G. (Silviu Gurlui). All authors have read and agreed to the published version of the manuscript.
Funding
This research received no external funding.
Data Availability Statement
The original contributions presented in this study are included in the article. Further inquiries can be directed to the corresponding author(s).
Acknowledgments
Acknowledgment is given by S. G. (Silvia Garofalide), D.A.P., I.C., A.C. and S. G. (Silviu Gurlui), to the infrastructure support from the Operational Program Competitiveness 2014–2020, Axis 1, under POC/448/1/1 research infrastructure projects for public R&D institutions/Sections F 2018, through the Research Center with Integrated Techniques for Atmospheric Aerosol Investigation in Romania (RECENT AIR) project, under grant agreement MySMIS no. 127324.
Conflicts of Interest
The authors declare no conflict of interest.
References
- Pana, I.; Parau, A.C.; Dinu, M.; Kiss, A.E.; Constantin, L.R.; Vitelaru, C. Optical Properties and Stability of Copper Thin Films for Transparent Thermal Heat Reflectors. Metals 2022, 12, 262. [Google Scholar] [CrossRef] [Scilit]
- Wei, C.; Wu, G.; Yang, S.; Liu, Q. Electrochemical deposition of layered copper thin films based on the diffusion limited aggregation. Sci. Rep. 2016, 6, 34779. [Google Scholar] [CrossRef] [Scilit]
- Mendoza-Luna, L.G.; Guarin, C.A.; de la Vega, E.C.; Sánchez, F.N.N.; Haro-Poniatowski, E.; Hernández-Pozos, J.L. Experimental and computational investigation on the surface plasmon resonance of copper thin-films produced via pulsed laser deposition. Results Opt. 2025, 19, 100803. [Google Scholar] [CrossRef] [Scilit]
- Lorusso, A.; Kovács, Z.; Gilicze, B.; Szatmári, S.; Perrone, A.; Szörényi, T. Sub-ps Laser Deposited Copper Films for Application in RF Guns. Materials 2023, 16, 1267. [Google Scholar] [CrossRef] [Scilit]
- Abhinav, K.V.; Rao, R.V.K.; Karthik, P.S.; Singh, S.P. Copper conductive inks: Synthesis and utilization in flexible electronics. RSC Adv. 2015, 5, 63985–64030. [Google Scholar] [CrossRef] [Scilit]
- Tomotoshi, D.; Kawasaki, H. Surface and Interface Designs in Copper-Based Conductive Inks for Printed/Flexible Electronics. Nanomaterials 2020, 10, 1689. [Google Scholar] [CrossRef] [Scilit]
- Grouchko, M.; Magdassi, S. Copper Ink-Jet inks for Flexible and Plastic Electronics. Nip Digit. Fabr. Conf. 2012, 28, 461–462. [Google Scholar] [CrossRef] [Scilit]
- Din, M.I.; Arshad, F.; Hussain, Z.; Mukhtar, M. Green Adeptness in the Synthesis and Stabilization of Copper Nanoparticles: Catalytic, Antibacterial, Cytotoxicity, and Antioxidant Activities. Nanoscale Res. Lett. 2017, 12, 638. [Google Scholar] [CrossRef] [Scilit]
- Naik, S.S.; Obernberger, S.; Ruediger, A.; Ma, D.; Guay, D. Fabrication of Multi-Phase Copper Oxide Thin Films Using Pulsed Laser Deposition as a Highly Selective Non-Enzymatic Glucose Biosensor. ECS Meet. Abstr. 2025, MA2025-01, 2814. [Google Scholar] [CrossRef] [Scilit]
- Menazea, A.; Awwad, N.S. Pulsed Nd:YAG laser deposition-assisted synthesis of silver/copper oxide nanocomposite thin film for 4-nitrophenol reduction. Radiat. Phys. Chem. 2020, 177, 109112. [Google Scholar] [CrossRef] [Scilit]
- Panda, R.; Patel, M.; Thomas, J.; Joshi, H.C. Pulsed laser deposited Cu2O/CuO films as efficient photocatalyst. Thin Solid Films 2022, 744, 139080. [Google Scholar] [CrossRef] [Scilit]
- Baldenebro-Lopez, J.; Flores-Holguin, N.; Castorena-Gonzalez, J.; Almaral-Sanchez, J.; Glossman-Mitnik, D. Theoretical Study of Copper Complexes: Molecular Structure, Properties, and Its Application to Solar Cells. Int. J. Photoenergy 2013, 2013, 613064. [Google Scholar] [CrossRef] [Scilit]
- Kaluzhina, S.A.; Sieber, I.V. Copper passivity and its breakdown in sodium bicarbonate solutions: A scanning electron microscopy and x-ray photoelectron and auger spectroscopy study. Russ. J. Electrochem. 2006, 42, 1352–1357. [Google Scholar] [CrossRef] [Scilit]
- Adeloju, S.B.; Duan, Y.Y. Influence of bicarbonate ions on stability of copper oxides and copper pitting corrosion. Br. Corros. J. 1994, 29, 315–320. [Google Scholar] [CrossRef] [Scilit]
- Giziński, D.; Brudzisz, A.; Alzahrani, M.R.; Wang, K.-K.; Misiołek, W.Z.; Stępniowski, W.J. Formation of CuOx Nanowires by Anodizing in Sodium Bicarbonate Solution. Crystals 2021, 11, 624. [Google Scholar] [CrossRef] [Scilit]
- Brudzisz, A.; Giziński, D.; Liszewska, M.; Wierzbicka, E.; Tiringer, U.; Taha, S.A.; Zając, M.; Orzechowska, S.; Jankiewicz, B.; Taheri, P.; et al. Low-voltage anodizing of copper in sodium bicarbonate solutions. Electrochim. Acta 2023, 443, 141918. [Google Scholar] [CrossRef] [Scilit]
- Cocean, A.; Cocean, G.; Postolachi, C.; Garofalide, S.; Pricop, D.A.; Munteanu, B.S.; Bulai, G.; Cimpoesu, N.; Motrescu, I.; Pelin, V.; et al. High Energy Pulsed Laser Beam to Produce a Thin Layer of Crystalline Silver without Heating the Deposition Substrate and Its Catalytic Effects. Quantum Beam Sci. 2024, 8, 16. [Google Scholar] [CrossRef] [Scilit]
- Cocean, A.; Cocean, I.; Gurlui, S.; Iacomi, F. Study of the pulsed laser deposition phenomena by means of Comsol Multiphysics. UPB Sci. Bull. Ser. A 2017, 79, 263–274. [Google Scholar]
- Available online: https://refractiveindex.info/?shelf=main&book=Cu&page=Johnson (accessed on 1 June 2026).
- Available online: https://refractiveindex.info/?shelf=main&book=Ag&page=Johnson (accessed on 1 June 2026).
- Pretch, E.; Bülmann, P.; Badertscher, M. Structure Determination of Organic Compounds. Tables of Spectral Data, 4th ed.; Springer: Berlin, Germany, 2009. [Google Scholar]
- Miller, F.A.; Wilkins, C.H. Infrared Spectra and Characteristic Frequencies of Inorganic Ions. Anal. Chem. 1952, 24, 1253–1294. [Google Scholar] [CrossRef] [Scilit]
- Cocean, G.; Cocean, A.; Postolachi, C.; Garofalide, S.; Bulai, G.; Munteanu, B.S.; Cimpoesu, N.; Cocean, I.; Gurlui, S. High-Power Laser Deposition of Chitosan Polymers: Medical and Environmental Applications. Polymers 2022, 14, 1537. [Google Scholar] [CrossRef] [Scilit]
- Cocean, G.; Cocean, A.; Garofalide, S.; Pelin, V.; Munteanu, B.S.; Pricop, D.A.; Motrescu, I.; Dimitriu, D.G.; Cocean, I.; Gurlui, S. Dual-Pulsed Laser Ablation of Oyster Shell Producing Novel Thin Layers Deposed to Saccharomyces cerevisiae. Polymers 2023, 15, 3953. [Google Scholar] [CrossRef] [Scilit]
- Cocean, A.; Cocean, G.; Garofalide, S.; Cimpoesu, N.; Alexa, D.; Cocean, I.; Gurlui, S. Laser-Induced Ablation of Hemp Seed-Derived Biomaterials for Transdermal Drug Delivery. Int. J. Mol. Sci. 2025, 26, 7852. [Google Scholar] [CrossRef] [Scilit]
- NIST X-Ray Photoelectron Spectroscopy Database. Available online: https://srdata.nist.gov/xps/QueryByElmType/Ag/PE (accessed on 12 July 2026).
- Li, L.; Yang, L.; Li, F. Synthesis of 1-(2-Hydroxyphenyl) Dec-2-en-1-One Oxime and Its Flotation and Adsorption Behavior for Malachite. Front. Chem. 2020, 8, 592771. [Google Scholar] [CrossRef] [Scilit]
- Alonso, J.C.; Diamant, R.; Castillo, P.M.; Acosta–García, C.; Batina, N.; Haro-Poniatowski, E. Thin films of silver nanoparticles deposited in vacuum by pulsed laser ablation using a YAG:Nd laser. In Applied Surface Science; Elsevier: Amsterdam, The Netherlands, 2009; Volume 255, pp. 4933–4937. [Google Scholar] [CrossRef] [Scilit]

Disclaimer/Publisher’s Note: The statements, opinions and data contained in all publications are solely those of the individual author(s) and contributor(s) and not of MDPI and/or the editor(s). MDPI and/or the editor(s) disclaim responsibility for any injury to people or property resulting from any ideas, methods, instructions or products referred to in the content. |
© 2026 by the authors. Licensee MDPI, Basel, Switzerland. This article is an open access article distributed under the terms and conditions of the Creative Commons Attribution (CC BY) license.