


Abstract
This work presents a systematic methodology for generating bi-sinusoidal surface topographies with controlled and reproducible characteristics on Ti-6Al-4V using a progressive 1D–2D–3D framework. Such deterministic topographies are of interest for dental implants, where surface micro-texture can influence an early biological response and osseointegration. Single-pulse ablation thresholds were first determined to be 0.175 J/cm2 at a 1031 nm wavelength using 306 fs pulses, with no polarization dependence. Studies were then carried out to identify fundamental ablation parameters, optimize scanning conditions for planar texturing, and extend the process to controlled three-dimensional surface architectures. During the 1D stage, increasing the fluence from 0.26 to 6.52 J/cm2 enlarged the crater diameter from approximately 7 to 32 µm and increased the areal roughness Sa from 0.012 to 0.020 µm. With an increasing pulse number, the crater diameter continued to grow up to 25 pulses before stabilizing. Multi-pulse tests below the threshold showed that repeated exposures caused ablation, highlighting incubation and energy accumulation, with an incubation factor of S = 0.84. In the 2D stage, scanned irradiation was used to quantify how fluence and pulse overlap affect the ablated depth and areal roughness, with depth increasing linearly with the number of passes, and roughness strongly governed by overlap and fluence. Finally, 3D texturing combining x–y scanning with a z-axis focal adjustment enabled reproducible bi-sinusoidal topographies.
1. Introduction
Machining and surface texturing are key steps in manufacturing metallic parts because they directly affect functionality and performance [1,2]. Surface finish and roughness, defined, respectively, by the geometric features and microscopic irregularities [3], strongly influence adhesion, wear, fatigue, tribological properties, and stability [4,5]. Among the available processing techniques, ultrashort-pulse laser texturing is highly flexible, combining high precision, minimal thermal damage [6], and the ability to create controlled micro- and nanoscale features [7]. In particular, femtosecond lasers can further improve feature resolution and reduce undesirable side effects due to their extremely short pulse duration [8]. Laser-based surface treatment can be applied to a wide range of materials, including metals, ceramics, polymers, and composites. Ti-6Al-4V was chosen for this project because of its wide range of biomedical and aerospace applications. It has the combination of having a low density, high tensile strength, exceptional resistance to corrosion, and good biocompatibility. The use of laser surface texturing as an effective means of modifying the surface topography of Ti-6Al-4V has been studied extensively; it has been shown to alter wettability, cell adhesion, and osseointegration [9] and reduce bacterial adhesion [10]. In addition, it has been demonstrated that laser surface texturing can also increase nano-hardness and improve wear resistance [11].
However, despite these advantages, a major technical challenge remains: the final laser-textured morphology is highly sensitive to processing and measurement conditions, which makes it difficult to obtain predictable and reproducible surface topographies. The literature reports significant variability in laser ablation outcomes, even for similar materials [12], underlining strong sensitivity of the results to experimental conditions [13,14]. This variability is not only related to the intrinsic material response, but also to the combined influence of laser fluence, pulse duration, wavelength, spot size definition, number of pulses, pulse overlap, scanning strategy, surface preparation, and measurement method. As a result, a central unresolved issue is the difficulty of linking fundamental single-spot ablation behavior to the final morphology obtained under 2D scanning and 3D texturing conditions.
One of the most relevant quantities in ultrashort-pulse laser processing is the ablation threshold, defined as the minimum fluence required to initiate material removal. Reported single-pulse ablation thresholds for Grade-5 Ti-6Al-4V vary widely, from 0.109 J/cm2 to 2.13 J/cm2, depending on the wavelength, pulse duration, spot size definition, measurement method, surface preparation, and ambient environment [12,13,15,16,17,18,19,20,21]. In addition, three approaches for estimating the ablation threshold have been described, based, respectively, on the ablation diameter, ablation depth, and removed volume [22]. Among these, the diameter-based method is generally considered the most reliable [15]. Therefore, ablation thresholds should be compared with caution and only when experimental conditions and calculation methods are consistent.
Beyond the threshold, many studies across a wide range of materials have examined how crater dimensions evolve with fluence and pulse number [15,23,24]. The crater diameter generally increases with fluence [15,24,25]. Moreover, depending on the ablation rate, two regimes are often distinguished: low-fluence “gentle ablation” below 1 J/cm2 and high-fluence “strong ablation” above 1 J/cm2 [26,27]. In contrast, diameter evolution with a pulse number is not consistent across the literature, with reports of progressive growth [28], early saturation [24], or negligible pulse number dependence [15,25]. Ablation depth, however, generally increases with the pulse number [15,25,27], with larger depths observed at higher fluence [15]. Nevertheless, growth may slow and eventually saturate beyond approximately 103 pulses per spot [29]. These observations show that single-pulse fluence alone is insufficient to describe material removal since cumulative irradiation and incubation effects also strongly influence crater growth.
The term “incubation” refers to the progressive decrease in the effective ablation threshold with increasing pulse number, where Fth(N) is defined as the minimum fluence required to initiate ablation after N successive pulses at the same location [30]. It is commonly attributed to defect accumulation [31], structural modifications, and changes in absorption properties that increase the material’s susceptibility to subsequent irradiation [32]. Incubation is typically characterized by a power law, , where S is the incubation coefficient. S = 1 indicates no incubation, and S < 1 corresponds to a reduction in threshold with increasing pulse number. Conversely, S > 1 suggests surface hardening under laser irradiation [33,34]. For metals, S typically lies between 0 and 1, meaning that multi-pulse irradiation gradually lowers the effective ablation threshold [34]. Numerous investigations have documented varying values of the incubation coefficient S for Ti-6Al-4V, which reflects the impact of the experimental conditions. The incubation coefficient S reported for Ti-6Al-4V generally ranges from 0.78 to 0.92 under different irradiation conditions: S = 0.78 for 200 fs, 775 nm [20], S = 0.80 ± 0.08 for 30 fs, 800 nm [21], S = 0.855 ± 0.014 for 130 fs [15], and S = 0.92 for 10 ps, 1064 nm [17].
While these fundamental studies provide useful information on ablation thresholds, crater growth, and incubation effects, they do not fully resolve how these parameters should be translated into controlled scanned textures. Under 2D laser scanning, the final surface morphology results from the coupled effects of fluence, pulse overlap, hatching distance, number of passes, cumulative deposited energy, and local ablation efficiency. These coupled effects can produce non-monotonic trends in roughness and depth, making it difficult to select processing conditions based only on single-pulse or single-crater data. Therefore, a systematic approach is required to connect 1D fixed-beam ablation behavior to 2D scanning and, ultimately, to controlled 3D surface structuring.
Beyond process fundamentals, laser surface structuring enables the precise fabrication of three-dimensional topographies with tailored functionality. This is particularly relevant for titanium-based biomedical implants, where surface topography is increasingly used as a design parameter to promote bio-functionality. Laser-fabricated microgrooves have been reported to increase surface roughness and hydrophilicity, promote osteoblast adhesion, proliferation, and osteogenic differentiation, and reduce stress in the surrounding bone tissue, suggesting their potential to enhance osseointegration [35]. Several studies have therefore focused on groove geometry, especially groove width and pitch: grooves of 30 µm width with 70 µm pitch have been reported consistently [35,36,37]. Also, it has been demonstrated that microgrooves with a width of 30 µm exhibited the highest coefficient of friction, suggesting improved interfacial mechanical stability [38]. In addition, a groove depth of 10 µm was reported [35]. Overall, micro-grooved surfaces promote contact guidance, improved cell alignment, and increased cell density and adhesion, while also contributing to favorable biomechanical interface conditions [35,36,37]. In this work, these literature-informed groove parameters are adopted as a technical baseline and extended toward controlled bi-sinusoidal surface topographies on Ti-6Al-4V. This enables a systematic transition from conventional grooves to more complex three-dimensional architectures with controlled amplitude and periodicity along two perpendicular directions.
To address these challenges, this work proposes a step-by-step strategy for mastering laser ablation and texturing on Ti-6Al-4V alloy. The methodology is organized into three interconnected levels. First, a 1D investigation is carried out to identify the key ablation parameters and to better understand how the material responds to single and repeated laser pulses. Second, 2D scanning experiments were carried out to first assess the effect of the number of passes on ablation depth at different fluences, and then to examine how fluence and pulse overlap influence the resulting surface morphology. Finally, the optimized conditions are extended to 3D fabrication by combining x–y scanning with z-axis focal adjustments to create controlled bi-sinusoidal topographies. This progressive methodology aims to reduce the gap between fundamental ablation characterization and reproducible surface fabrication.
2. Materials and Methods
2.1. Sample Preparation
Cylindrical samples of titanium alloy Ti-6Al-4V, 3 cm in diameter and 1.2 cm thick, were cut from a bar using a MECATOME T 330 precision cutter (PRESI, Eybens, France). Surface preparation was carried out in three polishing steps using Tegramin-25 (Struers, Champigny-sur-Marne, France) SiC 320-grit, an MD-Largo disk, and final polishing using an MD-Chem disk. Prior to testing, all samples were ultrasonically cleaned in isopropanol for 5 min and subsequently air-dried. This preparation procedure resulted in a final surface roughness of Sa = 12 nm, measured using a white-light interferometric profiler over an area of 412.9 µm × 344.1 µm, using an objective of 20× with the Vertical Scanning Interferometry (VSI) mode, and at the minimum scanning speed of the instrument, corresponding to 10 µm/s.
2.2. Laser System and Focusing Optics
Samples were processed at room temperature using a femtosecond micromachining system (ES LASER, Léognan, France). The system is equipped with a Ytterbium femtosecond fiber laser source Satsuma HP3 (Amplitude, Pessac, France), operated at a 1031 nm wavelength in the infrared. The focused laser spot has a Gaussian intensity profile. The nominal spot diameter is 2w0 = 24.8 µm. The laser emits pulses of 306 fs with a maximum average power of 43.1 W, and a linear polarization is applied during all experiments. The beam quality factor was measured as M2 = 1.14, thus enabling the accurate determination of the beam waist. The focal position was finely adjusted with a 100 nm minimal z-axis step, while the sample was positioned using a motorized XY translation stage.
The incident laser fluence is defined by the maximum energy per unit area delivered at the center of the Gaussian beam, with Equation (1) [39] as follows:
where is the pulse energy.
2.3. Surface Measurements and Characterization
Surface topography was measured using a white-light interferometric profiler (Bruker, Billerica, MA, USA). Crater measurements were performed in the Phase-Shifting Interferometry (PSI) mode, which is well suited for shallow features, owing to its higher sensitivity to small height variations. A 115× objective was selected; the lateral sampling resolution was 0.062 µm over a 74.6 µm × 62.2 µm field of view. The VSI mode was selected for deeper textures due to its larger measurable vertical range, using a 20× objective. The lateral sampling resolution was 0.344 µm over a 412.9 µm × 344.1 µm field of view. The ablated depth was quantified as the average vertical depth of the ablated area relative to the surrounding polished surface, used as the reference level.
Detailed surface images were additionally acquired using scanning electron microscopy (SEM) (JEOL Ltd., Akishima, Tokyo, Japan) at an operating voltage of 10 kV and a working distance of 10 mm to analyze crater morphology. Surface characterization, including analyses, calculations, and visualizations, was performed using MountainsMap 9 software (Digital Surf, Besançon, France).
2.4. Experimental Approaches
The experimental methodology was designed as a progressive framework consisting of three stages: 1D, 2D, and 3D. The 1D stage involved fixed-beam irradiation to determine the fundamental ablation parameters under single- and multi-pulse conditions. The 2D stage extended the investigation to planar XY scanning for surface texturing, while the 3D approach addressed texturing for volumetric structuring. Each of these stages is described in detail below.
2.4.1. One-Dimensional—Fixed-Beam Irradiation
In the first stage, single craters were generated by varying the incident fluence. According to the Liu method [39], which is widely used for laser ablation threshold determination [7,21,27], in the gentle ablation regime, the square of the crater diameter varies linearly with the logarithm of the incident fluence, which enables the extraction of the ablation threshold by linear extrapolation (Equation (2)). In these experiments, the fluence was varied over a range from 0.04 J/cm2 to 0.89 J/cm2 using selected discrete values. After determining the ablation threshold, the dependence of the ablated crater diameter on fluence was analyzed.
where D is the measured crater diameter and Fth is the ablation threshold fluence.
Subsequently, multi-pulse irradiations were performed at a fixed position at 1 MHz; the pulse numbers were 1, 5, 10, 25, 50, 100, 200, 300, 400, and 500. A fluence of 0.89 J/cm2 was selected because it produced a crater diameter close to the nominal spot size .
In addition, sequences of multiple pulses were applied at fluence values below the single-pulse threshold (0.09 J/cm2, 0.13 J/cm2, and 0.16 J/cm2) in order to examine possible incubation or cumulative effects. These measurements provided reference values for ablation efficiency and served as a baseline for the design of subsequent 2D and 3D texturing experiments.
2.4.2. Two-Dimensional—Planar Scanning
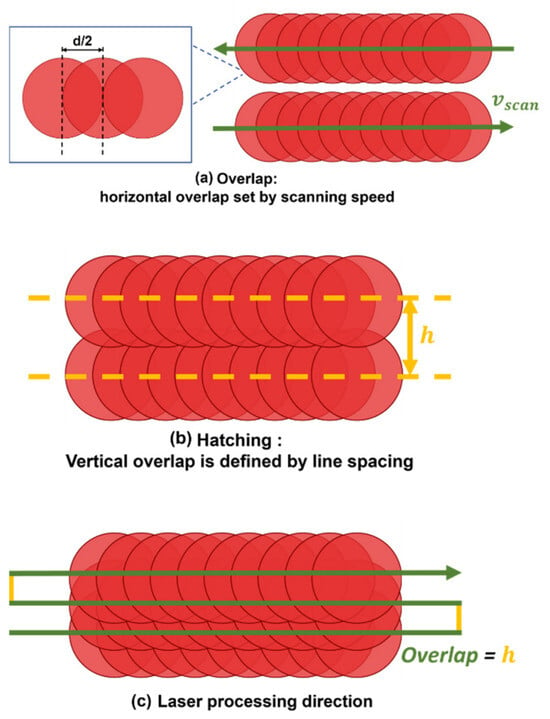
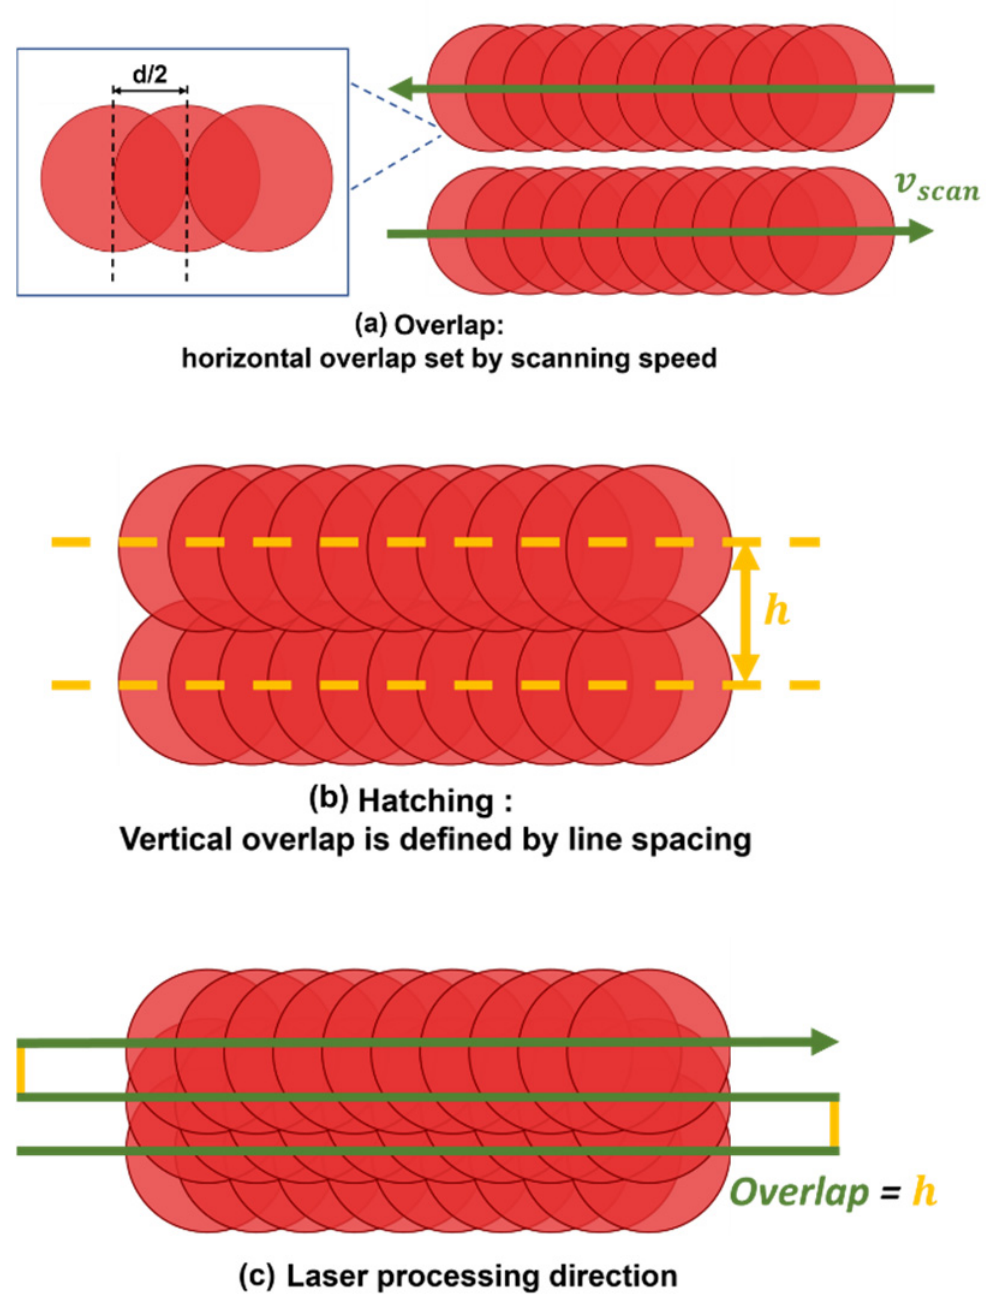
In the second stage, the laser beam was scanned over the sample surface in the XY plane using a motorized translation stage. Among the process variables, spot overlap and hatch spacing strongly affect the local energy distribution. Spot overlap quantifies the fractional superposition of successive pulses along the scan direction, as shown in Figure 1a. It was computed from the scan speed , pulse repetition rate f, and ablated diameter D, as per Equation (3) [40]:
Figure 1.
Schematic of scan-parameter definitions: (a) pulse-to-pulse spot overlap along the scan path; (b) hatch spacing h between adjacent, parallel scan lines; and (c) laser processing direction. The drawing is not to scale.
The hatch spacing is the center-to-center distance h between adjacent parallel scan lines (Figure 1b), which governs lateral track overlap. It can be expressed as a hatch-overlap fraction using the effective spot diameter d, and is calculated by the given Equation (4) [40]:
These settings were optimized to realize the target fluence distribution (uniform or intentionally graded), reduce unprocessed gaps, and limit thermal accumulation.
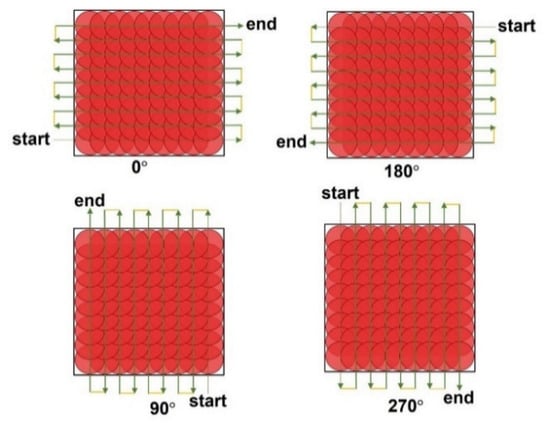
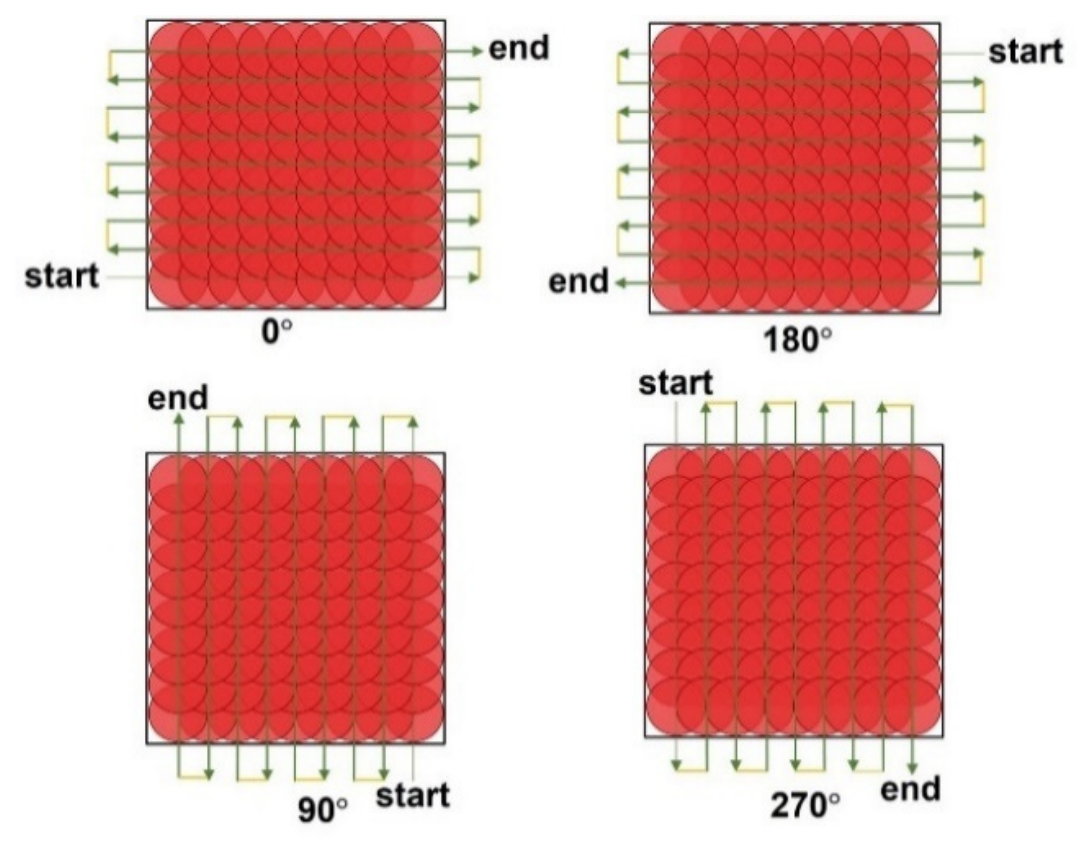
First, square zones of 200 × 200 µm2 were textured to study the ablation depth as a function of the number of passes: 1, 2, 3, 4, 5, 10, 20, 40, 60, and 90 passes. All zones were processed at a scanning speed of 100mm/s with a constant spot overlap of 50% (Figure 1c), and were scanned in two orientations: 0° and 90° (Figure 2). In this series, the incident fluence was varied between 0.28, 0.48, and 0.89 J/cm2. To maintain the same spot overlap for each fluence condition, the pulse repetition rate was adjusted to 20 kHz, 11.76 kHz, and 9 kHz, respectively.
Figure 2.
Laser scanning orientations (0°, 90°, 180°, and 270°). The drawing is not to scale.
Second, two processing parameters were investigated: incident fluence and pulse overlap between successive laser spots. Fluence varied from 0.20 J/cm2 to 0.87 J/cm2 to remain above the ablation threshold while staying within the gentle ablation regime (<1 J/cm2) and using the 1D threshold as a reference. The overlap was set at 40%, 45%, 50%, 55%, and 60%. A hatch pattern was applied with identical overlap values along and across the scanning direction. All textures were produced in a single pass to assess the effects of fluence and overlap on surface roughness, morphology, and texture uniformity.
2.4.3. Three-Dimensional—Laser Texturing: Bi-Sinusoidal Topography
In the third stage, the laser process was extended to three-dimensional surface texturing. Multi-axis motion, combining the motorized XY translation stage with vertical adjustment of the focal position, enabled the fabrication of complex surface features beyond flat geometries. The research presented here investigates a unique three-dimensional (3D) model that contains both sinusoidal valleys and peaks. The valley and peak have the same frequency along both the X and Y axes. The valleys and peaks are located in periodic arrangements. Periodic surface architectures are regularly explored to study how geometry influences contact mechanics. Here, the characteristic dimensions reported for microgrooves in the literature were used as design targets to define the bi-sinusoidal periodicity and amplitude. The objective was to demonstrate the feasibility of producing reproducible bi-sinusoidal patterns by laser texturing for the development of bio-functional implant surfaces.
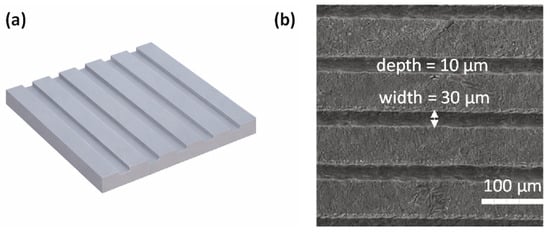
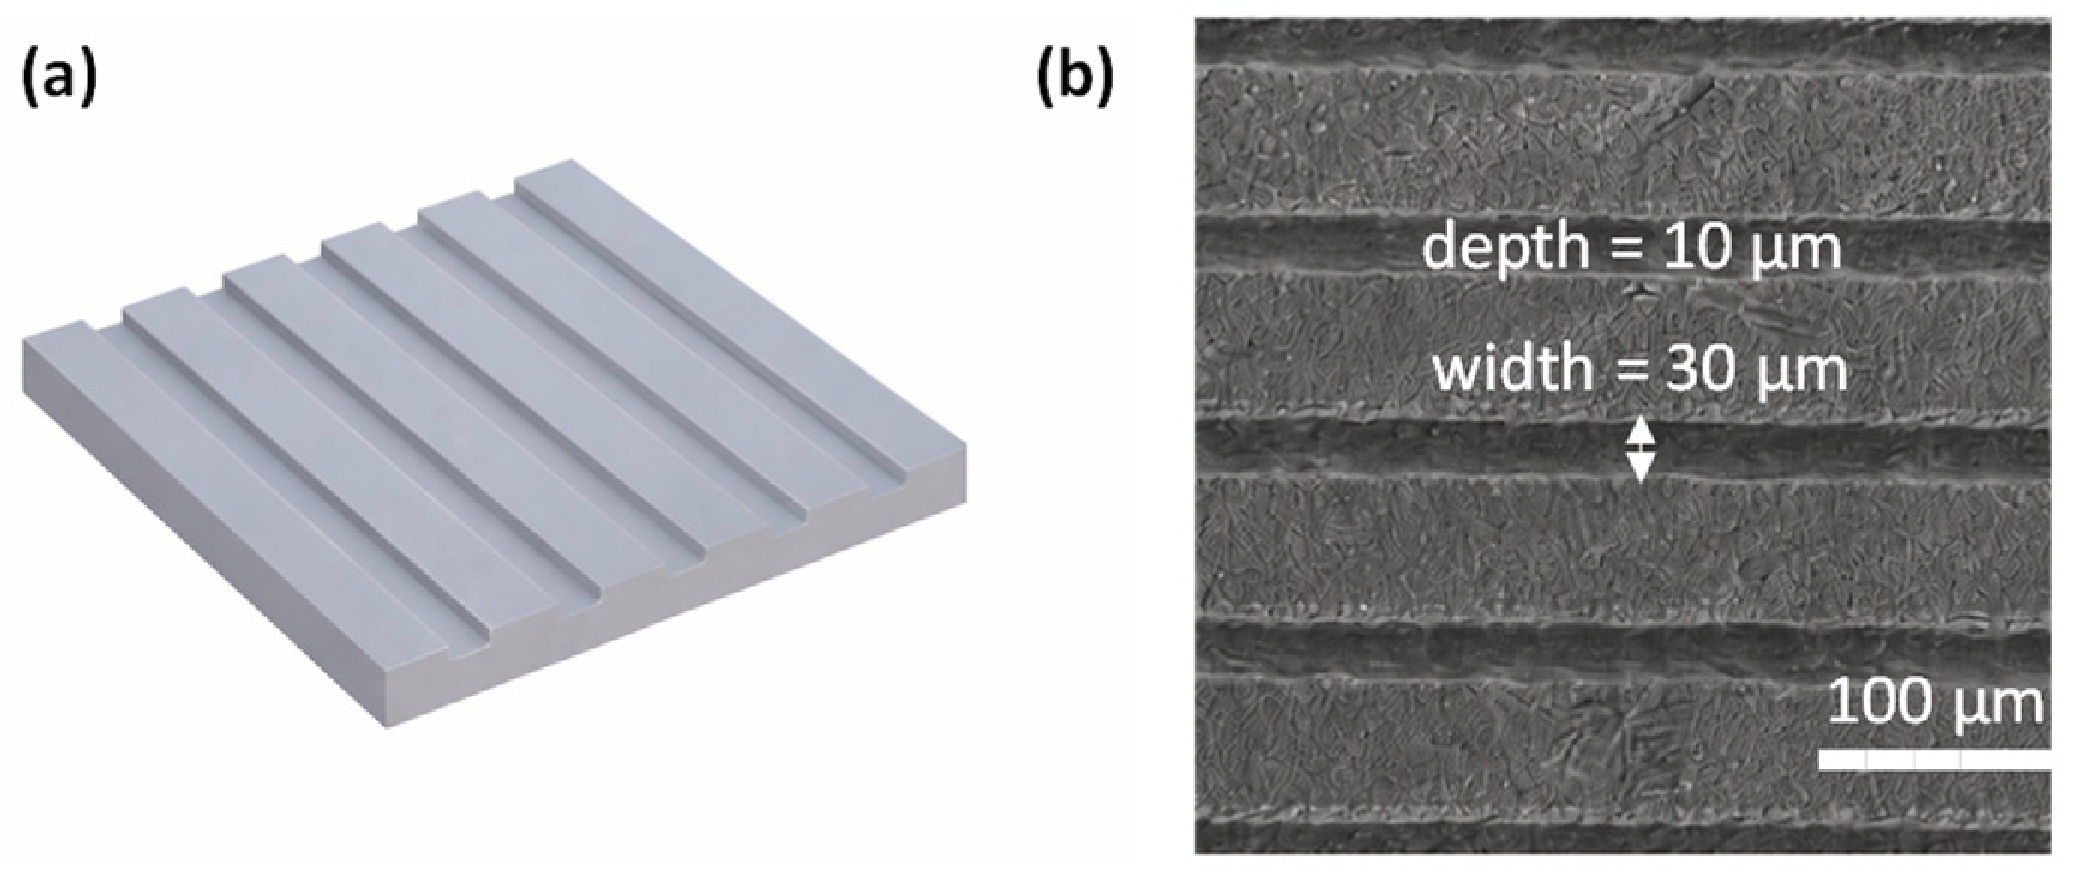
A periodicity of 30 µm was chosen to match the typical microgroove width reported for bio-functional surfaces [35,36,37,38]. The target peak-to-valley difference was set to 10 µm [35], which, in this work, corresponds to the height difference between sinusoidal peaks and troughs. In the microgroove literature, a comparable value is typically reported as the groove depth. Figure 3 summarizes the microgroove-inspired design parameters adopted here. Figure 3a shows the target geometry, while Figure 3b presents a representative SEM image acquired at 300× magnification.
Figure 3.
Microgroove-inspired design parameters for the bi-sinusoidal topography: (a) schematic of the target geometry not to scale; (b) representative SEM image at 300× magnification. The arrow indicates the groove width. Reproduced from Elsevier Ltd. [35] 2021.
The parameters used to create the bi-sinusoidal surface were determined by combining the 1D and 2D investigations. Based on the 1D results, the selected fluence had to remain close to the controlled low-fluence processing window, while the 2D results showed that more stable surface morphologies were obtained above 0.49 J/cm2 and that 50% overlap provided a compromise between ablation depth, roughness, and pulse accumulation. Therefore, a fluence of 1 J/cm2 was selected as a slight extension of the upper 2D range investigated, close to 0.87 J/cm2, to provide sufficient material removal for reaching the targeted peak-to-valley amplitude. At this fluence, the crater diameter was 21 µm, and both the spot overlap and hatch overlap were set to 50%. The scanning speed and repetition rate were set to 50 mm/s and 5.88 kHz, respectively. A slicing step of 100 nm was applied for precise depth control. To ensure homogeneous texturing, four scanning orientations were used: 0°, 90°, 180°, and 270°.
3. Results and Discussion
3.1. One-Dimensional Results—Laser–Material Interaction and Ablation Behavior
3.1.1. Ablation Threshold Determination
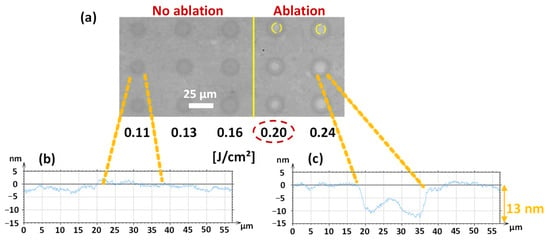
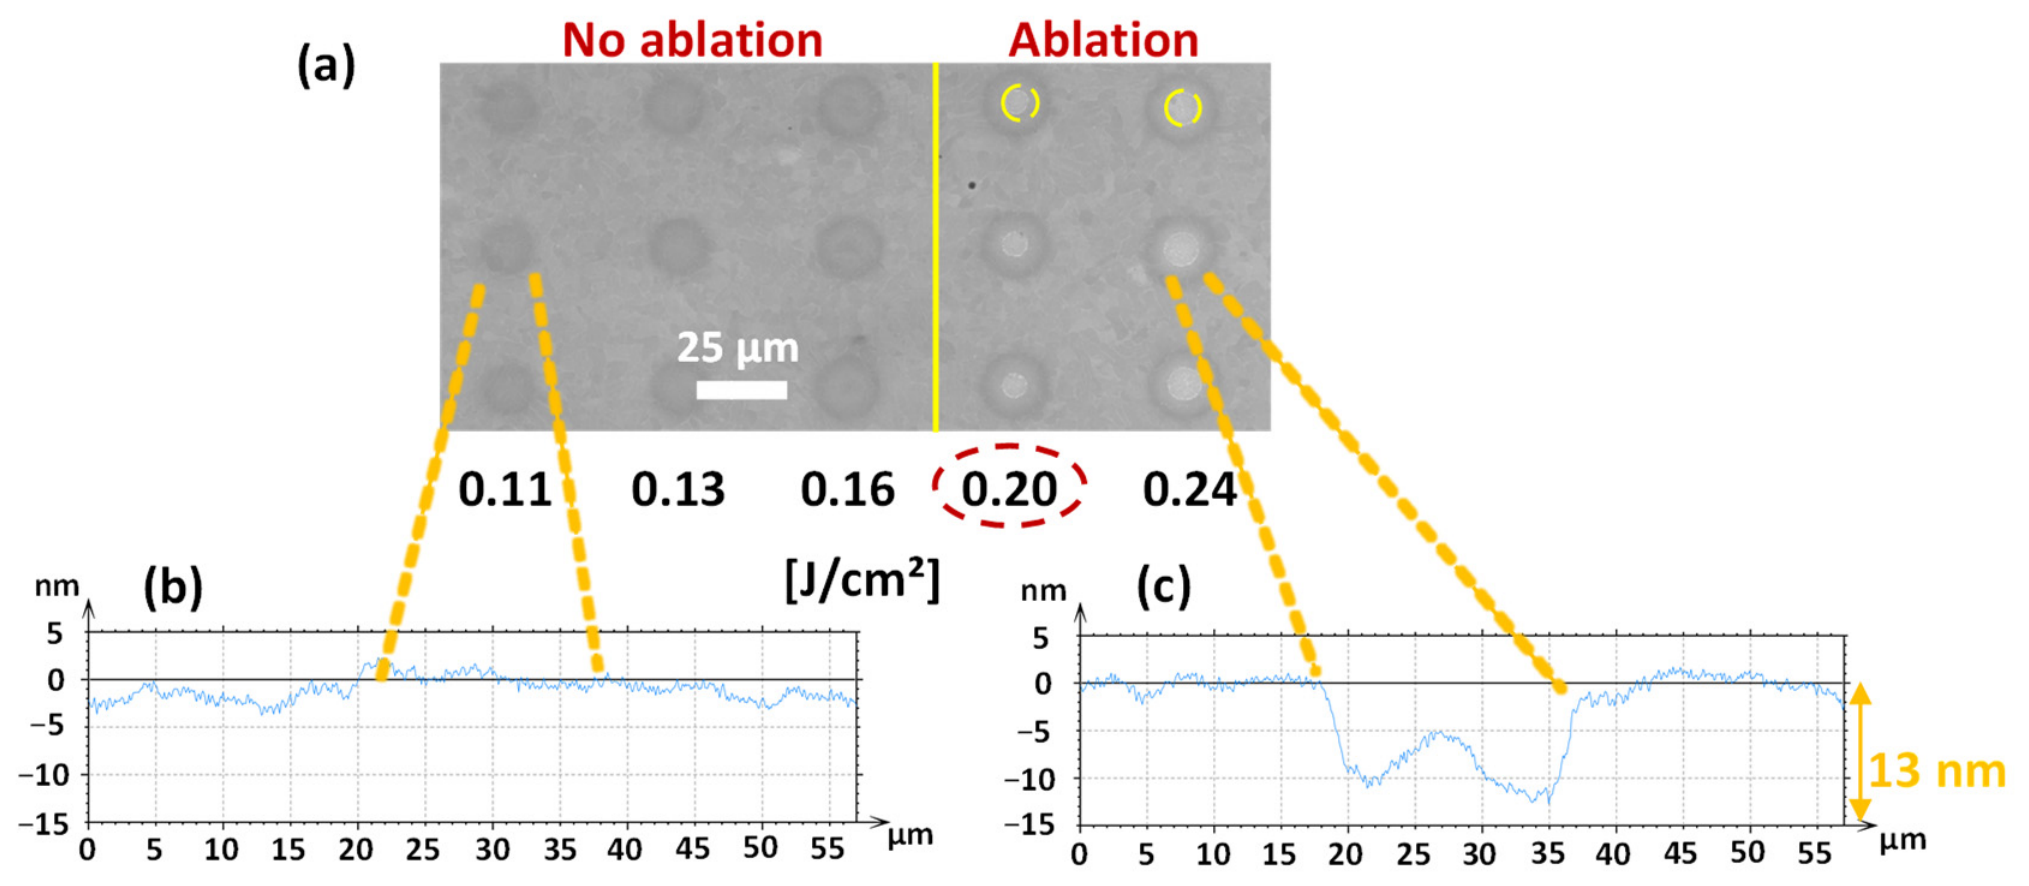
The ablation threshold was initially estimated through single-pulse irradiations performed at increasing fluence levels. In this preliminary assessment, the threshold was defined as the lowest incident fluence at which a visible crater associated with a negative depth profile was detected. Figure 4a shows an SEM image of the irradiated Ti-6Al-4V surface, where the laser-induced marks produced at fluences ranging from 0.11 to 0.24 J/cm2 are visible. Each vertical line corresponds to repeated irradiations performed under identical conditions, with representative repetitions shown from a total of 30 measurements.
Figure 4.
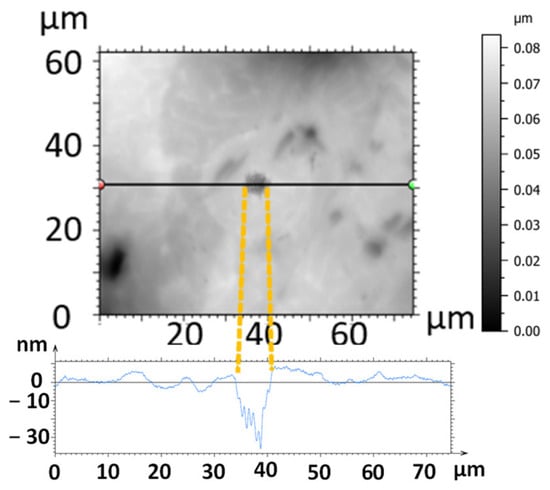
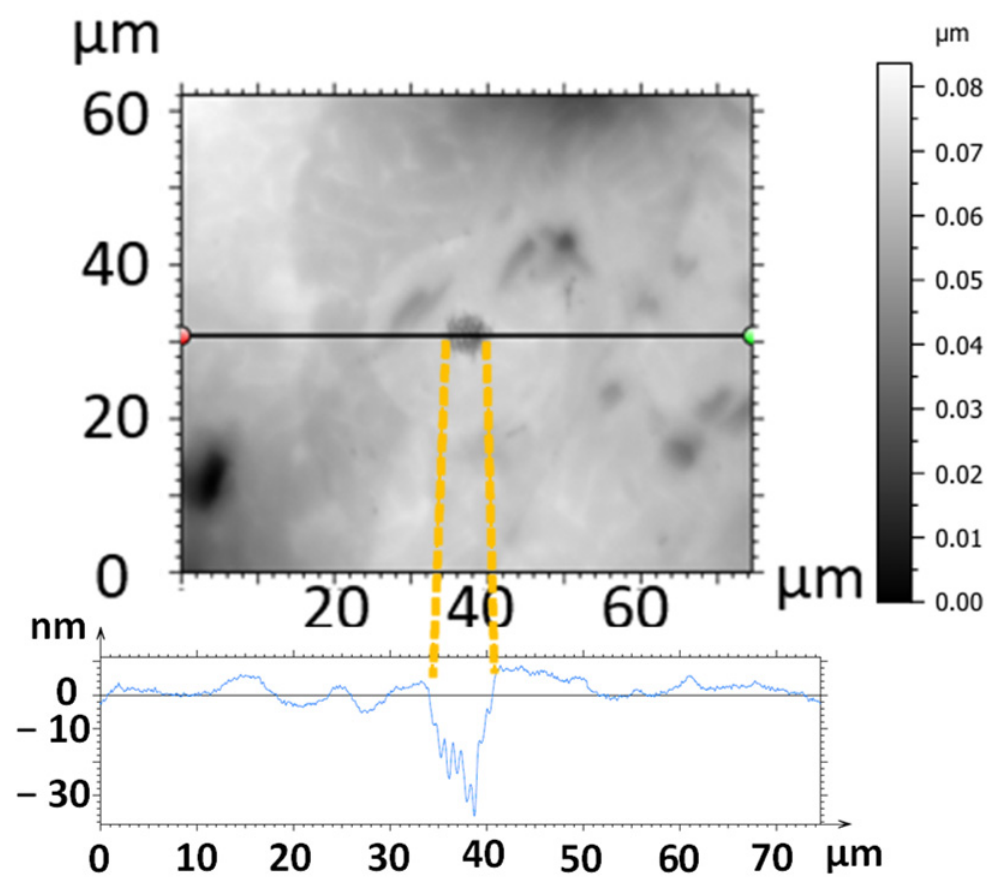
Single-pulse irradiation marks on Ti-6Al-4V: (a) SEM image at fluences from 0.11 to 0.24 J/cm2, (b) surface profile of a dark non-ablated spot, and (c) surface profile of an ablated spot showing a depth of about 13 nm. Yellow circles indicate the ablated areas.
At fluences of 0.11, 0.13, and 0.16 J/cm2, the dark spots observed in Figure 4a did not exhibit measurable material removal. This is confirmed by the corresponding surface profile in Figure 4b, which shows the absence of crater formation and indicates that these features should be attributed to non-ablative surface modification rather than ablated areas. In contrast, ablation became detectable at an incident fluence of 0.20 J/cm2, as illustrated in Figure 4c, where the selected spot exhibits a negative depth profile of about 13 nm. This initial estimate was subsequently refined using the Liu method [39], allowing a more accurate determination of the ablation threshold.
For a more quantitative evaluation, the ablation threshold was determined using the Liu formalism Equation (3) [39]. Using this approach, the single-pulse ablation threshold was found to be 0.175 J/cm2. Identical values were obtained for linear and circular polarization, indicating that polarization had no effect on the threshold under the present conditions.
After threshold determination, single-pulse irradiation was performed at a fluence of 0.89 J/cm2. This value was not selected as a fixed multiplier of the ablation threshold, but as a representative moderate-fluence condition above the near-threshold range, while remaining below 1 J/cm2 and, therefore, within the gentle ablation regime [26,27]. This fluence was used to examine the morphology of an isolated ablated spot by SEM.
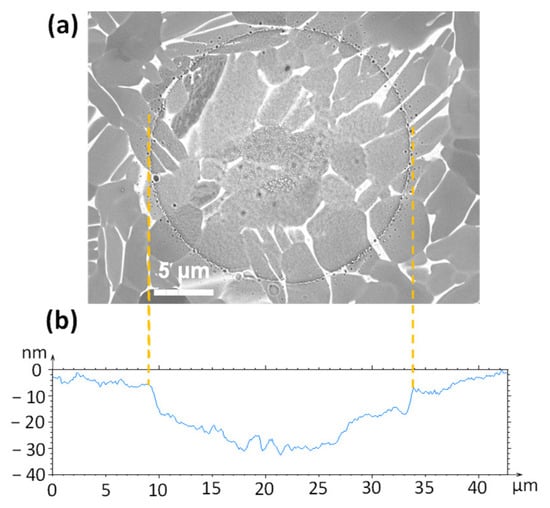
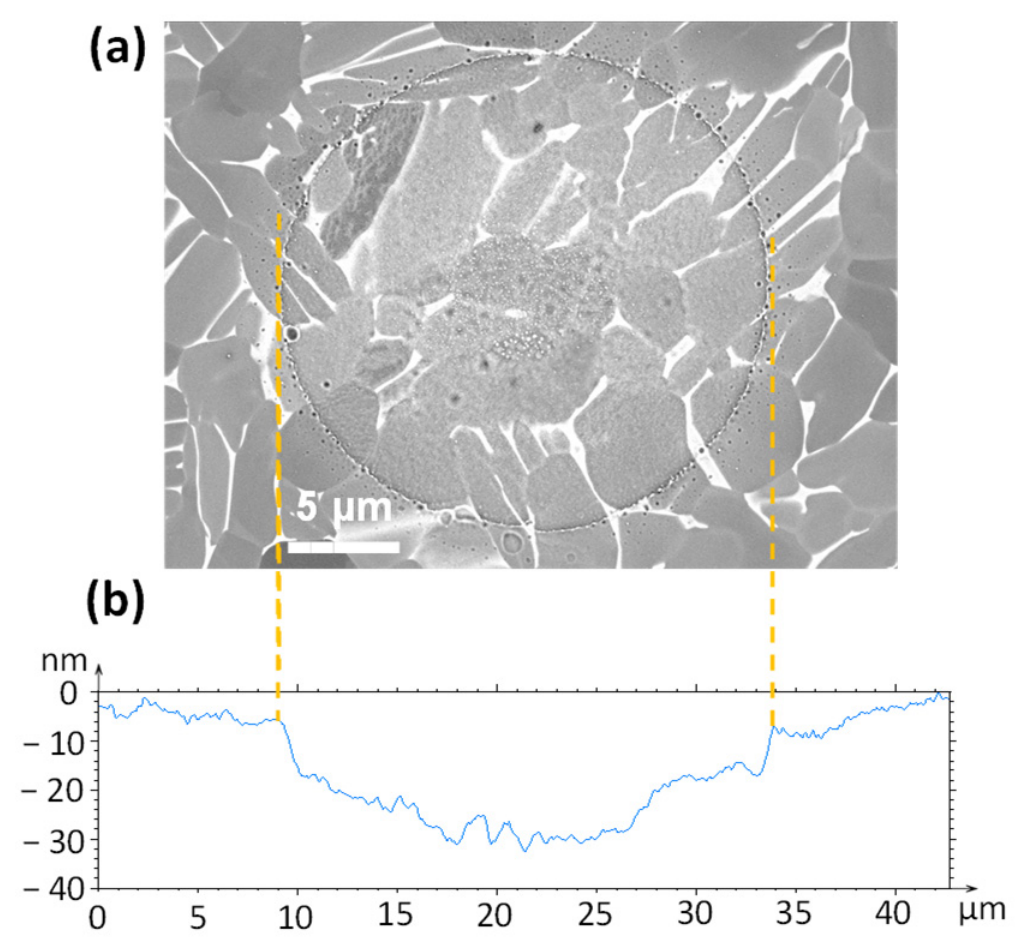
The corresponding spot profile indicates a shallow ablation depth of about 26 nm Figure 5b. SEM observations of the irradiated area in Figure 5a show that a continuous grain structure still exists in the irradiated region after one moderate-fluence pulse. Minor redeposited debris is observed around the irradiated area. Although the SEM image does not show a direct reduction in grain sizes, it is assumed that the grain size has been reduced due to ablation-induced material loss, while microstructural coherence has been preserved. This supports operating close to the processing threshold, as it produces well-defined surface features in the gentle ablation regime and helps limit collateral effects such as excessive melting, cracking, and recast layers.
Figure 5.
(a) SEM image of a single-pulse laser spot at 0.89 J/cm2, showing grain continuity in the microstructure; (b) interferometric profile of the laser-ablated crater.
The ablation threshold values determined in this work differ from those reported for Ti-6Al-4V in previous studies. Table 1 provides a representative summary of the ablation thresholds reported in the literature and results from this work.
Table 1.
Summary of reported (literature) and obtained (this work) laser ablation thresholds for pure titanium and Ti-6Al-4V across different wavelengths and pulse duration conditions.
Taken together, the results indicate that the processing threshold depends on pulse duration, wavelength, material, and surface preparation. Therefore, establishing the threshold under the specific experimental conditions was essential. Furthermore, using a fluence near the threshold is advantageous, as it produces cleaner and more sharply defined surface modifications while reducing unwanted side effects and debris redeposition.
3.1.2. Crater Diameter Evolution with Fluence
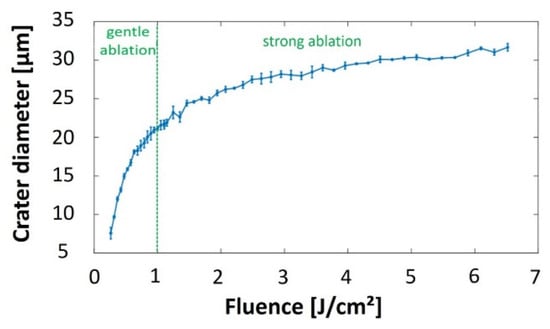
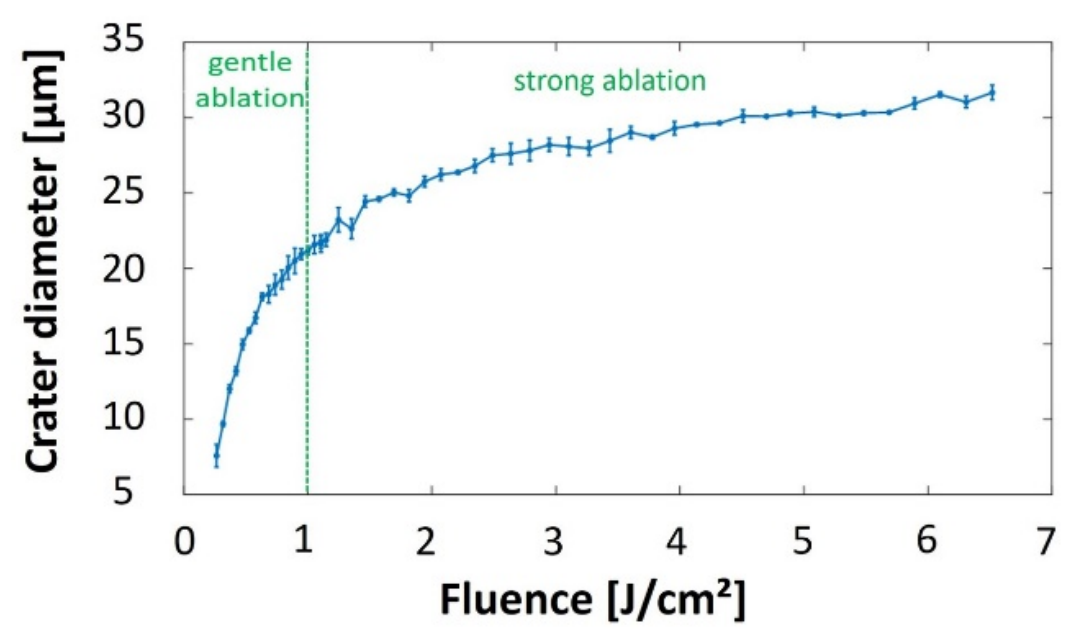
After determining the ablation threshold, the dependence of the ablated crater diameter on incident fluence was examined. As expected, the diameter increased progressively with fluence, reflecting the logarithmic behavior predicted by the Liu model [39]. Figure 6 presents the measured crater diameters over the investigated fluence range, from just above threshold to higher values. At low fluence, the ablated diameter remained smaller than the optical spot size and reached the nominal value of 24.8 µm at around 1.46 J/cm2. At higher fluence, the crater diameter exceeded the optical spot size, indicating stronger energy coupling and more efficient material removal.
Figure 6.
Crater diameter versus incident laser fluence for Ti-6Al-4V.
These results are consistent with the literature, where the diameter increases with fluence [15,24,25]. This trend supports the existence of two ablation regimes. Below 1 J/cm2, ablation occurs in a gentle regime where the ablation depth is mainly governed by the optical penetration depth, with limited thermal effects. Above 1 J/cm2, the increased density of hot electrons makes electronic heat conduction significant, extending the effective heat penetration depth and leading to a stronger ablation regime associated with melting and possible phase explosion [26,27].
3.1.3. Effect of Pulse Number on Crater Diameter and Depth
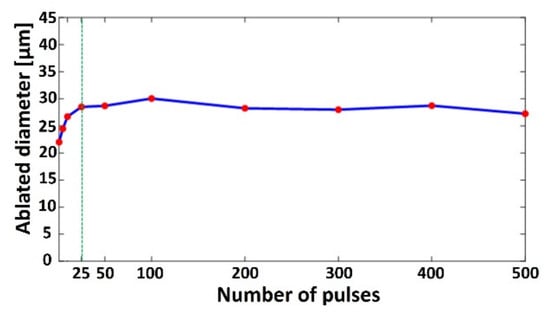
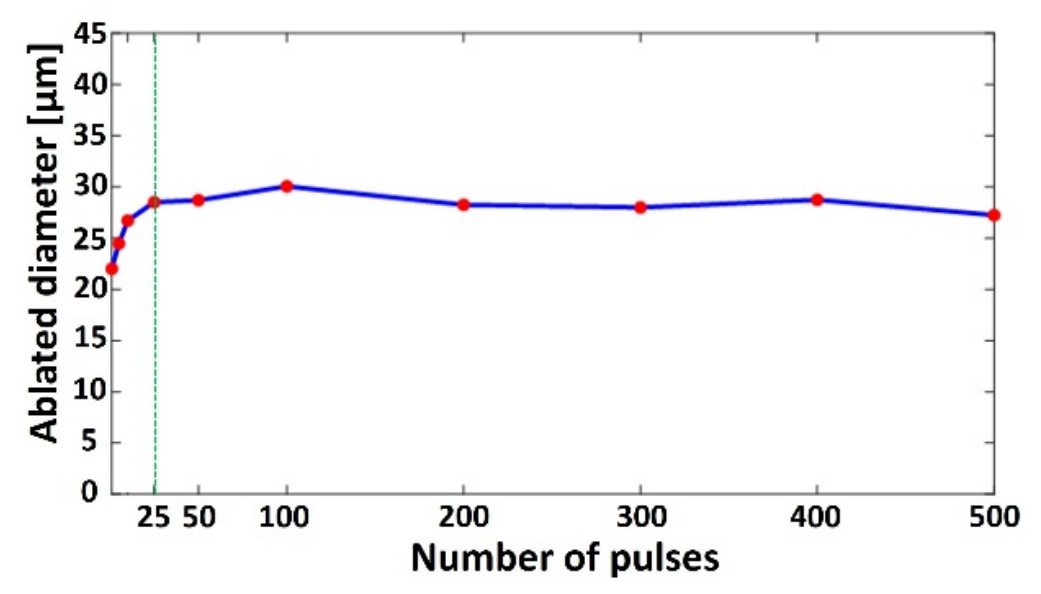
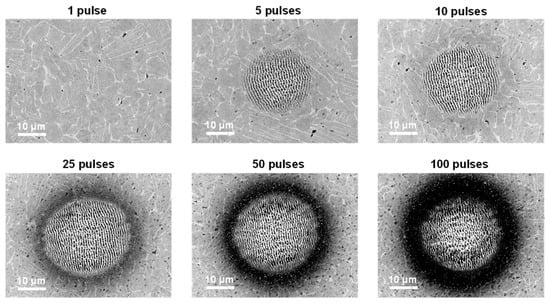
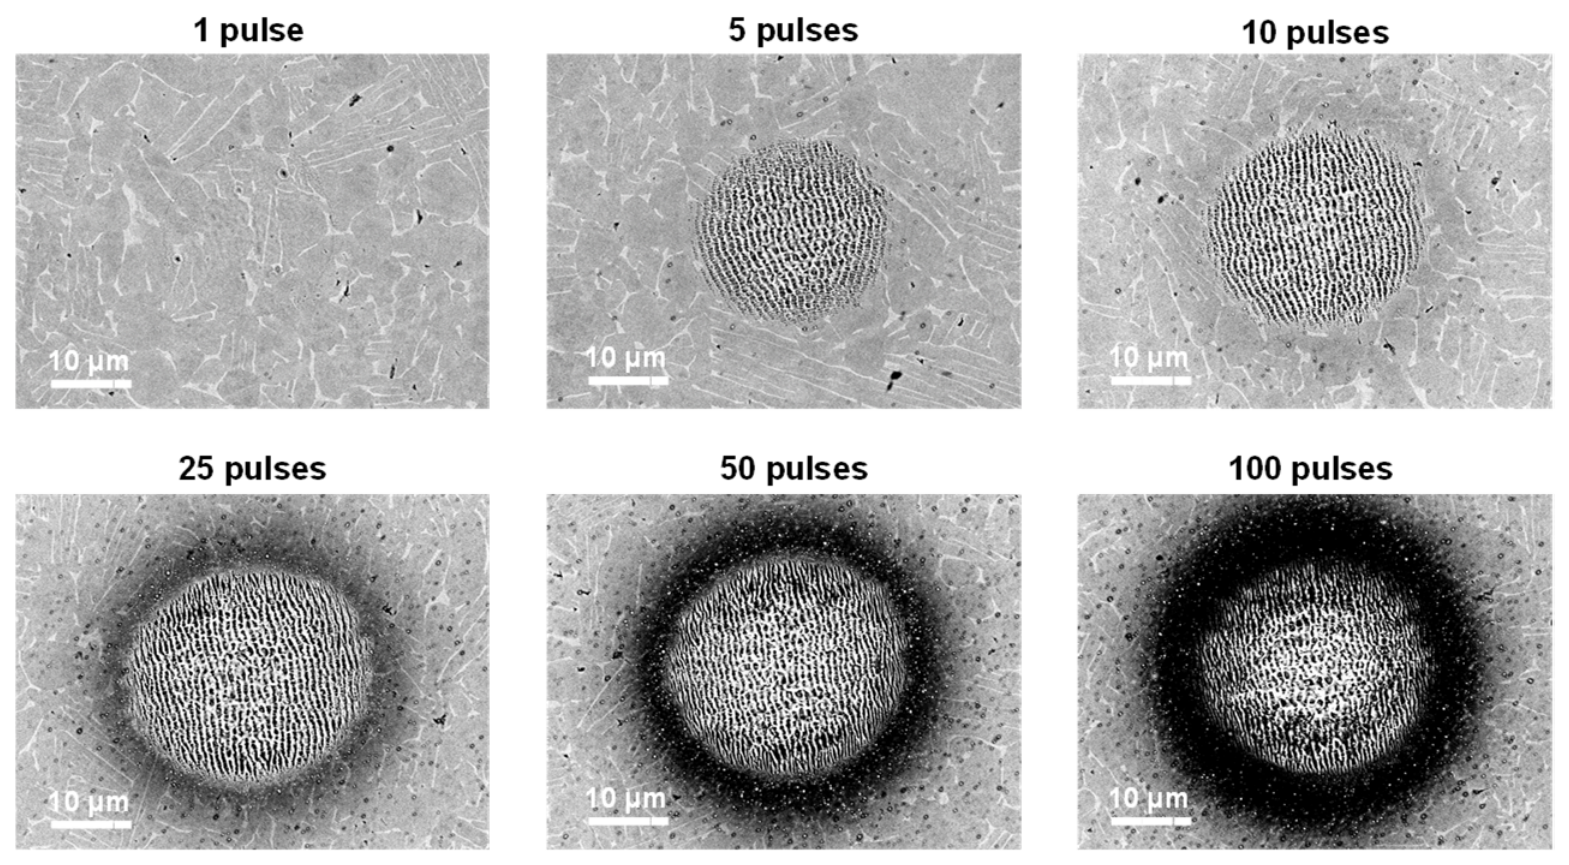
The influence of the pulse number on crater diameter was studied by applying successive pulses at a fixed position. Figure 7 shows the crater diameter evolution at 0.89 J/cm2. The diameter increased progressively over the first 25 pulses and then remained essentially constant. The initial growth is attributed to incubation and cumulative effects, which lower the effective ablation threshold so that regions near the crater edge, initially below threshold, eventually reach the threshold and begin to ablate and expand laterally. After this transient stage, the crater diameter reached a steady state because the local fluence at the crater edges became insufficient to sustain further lateral ablation due to the Gaussian beam profile. Therefore, additional pulses mainly contribute to crater deepening and surface modifications, such as redeposition and oxidation, rather than further diameter enlargement. This behavior is illustrated by the SEM images in Figure 8 for 1, 5, 10, 25, 50, and 100 pulses.
Figure 7.
Ablated crater diameter versus pulse number at 0.89 J/cm2 for Ti-6Al-4V. The red dots represent the investigated pulse counts, and the green vertical line indicates 25 pulses.
Figure 8.
SEM images of craters formed by multiple pulse irradiation (1, 5, 10, 25, 50, and 100 pulses) at 0.89 J/cm2.
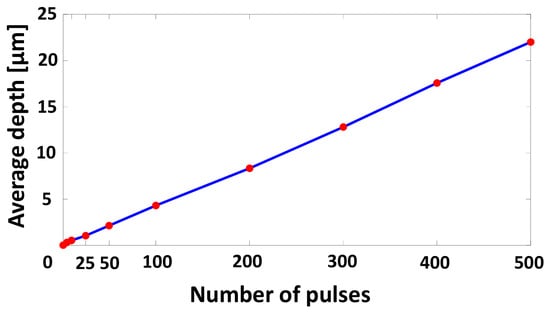
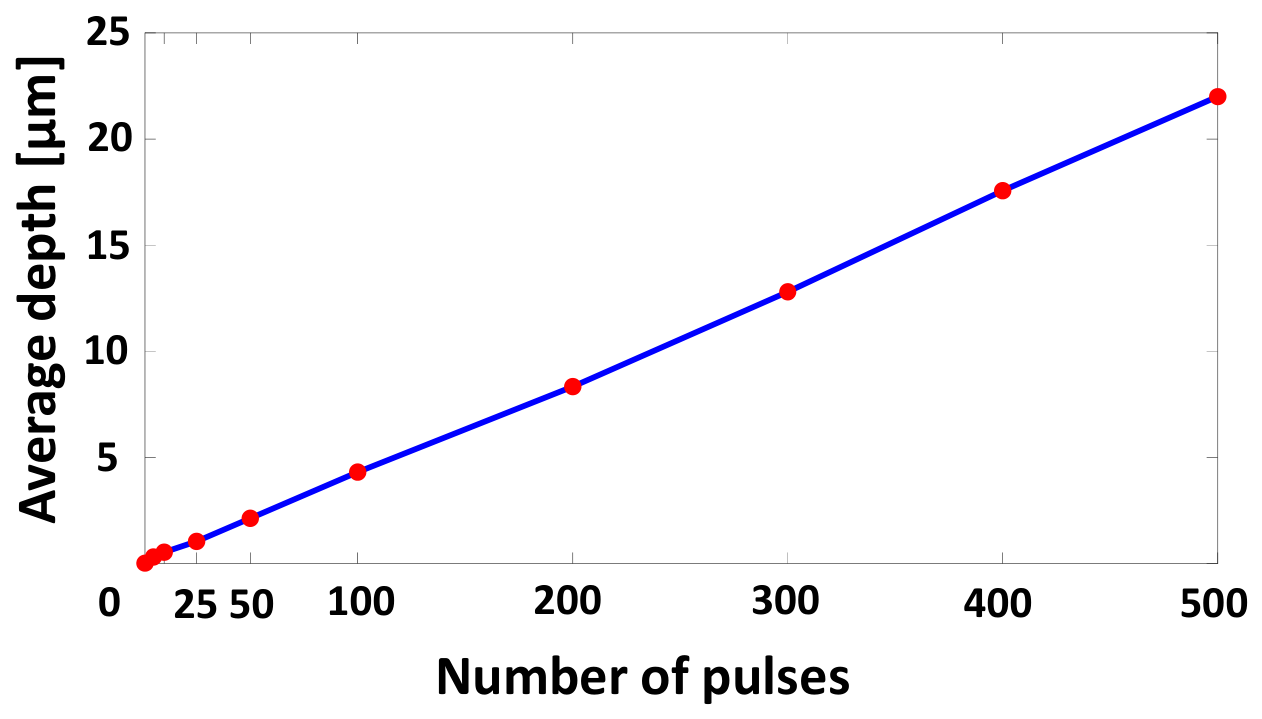
After that, the average ablated depth was measured, with results shown in Figure 9. The ablation depth increases quasi-linearly with the number of pulses over the investigated range. It rose from approximately 2 µm at 50 pulses to 22 µm at 500 pulses, confirming progressive material removal under repeated irradiation. This strong increase is attributed to cumulative material removal under repeated irradiation, where each additional pulse removes material from the crater’s bottom and progressively deepens the crater. This trend is in agreement with [41], which shows a linearity between the two parameters for relatively shallow craters when the depth-to-diameter ratio is less than 1. It has been reported that depth increases linearly until 103 pulses, beyond which the ablative depth reaches a saturation level [29]. This saturation is explained by the fact that, as the crater becomes deeper, the laser hits the sidewalls more obliquely and more light is reflected instead of absorbed, with multiple reflections occurring inside the cavity.
Figure 9.
The average ablated crater depth versus pulse number at 0.89 J/cm2 for Ti-6Al-4V. The red dots represent the investigated pulse counts.
Together with recast layer formation, this reduces the energy delivered to the material; therefore, ablation becomes less efficient, and the depth eventually saturates. Another important point is that as the crater deepens, the laser focus is no longer located at the bottom surface, which reduces the local energy density and further limits efficient ablation.
In this section, the crater diameter is observed to increase with pulse number, consistent with most previous studies [6,24,27,28].
The results further confirm that the ablated diameter depends on both fluence and pulse number [21,24] rather than on fluence alone, as proposed in [15,25]. Additionally, a saturation of the diameter is observed beyond 25 pulses at 0.89 J/cm2. This result is consistent with previous studies, which reported saturation occurring from 20 pulses at 0.42 J/cm2 [28] and from 45 pulses at different energy levels (E = 29.0 µJ, 55.2 µJ, 101.6 µJ, 127.6 µJ, 149.0 µJ) [24].
This is also consistent with the results of [29], who reported that the ablation depth grows almost linearly with the number of laser pulses in the initial stages. They additionally noted that this linear regime holds for roughly 103 pulses, beyond which the ablative depth slowly reaches a saturation level. They additionally noted that this linear regime holds; the SEM images reveal increased redeposition within and around the crater [20], along with progressive oxidation [42,43].
3.1.4. Incubation Effect Under Sub-Threshold Multi-Pulse Irradiation
To evaluate whether pulse accumulation can initiate ablation below the single-pulse threshold, multi-pulse irradiations were performed at a fixed position using 1, 2, 5, 10, and 20 pulses. Three sub-threshold fluence levels were investigated: 0.09 J/cm2, 0.13 J/cm2, and 0.16 J/cm2. These values were selected to progressively approach the single-pulse ablation threshold of 0.175 J/cm2 while remaining below it. This combination of fluence levels and pulse numbers enables the onset and evolution of cumulative surface modification to be assessed without introducing an excessive number of test conditions. After a single pulse at these fluences, no ablation was observed. Instead, dark surface marks were visible, which are attributed to modification phenomena such as localized oxidation, partial carbonization, or structural changes rather than true material removal (see Section 3.1.1. Ablation Threshold Determination). However, when the number of pulses increased, the effective threshold gradually reduced. Ablation craters were detected for 10 pulses at 0.16 J/cm2, and for 20 pulses at 0.13 J/cm2. Figure 10 illustrates a representative crater produced with 10 pulses at 0.16 J/cm2.
Figure 10.
Three-dimensional surface profilometry image obtained by interferometry and treated on MountainsMap showing a crater produced by 10 pulses at 0.16 J/cm2 on Ti-6Al-4V.
The extracted profile in Figure 10 indicates that ablation occurs for fluences below the single-pulse threshold. This result shows that while a single pulse below the threshold is not enough to ablate material, the cumulative energy and effect of repeated exposure can lead to material removal once the cumulative fluence simulates the ablation threshold. This is similar to classical incubation: repeated irradiation accumulates structural defects, increases light absorption, and eventually reduces the fluence threshold for ablation. The incubation effect is always present during multi-pulse irradiation, regardless of whether the applied fluence is below or above the ablation threshold. These findings highlight the importance of accounting for multi-pulse effects in process optimization.
As previously introduced in the introduction, for a given number of laser pulses , the threshold fluence can be determined using the incubation model [27], as presented in Equation (5):
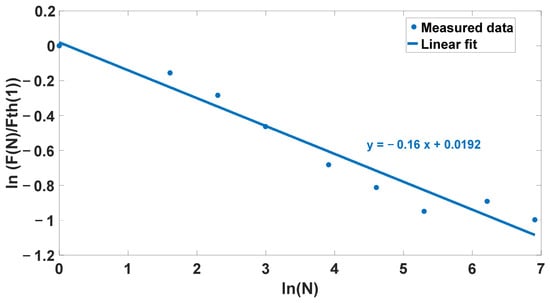
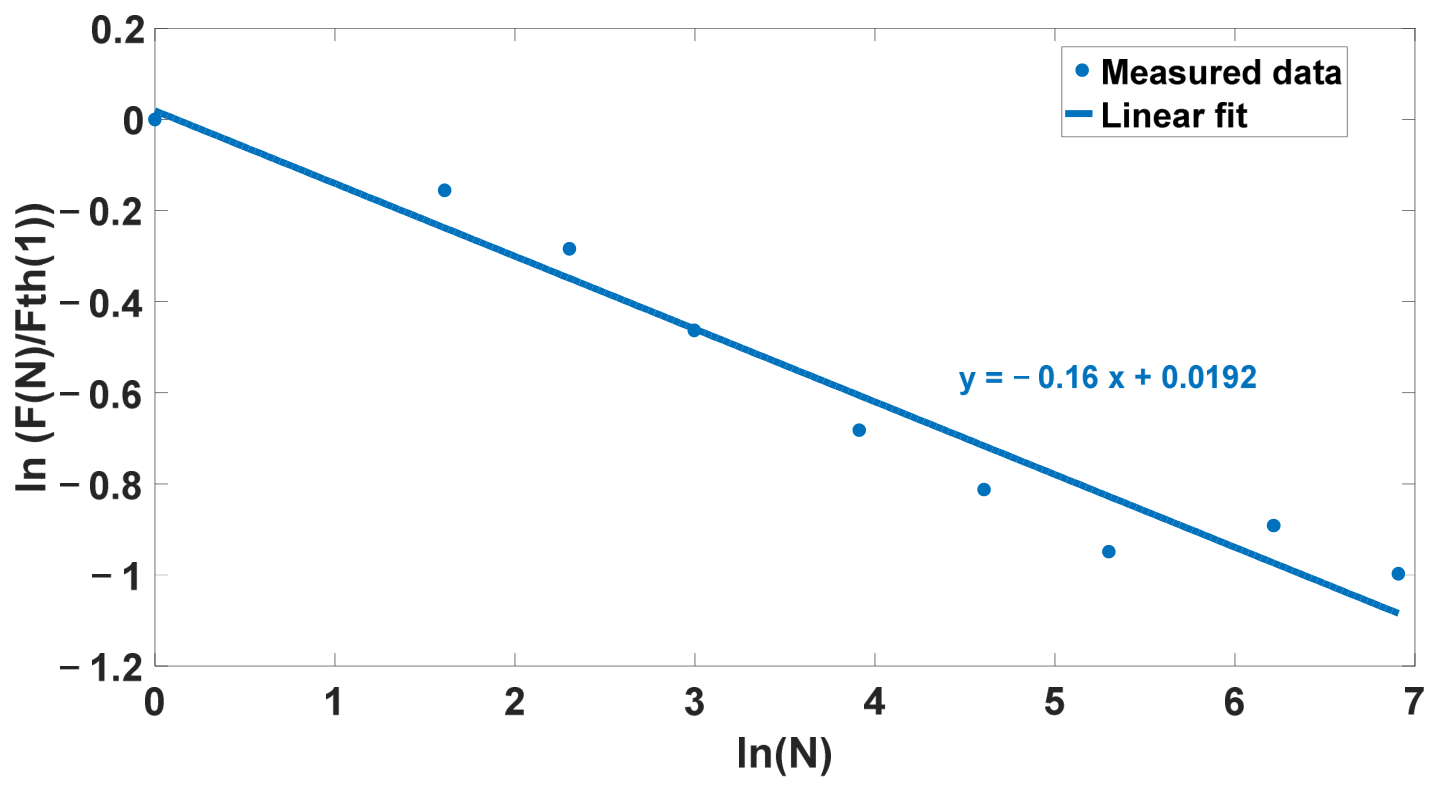
The threshold fluence was calculated for each number of pulses: 1, 5, 10, 25, 50, and 100. The data were then plotted on a log–log scale as ln(F(N)/Fth(1)) versus ln(N). The resulting curve is shown in Figure 11. According to the incubation model, the logarithmic representation is expected to be linear, with the fitted slope corresponding to S = m + 1. Therefore, the linear trendline was used to estimate the incubation factor, yielding S = 0.84.
Figure 11.
Evolution of ln(F(N)/Fth(1)) vs. ln(N). The linear trendline is shown to estimate the incubation factor.
In this step, the incubation factor S for Ti-6Al-4V was determined to be 0.84, indicating that cumulative energy deposition under multi-pulse irradiation reduces the effective ablation threshold. As mentioned in the introduction, reported S values for Ti-6Al-4V vary between studies, reflecting their dependence on laser parameters and experimental conditions. The value reported in this work is closest to that of [15] with only minor differences expected. Ultimately, there is no single “correct” incubation factor since it strongly depends on experimental conditions and laser parameters such as wavelength, pulse duration, and surface preparation.
3.2. Two-Dimensional Results—Planar Scanning
3.2.1. Evolution of Ablated Zone Depth with Number of Passes
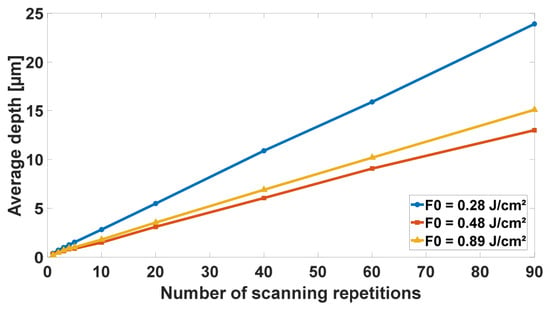
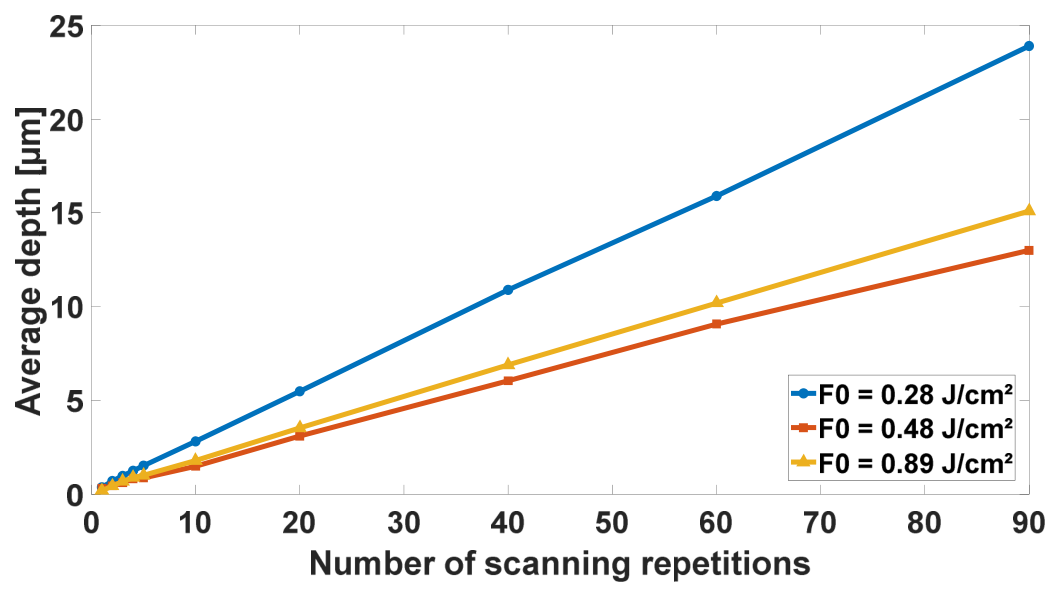
Figure 12 shows that the ablation depth of 2D textured zones increases as a function of the number of passes for all three tested fluences: 0.28 J/cm2, 0.48 J/cm2, and 0.89 J/cm2. The overlapping spots and hatching were both set to 50%. In each case, depth grew approximately linearly up to 90 passes, indicating a nearly constant material removal contribution per scan. This behavior is in line with the observations reported in Section 3.1.3, where the accumulation of pulses at a fixed position produced a progressive deepening of the craters before reaching saturation. Under 2D scanning, the spatial redistribution of the laser energy over the scanned area can favor a more regular depth evolution. Overall, these results indicate that depth can be controlled reliably by adjusting the number of passes within the investigated range, although deviations may occur at higher pass numbers due to cumulative effects, redeposition, or changes in surface properties.
Figure 12.
Average ablated depth of 2D textured zones as a function of the number of passes for three different fluences (0.28, 0.48, and 0.89 J/cm2). Both the overlap and the hatch were set to 50%.
An additional observation is that the greatest depth was obtained with the lowest fluence, F0 = 0.28 J/cm2. This behavior can be explained by considering the cumulative fluence delivered over the textured area rather than only the single-pulse fluence. Since the overlap and hatching were kept constant at 50% for all fluences, the spacing between spots changed with the spot size. At lower fluence, the ablated diameter is smaller, so more pulses are required to cover the same area. Therefore, the total number of pulses delivered to the surface differs from one fluence to another, as described by Equation (6), which can increase the cumulative irradiation effect at low single-pulse fluence and lead to deeper material removal. When the calculated number of pulses in either scanning direction was not an integer, the laser control software automatically rounded the value down to the nearest lower integer.
The cumulative fluence delivered over the textured area was calculated by dividing the total delivered pulse energy by the irradiated surface area. For each fluence condition, the total delivered energy was obtained from the product of the total number of pulses delivered over the surface and the single-pulse energy defined in Equation (1). The cumulative fluence Fcum was calculated according to Equation (7).
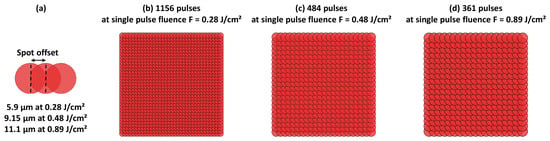
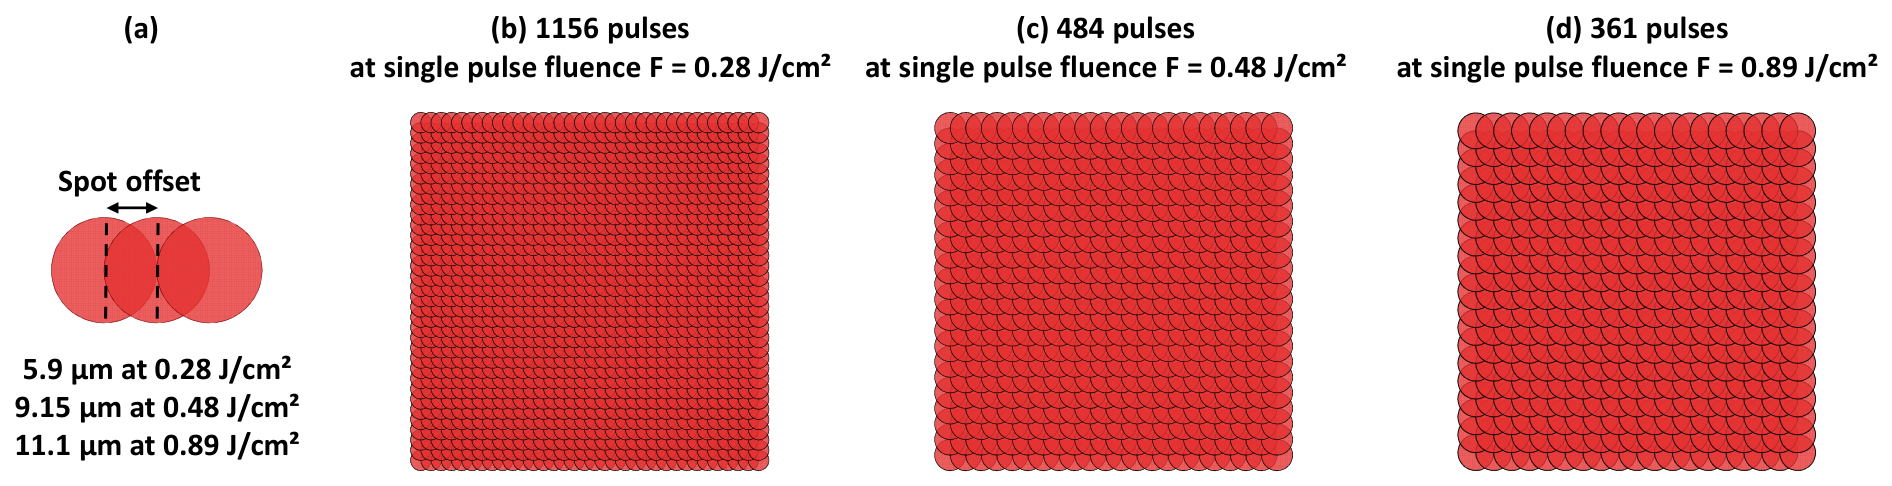
Based on the equations mentioned above, the total fluence delivered over the entire irradiated surface was calculated to be 1.95 J/cm2 for a single-pulse fluence of 0.28 J/cm2, 1.40 J/cm2 for 0.48 J/cm2, and 1.93 J/cm2 for 0.89 J/cm2. Figure 13 illustrates the spot offset definition and the corresponding pulse distribution maps for the investigated fluence conditions. The calculated number of pulses delivered over the irradiated surface was 1156 pulses at 0.28 J/cm2 (Figure 13b), 484 pulses at 0.48 J/cm2 (Figure 13c), and 361 pulses at 0.89 J/cm2 (Figure 13d). Thus, the lowest fluence condition required the largest number of pulses to cover the same textured area due to the smaller ablated spot diameter.
Figure 13.
(a) Spot offset definition (half ablated diameter), (b) pulse map at 0.28 J/cm2, (c) pulse map at 0.48 J/cm2, and (d) pulse map at 0.89 J/cm2.
The comparison between the depth curves also shows that the average cumulative fluence alone is not sufficient to fully describe the ablation depth. Although the cumulative fluences calculated for 0.28 and 0.89 J/cm2 are relatively close, their depth evolutions are clearly different, while the curves obtained at 0.48 and 0.89 J/cm2 remain closer to each other. This behavior can be explained by the different pulse distributions over the textured area. The 0.28 J/cm2 condition required a much larger number of pulses, which promotes stronger pulse accumulation and incubation effects, leading to a greater depth increase. In contrast, the 0.48 and 0.89 J/cm2 conditions involved closer numbers of delivered pulses, resulting in more similar depth increase trends. Moreover, when comparing different fluence conditions, the ablation efficiency does not necessarily increase proportionally with the single-pulse fluence since part of the delivered energy may contribute to redeposition, oxidation, plume/debris shielding, or thermal effects rather than effective material removal. Therefore, the ablated depth is governed by the combined effects of cumulative fluence, number of pulses, incubation, and ablation efficiency.
3.2.2. Influence of Fluence and Overlap on Surface Morphology
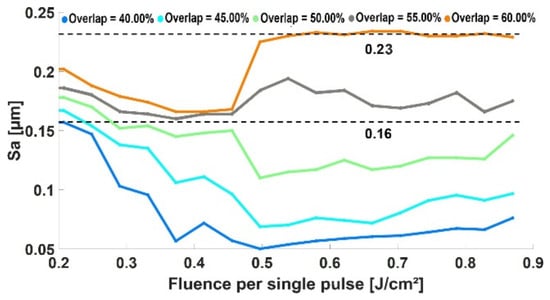
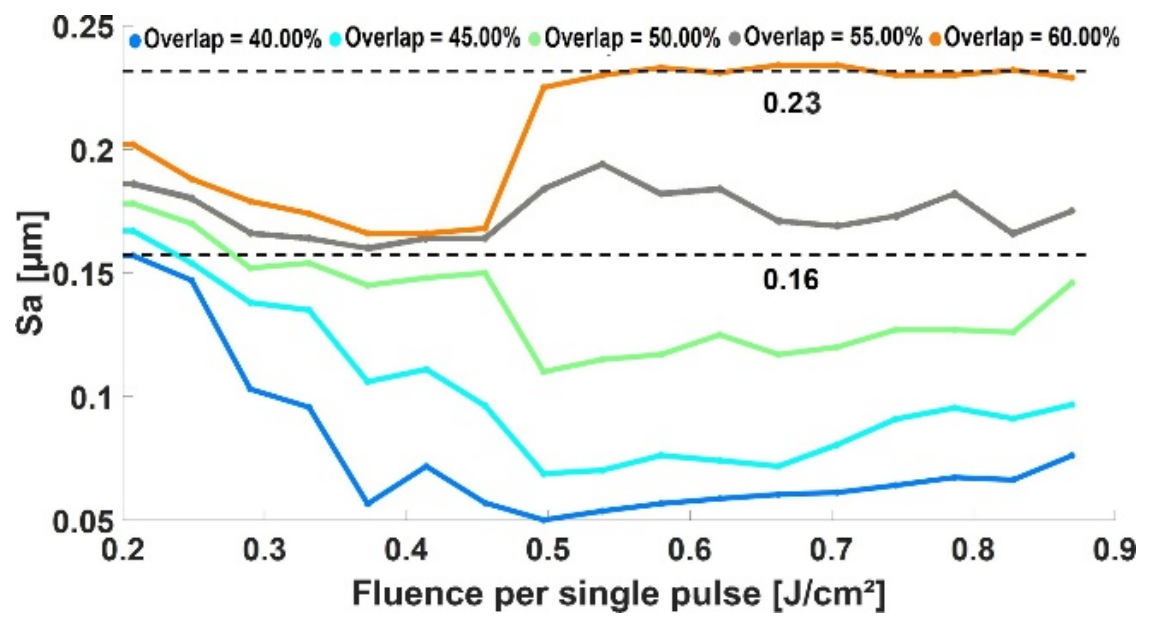
A total of 85 processing conditions were evaluated by combining several fluence levels with different spot overlaps, producing 85 textured surfaces. For each surface, a 125 × 125 µm2 central region was analyzed to avoid edge effects and ensure consistent topography characterization. Figure 14 shows the evolution of the areal roughness Sa as a function of the single-pulse fluence for various overlaps. A strong overlap dependence is observed. Increasing overlap from 40% to 60% systematically increases roughness over the entire fluence range. This indicates that pulse accumulation, and therefore the local number of pulses contributing to each point on the surface, plays a dominant role in surface roughening. At 60% overlap, Sa reaches the highest value of 0.23 µm for F0 = 0.49 J/cm2 and remains quasi-constant till 0.87 J/cm2, whereas at 40% overlap, Sa stays much lower. At lower overlaps, Sa decreases as the fluence increases from 0.20 to 0.49 J/cm2. For example, at 40% overlap, Sa drops from 0.16 µm to 0.05 µm at 0.49 J/cm2. A similar decrease is observed for the other overlap conditions, indicating more stable and homogeneous material removal away from the near-threshold regime. Between 0.49 J/cm2 and 0.87 J/cm2, Sa slightly increases for all cases, showing a more stable regime. At higher overlaps, the roughness increase is more marked.
Figure 14.
Evolution of the roughness parameter Sa as a function of single-pulse fluence and spot overlap. The dashed lines indicate reference Sa values of 0.23 µm and 0.16 µm.
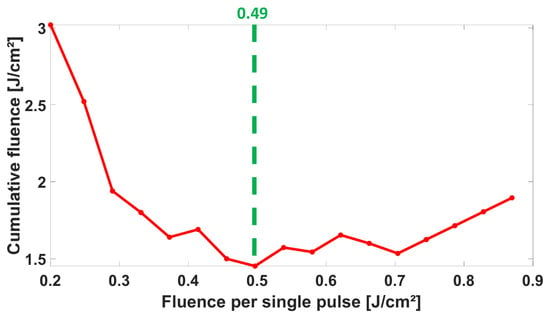
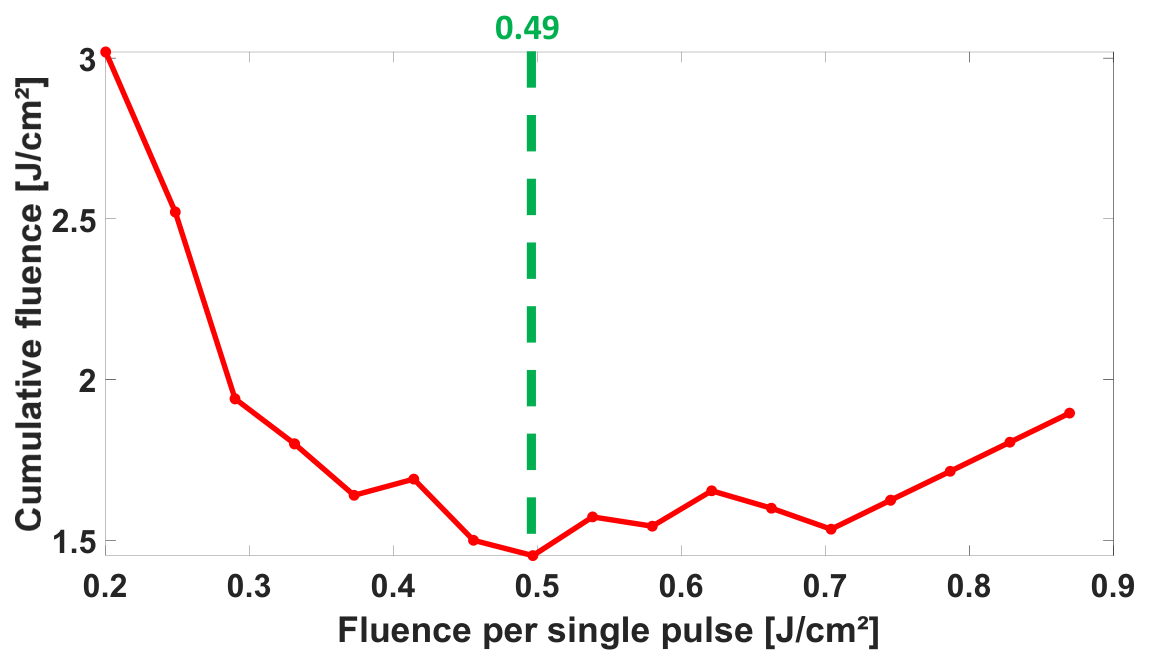
As a result, the cumulative delivered energy from 0.20 J/cm2 to 0.87 J/cm2 is shown in Figure 15. The rapid decrease in cumulative energy up to 0.49 J/cm2 is attributed to the sharp reduction in the number of delivered pulses. In this low-fluence range, the ablated spot diameter increases rapidly with fluence; therefore, under constant overlap and hatching conditions, fewer pulses are required to cover the same textured area. This reduction in pulse number dominates over the increase in single-pulse energy, leading to a rapid decrease in cumulative delivered energy.
Figure 15.
Cumulative fluence as a function of single-pulse fluence.
Below 0.49 J/cm2, the texture is primarily governed by the number of pulses. Whereas above 0.49 J/cm2, it is predominantly controlled by the cumulative energy. Consequently, the regime becomes more stable for cumulative energy above 0.49 J/cm2.
The minimum observed at 0.49 J/cm2 is justified. For a Gaussian beam, the ablated crater diameter follows the Liu relation Equation (2), meaning that the ablated crater size increases with fluence. Under a fixed overlap, a larger crater diameter implies a larger scan offset and therefore fewer pulses are required to cover a given area. By differentiating the energy, it is found to reach a minimum at e. Therefore, the fluence can be written as F0 = e·Fth. Using the nominal spot radius 12.4 µm and Fth = 0.175 J/cm2, this yields F0 ~ 0.49 J/cm2.
Based on the combined depth and roughness trends, an overlap of 50% was selected as a practical compromise. Lower overlaps (40–45%) produce smoother surfaces. However, they lead to lower ablation depths and less pronounced surface structuring. Consequently, more scan repetitions are needed to reach a given depth, leading to enhanced pulse accumulation and stronger incubation effects. It can also promote energy accumulation and debris redeposition over successive passes. Higher overlaps (55–60%) generate deeper textures. Additionally, they increase the amount of surface roughness substantially as more matter is melted and then deposited back onto the surface. Thus, a 50% overlap provides a balance as it ensures sufficient ablation depth and limits both excessive surface roughness and any unintended thermal effects. An overlap of 50% was kept for all subsequent texturing using a bi-sinusoidal surface texture method.
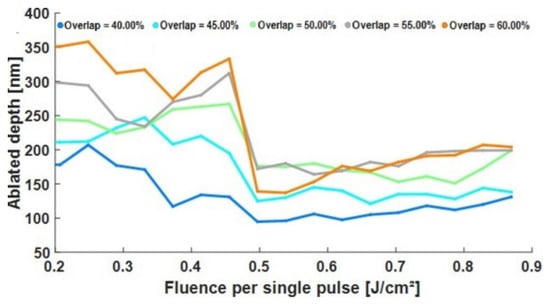
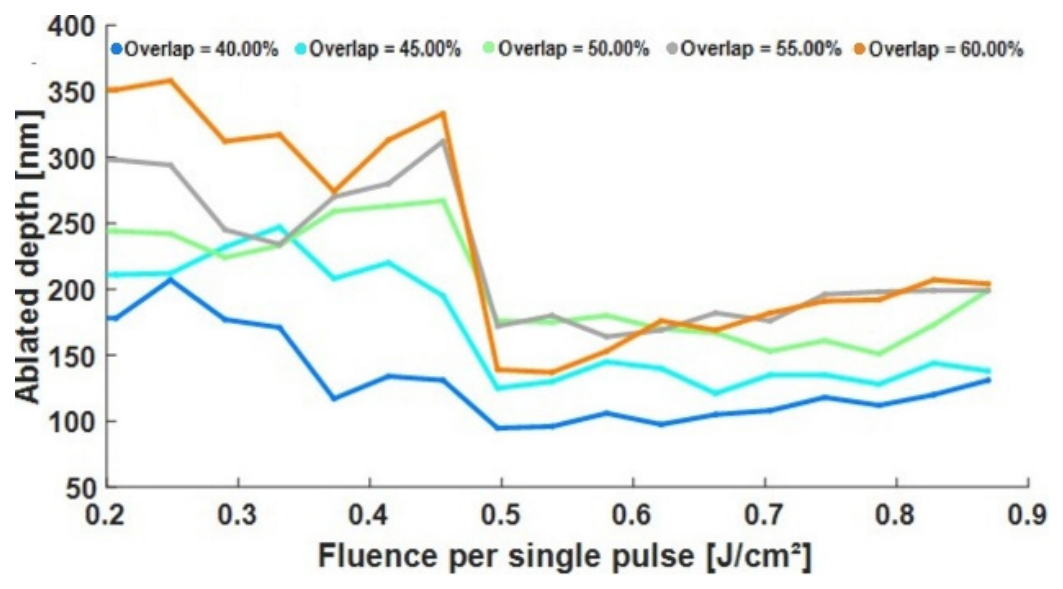
In Figure 16, the depth curves exhibit two main features. First, for a given single-pulse fluence, increasing the spot overlap systematically increases the ablated depth, which is consistent with a higher local pulse density and thus a larger cumulative delivered fluence per unit area. For example, at F0 = 0.2 J/cm2, the depth rises from 180 nm at 40% overlap to 350 nm at 60% overlap. Second, the depth does not evolve monotonically with fluence. A pronounced decrease occurs at 0.49 J/cm2, where the depth drops to 95–140 nm depending on the overlap. This is followed by a gradual increase toward 130–205 nm as fluence approaches 0.87 J/cm2. This non-monotonic behavior implies that not just the single-pulse fluence but the effective cumulative fluence delivered during scanning (which is a result of both pulse accumulation and spot overlap) determines depth. With increasing fluence, the ablation spot diameter also increases.
Figure 16.
Evolution of the ablated depth as a function of single-pulse fluence and spot overlap.
3.3. Three-Dimensional Results—Controlled Three-Dimensional Bi-Sinusoidal Texturing for Implant Applications
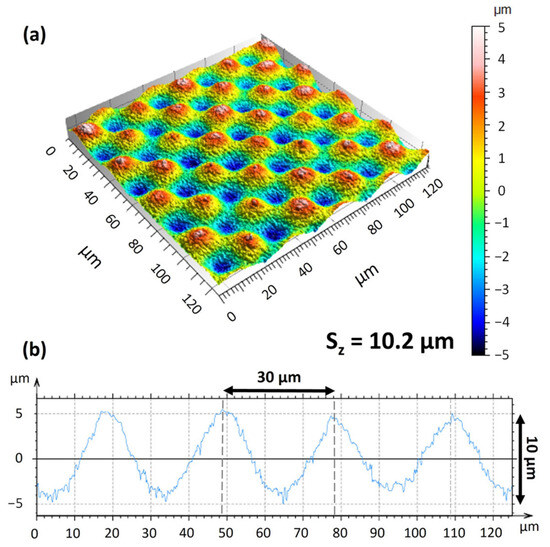
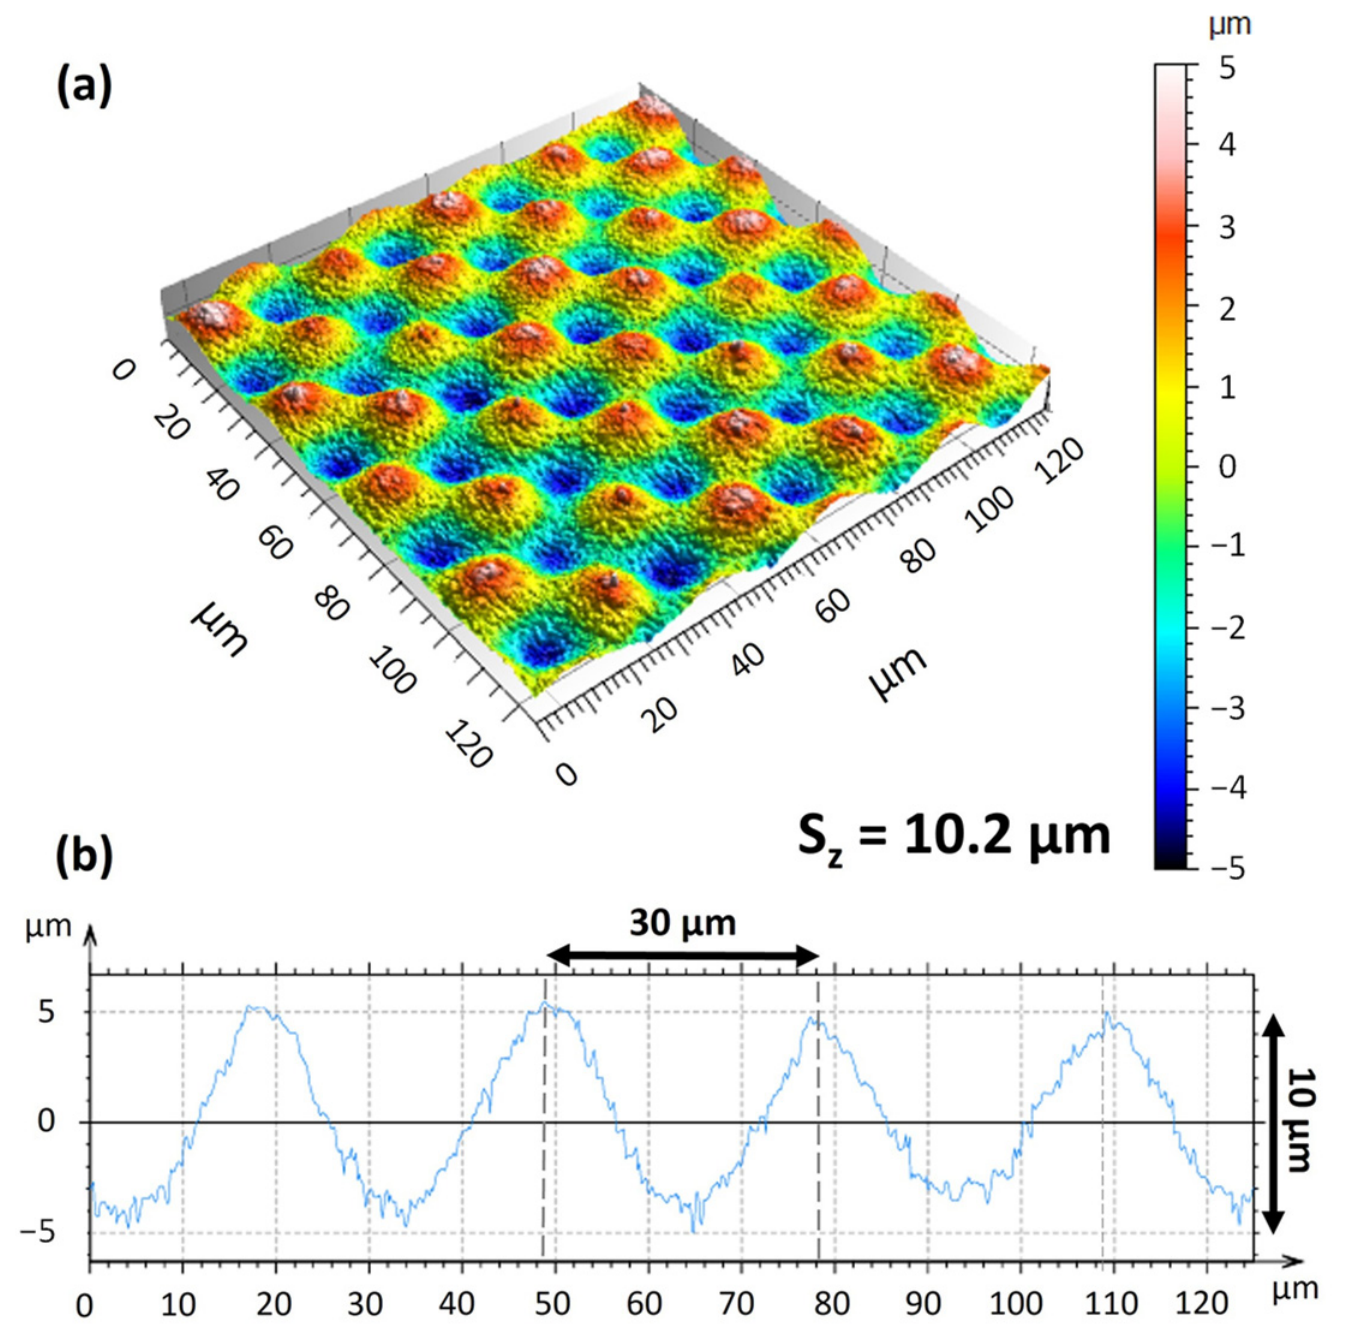
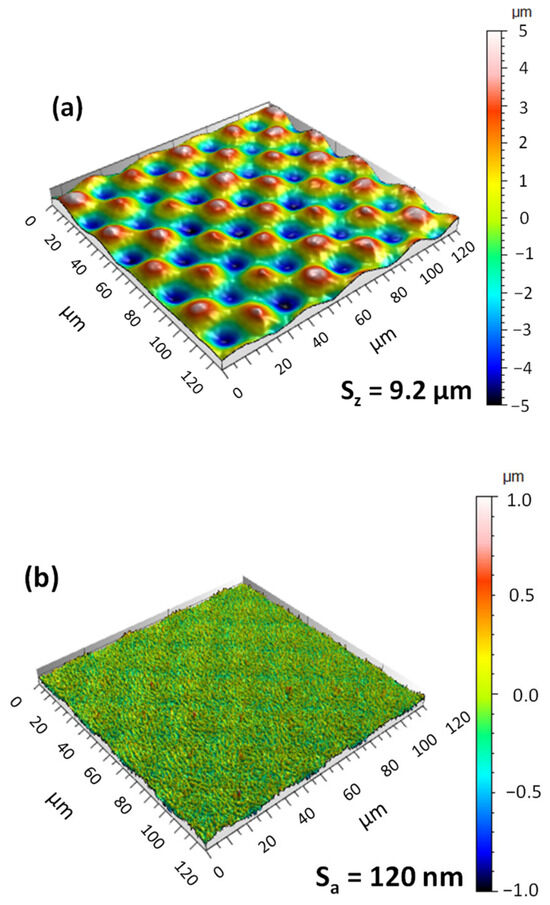
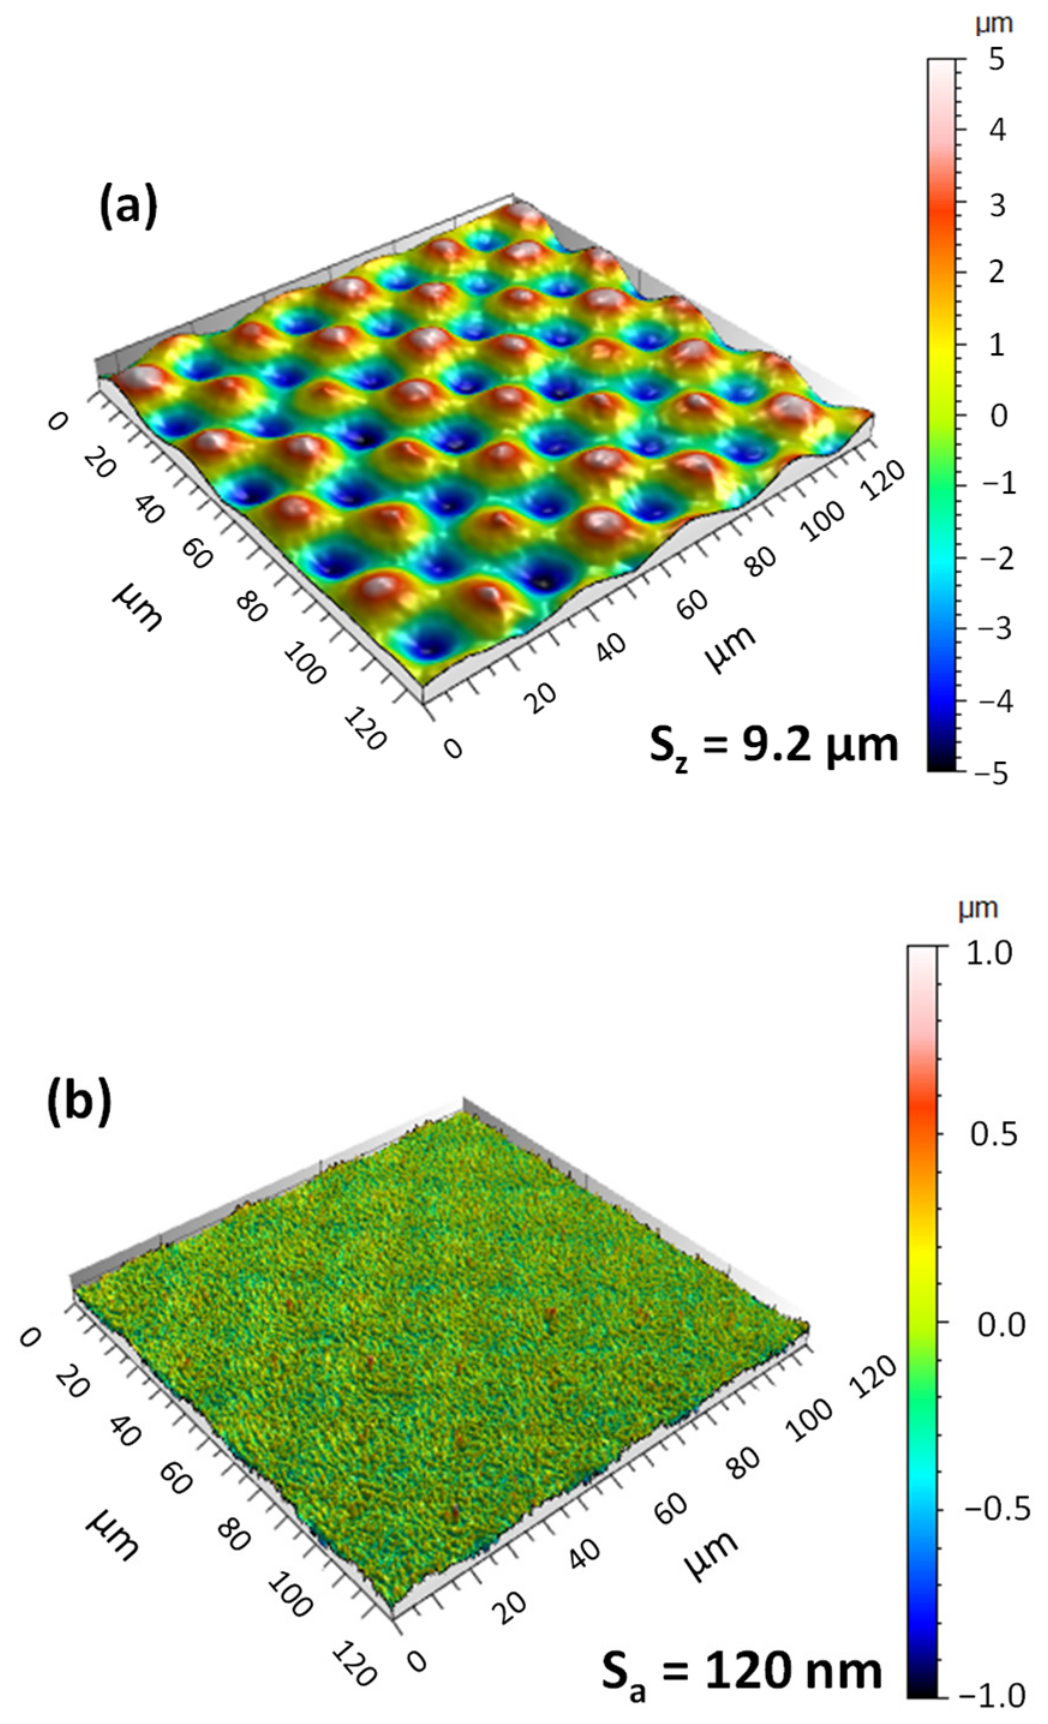
As in the previous parts, square areas of 125 µm × 125 µm were extracted from the total 200 µm × 200 µm surface to avoid edge effects. Figure 17a shows the bi-sinusoidal surface topography under the applied laser-texturing parameters. Over the textured area, a distinct bi-sinusoidal pattern was effectively produced. Peaks and valleys are clearly arranged in a periodic pattern, as confirmed by the extracted profile in Figure 17b. This matches the target geometry: 30 µm periodicity and a 10 µm peak-to-valley height difference. Quantitative areal measurements indicate an initial peak-to-valley height of Sz = 10.2 µm. This value corresponds to the height difference between troughs and peaks. The surface topography was first leveled and then processed using a Gaussian filter according to ISO 16610-61 [44], with a nesting index of 3 µm. The areal surface parameters, including the peak-to-valley height Sz, were then calculated from the filtered surface. After filtering, Sz decreased by about 1 µm and reached 9.2 µm (Figure 18a). This confirms that the topography is mainly governed by the designed bi-sinusoidal architecture.
Figure 17.
Bi-sinusoidal surface characterization obtained using a fluence of 1 J/cm2, 50% spot overlap, 50% hatch overlap, a scanning speed of 50 mm/s, a repetition rate of 5.88 kHz, a slicing step of 100 nm, and four scanning orientations of 0°, 90°, 180°, and 270°: (a) measured bi-sinusoidal surface topography; (b) extracted height profile showing the periodicity and reproducibility of the bi-sinusoidal pattern.
Figure 18.
Multiscale bi-sinusoidal topography and residual micro/nanoscale roughness: (a) S-filtered surface showing Sz = 9.2 µm; (b) extracted high-spatial-frequency component showing a superimposed roughness of Sa = 120 nm.
The removed high-spatial-frequency component corresponds to fine micro/nanoscale roughness superimposed on the desired base sinusoidal topography, with an areal roughness of Sa = 120 nm (Figure 18b). Such micro/nanoscales may be advantageous for biomedical applications, as they have been associated with enhanced cell-surface interactions and an early osteogenic response [44,45]. In addition, the micro/nanoscale textures and microgrooves generated by laser processing can modify surface wettability and thereby contribute to a favorable biological response [46,47].
Overall, the results confirm that reproducible bi-sinusoidal topographies can be produced on Ti-6Al-4V using the selected laser parameters. The peak-to-valley measurement indicated that the product was close to the originally designed periodic value. A limited superimposed micro/nanoscale roughness of Sa = 120 nm was also observed.
4. Conclusions
This study proposed a systematic 1D–2D–3D methodology for femtosecond laser texturing of Ti-6Al-4V. It should be noted that the results are highly sensitive to the evaluation procedure and measurement conditions. The single-pulse ablation threshold was determined to be 0.175 J/cm2 at 1031 nm. Crater evolution highlighted the role of incubation and cumulative effects, with an apparent incubation factor estimated to be S = 0.84. In scanned texturing, depth and roughness were governed by cumulative deposited fluence, leading to a non-monotonic trend and supporting the selection of 50% overlap as a balanced condition. Finally, the selected processing conditions enabled the fabrication of a controlled bi-sinusoidal surface topography on Ti-6Al-4V, with a target periodicity of 30 µm, a final filtered peak-to-valley height of Sz = 9.2 µm, and a superimposed micro/nanoscale roughness of Sa = 120 nm.
Author Contributions
Methodology, H.A., F.R., R.V. and A.M.; investigation, H.A., F.R., R.V. and A.M.; formal analysis, H.A., F.R., R.V. and A.M.; writing—original draft preparation, H.A.; writing—review and editing, F.R., R.V., M.B. and A.M.; supervision, F.R., R.V., M.B. and A.M.; project administration, F.R., R.V., M.B. and A.M. All authors have read and agreed to the published version of the manuscript.
Funding
This research was funded by the French National Research Agency ANR through the MESURUFO Junior Professor Chair (grant number ANR-22-CPJ2-0130-01). Additional support was provided by INSA Hauts-de-France, the Carnot Arts Institute, and the CPER RITMEA and ELSAT projects.
Data Availability Statement
The data supporting the findings of this study are available from the corresponding author upon reasonable request.
Acknowledgments
The authors would like to thank Raphaël Deltombe and José La Barbera for their assistance with the experimental platform. The authors also thank Rudy Dubois for his help with SEM imaging.
Conflicts of Interest
The authors declare no conflicts of interest.
References
- Arumugaprabu, V.; Jo Ko, T.; Thirumalai Kumaran, S.; Kurniawan, R.; Uthayakumar, M. A Brief Review on Importance of Surface Texturing in Materials to Improve the Tribological Performance. Rev. Adv. Mater. Sci. 2018, 53, 40–48. [Google Scholar] [CrossRef] [Scilit]
- Vishnoi, M.; Kumar, P.; Murtaza, Q. Surface texturing techniques to enhance tribological performance: A review. Surf. Interfaces 2021, 27, 101463. [Google Scholar] [CrossRef] [Scilit]
- Bigerelle, M.; Gautier, A.; Iost, A. Roughness characteristic length scales of micro-machined surfaces: A multi-scale modelling. Sens. Actuators B Chem. 2007, 126, 126–137. [Google Scholar] [CrossRef] [Scilit]
- Fraulob, M.; Pang, S.; Le Cann, S.; Vayron, R.; Laurent-Brocq, M.; Todatry, S.; Soares, J.A.N.T.; Jasiuk, I.; Haïat, G. Multimodal characterization of the bone-implant interface using Raman spectroscopy and nanoindentation. Med. Eng. Phys. 2020, 84, 60–67. [Google Scholar] [CrossRef] [Scilit] [PubMed]
- Abellán-Nebot, J.V.; Vila Pastor, C.; Siller, H.R. A Review of the Factors Influencing Surface Roughness in Machining and Their Impact on Sustainability. Sustainability 2024, 16, 1917. [Google Scholar] [CrossRef] [Scilit]
- Baudach, S.; Bonse, J.; Kautek, W. Ablation experiments on polyimide with femtosecond laser pulses. Appl. Phys. A Mater. Sci. Process. 1999, 69, S395–S398. [Google Scholar] [CrossRef] [Scilit]
- Orlandini, A.; Baraldo, S.; Porta, M.; Valente, A. Ablation threshold estimation for femtosecond pulsed laser machining of AISI316L. Procedia CIRP 2022, 107, 617–622. [Google Scholar] [CrossRef] [Scilit]
- Chicbkov, B.N.; Momma, C.; Nolte, S.; von Alvensleben, F.; Tiinnermann, A. Femtosecond, picosecond and nanosecond laser ablation of solids. Appl. Phys. A Mater. Sci. Process. 1996, 63, 109–115. [Google Scholar] [CrossRef] [Scilit]
- Pfleging, W.; Kumari, R.; Besser, H.; Scharnweber, T.; Majumdar, J.D. Laser surface textured titanium alloy (Ti–6Al–4V): Part 1—Surface characterization. Appl. Surf. Sci. 2015, 355, 104–111. [Google Scholar] [CrossRef] [Scilit]
- Cunha, A.; Elie, A.-M.; Plawinski, L.; Serro, A.P.; Botelho Do Rego, A.M.; Almeida, A.; Urdaci, M.C.; Durrieu, M.-C.; Vilar, R. Femtosecond laser surface texturing of titanium as a method to reduce the adhesion of Staphylococcus aureus and biofilm formation. Appl. Surf. Sci. 2016, 360, 485–493. [Google Scholar] [CrossRef] [Scilit]
- Kumari, R.; Scharnweber, T.; Pfleging, W.; Besser, H.; Majumdar, J.D. Laser surface textured titanium alloy (Ti–6Al–4V)—Part II—Studies on bio-compatibility. Appl. Surf. Sci. 2015, 357, 750–758. [Google Scholar] [CrossRef] [Scilit]
- Hashida, M.; Semerok, A.F.; Gobert, O.; Petite, G.; Wagner, J.-F. Ablation Thresholds of Metals with Femtosecond Laser Pulses; Libenson, M.N., Ed.; SPIE: St. Petersburg, Russia, 2001; pp. 178–185. [Google Scholar]
- Bussoli, M.; Desai, T.; Batani, D.; Gakovic, B.; Trtica, M. Nd:YAG laser interaction with titanium implant surfaces for medical applications. Radiat. Eff. Defects Solids 2008, 163, 349–356. [Google Scholar] [CrossRef] [Scilit]
- Deng, Y.; Hong, W.; He, J.; Guo, Z.; Chen, Y.; Huang, Z. Micro-cracks on crosslinked Poly(dimethylsiloxane) (PDMS) surface treated by nanosecond laser irradiation. Appl. Surf. Sci. 2018, 445, 488–495. [Google Scholar] [CrossRef] [Scilit]
- Maharjan, N.; Zhou, W.; Zhou, Y.; Guan, Y. Ablation morphology and ablation threshold of Ti-6Al-4V alloy during femtosecond laser processing. Appl. Phys. A 2018, 124, 519. [Google Scholar] [CrossRef] [Scilit]
- Sanner, N.; Utéza, O.; Bussiere, B.; Coustillier, G.; Leray, A.; Itina, T.; Sentis, M. Measurement of femtosecond laser-induced damage and ablation thresholds in dielectrics. Appl. Phys. A 2009, 94, 889–897. [Google Scholar] [CrossRef] [Scilit]
- Kong, M.C.; Wang, J. Surface Quality Analysis of Titanium and Nickel-based Alloys Using Picosecond Laser. Procedia CIRP 2014, 13, 417–422. [Google Scholar] [CrossRef] [Scilit]
- Zheng, B.; Jiang, G.; Wang, W.; Wang, K.; Mei, X. Ablation experiment and threshold calculation of titanium alloy irradiated by ultra-fast pulse laser. AIP Adv. 2014, 4, 031310. [Google Scholar] [CrossRef] [Scilit]
- Milovanović, D.; Rajčić, B.; Ranković, D.; Stankov, B.; Čekada, M.; Ciganović, J.; Đurđević-Milošević, D.; Stević, Z.; Kuzmanović, M.; Šibalija, T.; et al. Microstructure Formations Resulting from Nanosecond and Picosecond Laser Irradiation of a Ti-Based Alloy under Controlled Atmospheric Conditions and Optimization of the Irradiation Process. Micromachines 2023, 15, 5. [Google Scholar] [CrossRef] [Scilit] [PubMed]
- Milovanović, D.; Rajčić, B.; Petronić, S.; Radulović, A.; Radak, B.; Gaković, B.; Zamfirescu, M.; Albu, C.; Savović, J. Comprehensive ablation study of near-IR femtosecond laser action on the titanium-based alloy Ti6Al4V: Morphological effects and surface structures at low and high fluences. Eur. Phys. J. D 2022, 76, 2. [Google Scholar] [CrossRef] [Scilit]
- Xu, S.; Chen, Y.; Liu, H.; Miao, X.; Yuan, X.; Jiang, X. Femtosecond laser ablation of Ti alloy and Al alloy. Optik 2020, 212, 164628. [Google Scholar] [CrossRef] [Scilit]
- Mustafa, A.M.; Muhamedsalih, H.; Tang, D.; Kumar, P.; Blunt, L.; Jiang, J. Investigation of focus variation microscopy immunity to vibrations. Precis. Eng. 2025, 93, 87–98. [Google Scholar] [CrossRef] [Scilit]
- Wang, Y.; Zhang, M.; Huang, Y.; Cao, X.; Dong, Y.; Zhao, J.; Li, Y.; Wang, Y. Ablation threshold modelling and validation of metal Nanosecond laser processing. Opt. Commun. 2022, 523, 128608. [Google Scholar] [CrossRef] [Scilit]
- Xu, J.; Zhang, G.; Rong, Y.; Huang, Y. Study on the ultraviolet nanosecond laser ablation and heat-affected zone of polydimethylsiloxane films based on comprehensive surface analysis. Opt. Laser Technol. 2023, 167, 109769. [Google Scholar] [CrossRef] [Scilit]
- Dong, X.; Fan, P.; Cui, H.; Wang, K. Experimental study on high quality micro-holes with large aspect ratio in thick metal based on femtosecond laser focus shaping and plasma processing underwater. Opt. Laser Technol. 2025, 184, 112556. [Google Scholar] [CrossRef] [Scilit]
- Nolte, S.; Momma, C.; Jacobs, H.; Tünnermann, A.; Chichkov, B.N.; Wellegehausen, B.; Welling, H. Ablation of metals by ultrashort laser pulses. J. Opt. Soc. Am. B 1997, 14, 2716. [Google Scholar] [CrossRef] [Scilit]
- Mannion, P.T.; Magee, J.; Coyne, E.; O’Connor, G.M.; Glynn, T.J. The effect of damage accumulation behaviour on ablation thresholds and damage morphology in ultrafast laser micro-machining of common metals in air. Appl. Surf. Sci. 2004, 233, 275–287. [Google Scholar] [CrossRef] [Scilit]
- De Palo, R.; Volpe, A.; Gaudiuso, C.; Patimisco, P.; Spagnolo, V.; Ancona, A. Threshold fluence and incubation during multi-pulse ultrafast laser ablation of quartz. Opt. Express 2022, 30, 44908. [Google Scholar] [CrossRef] [Scilit] [PubMed]
- Žemaitis, A.; Gaidys, M.; Brikas, M.; Gečys, P.; Račiukaitis, G.; Gedvilas, M. Advanced laser scanning for highlyefficient ablation and ultrafast surface structuring: Experiment and model. Sci. Rep. 2018, 8, 17376. [Google Scholar] [CrossRef] [Scilit] [PubMed]
- Jee, Y.; Becker, M.F.; Walser, R.M. Laser-induced damage on single-crystal metal surfaces. J. Opt. Soc. Am. B 1988, 5, 648. [Google Scholar] [CrossRef] [Scilit]
- Di Niso, F.; Gaudiuso, C.; Sibillano, T.; Mezzapesa, F.P.; Ancona, A.; Lugarà, P.M. Role of heat accumulation on the incubation effect in multi-shot laser ablation of stainless steel at high repetition rates. Opt. Express 2014, 22, 12200. [Google Scholar] [CrossRef] [Scilit] [PubMed]
- Vorobyev, A.Y.; Guo, C. Enhanced absorptance of gold following multipulse femtosecond laser ablation. Phys. Rev. B 2005, 72, 195422. [Google Scholar] [CrossRef] [Scilit]
- Raciukaitis, G.; Brikas, M.; Gecys, P.; Gedvilas, M. Accumulation effects in laser ablation of metals with high-repetition-rate lasers. In High-Power Laser Ablation; Phipps, C.R., Ed.; SPIE: Taos, NM, USA, 2008; Volume 7005, p. 70052L. [Google Scholar]
- Jaeggi, B.; Neuenschwander, B.; Schmid, M.; Muralt, M.; Zuercher, J.; Hunziker, U. Influence of the Pulse Duration in the ps-Regime on the Ablation Efficiency of Metals. Phys. Procedia 2011, 12, 164–171. [Google Scholar] [CrossRef] [Scilit]
- Sun, Y.; Sun, J.; Wu, X.; Li, Y.; Li, X.; Li, R.; Wang, T.; Bi, W.; Cui, W.; Yu, Y. Mechanism of zirconia microgroove surface structure for osseointegration. Mater. Today Adv. 2021, 12, 100159. [Google Scholar] [CrossRef] [Scilit]
- Delgado-Ruíz, R.A.; Calvo-Guirado, J.L.; Moreno, P.; Guardia, J.; Gomez-Moreno, G.; Mate-Sánchez, J.E.; Ramirez-Fernández, P.; Chiva, F. Femtosecond laser microstructuring of zirconia dental implants. J. Biomed. Mater. Res. 2011, 96B, 91–100. [Google Scholar] [CrossRef] [Scilit] [PubMed]
- Delgado-Ruíz, R.A.; Gomez Moreno, G.; Aguilar-Salvatierra, A.; Markovic, A.; Mate-Sánchez, J.E.; Calvo-Guirado, J.L. Human fetal osteoblast behavior on zirconia dental implants and zirconia disks with microstructured surfaces. An experimental in vitro study. Clin. Oral Implant. Res. 2016, 27, e144–e153. [Google Scholar] [CrossRef] [Scilit] [PubMed]
- Nitta, I.; Tsukiyama, Y.; Nomura, S.; Takatsu, N. Frictional characteristics of clamp surfaces of aneurysm clips finished by laser processing. J. Adv. Mech. Des. Syst. Manuf. 2016, 10, JAMDSM0026. [Google Scholar] [CrossRef] [Scilit]
- Liu, J.M. Simple technique for measurements of pulsed Gaussian-beam spot sizes. Opt. Lett. 1982, 7, 196–198. [Google Scholar] [CrossRef] [Scilit] [PubMed]
- Pacquentin, W. Contribution à L’étude des Propriétés Physico-Chimiques des Surfaces Modifiées par Traitement Laser: Application à L’amélioration de la Résistance à la Corrosion Localisée des Aciers Inoxydables. Ph.D. Thesis, Université de Bourgogne, Dijon, France, 2011. [Google Scholar]
- Bruneau, S.; Hermann, J.; Itina, T.; Sentis, M.; Semerok, A.; Marine, W. Ablation de matériaux par laser femtoseconde. J. Phys. IV (Proc.) 2003, 108, 41–44. [Google Scholar] [CrossRef] [Scilit]
- Florian, C.; Wonneberger, R.; Undisz, A.; Kirner, S.V.; Wasmuth, K.; Spaltmann, D.; Krüger, J.; Bonse, J. Chemical effects during the formation of various types of femtosecond laser-generated surface structures on titanium alloy. Appl. Phys. A 2020, 126, 266. [Google Scholar] [CrossRef] [Scilit]
- Veiko, V.P.; Karlagina, Y.Y.; Samokhvalov, A.A.; Polyakov, D.S.; Manokhin, S.S.; Radaev, M.M.; Odintsova, G.V.; Gornushkin, I.B. Surface Structuring and Reverse Deposition of Nanoporous Titanium Oxides by Laser Ablation of Titanium in Air. Plasma Chem. Plasma Process 2022, 42, 923–937. [Google Scholar] [CrossRef] [Scilit]
- ISO 16610-61:2015; Geometrical Product Specification (GPS)—Filtration—Part 61: Linear Areal Filters—Gaussian Filters. International Organization for Standardization: Geneva, Switzerland, 2015.
- Huang, H.; Yang, L.-M.; Bai, S.; Liu, J. Blackening of metals using femtosecond fiber laser. Appl. Opt. 2015, 54, 324. [Google Scholar] [CrossRef] [Scilit] [PubMed]
- Raimbault, O.; Benayoun, S.; Anselme, K.; Mauclair, C.; Bourgade, T.; Kietzig, A.-M.; Girard-Lauriault, P.-L.; Valette, S.; Donnet, C. The effects of femtosecond laser-textured Ti-6Al-4V on wettability and cell response. Mater. Sci. Eng. C 2016, 69, 311–320. [Google Scholar] [CrossRef] [Scilit] [PubMed]
- Bizi-Bandoki, P.; Benayoun, S.; Valette, S.; Beaugiraud, B.; Audouard, E. Modifications of roughness and wettability properties of metals induced by femtosecond laser treatment. Appl. Surf. Sci. 2010, 257, 5213–5218. [Google Scholar]

Disclaimer/Publisher’s Note: The statements, opinions and data contained in all publications are solely those of the individual author(s) and contributor(s) and not of MDPI and/or the editor(s). MDPI and/or the editor(s) disclaim responsibility for any injury to people or property resulting from any ideas, methods, instructions or products referred to in the content. |
© 2026 by the authors. Licensee MDPI, Basel, Switzerland. This article is an open access article distributed under the terms and conditions of the Creative Commons Attribution (CC BY) license.