


Highlights
What are the main findings?
- Newly proposed wind forecasting models outperformed their own baselines in 69 of 76 studies (pooled Hedges’ , 95% CI []), although the size of the gain varied widely.
- Advanced architectures did not significantly outperform classical ones (, 95% CI []): 59 of 76 comparisons were within the same family, and the 10 direct comparisons favored the advanced model in nine studies but not significantly (, 95% CI []).
What are the implications of the main findings?
- In coastal and complex-terrain wind forecasting, modified variants of existing models, within the same or a different architecture, generally improved on their baselines, so the variants proposed in the reviewed studies are worth replicating at other sites.
- The literature cannot yet settle the choice between advanced and classical architectures; comparing both classes on common data and metrics is needed before the superiority of either class can be established.
Abstract
Wind forecasting in complex coastal terrain, such as the Colombian Caribbean, is hindered by air–sea heat fluxes and nonlinear atmospheric dynamics. This pre-registered systematic review and meta-analysis tests whether advanced architectures (artificial intelligence, hybrid, ensemble) outperform classical ones (physical, statistical). Scopus and Web of Science (last query: 22 September 2026) yielded 100 studies with extractable effect sizes; 76 compared a proposed model with an explicit comparator (primary analysis). Hedges’ g (negative values favor the proposed model) was pooled with REML random effects and Knapp–Hartung inference. The pooled effect was (95% CI []; 95% prediction interval []; ), robust to the estimator and to influential studies, although 59 comparisons were against a baseline of the same family. The estimates favored advanced over classical architectures, but not significantly (, 95% CI []); only 10 studies compared them directly, and 9 favored the advanced model (, 95% CI []). Only AI (, ) and physical (, ) models had intervals excluding zero. Egger and Begg tests indicated funnel-plot asymmetry, but the Pustejovsky–Rodgers test, robust to the dependence of the standard error on the effect, did not. Proposed models outperform their baselines; the superiority of any architectural class is not established.
1. Introduction
The transition towards a decarbonized energy mix requires the integration of high-power-density sources and reliable management systems. Analyses of carbon dioxide emissions show that mitigation does not follow a linear relationship between infrastructure deployment and pollutant reduction; under high-emission regimes, systemic deficiencies limit proportional gains [1,2]. By the end of 2024, wind and solar power accounted for of global electricity production, and wind technology stood out for its rapid response to grid disturbances [3,4]. Further growth depends on a synergistic combination of technical capabilities and management models adapted to the local context [5,6,7].
In South America, the realistic representation of climatic conditions poses a challenge to numerical models owing to the southern extent of the region and its heterogeneous topography, notably, the Andes and the Amazon [8]. Water and atmospheric variability depend strongly on sea surface temperature and mountain elevation, which shape circulation and partition moisture sources [9,10]. Despite advances in environmental data processing, state-of-the-art systems such as the models of the Coupled Model Intercomparison Project Phase 6 (CMIP6) still exhibit systematic biases in the simulation of precipitation and in the representation of atmospheric circulation processes [11,12].
In the Colombian Caribbean, the interaction between the Caribbean Low-Level Jet (CLLJ), coastal orography and estuarine dynamics produces nonlinear wind blocking and shear effects that undermine the stability assumptions of conventional statistical forecasting methods [13]. This interaction generates vertical wind profiles that violate Hellmann’s power law, which is widely employed for wind speed extrapolation [14]. Nocturnal jets and variable coastal roughness add residual variance that simple statistical models fail to capture, thereby increasing short-term estimation error.
The complexity of the region extends to the Caribbean convergent margin, where contourite systems shaped by subduction tectonics and strong bottom currents reflect coupled oceanic and tectonic controls on slope dynamics, with indirect effects on the coastal atmospheric circulation relevant to wind energy assessment [15]. In this context, wind power estimation benefits from an improved representation of atmospheric and environmental variables and from a diversity of modeling approaches [16,17].
The literature on wind profile and wind potential estimation exhibits a theoretical fragmentation in which numerical optimization frequently precedes geographical contextualization. Recent evaluative studies indicate a shift in metric preference: some authors argue that the Mean Absolute Percentage Error (MAPE) is limited when observed values approach zero, a limitation that normalized metrics such as nRMSE and nMAE address [18,19]. However, normalized metrics are not standardized across different studies, as each one normalizes to a different magnitude [20]. While classical physical and statistical approaches maintain linear efficiency, advanced methods leverage the universal approximation theorem to model complex interactions over short time horizons [21,22]. The knowledge gap lies in the lack of specificity for coastal regions influenced by trade winds, where fragmented data infrastructure and extreme environmental conditions degrade telemetry and, consequently, decision-making [23,24,25,26,27,28,29,30,31].
Identifying effective forecasting architectures for these environments requires a systematic comparison of the approaches in use. The present work evaluates the main families of models used in wind forecasting, namely, classical and advanced methods, in coastal and complex-terrain regimes. A direct comparison across studies is not straightforward because of the diversity in experimental designs: each study defines its own reference condition through physical models, statistical baselines or machine-learning approaches, which results in non-standardized definitions of the comparator across the corpus. To address this limitation, metrics for which higher values indicate better performance and metrics for which lower values do so are placed in a common direction, so that lower values consistently indicate better performance. This permits a directionally consistent synthesis within predefined strata of architecture, comparator design and metric family, while preserving the original structure of each experiment.
This study is a quantitative synthesis rather than a narrative review. Instead of describing and discussing the methods proposed in the literature, it converts the results reported by the primary studies into a common effect size, pools them with a random-effects model that quantifies the heterogeneity between studies, and examines through a sequence of moderator analyses whether the type of architecture explains that heterogeneity. The analysis is organized in strata: class of the proposed model (advanced or classical), family (physical, statistical, artificial intelligence, hybrid or ensemble), design of the comparison (within a family or between families), prediction target and metric family.
The key contributions of this study are summarized as follows:
- A quantitative, random-effects meta-analysis of 76 studies of wind forecasting in complex terrain and coastal environments, with a stratified analysis of the type of architecture (class, family and comparison design), based on an explicit and auditable criterion for the validity of reconstructed effect sizes; studies that fail this criterion are reported rather than silently discarded.
- A distinction between two questions that are frequently conflated: whether newly proposed models outperform the baselines against which they are compared (the pooled effect, which is large and robust), and whether one architectural class outperforms another (a between-family contrast, for which the evidence is inconclusive because most comparisons are made within a family and only 10 compare an advanced model directly with a classical one).
- A fully reproducible analysis in which every number, table and figure reported in this paper can be regenerated with the accompanying code from a single data file, together with sensitivity analyses with respect to the between-study variance estimator, influential studies, the coding of ensemble models and the re-admission of the excluded studies.
The architectures considered in this work are described as follows:
- Classical models, which are traditional methodologies that established the foundations of wind forecasting, characterized by a deterministic approach or by the use of linear statistical models:
- Pure physical (deterministic) models: These models use meteorological variables, such as temperature, atmospheric pressure, surface roughness and the presence of local obstacles, to characterize the wind flow. Through the processing of these environmental variables, the wind is scaled to the turbine hub height to estimate energy production.
- Traditional statistical models: These models perform time-series analysis to identify linear stochastic patterns in historical wind or power data. Autoregressive models, such as the AutoRegressive Moving Average (ARMA) and the AutoRegressive Integrated Moving Average (ARIMA), and persistence models are the most representative examples. Their main advantages are computational efficiency and high accuracy over very short time horizons (from minutes to a few hours).
- Advanced models, which are emerging technologies comprising architectures designed to capture the nonlinear, chaotic and intermittent nature of the wind, thereby overcoming the limitations of classical approaches:
- Artificial intelligence (AI)-based models: These models map complex nonlinear relationships between input variables (weather data or historical Supervisory Control and Data Acquisition (SCADA) records) and power output by means of data-driven learning algorithms, such as artificial neural networks (feedforward, recurrent, convolutional, graph-based and attention-based architectures, including deep-learning models), support-vector machines, tree-based learners and other stand-alone machine-learning methods.
- Ensemble models: This architecture combines several data-driven base learners, within a single framework, in order to improve overall accuracy, reduce variance and mitigate temporal bias. It encompasses bagging and boosting schemes (such as random forests, deep forests and gradient boosting), the stacking or weighted aggregation of several machine-learning or neural-network models, and the cascading of neural networks with tree-based learners.
- Hybrid models: These models combine techniques of different natures to exploit their respective strengths and mitigate their individual weaknesses. The predominant configuration couples a physical model, such as numerical weather prediction, with a data-driven or statistical component that corrects, downscales or post-processes its output and may include metaheuristic optimization of the parameters.
2. Materials and Methods
This synthesis examines whether the architecture of a forecasting model explains differences in forecasting error under coastal and complex atmospheric regimes. The variability observed across studies limits the possibility of a universal ranking of models and favors a context-dependent evaluation. The study follows a protocol pre-registered on the Open Science Framework (OSF), entitled “Protocol for the review and meta-analysis of the accuracy of Advanced Methods (AI, Ensemble and Hybrid) versus Classical Methods (Pure Physical and Statistical) for forecasting wind speed and wind power at onshore and offshore sites influenced by coastal or trade wind dynamics or located in complex terrain” [32].
This research is framed within the PICO (Population, Intervention, Comparison and Outcome) framework with the objective of determining whether, in the context of wind resource estimation at complex onshore and offshore sites influenced by coastal or trade wind regimes (P), the implementation of “advanced” computational architectures based on artificial intelligence, ensemble systems, and hybrids (I) exhibits superior predictive accuracy compared to “classical” reference models based on linear physical and statistical principles (C), quantified by the reduction of error and bias (O).
Eligible studies evaluated an advanced model (artificial intelligence, hybrid or ensemble) or a classical model (physical or statistical) against at least one comparator and reported a numerical error or skill metric for both models on the same evaluation data, in sufficient detail to allow the computation of an effect size. The search was restricted to English-language publications from 2020 to 2026, so that the comparisons reflect the current state of wind forecasting methods. The PICO framework and the search strategy admit both physical and statistical reference models under the classical category. In the primary corpus, however, the proposed model is physical in 19 studies and statistical in only 2, and the comparator is physical in 22 studies and statistical in 7; statements about classical performance are therefore dominated by physical models, and those about advanced models by AI-based models.
The scientific literature was identified through a systematic search of the Scopus and Web of Science (WoS) databases, with the final query performed on 22 September 2026. To ensure the completeness of the bibliographic corpus, a reverse search was applied to the reference lists of the selected articles; it identified no additional eligible records (. The search strategy employed Boolean syntax (AND, OR) and descriptors organized along three thematic axes: wind power estimation, coastal wind dynamics or complex terrain, and model architectures. Variants of the key terms were incorporated into the queries through the truncation wildcard (*) of the database syntax, which retrieves all endings of a word stem, to avoid the loss of relevant information. The search strings are reported in Table 1.
Table 1.
Search equations used by database.
Studies were eligible if they (i) were peer-reviewed journal articles published between 2020 and 2026 and written in English; (ii) addressed the forecasting or estimation of wind speed or wind profile (WSP), wind power output (WPO) or other atmospheric conditions relevant to wind energy (ATM) in complex-terrain or coastal environments; (iii) proposed, configured or evaluated a model and compared it with an explicit comparator; and (iv) reported an error or skill metric for both models from which an effect size and its standard error could be computed. Technical reports, conference papers, articles in languages other than English, studies without a model comparator, studies outside the scope of wind forecasting, and studies without sufficient or valid quantitative data were excluded; the numbers excluded at each stage are given in the PRISMA 2020 flow diagram. All 76 comparisons in the primary analysis concern WSP (48) or WPO (28); no study of the other atmospheric conditions (ATM) met the criteria for an effect size, and the prediction target is examined as a moderator.
Study selection followed a dual independent review process, and discrepancies were resolved by a third expert in computational meteorology. Abstract screening and record management were supported by the revtools package [33]. Records were deduplicated on identical DOI. For every study that reached full-text review, the effect size, its standard error and the classification of the proposed model and of the comparator were extracted and subsequently verified, study by study, against the full text.
2.1. Taxonomy of the Proposed Model and of the Comparator
Each study contributes one comparison between a proposed model and a comparator, and both are assigned to one of the five families defined in Section 1, which are referred to by the following short identifiers: physical (PHY), statistical (STA), artificial intelligence (AI), ensemble (ENS) and hybrid (HYB). The term “advanced” denotes AI, HYB and ENS, and “classical” denotes PHY and STA. The following coding rules were applied. Physical models include numerical weather prediction, computational fluid dynamics, mesoscale and microscale models, and physical extrapolation such as power laws or lidar advection. Persistence baselines are coded as statistical. Stand-alone data-driven models are coded as AI, with or without signal-decomposition pre-processing. A combination of data-driven techniques without a physical component is not coded as hybrid: it is coded as AI when a single learner is used, and as ENS when several learners are combined. Ensemble models constitute a family of their own in the primary analysis and are merged into AI only in a sensitivity analysis. The taxonomy determines the design of each comparison: within-family (the proposed model and the comparator belong to the same family, for example, a new deep network compared with an LSTM), advanced versus classical (an advanced model proposed against a classical comparator, which constitutes the direct test of the research question), advanced versus advanced, and classical versus classical. One study in which a classical model is proposed against an advanced comparator is included in the direct-comparison analysis with its sign reversed.
2.2. Meta-Analysis Inputs: Effect Size and Standard Error
Meta-analysis is an established method for the quantitative accumulation of knowledge. It differs from a narrative review because it combines the results of independent studies into a quantitative estimate, so that the agreement and disagreement among studies are measured rather than described. As in any empirical study, the research begins with the definition of the research question, which delimits the scope of the constructs and interventions under analysis. The choice of the effect size (ES) measure depends on the research question and on the conventions in the field; common measures include correlation coefficients and standardized mean differences, as well as regression coefficients, survival rates, risk ratios and odds ratios [34].
Methodological work on meta-analytic procedures shows that apparent discrepancies between methods may stem from the use of an inadequate formula for the standard error rather than from flaws in the methods themselves: when the correct procedures are applied, the results of the methods compared are consistent [35]. The choice of the effect size measure and of its standard error responds to the need to standardize the numerical results of performance metrics, which in this case concern wind resource estimation models. The standardized mean difference under the unbiased estimator g of Hedges [36] was selected, whereas other measures, such as the relative risk (RR, usually employed through its natural logarithm, [37,38,39]), were discarded in order to preserve the quantitative nature of the estimation errors and to subject all models to the same comparative regime [40].
The validity of the synthesis requires error formulas consistent with the population variance. Hedges’ g reduces the small-sample bias of Cohen’s d through the correction factor . The results are pooled with inverse-variance weights, which give more weight to the more precise studies [41,42].
2.3. Quantitative Synthesis and Effect Size Computation
The methodological framework adopts the standardized mean difference (SMD) to harmonize results across studies. Hedges’ g is the primary effect size estimator (Equation (1)). The “proposed” group denotes the model or configuration proposed by the authors of the primary study, whereas the “control” group represents its comparator.
The two groups consist of the values of one error metric reported by the primary study for the proposed model and for the comparator across the independent evaluation units that the study presents (forecast horizons, seasons, stations, turbines or site-years). Accordingly, the sample size of each group, , is the number of such evaluation units, M is the mean of the metric over those units, and is the empirical standard deviation of the metric over the same units. The sampling unit is therefore the independent evaluation unit rather than the individual hourly forecast, because consecutive forecast errors are autocorrelated and would overstate the effective sample size if treated as independent observations. The metric is oriented so that lower values indicate better performance: for error metrics (RMSE, MAE, MSE, MAPE, absolute bias and their normalized versions), g is computed as in Equation (1), whereas for skill metrics (coefficient of determination, correlation coefficient and accuracy) the sign is reversed. In every case, a negative g indicates that the proposed model outperforms its comparator.
The within-study variance is the square of the standard error of g and depends only on the number of units and on g itself (Equation (2)):
Equation (2) is the large-sample approximation of the variance of g and was applied to all 76 studies. In 75 of them, the two models were evaluated on the same number of units (); in one study (WoS 25 [43]), they were evaluated on 12 and 4 units, respectively, and the equation was applied with and . An alternative expression is given in Equation (3):
This uses the uncorrected standardized difference (Cohen’s ) inside the variance term and applies the factor to propagate the small-sample bias correction. The effect size remains Hedges’ g; only its variance changes. This expression yields standard errors that are about 10% smaller on average, and it is examined as a sensitivity analysis.
Equations (2) and (3) treat the values of the two models as independent groups, so the sampling variance of the mean difference is the sum of the two group variances, which gives the first term . In almost every study, however, both models are evaluated on the same units, so their errors are positively correlated, and the covariance between them reduces the variance of the difference. If r denotes the correlation between the metric values of the two models across units, this first term becomes for , and the variance of g is
Because r is not reported by the primary studies, Equation (4) cannot be used to compute the effect sizes. It serves instead to examine whether the results depend on the assumption of independence, by recomputing the analysis over a range of values of r. It reduces to Equation (2) when and cannot be applied to WoS25, where .
2.3.1. Standardization and Scalar Comparability
The within-study standard deviation (Equation (5)), obtained by combining the standard deviations of the two groups, provides the scaling factor required to compute a standardized mean difference, so that effect estimates reported on different numerical scales are expressed in a common standardized form. Because the corpus includes performance measures reported in heterogeneous physical units, such as , and , as well as diverse error-based metrics, standardizes each comparison within its own study; it does not combine information across studies, which is done only in the meta-analytic synthesis described below.
As the denominator of Equation (1), rescales the mean difference into standard-deviation units and reduces the dependence on the original measurement scale, although differences in metric definitions and evaluation objectives are not fully resolved. The correction factor J depends on the degrees of freedom , where and are the sample sizes of the two groups, that is, their numbers of evaluation units; the subtraction of two degrees of freedom reflects the estimation of the two group means required to compute the within-study variance. The correction factor is defined in Equation (6):
Although Hedges’ g standardizes study-specific performance differences, effect sizes reconstructed from heterogeneous evaluation metrics (absolute physical measures, relative-performance metrics and correlation coefficients) are not fully commensurable across measurement domains. The pooled estimate is therefore interpreted as a summary of the distribution of standardized effects, and the metric family is examined as a moderator.
2.3.2. Validity Criterion for Effect Sizes
An effect size was considered valid when the proposed model and the comparator were evaluated on the same data with the same error metric, and when the standard deviation and the number of independent evaluation units came from the primary study: read from its tables or figures, approximated from box-plot quartiles or derived from reported percentage changes. A study was classified as not valid when its standard error could be obtained by (a) reconstructing a standard deviation from the RMSE or the correlation coefficient instead of obtaining it from the dispersion of the metric across evaluation units, (b) using the standard deviation of a different variable, (c) treating thousands of autocorrelated time steps as independent observations or (d) using non-independent rows, or when the sample size was not reported. Seven studies failed this criterion. Their standard errors (–) are up to two orders of magnitude smaller than those of the retained studies, so they would dominate any inverse-variance pooled estimate. They were excluded from the primary analysis, are listed in Appendix C, and were re-admitted only in a sensitivity analysis. Studies in which models or reanalysis products were compared only with each other, or with a reference simulation, and not with observations, were not considered model comparisons; these and the other studies excluded after extraction are reported in the same appendix.
2.3.3. Variance Estimation and Weighting Scheme
In a random-effects model, the observed effect of study i is , with and . The between-study variance was estimated by restricted maximum likelihood (REML) [44], which is the primary estimator because it is less biased than moment estimators when the number of studies is small or heterogeneity is moderate to high. The DerSimonian–Laird (DL) moment estimator [45] and the Paule–Mandel (PM) estimator [46] are reported as sensitivity analyses. The adjusted study weights and the overall effect are computed as follows:
2.3.4. Precision and Interval Estimation
Inference on the summary effect employed the Knapp–Hartung (KH) adjustment [47]. The variance of is , with , and the confidence interval is based on a t distribution with degrees of freedom:
The prediction interval (PI) describes the expected range of the true effect in a new comparable study by adding the between-study variance to the uncertainty of the mean [48]:
Heterogeneity was summarized by Cochran’s Q, by and by . The Q-based statistic is given in Equation (10). Because this value depends on how the typical within-study variance is defined, a second version, based on that quantity, is also computed and reported (Equation (11)):
where is the typical within-study variance and .
2.3.5. Illustrative Worked Example
To illustrate the reconstruction procedure, this subsection presents the computation of g and for two representative studies of the corpus, one from each database.
- Example 1, Scopus: Sc17
Fang et al. [49] compare a proposed seasonal temporal-correlation deep-forest model (STC-DF, the “proposed” group P) with the raw WRF forecast (the “control” group C), evaluated by the RMSE (m/s) on four seasonal test sets (spring, summer, autumn and winter), so that . The reported RMSE values are as follows:
- STC-DF (proposed): ;
- WRF (control): .
From these four values per group, the sample means and standard deviations are
With , the within-study standard deviation (Equation (5)) is
The uncorrected standardized difference is . The bias-correction factor (Equation (6)) is
which yields, by Equation (1),
The within-study variance (Equation (2)) is
so that . The negative sign indicates that STC-DF achieved a lower (better) RMSE than the raw WRF forecast, in agreement with the values and () reported in Appendix A. This study is a between-family comparison (an ensemble-type model proposed against a physical comparator).
- Example 2, Web of Science: WoS52
A second study [50] compares two WRF configurations, both driven by the North American Regional Reanalysis (NARR) and differing in the land-surface scheme, NARR-RUC (proposed, P) and NARR-PX (control, C), for wind speed forecasting, evaluated by the RMSEf (m/s) at three site-year combinations ():
- NARR-RUC (proposed): ;
- NARR-PX (control): .
The corresponding statistics are
The within-study standard deviation is
so that . With
the bias-corrected effect size is . Finally,
which matches the values and () reported in Appendix A. This is a within-family comparison (two physical configurations). As in Example 1, the small negative g indicates a modest advantage of the proposed configuration over the control, whereas the comparatively large reflects the small number of evaluation units that is typical of this corpus (median ).
2.3.6. Pooling Methodology
The choice between pooling methods depends on how the true effect is defined. In a fixed-effect model, the true effect is an invariant constant, and any variation in the observed performance is attributed exclusively to random error. In a random-effects model, by contrast, the true effect is treated as a random variable: each study estimates its own specific true effect, which acknowledges that model performance may genuinely differ between studies as a result of methodological heterogeneity. Given the diversity of sites, horizons, targets and metrics in this corpus, only the random-effects model was used.
2.4. Hypothesis Testing and Meta-Regression
2.4.1. Hypothesis Testing Through Architecture-Based Meta-Regression
The hypotheses are the following:
- (alternative hypothesis): advanced forecasting models achieve a larger reduction in forecasting error than classical models, as reflected by more negative standardized effect sizes .
- (null hypothesis): there is no difference in standardized effect sizes between advanced and classical models ().
Two complementary designs were used to test these hypotheses: a random-effects meta-regression of the effect size on the architecture category of the proposed model, and a separate pooling of the studies in which an advanced model is compared directly with a classical comparator (the direct comparisons, sign-aligned so that negative values favor the advanced model).
The general random-effects meta-regression is given by Equation (12):
where is the observed effect size of study k, is the intercept, are the regression coefficients, is the within-study sampling error () and is the residual between-study heterogeneity component () [51]. The model was specified with the architecture category of the proposed model as the moderator:
where if the proposed model is AI, hybrid or ensemble, and if it is physical or statistical. The coefficient (Equation (14)), and a negative and statistically significant would support .
The coefficient compares to what extent advanced and classical proposals improve on their own comparators, which usually belong to the same family. The specification was therefore extended with an indicator of between-family comparison, and the five families were entered as a categorical moderator, with an omnibus test and Holm-adjusted [52] pairwise contrasts. The second design, the pooling of the direct comparisons, removes this limitation by construction. The prediction target and the metric family were also tested as moderators.
All meta-regressions were fitted by REML with KH inference (t or F tests with degrees of freedom) and, for comparison, by DL. Explanatory power was summarized by the proportion of between-study variance explained by the moderators, following the pseudo- of Raudenbush and Bryk [53], here called the analog and truncated at zero (Equation (15)):
where is the between-study variance of the unconditional model and is the residual variance after the inclusion of the moderators.
2.4.2. Influential Studies, Small-Study Effects and Sensitivity Analyses
Influential studies, that is, studies whose effect size departs from the rest of the corpus enough to shift the pooled estimate, were identified to verify that the conclusions do not depend on a few extreme values. For this purpose, each study was left out in turn and its externally standardized deleted residual z was computed from the model fitted to the remaining studies [54]; studies with (two-sided probability of about 0.003 under normality) were flagged. Flagged studies were checked against the primary studies and retained in the primary analysis, and the model was refitted without them as a sensitivity analysis.
Small-study effects were assessed with Egger’s regression, the Begg–Mazumdar rank correlation, Rosenthal’s fail-safe N, a regression on the normal quantile–quantile plot (Appendix B) [55,56,57], and an REML meta-regression of g on its standard error, whose intercept is the precision-effect test (PET) estimate with its 95% confidence interval. Because the standard error depends mechanically on g (Equation (2)), these tests may signal asymmetry in the absence of publication bias. We therefore also fitted the modified Egger regression of Pustejovsky and Rodgers [58], which regresses on a measure of precision that does not depend on g, defined in Equation (16), with weights , heteroskedasticity-consistent (HC2) robust standard errors and t inference with degrees of freedom:
Asymmetry is assessed from the slope on , and the intercept estimates the effect for a hypothetical study of infinite precision.
Further sensitivity analyses varied the between-study variance estimator (REML, DL, PM, each with and without the Knapp–Hartung adjustment), merged the ensemble category into AI, re-admitted the studies with invalid effect sizes, and recomputed the variances for within-unit correlations , and (Equation (4)), refitting the overall model, the meta-regression on architecture and the direct comparisons. All computations were implemented in Python version 3.10.12 (numpy, scipy) following the Meta-Essentials workbooks [59,60,61], were validated with unit tests, and are reproducible from a single data file.
3. Results
3.1. Study Selection
Figure 1 illustrates the overlap between the databases used; the complementary use of both is justified by the need to ensure coverage of the technical literature in engineering and atmospheric sciences (intersection detected: 3605; unique universe : 6357; overlap rate: ).
Figure 1.
Overlap between Scopus and Web of Science.
Study selection followed successive filtering stages (Table 2 and Figure 2). Of the 9962 records initially identified, 6357 remained after deduplication, 2220 after title screening (F1) and 282 after abstract screening (F2). The full texts of 138 records could not be retrieved, and 144 reports were assessed for eligibility; of these, 3 were excluded for language or topic and 41 for lacking the data needed to compute an effect size and its standard error. Of the 100 remaining studies (30 from Scopus and 70 from WoS), 16 were excluded for lacking a model comparator or being out of scope, 7 for an effect size that did not meet the validity criterion, and 1 for falling outside the 2020–2026 window (published in 2019). The primary analysis therefore comprises 76 studies (20 from Scopus and 56 from WoS); the 24 excluded studies are listed in Appendix C.
Table 2.
Study selection by database.
Figure 2.
PRISMA 2020 flow diagram of study selection [62].
3.2. Study Characteristics
Table 3 cross-classifies the family of the proposed model with that of its comparator. The proposed model is AI in 48 studies, physical in 19, hybrid in 4, ensemble in 3 and statistical in 2. The comparison is within-family in 59 studies (78%), for example, a new deep network against an LSTM; 9 studies compare an advanced model with a classical one (10 including the single reversed comparison), 5 compare two advanced families and 2 compare two classical families. The target is wind speed or profile (WSP) in 48 studies and wind power output (WPO) in 28. Absolute-error metrics (AEM) are used in 64 studies, correlation metrics (CRM) in 5, relative-performance metrics (PRM) in 6 and accuracy (ACC) in 1; RMSE alone accounts for 47.
Table 3.
Composition of the primary corpus: family of the proposed model (rows) by family of its comparator (columns).
3.3. Overall Effect
The random-effects synthesis of the 76 studies (REML with KH inference; Table 4 and Figure 3) yielded a pooled effect of (95% CI []), which was statistically significant (). Because a negative g indicates a lower standardized prediction error for the proposed model, the proposed models outperformed their comparators on average by approximately one standard deviation of the between-unit variability of the error metric. The effect is negative in 69 of the 76 studies and positive in 7, although individual estimates are imprecise because each rests on few evaluation units (median 5, range 3 to 60; median , range 0.237 to 6.38). The estimate does not depend on the estimator: DL yielded (95% CI []; [] with KH) and PM yielded (95% CI []).
Table 4.
Pooled effect of the proposed model versus its comparator (Hedges’ g; negative values favor the proposed model), by between-study variance estimator.
Figure 3.
Forest plot of the 76 studies (Hedges’ g, REML with KH); color indicates the family of the proposed model. Negative values favor the proposed model.
Heterogeneity is substantial: (), (65.7% under the typical-variance definition) and (REML; 0.86 for DL and 1.83 for PM). The 95% prediction interval, [], includes zero, but it extends much further in the favorable direction than in the adverse one: the true effect in a new comparable study is most likely favorable (about 89% of the predictive distribution lies below zero, assuming normally distributed true effects), whereas a null or slightly adverse effect cannot be excluded. The result should therefore be read as evidence that proposed models generally improve on the baseline against which they are compared, and not as the gain to be expected in a specific application [48].
Study identifiers in Figure 3 are translated into references in Table 5; the study-level data are given in Appendix A.
Table 5.
Translation table between study identifiers used in this paper and their references.
3.4. Influential Studies
The leave-one-out diagnostics flagged three studies (Table 6): Sc01 [63] (), WoS55 [119] () and WoS48 [93] (). All three were verified against the primary studies: their error series barely overlap across evaluation units, so the standard deviation across units is small relative to the difference between the models. Excluding them attenuated the pooled effect to (95% CI [], ; with DL; ; prediction interval []). Omitting any single study shifts the REML–KH estimate only within [], the extremes corresponding to the omission of Sc15 [80] and WoS48 [93], respectively.
Table 6.
The five studies with the largest leave-one-out standardized deleted residuals (REML).
3.5. Effect by Architecture and Tests of the Hypothesis
Table 7 and Figure 4 report the pooled effect by family of the proposed model. All five point estimates are negative, ranging from (physical, ) and (AI, ) to (ensemble, ) and (hybrid, ); the statistical estimate () is . Only the intervals of the physical and AI families exclude zero. The hybrid, ensemble and statistical families are supported by two to four studies each, and their intervals are extremely wide; no conclusion can therefore be drawn for them.
Table 7.
Pooled effect by family of the proposed model (REML + KH).
Figure 4.
Pooled effect by family of the proposed model (REML with KH).
Hypothesis .
The meta-regression (Table 8) estimated the difference between advanced and classical proposals at (95% CI [], ; DL: , ). The direction is that anticipated by , but the difference is not statistically significant, and the interval is compatible both with a substantial advantage of advanced models and with a small advantage of classical models. When the five families are considered separately, the omnibus test did not reject equality (; DL: ), and none of the ten pairwise contrasts approached significance after Holm adjustment (all ; Table 9). The addition of an indicator of between-family comparison left essentially unchanged (, ), and the indicator itself was not significant (, 95% CI [], ). The analog was 0.0% in every specification, that is, architecture explains none of the between-study variance. is therefore not supported by the moderator analysis.
Table 8.
Meta-regression of the effect size on architecture, design, target and metric family (primary set).
Table 9.
Pairwise contrasts between the pooled effects of the proposed-model families (REML + KH, Holm adjustment over the ten contrasts).
Direct comparisons.
Only 10 studies compare an advanced model with a classical comparator (Table 10 and Figure 5). Nine favor the advanced model, and the pooled effect is (95% CI []; prediction interval []) under REML with KH; under DL, (95% CI []) and narrowly excludes zero, which the KH-adjusted primary estimator does not. Excluding the outlier among them yields (95% CI [], ). Against a physical comparator (), the estimate is (95% CI []); against a statistical comparator (), it is much larger but extremely imprecise (REML with KH: , 95% CI []), because two studies (WoS29, ; WoS55, ) have very large effects. These direct comparisons are consistent with an advantage of advanced over classical models, but are too few and too heterogeneous to demonstrate it.
Table 10.
Direct comparisons of an advanced model against a classical comparator (sign-aligned: negative favors the advanced model).
Figure 5.
Direct comparisons of an advanced model against a classical comparator (sign-aligned; negative values favor the advanced model; REML with KH).
Comparator design.
Among the studies that propose an advanced model, the pooled effect is (95% CI [], ) when the comparator belongs to the same family, (95% CI [], ) against a classical comparator, and (95% CI [], ) against a different advanced family (Table 11). Effects against classical comparators are therefore not larger than those against advanced comparators, which is consistent with the meta-regression.
Table 11.
Pooled effects by comparator design, prediction target and metric family (REML + KH).
3.6. Effect by Prediction Target and Metric Family
The pooled effect is similar for wind power (, 95% CI [], ) and for wind speed (, 95% CI [], ); the prediction target was not a significant moderator (, 95% CI [], ). Absolute-error metrics, which account for most studies, yield (95% CI [], ). Correlation metrics (, ) and relative-performance metrics (, ) are supported by only five and six studies, respectively, and their intervals include zero; the metric family did not moderate the effect (omnibus ). Figure 6 shows the pooled effect by metric family.
Figure 6.
Pooled effect by metric family (REML with KH).
3.7. Small-Study Effects and Risk of Bias
The diagnostics are summarized in Table 12 and Figure 7 and Figure 8. In the full corpus, less precise studies report larger improvements: Egger’s regression is significant (intercept , ), as is the Begg–Mazumdar rank correlation (, ), and the meta-regression of g on has a markedly negative slope (, ). Its intercept, the PET estimate, is (95% CI [], ), that is, the effect extrapolated to a zero standard error is no longer favorable. The asymmetry is concentrated in the AI family (Egger ) and weakens without the outliers (Egger intercept , ), although the slope on persists (, ). Rosenthal’s fail-safe N (5906, against a threshold of 390) shows that the significance of the mean effect would withstand a large number of unpublished null studies, but it says nothing about bias in the magnitude of the effect. The normal Q–Q regression of the standardized residuals (slope , ; intercept , ) indicates tails somewhat heavier than normal.
Table 12.
Small-study and distributional diagnostics.
Figure 7.
Funnel plot of the 76 studies.
Figure 8.
Normal Q–Q plot of the standardized random-effects residuals (REML). Each dot is one study (the underlying values are given in Appendix B); the red line is the least-squares fit to the points.
These signals cannot be attributed to publication bias with confidence, because depends mechanically on g (Equation (2)). The Pustejovsky–Rodgers regression, which removes this dependence, detects no asymmetry: the slope on is (95% CI [], ) for the full corpus and () without the influential studies, and it is not significant within any family (Table 12). The Egger, Begg and PET results therefore probably reflect this artifact, at least in part, and should be read accordingly, although the power of the test is limited, with 76 studies and a median of five evaluation units per study. In sum, the diagnostics do not establish publication bias, but they leave the magnitude of the pooled effect, more than its direction, uncertain.
3.8. Robustness
The pooled effect is stable under four alternative specifications. First, it barely depends on the variance estimator (g from with REML to with PM) or on the removal of influential studies (). Second, coding the ensemble models as AI leaves the AI estimate almost unchanged (, 95% CI [], ) and the advanced-versus-classical contrast identical (), because ensembles belong to the advanced group under both codings. Third, using the alternative variance of Hedges’ g (Equation (3)) yields (95% CI [], , ). Fourth, allowing for a positive within-unit correlation between the error series of the two models (Equation (4)) reduces the standard errors (median at and at ) but leaves the conclusions unchanged (Table 13). The pooled effect moves only from to , and the estimated between-study variance rises from to because the smaller sampling variances are absorbed by heterogeneity. The prediction interval includes zero at every r. The advanced-versus-classical contrast remains non-significant ( from to , p from to ), as does the omnibus test across the five families () and the pooled direct comparison (g from to ). The assessment of therefore does not depend on omitting the within-unit correlation.
Table 13.
Sensitivity to the within-unit correlation r between the error series of the proposed model and of the comparator (REML + KH).
The exception is the re-admission of the seven studies with invalid effect sizes (Table 14). The REML–KH estimate remains similar (, 95% CI [], ), but the DL estimate collapses to (95% CI [], ), because the standard errors of these studies (–) do not reflect sampling uncertainty across independent units and give them almost all the weight. An estimate that changes with the estimator and is driven by a few such studies is not a reliable summary, which supports their exclusion.
Table 14.
Sensitivity of the pooled effect to re-admitting the seven studies whose effect size was not a valid error comparison.
4. Discussion
The models proposed for wind forecasting in coastal and complex-terrain environments reduce error relative to their own comparators by about one standard deviation of the between-unit error variability (), regardless of the estimator, of a few extreme studies or of how ensemble models are coded. The direct comparison of advanced and classical models, which is the question that motivated this review, points in the same direction but is imprecise: nine of the ten studies favor the advanced model, yet the pooled effect is not significant under the primary estimator (, 95% CI []). Heterogeneity is high () and the prediction interval includes zero, so the size of the gain in a new application remains uncertain.
The pooled effect and the direct comparisons answer different questions. In 59 of the 76 studies, the comparator belongs to the same family as the proposed model, so the pooled effect measures the gain of a new model over an earlier model of the same kind, as expected when authors report improvements over their own baselines. The ten studies that contrast an advanced model with a classical one yield an effect of similar size, also against physical comparators alone (, , 95% CI []), but with intervals that include zero under the primary estimator, partly because two studies against statistical comparators have very large effects. The meta-regression on the family of the proposed model has the same direction (, 95% CI [], ): it is compatible with an advantage of about one standard deviation and with no difference. is therefore not supported at the conventional level of significance, although the estimates favor advanced models and none of the analyses suggests the converse. The limit is precision, not direction: few studies compare the two classes directly, and the hybrid, ensemble and statistical families rest on two to four studies each.
The two families with enough studies show a similar size of improvement, but of a different kind. For AI models (, ), 47 studies report an improvement, and in 40 the comparator is another AI model, so the effect reflects the refinement of data-driven architectures, for example, a new deep network against a recurrent baseline; only four studies compare an AI model with a statistical one and two with a physical one. For physical models (, ), 17 studies compare a configuration or product of a numerical system with another of the same system, such as a boundary-layer scheme, the assimilation of lidar data, the horizontal resolution or the choice of reanalysis, and 6 of the 19 favor the comparator, so the improvements are less consistent than for AI, which may reflect reporting practice as well as the models. The difference between the two families is small and not significant (, 95% CI []). Published refinements thus reduce error by about one standard deviation in both, but this does not show that one family is preferable to the other.
Three features of the evidence call for caution. The magnitude of the effect is uncertain: less precise studies report larger effects (Egger, Begg–Mazumdar and the slope on ), and the effect falls from to without the three most extreme studies. Because the standard error of a standardized mean difference depends on the effect itself, this asymmetry is probably largely mechanical, as the Pustejovsky–Rodgers test suggests, although publication or reporting bias cannot be excluded. Effect sizes are also reconstructed from a median of 5 evaluation units per study, so g expresses the improvement relative to the dispersion of the aggregated error metrics across those units, not relative to the step-by-step variability of the forecast error, and the results are best read as a synthesis of standardized reported improvements, not as the gain at the level of individual forecasts. Finally, absolute-error metrics, mostly the RMSE, account for 64 of the 76 studies, whereas correlation and relative-performance metrics are supported by only 5 and 6, so statements about metric-specific behavior are tentative. Neither the prediction target nor the metric family moderated the effect.
For wind energy planning in the Colombian Caribbean, the published comparative evidence cannot settle the choice between advanced and classical architectures, and gains reported against a baseline of the same family may not transfer between sites. Until studies compare both classes on the same data and with common metrics, stating the number and independence of the evaluation units, a model should be validated at the site against a classical baseline before it is adopted.
Limitations
This synthesis has six main limitations. First, the corpus is unbalanced with respect to the question posed: 59 of the 76 comparisons are within a family and only 10 compare an advanced with a classical model, and the statistical (), hybrid () and ensemble () families are too small for separate conclusions. Second, effect sizes were reconstructed from aggregate error metrics, taking the reported evaluation units (horizons, seasons, stations, turbines or site-years) as sampling units. These units may not be independent and are few (median 5, range 3–60), so does not represent true sampling error and the intervals are approximate; the Knapp–Hartung correction mitigates this but does not remove it, and the within-unit correlation between the two models is unknown, although assuming r between 0.5 and 0.9 does not alter the conclusions (Table 13). Third, 41 studies lacked the data for an effect size and 7 were excluded for an invalid comparison; if they differ systematically from the retained studies, the results may be biased, although re-admitting them does not change the direction of the REML–KH estimate (Table 14). Fourth, forecasting horizon, temporal resolution and test-set size could not be examined as moderators because the primary studies do not report them in a comparable form. Fifth, the classification into families is a coding decision: it was verified against the full texts and its main uncertainty (ensemble versus AI) is examined in a sensitivity analysis, but families such as AI still group methodologically diverse models. Sixth, the choice of REML with KH, the validity criterion and the outlier rule were specified after the registration of the protocol and are therefore post hoc, although all alternatives are reported.
Future meta-analyses should concentrate on studies with well-defined atmospheric regimes, such as tropical coastal microclimates influenced by the Intertropical Convergence Zone (ITCZ), where environmental parameters and spatial scales can be held constant and each subgroup has enough studies for analysis.
5. Conclusions
This synthesis of 76 studies (selected from 100 with extractable effect sizes) shows that the models proposed for wind forecasting in coastal and complex-terrain environments outperform the comparators against which they are evaluated (pooled Hedges’ , 95% CI []). The effect is robust to the estimator and to influential studies, and remains substantial without the three most extreme studies (). Heterogeneity is high and the prediction interval includes zero, so the size of the gain in a new application is uncertain. The point estimates favor advanced architectures (AI, hybrid and ensemble) over classical ones (physical and statistical), but the difference is not statistically significant (meta-regression , 95% CI [], ), and is therefore not supported. The ten studies that compare the two classes directly point the same way (nine favor the advanced model; , 95% CI []), so the evidence is consistent in direction but too limited in number to establish a difference. By family, the improvement is clearly supported for AI (, ) and physical models (, ), which account for 67 of the 76 studies and do not differ significantly from each other; for the hybrid, ensemble and statistical families, with 2 to 4 studies each, the data are insufficient for separate estimates. Most comparisons are made between models of the same family, and the small-study diagnostics do not exclude some overestimation of the reported improvements. Future work should report advanced and classical models on common data and metrics, stating the number and independence of the evaluation units, and should prioritize the underrepresented statistical, hybrid and ensemble families identified in Section 4.
Author Contributions
Conceptualization, M.C.-R. and A.O.-C.; methodology, M.C.-R., A.O.-C. and D.R.-L.; software, M.C.-R. and D.R.-L.; validation, M.C.-R., A.O.-C., C.R.-A. and I.T.-O.; formal analysis, M.C.-R. and D.R.-L.; investigation, M.C.-R., C.R.-A. and I.T.-O.; resources, A.O.-C. and C.R.-A.; data curation, M.C.-R., D.R.-L. and I.T.-O.; writing—original draft preparation, M.C.-R.; writing—review and editing, M.C.-R., A.O.-C., D.R.-L., C.R.-A. and I.T.-O.; visualization, M.C.-R. and D.R.-L.; supervision, A.O.-C. and C.R.-A.; project administration, A.O.-C.; funding acquisition, A.O.-C. and C.R.-A. All authors have read and agreed to the published version of the manuscript.
Funding
This research was funded by the Ministerio de Ciencia, Tecnología e Innovación—Fondo Francisco José de Caldas and the Agencia Nacional de Hidrocarburos (ANH), through the Contrato de Financiamiento de Recuperación Contingente No. 112721-053-2025, within the project “Herramientas tecnológicas y prototipos para caracterizar, identificar y optimizar el potencial eólico en zonas costeras de Colombia” (Project Code 111983).
Institutional Review Board Statement
Not applicable. This study is a meta-analysis of previously published, publicly available literature and did not involve new experiments on humans or animals.
Informed Consent Statement
Not applicable.
Data Availability Statement
The data extracted from the 76 studies of the primary analysis (effect sizes, standard errors, families of the proposed model and of the comparator, prediction target and metric) are reported in Appendix A, and the studies excluded after data extraction are listed in Table A3. The pre-registered protocol is available on the Open Science Framework [32]. The data file and the complete analysis code, with the tests that regenerate every table and figure of this paper, are available in a public GitLab repository: https://gitlab.com/maralcar/wind-forecasting-meta-analysis (accessed on 2 October 2026).
Conflicts of Interest
The authors declare no conflicts of interest.
Abbreviations
The following abbreviations are used in this manuscript:
| AI | Artificial Intelligence |
| ML | Machine Learning |
| DL | DerSimonian–Laird (Estimator) |
| KH | Knapp–Hartung Adjustment |
| HYB | Hybrid |
| ENS | Ensemble |
| PHY | Physical |
| STA | Statistical |
| NWP | Numerical Weather Prediction |
| WRF | Weather Research and Forecasting model |
| LSTM | Long Short-Term Memory (Neural Network) |
| GRU | Gated Recurrent Unit |
| CNN | Convolutional Neural Network |
| RF | Random Forest |
| PICO | Population, Intervention, Comparison, Outcome |
| PRISMA | Preferred Reporting Items for Systematic Reviews and Meta-Analyses |
| SMD | Standardized Mean Difference |
| CI | Confidence Interval |
| PI | Prediction Interval |
| WPO | Wind Power Output |
| WSP | Wind Speed or Profile |
| REML | Restricted Maximum Likelihood |
| PM | Paule–Mandel (estimator) |
| AEM | Absolute Error Metrics |
| CRM | Correlation Metrics |
| ACC | Accuracy |
| PRM | Relative Performance Metrics |
Appendix A. Study Data Appendix
This appendix presents the data of the 76 studies of the primary analysis, which support the analyses of Section 2 and Section 3.8.
Appendix A.1. Individual Study Results
Table A1.
Individual study data of the primary analysis (): identifier, reference, family of the proposed model, family of the comparator, prediction target, original error metric, Hedges’ g (negative favors the proposed model), standard error, and random-effects weight (REML, %).
Appendix B. Normal Q–Q Plot Data
Table A2.
Points of the normal Q–Q plot (Figure 8): standardized random-effects residuals (REML), ordered from smallest to largest, with the corresponding theoretical normal quantiles.
Appendix C. Studies Excluded After Effect-Size Extraction
The following 24 studies yielded an extracted effect size but were not retained in the primary analysis. The seven studies excluded because their effect size was not a valid error comparison are examined in the sensitivity analysis in Table 14.
Table A3.
Studies from which an effect size was extracted () but that were not retained in the primary analysis ().
References
- Allahyarzadeh, A.; Sharifzadeh, M. Integrated carbon capture and renewable technologies for carbon neutral energy hubs: A network-ready superstructure model. Renew. Energy 2026, 256, 124570. [Google Scholar] [CrossRef] [Scilit]
- Chaaben, N.; Saida, I.; Helali, K. Analyzing the non-linear impact of carbon dioxide emissions on renewable energy in Commonwealth nations. Renew. Sustain. Energy Rev. 2026, 227, 116494. [Google Scholar] [CrossRef] [Scilit]
- Graham, E.; Fulghum, N.; Altieri, K. Global Electricity Review 2025; Ember: London, UK, 2025; Available online: https://ember-energy.org/latest-insights/global-electricity-review-2025/ (accessed on 20 January 2026).
- Ember. Global Electricity Review 2024: Trends and Data Analysis; Ember: London, UK, 2024; Available online: https://ember-energy.org/latest-insights/global-electricity-review-2024/global-electricity-trends/ (accessed on 20 January 2026).
- Ragab, K.M.; Orhan, M.F. Evaluating conventional and renewable energy systems for green buildings: A case study on energy efficiency and cost optimization. Case Stud. Therm. Eng. 2024, 63, 105233. [Google Scholar] [CrossRef] [Scilit]
- Krarti, M.; Aldubyan, M. Role of energy efficiency and distributed renewable energy in designing carbon neutral residential buildings and communities: Case study of Saudi Arabia. Energy Build. 2021, 250, 111309. [Google Scholar] [CrossRef] [Scilit]
- Siddique, M.A.; Nobanee, H.; Hasan, M.B.; Uddin, G.S.; Hossain, M.N.; Park, D. How do energy markets react to climate policy uncertainty? Fossil vs. renewable and low-carbon energy assets. Energy Econ. 2023, 128, 107195. [Google Scholar] [CrossRef] [Scilit]
- Ferreira, G.W.S.; Reboita, M.S. A New Look into the South America Precipitation Regimes: Observation and Forecast. Atmosphere 2022, 13, 873. [Google Scholar] [CrossRef] [Scilit]
- Arias, P.A.; Garreaud, R.; Poveda, G.; Espinoza, J.C.; Molina-Carpio, J.; Masiokas, M.; Viale, M.; Scaff, L.; Van Oevelen, P.J. Hydroclimate of the Andes Part II: Hydroclimate Variability and Sub-Continental Patterns. Front. Earth Sci. 2021, 8, 505467. [Google Scholar] [CrossRef] [Scilit]
- Martinez, J.A.; Junquas, C.; Bozkurt, D.; Viale, M.; Fita, L.; Trachte, K.; Campozano, L.; Arias, P.A.; Boisier, J.P.; Condom, T.; et al. Recent progress in atmospheric modeling over the Andes—Part I: Review of atmospheric processes. Front. Earth Sci. 2024, 12, 1427783. [Google Scholar] [CrossRef] [Scilit]
- Arias, P.A.; Correa, I.C.; Fita, L.; Martínez, J.A.; Alvarez-Garreton, C.; Alves, L.M.; Boisier, J.P.; Campozano, L.; Espinoza, J.C.; Junquas, C.; et al. How well CMIP6 models simulate key boundary conditions affecting South American climate? Insights for regional modeling efforts. Clim. Dyn. 2025, 63, 231. [Google Scholar] [CrossRef] [Scilit]
- Byrne, H.; Seager, R.; Smerdon, J.E. CMIP6 models cannot capture long-term forced changes in the tropical Pacific sea surface temperature gradient. Nat. Commun. 2026, 17, 142. [Google Scholar] [CrossRef] [Scilit]
- Torres-Bejarano, F.M.; Torregroza-Espinosa, A.C.; Restrepo, J.C. Modeling sediment transport and salt stratification in river estuaries: A case study of the Magdalena River, Colombia. Catena 2025, 261, 109589. [Google Scholar] [CrossRef] [Scilit]
- Liu, Y.; Chen, D.; Yi, Q.; Li, S. Wind profiles and wave spectra for potential wind farms in South China Sea. Part I: Wind speed profile model. Energies 2017, 10, 125. [Google Scholar] [CrossRef] [Scilit]
- Naranjo-Vesga, J.; Mantilla, O.; Rincón-Martínez, D.; Rodriguez-Rubio, E.; Ortiz-Karpf, A.; Winter, C.; Rojas-Agramonte, Y. The Guajira contourite depositional system along the northern Colombian Caribbean convergent margin. Mar. Pet. Geol. 2025, 182, 107556. [Google Scholar] [CrossRef] [Scilit]
- Karpatne, A.; Atluri, G.; Faghmous, J.H.; Steinbach, M.; Banerjee, A.; Ganguly, A.; Shekhar, S.; Samatova, N.; Kumar, V. Theory-Guided Data Science: A New Paradigm for Scientific Discovery from Data. IEEE Trans. Knowl. Data Eng. 2017, 29, 2318–2331. [Google Scholar] [CrossRef] [Scilit]
- Kashinath, K.; Mustafa, M.; Albert, A.; Wu, J.L.; Jiang, C.; Esmaeilzadeh, S.; Azizzadenesheli, K.; Wang, R.; Chattopadhyay, A.; Singh, A.; et al. Physics-informed machine learning: Case studies for weather and climate modelling. Philos. Trans. R. Soc. A 2021, 379, 20200093. [Google Scholar] [CrossRef] [Scilit]
- Piotrowski, P.; Rutyna, I.; Baczyński, D.; Kopyt, M. Evaluation metrics for wind power forecasts: A comprehensive review and statistical analysis of errors. Energies 2022, 15, 9657. [Google Scholar] [CrossRef] [Scilit]
- Haq, I.U.; Kumar, A.; Rathore, P.S. Machine learning approaches for wind power forecasting: A comprehensive review. Discov. Appl. Sci. 2025, 7, 1139. [Google Scholar] [CrossRef] [Scilit]
- Prema, V.; Bhaskar, M.S.; Almakhles, D.; Gowtham, N.; Rao, K.U. Critical review of data, models and performance metrics for wind and solar power forecast. IEEE Access 2022, 10, 667–688. [Google Scholar] [CrossRef] [Scilit]
- Valdivia-Bautista, S.M. Artificial Intelligence in wind speed forecasting: A review. Energies 2023, 16, 2457. [Google Scholar] [CrossRef] [Scilit]
- Cryer, J.D.; Chan, K.-S. Time Series Analysis: With Applications in R, 2nd ed.; Springer: New York, NY, USA, 2008. [Google Scholar] [CrossRef] [Scilit]
- McCabe, E.J.; Freedman, J.M. Quantifying the uncertainty in the weather research and forecasting model under sea breeze and low-level jet conditions in the New York Bight: Importance to offshore wind energy. Weather Forecast. 2025, 40, 425–450. [Google Scholar] [CrossRef] [Scilit]
- Balasubramanian, K.; Thanikanti, S.B.; Subramaniam, U.; Sudhakar, N.; Sichilalu, S. A novel review on optimization techniques used in wind farm modelling. Renew. Energy Focus 2020, 35, 84–96. [Google Scholar] [CrossRef] [Scilit]
- Lee, S.; Almomani, M.H.; Alomari, S.A.; Saleem, K.; Smerat, A.; Snasel, V.; Gandomi, A.H.; Abualigah, L. A novel deep learning framework with artificial protozoa optimization-based adaptive environmental response for wind power prediction. Sci. Rep. 2025, 15, 18746. [Google Scholar] [CrossRef] [Scilit]
- Mo, S.; Wang, H.; Liu, Q. Powerformer: A temporal-based transformer model for wind power forecasting. Energy Rep. 2024, 11, 736–744. [Google Scholar] [CrossRef] [Scilit]
- Bui, H.; Bakhoday-Paskyabi, M.; Mohammadpour-Penchah, M. Implementation of a Simple Actuator Disk for Large-Eddy Simulation in the Weather Research and Forecasting Model (WRF-SADLES v1.2) for wind turbine wake simulation. Geosci. Model Dev. 2024, 17, 4447–4465. [Google Scholar] [CrossRef] [Scilit]
- Larsén, X.G.; Fischereit, J. A case study of wind farm effects using two wake parameterizations in the Weather Research and Forecasting (WRF) model (V3.7.1) in the presence of low-level jets. Geosci. Model Dev. 2021, 14, 3141–3158. [Google Scholar] [CrossRef] [Scilit]
- Fernández-González, S.; Martín, M.L.; García-Ortega, E.; Merino, A.; Lorenzana, J.; Sánchez, J.L.; Valero, F.; Rodrigo, J.S. Sensitivity Analysis of the WRF Model: Wind-Resource Assessment for Complex Terrain. J. Appl. Meteor. Climatol. 2018, 57, 733–753. [Google Scholar] [CrossRef] [Scilit]
- Giannakopoulou, E.-M.; Nhili, R. WRF Model Methodology for Offshore Wind Energy Applications. Adv. Meteorol. 2014, 2014, 319819. [Google Scholar] [CrossRef] [Scilit]
- Sandeepan, B.S.; Panchang, V.G.; Nayak, S.; Kumar, K.K.; Kaihatu, J.M. Performance of the WRF Model for Surface Wind Prediction around Qatar. J. Atmos. Ocean. Technol. 2018, 35, 575–592. [Google Scholar] [CrossRef] [Scilit]
- Restrepo-Leal, D.; Carrillo-Reales, M. Protocol for the review and meta-analysis of the accuracy of Advanced Methods (AI, Ensemble and Hybrid) versus Classical Methods (Pure Physical and Statistical) for forecasting wind speed and wind power at onshore and offshore sites influenced by coastal or trade wind dynamics or located in complex terrain. OSF Regist. 2026. [Google Scholar] [CrossRef]
- Westgate, M.J. revtools: An R package to support article screening for evidence synthesis. Res. Synth. Methods 2019, 10, 606–614. [Google Scholar] [CrossRef] [Scilit]
- Hansen, C.; Steinmetz, H.; Block, J. How to conduct a meta-analysis in eight steps: A practical guide. Manag. Rev. Q. 2022, 72, 1–19. [Google Scholar] [CrossRef] [Scilit]
- Schmidt, F.L.; Hunter, J.E. Comparison of three meta-analysis methods revisited: An analysis of Johnson, Mullen, and Salas (1995). J. Appl. Psychol. 1999, 84, 144–148. [Google Scholar] [CrossRef]
- Hedges, L.V. Distribution theory for Glass’s estimator of effect size and related estimators. J. Educ. Behav. Stat. 1981, 6, 107–128. [Google Scholar] [CrossRef] [Scilit]
- Hedges, L.V.; Gurevitch, J.; Curtis, P.S. The meta-analysis of response ratios in experimental ecology. Ecology 1999, 80, 1150–1156. [Google Scholar] [CrossRef]
- Austin, P.C. Absolute risk reductions, relative risks, relative risk reductions, and numbers needed to treat can be obtained from a logistic regression model. J. Clin. Epidemiol. 2010, 63, 2–6. [Google Scholar] [CrossRef] [Scilit]
- Andrade, C. Understanding relative risk, odds ratio, and related terms: As simple as it can get. J. Clin. Psychiatry 2015, 76, e857–e861. [Google Scholar] [CrossRef] [Scilit]
- Borenstein, M.; Hedges, L.V.; Higgins, J.P.; Rothstein, H.R. Introduction to Meta-Analysis; John Wiley & Sons: Hoboken, NJ, USA, 2009. [Google Scholar]
- Sánchez-Meca, J.; Marín-Martínez, F.; Chacón-Moscoso, S. Effect-size indices for dichotomized outcomes in meta-analysis. Psychol. Methods 2003, 8, 448–467. [Google Scholar] [CrossRef] [Scilit]
- Cohen, J. Statistical Power Analysis for the Behavioral Sciences, 2nd ed.; Erlbaum: New York, NY, USA, 1998. [Google Scholar]
- Yeganeh-Bakhtiary, A.; EyvazOghli, H.; Shabakhty, N.; Kamranzad, B.; Abolfathi, S. Machine Learning as a Downscaling Approach for Prediction of Wind Characteristics under Future Climate Change Scenarios. Complexity 2022, 2022, 8451812. [Google Scholar] [CrossRef] [Scilit]
- Viechtbauer, W. Bias and efficiency of meta-analytic variance estimators in the random-effects model. J. Educ. Behav. Stat. 2005, 30, 261–293. [Google Scholar] [CrossRef] [Scilit]
- DerSimonian, R.; Laird, N. Meta-analysis in clinical trials. Control. Clin. Trials 1986, 7, 177–188. [Google Scholar] [CrossRef] [Scilit]
- Paule, R.C.; Mandel, J. Consensus values and weighting factors. J. Res. Natl. Bur. Stand. 1982, 87, 377–385. [Google Scholar] [CrossRef] [Scilit]
- Knapp, G.; Hartung, J. Improved tests for a random effects meta-regression with a single covariate. Stat. Med. 2003, 22, 2693–2710. [Google Scholar] [CrossRef] [Scilit]
- IntHout, J.; Ioannidis, J.P.A.; Rovers, M.M.; Goeman, J.J. Plea for routinely presenting prediction intervals in meta-analysis. BMJ Open 2016, 6, e010247. [Google Scholar] [CrossRef] [Scilit]
- Fang, H.; Lin, S.; Zhu, J.; Lu, W. Application of deep forest algorithm incorporating seasonality and temporal correlation for wind speed prediction in offshore wind farm. Front. Energy Res. 2024, 12, 1488718. [Google Scholar] [CrossRef] [Scilit]
- Cuevas-Figueroa, G.; Stansby, P.K.; Stallard, T. Accuracy of WRF for prediction of operational wind farm data and assessment of influence of upwind farms on power production. Energy 2022, 254, 124362. [Google Scholar] [CrossRef] [Scilit]
- Kyriakou, S.; Kosmidis, I.; Sartori, N. Median bias reduction in random-effects meta-analysis and meta-regression. Stat. Methods Med. Res. 2019, 28, 1622–1636. [Google Scholar] [CrossRef] [Scilit]
- Holm, S. A simple sequentially rejective multiple test procedure. Scand. J. Stat. 1979, 6, 65–70. [Google Scholar]
- Raudenbush, S.W.; Bryk, A.S. Hierarchical Linear Models: Applications and Data Analysis Methods, 2nd ed.; Sage Publications: Newbury Park, CA, USA, 2002. [Google Scholar]
- Viechtbauer, W.; Cheung, M.W.-L. Outlier and influence diagnostics for meta-analysis. Res. Synth. Methods 2010, 1, 112–125. [Google Scholar] [CrossRef] [Scilit]
- Egger, M.; Smith, G.D.; Schneider, M.; Minder, C. Bias in meta-analysis detected by a simple, graphical test. Brit. Med. J. 1997, 315, 629–634. [Google Scholar] [CrossRef] [Scilit]
- Rosenthal, R. The `file-drawer’ problem and tolerance for null results. Psychol. Bull. 1979, 86, 638–641. [Google Scholar] [CrossRef]
- Begg, C.B.; Mazumdar, M. Operating characteristics of a rank correlation test for publication bias. Biometrics 1994, 50, 1088–1101. [Google Scholar] [CrossRef] [Scilit]
- Pustejovsky, J.E.; Rodgers, M.A. Testing for funnel plot asymmetry of standardized mean differences. Res. Synth. Methods 2019, 10, 57–71. [Google Scholar] [CrossRef] [Scilit]
- van Rhee, H.J.; Suurmond, R.; Hak, T. User Manual for Meta-Essentials: Workbooks for Meta-Analysis; Erasmus Research Institute of Management: Rotterdam, The Netherlands, 2015; Available online: https://repub.eur.nl/pub/78635/User-manual-1.3.pdf (accessed on 5 January 2026).
- Suurmond, R.; van Rhee, H.; Hak, T. Introduction, comparison, and validation of Meta-Essentials: A free and simple tool for meta-analysis. Res. Synth. Methods 2017, 8, 537–553. [Google Scholar] [CrossRef] [Scilit]
- Hak, T.; van Rhee, H.J.; Suurmond, R. How to Interpret Results of Meta-Analysis; Erasmus Rotterdam Institute of Management: Rotterdam, The Netherlands, 2016; Available online: https://repub.eur.nl/pub/80102/How-to-interpret-results-of-meta-analysis-1.3.pdf (accessed on 5 January 2026).
- Haddaway, N.R.; Page, M.J.; Pritchard, C.C.; McGuinness, L.A. PRISMA2020: An R package and Shiny app for producing PRISMA 2020-compliant flow diagrams, with interactivity for optimised digital transparency and Open Synthesis. Campbell Syst. Rev. 2022, 18, e1230. [Google Scholar] [CrossRef] [Scilit]
- Zhang, Y.; Qiao, D.; Wu, S.; Liu, C.; Zhao, B.; Gu, Y.; Du, T. Short-term wind power forecasting in complex terrain based on spatiotemporal enhanced deep correction network. Renew. Energy 2026, 256, 124342. [Google Scholar] [CrossRef] [Scilit]
- Wang, Q.; Xu, F.; He, J.; Luo, K.; Fan, J. A new fusion model for enhanced ultra-short-term offshore wind power forecasting. Renew. Energy 2026, 256, 123876. [Google Scholar] [CrossRef] [Scilit]
- Michos, D.; Catthoor, F.; Foussekis, D.; Kazantzidis, A. A CFD Model for Spatial Extrapolation of Wind Field over Complex Terrain—Wi. Sp.Ex. Energies 2024, 17, 4139. [Google Scholar] [CrossRef] [Scilit]
- Chen, G.; Li, X.; Zhang, R.; Zhang, H.; Han, J.; Zhang, T. Short-term offshore wind speed prediction model based on VMD-GDPSO-TCN-BiLSTM. Ocean Eng. 2025, 341, 122518. [Google Scholar] [CrossRef] [Scilit]
- Leme Beu, C.M.; Landulfo, E. Machine-learning-based estimate of the wind speed over complex terrain using the long short-term memory (LSTM) recurrent neural network. Wind Energy Sci. 2024, 9, 1431–1450. [Google Scholar] [CrossRef] [Scilit]
- Zaman, T.; Juliano, T.W.; Hawbecker, P.; Astitha, M. On Predicting Offshore Hub Height Wind Speed and Wind Power Density in the Northeast US Coast Using High-Resolution WRF Model Configurations during Anticyclones Coinciding with Wind Drought. Energies 2024, 17, 2618. [Google Scholar] [CrossRef] [Scilit]
- Redfern, S.; Optis, M.; Xia, G.; Draxl, C. Offshore wind energy forecasting sensitivity to sea surface temperature input in the Mid-Atlantic. Wind Energy Sci. 2023, 8, 1–23. [Google Scholar] [CrossRef] [Scilit]
- Liu, X.; Li, Z.; Shen, Y. Study on Downscaling Correction of Near-Surface Wind Speed Grid Forecasts in Complex Terrain. Atmosphere 2024, 15, 1090. [Google Scholar] [CrossRef] [Scilit]
- Xu, Y.; Lin, Y.; Li, S.; Gao, X. Prediction Model of Offshore Wind Power Based on Multi-Level Attention Mechanism and Multi-Source Data Fusion. Electronics 2025, 14, 3183. [Google Scholar] [CrossRef] [Scilit]
- Theuer, F.; van Dooren, M.F.; von Bremen, L.; Kühn, M. Minute-scale power forecast of offshore wind turbines using long-range single-Doppler lidar measurements. Wind Energy Sci. 2020, 5, 1449–1468. [Google Scholar] [CrossRef] [Scilit]
- Chen, J.; Fu, X.; Zhang, L.; Shen, H.; Wu, J. A novel offshore wind power prediction model based on TCN-DANet-sparse transformer and considering spatio-temporal coupling in multiple wind farms. Energy 2024, 308, 132899. [Google Scholar] [CrossRef] [Scilit]
- Michos, D.; Catthoor, F.; Foussekis, D.; Kazantzidis, A. Ultra-Short-Term Wind Power Forecasting in Complex Terrain. Energies 2024, 17, 5493. [Google Scholar] [CrossRef] [Scilit]
- Kumar, R.; Rutgersson, A.; Asim, M.; Routray, A. Understanding Wind Characteristics Over Different Terrains for Wind Turbine Deployment. Meteorol. Appl. 2025, 32, e70079. [Google Scholar] [CrossRef] [Scilit]
- Bianco, L.; Muradyan, P.; Djalalova, I.; Wilczak, J.M.; Olson, J.B.; Kenyon, J.S.; Kotamarthi, R.; Lantz, K.; Long, C.N.; Turner, D.D. Comparison of Observations and Predictions of Daytime Planetary-Boundary-Layer Heights and Surface Meteorological Variables in the Columbia River Gorge and Basin During the Second Wind Forecast Improvement Project. Bound.-Layer. Meteorol. 2022, 182, 147–172. [Google Scholar] [CrossRef] [Scilit]
- Guo, Z.; Lyu, Z.; Liu, Y. Challenge and Bias Correction for Surface Wind Speed Prediction: A Case Study in Shanxi Province, China. Climate 2025, 13, 150. [Google Scholar] [CrossRef] [Scilit]
- Li, T.; Ai, L.; Yang, Q.; Zhang, X.; Li, H.; Lu, D.; Shen, H. Short-term wind power prediction based on multiscale numerical simulation coupled with deep learning. Renew. Energy 2025, 246, 122951. [Google Scholar] [CrossRef] [Scilit]
- Martzikos, N.; Craven, M.; Walker, D.; Conley, D. Enhancing offshore wind Resource assessment through neural network-based HF radar data analysis. Renew. Energy 2026, 256, 124547. [Google Scholar] [CrossRef] [Scilit]
- Myers, T.A.; Ormer, A.V.; Turner, D.D.; Wilczak, J.M.; Bianco, L.; Adler, B. Evaluation of Hub-Height Wind Forecasts Over the New York Bight. Wind Energy 2024, 27, 1063–1073. [Google Scholar] [CrossRef] [Scilit]
- Qiao, D.; Wu, S.; Li, G.; You, J.; Zhang, J.; Shen, B. Wind speed forecasting using multi-site collaborative deep learning for complex terrain application in valleys. Renew. Energy 2022, 189, 231–244. [Google Scholar] [CrossRef] [Scilit]
- Maruo, T.; Ohsawa, T. Wind Estimation Methods for Nearshore Wind Resource Assessment Using High-Resolution WRF and Coastal Onshore Measurements. Wind 2025, 5, 17. [Google Scholar] [CrossRef] [Scilit]
- Ji, L.; Fu, C.; Ju, Z.; Shi, Y.; Wu, S.; Tao, L. Short-Term Canyon Wind Speed Prediction Based on CNN-GRU Transfer Learning. Atmosphere 2022, 13, 813. [Google Scholar] [CrossRef] [Scilit]
- Shi, Y.; Wang, Y.; Zheng, H. Wind Speed Prediction for Offshore Sites Using a Clockwork Recurrent Network. Energies 2022, 15, 751. [Google Scholar] [CrossRef] [Scilit]
- Zhang, Z.; Yin, J. Spatial-temporal offshore wind speed characteristics prediction based on an improved purely 2D CNN approach in a large-scale perspective using reanalysis dataset. Energy Convers. Manag. 2024, 299, 117880. [Google Scholar] [CrossRef] [Scilit]
- Ivanova, T.; Porchetta, S.; Buckingham, S.; Glabeke, G.; van Beeck, J.; Munters, W. Improving wind and power predictions via four-dimensional data assimilation in the WRF model: Case study of storms in February 2022 at Belgian offshore wind farms. Wind Energy Sci. 2025, 10, 245–263. [Google Scholar] [CrossRef] [Scilit]
- Han, X.; Li, X.; Yang, J.; Wang, J.; Ding, J.; Shen, H.; Yan, J.; Fang, H.; Xiao, Q. Enhanced Offshore Wind Speed Forecasts along the US East Coast: A Deep Learning Framework Leveraging NDBC Buoy Data. Ocean-Land Res. 2023, 2, 0031. [Google Scholar] [CrossRef] [Scilit]
- Wang, M.; Ying, F.; Nan, Q. Refined offshore wind speed prediction: Leveraging a two-layer decomposition technique, gated recurrent unit, and kernel density estimation for precise point and interval forecasts. Eng. Appl. Artif. Intell. 2024, 133, 108435. [Google Scholar] [CrossRef] [Scilit]
- Yu, B.; Wang, Y.; Wang, J.; Ma, Y.; Li, W.; Zheng, W. A hybrid model for short-term offshore wind power prediction combining Kepler optimization algorithm with variational mode decomposition and stochastic configuration networks. Int. J. Electr. Power Energy Syst. 2025, 168, 110703. [Google Scholar] [CrossRef] [Scilit]
- Hadjipetrou, S.; Kyriakidis, P. High-Resolution Wind Speed Estimates for the Eastern Mediterranean Basin: A Statistical Comparison Against Coastal Meteorological Observations. Wind 2024, 4, 311–341. [Google Scholar] [CrossRef] [Scilit]
- Cañadillas, B.; Wang, S.; Ahlert, Y.; Djath, B.; Barekzai, M.; Foreman, R.; Lampert, A. Coastal horizontal wind speed gradients in the North Sea based on observations and ERA5 reanalysis data. Meteorol. Z. 2023, 32, 207–228. [Google Scholar] [CrossRef] [Scilit]
- Ge, C.; Yan, J.; Song, W.; Zhang, H.; Wang, H.; Li, Y.; Liu, Y. Middle-term wind power forecasting method based on long-span NWP and microscale terrain fusion correction. Renew. Energy 2025, 240, 122123. [Google Scholar] [CrossRef] [Scilit]
- Che, Y.; Salazar, A.A.; Peng, S.; Zheng, J.; Chen, Y.; Yuan, L. A multi-scale model for day-ahead wind speed forecasting: A case study of the Houhoku wind farm, Japan. Sustain. Energy Technol. Assess. 2022, 52, 101995. [Google Scholar] [CrossRef] [Scilit]
- Liu, X.; Lin, Z.; Feng, Z. Short-term offshore wind speed forecast by seasonal ARIMA—A comparison against GRU and LSTM. Energy 2021, 237, 120492. [Google Scholar] [CrossRef] [Scilit]
- Meng, W.; Sun, P.; Yan, Y.; Wang, J.; Shao, Z.; Yang, S. Enhanced offshore wind power forecasting through multiscale time series decomposition and temporal pattern attention mechanisms. Int. J. Green Energy 2026, 23, 110–128. [Google Scholar] [CrossRef] [Scilit]
- Nezhad, M.M.; Heydari, A.; Pirshayan, E.; Groppi, D.; Garcia, D.A. A novel forecasting model for wind speed assessment using sentinel family satellites images and machine learning method. Renew. Energy 2021, 179, 2198–2211. [Google Scholar] [CrossRef] [Scilit]
- Geng, X.; Xu, L.; He, X.; Yu, J. Graph optimization neural network with spatio-temporal correlation learning for multi-node offshore wind speed forecasting. Renew. Energy 2021, 180, 1014–1025. [Google Scholar] [CrossRef] [Scilit]
- Sun, H.; Song, T.; Li, Y.; Yang, K.; Xu, D.; Meng, F. EEMD-ConvLSTM: A model for short-term prediction of two-dimensional wind speed in the South China Sea. Appl. Intell. 2023, 53, 30186–30202. [Google Scholar] [CrossRef] [Scilit]
- Sacie, M.; Santos, M.; Lopez, R.; Pandit, R. Use of State-of-Art Machine Learning Technologies for Forecasting Offshore Wind Speed, Wave and Misalignment to Improve Wind Turbine Performance. J. Mar. Sci. Eng. 2022, 10, 938. [Google Scholar] [CrossRef] [Scilit]
- Wu, C.; Luo, K.; Wang, Q.; Fan, J. Simulated potential wind power sensitivity to the planetary boundary layer parameterizations combined with various topography datasets in the weather research and forecasting model. Energy 2022, 239, 122047. [Google Scholar] [CrossRef] [Scilit]
- Wan, A.; Peng, S.; AL-Bukhaiti, K.; Ji, Y.; Ma, S.; Yao, F.; Ao, L. A novel hybrid BWO-BiLSTM-ATT framework for accurate offshore wind power prediction. Ocean Eng. 2024, 312, 119227. [Google Scholar] [CrossRef] [Scilit]
- Pérez-Albornoz, C.; Hernández-Gómez, Á.; Ramirez, V.; Guilbert, D. Forecast Optimization of Wind Speed in the North Coast of the Yucatan Peninsula, Using the Single and Double Exponential Method. Clean Technol. 2023, 5, 37. [Google Scholar] [CrossRef] [Scilit]
- Yang, Z.; Peng, X.; Zhang, X.; Song, J.; Wang, B.; Liu, C. Short-Term Offshore Wind Power Prediction Based on Significant Weather Process Classification and Multitask Learning Considering Neighboring Powers. Wind Energy 2024, 27, 1011–1023. [Google Scholar] [CrossRef] [Scilit]
- Yu, M.; Zhang, Z.; Li, X.; Yu, J.; Gao, J.; Liu, Z.; You, B.; Zheng, X.; Yu, R. Superposition Graph Neural Network for offshore wind power prediction. Future Gener. Comput. Syst.-Int. J. Escience 2020, 113, 145–157. [Google Scholar] [CrossRef] [Scilit]
- Shi, P.; Lin, S.; Song, D.; Xu, X.; Wu, J. TRNet: A trend and residual network utilizing novel hilly attention mechanism for wind speed prediction in complex scenario. Energy 2024, 309, 133103. [Google Scholar] [CrossRef] [Scilit]
- Anacona, H.V.; Mattar, C.; Alonso-de-Linaje, N.G.; Sepulveda, H.H.; Crisostomo, J. Wind Simulations over Western Patagonia Using the Weather Research and Forecasting model and Reanalysis. Atmosphere 2023, 14, 1062. [Google Scholar] [CrossRef] [Scilit]
- Afolabi, L.A.; Soukissian, T.; Vicinanza, D.; Contestabile, P. Wind Speed Forecasting in the Greek Seas Using Hybrid Artificial Neural Networks. Atmosphere 2025, 16, 763. [Google Scholar] [CrossRef] [Scilit]
- Xiao, H.; He, X.; Li, C. Multi-step prediction of offshore wind power based on Transformer network and Huber loss. Int. J. Electr. Power Energy Syst. 2024, 162, 110229. [Google Scholar] [CrossRef] [Scilit]
- Dong, D.; Wang, S.; Guo, Q.; Ding, Y.; Li, X.; You, Z. Short-Term Marine Wind Speed Forecasting Based on Dynamic Graph Embedding and Spatiotemporal Information. J. Mar. Sci. Eng. 2024, 12, 502. [Google Scholar] [CrossRef] [Scilit]
- Arthur, R.S.; Rybchuk, A.; Juliano, T.W.; Rios, G.; Wharton, S.; Lundquist, J.K.; Fast, J.D. Evaluating mesoscale model predictions of diurnal speedup events in the Altamont Pass Wind Resource Area of California. Wind Energy Sci. 2025, 10, 1187–1209. [Google Scholar] [CrossRef] [Scilit]
- Korkmaz, D.; Acikgoz, H.; Ustundag, M. Cross-scale fusion network and two-stage decomposition for power forecasting of offshore wind turbines. Ocean Eng. 2025, 341, 122541. [Google Scholar] [CrossRef] [Scilit]
- Xiong, Y.; Wang, W. Offshore wind power multi-step forecasting based on multi-scale attention mechanism fusion network. Eng. Appl. Artif. Intell. 2025, 161, 112026. [Google Scholar] [CrossRef] [Scilit]
- Li, Y.; Pan, J.; Wang, J. A Hybrid Framework for Offshore Wind Power Forecasting: Integrating CNN-BiGRU-XGBoost with Advanced Feature Engineering and Analysis. Energies 2025, 18, 5153. [Google Scholar] [CrossRef] [Scilit]
- Liu, Y.; Miao, F. Improving Offshore Wind Speed Forecasting with a CRGWAA-Enhanced Adaptive Neuro-Fuzzy Inference System. J. Mar. Sci. Eng. 2025, 13, 908. [Google Scholar] [CrossRef] [Scilit]
- Li, S.; Guo, L.; Zhu, J.; Chen, J.; Liu, M.; Cui, X.; Li, L. Medium-term offshore wind speed multi-step forecasting based on VMD and GRU-MATNet model. Ocean Eng. 2025, 325, 120737. [Google Scholar] [CrossRef] [Scilit]
- Du, R.; Chen, H.; Yu, M.; Li, W.; Niu, D.; Wang, K.; Zhang, Z. 3DTCN-CBAM-LSTM short-term power multi-step prediction model for offshore wind power based on data space and multi-field cluster spatio-temporal correlation. Appl. Energy 2024, 376, 124169. [Google Scholar] [CrossRef] [Scilit]
- Mojahid, H.Z.; Basit, A.; Jumaat, A.K.; Zain, J.M.; Haron, N.S.; Jaafar, J.; Ibrahim, S.S.; Kassim, M.; Yusoff, M.; Tahir, N.M. A hybrid fusion of the recurrent neural network and bidirectional long short-term memory for wind speed prediction in the South China Sea. Peerj Comput. Sci. 2025, 11, e3303. [Google Scholar] [CrossRef] [Scilit]
- Hanifi, S.; Zare-Behtash, H.; Cammarano, A.; Lotfian, S. Offshore wind power forecasting based on WPD and optimised deep learning methods. Renew. Energy 2023, 218, 119241. [Google Scholar] [CrossRef] [Scilit]
- Lopez, G.; Arboleya, P. Short-term wind speed forecasting over complex terrain using linear regression models and multivariable LSTM and NARX networks in the Andes Mountains, Ecuador. Renew. Energy 2022, 183, 351–368. [Google Scholar] [CrossRef] [Scilit]
- Konstantinou, T.; Hatziargyriou, N. Complex terrains and wind power: Enhancing forecasting accuracy through CNNs and DeepSHAP analysis. Front. Energy Res. 2024, 11, 1328899. [Google Scholar] [CrossRef] [Scilit]
- Kang, M.; Ko, K.; Kim, M. Verification of the Reliability of Offshore Wind Resource Prediction Using an Atmosphere-Ocean Coupled Model. Energies 2020, 13, 254. [Google Scholar] [CrossRef] [Scilit]
- Chen, K.; Pei, T.; Yang, L.; Wu, T.; Dong, Y. A novel method for multivariate short-term offshore wind forecasting via time-frequency clustering and inverted attention. Energy AI 2025, 22, 100654. [Google Scholar] [CrossRef] [Scilit]
- Fang, L.; He, B.; Yu, S. A modular multi-step forecasting method for offshore wind power clusters. Appl. Energy 2025, 380, 125060. [Google Scholar] [CrossRef] [Scilit]
- Ally, S.; Verstraeten, T.; Daems, P.J.; Nowe, A.; Helsen, J. Modular deep learning approach for wind farm power forecasting and wake loss prediction. Wind Energy Sci. 2025, 10, 779–812. [Google Scholar] [CrossRef] [Scilit]
- Hanifi, S.; Lotfian, S.; Zare-Behtash, H.; Cammarano, A. Offshore Wind Power Forecasting-A New Hyperparameter Optimisation Algorithm for Deep Learning Models. Energies 2022, 15, 6919. [Google Scholar] [CrossRef] [Scilit]
- Acikgoz, H.; Korkmaz, D. Short-term offshore wind speed forecasting approach based on multi-stage decomposition and deep residual network with self-attention. Eng. Appl. Artif. Intell. 2025, 146, 110313. [Google Scholar] [CrossRef] [Scilit]
- Acikgoz, H.; Yildiz, C.; Sekkeli, M. An extreme learning machine based very short-term wind power forecasting method for complex terrain. Energy Sources Part A-Recovery Util. Environ. Eff. 2020, 42, 2715–2730. [Google Scholar] [CrossRef] [Scilit]
- Scheepens, D.R.; Schicker, I.; Hlavackova-Schindler, K.; Plant, C. Adapting a deep convolutional RNN model with imbalanced regression loss for improved spatio-temporal forecasting of extreme wind speed events in the short to medium range. Geosci. Model Dev. 2023, 16, 251–270. [Google Scholar] [CrossRef] [Scilit]
- Daenens, S.; Verstraeten, T.; Daems, P.J.; Nowe, A.; Helsen, J. Spatio-temporal graph neural networks for power prediction in offshore wind farms using SCADA data. Wind Energy Sci. 2025, 10, 1137–1152. [Google Scholar] [CrossRef] [Scilit]
- Ma, H.; Ma, X.; Mei, S.; Wang, F.; Jing, Y. Improving the Near-Surface Wind Forecast around the Turpan Basin of the Northwest China by Using the WRF_TopoWind Model. Atmosphere 2021, 12, 1624. [Google Scholar] [CrossRef] [Scilit]
- Neshat, M.; Nezhad, M.M.; Abbasnejad, E.; Mirjalili, S.; Tjernberg, L.B.; Astiaso Garcia, D.; Alexander, B.; Wagner, M. A deep learning-based evolutionary model for short-term wind speed forecasting: A case study of the Lillgrund offshore wind farm. Energy Convers. Manag. 2021, 236, 114002. [Google Scholar] [CrossRef] [Scilit]
- Sun, J.; Zhang, Y.; Sun, Y.; Fang, H.; Xiao, Z.; Jiang, H. Wind Speed Prediction of Complex Terrain Based on Multi-Dimensional Time Series Decomposition. IEEE Access 2025, 13, 206475–206489. [Google Scholar] [CrossRef] [Scilit]
- Khan, M.; Al-Ammar, E.A.; Naeem, M.R.; Ko, W.; Choi, H.J.; Kang, H.K. Forecasting renewable energy for environmental resilience through computational intelligence. PLoS ONE 2021, 16, e0256381. [Google Scholar] [CrossRef] [Scilit]
- Li, M.; Zhang, K.; Kou, M.; Ma, Y. An offshore wind speed forecasting system based on feature enhancement, deep time series clustering, and extended LSTM. Energy 2025, 333, 137335. [Google Scholar] [CrossRef] [Scilit]
- Xiao, L.; Wang, Y.; Meng, A.; Tan, Z.; Chen, S.; Song, S.; Yin, H.; Luo, J. Power prediction methods for offshore wind farm clusters: Interpretable ASTGCN based on wind speed delay perception and spatial feature fusion. Energy 2025, 341, 139345. [Google Scholar] [CrossRef] [Scilit]
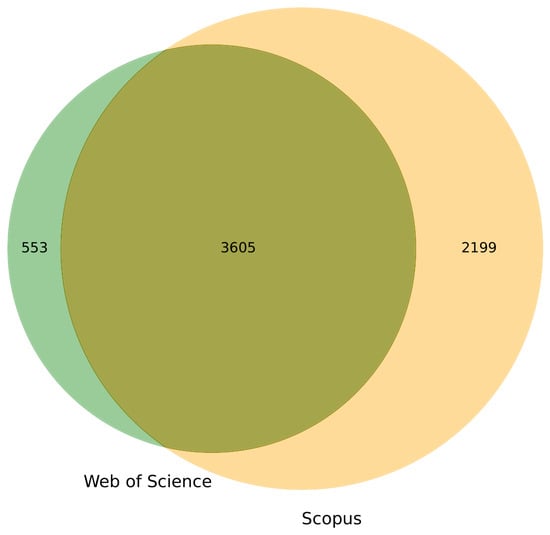
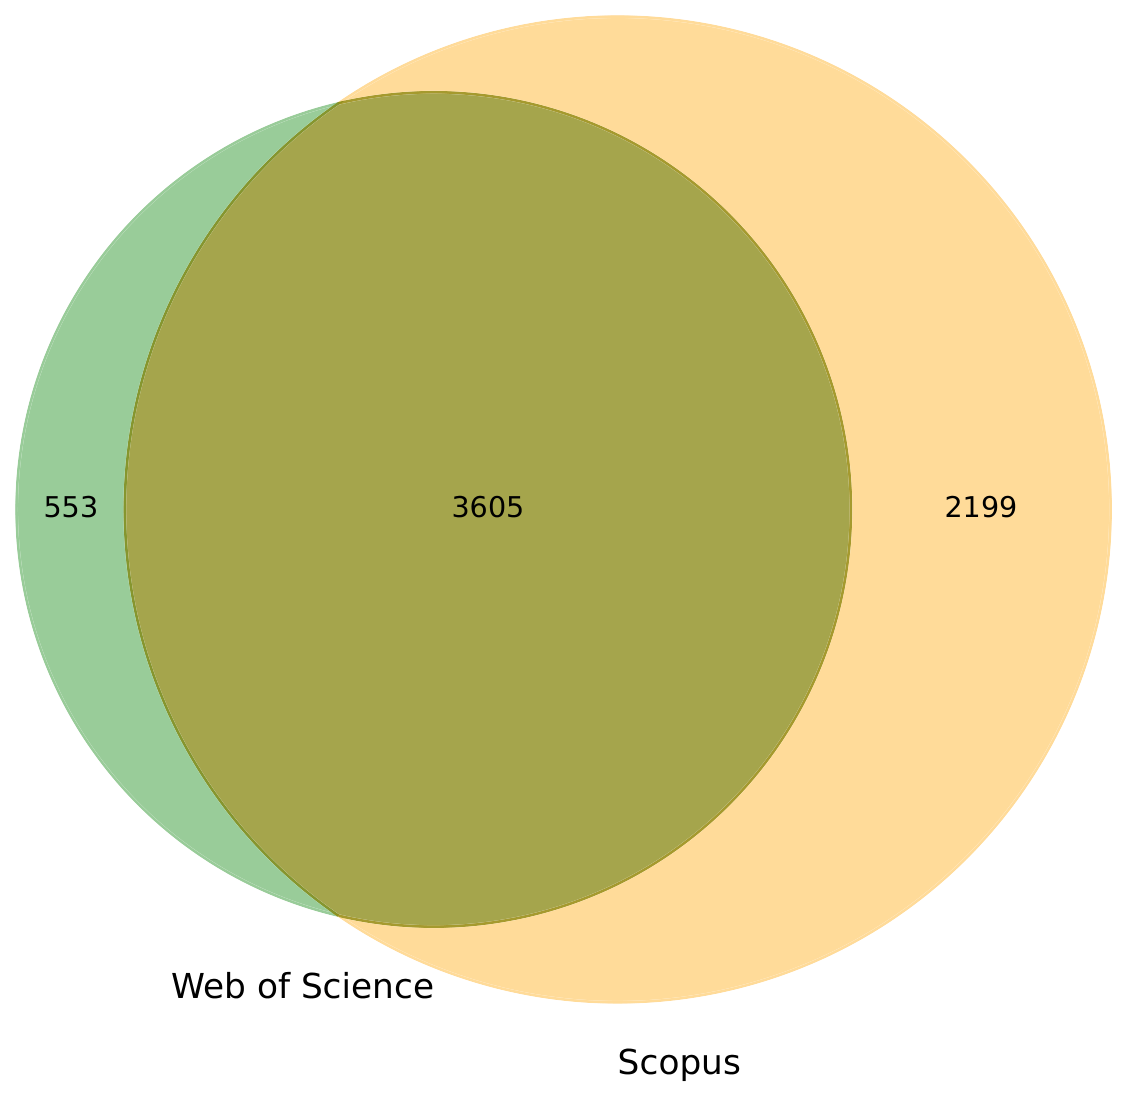
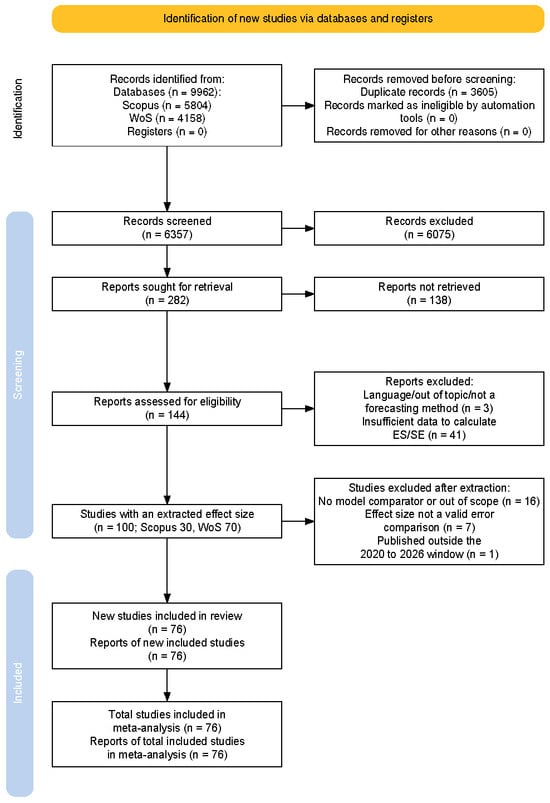
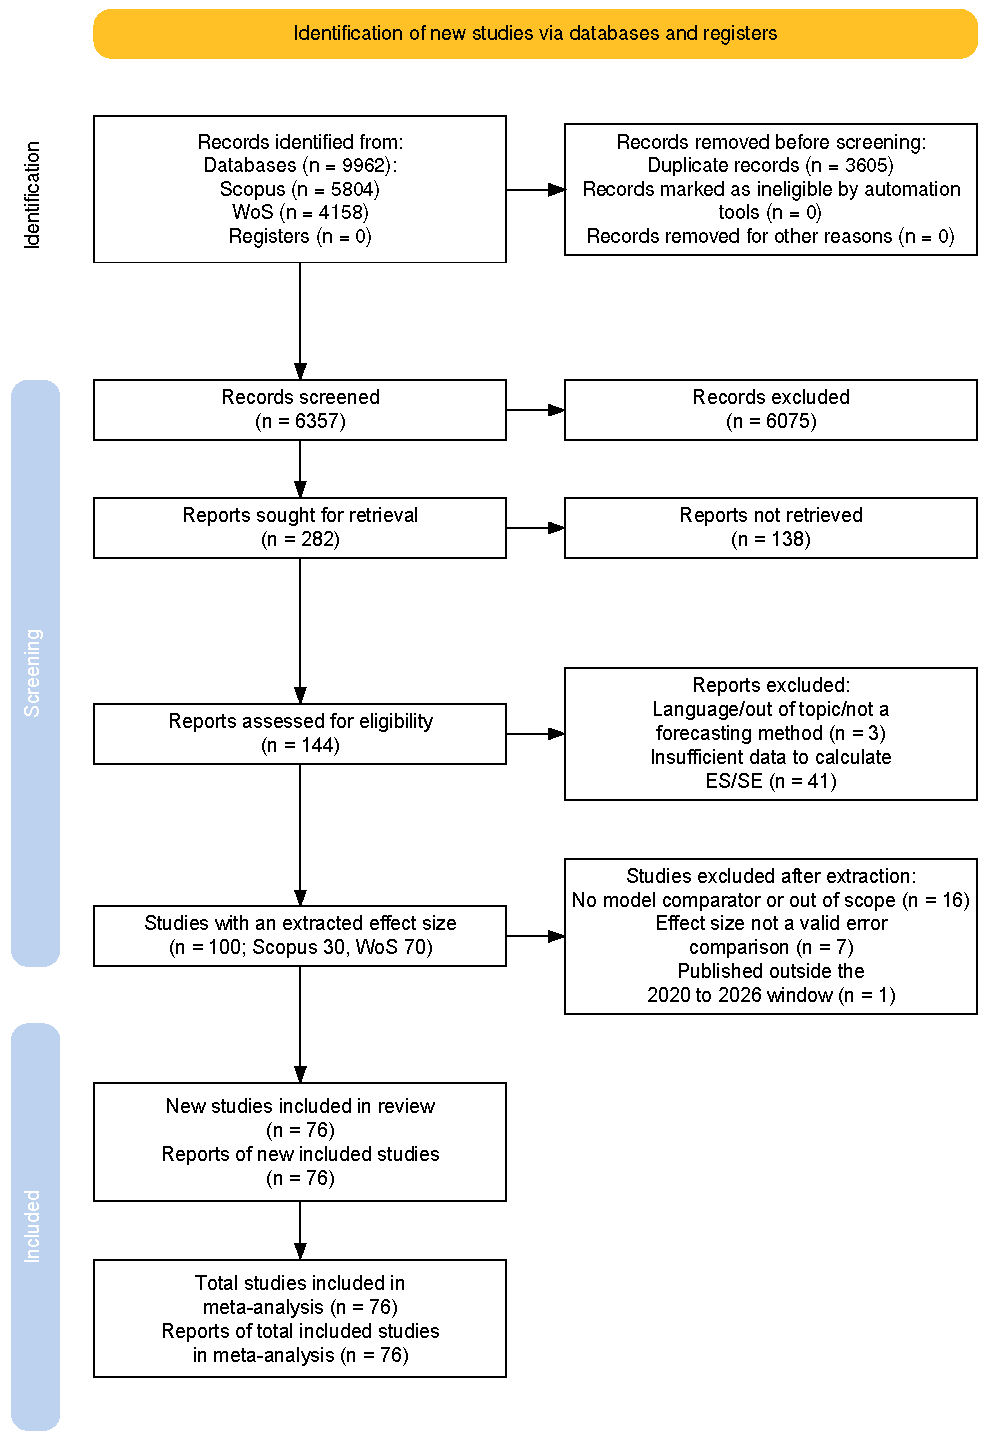
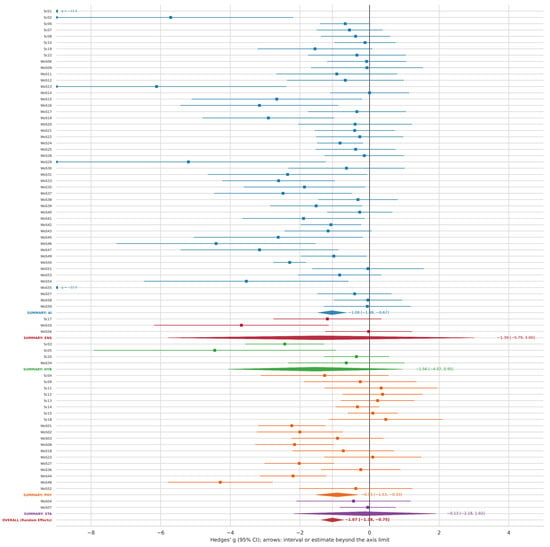
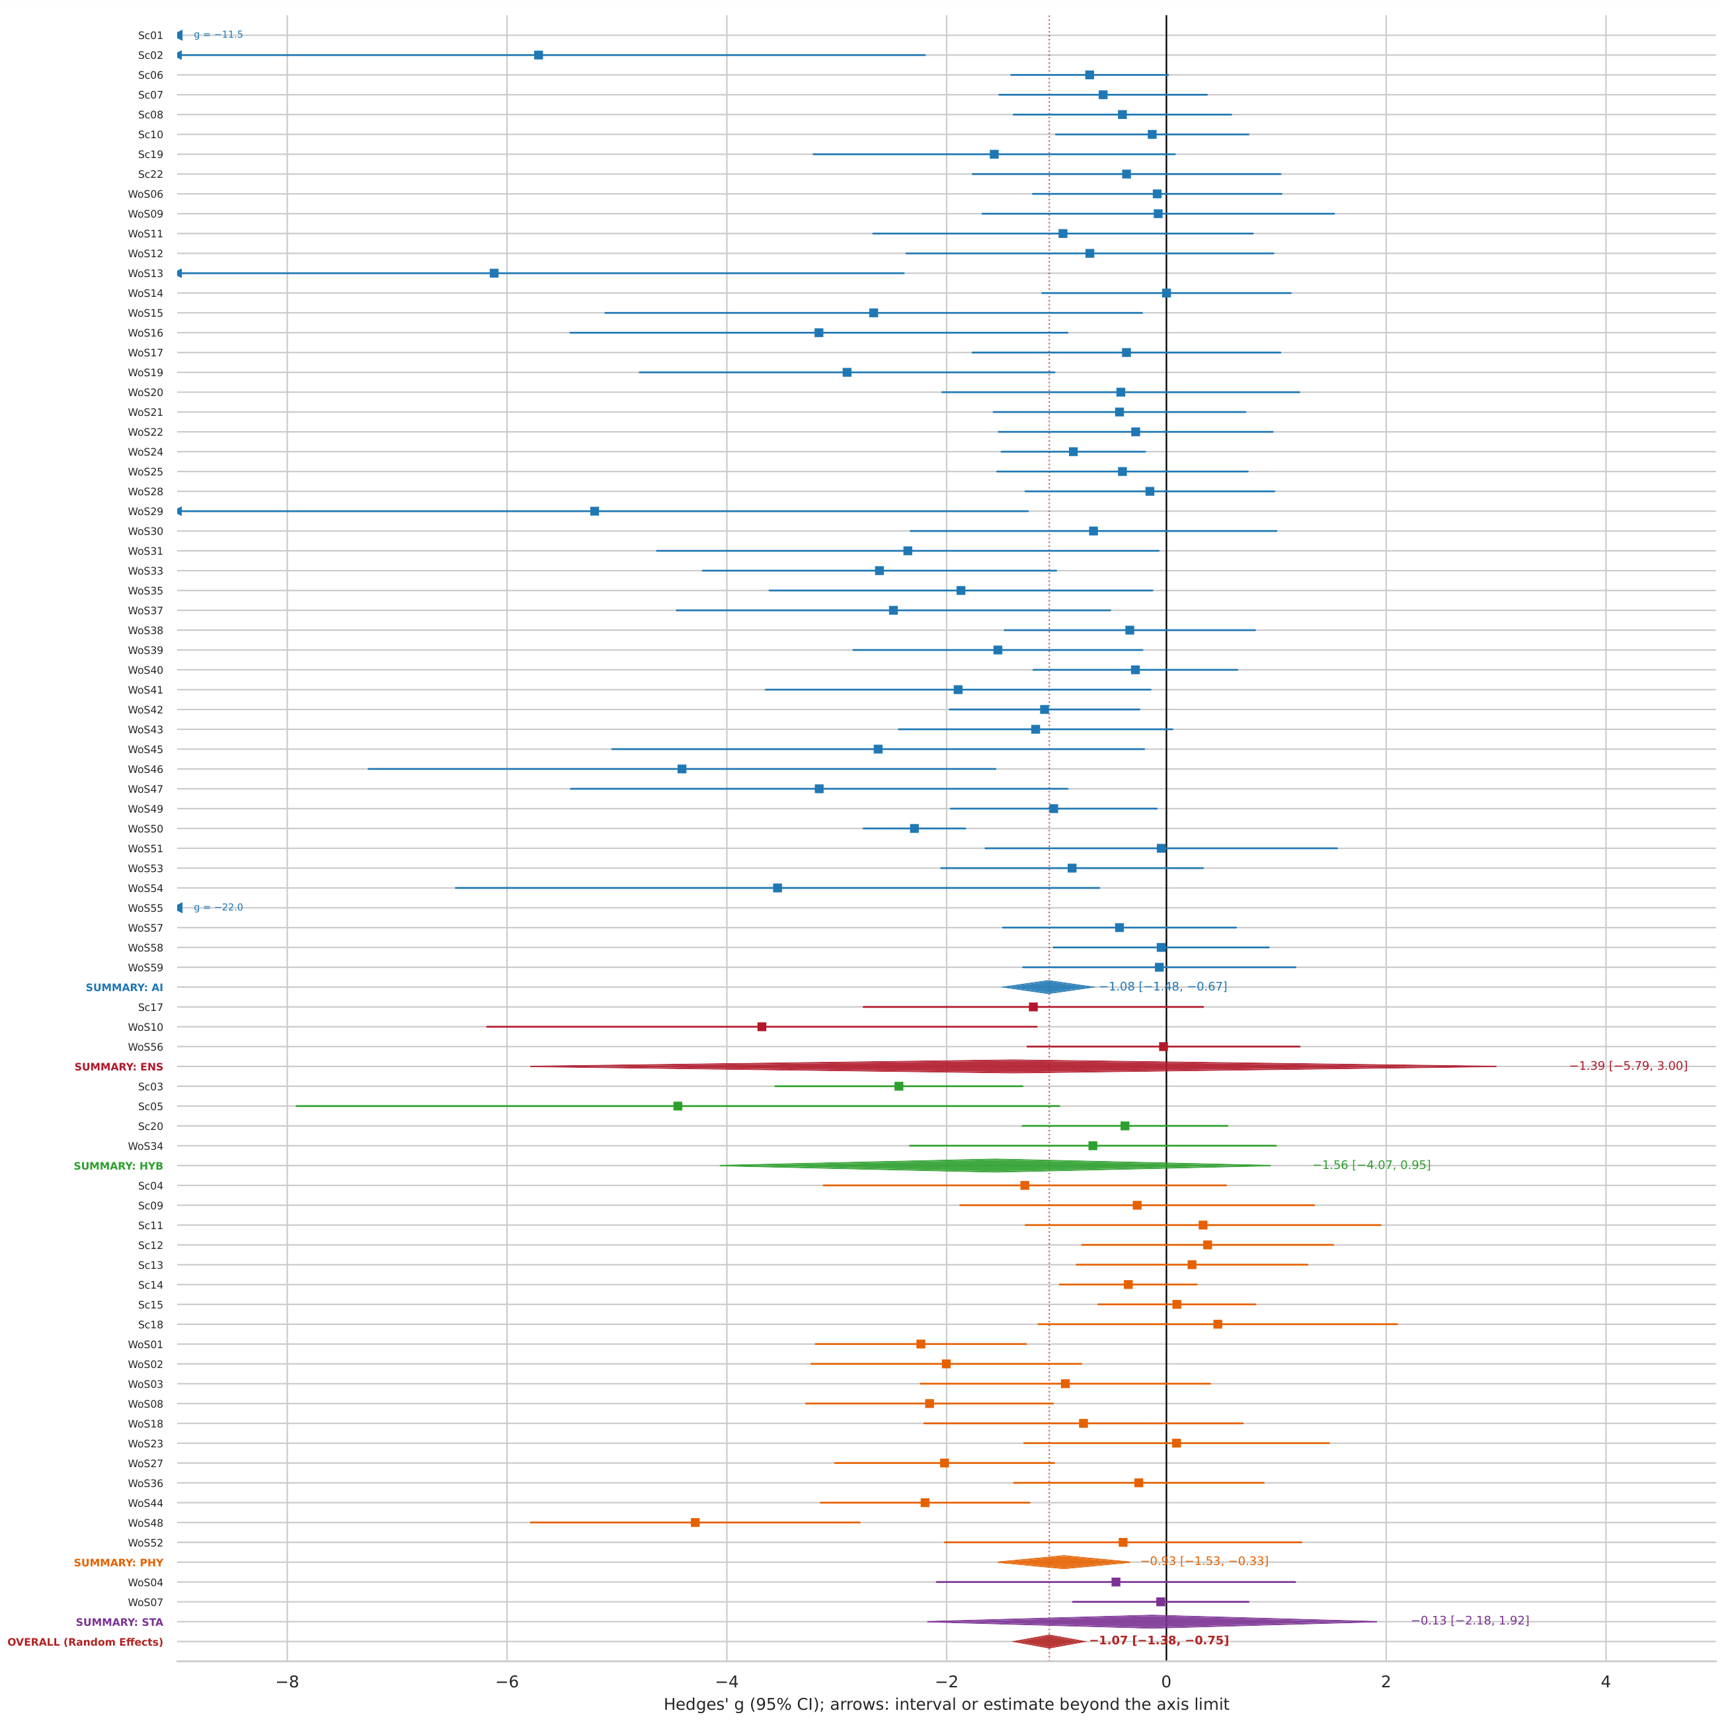
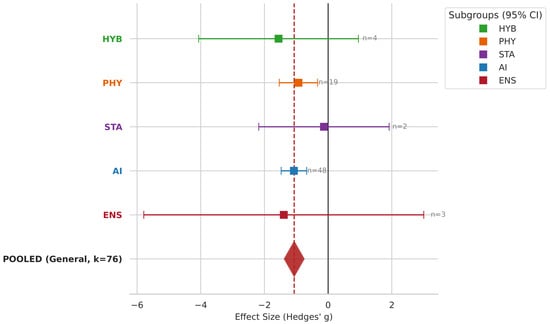
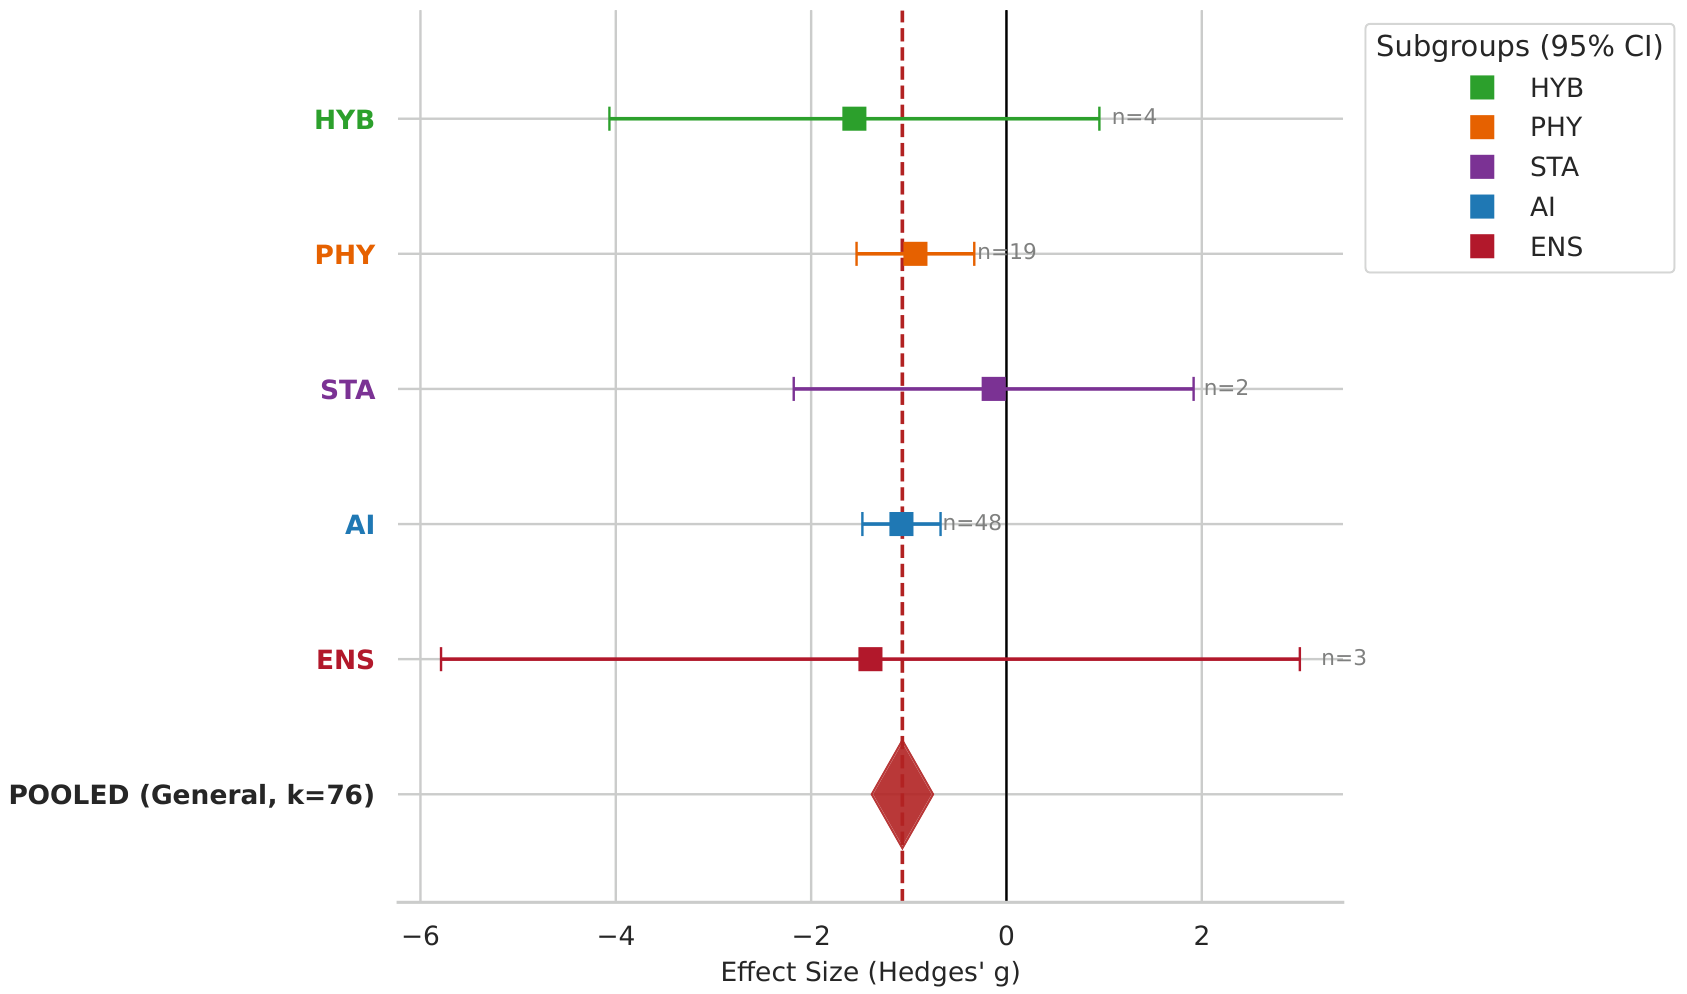
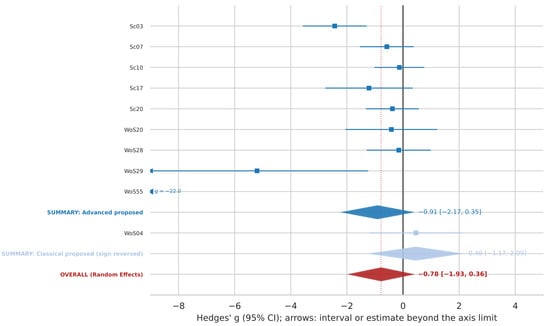
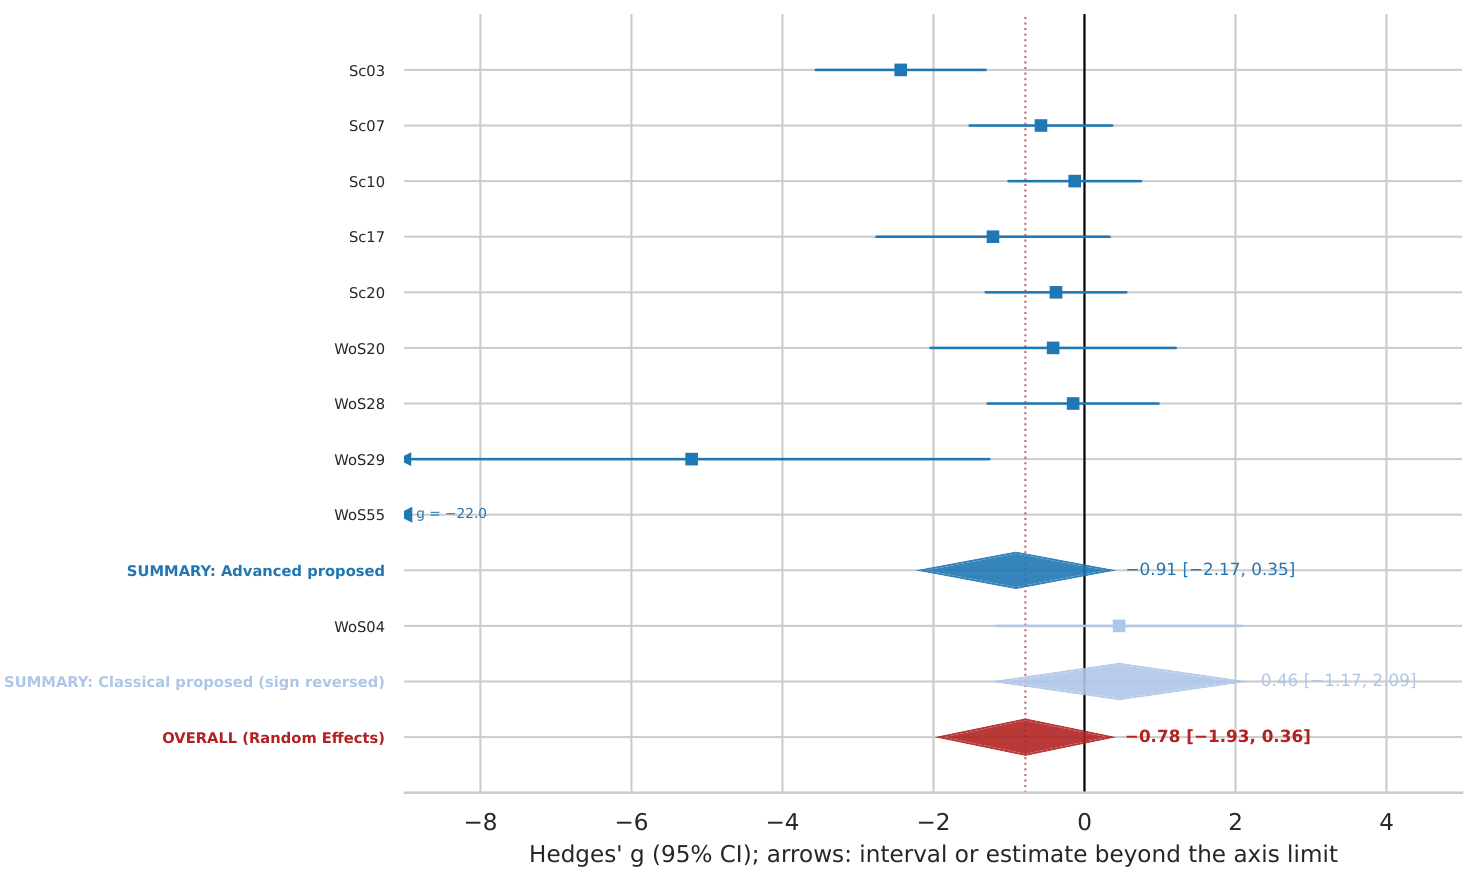
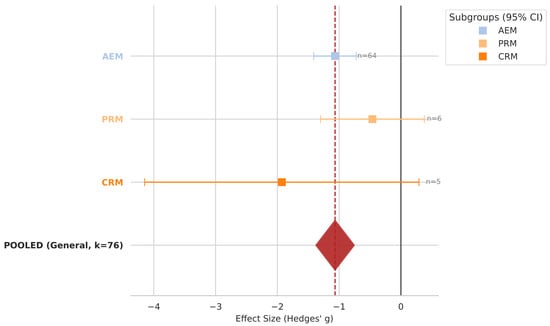
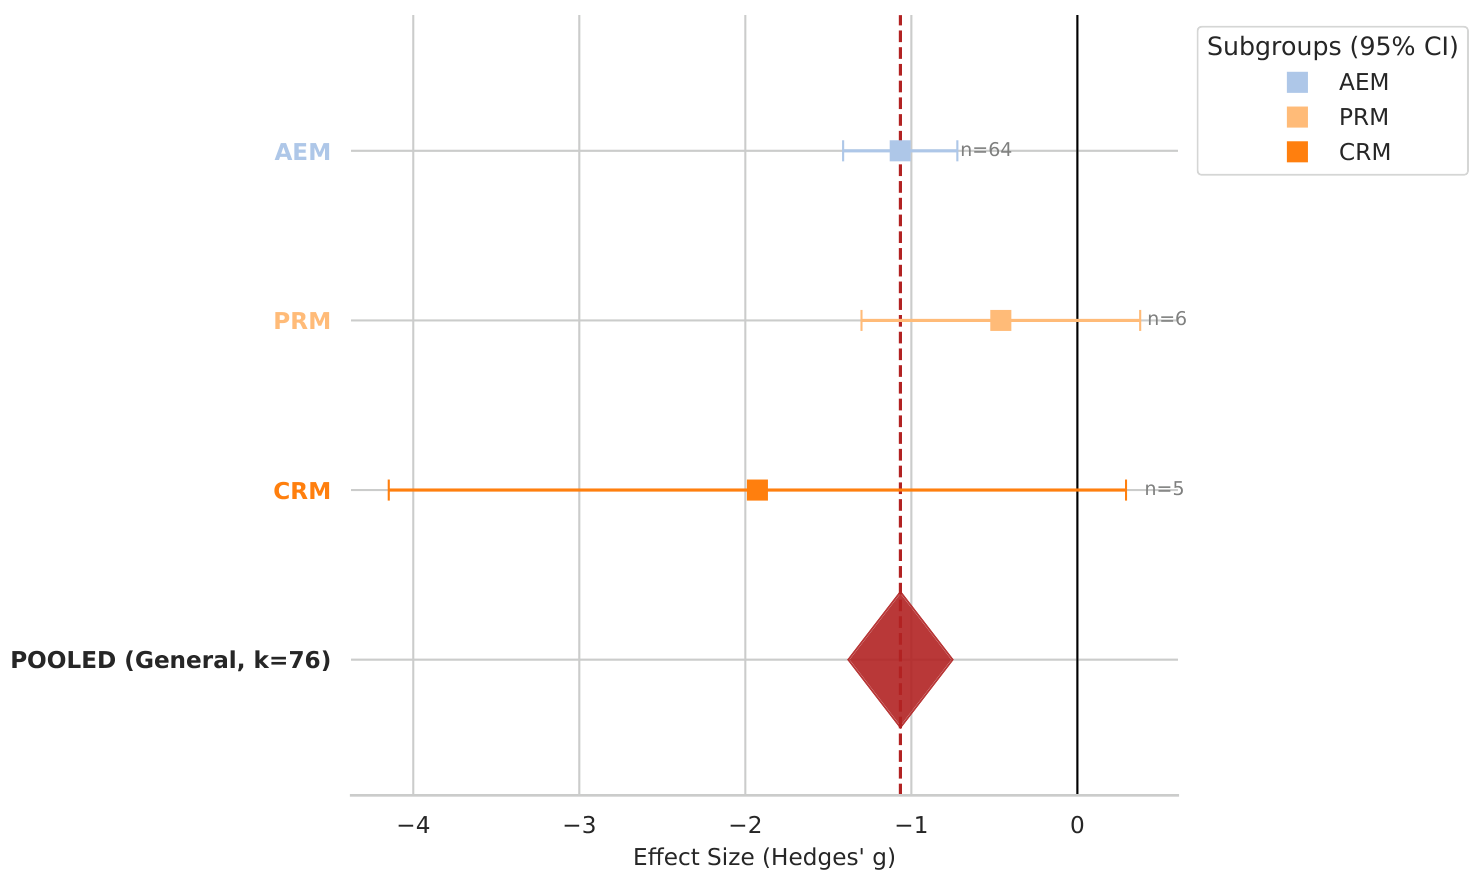
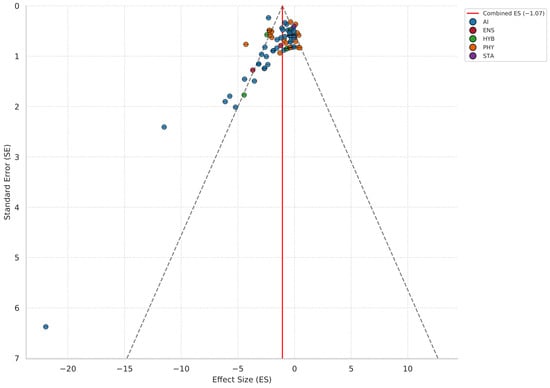
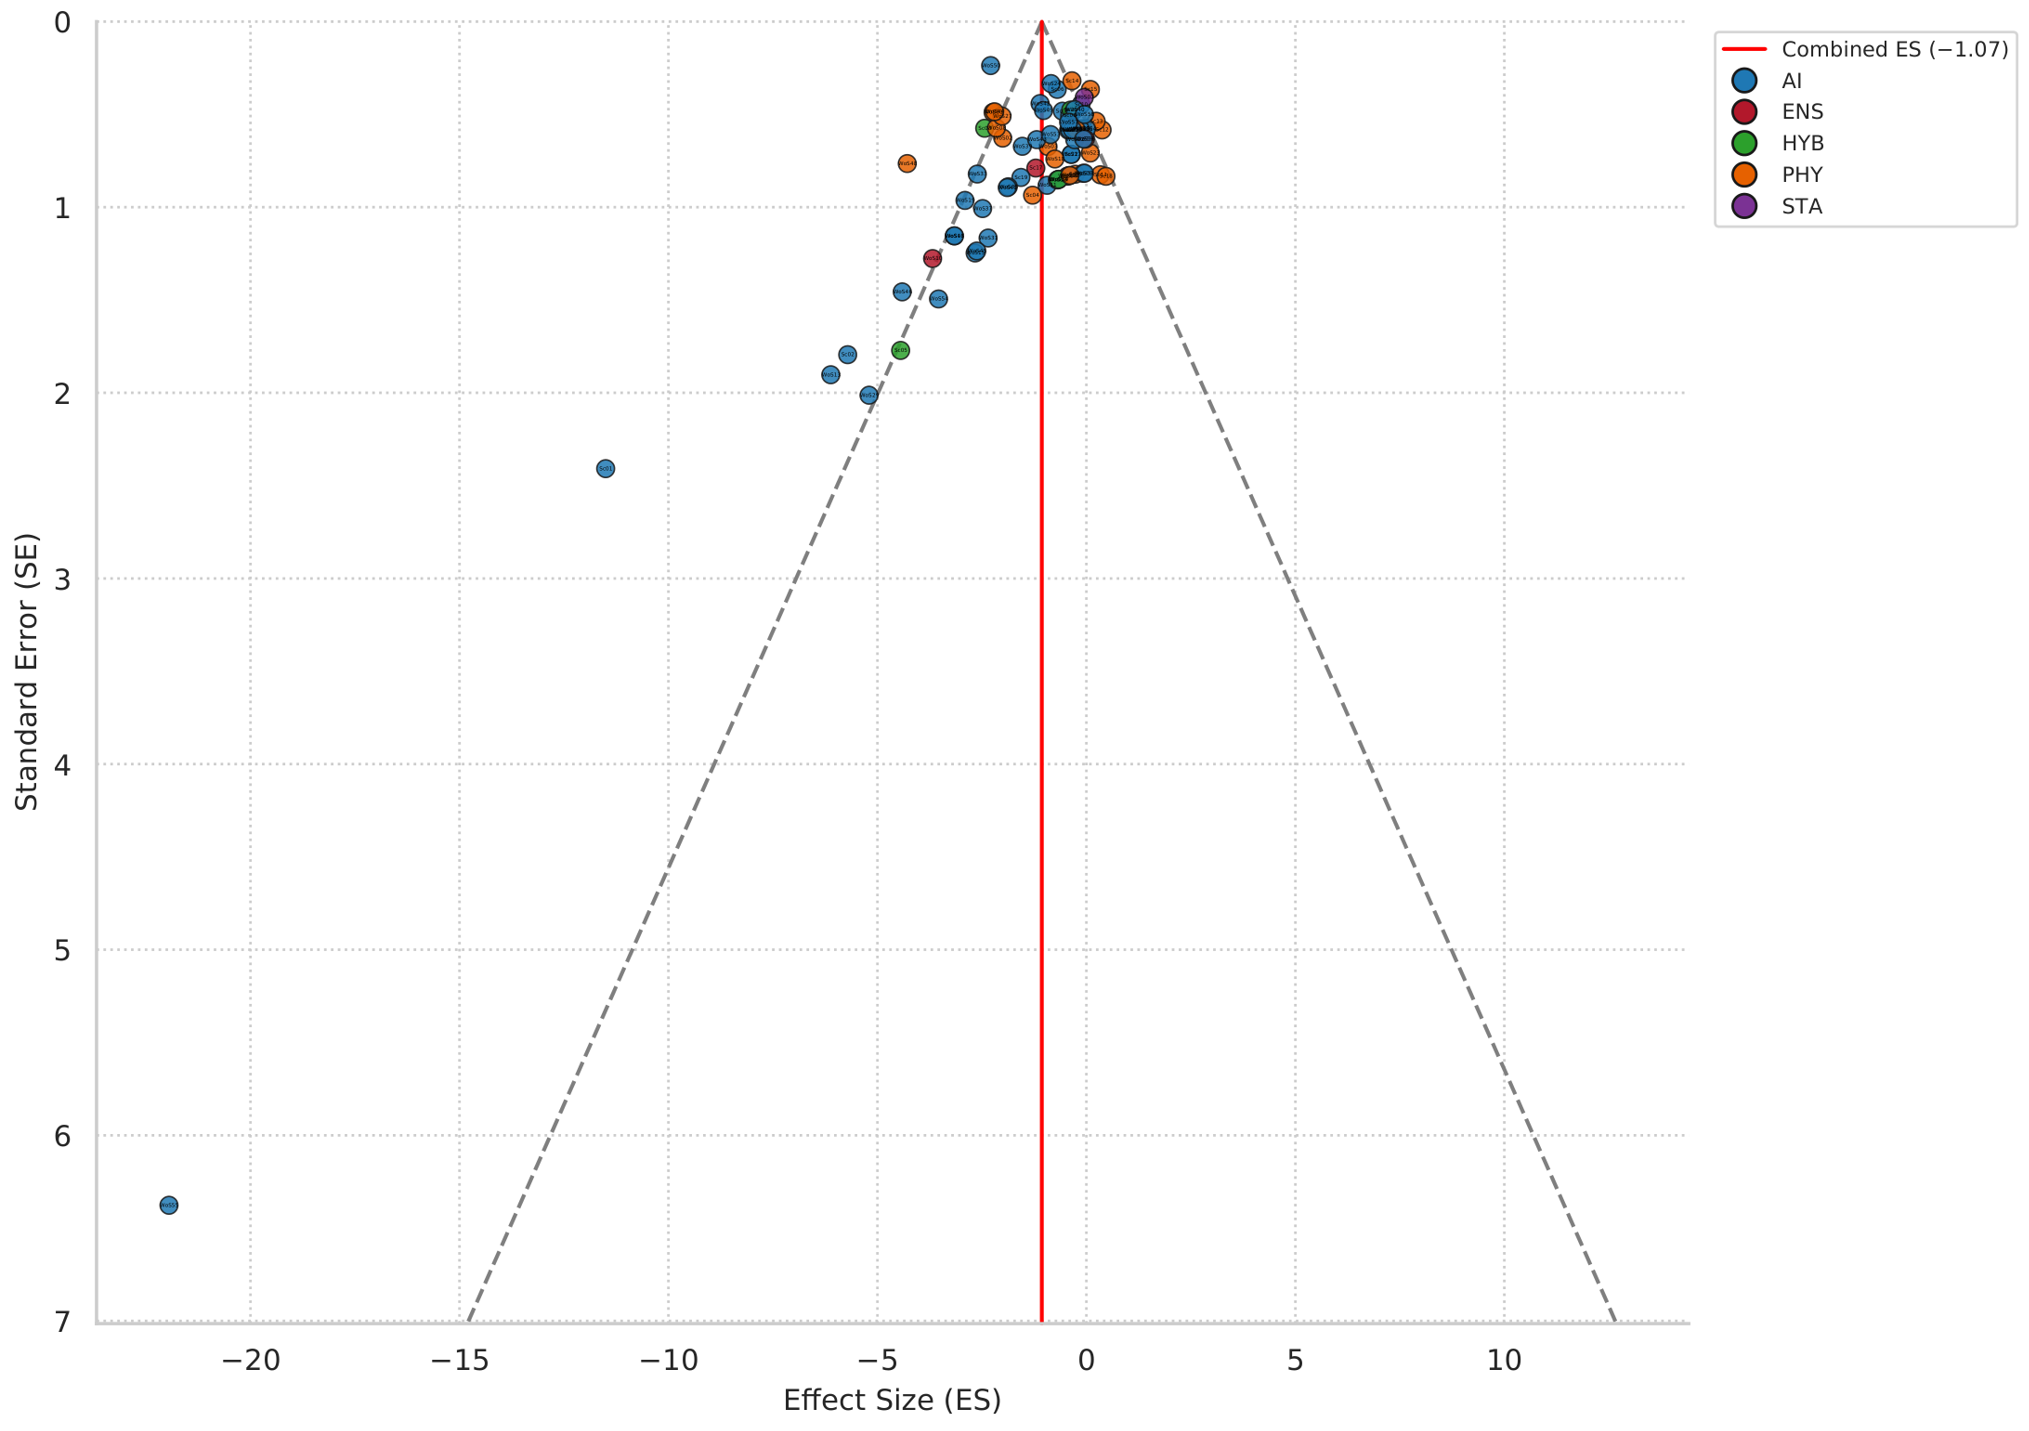
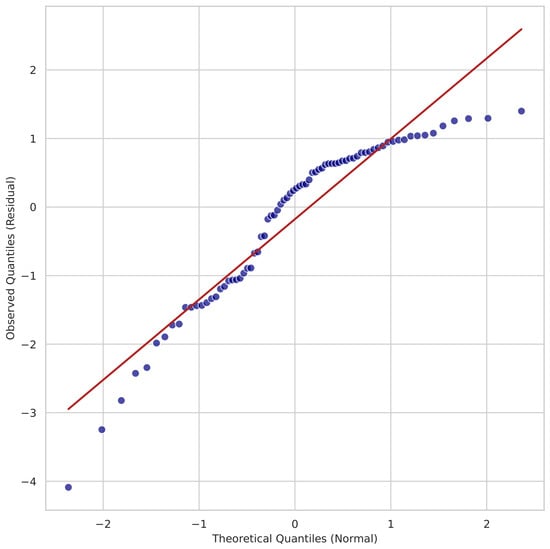
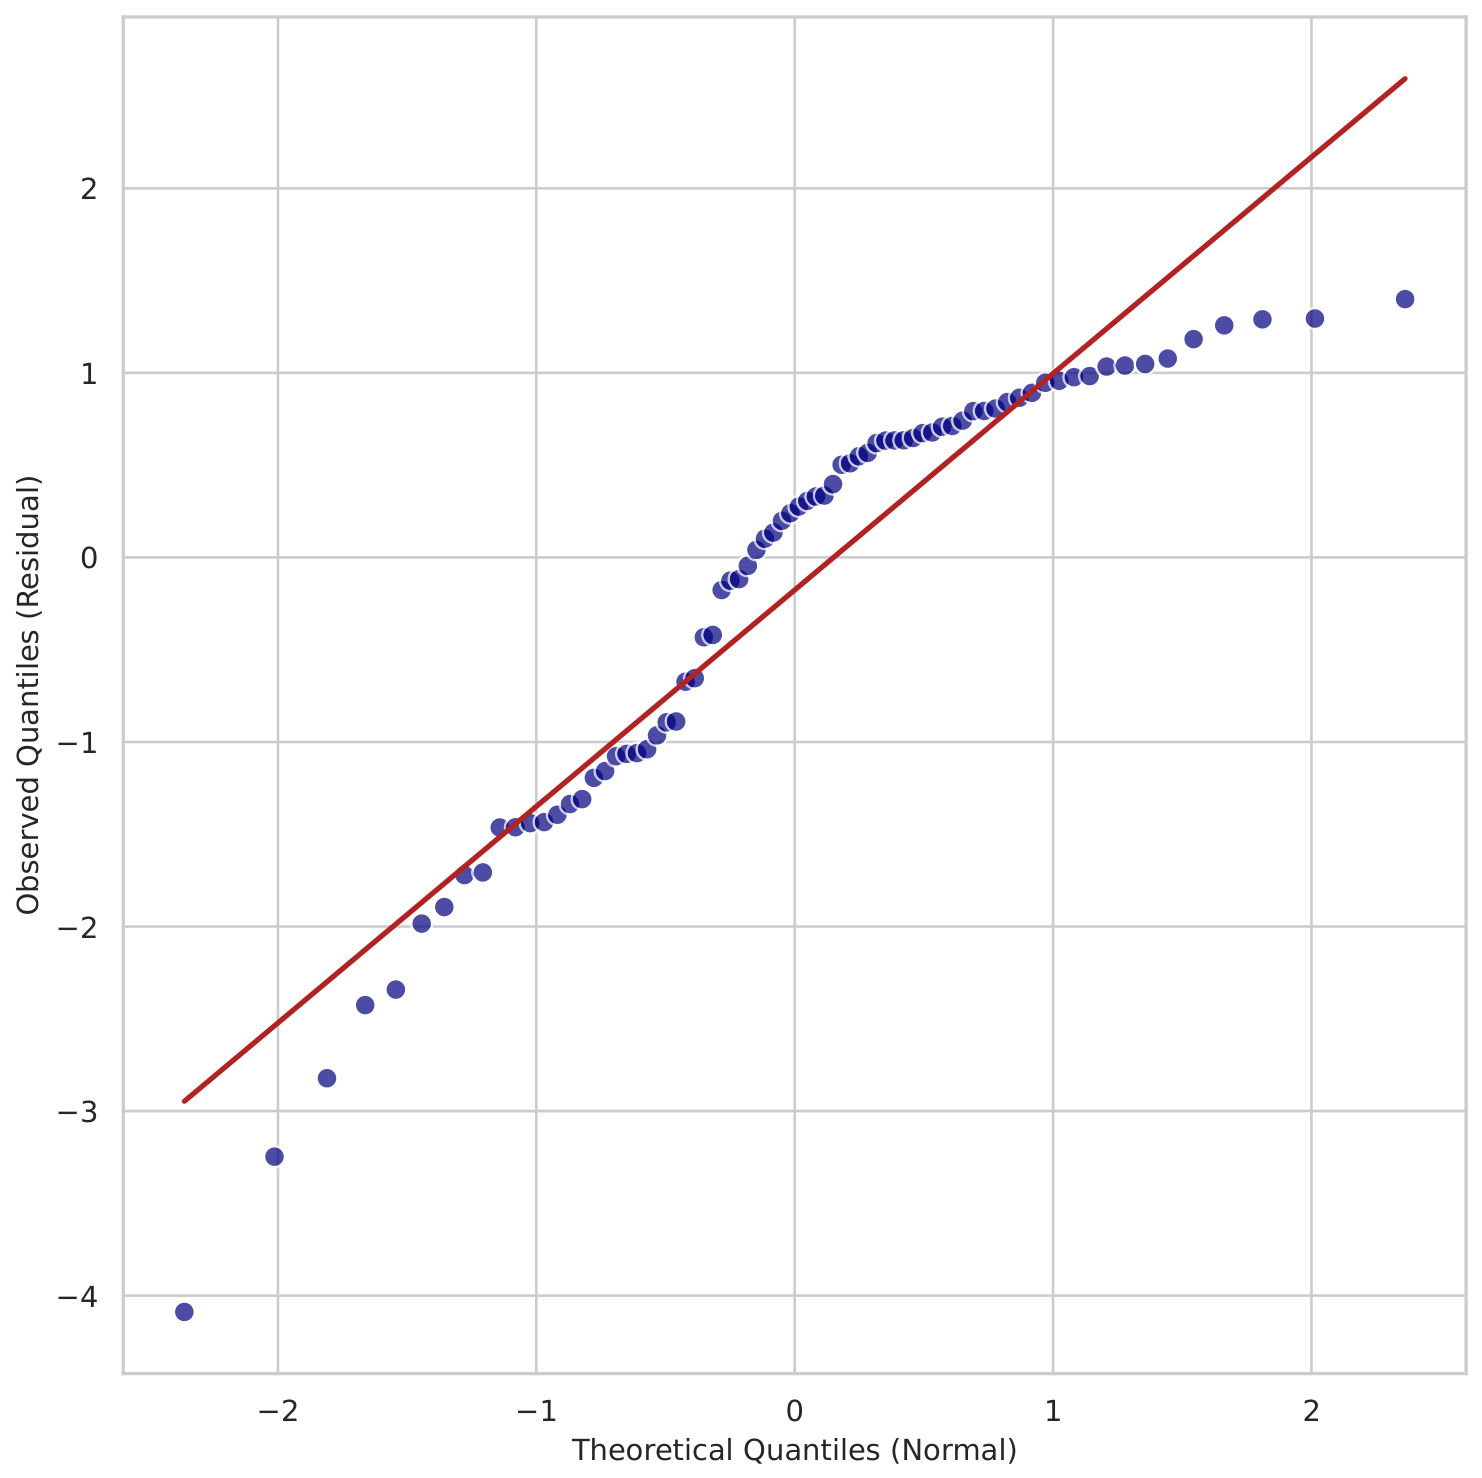

Disclaimer/Publisher’s Note: The statements, opinions and data contained in all publications are solely those of the individual author(s) and contributor(s) and not of MDPI and/or the editor(s). MDPI and/or the editor(s) disclaim responsibility for any injury to people or property resulting from any ideas, methods, instructions or products referred to in the content. |
© 2026 by the authors. Licensee MDPI, Basel, Switzerland. This article is an open access article distributed under the terms and conditions of the Creative Commons Attribution (CC BY) license.