


Highlights
What are the main findings?
- The external sector affects the stock market through remittance inflows, the oil, gold, and currency markets; however, the relationships are unstable.
- Remittance inflows, oil, and gold markets have positive effects, whereas the currency market relationship is negative.
What are the implications of the main findings?
- Policy actions include prudent management of the exchange rate and facilitation of remittance inflows.
- Oil price increases are indications of stock market momentum; the gold market lacks beneficial diversification opportunities.
Abstract
The study documents the impact of the external sector on movements of the Pakistan Stock Exchange (PSX), covering conventional and Islamic indices. Selected variables include international trade, foreign investment, remittances, oil, gold, and currency markets, as well as the KSE-100 and KMI-30 indices. The sample period covers the latest 130 months, from 2015/01 to 2025/10. Results are documented through descriptive statistics, pairwise correlations, and OLS regression. Stability of coefficients during the review period is checked by calculating BTC-Var and switching Var. Outstanding momentum is evident in market indices (in the final phase), accompanied by growth in remittances, while the national currency has experienced an alarming depreciation. The combined impact of the external sector is not in the higher range for either index (adjusted R-square values are low). A group of four variables (remittances, oil, gold, and currency markets) was significant for the conventional index, while a group of three variables (oil, gold, and currency markets) was significant for the Islamic index. All significant variables contribute positively to stock index movements, except the exchange rate. BTC-Var and switching var suggest instability of relationships and regime-dependent var dynamics. The findings are beneficial for managers and investors in predicting index movements and portfolio diversification, as well as for relevant authorities in making policy decisions that promote prudent exchange-rate management and facilitate remittances. To the best of the author’s knowledge, this study is among the few that jointly examine the impact of external-sector variables on stock market movements.
JEL Classification:
G10; G11; G12
1. Introduction
Globalisation contributed significantly to the mobility of resources across borders. The ever-increasing innovations in Information Technology (IT) enable the mobility of resources across multiple markets. Virtual software packages offer investment opportunities across various global markets with a single click. Computer applications have also facilitated cross-border fund transfers. IT inventions have revolutionised the financial sector worldwide. Investments are taking place in foreign markets. Goods and services are exported. Workers take up positions in foreign markets and remit their earnings to home countries. The prices of commodities, including oil and gold, are determined by global demand and supply. The world has truly become an international community (a global village). Almost nothing in an economy is exclusively indigenous. Depending on an economy’s openness, developmental stage, and capacity, foreign influence plays a crucial role in shaping it.
International trade is a significant source of international linkages. Comparative advantages motivate nations to specialise and trade with others. For less developed countries, both imports from and exports to technologically advanced countries offer incentives, including access to advanced industrial goods and relatively better prices for domestic goods in international markets. Foreign investment, including Foreign Direct Investment (FDI) and Foreign Portfolio Investment (FPI), brings capital into cash-scarce countries, thereby generating increased economic activity. Workers’ remittances are hard-cash foreign exchange for recipient economies to cover trade deficits and to service external debt. The movements of oil and currency markets significantly impact a country’s economic management, while gold serves as a safe haven for storing value.
The external sector of an economy influences economic management and contributes significantly to economic growth and development. The stock market is often regarded as a barometer of an economy. Detection of linkages between the external sector and the stock market enhances stakeholders’ understanding of the external sector’s role in the economy’s financial management. Pakistan’s economy encompasses multiple aspects of the external sector, including multibillion-dollar international trade, millions of workers abroad (remitting billions of dollars), billions of dollars in foreign investment, the acquisition of mineral fuels and gold from the global market, and the provision of required foreign exchange. Given the multiple channels of external linkages, a study of the influence of the external sector on equity pricing in the domestic market would be a valuable contribution to the literature for stakeholders, including academia, industry, and policy institutions. The need for such a research project further increases, given the outstanding performance of the Pakistan Stock Exchange (PSX) in the recent (post-COVID-19) period. From January 2023 to October 2025 [34 months], the market index increased by 310% (Investing.com, 2025).
The literature presents interesting studies on the documentation of the linkage between external sector variables and the generation of stock returns at PSX (see inter alia [1,2,3,4,5,6]). Findings indicate the relevance of remittances, foreign investments, oil prices, gold prices, and exchange rates. Much of the published literature has focused on documenting the relationship between the stock index and two global markets (including currencies and oil). While the author appreciates the efforts of esteemed researchers, three observations are relevant to the published studies:
- First, to the best of the author’s knowledge, there is little literature covering all variables of the external sector jointly.
- Second, in most of the reviewed studies, the sample periods lack coverage of recent data.
- Third, most of the studies have primarily covered the conventional stock market, with a thin focus on the Islamic stock index at PSX.
The ever-increasing volume of assets under management and the expansion of Islamic finance in the domestic market and elsewhere [7] demand that researchers identify the key factors contributing to variations in Islamic indices at the PSX and elsewhere.
This study aims to document the relevance of external-sector variables for stock market movements at the PSX, including conventional and Islamic stock indices. Specifically, the contribution of the study includes the following:
- Documentation of the impact of hard cash inflows on the stock market through foreign investment, remittances, and exports.
- Measuring and recording of transmission of volatility to stock markets from global markets, including oil, gold, and currency markets.
- Identification and reporting of the impact on PSX’s performance of imports (including industrially advanced goods and mineral fuels) resulting in forex outflow.
- Comparative documentation of significant variables contributing to equity markets’ risk for conventional and Islamic indices at PSX.
- Documentation of time-varying impact on coefficients through BTC-VAR and switching VAR.
The study analyses data for the latest 130 months (January 2015–October 2025). The sample period includes several significant events, such as the spread of COVID-19, a near two-thirds decline in the national currency’s value, higher interest rates, rising inflation in the domestic market, growth in remittances and the gold market, and the outstanding performance of the PSX indices (from January 2023 onward). Results are documented using descriptive statistics, correlation analysis, OLS regression, and TVC VAR, all conducted with EViews 14. The study’s results indicate significant variables in the generation of stock returns at the PSX, covering both conventional and Islamic indices. The findings are expected to benefit academia and the public by enhancing understanding of the role of the external sector in market movements, helping investors and portfolio managers diversify their portfolios, and supporting relevant authorities in policymaking.
2. Literature Review
The documentation of stock market predictors has historically been an important area of financial research worldwide. Numerous studies on the topic have been published over the period. The literature documents macroeconomic variables that drive stock market volatility. Macroeconomic variables are objectively classified as internal or external to an economy. Studies worldwide have identified multiple significant internal variables across the real and financial sectors. Similarly, existing published studies demonstrate the influence of the external sector on stock market movements. The external sector of an economy consists of multiple variables, including foreign investments (direct and portfolio), international trade (imports/exports), remittances, external loans/grants, oil, gold, and currency markets. Associations between external sector variables and stock markets across multiple economies have emerged from numerous studies. The following paragraphs present a selected review of the literature, primarily focusing on the domestic economy.
The inflow of capital through Foreign Direct Investment (FDI) and Foreign Portfolio Investment (FPI) aims to enhance economic activity in the domestic market. A positive impact on stock market returns is expected. The literature documents the relationship in the domestic market. Ref. [8] document the positive impact of foreign investment on stock market developments by analysing data from 1985 to 2011 using cointegration techniques. Ref. [3] confirm the findings using annual data (1985–2017). Ref. [9] conducted an interesting study on the determinants of foreign portfolio investment for the period 2010–2022 using multiple regression analysis. As a result, six variables are significant. Two variables exhibit negative beta coefficients (inflation and exchange rate), whereas four variables exhibit positive beta coefficients (market capitalisation, market liquidity, political stability, and regulatory quality).
The expansion of international trade is a significant achievement in human history. It leads to the availability of advanced industrial goods in technologically underdeveloped countries, as well as to higher prices for goods produced in less-developed and agrarian economies in international markets. International trade consists of the export and import of goods and services. Exports of goods generate cash inflows, thereby increasing economic activity and stock market movements. The literature has identified an association between exports and the domestic stock market. Ref. [10] document the association between exports and conventional and Islamic indices (2011–2016) using the Granger causality test. Ref. [6] confirms the findings in the domestic market.
Remittances from workers are a significant source of foreign exchange, boosting economic activity in the receiving economy. The literature documents the variable’s impact on the economy. Ref. [11] documented that workers’ remittances significantly contributed to economic growth between 1991 and 2012. Granger causality suggests that workers’ remittances and stock indices (conventional and Islamic) are associated during 2011–2016 [10]. Ref. [3] document the positive impact of remittances on the stock market from 1985–2017, and [12] document the positive contribution of remittances to GDP growth and poverty reduction (1981–2020) in the Pakistani economy. Ref. [6] reports an association between remittances and stock indices (both conventional and Islamic) at the PSX, using Granger causality from January 2010 to August 2023.
Mineral fuels have a significant place in the management of the modern economy. Currently, managing a fuel-free economy is unfeasible, despite the development of alternative energy sources such as solar and wind. Researchers worldwide have documented the association between the oil market and stock prices. Ref. [13] document the transmission of volatility from oil to stocks in the Iranian market using quarterly data (1991–2017) and the ARDL model. The oil market is a significant predictor of PSX stock returns, with positive beta coefficients during 2009–2020 [1]. Similar findings are reported by [3], who used ARDL on annual data from 1985 to 2017. Ref. [9] highlight differences in impact across different states of the stock market. Findings indicate an adverse effect of the oil market on stock performance during the period of deficient performance, as indicated by the quantile ARDL model using quarterly data from 2000 to 2019. Ref. [5] document the significance of the oil market for stock returns during the COVID-19 period (January 2020–April 2021) using a VAR technique.
Since ancient times, gold has played a significant role in serving as a medium of exchange and a store of value. Gold has served as currency for centuries, and there are still voices advocating its use for its stability. Gold is another avenue for investors. Historically, investors have sought refuge in gold during periods of crisis. The literature has documented relationships between gold and stock markets. Gold was a significant predictor of the PSX market index, with a negative coefficient [1], during 2009–2020. In another study, ref. [2] report findings from MGARCH and quantile regression indicating that gold price volatility negatively affects stock market performance at the PSX during 2001–2018.
The foreign exchange market is the largest financial market in the world. The average daily trading volume is USD 9.6 trillion [14]. Exchange rate movements have significant consequences for modern economies, particularly for import-dependent economies. Adverse movements lead to inflation in import-dependent economies, whereas positive movements affect export performance. Therefore, prudent management of exchange rates is essential for navigating the global economic system smoothly. The relationship between currency and stock markets is well documented in the literature e.g., [5,15]. Ref. [16] documented volatility transmission between the forex and stock markets at the PSX using weekly data from June 1998 to May 2006. Ref. [1] documents the currency market’s significance for the Islamic index, showing a negative beta coefficient. Multiple studies [2,3] have documented the negative impact of exchange rate volatility on the stock market. The association between the exchange rate and the stock market is documented by [6] for the period January 2010–August 2023 using Granger causality and by [5] for the period January 2016–April 2022 using a VAR on daily data. Finally, ref. [4] report interesting results from a quantile ARDL analysis of quarterly data (2000–2019). According to the findings, movements in the exchange rate have different effects across states of the stock market, with positive effects by the currency market during the upper and lower quantiles.
To summarise, empirics document the relationship of stocks and macroeconomic variables, including remittances [11,12] (economic growth) and [3,6,10]; international trade—exports [6,10]; and foreign investments [3,8]; oil prices [1,3,4,5]; gold prices [1,2]; and exchange rate [1,2,3,4,5]. The research focuses on documenting the impact of the external sector (exclusively) on stocks, including conventional and Islamic indices at PSX. The conduct of the study is justified for three reasons: the limited body of research examining the linkage between stocks and the external sector (joint impact of external-sector variables), relatively less focus on Islamic stocks, and the availability of results based on fresh data. Hence, a literature gap exists that this research project aims to address.
3. Methodology
a. Variables: Selected variables (Table 1) cover stock indices (conventional and Islamic) and the external sector of the economy, including international trade (exports and imports), foreign investment, expat remittances, and three global markets (currency, oil, and gold). Data are collected from two sources: the central bank [17] [macroeconomic variables], updated monthly, and Fusion Media Limited [18] [oil, gold, currency, and stocks], updated daily. The data period covers 130 months, from January 2015 to October 2025. The data are freely available from [17,18]. These variables have been used in the literature and empirically tested, as summarised in the literature review.
Table 1.
Selection of variables.
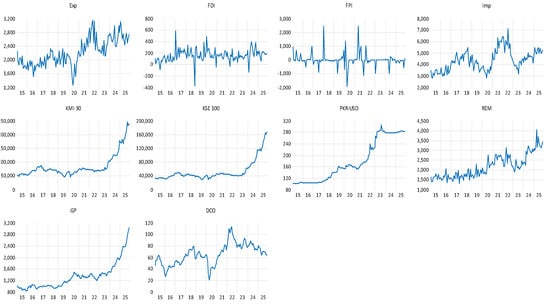
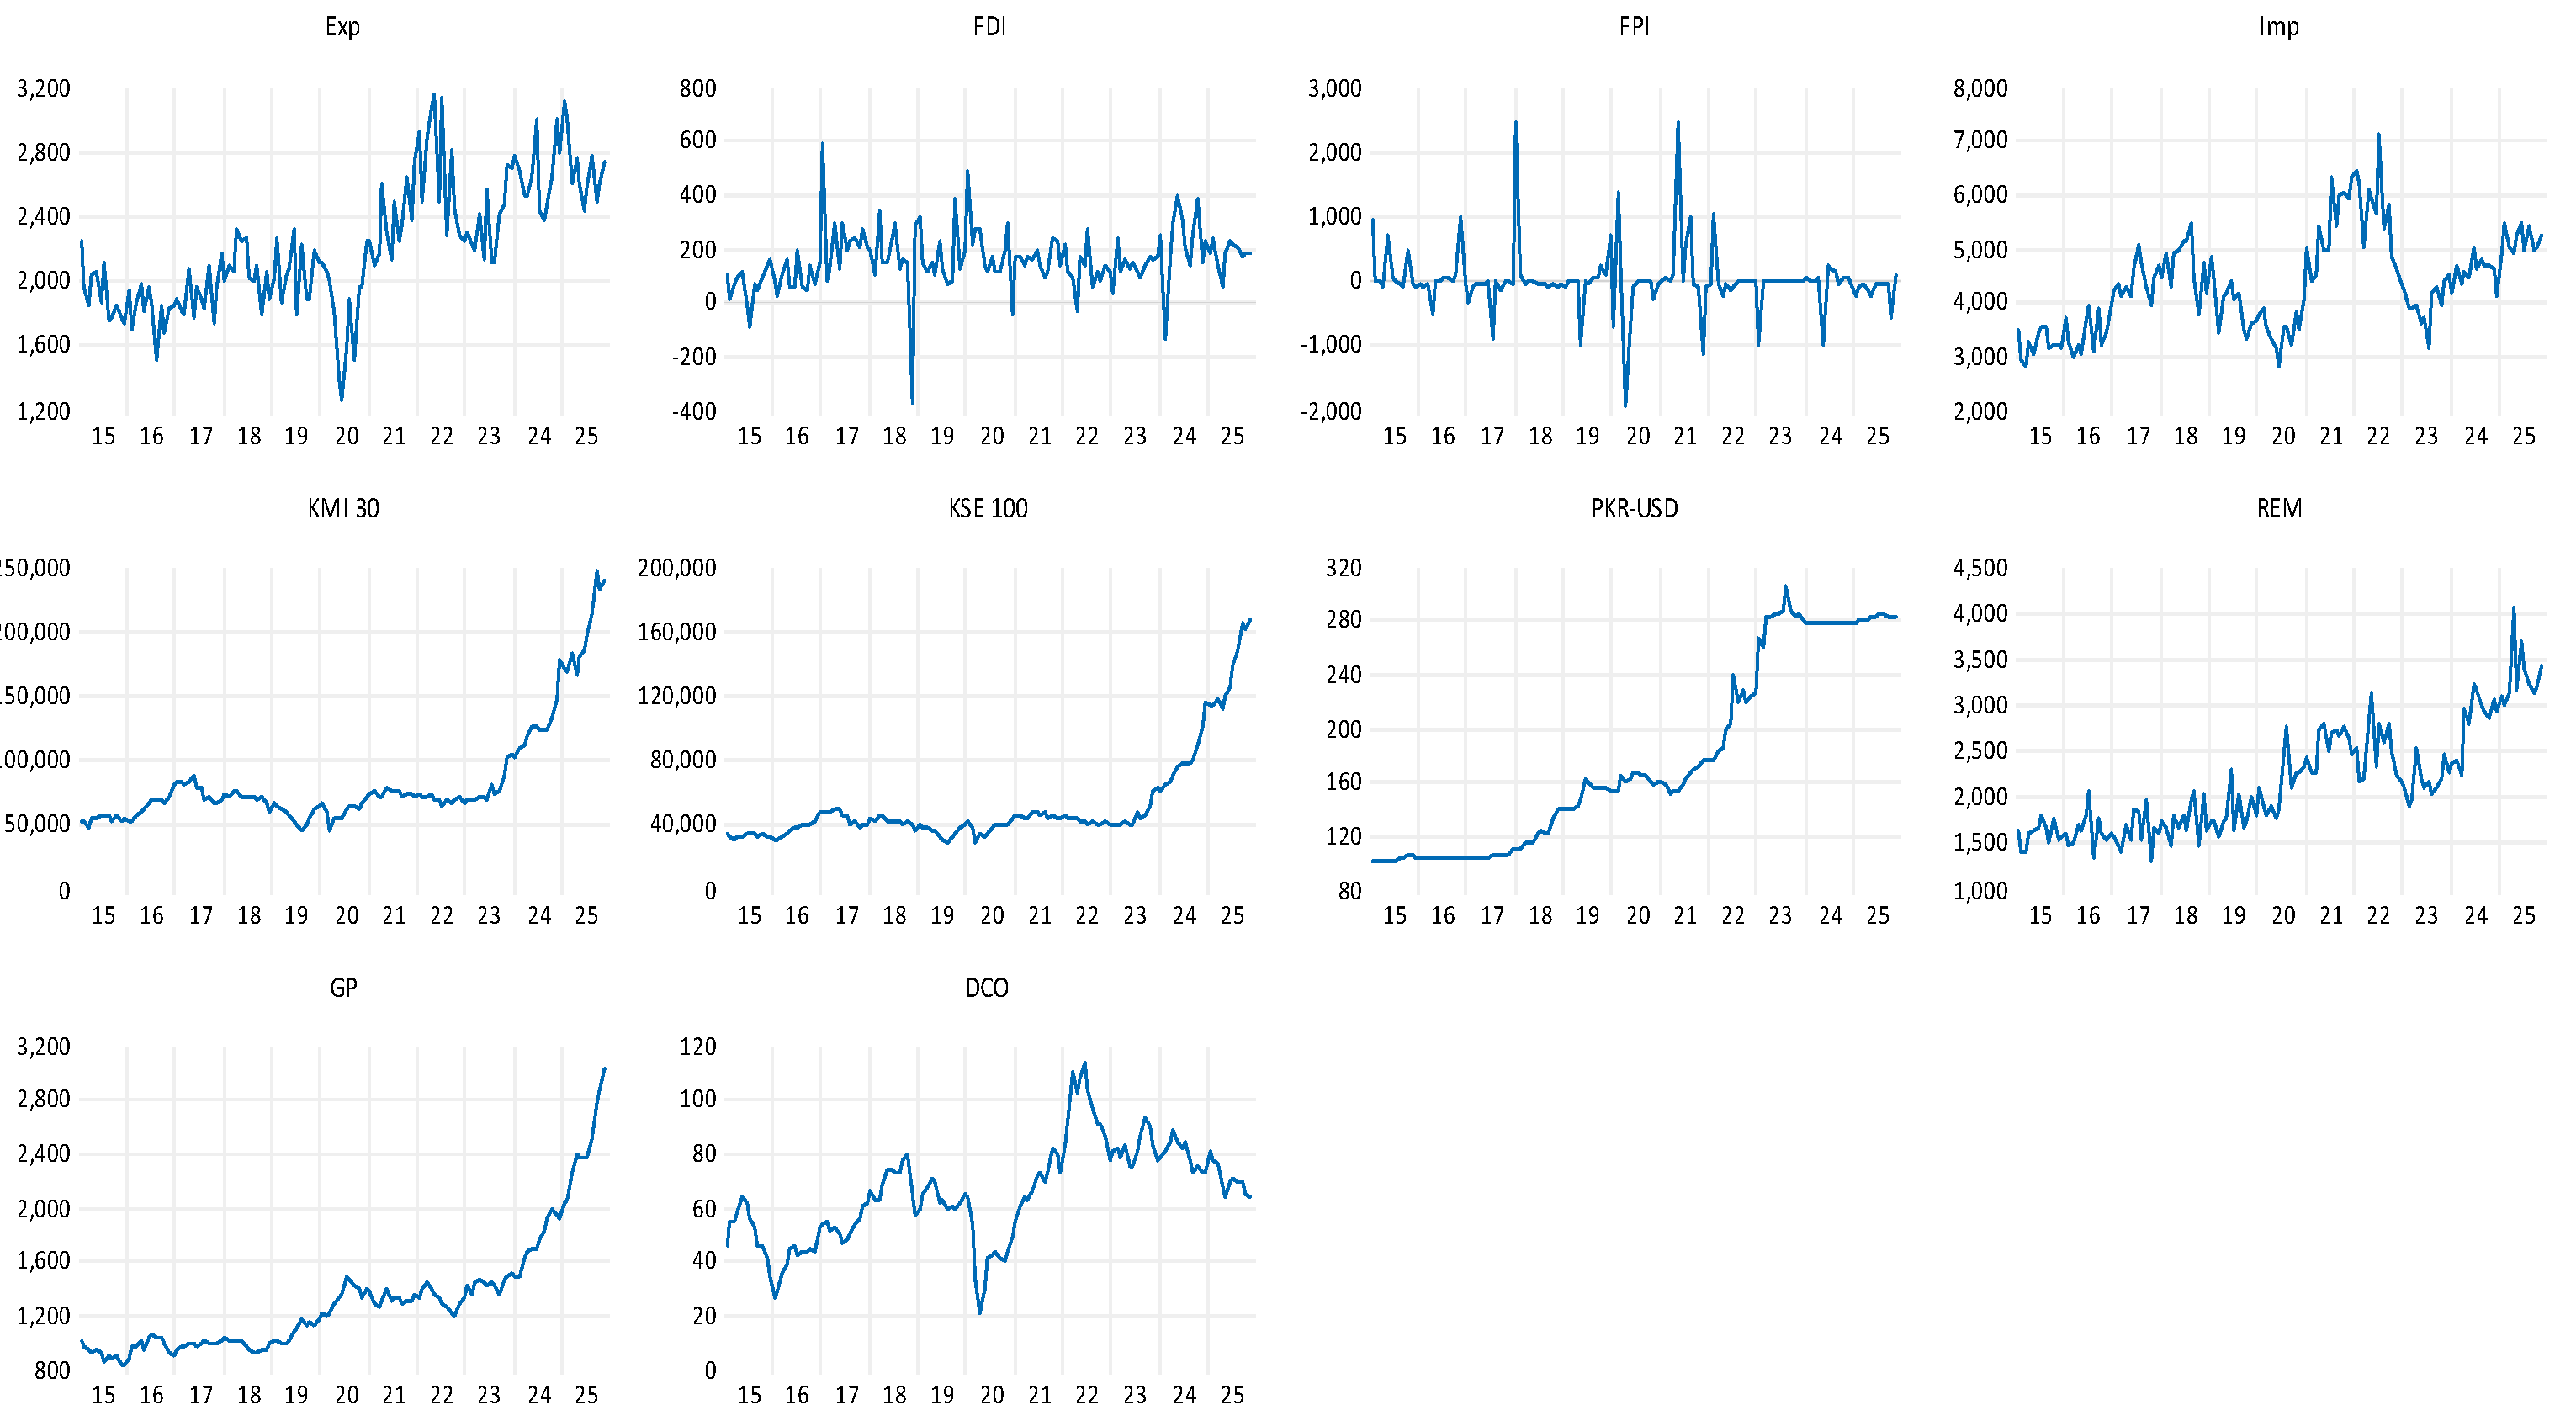
Data trends in selected variables during the review period are presented in Figure 1.
Figure 1.
Growth trends in selected variables. Source: created by the author.
A brief review of selected variables follows:
1. Stock Indices: The Pakistan Stock Exchange (PSX) was established in 2016 by merging three stock exchanges in Pakistan. The Securities and Exchange Commission of Pakistan (SEP) regulates the market, established in 1997 (a successor of the Corporate Law Authority). The domestic economy experienced momentum in the 1960s; however, this momentum was lost in the 1970s due to political instability and mass nationalisation. In the 1990s, Pakistan initiated a privatisation programme and introduced stock market reforms [16]. KSE-100, KMI-30, and KSE-30 are major indices. KSE-100 and KSE-30 represent conventional stocks, and KMI-30 is an Islamic index. KSE-100 comprises 100 companies listed on the PSX. These companies come from many different sectors and have a higher market capitalisation. KMI-30 consists of 30 leading Shari’ah-compliant companies (Stock screening includes multiple tests, including Halal business, limit (based on total assets) for liquid assets (75%), interest-based debts (37%), and Haram investments (33%). Additionally, market-to-book value [net liquid assets] > 1, while Haram income limit is (5% of total revenue); https://www.almeezangroup.com/investor-education/shariah-methodology/ [accessed 12 December 2025]). PSX has delivered outstanding results in the first quarter of the 21st century, including being one of the best-performing stock exchanges [19], the fifth-best-performing equity market [20], and the second-best-performing in September-October 2023 [21]. The market has shown tremendous momentum over the past decade, particularly in the post-COVID era. The KSE-100 index rose from 34,444 (January 2015) to 166,678 (October 2025) in almost 11 years—an overall increase of 384%. During the period, KMI-30 reached a height of 239,316 from a starting point of 53,902, an overall increase of 344% (Figure 1). Growth on the PSX was not uniform over the period. In fact, post-COVID-19, stock market growth has been phenomenal. From the beginning of 2023 onward, the KSE-100 increased by 310%, while the KMI-30 increased by 244% (in the latest 34 months, January 2023–October 2025). The proxies for the research are the KSE-100 index for the conventional stock market and the KMI-30 for the Islamic market.
2. Workers’ Remittances: Expat workers’ remittances are considered the backbone of Pakistan’s economic management. Millions of expatriate Pakistanis are working abroad, with a concentration in the GCC region, and remitting billions of US dollars each month, which is a primary source of meeting the trade deficit. Historically, Pakistan has faced a trade deficit in goods and services. During the review period, expat remittances grew substantially, totalling USD 283 billion, with a low of B1.34 (September 2017) and a high of B4.05 (March 2025). A steady growth in remittances is observable in Figure 1. Remittances flood the foreign exchange market, leading to incremental consumption and economic growth. We expect the excess income available to residents to contribute to expanded economic activity and positive movement in the stock market. The study uses monthly remittance volumes in USD million. The literature section reviews the results obtained with this variable.
3. International Trade: Exports play a vital role in the economic management of Pakistan by generating much-needed foreign exchange to pay for imports (including capital goods and energy resources). Export revenue is expected to positively influence the stock market. Similarly, the import of machinery and energy stimulates industrial processes and boosts economic activity. Imports are also expected to have a positive impact on the stock market. During the review period, both exports and imports depict increasing trends (Figure 1). The export volume is USD 288 billion (with a monthly high of USD 3.15 billion and a low of USD 1.26 billion), while imports are USD 569 billion (with a monthly high of USD 7.11 billion and a low of USD 2.80 billion) during the study period. A persistent trade deficit, coupled with a budgetary deficit, leads to borrowing. Pakistan is in a debt trap, with the highest single allocation in recent budgets going to debt servicing. The study uses monthly export and import volumes expressed in USD million. Section 2 documents the empirical relationship between exports and the stock market.
4. Foreign Investment: During the review period, Pakistan received net FDI of USD 20.7 billion and net FPI of about USD 800 million. The study measures the volume of net FDI and FPI in USD millions. The literature (Section 2) indicates a positive relationship between the net inflow of foreign investment and stock market returns.
5. Oil Prices: Fuels are needed to run the industrial processes and transportation of goods and passengers. The single highest import bill is for fuels in the domestic market. (e.g., combined import bills of mineral fuels reached USD 51 billion, approximately [three fiscal years 2021, 2022, and 2023], consuming 48% of total exports). Movements in oil prices carry serious consequences for the economy. During the review period, oil prices have shown upward movement with a high of USD 113.2 (June 2022) and a low of USD 20.4 (April 2020). The study uses the price of Dubai Crude Oil (DCO) per barrel as a proxy for the oil market. The literature section reviews empirical evidence on the relationship between stock and oil markets.
6. Gold Prices: During the review period, gold prices have risen from USD 960 to USD 3037 per ounce. Empirical evidence documents the association between gold and stock markets (Section 2). The study uses the gold price per ounce in USD as a proxy for the gold market.
7. Currency Market: Pakistan encountered difficulties in managing the exchange rate throughout the review period. The national currency has lost almost two-thirds of its value against the US dollar during the review period. We expect exchange rate movements to negatively affect stock returns. The study used the PKR/USD exchange rate as its proxy. Empirical evidence documents a significant association between currencies and stock markets, as noted in the literature section.
b. Econometrics: The following data analysis techniques were used. Raw prices/figures were converted to growth (returns) by using the equation:
is returns/growth (to calculate transformed series for data analysis); is natural log; is the current month value, while is the previous month’s value.
Descriptive statistics are calculated for the transformed series. The statistics include averages (mean, median), deviations (standard deviation, coefficient of variation), dispersions (skewness, kurtosis), and normality (Jarque–Bera). The unit root test is applied to check the stationarity status of the series. Correlation coefficients are calculated to document bivariate relationships among selected variables and to assess multicollinearity. Finally, cause and effect is determined through formal regression models. The following are the basic regression equations tested using econometric software EViews 14:
is stock returns; represents the conventional stock index and denotes the Islamic stock index; represents constant (factors other than selected variables); is Dubai Crude Oil (oil market); is export volume; is foreign direct investment; is foreign portfolio investment; import volume; exchange rate Pak rupee/USA dollar; and for workers’ remittances. to represent beta coefficients, while the subscript is for the error term.
Serial correlation is checked using the Durbin–Watson (DW) statistic, which is built into the regression analysis function of EViews. The study employs Newey–West robust standard errors (in OLS specifications) to check the effects of heteroskedasticity on the validity of statistical inferences.
4. Analysis and Findings
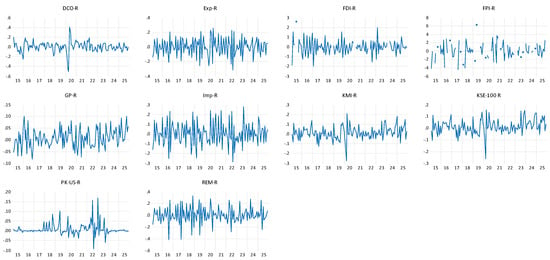
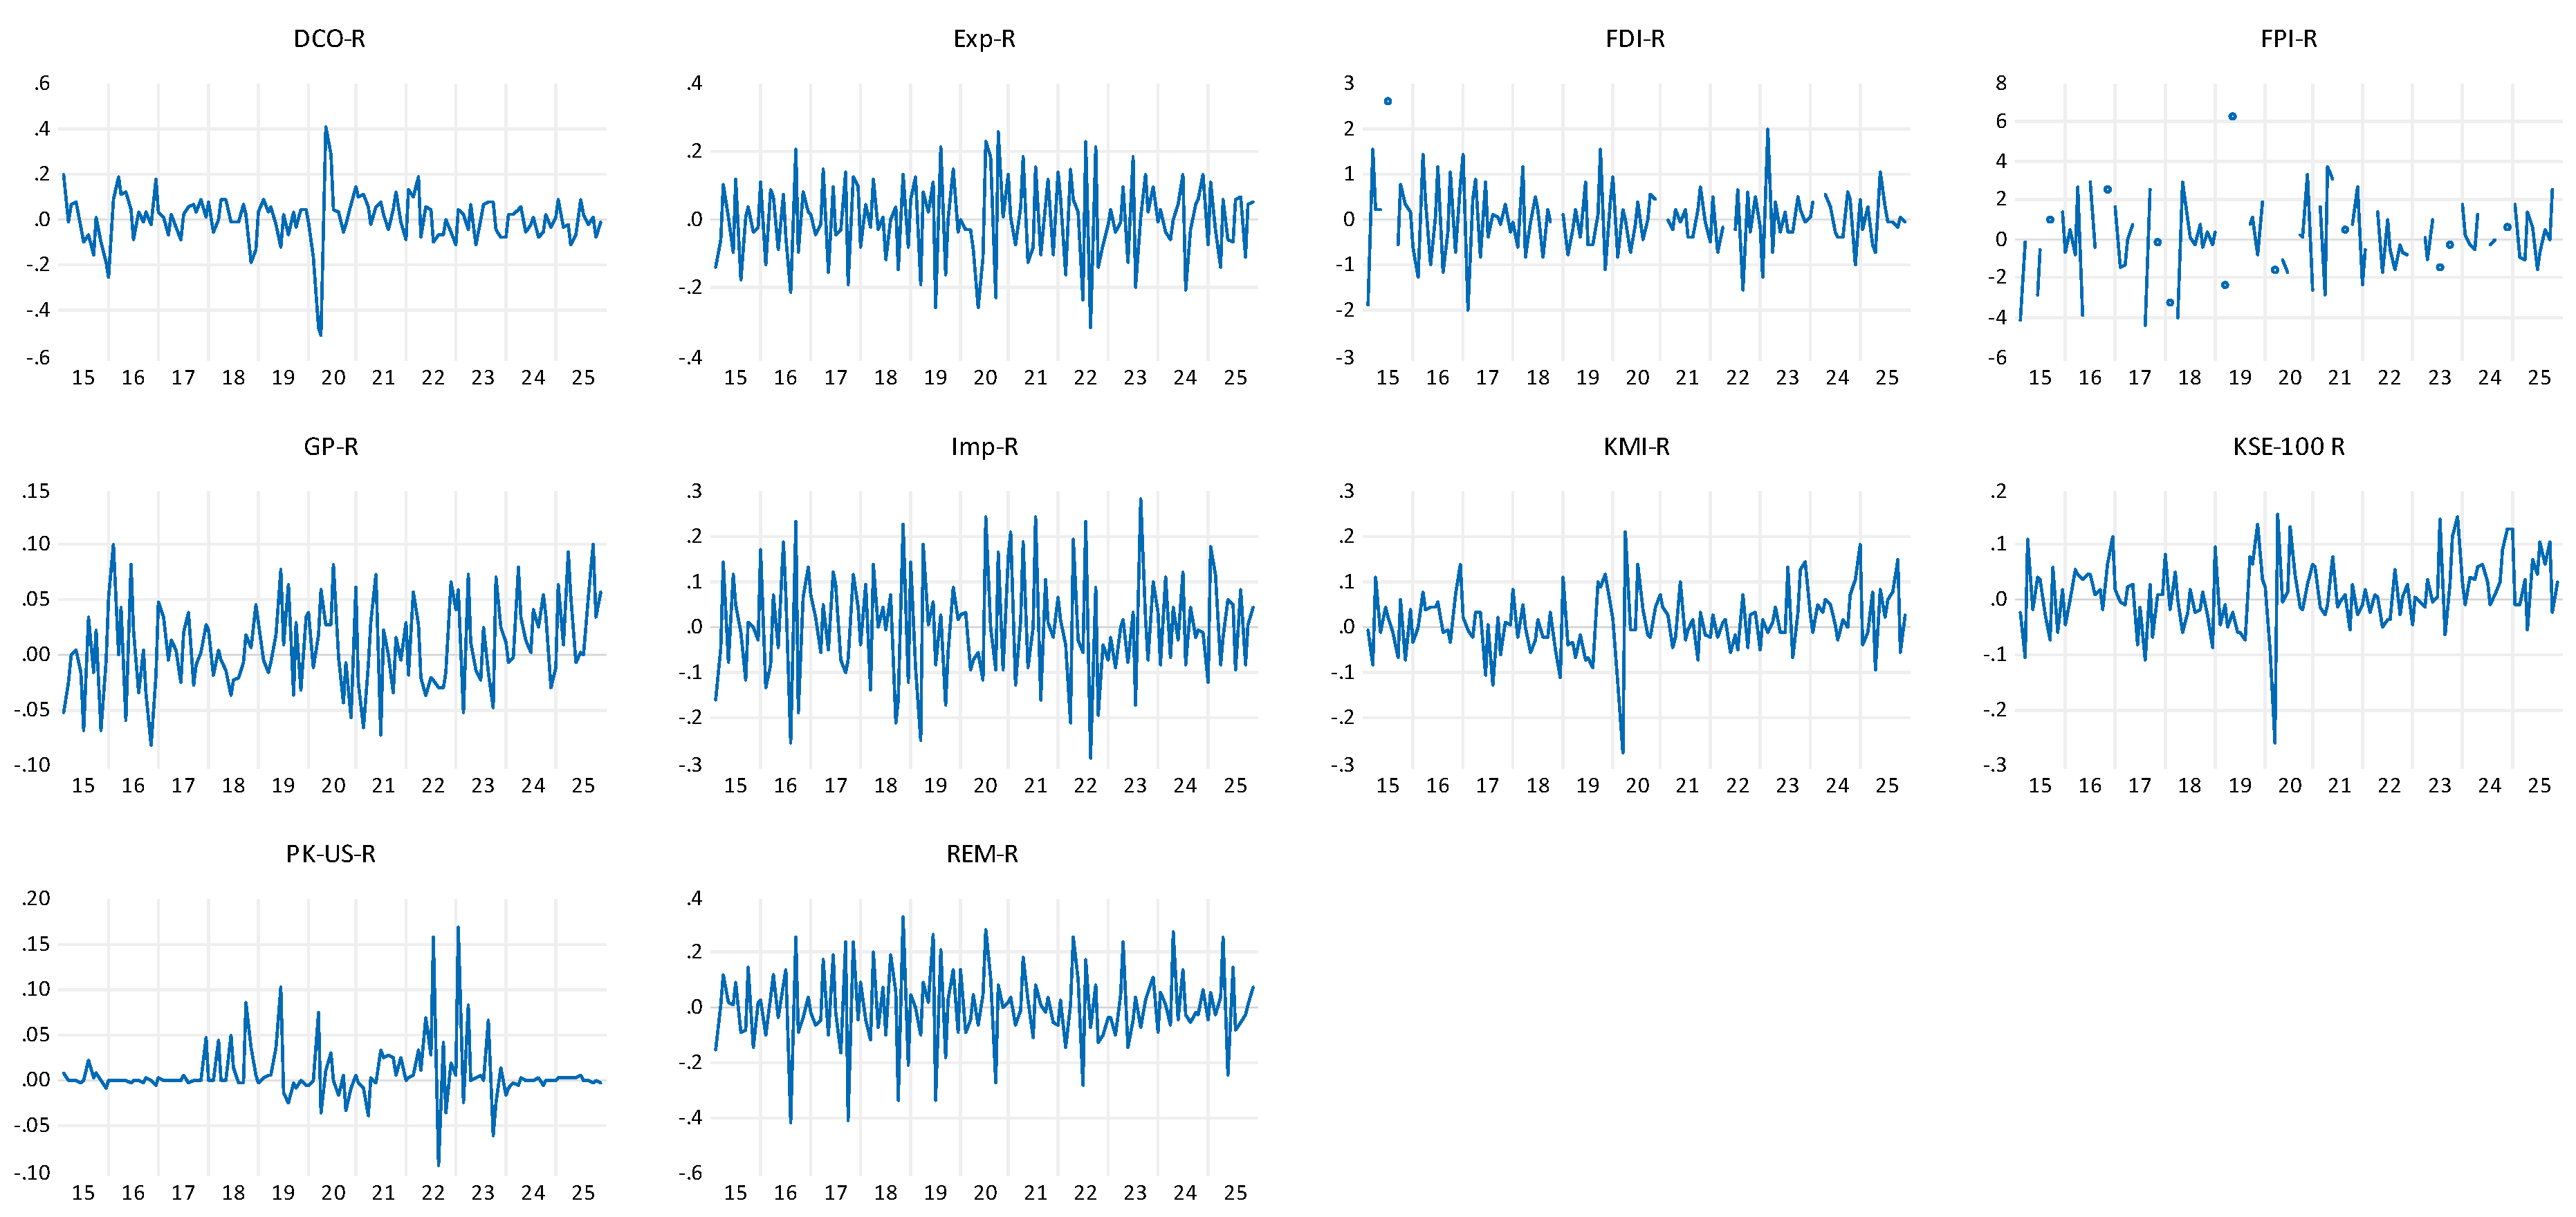
1. Descriptive Statistics: The analysis is conducted using the transformed series. The analysis begins by calculating descriptive statistics (Table 2). According to the results, the highest median monthly increase in FPI, is followed by KMI, KSE, and DCO. In contrast, negative median monthly increases are recorded for FDI, exports, and imports. REM, FDI, DCO, and FPI depict the highest variations (coefficient of variation). Skewness indicates left skew in DCO, EXP, IMP, KMI, KSE, and REM, and right skew in FDI, FPI, GP, KSE, and the exchange rate. Jerque–Bera stats indicate EXP, FPI, GP, IMP, and REM are within the normal range. The time series for DCO, KMI, KSE, and the exchange rate exhibit leptokurtic distributions. Figure 2 presents the transformed series (log returns) graphically, indicating relative randomness.
Table 2.
Descriptive statistics of transformed series [)].
Figure 2.
Graphic presentation of transformed series [)]. Source: Constructed by the author.
2. Multicollinearity: Before testing the regression model, it is recommended to determine the multicollinearity status between independent variables, because severe multicollinearity leads to incorrect results. A correlation above 80% between two independent variables is considered severe multicollinearity. The study includes eight independent and two dependent variables. As depicted in Table 3, the highest correlation is between two stock market indexes (both dependent variables), which cannot be used in any regression model together (as independent variables). Focusing on independent variables, the highest correlation exists between imports–exports (71%) and exports–remittances (63%), followed by FDI–export (34%), FDI–FPI (25%), FDI–imports (25%), and FDI–remittances (22%). All other pairs of independent variables depict correlations less than 20%. Oil prices show a negative correlation with all independent variables except remittances, whereas gold prices show a negative relationship with three variables (oil prices, exports, and FDI). In case of correlations between independent and dependent variables, KSE-100 depicts five positive correlations (oil prices 37%, FPI 12%, remittances 11%, gold prices 3%, and FDI 1%), one zero correlation (imports), and two negative correlations (exchange rate 29% and exports 1%). As far as correlations between independent variables and KMI are concerned, five pairs have positive relationships (oil price 36%, FPI 15%, remittances 5%, gold prices 4%, and FDI 2%), and three have negative correlations (exchange rate 30%, exports 8%, and imports 5%). The results indicate no severe multicollinearity among the independent variables. Additionally, two independent variables (oil and currency markets) show relatively stronger associations with the dependent variables. Such indications will be confirmed through formal regression analysis (in the following section).
Table 3.
Correlations between transformed series [)].
3. Stationary Test: The stationarity of the series is required for a formal regression model. To obtain correct regression results, the data series must be stationary. The results of unit root testing are presented in Table 4. As per the results, the series’ stationarity exists at the group as well as the individual level under both types of unit root tests (ADF Fisher and PP Fisher). Group unit root results indicate that the series are stationary at the 1% significance level. All individual results are significant at the 1% level, except for imports and workers’ remittances, which are significant at the 5% level under the Fisher-ADF.
Table 4.
Group unit root testing (log return series).
4. Regression Results: Regression results are reported in Table A1 and Table A2 (Appendix A). Results calculated using all variables (A) and excluding FPI (B). The FPI series is excluded from the regression model due to missing values in the log-return calculations (resulting from multiple negative values). Regression results with FPI include 78 observations, and without FPI, 120 observations. Table A1 indicates the insignificance of FPI.
Results based on all variables except FPI are reported in Table A2. For the Islamic stock index, the model’s fitness is indicated by the F Stat (p value 0.008), while the Durbin–Watson (DW) statistic (2.218) suggests negligible autocorrelation. The external sector’s combined explanatory power for stock price variations exceeds 10% (adjusted R-square), with three significant variables: oil prices, exchange rates, and the gold market. The results indicate a link between the Islamic stock index and three external markets (oil, gold, and currency). While the coefficients for oil and currency are significant at the 5% level, the coefficient for gold is marginally significant.
The results are even better in the case of the conventional stock index, with an improved F-stat probability value (0.004) and DW statistic (2.034). The combined explanatory power for stock returns’ variation is approximately 12% (adjusted R-square), using the same set of three significant variables: oil prices, exchange rates, and the gold market. PXS depicts linkage with three external markets (oil, gold, and currency). The significance level is 5%, except for gold, which is marginally significant. As a rule of thumb, the acceptable range for the DW stat is 1.5 to 2.5. Adjusted R-square values are low, perhaps due to the noise characteristics of the return series. Also, a smaller impact from the external sector suggests that most of the variation in stock indices is indigenous and driven by domestic macroeconomic factors.
Based on these results, the study selected four variables as regressors, and the results are presented in Table 5. Remittances, insignificant in the model (Table A2), are included as a fourth variable (with three significant variables: oil, gold and currency). The selection of remittances is justified as the p-value is lower than that of the other insignificant variables. Improved results are examined for Islamic and conventional stock indices in terms of explanatory power, F- Stat probability, and Durbin–Watson statistics. For the Islamic index, the model’s explanatory power increased to 12%, and for the conventional index, to 15%. Likewise, DW statistics improved for Islamic from 2.22 to 2.20 and for conventional from 2.03 to 2.01. Additionally, the F Stat probability improved for the Islamic index from 0.008 to 0.000 and for the conventional index from 0.004 to 0.000. There are three significant variables for both indexes [including oil prices, gold prices, and exchange rates], while the fourth variable (remittances) is significant only for conventional stocks. Gold is marginally significant for both indices. Significant constant values indicate the contribution of variables other than those selected in the stock returns’ generation process.
Table 5.
Regression results (selected variables).
Heteroskedasticity is assessed using the White test. Results indicated rejection of the homoskedastic hypothesis [Obs*R-squared 51.07085 Prob. Chi-Square (14) 0.0000]. The OLS model was retested using Newey–West (HAC standard errors), and the results are presented in Table A3 (Appendix A). A slight difference in results is evident, particularly in the significance levels. However, the overall findings remain relevant.
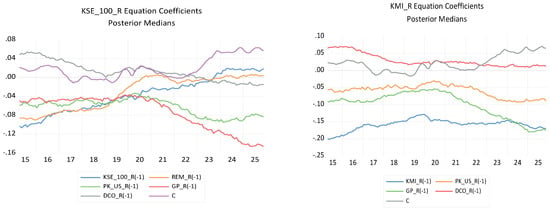
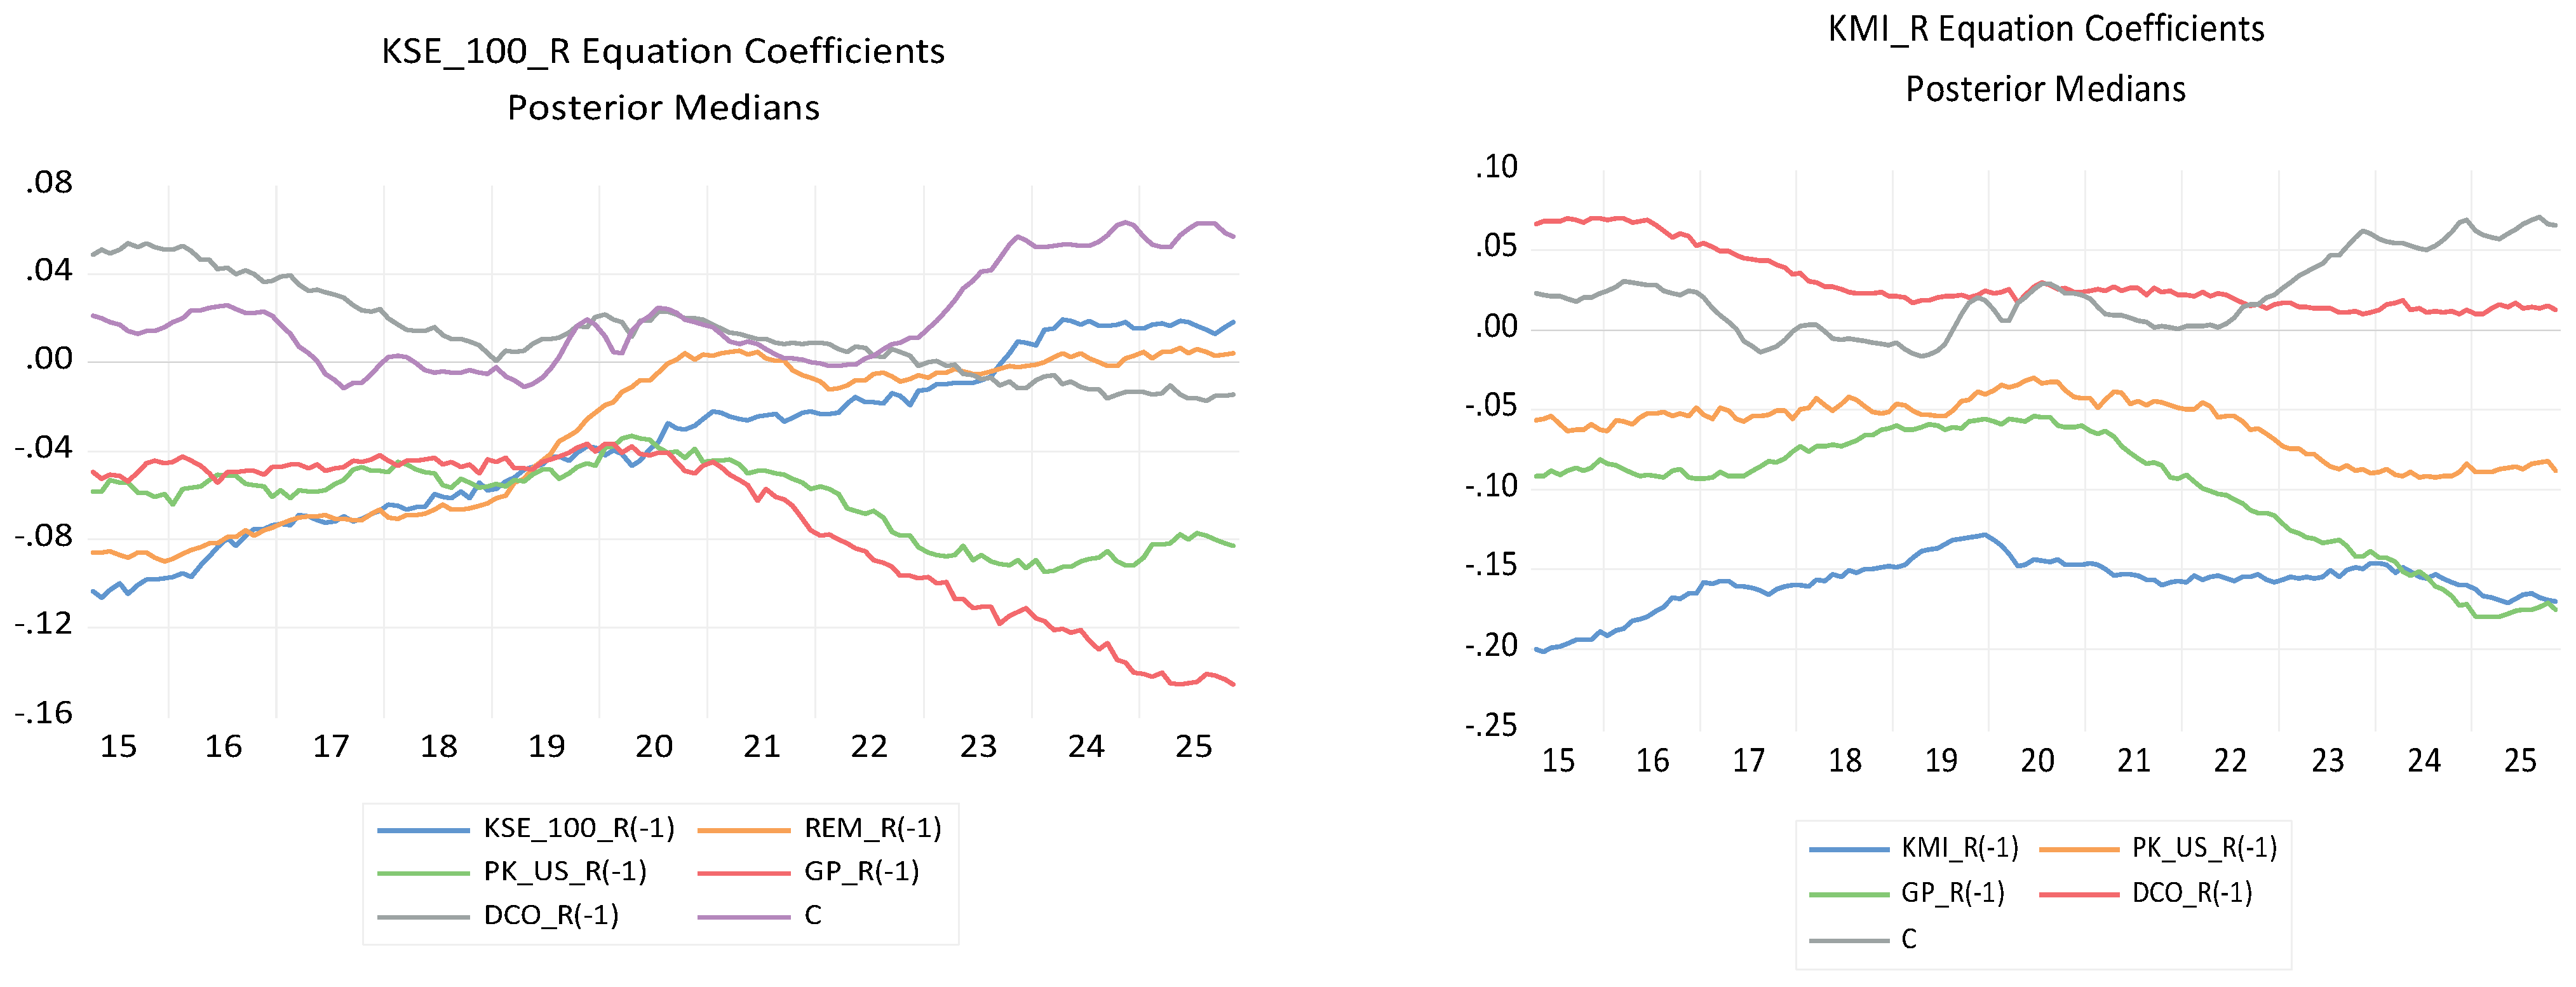
5. Stability of Relationship: Stability of the relationships over the period is checked through Bayesian Time-Varying Coefficient Vector Auto Regression (BTCV-VAR) (Figure 3) and Switching Vector Auto Regression (SVAR) (Table 6 and Table 7) by using EViews 14. Using three significant variables for KMI and four for KSE, time-varying-VARs are calculated with a one-lag. For the KSE index, coefficient variations are evident throughout the sample period. In the final phase, oil prices (DCO) and remittances (REM) merge with the index, while gold prices and exchange rates expound. Similarly, for KMI, the coefficients vary over the review period. Gold prices (GP) are converging with KMI, while the exchange rate (PK_US_R) is drifting away. The evidence leads to an unstable relationship during the review period (Figure 3).
Figure 3.
BTCV-VAR. Source: Created by the author. Simulation smoother: Cholesky factor algorithm (CFA; Posterior sample size: 5000 (burn-in size: 5000).
Table 6.
Markov Switching VAR (KSE-100 Index).
Table 7.
Markov Switching VAR (KMI-30 Index).
Further evidence of time-varying effects was obtained through switching VAR, and the results are reported in Table 6 (conventional index) and Table 7 (Islamic index). For the conventional index, the model’s fitness is assessed using the log-likelihood, Akaike information criterion (AIC), and Schwarz criterion (SC). The results of all tests indicate goodness of fit. Likewise, a negligible value of the determinant residual covariance matrix confirms numerical stability (Panel 3). Comparative results are presented in panel 1. According to the results, strong switching is indicated by the mean (intercept) values across regimes. For example, the coefficients for the stock and gold markets changed from significantly positive to insignificant, whereas the oil market changed from significantly positive to significantly negative. Likewise, the exchange rate shifts from insignificance to positive significance, while remittances shift from negative to positive significance. All variables exhibit different values across the regimes, indicating that each regime has its own VAR dynamics.
For the Islamic index, all tests indicate goodness of fit (log-likelihood, AIC, and SIC) and numerical stability (Determinant RCOV). Comparative results are presented in panel 1. According to the results, strong switching is indicated by the mean (intercept) values across regimes for all selected series, except for the KMI index, which changes from marginally significant to insignificant. All variables exhibit different coefficient values across the regimes, indicating that each regime has its own VAR dynamics.
6. Discussion on Results: The currency market beta coefficient with a negative sign is above 0.50 (highly significant) for both markets, an indication of a substantial impact on the stock returns generation process at PSX. The findings are consistent with those of [2,3]. Negative signs of the exchange rate depict the impact of the deteriorating Pakistani rupee (PKR) on stock returns. Recently, PKR has lost much of its value. From the January 2015 exchange rate of PKR/USD (101) to the October 2025 exchange rate of PKR/USD (283), the currency has lost about 64% of its value. Prudent management of currency values and exchange rates is necessary for the smooth running of the economy. Devaluation/deterioration of the national currency has implications for society as a whole, including reduced purchasing power and mistrust in the currency, which contribute to a lack of confidence in the country’s economic management. The risk of capital flight from the country increases as inflation mounts, leading to the misery of residents.
The positive coefficient of oil prices confirms the demand–pull inflation hypothesis—signalling increased production and booming businesses. The result confirms the findings of [3,6]. Oil prices significantly affect the broader economy, as evidenced by stock market movements. A significant chunk of export earnings (48% combined for the three years 2021, 2022, and 2023) is spent on imported mineral fuels.
Against expectations, the beta coefficient of gold is positive. Conventional wisdom views gold as an alternative investment, which is often associated with a negative relationship. However, the relationship between stocks and gold markets is positive during the study period in the selected market. The results contradict the findings of [1,2] at PSX.
Finally, workers’ remittances became a significant factor in the conventional stock index. The positive beta coefficient is close to 0.8 (significant at the 5% level). The findings are consistent with those of [3]. Pakistan has received multi-hundred billion USD as remittances during the review period, which are reflected in stock market movements through various channels, including increased demand for goods and services and investment avenues. Facilitating the process by training workers in skills and foreign languages, as well as professional financial management aimed at transfer-in and productive utilisation, would yield benefits for the economy.
5. Conclusions and Recommendations
The study documents external-sector predictors of stock returns at the PSX for conventional and Islamic indices, using data from January 2015 to October 2025. Data for seven external variables covering foreign investment, international trade, remittances, the currency market, the gold market, and the oil market are used for analysis. The analytical techniques include descriptive statistics, correlation analysis, unit root tests, and regression analysis. Results indicate that a group of three external-sector variables is significant in generating stock returns. Oil, gold, and currency markets are significant drivers of indices’ movements at the PSX, for both conventional and Islamic indices. Additionally, workers’ remittances are significant only for the conventional stock index. BTC-Var and switching var suggest instability of relationships and regime-dependent var dynamics.
While the results based on historical data are regime-dependent, the findings have implications for investors and policy institutions. Upward movements in oil, gold, and expatriate remittances would be indicators of growth momentum at the PSX. Likewise, depreciation of the national currency would signal a decline in the stock indices. The currency market may serve as an alternative investment avenue during crises at PSX. Furthermore, gold is no longer a safe haven for domestic stock investors. Policy institutions may consider designing an action plan to manage the exchange rate prudently, which would help stabilise the national currency’s value and enhance confidence in the economy’s management. Furthermore, the process of generating workers’ remittances needs to be improved by providing workforce training, establishing a high-quality professional financial system to manage remittances through formal channels from abroad, and ensuring their productive use within the country. The relevant authorities have made the right moves by introducing Roshan Digital Accounts (RDAs) and related investment avenues to attract foreign exchange into the economy.
Study limitations include a focus solely on the external sector. Future research agendas may include documenting results by including the internal and external sectors. Furthermore, studies with different data frequencies and econometric techniques would be interesting contributions to understanding the predictors of stock returns at PSX.
Funding
The Article Processing Charge (APC) is funded by Ajman University.
Data Availability Statement
Public sources.
Conflicts of Interest
The author declares no conflict of interest.
Appendix A
Table A1.
Regression results (all variables).
Table A2.
Regression results (all variables excluding FPI).
Table A3.
Regression results (selected variables). HAC standard errors and covariance (Bartlett kernel, Newey–West fixed bandwith = 5.00.
References
- Hanif, M. Relationship between Oil and Stock Markets: Evidence from Pakistan Stock Exchange. Int. J. Energy Econ. Policy 2020, 5, 150–157. [Google Scholar] [CrossRef] [Scilit]
- Ali, R.; Mangla, I.U.; Rehman, R.U.; Xue, W.; Naseem, M.A.; Ahmad, M.I. Exchange Rate, Gold Price, and Stock Market Nexus: A Quantile Regression Approach. Risks 2020, 8, 86. [Google Scholar] [CrossRef] [Scilit]
- Khan, M.I.; Teng, J.-Z.; Khan, M.K.; Jadoon, A.U.; Khan, M.F. The impact of oil prices on stock market development in Pakistan: Evidence with a novel dynamic simulated ARDL approach. Resour. Policy 2021, 70, 101899. [Google Scholar] [CrossRef] [Scilit]
- Hashmi, S.M.; Chang, B.H.; Huang, L.; Uche, E. Revisiting the relationship between oil prices, exchange rates, and stock prices: An application of the quantile ARDL model. Resour. Policy 2022, 75, 102543. [Google Scholar] [CrossRef] [Scilit]
- Tabash, M.I.; Babar, Z.; A Sheikh, U.; Khan, A.A.; Anagreh, S. The linkage between oil price, stock market indices, and exchange rate before, during, and after COVID-19: Empirical insights of Pakistan. Cogent Econ. Financ. 2022, 10, 2129366. [Google Scholar] [CrossRef] [Scilit]
- Hanif, M. Identification of risk factors: A comparison of conventional and Islamic stocks. Technol. Econ. Dev. Econ. 2025, 31, 1433–1456. [Google Scholar] [CrossRef] [Scilit]
- IFSB. Islamic Financial Services Industry Stability Report, Kuala Lumpur. 2025. Available online: https://www.ifsb.org/publication/?_sft_publications_category=islamic-financial-stability-report (accessed on 20 December 2025).
- Malik, I.; Amjad, S. Foreign direct investment and stock market development in Pakistan. J. Int. Trade Law Policy 2013, 12, 226–242. [Google Scholar] [CrossRef] [Scilit]
- Asghar, M.M. Factors Influencing Foreign Portfolio Investment in the Pakistan Stock Exchange: An Empirical Analysis. Acad. Int. Res. J. 2025, 1, 15–26. [Google Scholar]
- Hanif, M.; Bhatti, A.A. Causality among stock market and macroeconomic factors: A comparison of conventional and Islamic stocks. J. Islam. Bus. Manag. 2018, 8, 423–449. [Google Scholar]
- Dilshad, W. Impact of Workers’ Remittances on Economic Growth: An Empirical Study of Pakistan’s Economy. Int. J. Bus. Manag. 2013, 8, 126–131. [Google Scholar] [CrossRef] [Scilit]
- Rehman, M.U.; Shah, Z.; Rehman, Z.U. Impact of the foreign remittances on economic growth and poverty reduction: An analysis of Pakistan’s economy. J. Humanit. Soc. Manag. Sci. 2023, 4, 58–77. [Google Scholar] [CrossRef] [Scilit] [PubMed]
- Shirazi, M.; Meibodi, A. Reaction of stock market index to oil price shocks. Iran. Econ. Rev. 2020, 24, 99–128. [Google Scholar]
- Stefanova, Z. Forex Trading. 2025. Available online: https://www.bestbrokers.com/forex-trading/forex-daily-trading-volume/ (accessed on 24 December 2025).
- Adjasi, C.; Harvey, S.; Agyapong, D. Effect of exchange rate volatility on the Ghana stock exchange. Afr. J. Account. Econ. Financ. Bank. Res. 2008, 3, 28–47. [Google Scholar]
- Qayyum, A.; Kemal, A. Volatility Spillover Between the Stock Market and the Foreign Exchange Market in Pakistan; PIDE Working Paper; Pakistan Institute of Development Economics: Islamabad, Pakistan, 2006; pp. 1–18. [Google Scholar]
- SBP. Statistical Bulliten. 2025. Available online: https://www.sbp.org.pk/reports/stat_reviews/Bulletin/index.htm (accessed on 25 December 2025).
- Investing.Com. 2025. Available online: https://www.investing.com/markets/ (accessed on 20 December 2025).
- Dawn. USA Today Recognizes KSE as Best Market. 2002. Available online: https://www.dawn.com/news/57807 (accessed on 24 December 2025).
- Verhage, J. News. 2016. Available online: https://www.bloomberg.com/news/articles/2016-12-28/here-are-the-best-and-worst-performing-assets-of-2016 (accessed on 24 December 2025).
- Mangi, F.; Chakraborty, C. 2023. Available online: https://www.bloomberg.com/news/articles/2023-10-20/pakistan-is-world-s-second-best-stock-market-as-kse-tops-50-000 (accessed on 24 December 2025).

Disclaimer/Publisher’s Note: The statements, opinions and data contained in all publications are solely those of the individual author(s) and contributor(s) and not of MDPI and/or the editor(s). MDPI and/or the editor(s) disclaim responsibility for any injury to people or property resulting from any ideas, methods, instructions or products referred to in the content. |
© 2026 by the author. Licensee MDPI, Basel, Switzerland. This article is an open access article distributed under the terms and conditions of the Creative Commons Attribution (CC BY) license.