


Abstract
Orthophosphate is a bioavailable phosphorus form that contributes to eutrophication. This study evaluated aluminum electrocoagulation for orthophosphate (PO4-P) removal from real dairy wastewater with variable initial characteristics. Batch experiments were conducted for 60 min at an initial pH of 5–7 and 2.9–10 mA cm−2. A study-defined residual PO4-P target of 0.5 mg P L−1 was used to compare treatment time and specific energy consumption (SEC), while electrode loss and partial operating cost were also assessed. The target was reached at pH 5 for current densities ≥4.5 mA cm−2, at all current densities at pH 6, and only at 10 mA cm−2 at pH 7. Among the target-achieving experiments, 19–81% of the electrical energy consumed over 60 min was used after the first sampling point, at which PO4-P decreased below 0.5 mg P L−1. NaCl addition reduced SEC by 69–76% and 60-min operating cost by 24–39%, whereas electrode consumption remained similar or increased. The target was reached within 25–50 min at operating costs of 1.16–1.64 EUR m−3. SEM-EDS and FTIR provided qualitative evidence consistent with phosphate retention in Al-containing solids, while NaCl addition was associated with localized anodic dissolution. This target-based approach provided a common basis for comparing treatment time and energy requirements across different operating conditions.
1. Introduction
The dairy industry is one of the largest food-processing sectors worldwide and is characterized by intensive water consumption throughout various production stages, including equipment cleaning, pasteurization, cooling, and product processing [1]. The resulting wastewater varies in volume and composition depending on the products processed and the operating and cleaning practices used at the plant [1,2]. Dairy wastewater is generally characterized by high concentrations of biodegradable organic matter, suspended solids, fats, proteins, lactose, and nutrients, particularly nitrogen and phosphorus compounds [1,3,4,5]. For mixed dairy wastewater, the reported physicochemical characteristics vary considerably, with pH values ranging from 4 to 11, biochemical oxygen demand (BOD5) from 240 to 5900 mg L−1, chemical oxygen demand (COD) from 500 to 10,400 mg L−1, total suspended solids (TSS) from 60 to 5800 mg L−1, fats, oils, and grease (FOG) from 20 to 1920 mg L−1, total nitrogen from 10 to 660 mg L−1, and total phosphorus from 0 to 600 mg L−1 [1]. The use of alkaline and acidic cleaning agents, including sodium hydroxide, nitric acid, and phosphoric acid, can further modify wastewater composition and contribute to fluctuations in nutrient concentrations and conductivity [6]. Such variability is a characteristic feature of real dairy wastewater and complicates both process optimization and comparison of treatment performance in different operating conditions [5,7].
In dairy wastewater, phosphorus occurs in several forms depending on the origin of the effluent and on the processing and cleaning operations involved; these include orthophosphate, condensed inorganic phosphates such as polyphosphates, organically bound phosphorus, and particulate-associated forms [8,9]. These fractions differ in their chemical behavior and environmental availability. In particular, the dissolved orthophosphate is a readily bioavailable phosphorus form that can be assimilated by aquatic plants and algae, promoting excessive growth. The eutrophication process can lead to oxygen depletion during biomass decomposition, therefore adversely affecting aquatic organisms, disrupting the ecosystem balance, and reducing the overall water quality [10,11]. Consequently, the removal of orthophosphate from wastewater before discharge is important for mitigating eutrophication risks and protecting the receiving-water quality.
Phosphorus can be removed from wastewater using several biological and physicochemical methods, including chemical precipitation, adsorption, ion exchange, membrane processes, and electrochemical treatment [12,13]. Electrocoagulation (EC) is an electrochemical treatment process that has been applied to a broad range of wastewaters and pollutants [14,15,16,17]. The process involves the anodic dissolution of a sacrificial metal electrode, which generates coagulant species in situ. These species destabilize colloidal matter and promote floc formation, followed by separation through sedimentation or flotation [14,16,18]. The electrode material is a key process variable because it influences the metal species released, the structure of the electro-generated flocs, and the dominant pathways of phosphate removal [12,16]. Aluminum and iron are widely used as sacrificial electrode materials in electrocoagulation. Several comparative studies indicate that aluminum generally provides more effective phosphate removal than iron in comparable conditions, although the relative performance of the two materials depends on the wastewater matrix and reactor configuration [19,20,21].
In aluminum electrocoagulation, coagulant species are generated primarily through the anodic dissolution of the sacrificial electrode, as described by Equation (1) [21,22]:
Al → Al3+ + 3e−,
At the cathode, water reduction generates hydrogen and hydroxide ions, as shown in Equation (2) [22]:
2H2O + 2e− → H2(g) + 2OH−,
Electrochemically generated Al3+ ions undergo hydrolysis reactions that depend strongly on the pH of wastewater. As a result, different soluble hydroxo-aluminum species and Al(OH)3-rich precipitates may form, with their relative proportions changing as the pH evolves during electrocoagulation [23].
At near-neutral pH, amorphous Al(OH)3-rich precipitates are typically formed, providing a high surface area for coagulation. The overall precipitation process is commonly represented in a simplified form by Equation (3) [23]:
Al3+ + 3H2O → Al(OH)3(s) + 3H+,
The freshly generated hydroxide flocs destabilize colloids, adsorb dissolved species, and remove suspended material by sweep flocculation. Hydrogen bubbles can additionally promote flotation, whereas the remaining flocs are removed by settling [16,23].
In strongly alkaline conditions (pH > 9–10), the amphoteric dissolution of aluminum hydroxide may occur through the formation of soluble aluminate species, as shown in Equation (4) [24]:
Al(OH)3(s) + OH− → Al(OH)4−,
This process can reduce the amount of solid hydroxide-rich coagulating species [24].
The local alkaline environment at the cathode can also promote the chemical dissolution of aluminum, as represented by Equation (5) [23]:
2Al + 2OH− + 6H2O → 2Al(OH)4− + 3H2(g),
Orthophosphate removal by aluminum electrocoagulation is governed by the interactions between phosphate species and the aluminum hydrolysis products formed during the process [22,25]. At mildly acidic to neutral pH values, orthophosphate occurs predominantly as H2PO4− and HPO42− rather than as free PO43−. These phosphate species can interact with aluminum hydrolysis products through several pathways, including Al–P precipitation, inner-sphere complexation, and incorporation into growing aluminum-rich flocs, which could occur simultaneously [21,24,25]. Their relative contributions depend on the aluminum and phosphate speciation and are influenced by the solution pH, aluminum dose, phosphate concentration, and the presence of coexisting species [12,13].
Aluminum electrocoagulation has been investigated for both synthetic and real dairy effluents under a wide range of conditions (Table 1).
As shown in Table 1, phosphorus removal was generally accompanied by substantial clarification of the wastewater. Tchamango et al. [26] reported 89% phosphorus removal from a synthetic dairy effluent prepared from milk powder and complete removal of water turbidity. Varank and Sabuncu [27] obtained up to 99.78% orthophosphate removal from real dairy wastewater under optimized conditions, with 98.6% turbidity removal. In a continuous-flow Al electrocoagulation reactor treating real industrial dairy wastewater, Aitbara et al. [28] reported 72% phosphorus removal, whereas COD and turbidity removals reached 92% and 99%, respectively.
Table 1.
Selected studies reporting phosphorus removal from dairy effluents using electrocoagulation.
Despite these valuable results, direct comparison of treatment performance remains difficult because the reported studies differ in wastewater composition, reactor configuration, electrode arrangement, operating parameters, treatment times, phosphorus fraction, and initial concentration used to assess performance. Furthermore, the operating conditions identified as effective for a particular wastewater cannot necessarily be applied to effluents with different characteristics. In this context, the performance of real wastewater treatment should be evaluated not only in terms of removal efficiency, but also considering the initial wastewater characteristics, the residual pollutant concentration attained, and the associated treatment time, energy consumption and material requirements.
The present study investigated aluminum electrocoagulation for the removal of orthophosphate (PO4-P) from real dairy wastewater collected on different dates from a single dairy processing facility.
Because the characteristics of real dairy wastewater varied across sampling days as a function of production and cleaning operations, the experiments were carried out on successive batches with different initial characteristics, and this variability was taken into account in the interpretation of the treatment performance. The effects of initial pH and current density on the temporal evolution of the residual orthophosphate concentration were studied, and the turbidity removal was used to assess the extent of wastewater clarification.
A study-defined residual PO4-P target of 0.5 mg P L−1 was adopted as a common basis for comparing the treatment time and specific energy consumption required to achieve this target in the investigated operating conditions. Electrode consumption and partial operating cost were also assessed.
In an attempt to reduce the operating cost of the treatment, NaCl was added as a supporting electrolyte, and its effects on PO4-P removal, electrode dissolution behavior, and partial operating cost were compared with those of the salt-free experiment.
In addition to the treatment-performance evaluation, the settled and floated solids generated during EC were characterized by SEM-EDS and FTIR to provide complementary information on their composition and the association of phosphate with the Al-containing solids. The post-EC Al anodes were also examined using SEM-EDS to identify the changes in the surface morphology and dissolution behavior induced by NaCl addition.
2. Materials and Methods
2.1. Dairy Wastewater and Its Characterization
Real dairy wastewater was collected from a dairy-processing facility located in Alba County, Romania, and used without any pretreatment. The samples were collected from the combined effluent upstream of the on-site treatment unit, including rinse water from cleaning operations.
Sampling was conducted in successive campaigns over a four-month period (March to June 2026). The samples were collected in pre-cleaned polyethylene bottles, transported to the laboratory, stored at 4 °C, and used within 5 days of sampling. Prior to each experiment, the wastewater was homogenized by magnetic stirring at 500 rpm for 1 h.
The wastewater composition varied among sampling batches and also showed some variations during the refrigerated storage. Therefore, the initial wastewater characteristics were measured both before and after the pH adjustment for each electrocoagulation experiment.
Table 2 summarizes the initial characteristics of the raw wastewater samples used in the experiments.
Table 2.
Initial characteristics of the raw dairy wastewater used in the electrocoagulation experiments before pH adjustment.
Before the electrocoagulation experiments, the pH of the wastewater was adjusted to initial values of 5, 6, or 7 using a 2 mol L−1 H2SO4 solution; no significant changes in the orthophosphate concentration were observed following the pH adjustment.
2.2. Electrocoagulation Experiments
Electrocoagulation experiments were performed in a laboratory-assembled batch reactor containing 800 mL of wastewater at room temperature (22 °C).
Four commercial-grade aluminum alloy plates (150 mm × 30 mm × 2 mm) were arranged vertically in a monopolar–parallel configuration, with two anodes and two cathodes alternately placed in the reactor (A-C-A-C). The electrodes were partially immersed in wastewater to a depth of approximately 5.5 cm, corresponding to a total effective anodic area of 65 cm2. The distance between the electrodes was 1 cm. The current was provided by a DC power supply (PeakTech 6225 A, PeakTech Prüf- und Messtechnik GmbH, Ahrensburg, Germany) operated under galvanostatic conditions with current and voltage ranges of 0–5 A and 0–30 V, respectively. The wastewater was magnetically stirred at 200 rpm during the electrocoagulation experiments.
The experimental electrocoagulation setup is schematically presented in Figure 1.
Figure 1.
Schematic representation of the laboratory-scale electrocoagulation setup with four aluminum electrodes arranged in a monopolar–parallel configuration (A, anode; C, cathode). Red and black lines indicate the positive and negative electrical connections, respectively.
Prior to the experiments, the aluminum electrodes were polished with 800- and 1200-grit abrasive paper and immersed for 3 min in 0.1 mol L−1 HCl to remove the surface oxide layer and then rinsed with distilled water. The electrodes were dried and weighed using an analytical balance (Ohaus Pioneer PX224, Ohaus Corporation, Parsippany, NJ, USA). After each electrocoagulation run, the electrodes were rinsed, dried at room temperature, visually inspected to ensure that no visible deposits remained on the surface, and reweighed to determine the anodic and cathodic mass losses.
The effects of the initial pH and current density on orthophosphate removal were investigated at adjusted initial pH values of 5, 6, and 7, and current densities of 2.9, 4.5, 7.5, and 10 mA cm−2. The initial pH values and current density ranges were selected based on previous studies on phosphate removal by Al electrocoagulation [22,27,28].
Four wastewater sampling batches were used for the current-density experiments. The wastewater batch corresponding to each operating condition is reported in Table S2 in the Supplementary Materials. Aliquots from the same batch were tested on different days within the refrigerated storage period. All NaCl-containing experiments were performed using wastewater from the same sampling batch (B4).
The current density (j) was calculated using Equation (6):
where I is the applied current (A), and S is the total effective immersed anodic area (cm2).
j = I/S,
Electrocoagulation experiments were conducted for 60 min, with sampling at predetermined time intervals of 5, 10, 15, 20, 30, 40, 50, and 60 min. A further 60-min series of experiments was performed at a current density of 7.5 mA cm−2 and initial pH values of 5, 6, and 7, after the conductivity of the real wastewater was increased to about 4000 µS cm−1 by the addition of 1.2586 g NaCl (1.573 kg m−3). The addition of NaCl was intended to increase the wastewater conductivity, thereby reducing the cell voltage and energy consumption, consistent with previous studies [22,28]. In these experiments, additional samples were also collected every 5 min between 15 and 35 min, which allowed the treatment time required to reach the operational target to be determined more accurately.
For the NaCl-added conditions, separate experiments were subsequently performed under the same operating conditions and terminated at the first sampling time at which the residual PO4-P concentration was below the operational target of 0.5 mg P L−1. The treatment times were 25, 30, and 50 min for initial pH values of 5, 6, and 7, respectively. The electrode mass losses measured in these separate experiments were used to calculate the experimental partial operating cost at the corresponding treatment times.
The chemicals, HCl (Merck, Darmstadt, Germany), H2SO4 (Merck, Darmstadt, Germany), and NaCl (Chempur, Piekary Śląskie, Poland) were of analytical grade; ultrapure water was used for solution preparation.
2.3. Analytical Methods
The orthophosphate concentration was determined using the ammonium molybdate spectrometric procedure based on SR EN ISO 6878:2005 [32], using an Analytik Jena UV-Vis spectrophotometer (Specord 210 Plus, Analytik Jena, Jena, Germany). The collected aliquots were allowed to settle for 45 min [33], and the clarified supernatants were carefully extracted for PO4-P analysis. Before analysis, the samples were appropriately diluted with ultrapure water to bring the PO4-P concentration within the calibration range. The corresponding dilution factors were taken into account when calculating the reported PO4-P concentrations. Orthophosphate concentrations were expressed as mg P L−1.
Chemical oxygen demand (COD) was determined using the dichromate oxidation method based on SR ISO 15705:2022 [34]. Appropriately diluted wastewater samples were digested in sealed tubes using an ECO8 thermoreactor (Velp Scientifica, Usmate, Italy), followed by titration with ammonium iron(II) sulfate solution.
The pH and cell voltage were recorded at each sampling time. The conductivity of the raw wastewater was measured before pH adjustment. The conductivity was measured again after adjustment to the selected initial pH, immediately before electrocoagulation, and after 60 min of treatment. The turbidity was also measured before and after each 60-min electrocoagulation experiment, following the same settling procedure for all samples. However, the contribution of sedimentation in the absence of an applied current to the observed changes in the orthophosphate concentration and turbidity was not independently evaluated.
The pH and conductivity were measured using a pH/Ion/Conductivity meter (SevenExcellence S475, Mettler Toledo, Greifensee, Switzerland) and turbidity was measured using an HI 83414 turbidimeter (Hanna Instruments, Leighton Buzzard, UK).
2.4. Evaluation of the Process Performance
The orthophosphate removal efficiency (RE) was calculated according to Equation (7):
where C0 is the initial orthophosphate concentration in dairy wastewater measured immediately before the corresponding electrocoagulation experiment (mg P L−1), and Ct is the residual orthophosphate concentration (mg P L−1) at treatment time (t).
RE = [(C0 − Ct)/C0] × 100,
In the absence of a discharge limit specific to orthophosphate, a residual PO4-P concentration of 0.5 mg P L−1 was adopted as a common performance target to provide a consistent basis for comparing the experimental conditions despite the differences in the initial wastewater composition. The selected value represents a low residual concentration corresponding to approximately 96–97% orthophosphate removal in the range of the investigated initial concentrations. This value was used only as an experimental benchmark and should not be interpreted as a regulatory discharge limit. The benchmark refers specifically to PO4-P, as total phosphorus was not measured in this study.
Because PO4-P concentrations were measured at discrete sampling times, the exact target-crossing time could not be established. Instead, the parameter t0.5 was defined as the target-crossing interval between the last sampling time at which the residual PO4-P concentration remained above 0.5 mg P L−1 and the first subsequent sampling time at which it decreased below this value.
The anodic and cathodic electrode mass losses were determined gravimetrically from the difference between the electrode masses measured before and after the electrocoagulation process.
The experimental Al electrode consumption (CAl,exp, kg m−3) and specific electrical energy consumption (SEC, kWh m−3) were obtained from the total measured anodic and cathodic mass losses and electrical parameters, respectively, using Equations (8) and (9) [35]:
where mtot is the sum of the measured anodic and cathodic mass losses (g), Vw is the treated volume (m3), U is the mean cell voltage over the corresponding treatment period (V), I is the current (A), and t is the treatment time (h); the factor 1000 accounts for the conversion of g into kg and Wh into kWh. The numerical integration of the measured voltage profiles resulted in SEC values that differed by less than 5% from those calculated using the mean voltage; therefore, the latter approach was used.
CAl,exp = mtot/1000 Vw,
SEC = (U × I × t)/1000 Vw,
The specific electrical energy consumption calculated at a fixed 60-min treatment endpoint was denoted as SEC60min. For the experimental conditions that reached the operational target, SECt0.5 was reported as the range between the SEC values calculated at the two sampling times, defining the t0.5 interval.
The theoretical anodic Al consumption predicted by Faraday’s law is calculated based on Equation (10):
where I is the current (A), t is the treatment time (s), M is the molar mass of aluminum, z is the number of electrons transferred in the anode reaction (z = 3), and F is the Faraday constant (96,485 C mol−1).
mAl,theor = (I × t × M)/zF,
The partial operating cost was calculated from the electrical energy consumption, measured Al electrode consumption, H2SO4 consumption for initial pH adjustment, and NaCl consumption, where applicable, using Equation (11) [35]:
where a is the unit price of electrical energy (0.1837 EUR kWh−1; [36]), b is the unit price of aluminum (3.10 EUR kg−1; [37]), c is the unit price of H2SO4 (0.5 EUR kg−1; [38]), and d is the unit price of NaCl (0.20 EUR kg−1; [39]). SEC is the specific electrical energy consumption (kWh m−3); CAl,exp is the measured total Al electrode consumption (kg m−3), CH2SO4 is the H2SO4 consumption used for initial pH adjustment (kg m−3), and CNaCl is the NaCl consumption (kg m−3).
OC = a × SEC + b × CAl,exp + c × CH2SO4 + d × CNaCl,
It should be mentioned that the electricity price was based on the EU average for non-household consumers in the second half of 2025 [36]. The aluminum price (3.10 EUR kg−1) was adopted as an indicative reference value based on LME spot prices reported for April-May 2026 [37]. The H2SO4 unit price was adopted as an indicative reference value applied to the mass of pure H2SO4 calculated from the 2 mol L−1 solution, considering the published commercial sulfuric acid price data [38]. The NaCl unit price was based on European industrial salt market data [39]. All unit prices were adopted as reference values rather than site-specific purchasing prices and were applied consistently across the investigated conditions.
In the salt-free experiments, electrode mass loss was measured only at 60-min, and the corresponding partial operating cost was calculated using the measured electrode consumption. For the conditions that reached the operational target, the partial operating cost at the first sampling time confirming the target attainment (the upper endpoint of the t0.5 interval) could not be directly calculated and was therefore expressed as a range defined by a lower (OC_L) and an upper (OC_U) limit. The two cost limits were calculated using Equation (11). The lower limit included the costs of electricity consumed up to this sampling time and H2SO4 used for initial pH adjustment. The upper limit additionally included the electrode cost calculated from the total anodic and cathodic mass loss measured at 60 min in the same experiment, assuming that the net electrode mass loss at the target confirmation did not exceed its 60-min value.
For the NaCl-added conditions, electrode mass loss was measured both at 60 min and in separate experiments (Section 2.2) stopped at the first sampling time confirming target attainment. The partial operating costs were calculated for both treatment endpoints using the corresponding measured electrode consumption. Therefore, the corresponding electrode consumption and partial operating cost refer to the first sampling time confirming target attainment, rather than to the exact target-crossing time.
The apparent Faradaic yield (ηF) of the sacrificial anodes was calculated by comparing the measured anodic mass loss with the theoretical value predicted by Faraday’s law, based on Equation (12) [40]:
where manode,exp is the measured anodic mass loss (g).
ηF = (manode,exp/mAl,theor) × 100,
2.5. Characterization of the Sludge and Electrodes
The sludge produced without and with NaCl addition after 60 min of electrocoagulation at an initial pH of 6 and a current density of 7.5 mA cm−2 was collected, separated from the liquid phase, and dried at room temperature before characterization. The floating foam was also collected from the corresponding 60-min experiment conducted without NaCl and dried in the same experimental conditions.
The morphologies of the sludge and aluminum electrode surfaces were examined using scanning electron microscopy (SEM), and the elemental composition was determined using energy-dispersive X-ray spectroscopy (EDS) with a TM4000Plus II microscope (Hitachi, Tokyo, Japan) equipped with a tungsten filament and an EDS detector (Oxford Instruments, Oxford, UK). SEM-EDS analyses were carried out at an accelerating voltage of 15 kV and a working distance of about 10 mm, on uncoated samples.
The functional groups of the sludge and floated foam were characterized by Fourier-transform infrared spectroscopy (FTIR) in the attenuated total reflectance mode, using a Bruker Vector 22 spectrometer (Bruker Optik GmbH, Ettlingen, Germany), over the 4000–400 cm−1 range.
3. Results
The analyzed real dairy wastewater batches showed considerable variability in their initial composition, with PO4-P concentrations of 12.07–18.60 mg P L−1, turbidity of 1536–3992 NTU, conductivity of 844–1571 µS cm−1, and unadjusted pH of 9.43–11.65 (Table 2).
Because successive wastewater batches were used in the EC experiments, the batch-to-batch differences in wastewater composition may also have influenced the treatment performance. This variability was considered when interpreting the influence of current density and initial pH on treatment performance.
Before the EC experiments, the wastewater pH was adjusted to 5, 6, or 7; unless otherwise stated, these values refer to the adjusted initial pH.
The influence of the initial pH and current density on PO4-P removal was first evaluated in relation to the study-defined operational target. The corresponding energy consumption, electrode consumption, and partial operating cost were then evaluated. The effect of NaCl addition was assessed separately. The generated solids were characterized by SEM-EDS and FTIR. The anode surfaces after EC treatment were also analyzed using SEM-EDS.
3.1. Influence of Current Density on Orthophosphate Removal
Figure 2 shows the temporal evolution of the residual orthophosphate concentration during electrocoagulation at initial pH values of 5, 6, and 7 and current densities of 2.9–10 mA cm−2. The corresponding target-crossing intervals (t0.5) obtained from the experimental sampling times are summarized in Figure 3.
Figure 2.
Temporal evolution of residual PO4-P concentration during electrocoagulation at initial pH values of 5 (a), 6 (b), and 7 (c) and different current densities (mA cm−2): 2.9 (-■-), 4.5 (-●-), 7.5 (-▲-), and 10 (-▼-). The horizontal dashed line indicates the study-defined operational target of 0.5 mg P L−1. The error bars represent the standard deviation of replicate experiments (n = 2).
Figure 3.
Target-crossing intervals t0.5 identified during Al electrocoagulation experiments at different initial pH values and current densities (n.r.—target not reached within 60 min).
Despite the batch-to-batch variability, higher current densities were generally associated with a faster decrease in residual PO4-P concentration within each initial-pH series (Figure 2). This trend is consistent with the increased rate of electrochemical Al release at higher current density and the formation of Al hydrolysis products and flocs involved in phosphate removal [22,24]. Small transient increases in the measured PO4-P concentration were observed at early treatment times in some experiments. These fluctuations may reflect the heterogeneity of the real wastewater matrix, including the possible effects of suspended or colloidal particles on orthophosphate determination [41]. However, they did not affect the overall removal trends.
The evolution of PO4-P removal efficiency during electrocoagulation time at different initial pH values and current densities is shown in Figure 4.
Figure 4.
Evolution of PO4-P removal efficiency during electrocoagulation at initial pH values of 5 (a), 6 (b), and 7 (c) and different current densities (mA cm−2): 2.9 (-■-), 4.5 (-●-), 7.5 (-▲-), and 10 (-▼-). The error bars represent the estimated standard deviation of removal efficiency.
At an initial pH of 5, the concentration of PO4-P decreased slightly at 2.9 mA cm−2, from 18.13 to 15.17 mg P L−1 during the first 30 min and remained above the operational target after 60 min (1.22 mg P L−1). At 4.5 mA cm−2, the concentration remained nearly unchanged during the first 15 min and then decreased to 4.04 mg P L−1 at 20 min and 0.18 mg P L−1 at 40 min. At 7.5 and 10 mA cm−2, the target was reached at shorter treatment times (Figure 3). At 30 min, the removal efficiency increased from 16.3% at 2.9 mA cm−2 to 89.3%, 98.1%, and 99.2% at 4.5, 7.5, and 10 mA cm−2, respectively (Figure 4a).
A similar behavior was observed for the experiments conducted at an initial pH of 6 (Figure 2b). During the first 20 min, the residual PO4-P concentrations remained relatively high at 2.9 and 4.5 mA cm−2, whereas a more pronounced decrease occurred at higher current densities. For example, at 7.5 mA cm−2, the concentration decreased from 10.97 mg P L−1 at 20 min to 1.22 mg P L−1 at 30 min and then to 0.24 mg P L−1 at 40 min. At 10 mA cm−2, it decreased to 5.67 mg P L−1 at 20 min and 0.14 mg P L−1 at 30 min. By 50 min, the removal efficiency ranged from 97.5% to 99.4% across all investigated current densities (Figure 4b). All investigated current densities reached the operational target within 60 min (Figure 3).
At an initial pH of 7, PO4-P removal varied markedly with the current density. After 60 min, the orthophosphate removal efficiency increased from 27.3% at 2.9 mA cm−2 to 63.2% and 90.1% at 4.5 and 7.5 mA cm−2, respectively (Figure 4c). At 10 mA cm−2, the PO4-P concentration decreased from 4.36 mg P L−1 at 20 min to 0.14 mg P L−1 at 30 min, corresponding to 99.0% removal, with t0.5 occurring within the 20–30 min interval (Figure 3). In these experimental conditions, only the experiment conducted at 10 mA cm−2 reached the operational target within 60 min. At lower current densities, the residual PO4-P concentration was still decreasing at the end of the experiment.
The effect of current density was assessed primarily by comparing the experiments conducted using the same wastewater batch (Table S2). For example, at pH 7, the experiments performed at 2.9 and 7.5 mA cm−2 were conducted using the same wastewater batch and had comparable initial PO4-P concentrations (17.93 and 18.60 mg P L−1). Therefore, the higher removal observed at 7.5 mA cm−2 cannot be explained by the differences in the initial orthophosphate concentration alone, suggesting that current density also influenced the treatment performance. Similar trends were observed when comparing other experiments performed on the same wastewater batch, particularly at pH 5 and pH 6, where higher current densities generally accelerated the PO4-P removal (Figure 2). At 10 mA cm−2, the experiments using wastewater batch B2 also showed that the target was attained earlier at pH 5 (10–15 min) than at pH 6 (20–30 min), although the initial PO4-P concentration was higher at pH 5 (16.39 versus 14.04 mg P L−1). This observation suggests that the initial pH influenced the treatment performance in the investigated conditions. For comparisons involving different batches, the variations in the initial PO4-P concentration and other wastewater characteristics may also have contributed to the observed differences in treatment performance.
Because the initial concentration of PO4-P varied among the experiments, the theoretical Faradaic Al:P molar ratio was also calculated as the ratio of the Al dose predicted by Faraday’s law to the initial amount of P in the wastewater (Table S1) [42]. For the conditions that reached the target, this ratio was generally higher at pH 6–7 than at pH 5.
This pH-dependent behavior is consistent with the reported influence of pH on the Al speciation and phosphate removal during electrocoagulation [21,42].
The bulk solution pH was monitored during treatment, and its evolution over time is presented in Figure S1 (Supplementary Materials). The bulk pH increased during electrocoagulation, and both the final pH and the magnitude of increase varied among the experimental conditions. This increase in pH is consistent with OH− generation during cathodic water reduction, while the measured bulk pH was further influenced by the hydrolysis and precipitation of Al species and by the buffering properties of the wastewater matrix [29,43]. Although the solution pH affects the Al hydrolysis and electrochemical behavior of Al electrodes [23], the final bulk pH was not consistently related to PO4-P removal in all investigated conditions. For example, in the initial-pH 7 series, the bulk pH reached 12.07 at 4.5 mA cm−2 and 11.59 at 10 mA cm−2 after 60 min, while the corresponding PO4-P removal efficiencies were 63.2% and 99.7%, respectively. These results indicate that PO4-P removal depends not only on the bulk pH but also on the formation and speciation of Al species and their interactions with phosphate and other constituents of the wastewater matrix [24]. The elevated final pH values observed in some operating conditions exceeded the upper limit of the 6.5–8.5 range specified by Romanian regulations for wastewater discharge into natural receiving waters and sewer systems [44]. Thus, even when substantial PO4-P removal was achieved, a subsequent pH adjustment would be necessary before the direct discharge under these conditions.
Turbidity removal was high in most operating conditions, as shown in Table S2 (Supplementary Materials). At an initial pH of 5, the turbidity decreased to 5.6–54.5 NTU, corresponding to removal efficiencies of 98.6–99.8%. At an initial pH of 6, turbidity removal exceeded 99.7% at all investigated current densities. The experiments conducted at an initial pH of 7 showed a greater variability, with turbidity removal efficiencies of 15.8%, 99.5%, 88.8%, and 99.7% at current densities of 2.9, 4.5, 7.5, and 10 mA cm−2, respectively.
In most experiments, the turbidity and PO4-P removal followed similar trends. However, high turbidity removal did not always correspond to high PO4-P removal. This discrepancy was particularly evident at an initial pH of 7 and a current density of 4.5 mA cm−2, where turbidity removal reached 99.5%, whereas PO4-P removal was only 63.2%. This behavior can be attributed to the distinct removal mechanisms involved. The turbidity decrease is mainly associated with the destabilization, aggregation, and subsequent separation of suspended particles, whereas the phosphate removal with Al electrodes was generally attributed to its adsorption onto and/or incorporation into Al hydroxide flocs, and may also involve the formation of Al-P-containing precipitates [22,24].
The results demonstrated that electrocoagulation can substantially reduce both orthophosphate and turbidity in real dairy wastewater, despite the batch-to-batch variability in wastewater composition. However, the treatment performance varied with the initial pH and current densities. Within each initial-pH series, the increases in the current density generally enhanced the orthophosphate removal and reduced the time required to reach the study-defined target of 0.5 mg P L−1.
3.2. Energy Consumption, Electrode Dissolution, and Partial Operating Costs
The practical applicability of electrocoagulation depends not only on pollutant removal efficiency but also on the electrical energy and electrode material required to achieve the treatment objective. Electrical energy and electrode consumption are major cost components and were therefore evaluated alongside with PO4-P removal. Other cost elements commonly considered in wastewater treatment cost assessments [35,45,46], including mixing energy, sludge management, labor, maintenance, and capital costs, were not included. Therefore, the reported values represent partial operating costs. These partial operating costs allow comparison of the investigated conditions based on the cost components included in the assessment, but do not represent the total cost of full-scale treatment. At larger scale, sludge handling and maintenance requirements may also vary with the operating conditions, while labor and capital costs depend on plant design and treatment capacity. The cost differences observed between operating conditions may therefore change when these additional expenses are considered at full scale.
The specific energy consumption (SEC) was calculated using Equation (9) at the fixed 60-min treatment endpoint (SEC60min) and, for conditions that reached the operational target, at the two sampling times defining the t0.5 interval (SECt0.5), as defined in Section 2.4.
Table 3 summarizes the specific energy consumption, electrode mass loss, and partial operating costs obtained during salt-free electrocoagulation experiments. Figure 5 shows the distribution of the total electricity cost over the 60-min treatment period relative to the target-crossing interval.
Table 3.
Energy consumption, electrode mass loss, and partial operating cost for the salt-free electrocoagulation experiments at different initial pH values and current densities. Partial operating costs are reported at 60 min and as calculated ranges (OC_L–OC_U) at target confirmation.
Figure 5.
Electrical energy cost as a function of the current density at the initial pH values of 5 (a), 6 (b), and 7 (c). (Percentages indicate the fraction of the total electricity cost consumed after the first sampling point meeting the target).
As shown in Table 3, SEC60min increased with current density in all three initial-pH series ranging from 1.65 to 18.08 kWh m−3. Thus, increasing the current density from 2.9 to 10 mA cm−2 increased the values of specific energy consumption by factors of 7.3–10.0, depending on the initial-pH series. This increase was attributed to the combined effects of the higher applied current and the associated increase in the mean cell voltage during electrocoagulation (Table 3), consistent with previous observations reported for phosphate removal using Al electrodes [22].
However, the SECt0.5 values did not increase consistently with the current density. At an initial pH of 6, the corresponding SECt0.5 values increased from 1.35–1.84 kWh m−3 at 2.9 mA cm−2 to 5.92–8.94 kWh m−3 at 10 mA cm−2, despite the earlier target attainment at higher current density. At pH 5, SECt0.5 did not vary monotonically with current density; notably, it decreased from 3.14–4.94 kWh m−3 at 7.5 mA cm−2 to 1.84–2.81 kWh m−3 at 10 mA cm−2. The lower SECt0.5 values at 10 mA cm−2 were associated with an earlier t0.5 interval (10–15 min) than at 7.5 mA cm−2 (20–30 min), resulting in lower energy consumption up to target confirmation despite the higher current density.
For the experiments that reached the target, continuing electrolysis for the entire 60-min treatment period increased the specific energy consumption to 2.46–18.08 kWh m−3. As shown in Figure 5, the additional energy consumed by continuing electrolysis after the first sampling point at which the residual PO4-P concentration decreased below 0.5 mg P L−1 accounted for 19–81% of the total electrical energy consumed during the 60-min treatment period. The large variation in this fraction indicates that the energy consumption estimated for a fixed treatment period does not necessarily reflect the energy required to achieve the same residual PO4-P concentration in different operating conditions.
The total measured electrode mass loss ranged from approximately 0.13 to 0.53 kg Al m−3, whereas the apparent anodic Faradaic yields ranged from 76.8% to 131.1% (Table 3).
The supra-Faradaic dissolution observed in several experiments, particularly at pH 6 and 7, suggests that the measured anodic mass loss was not exclusively associated with Faradaic dissolution and may include additional chemical dissolution of Al, as previously reported during electrocoagulation [21,26]. In contrast, ηF values below 100% may reflect partial inhibition of anodic dissolution by surface passivation or competing electrochemical reactions [12,47]. The cathodic mass loss accounted for 3.4–43.4% of the total electrode loss. Similar cathodic Al dissolution under locally alkaline conditions has been previously reported during Al electrocoagulation [48,49]. This behavior has been attributed to OH− generation during water reduction at the cathode, which increases the local pH at the electrode surface and can promote additional chemical dissolution of Al.
The partial operating cost, including electrical energy, total measured electrode consumption, and H2SO4 used for initial pH adjustment, ranged from 0.77 to 4.71 EUR m−3 after the 60-min treatment period (Table 3). At 2.9 mA cm−2, electrode consumption and electricity were the main cost components, accounting for 42–56% and 31–47% of the total cost, respectively, while the H2SO4 consumption contributed by 4–22%. At 7.5–10 mA cm−2, the electrical energy dominated the cost (61–74%), followed by electrode consumption (20–37%), with a smaller contribution from H2SO4 (1–7%). Thus, the increase in the partial operating cost at a higher current density was primarily due to the significant increase in electrical energy consumption.
In addition to the 60-min cost assessment, the partial operating costs for the eight salt-free conditions that reached the operational target were also evaluated as ranges (OC_L–OC_U) for the first sampling time at which the residual PO4-P concentration decreased below 0.5 mg P L−1 (Table 3). The electricity cost up to this time ranged from 0.34 to 1.64 EUR m−3, while the H2SO4 cost remained unchanged from the 60-min calculation; together, these components define OC_L. As electrode mass loss was measured only at 60 min, OC_U was calculated by adding the corresponding 60-min electrode cost (0.40–1.64 EUR m−3) to OC_L (Section 2.4). For all eight conditions, OC_U was 0.11–2.24 EUR m−3 (approximately 10–60%) lower than the corresponding partial operating cost at 60 min. This difference represents the additional electricity cost generated after the target confirmation (Figure 5). It should also be mentioned that any reduction in the anodic and cathodic electrode consumption associated with shorter treatment times might represent an additional potential cost–benefit.
At an initial pH of 6, for which all experiments were performed with the same wastewater batch, the electricity cost up to target confirmation increased with current density from 0.34 EUR m−3 at 2.9 mA cm−2 to 1.64 EUR m−3 at 10 mA cm−2, although the target-crossing interval shifted to earlier treatment times (40–50 versus 20–30 min). Both OC_L and OC_U increased with current density, and the calculated cost ranges did not overlap between 2.9 and 7.5–10 mA cm−2 or between 4.5 and 10 mA cm−2. At pH 5, increasing current density from 4.5 to 7.5 mA cm−2 in experiments using the same wastewater batch increased the electricity cost up to target confirmation from 0.44 to 0.91 EUR m−3, while the H2SO4 cost remained rather unchanged. Consequently, the calculated cost range at 7.5 mA cm−2 was higher, with no overlap between the two ranges, despite the earlier target-crossing interval (20–30 versus 30–40 min). At 10 mA cm−2 (different wastewater batch, B2), the electricity cost was lower (0.52 EUR m−3), and its calculated cost range overlapped with both lower-current-density conditions. At pH 7, the target was reached only at 10 mA cm−2.
In the investigated conditions, the results suggest that an earlier target attainment did not necessarily correspond to lower calculated partial operating costs. This finding is consistent with previous studies on phosphate electrocoagulation, which reported faster phosphate removal but higher electrical energy consumption at increased current densities [20,22].
3.3. Effect of NaCl Addition as a Supporting Electrolyte
In an attempt to reduce the electrical energy consumption associated with the relatively high cell voltages observed in the experiments without added NaCl, an additional set of experiments was conducted with NaCl as a supporting electrolyte [50]. In chloride-containing solutions, the Cl− ions can promote breakdown of the passive oxide film on the Al anode, thereby facilitating Al dissolution and helping to maintain electrode activity at lower cell voltages [23].
The conductivity of the real dairy wastewater was adjusted to approximately 4000 µS cm−1 by NaCl addition, while the current density was maintained at 7.5 mA cm−2. This current density was selected based on the results of the salt-free experiments. At 7.5 mA cm−2, the operational target of 0.5 mg P L−1 was reached at initial pH values of 5 and 6, while at pH 7, the PO4-P removal efficiency reached 90.1% after 60 min, and the residual concentration continued to decrease. Moreover, the salt-free experiments at 7.5 mA cm−2 had relatively high mean cell voltages, ranging from 13.6 to 17.6 V, providing a suitable basis for assessing the effect of increased conductivity on the cell voltage and electrical energy consumption.
The effect of the treatment time on the residual PO4-P concentration and removal efficiency at the three initial pH values is shown in Figure 6.
Figure 6.
Effect of treatment time on the residual PO4-P concentration (left axis, solid symbols) and on the PO4-P removal efficiency (right axis, open symbols) during the electrocoagulation of real dairy wastewater with Al electrodes at 7.5 mA cm−2 and initial pH values of 5 (■), 6 (●), and 7 (▲), after conductivity enhancement to 4000 µS cm−1 by NaCl addition. The horizontal dashed line indicates the operational target of 0.5 mg P L−1. The error bars represent the standard deviation of replicate experiments (n = 2).
In all three experiments performed using the same wastewater batch, the residual orthophosphate concentration decreased below the operational target of 0.5 mg P L−1 within the 60-min treatment period, with final removal efficiencies of 99.7%, 99.6%, and 98.9%, respectively. The corresponding t0.5 intervals were 20–25, 25–30, and 40–50 min at initial pH values of 5, 6, and 7, suggesting that the target attainment was slower at pH 7 in the investigated conditions.
During Al electrocoagulation, phosphate removal may involve the formation of Al-P-containing phases together with adsorption onto and/or incorporation into Al hydroxide flocs; the relative contributions of these removal pathways may vary with pH and Al speciation [21,22,43]. In the present study, the measured bulk pH varied throughout the treatment period (Figure S2), suggesting that the relative contributions of these pathways may have changed over time.
Compared with the salt-free electrocoagulation conducted at the same current density, the NaCl addition shortened the time required to reach the operational target and improved PO4-P removal, with the strongest effect observed at an initial pH of 7. For the experiments conducted at initial pH values of 5 and 6, the NaCl addition slightly reduced the t0.5 intervals to 20–25 min and 25–30 min, respectively, while PO4-P removal after 60 min remained high.
At an initial pH of 7, NaCl addition reduced the residual PO4-P concentration below 0.5 mg P L−1 within 40–50 min, whereas it remained above this target after 60 min in the absence of NaCl. At the end of the 60-min treatment period, the PO4-P removal efficiency increased from 90.1% to 98.9%, whereas the final turbidity decreased from 221 to 5.21 NTU.
The effect of NaCl addition on the specific energy consumption, measured electrode mass loss, and partial operating cost was further evaluated by comparing the salt-free and NaCl-added experiments at the same current density over a 60-min treatment period (Figure 7).
Figure 7.
Specific energy consumption at the 60 min treatment period (a), total electrode mass loss (b), and partial operating cost at 60 min (c) for the electrocoagulation of real dairy wastewater at j = 7.5 mA cm−2 and different initial pH values, without and with NaCl addition.
As shown in Figure 7a, the addition of NaCl markedly reduced the specific energy consumption of the electrocoagulation process. The mean cell voltage decreased from 13.6–17.6 V in the salt-free experiments to about 4 V after NaCl addition, while the SEC60min values decreased by 69–76%. In contrast, the total electrode mass loss was higher at the initial pH values of 5 and 7 and remained similar at pH 6 compared with the corresponding salt-free experiments (Figure 7b). The apparent anodic Faradaic yields after 60 min were 115.7, 122.1, and 117.2% at initial pH values of 5, 6, and 7, respectively. At an initial pH of 5, ηF increased from 78.8% in the salt-free experiment to 115.7% after NaCl addition. This increase may be associated with chloride-induced breakdown of the passive Al surface and the resulting enhancement of localized anodic dissolution [51,52]. At initial pH values of 6 and 7, the salt-free experiments already exhibited super-Faradaic behavior, and the changes observed after the addition of NaCl were smaller.
Over the 60 min treatment period, the NaCl addition reduced the partial operating cost at all tested initial pH values compared with the corresponding salt-free experiments conducted at 7.5 mA cm−2 (Figure 7c). The partial operating cost decreased by approximately 24–39%, primarily because of the marked reduction in electrical energy consumption. In the investigated conditions, in the NaCl-added experiments, Al electrode consumption accounted for approximately 52–56% of the partial operating cost, followed by electricity (24–25%), NaCl (16–17%), and H2SO4 used for initial pH adjustment (2–8%).
Because the operational PO4-P target was reached before 60 min in all NaCl-added experiments, the corresponding target-related parameters were also evaluated (Table 4).
Table 4.
Target-related specific energy consumption, electrode mass loss, and partial operating cost for NaCl-added electrocoagulation (j = 7.5 mA cm−2, 4000 µS cm−1).
The partial operating cost associated with target attainment increased from 1.16 EUR m−3 at pH 5 to 1.64 EUR m−3 at pH 7. The higher cost at pH 7 coincided with the longer treatment time and greater electrode mass loss required to reach the target. Thus, among the tested conditions with NaCl addition, an initial pH of 5 provided the lowest partial operating cost at target attainment.
In addition to orthophosphate removal, substantial clarification of the real dairy wastewater was achieved in experiments with NaCl addition. The residual turbidity decreased to 12.5, 9.41, and 5.21 NTU at initial pH values of 5, 6, and 7, respectively, corresponding to turbidity removal efficiencies of 99.5–99.7% (Table S3 in the Supplementary Materials). The largest difference between the salt-free and NaCl-added EC experiments was observed at an initial pH of 7, where the residual turbidity decreased from 221 to 5.21 NTU, corresponding to removal efficiencies of 88.8% and 99.7%, respectively.
Among the salt-free conditions that reached the operational target within 60 min, the lowest 60-min partial operating cost was observed at an initial pH of 6 and a current density of 2.9 mA cm−2. In these conditions, the PO4-P target was reached within the 40–50 min interval, and the partial operating cost was 0.96 EUR m−3 at 60 min.
The effect of NaCl addition was most pronounced at an initial pH of 7. At 7.5 mA cm−2, the residual PO4-P concentration remained above 0.5 mg P L−1 after 60 min without NaCl but decreased below this value within 40–50 min after NaCl addition, while the 60-min partial operating cost decreased from 2.48 to 1.87 EUR m−3.
3.4. Characterization of Electrocoagulation Sludge and Floated Foam
3.4.1. SEM-EDS Analysis
Scanning electron microscopy (SEM) was further used to examine the surface morphology of the sludges recovered after electrocoagulation processes, while energy-dispersive X-ray spectroscopy (EDS) provided information on their elemental composition.
As shown in Figure 8a, the sludge obtained in the absence of NaCl exhibited a heterogeneous morphology consisting of irregular, relatively coarse agglomerates with rough surfaces and pronounced interparticle voids. This porous and interconnected structure is consistent with the formation of aggregated Al-containing solids during electrocoagulation [12,53]. In the sludge produced with NaCl (Figure 8b), the surface appeared more compact and comparatively homogeneous, with a smoother matrix and a finer distribution of pores. These observations suggest that NaCl addition was associated with changes in particle aggregation and the structural organization of the electrocoagulation solids. The observed morphological difference may reflect the higher ionic strength resulting from NaCl addition, which can compress the electrical double layer, reduce electrostatic repulsion between particles, and promote aggregation [54,55].
Figure 8.
SEM micrographs (backscattered electrons) of the electrocoagulation sludge produced from dairy effluents without (a) and with NaCl (b), after 60 min of treatment at an initial pH of 6 and j = 7.5 mA cm−2.
The elemental composition of the electrocoagulation sludges determined by EDS analysis is summarized in Table 5.
Table 5.
Elemental composition (at.%) of the electrocoagulation sludges produced from real dairy wastewater without and with NaCl addition.
Carbon and oxygen were the dominant elements detected in both sludges. Among the metallic elements, aluminum was predominant, with mean contents of 5.94 ± 2.22 at.% without NaCl and 6.72 ± 0.97 at.% with NaCl, respectively. The presence of Al in both sludges is consistent with the incorporation of Al-containing coagulation products into the generated solids. Carbon was likely associated with the organic constituents retained from the wastewater during treatment.
The sludge obtained in the presence of NaCl exhibited a higher mean P content than the sludge produced without NaCl (0.57 ± 0.04 vs. 0.34 ± 0.17 at.%, respectively) and a lower variability among the analyzed areas. Nitrogen also showed a lower variability in the sludge produced with NaCl. In contrast, it was detected only sporadically in the sludge produced without NaCl. As expected, the Na and Cl contents were also higher in the sludge produced with NaCl.
The EDS results indicate that NaCl addition was associated with differences in sludge composition, particularly a higher mean P content and lower variability in P content across the analyzed areas. To obtain complementary information on the chemical functionalities present in the generated solids, the samples were subsequently characterized by FTIR spectroscopy.
3.4.2. FTIR Characterization of the Sludge and Floated Foam
The FTIR spectra of the electrocoagulation sludges generated in the absence and presence of NaCl, together with the spectrum of the floated foam, are shown in Figure 9.
Figure 9.
FTIR spectra of the electrocoagulation sludges generated in the absence (a) and presence of NaCl (b) and of the floated foam generated without NaCl (c) obtained after 60 min of electrocoagulation of real dairy wastewater (initial pH = 6; j = 7.5 mA cm−2).
The bands at 1042–1054 cm−1 may be assigned to P-O stretching vibrations of phosphate overlapping with C-O/C-O-C contributions from organic constituents [47,56,57], while the bands at 520–553 cm−1 could include the overlapping O-P-O/Al-O and Al-OH-related vibrations [47,56]. The broad band at 3281–3341 cm−1 was attributed to O-H stretching of the hydroxylated species and adsorbed water. The signal at 1636–1644 cm−1 may include contributions from both H-O-H bending and amide I vibrations.
Together with the detection of P and Al by EDS, these spectral features provide qualitative evidence consistent with the phosphate retention in the electrocoagulation solids. These findings support the involvement of Al-containing coagulation products in phosphate removal, but do not allow the individual contributions of the different removal pathways to be distinguished.
The spectra contained bands consistent with lipid- and protein-derived organic constituents, including the aliphatic C-H stretching bands at 2840 and 2908 cm−1, the ester C=O band at 1734–1736 cm−1, the CH2/CH3 deformation bands near 1461 and 1374 cm−1, the amide I contribution near 1636 cm−1, and the amide II band near 1535 cm−1 [58]. The bands near 1570 and 1408 cm−1 were consistent with asymmetric and symmetric carboxylate stretching, although contributions from protein-related vibrations may overlap in this spectral region. These signals indicate the retention of lipid- and protein-derived compounds within the electrocoagulation solids.
When NaCl was added as supporting electrolyte, the P-O maximum shifted from 1054 to 1042 cm−1 and the O-P-O/Al-O band from 520 to 538 cm−1 while no additional bands were observed in the NaCl-containing spectrum (Figure 9b). These spectral shifts may reflect changes in the local environment of phosphate-containing species within the electrogenerated solids.
The foam contained several bands associated with lipid-derived constituents. In addition to the ester C=O band at 1736 cm−1, its spectrum (Figure 9c) contained bands at 1156 and 1106 cm−1 assigned to C-O/C-O-C stretching vibrations, which may include contributions from ester and carbohydrate constituents, a CH3 deformation band at 1374 cm−1, and a band at 717 cm−1 consistent with CH2 rocking of long aliphatic chains [59].
The presence of the ester C=O, aliphatic C-H, and long-chain CH2-related bands is consistent with a substantial contribution of lipid-derived organic matter to the floated fraction. Nevertheless, phosphate-, amide- and Al-O-related bands remained detectable in the foam, indicating a mixed organic and inorganic fraction rather than a purely lipidic foam.
3.5. Characterization of the Al Anode Surface
SEM-EDS analysis was further used to compare the morphology and local elemental composition of the Al anodes after EC treatment in the absence and presence of added NaCl. Representative SEM micrographs of the anodes recovered after EC treatment of real dairy wastewater are shown in Figure 10. A micrograph of the polished Al electrode is also included in Figure 10.
Figure 10.
SEM micrographs of the polished Al electrode (a) and Al anodes after 60 min of EC treatment of real dairy wastewater without added NaCl (b) and with NaCl addition (c) (initial pH = 6; j = 7.5 mA cm−2).
The polished Al electrode exhibited grinding striations associated with surface preparation, together with some isolated bright-contrast features (Figure 10a). As expected, the EDS analysis confirmed an Al-rich surface, with Al and O as the major detected elements (Table 6). The presence of O is consistent with the native surface oxide expected on Al exposed to air. The bright particle was enriched in Fe and Si and is consistent with an Al–Fe–Si intermetallic constituent of the commercial-grade alloy.
Table 6.
EDS-derived elemental compositions (at.%) of representative Al-rich surface regions and compositionally distinct localized regions on the polished Al electrode and post-EC Al anodes obtained without and with NaCl addition.
In the absence of added NaCl, the anode surface was strongly heterogeneous and irregular, with cavities and numerous angular, terraced, and faceted features distributed over most of the observed area (Figure 10b). This morphology suggests a spatially non-uniform anodic dissolution. As shown in Figure 10c, in the presence of NaCl, the morphology changed markedly; the anodic surface exhibited larger and relatively smooth coalesced domains containing rounded depressions, while roughened and faceted features were observed in more localized regions.
The morphology observed after NaCl addition is consistent with the localized anodic dissolution and pitting reported for Al electrodes in chloride-containing electrocoagulation systems [60,61,62].
The representative Al-rich regions of the two post-EC anodes showed similar mean elemental compositions, whereas compositionally distinct localized regions were identified on both surfaces (Table 6). On the anode surface exposed to wastewater without added NaCl, localized Fe- and Fe-Si-enriched regions were detected. Fe reached 3.43 at.% in one region, while a separate region contained 2.35 at.% Fe and 5.27 at.% Si. A strongly Al-rich region was also observed, containing 98.14 at.% Al and O was not detected by EDS. By contrast, in the presence of added NaCl, the localized compositional variations were mainly associated with O enrichment, with selected regions containing 19.88–23.44 at.% O. No Fe-rich regions comparable to those detected on the anode operated without added NaCl were identified among the analyzed spots.
SEM-EDS analysis revealed that NaCl addition altered the morphology and spatial distribution of the anodic surface attack as well as the composition of localized surface regions, while the representative Al-rich regions remained broadly similar in composition.
4. Conclusions
Aluminum electrocoagulation substantially reduced the orthophosphate concentration and turbidity in dairy wastewater, despite the variability of the initial wastewater composition. The treatment performance was influenced by the initial pH and current density.
The use of a study-defined residual PO4-P target of 0.5 mg P L−1 revealed important differences in the treatment time and energy required to achieve the same residual concentration across the investigated operating conditions. In the absence of NaCl, the target was reached at current densities ≥4.5 mA cm−2 at pH 5, at all investigated current densities at pH 6, and only at 10 mA cm−2 at pH 7. Higher current density generally reduced the time to target but increased the energy consumption and the 60-min partial operating cost. In the target-achieving conditions, 19–81% of the electrical energy consumed during 60 min treatment period was used after the first sampling time confirming target attainment.
At 7.5 mA cm−2, the increase in wastewater conductivity to approximately 4000 µS cm−1 by NaCl addition reduced the 60-min specific energy consumption by 69–76% and the partial operating cost by 24–39% relative to the salt-free experiments. However, the electrode mass loss remained similar or increased, making Al consumption the largest component of the 60-min partial operating cost in the investigated conditions.
With NaCl addition, the PO4-P target was reached at 25–50 min, with partial operating costs of 1.16–1.64 EUR m−3. The effect was most evident at pH 7, where for the same wastewater batch and applied current density, the target was not attained within 60 min without NaCl.
Turbidity removal exceeded 98% in most experiments. SEM-EDS analysis showed that the sludge generated with NaCl had a more compact and homogeneous morphology. EDS detected phosphorus in the Al-containing solids, while FTIR provided complementary qualitative evidence consistent with phosphate retention in the electrocoagulation solids. In the presence of NaCl, the post-treatment anodes exhibited more localized dissolution features, consistent with chloride-promoted pitting.
The study was limited to laboratory-scale batch experiments using wastewater collected from a single dairy facility. Because successive wastewater batches were used, some of the observed differences in treatment performance may also reflect variations in wastewater composition. However, such variability is characteristic of real dairy wastewater under practical operating conditions. The partial operating cost assessment provided a basis for comparing the investigated conditions, although it did not account for all costs associated with full-scale treatment. Future studies should extend the evaluation to continuous-flow and larger-scale systems, considering wastewater variability, total phosphorus removal, final effluent quality after pH correction, and the overall techno-economic performance of the process.
Supplementary Materials
The following supporting information can be downloaded at https://www.mdpi.com/article/10.3390/cleantechnol8060196/s1. Table S1: Target-based normalized electrochemical indicators for salt-free aluminum electrocoagulation; Figure S1: Evolution of the bulk solution pH during electrocoagulation at initial pH values of 5 (a), 6 (b), and 7 (c) and different current densities (mA cm−2): 2.9 (-■-), 4.5 (-●-), 7.5 (-▲-) and 10 (-▼-); Table S2: Initial orthophosphate concentration of the real dairy wastewater used in the electrocoagulation experiments, the turbidity removal and conductivity changes during the treatment in the investigated operating conditions; Figure S2: Evolution of the bulk solution pH during NaCl-added electrocoagulation at initial pH values of 5 (-■-), 6 (-●-), and 7 (-▲-) and j = 7.5 mA cm−2; Table S3: Influence of NaCl addition on the turbidity removal during electrocoagulation of the real dairy wastewater (batch B4) at j = 7.5 mA cm−2.
Author Contributions
Conceptualization, S.V.; methodology, S.V.; validation, S.V., A.M.S. and G.E.D.; formal analysis, G.E.D., A.M.S. and S.V.; investigation, G.E.D., A.M.S. and S.V.; resources, S.V.; data curation, G.E.D., A.M.S. and S.V.; writing—original draft preparation, G.E.D., A.M.S. and S.V.; writing—review and editing, G.E.D., A.M.S. and S.V.; visualization, S.V.; supervision, S.V. All authors have read and agreed to the published version of the manuscript.
Funding
This research was financially supported by the Scientific Performance Scholarship awarded to one of the authors (A.M. Suciu) by the “1 Decembrie 1918” University of Alba Iulia.
Data Availability Statement
The original contributions presented in this study are included in the article/Supplementary Materials. The raw data supporting the conclusions of this article will be made available by the authors on request.
Acknowledgments
The authors thank Luiza Gaina from Babeș-Bolyai University of Cluj-Napoca (Romania) for the FTIR analysis.
Conflicts of Interest
The authors declare no conflicts of interest.
Abbreviations
The following abbreviations are used in this manuscript:
| SEC | Specific energy consumption |
| EC | Electrocoagulation |
References
- Slavov, A.K. General Characteristics and Treatment Possibilities of Dairy Wastewater—A Review. Food Technol. Biotechnol. 2017, 55, 14–28. [Google Scholar] [CrossRef] [Scilit] [PubMed]
- Bazrafshan, E.; Moein, H.; Kord Mostafapour, F.; Nakhaie, S. Application of Electrocoagulation Process for Dairy Wastewater Treatment. J. Chem. 2013, 2013, 640139. [Google Scholar] [CrossRef] [Scilit]
- Şengil, I.A.; Özacar, M. Treatment of Dairy Wastewaters by Electrocoagulation Using Mild Steel Electrodes. J. Hazard. Mater. 2006, 137, 1197–1205. [Google Scholar] [CrossRef] [Scilit] [PubMed]
- Bassala, H.D.; Dedzo, G.K.; Bememba, C.B.N.; Seumo, P.M.T.; Dazie, J.D.; Nanseu-Njiki, C.P.; Ngameni, E. Investigation of the Efficiency of a Designed Electrocoagulation Reactor: Application for Dairy Effluent Treatment. Process Saf. Environ. Prot. 2017, 111, 122–127. [Google Scholar] [CrossRef] [Scilit]
- Tabelini, D.B.; Lima, J.P.P.; Borges, A.C.; Aguiar, A. A Review on the Characteristics and Methods of Dairy Industry Wastewater Treatment in the State of Minas Gerais, Brazil. J. Water Process Eng. 2023, 53, 103779. [Google Scholar] [CrossRef] [Scilit]
- Pant, K.J.; Cotter, P.D.; Wilkinson, M.G.; Sheehan, J.J. Towards Sustainable Cleaning-in-Place (CIP) in Dairy Processing: Exploring Enzyme-Based Approaches to Cleaning in the Cheese Industry. Compr. Rev. Food Sci. Food Saf. 2023, 22, 3602–3619. [Google Scholar] [CrossRef] [Scilit] [PubMed]
- Stasinakis, A.S.; Charalambous, P.; Vyrides, I. Dairy Wastewater Management in EU: Produced Amounts, Existing Legislation, Applied Treatment Processes and Future Challenges. J. Environ. Manag. 2022, 303, 114152. [Google Scholar] [CrossRef] [Scilit] [PubMed]
- Guillen-Jimenez, E.; Alvarez-Mateos, P.; Romero-Guzman, F.; Pereda-Marin, J. Bio-Mineralization of Organic Matter in Dairy Wastewater, as Affected by pH. The Evolution of Ammonium and Phosphates. Water Res. 2000, 34, 1215–1224. [Google Scholar] [CrossRef] [Scilit]
- Owodunni, A.A.; Ismail, S.; Kurniawan, S.B.; Ahmad, A.; Imron, M.F.; Abdullah, S.R.S. A Review on Revolutionary Technique for Phosphate Removal in Wastewater Using Green Coagulant. J. Water Process Eng. 2023, 52, 103573. [Google Scholar] [CrossRef] [Scilit]
- Jindakaew, J.; Khizar, S.; Kaewsaneha, C.; Ratanatawanate, C.; Opaprakasit, M.; Errachid, A.; Opaprakasit, P.; Elaissari, A. Advances in Functional Materials for Effective Removal of Orthophosphate from Aquatic Environments. J. Taiwan Inst. Chem. Eng. 2026, 184, 106285. [Google Scholar] [CrossRef] [Scilit]
- Reza, A.; Haller, S.; Mao, X. Electrocoagulation as a Remedial Approach for Phosphorus Removal from Onsite Wastewater: A Review. Water 2024, 16, 3206. [Google Scholar] [CrossRef] [Scilit]
- Hu, Q.; He, L.; Lan, R.; Feng, C.; Pei, X. Recent Advances in Phosphate Removal from Municipal Wastewater by Electrocoagulation Process: A Review. Sep. Purif. Technol. 2023, 308, 122944. [Google Scholar] [CrossRef] [Scilit]
- Wang, Y.; Kuntke, P.; Saakes, M.; van der Weijden, R.D.; Buisman, C.J.N.; Lei, Y. Electrochemically Mediated Precipitation of Phosphate Minerals for Phosphorus Removal and Recovery: Progress and Perspective. Water Res. 2022, 209, 117891. [Google Scholar] [CrossRef] [Scilit] [PubMed]
- Mollah, M.Y.A.; Schennach, R.; Parga, J.R.; Cocke, D.L. Electrocoagulation (EC)—Science and Applications. J. Hazard. Mater. 2001, 84, 29–41. [Google Scholar] [CrossRef] [Scilit] [PubMed]
- Jing, G.; Ren, S.; Pooley, S.; Sun, W.; Kowalczuk, P.B.; Gao, Z. Electrocoagulation for Industrial Wastewater Treatment: An Updated Review. Environ. Sci. Water Res. Technol. 2021, 7, 1177–1196. [Google Scholar] [CrossRef] [Scilit]
- Tegladza, I.D.; Xu, Q.; Xu, K.; Lv, G.; Lu, J. Electrocoagulation Processes: A General Review about Role of Electro-Generated Flocs in Pollutant Removal. Process Saf. Environ. Prot. 2021, 146, 169–189. [Google Scholar] [CrossRef] [Scilit]
- Ibrahim, A.A.; Oladipo, A.A.; Gazi, M. Electrochemical-Based and Hybrid Technologies: Remediation Strategies and Resource Recovery from Dairy Wastewater. ACS ES T Water 2025, 5, 2041–2069. [Google Scholar] [CrossRef] [Scilit]
- Mollah, M.Y.A.; Morkovsky, P.; Gomes, J.A.G.; Kesmez, M.; Parga, J.; Cocke, D.L. Fundamentals, Present and Future Perspectives of Electrocoagulation. J. Hazard. Mater. 2004, 114, 199–210. [Google Scholar] [CrossRef] [Scilit] [PubMed]
- Behbahani, M.; Moghaddam, A.; Arami, M. A Comparison Between Aluminum and Iron Electrodes on Removal of Phosphate from Aqueous Solutions by Electrocoagulation Process. Int. J. Environ. Res. 2011, 5, 403–412. [Google Scholar] [CrossRef] [Scilit]
- Irdemez, Ş.; Demircioǧlu, N.; Yildiz, Y.Ş.; Bingül, Z. The Effects of Current Density and Phosphate Concentration on Phosphate Removal from Wastewater by Electrocoagulation Using Aluminum and Iron Plate Electrodes. Sep. Purif. Technol. 2006, 52, 218–223. [Google Scholar] [CrossRef] [Scilit]
- Lacasa, E.; Cañizares, P.; Sáez, C.; Fernández, F.J.; Rodrigo, M.A. Electrochemical Phosphates Removal Using Iron and Aluminium Electrodes. Chem. Eng. J. 2011, 172, 137–143. [Google Scholar] [CrossRef] [Scilit]
- Attour, A.; Touati, M.; Tlili, M.; Ben Amor, M.; Lapicque, F.; Leclerc, J.P. Influence of Operating Parameters on Phosphate Removal from Water by Electrocoagulation Using Aluminum Electrodes. Sep. Purif. Technol. 2014, 123, 124–129. [Google Scholar] [CrossRef] [Scilit]
- Mouedhen, G.; Feki, M.; Wery, M.D.P.; Ayedi, H.F. Behavior of Aluminum Electrodes in Electrocoagulation Process. J. Hazard. Mater. 2008, 150, 124–135. [Google Scholar] [CrossRef] [Scilit] [PubMed]
- Tibebe, D.; Kassa, Y.; Bhaskarwar, A.N. Treatment and Characterization of Phosphorus from Synthetic Wastewater Using Aluminum Plate Electrodes in the Electrocoagulation Process. BMC Chem. 2019, 13, 107. [Google Scholar] [CrossRef] [Scilit] [PubMed]
- de Barros, I.R.; Benincá, C.; Zanoelo, E.F. Kinetics of the Precipitation Reaction between Aluminium and Contaminant Orthophosphate Ions. Environ. Technol. 2024, 45, 4266–4283. [Google Scholar] [CrossRef] [Scilit] [PubMed]
- Tchamango, S.; Nanseu-Njiki, C.P.; Ngameni, E.; Hadjiev, D.; Darchen, A. Treatment of Dairy Effluents by Electrocoagulation Using Aluminium Electrodes. Sci. Total Environ. 2010, 408, 947–952. [Google Scholar] [CrossRef] [Scilit] [PubMed]
- Varank, G.; Sabuncu, M.E. Application of Central Composite Design Approach for Dairy Wastewater Treatment by Electrocoagulation Using Iron and Aluminum Electrodes: Modeling and Optimization. Desalin. Water Treat. 2015, 56, 33–54. [Google Scholar] [CrossRef] [Scilit]
- Aitbara, A.; Cherifi, M.; Hazourli, S.; Leclerc, J.P. Continuous Treatment of Industrial Dairy Effluent by Electrocoagulation Using Aluminum Electrodes. Desalin. Water Treat. 2016, 57, 3395–3404. [Google Scholar] [CrossRef] [Scilit]
- Kuokkanen, V.; Kuokkanen, T.; Rämö, J.; Lassi, U.; Roininen, J. Removal of Phosphate from Wastewaters for Further Utilization Using Electrocoagulation with Hybrid Electrodes—Techno-Economic Studies. J. Water Process Eng. 2015, 8, e50–e57. [Google Scholar] [CrossRef] [Scilit]
- Majlessi-Nasr, M.; Rafiee, M.; Amereh, F.; Jahangiri-Rad, M.; Jalilvand, H. Multi-Objective Optimization of Electrocoagulation-Flotation (ECF) Process for Treatment of Real Dairy Wastewater. Desalin. Water Treat. 2020, 206, 44–57. [Google Scholar] [CrossRef] [Scilit]
- Tchamango, S.R.; Wandji Ngayo, K.; Belibi Belibi, P.D.; Nkouam, F.; Ngassoum, M.B. Treatment of a Dairy Effluent by Classical Electrocoagulation and Indirect Electrocoagulation with Aluminum Electrodes. Sep. Sci. Technol. 2021, 56, 1128–1139. [Google Scholar] [CrossRef] [Scilit]
- SR EN ISO 6878:2005; Water Quality—Determination of Phosphorus—Ammonium Molybdate Spectrometric Method. Romanian Standards Association (ASRO): Bucharest, Romania, 2005.
- Devlin, T.R.; Kowalski, M.S.; Pagaduan, E.; Zhang, X.; Wei, V.; Oleszkiewicz, J.A. Electrocoagulation of Wastewater Using Aluminum, Iron, and Magnesium Electrodes. J. Hazard. Mater. 2019, 368, 862–868. [Google Scholar] [CrossRef] [Scilit] [PubMed]
- SR ISO 15705:2022; Water Quality—Determination of the Chemical Oxygen Demand Index (ST-COD)—Small-Scale Sealed-tube Method. Romanian Standards Association (ASRO): Bucharest, Romania, 2022.
- Ebba, M.; Asaithambi, P.; Alemayehu, E. Investigation on Operating Parameters and Cost Using an Electrocoagulation Process for Wastewater Treatment. Appl. Water Sci. 2021, 11, 175. [Google Scholar] [CrossRef] [Scilit]
- Eurostat. Electricity Price Statistics. Available online: https://ec.europa.eu/eurostat/statistics-explained/index.php?+title=Electricity_price_statistics (accessed on 16 November 2026).
- Countryeconomy.com. Aluminum, 99.5% Minimum Purity, LME Spot Price, CIF UK Ports: 2026 Historical Prices. Available online: https://countryeconomy.com/raw-materials/aluminum?year=2026 (accessed on 7 November 2026).
- Bidoia, L. PricePedia. Sulphuric Acid: Product Scarcity and Cost Increases Drive Current High Prices. Available online: https://www.pricepedia.it/en/magazine/article/2026/02/06/sulphuric-acid-product-scarcity-and-cost-increases-drive-current-high-prices/ (accessed on 16 September 2026).
- ChemAnalyst. Sodium Chloride Price Trend and Forecast. Available online: https://www.chemanalyst.com/Pricing-data/sodium-chloride-1617 (accessed on 7 November 2026).
- Ingelsson, M.; Yasri, N.; Roberts, E.P.L. Electrode Passivation, Faradaic Efficiency, and Performance Enhancement Strategies in Electrocoagulation—A Review. Water Res. 2020, 187, 116433. [Google Scholar] [CrossRef] [Scilit] [PubMed]
- Sinaj, S.; Mächler, F.; Frossard, E.; Faïsse, C.; Oberson, A.; Morel, C. Interference of Colloidal Particles in the Determination of Orthophosphate Concentrations in Soil Water Extracts. Commun. Soil Sci. Plant Anal. 1998, 29, 1091–1105. [Google Scholar] [CrossRef] [Scilit]
- Omwene, P.I.; Kobya, M. Treatment of Domestic Wastewater Phosphate by Electrocoagulation Using Fe and Al Electrodes: A Comparative Study. Process Saf. Environ. Prot. 2018, 116, 34–51. [Google Scholar] [CrossRef] [Scilit]
- Li, G.; Zheng, B.; Zhang, W.; Liu, Q.; Li, M.; Zhang, H. Phosphate Removal Efficiency and Life Cycle Assessment of Different Anode Materials in Electrocoagulation Treatment of Wastewater. Sustainability 2024, 16, 3836. [Google Scholar] [CrossRef] [Scilit]
- Government of Romania. Romanian Governmental Resolution No. 188 of 28.02.2002 for the Approval of Norms on Wastewater Discharge Condition in the Aquatic Environment, with Reference to NTPA 001/2002 and NTPA 002/2002; Government of Romania: Bucharest, Romania, 2002.
- Bayramoglu, M.; Eyvaz, M.; Kobya, M. Treatment of the Textile Wastewater by Electrocoagulation: Economical Evaluation. Chem. Eng. J. 2007, 128, 155–161. [Google Scholar] [CrossRef] [Scilit]
- Bayramoglu, M.; Kobya, M.; Eyvaz, M.; Senturk, E. Technical and Economic Analysis of Electrocoagulation for the Treatment of Poultry Slaughterhouse Wastewater. Sep. Purif. Technol. 2006, 51, 404–408. [Google Scholar] [CrossRef] [Scilit]
- Tuyet, N.T.; Nguyen, V.D.; Nguyet, N.T.; Balasubramani, R.; Nghia, N.T. Phosphate Removal from Aqueous Solutions Using Reversal Mode Electrocoagulation with Iron and Aluminum Electrodes: RSM Optimization and ANN Modeling. Environ. Res. Commun. 2024, 6, 105005. [Google Scholar] [CrossRef] [Scilit]
- Picard, T.; Cathalifaud-Feuillade, G.; Mazet, M.; Vandensteendam, C. Cathodic Dissolution in the Electrocoagulation Process Using Aluminium Electrodes. J. Environ. Monit. 2000, 2, 77–80. [Google Scholar] [CrossRef] [Scilit] [PubMed]
- Fekete, É.; Lengyel, B.; Cserfalvi, T.; Pajkossy, T. Electrochemical Dissolution of Aluminium in Electrocoagulation Experiments. J. Solid State Electrochem. 2016, 20, 3107–3114. [Google Scholar] [CrossRef] [Scilit]
- Bouamra, F.; Drouiche, N.; Ahmed, D.S.; Lounici, H. Treatment of Water Loaded with Orthophosphate by Electrocoagulation. Procedia Eng. 2012, 33, 155–162. [Google Scholar] [CrossRef] [Scilit]
- Jang, G.G.; Keum, J.K.; Dutta, S.; Damron, J.T.; Wiechert, A.I.; Halbert, C.E.; Browning, J.F.; Hensley, D.K.; Jassby, D.; Hatzell, M.C.; et al. Understanding the Dissolution and Passivation of an Aluminum Electrode during Electrocoagulation of Groundwater Using Neutron and X-ray Reflectometry. ACS Appl. Mater. Interfaces 2025, 17, 25996–26012. [Google Scholar] [CrossRef] [Scilit] [PubMed]
- Mansouri, K.; Ibrik, K.; Bensalah, N.; Abdel-Wahab, A. Anodic Dissolution of Pure Aluminum during Electrocoagulation Process: Influence of Supporting Electrolyte, Initial pH, and Current Density. Ind. Eng. Chem. Res. 2011, 50, 13362–13372. [Google Scholar] [CrossRef] [Scilit]
- Karmil, F.Z.; Naribi, Z.; El Messaoudi, N.; Hassoune, J.; Georgin, J.; Al-Msiedeen, A.M.; El Alaoui-Belghiti, H. Electrocoagulation for Water Reclamation from Industrial Equipment Cleaning Wastewater: Purification, Reuse, Sludge Management, and Corrosivity Trade-Off. Sep. Purif. Technol. 2026, 394, 137591. [Google Scholar] [CrossRef] [Scilit]
- Harif, T.; Khai, M.; Adin, A. Electrocoagulation versus Chemical Coagulation: Coagulation/Flocculation Mechanisms and Resulting Floc Characteristics. Water Res. 2012, 46, 3177–3188. [Google Scholar] [CrossRef] [Scilit] [PubMed]
- Hu, Y.; Yang, Q.; Kou, J.; Sun, C.; Li, H. Aggregation Mechanism of Colloidal Kaolinite in Aqueous Solutions with Electrolyte and Surfactants. PLoS ONE 2020, 15, e0238350. [Google Scholar] [CrossRef] [Scilit] [PubMed]
- Tibebe, D.; Negash, A.; Mulugeta, M.; Kassa, Y.; Moges, Z.; Yenealem, D. Investigation of Selected Physico-Chemical Quality Parameters in Industrial Wastewater by Electrocoagulation Process, Ethiopia. BMC Chem. 2022, 16, 67. [Google Scholar] [CrossRef] [Scilit] [PubMed]
- Nicolaou, N.; Xu, Y.; Goodacre, R. Fourier Transform Infrared Spectroscopy and Multivariate Analysis for the Detection and Quantification of Different Milk Species. J. Dairy Sci. 2010, 93, 5651–5660. [Google Scholar] [CrossRef] [Scilit] [PubMed]
- Barth, A. Infrared Spectroscopy of Proteins. Biochim. Biophys. Acta Bioenerg. 2007, 1767, 1073–1101. [Google Scholar] [CrossRef] [Scilit] [PubMed]
- Vlachos, N.; Skopelitis, Y.; Psaroudaki, M.; Konstantinidou, V.; Chatzilazarou, A.; Tegou, E. Applications of Fourier Transform-Infrared Spectroscopy to Edible Oils. Anal. Chim. Acta 2006, 573–574, 459–465. [Google Scholar] [CrossRef] [Scilit] [PubMed]
- Wellner, D.B.; Couperthwaite, S.J.; Millar, G.J. Influence of Operating Parameters during Electrocoagulation of Sodium Chloride and Sodium Bicarbonate Solutions Using Aluminium Electrodes. J. Water Process Eng. 2018, 22, 13–26. [Google Scholar] [CrossRef] [Scilit]
- Gao, S.; Du, M.; Tian, J.; Yang, J.; Yang, J.; Ma, F.; Nan, J. Effects of Chloride Ions on Electro-Coagulation-Flotation Process with Aluminum Electrodes for Algae Removal. J. Hazard. Mater. 2010, 182, 827–834. [Google Scholar] [CrossRef] [Scilit] [PubMed]
- Mechelhoff, M.; Kelsall, G.H.; Graham, N.J.D. Electrochemical Behaviour of Aluminium in Electrocoagulation Processes. Chem. Eng. Sci. 2013, 95, 301–312. [Google Scholar] [CrossRef] [Scilit]
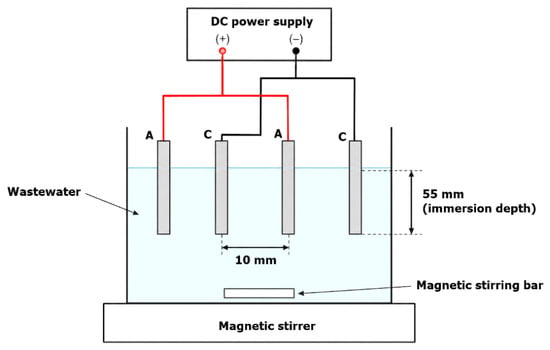
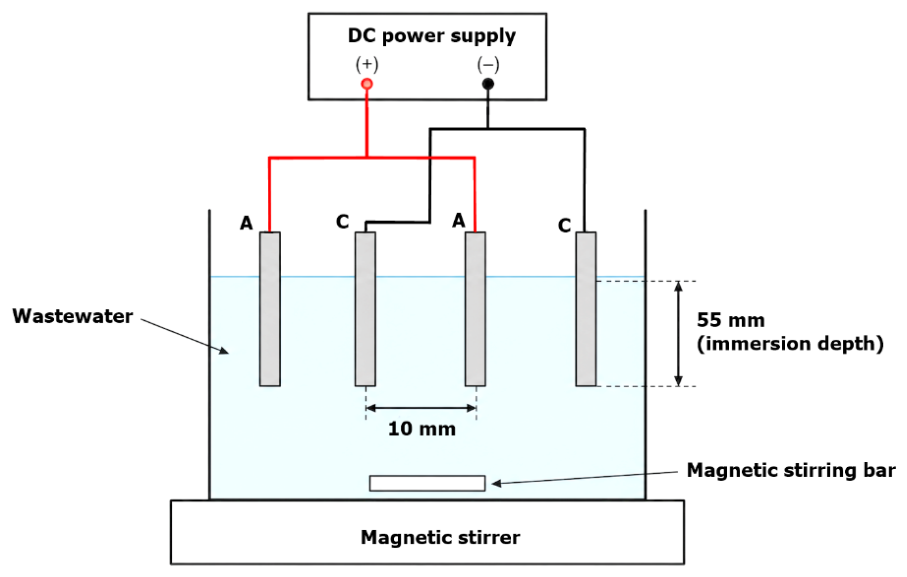
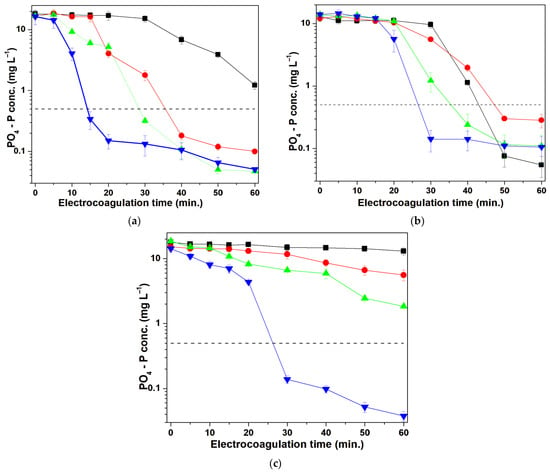
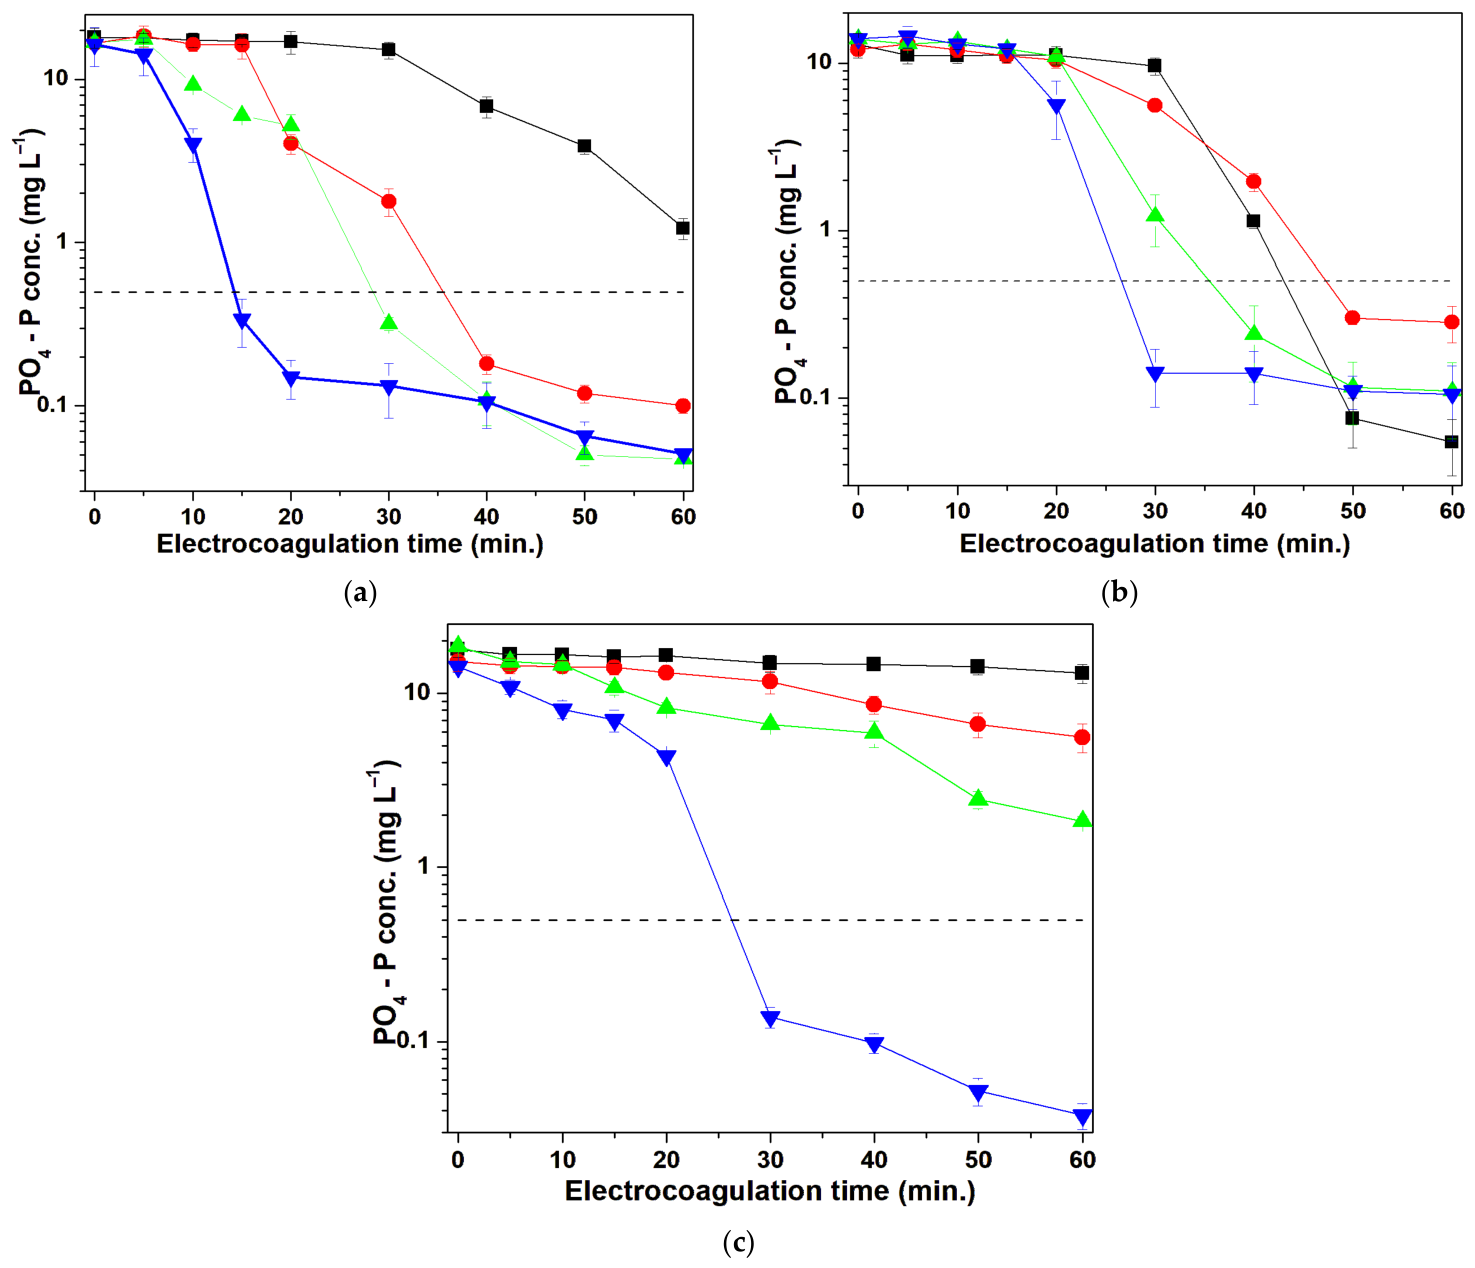
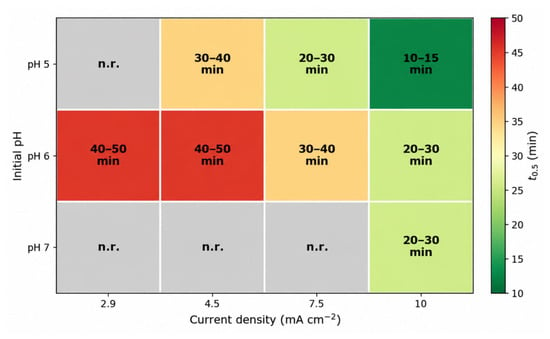
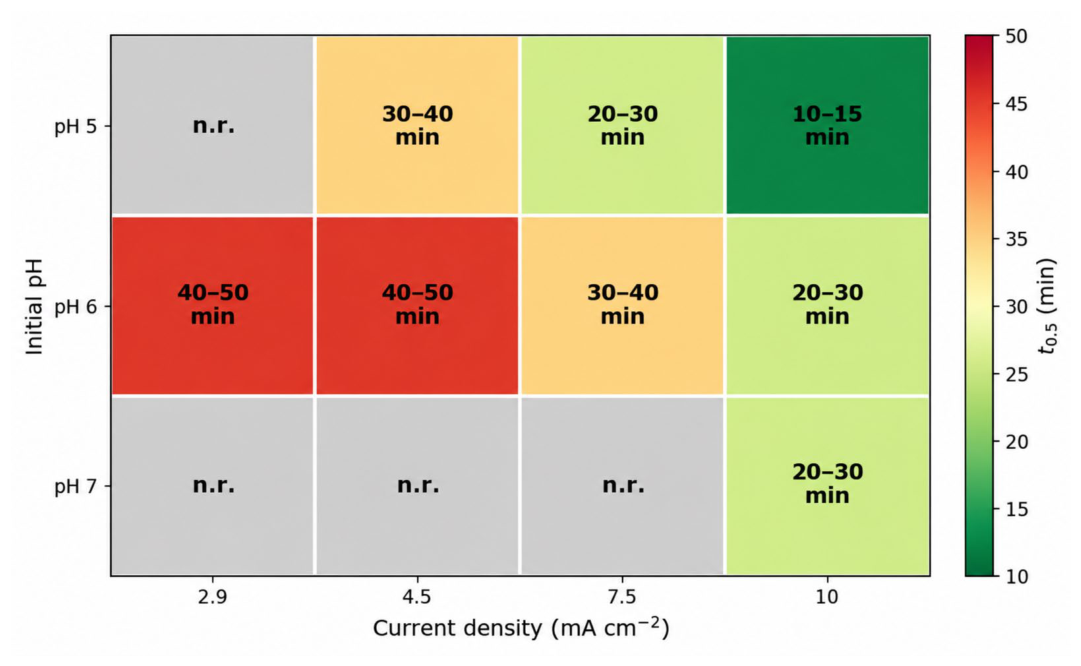
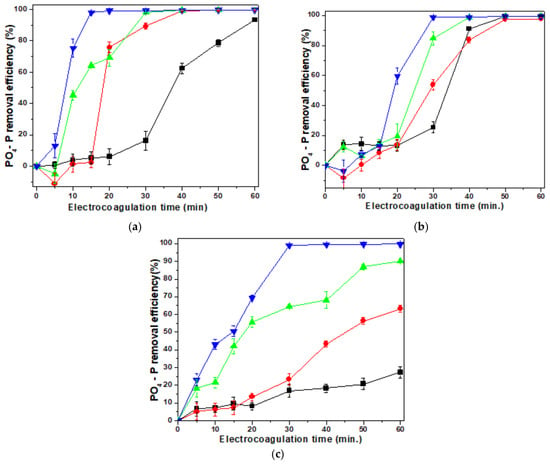
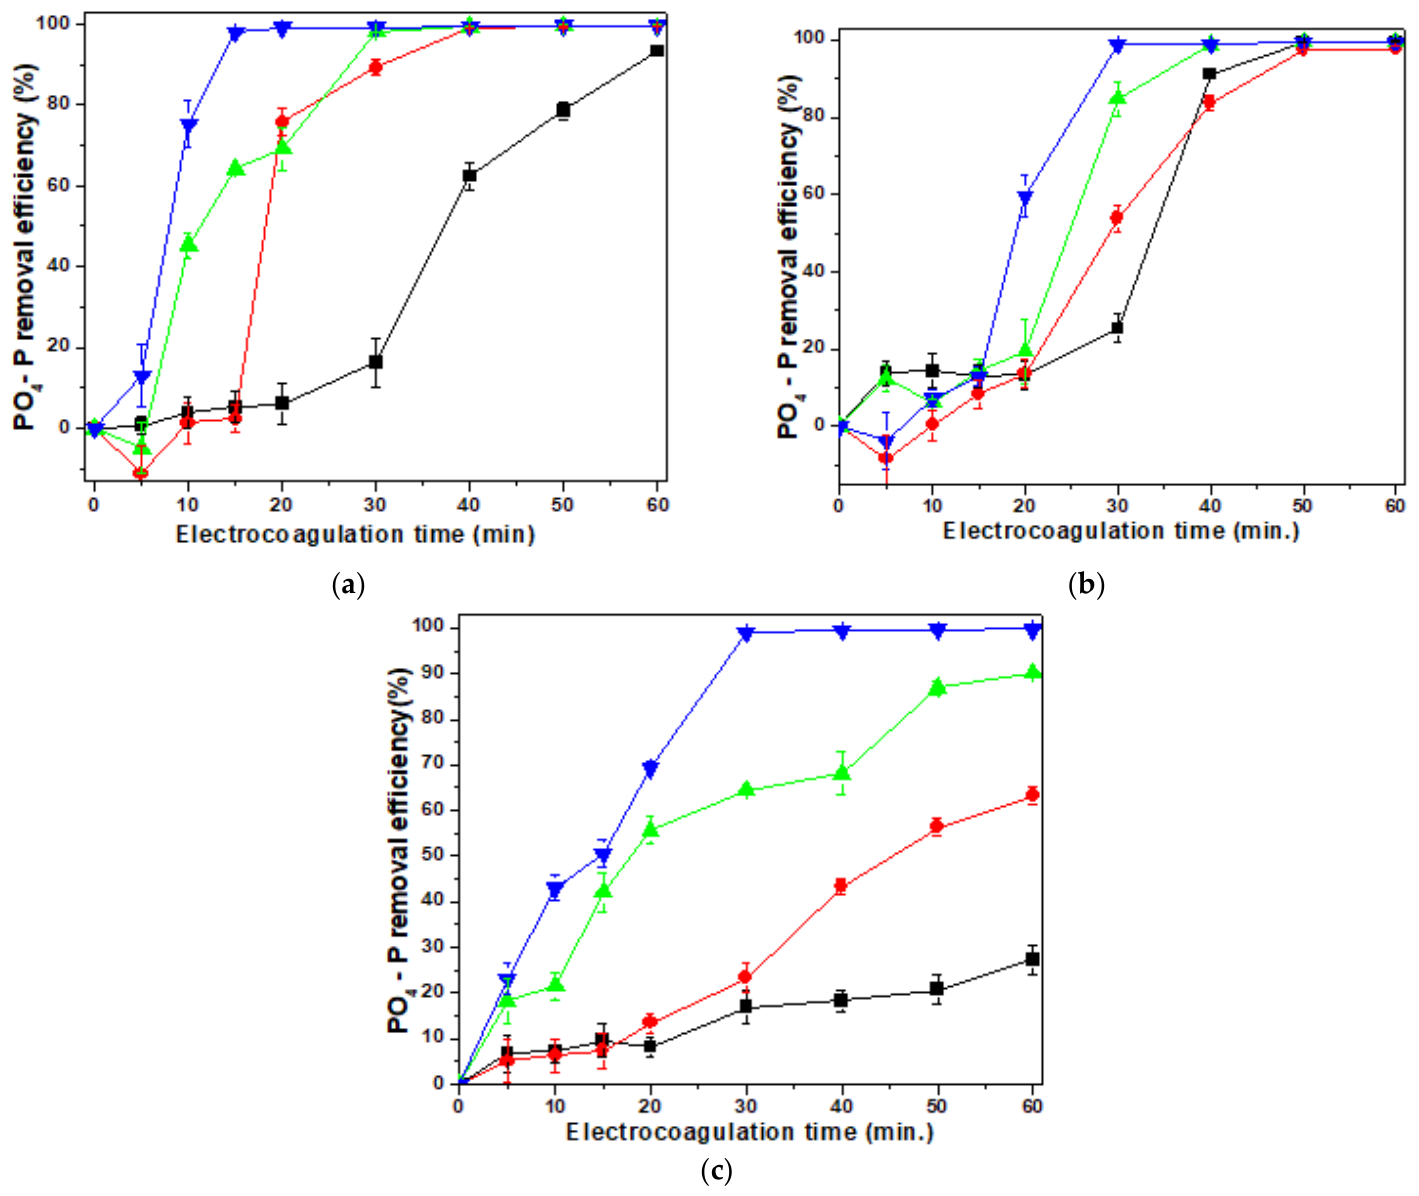
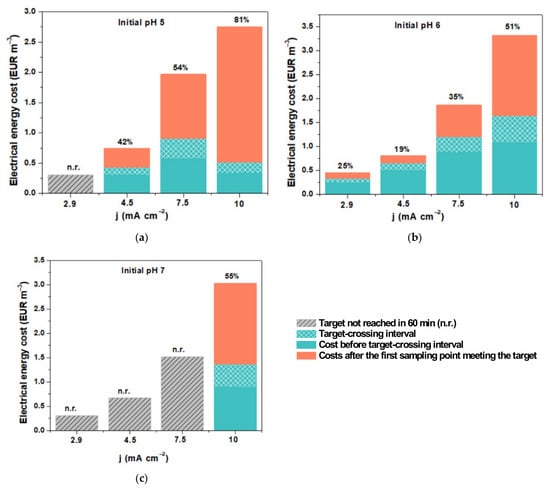
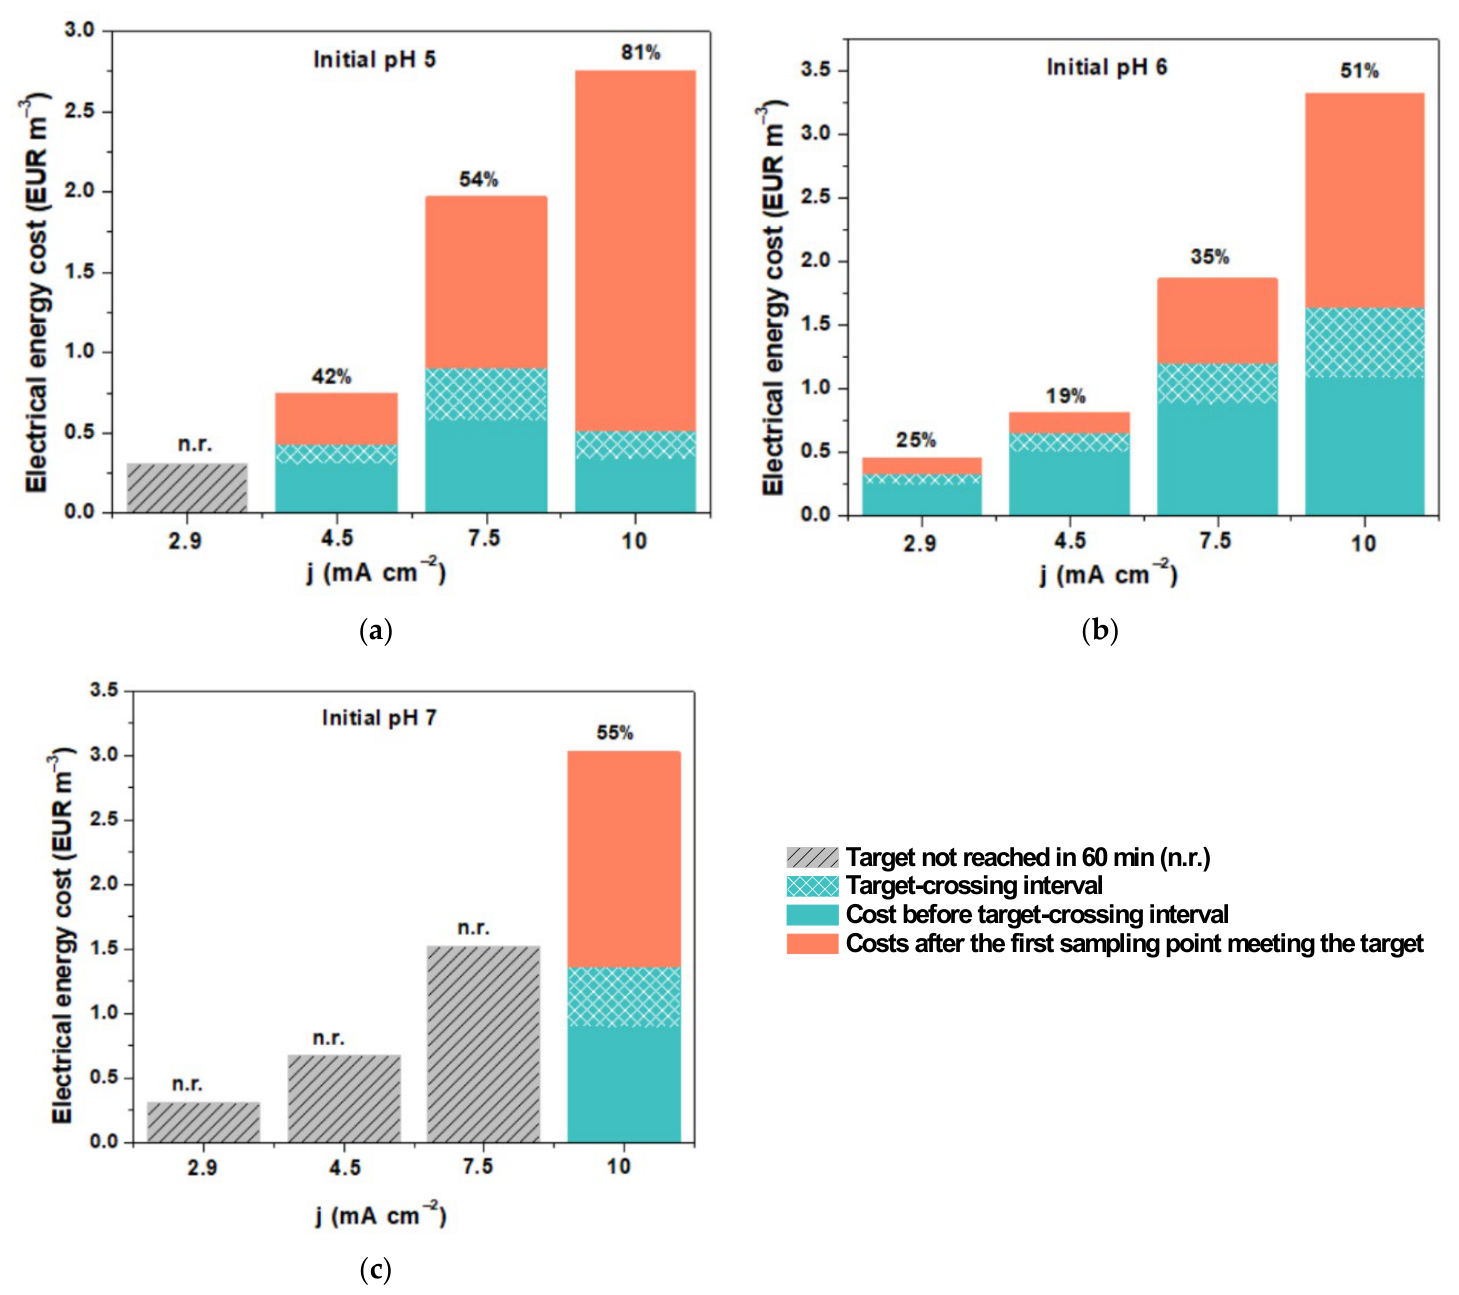
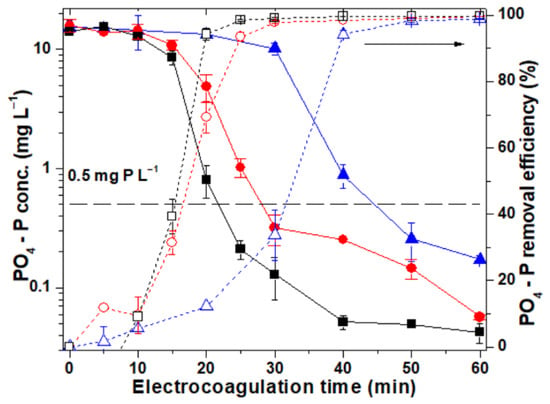
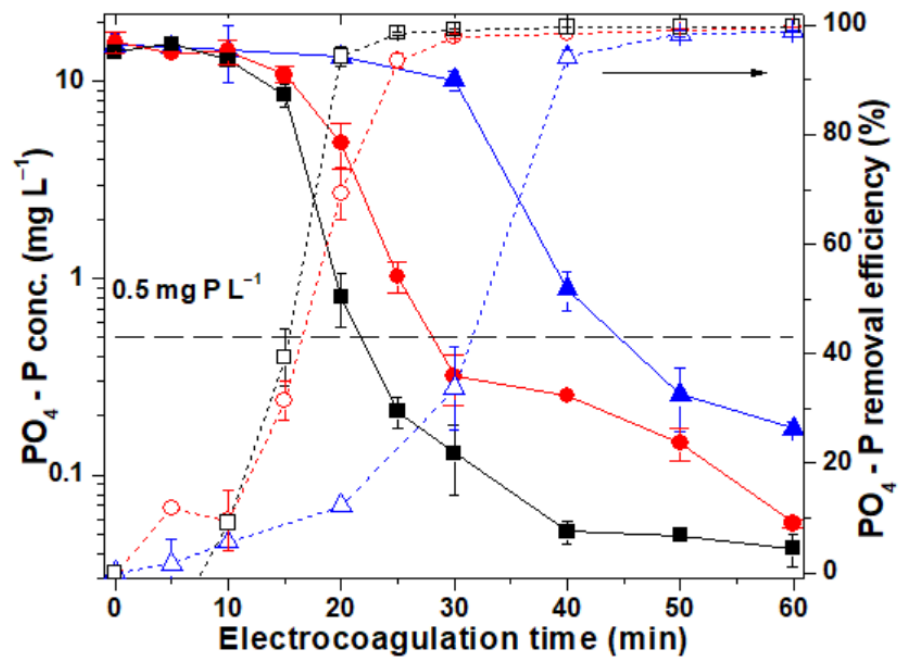
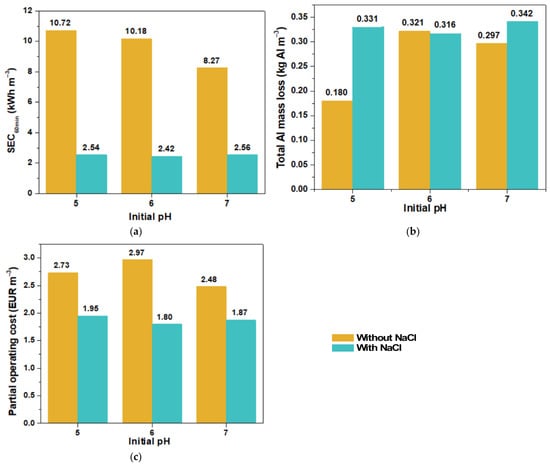
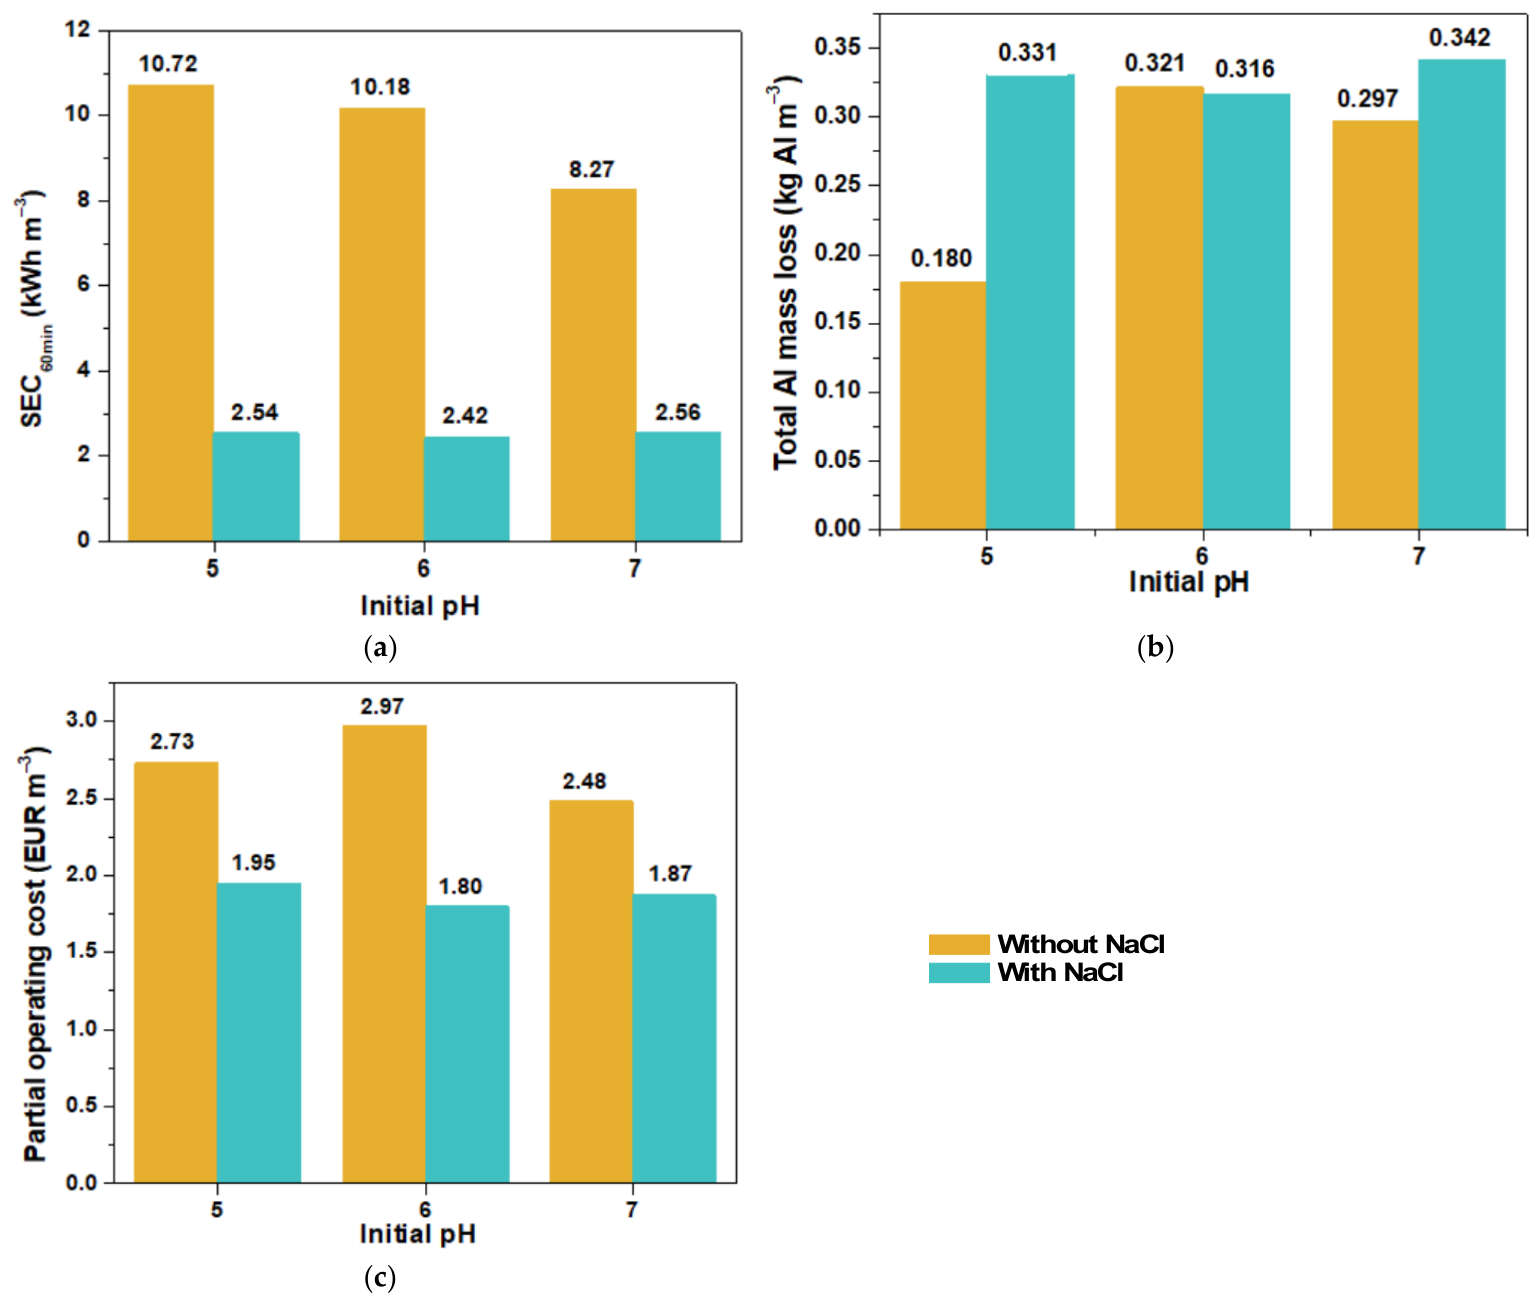
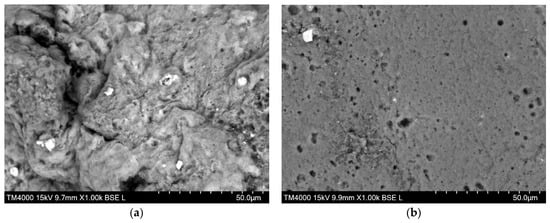
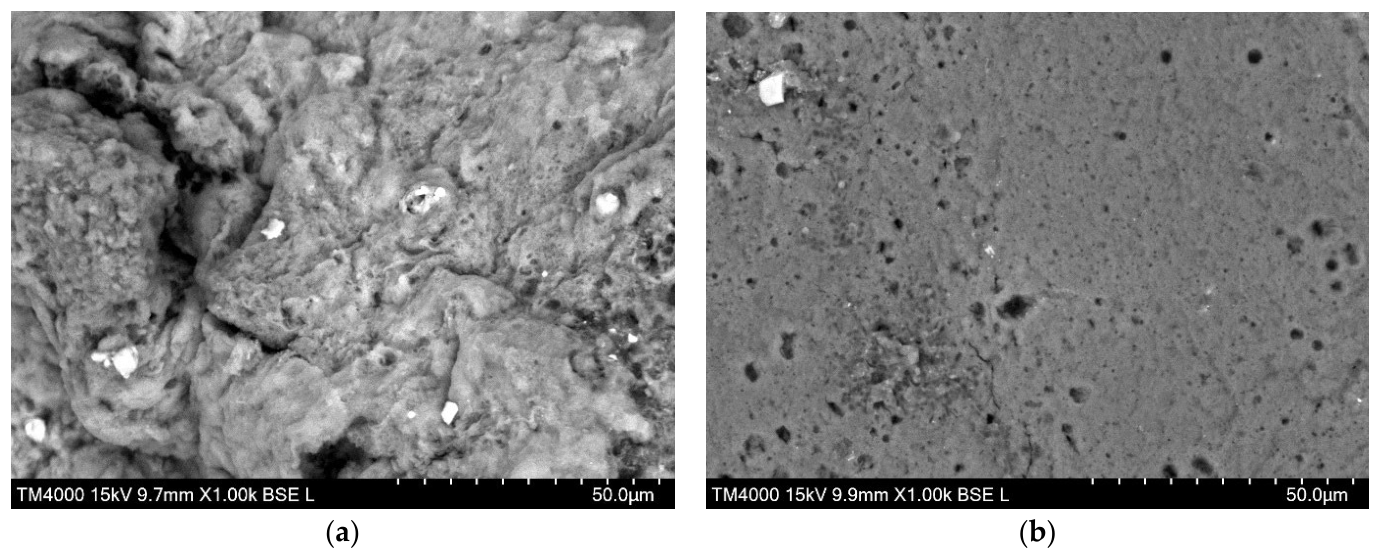
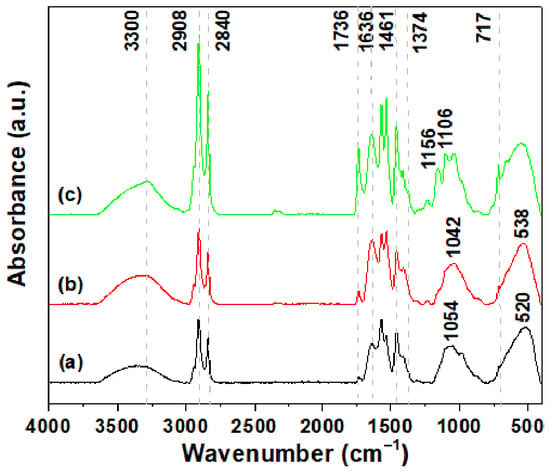
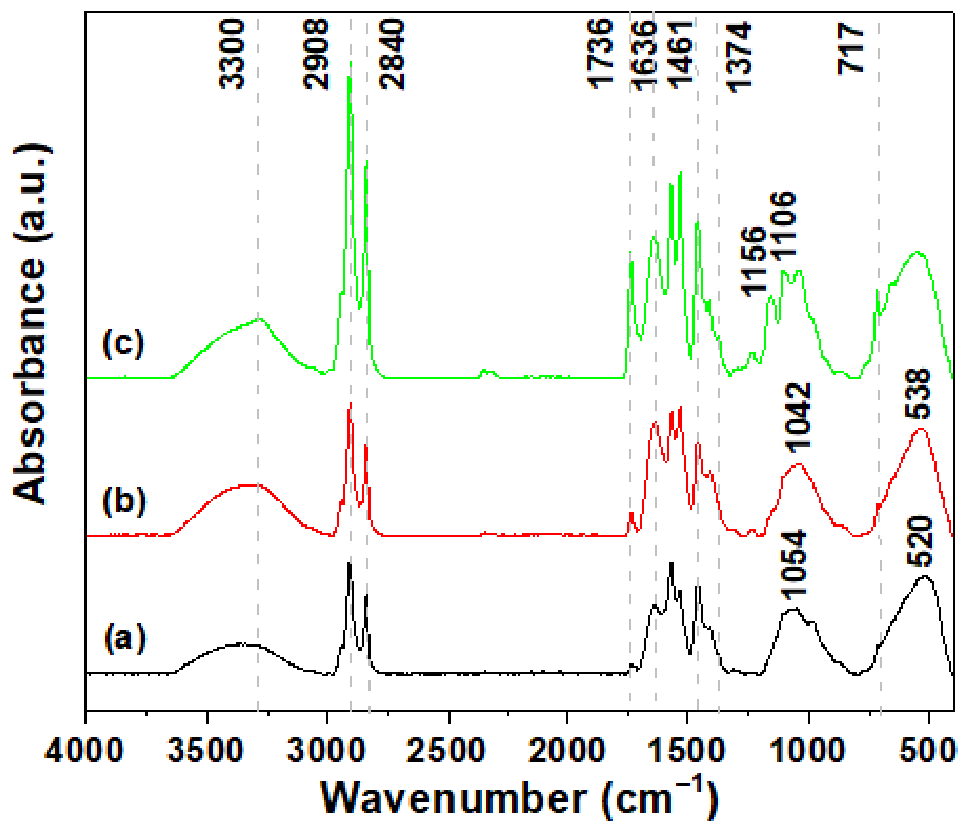
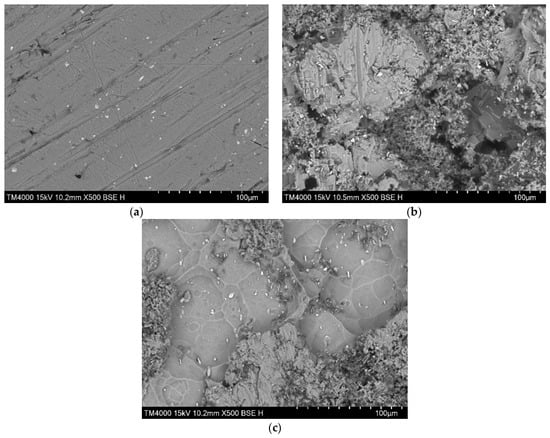
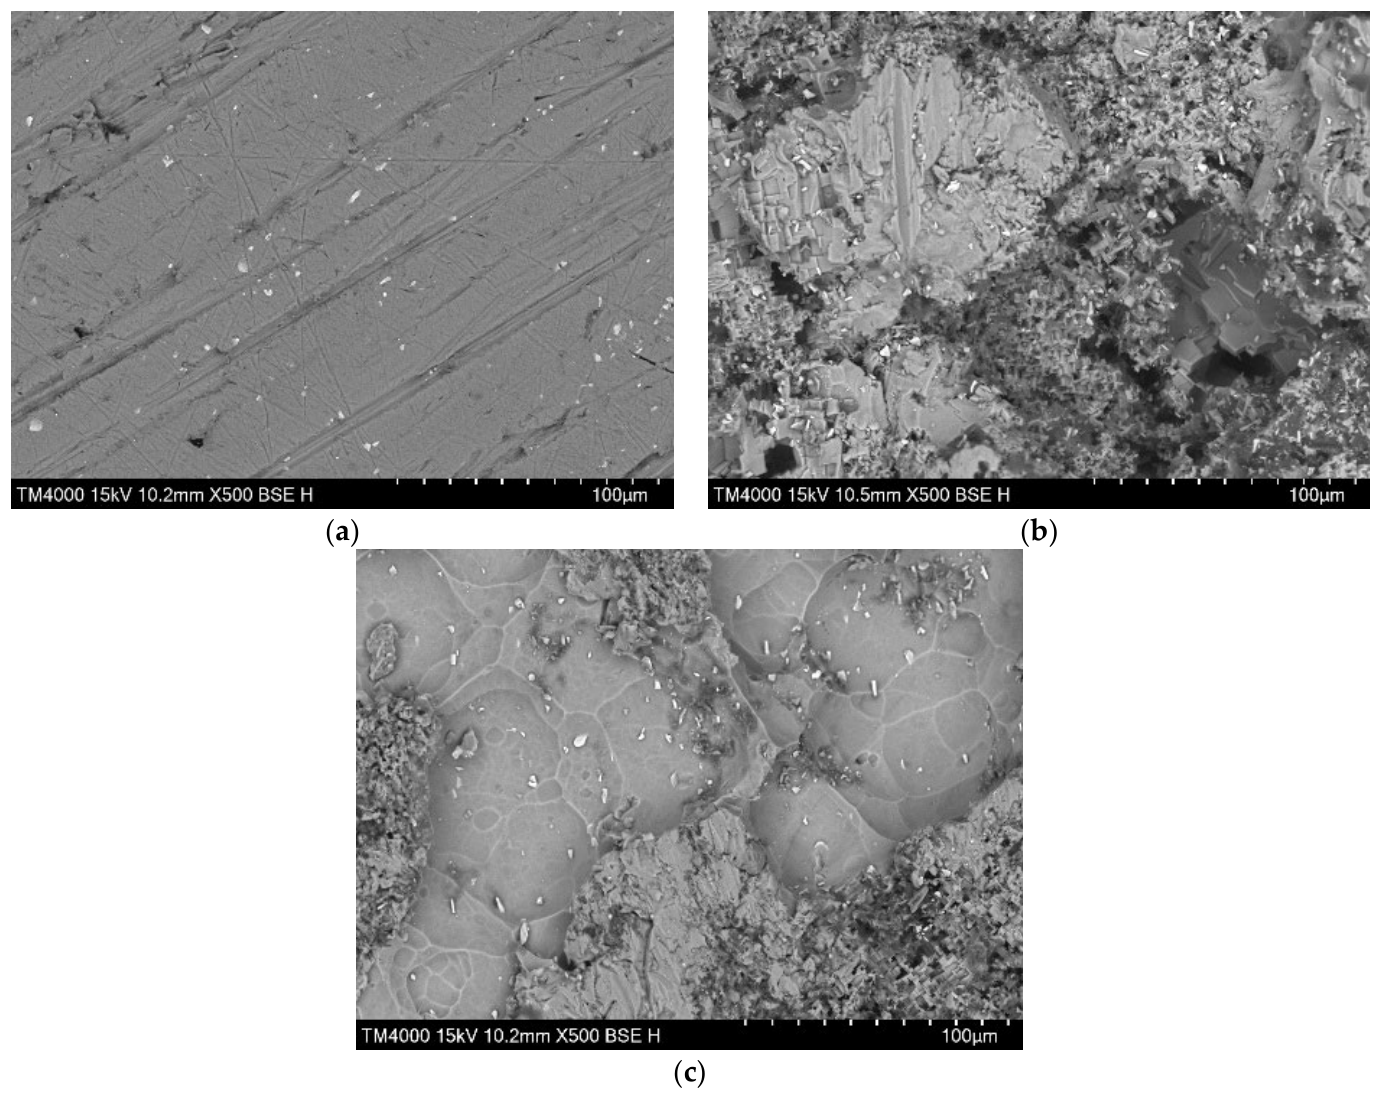

Disclaimer/Publisher’s Note: The statements, opinions and data contained in all publications are solely those of the individual author(s) and contributor(s) and not of MDPI and/or the editor(s). MDPI and/or the editor(s) disclaim responsibility for any injury to people or property resulting from any ideas, methods, instructions or products referred to in the content. |
© 2026 by the authors. Licensee MDPI, Basel, Switzerland. This article is an open access article distributed under the terms and conditions of the Creative Commons Attribution (CC BY) license.