


Highlights
What are the main findings?
- Engine mapping across compression ratios of 12–18 and engine loads of 25%–75% shows that a higher compression ratio improves brake thermal efficiency and reduces brake specific fuel consumption, while NOx generally increases across the operating range.
- Relative to diesel, WSO biodiesel delivers substantial reductions in CO and HC, with a modest increase in fuel consumption and a slight reduction in peak efficiency, indicating broadly comparable performance under steady-state operation.
What is the implication of the main finding?
- The compression ratio–load response surfaces provide an actionable operating region framework that can support calibration decisions to balance efficiency benefits against NOx constraints for WSO biodiesel operation.
- The results support the practical use of WSO biodiesel in compression ignition applications, with targeted NOx mitigation and low-load optimization identified as the key calibration priorities.
Abstract
This study presents an experimental engine map investigation of waste swine oil biodiesel (WSO B100) in a single-cylinder, four-stroke variable compression ratio compression ignition engine, quantifying the coupled effects of compression ratio and load on brake thermal efficiency, brake-specific fuel consumption, torque, brake power, and regulated emissions of NOx, CO, HC, and CO2. Compression ratios of 12, 14, 16, and 18 were evaluated at dynamometer loads of 25%, 50%, and 75% under steady-state operation. The study’s primary contribution is a structured compression ratio–load mapping framework that produces consistent performance emission response surfaces and, supported by statistical modeling and sensitivity analysis, resolves main and interaction effects to identify operating regions that balance efficiency and emissions. Methodological traceability is strengthened by attaching fuel energy and mass flow calculations to batch-specific fuel properties, including viscosity and density, and by using calorimetry-derived heating value in efficiency calculations. Increasing the compression ratio from 12 to 18 improved brake thermal efficiency by 3–10% at low load and reduced brake-specific fuel consumption, while NOx increased by 20–30% across the load range. Increasing load raised brake thermal efficiency from 29% at 25% load to 42% at 75% load and reduced brake-specific fuel consumption from 309 to 215 g/kWh; NOx peaked at 488 ppm at 75% load and compression ratio 18. CO and HC decreased with both load and compression ratio, reaching minima of 0.15% and 30 ppm, whereas CO2 increased primarily with load. Relative to diesel, WSO biodiesel showed 8–12% higher brake-specific fuel consumption and 2–4% lower peak brake thermal efficiency, but achieved substantial CO and HC reductions. Generally, WSO biodiesel operates effectively across a wide compression ratio range with broadly comparable performance to diesel. However, increased NOx and reduced low-load efficiency indicate the need for targeted calibration or emission control.
1. Introduction
Diesel engines dominate many transportation and power generation sectors due to their high efficiency and durability [1]. However, growing concerns over fossil fuel depletion and pollutant emissions have prompted interest in renewable, low-carbon fuels for compression ignition (CI) engines. Biodiesel has emerged as a promising alternative to fossil fuels. It is biodegradable in nature, non-toxic, and can be produced from various biological feedstocks, including vegetable oils, waste cooking oils, and animal fats [2]. Among these, waste animal fats such as WSO, a by-product of the pork industry, present an attractive feedstock for sustainable biodiesel production [3]. Exploiting WSO for fuel not only adds value to an agricultural waste stream but also aligns with circular economy principles by reducing landfill disposal and environmental pollution [1].
Chemically, WSO biodiesel derived through transesterification of pork lard has fuel properties comparable to conventional diesel, with some notable differences. It typically features a higher cetane number and oxygen content, which promote cleaner combustion. However, WSO and other animal fat biodiesels tend to have higher saturated fatty acid content, leading to higher viscosity and cloud point but slightly lower calorific value than petro-diesel [4,5,6]. For example, pork lard methyl ester (B100) typically exhibits a lower heating value, approximately 10–12% lower than that of conventional diesel fuel, alongside moderately higher density and kinematic viscosity. In contrast, its cetane number is generally higher, often exceeding 60, which can enhance ignition quality and influence combustion characteristics. These fuel property differences impact engine performance and emissions, generally causing a slight power and efficiency drop but significant reductions in certain pollutants [1].
Previous studies on biodiesel in CI engines have consistently reported that biodiesel fuels tend to reduce emissions of particulate matter (PM), CO, and HC due to their oxygenated nature, enabling more complete combustion [7,8]. Khujamberdiev and Cho [7] observed that increasing the blend ratio of WSO biodiesel up to B80 in a diesel engine led to decreases in CO emissions from 0.76% to 0.22% and HC from 36 ppm to 20 ppm relative to pure diesel at 1800 rpm. Likewise, smoke opacity and PM emissions are often markedly lower for animal fat biodiesels. This is attributed to biodiesel’s zero-sulfur content and inherent oxygen, which suppresses soot formation [9]. Conversely, a well-documented drawback is the tendency for biodiesel to produce higher nitrogen oxide (NOx) emissions in many cases. The higher bulk modulus and cetane of biodiesel can advance injection or combustion timing and elevate in-cylinder temperatures, therefore increasing thermal NOx formation [7,10]. In the above-discussed WSO biodiesel study, NOx emissions increased from 103 ppm for diesel fuel to 165 ppm when operating on B80. Such trends are commonly reported. Sathiyagnanam, et al. [11] found that using 100% pork lard methyl ester (WPLME) led to a slight drop in brake thermal efficiency (6% lower) and higher specific fuel consumption (23% higher) compared to diesel, alongside slightly higher NOx emissions and substantial reductions in HC, CO, and smoke. Overall, the review indicates that biodiesel from waste fats can achieve comparable engine performance to diesel with significantly cleaner carbon monoxide, hydrocarbon, and PM emissions, at the expense of increased NOx and a minor efficiency consequence [11,12]. These drawbacks motivate further research into engine strategies to mitigate NOx while leveraging biodiesel’s emissions benefits [1].
Another important parameter affecting CI engine combustion is the compression ratio (CR). Higher compression ratios are known to improve the thermal efficiency and output of diesel engines by achieving higher compression pressure and temperature, thus enhancing fuel ignition and combustion completeness [13,14]. However, elevated CR also increases peak combustion temperatures, which tend to increase NOx formation exponentially [15,16,17]. Most conventional diesel engines operate at a fixed CR optimized for diesel fuel. The use of variable compression ratio (VCR) technology enables real-time adjustment of the compression ratio, providing a practical means to optimize combustion conditions for alternative fuels such as biodiesel. There is limited but growing research examining how different compression ratios influence biodiesel combustion performance and emissions [18]. Alotaibi, et al. [18] investigated waste cooking oil B20 fuel at CR 16:1 against 18:1 and found that higher CR improved the engine’s efficiency but also led to higher NOx emissions for the biodiesel blend. Similarly, Mahmood, et al. [19] reported that a biodiesel (apricot oil methyl ester) engine attained its highest efficiency at CR 18.5, although with increased NOx and NO2 emissions at that setting. These studies highlight that compression ratio optimization is a key consideration when running biodiesel, as it influences the fundamental combustion characteristics and thus the emission performance balance.
Research Gap
Despite extensive research on biodiesel fuels, systematic engine mapping of biodiesels across a combined compression ratio–load regime remains limited, particularly for fuels derived from waste animal fats such as waste swine oil. Existing studies have predominantly focused on biodiesel from vegetable oils or waste cooking oils and have often been conducted under fixed compression ratio operation or within narrow load bands. This approach constrains the ability to resolve the coupled effects of compression ratio and load, even though load strongly governs combustion completeness and emission formation, with low-load conditions typically associated with elevated CO and HC due to incomplete oxidation, and high load operation promoting increased in-cylinder temperatures and NOx formation temperature Sathiyagnanam, et al. [11,12]. The lack of comprehensive datasets spanning both parameters has resulted in an incomplete understanding of how variable compression ratio operation interacts with load to influence efficiency, combustion behavior, and regulated emissions for waste animal fat-based biodiesels.
A further limitation in the literature concerns comparative benchmarking. Many experimental investigations report only biodiesel results without situating them against established diesel performance and emissions trends, limiting the assessment of practical suitability and deployment potential. In addition, relatively few studies employ mapping or regression-based sensitivity modeling to identify dominant operating drivers, nonlinear transitions, and critical regions within the operating cover. Such analytical tools are essential for revealing parameter interactions and for supporting engine calibration and control strategies, particularly in variable compression ratio engines, where the dynamic adjustment of compression ratio could mitigate efficiency penalties at low load or address emission constraints at high load.
In response to these gaps, the present study provides a comprehensive experimental and analytical investigation of waste swine oil biodiesel in a single-cylinder variable compression ratio diesel engine operated over a broad compression ratio–load matrix. Performance and regulated emissions are measured at four compression ratios of CR = 12, 14, 16, and 18 and across representative load levels of 25%, 50%, and 75–100% at constant speed, with results evaluated through comparison with peer-reviewed diesel baseline data. Detailed engine maps are developed for the performance and emission responses, and regression-based sensitivity analysis is applied to quantify the relative influence of compression ratio and load. By integrating systematic experimentation with mapping and modeling, this work advances the empirical understanding of waste swine oil biodiesel under variable thermodynamic conditions and establishes a structured foundation for future optimization of alternative biodiesel fuels in compression ignition engines.
2. Methodology
This study employed a controlled experimental methodology integrating VCR engine trials, fuel property characterization, systematic compression ratio variation, load-dependent performance measurement, emissions quantification, and surface mapping analytics. The investigation was structured to generate traceable and comparable datasets across the compression ratio–load regime, enabling cross-comparison of results, sensitivity interpretation, and uncertainty qualification. By aligning controlled engine operation with defined operating points, the approach ensured measurement repeatability, dataset consistency, and the reliable interpretation of WSO biodiesel performance and emissions behavior.
2.1. Biodiesel Production
WSO biodiesel (B100) was produced from Nigerian pork processing waste streams (Akure, Nigeria). Raw WSO was obtained from local waste streams. The WSO was collected as pork processing waste, with visible impurities removed by filtering. Initial characterization of the raw oils included measuring the moisture content, which was conducted by oven drying, and the Free Fatty Acid (FFA) level, assessed by titration with KOH. The WSO had an acid value of 0.54 mg KOH/g and 0.27% FFA, indicating relatively low free fatty acidity, which represents a result of proper rendering to remove rancid fractions. This low FFA content in the WSO fell within the acceptable range for direct base-catalyzed transesterification. The WSO feedstock exhibited a low FFA content and therefore did not require an acid esterification pretreatment. The material was instead preheated to approximately 60 °C to ensure complete melting and homogenization, as lard remains semi-solid at ambient temperature. The feedstock was dried to less than 0.1% moisture prior to reaction, since water can inhibit ester yield and promote soap formation.
Transesterification of the oil was carried out in batch mode. Based on established procedure for high conversion yields, a methanol-to-oil molar ratio of 6:1 was initially employed. For each reaction, 1 L of oil was loaded into a 2 L glass reactor, with mechanical stirring at 600 rpm and temperature control. An alkaline catalyst, KOH, was chosen for its fast reaction rate and cost-effectiveness. The catalyst amount was 1 wt% of oil for WSO. The methanolic KOH solution was added to the heated oil, and the transesterification reaction proceeded at 60 °C for 1.5 h. Samples were taken to monitor reaction progress. The conversion of triglycerides to methyl esters was tracked by thin-layer chromatography (TLC) and later verified by Gas Chromatography–Mass Spectrometry (GC–MS) analysis of the product. After reaction, the mixture was allowed to settle, separating into two phases, for at least 4 h at 50 °C. Glycerol, along with catalyst residues and soaps, settled as a dense lower phase, which was then drained. Approximately 10% glycerol byproduct per volume of oil was recovered, consistent with the stoichiometric expectation of 1 kg glycerol per 10 kg biodiesel produced. The crude upper phase was raw biodiesel containing Fatty Acid Methyl Esters (FAME) as well as residual impurities such as methanol, soap, catalyst, and traces of mono- and di-glycerides.
Purifying the WSO biodiesel required more intensive washing. Owing to its animal fat origin, the crude WSO biodiesel contained higher soap levels, with potassium soaps of fatty acids, as a result of the neutralization of residual FFA. These soaps, along with the catalyst, made the water from the first wash strongly basic (with a pH greater than 9) and turbid. Warm water at 60 °C was used to prevent the FAME from solidifying during washing, since lard FAME has a high melting point. The biodiesel was washed in successive stages. About 5% hot water was added, and the mixture was gently agitated and then allowed to settle until phase separation. The spent wash water was drained, and the process was repeated with fresh hot water. Multiple wash cycles, typically 3–5 cycles, were needed until the wash water was neutral, at pH 7, and no soap foaming was observed. This stepwise washing removed residual KOH and soap effectively. After washing, the WSO biodiesel was vacuum-dried at 80 °C for 1 h. The final purified WSO biodiesel was clear and light yellow. Notably, it solidified into a soft fat at room temperature of 23 °C, confirming its high saturation; hence, it was stored at 50 °C to remain liquid until testing. Despite the extra effort of more wash water and heat required for WSO biodiesel, the purification was successful. The acid value dropped to less than 0.20 mg KOH/g and free glycerol to less than 0.02%, meeting fuel specifications.
2.2. Experimental Engine Test Rig and Configuration
All experiments were conducted on a computerized single-cylinder, four-stroke, water-cooled variable compression ratio (VCR) diesel engine test rig (Apex Innovation Pvt. Ltd., Sangli, India), derived from the Kirloskar TV1 research platform, as shown in Figure 1. The engine is a direct injection, naturally aspirated configuration with mechanical fuel injection and the following base specifications: bore 87.5 mm, stroke 110 mm, displacement 0.661 L, and a rated output of 3.5 kW (5 hp) at 1500 rpm. Compression ratio variation is achieved through a screw-actuated tilting block mechanism located beneath the cylinder barrel, allowing geometric adjustment between CR = 12:1, 14:1, 16:1, and 18:1 without cylinder head removal or combustion chamber modification. This feature enabled the discrete evaluation of each compression ratio and facilitated rapid transitions during the mapping of the compression ratio–load regime.
Figure 1.
Experimental setup of the single-cylinder water-cooled variable compression ratio diesel engine.
The engine (Kirloskar Oil Engines Limited, Pune, India) was coupled to a water-cooled eddy current dynamometer (Apex Innovation Pvt. Ltd., Sangli, India) equipped with a strain gauge load cell (Apex Innovation Pvt. Ltd., Sangli, India) of 0–50 kg range and a calibrated moment arm (Apex Innovation Pvt. Ltd., Sangli, India) for brake torque determination. Engine speed was maintained at 1500 rpm throughout all tests using a mechanical governor, with rotational stability confirmed by an optical encoder with ±1 rpm resolution. Fuel consumption was measured through a precision volumetric burette (Apex Innovation Pvt. Ltd., Sangli, India) with density correction applied for WSO B100, while intake air mass flow rates were obtained from an orifice plate assembly with a differential pressure transducer. The fuel delivery system incorporated dual tanks and a switching valve to enable controlled transitions between commercial diesel (B0) and biodiesel operation.
Thermal conditions were monitored using Type K thermocouples (Apex Innovation Pvt. Ltd., Sangli, India) positioned at the intake manifold, exhaust manifold, coolant inlet/outlet, and cylinder head surface. Exhaust flow passed through a water-cooled calorimeter (Apex Innovation Pvt. Ltd., Sangli, India) to maintain consistent back pressure and thermal stability during the extended test. Instrumentation (Apex Innovation Pvt. Ltd., Sangli, India) for in-cylinder pressure and crank angle recording at 1° resolution was installed to enable combustion characterization. However, combustion phasing interpretation lies outside the scope of this study.
All sensor outputs were recorded using the EngineSoftLV® LabVIEW (version 9.0, Apex Inovation Pvt, Ltd., Sangli, Maharashtra, India) based data acquisition system supplied with the test rig, operating at a one-second sampling frequency to ensure continuous parameter tracking, measurement repeatability, and traceability of each dataset to its defined CR–load operating point. The software logged all inputs and computed real-time metrics, including brake power, Brake Mean Effective Pressure (BMEP), Brake Specific Fuel Consumption (BSFC), and thermal efficiencies. Table 1 summarizes the engine and dynamometer specifications. Calibration was verified prior to testing, with a thermocouple accuracy of ±1 °C, load cell accuracy of ±0.2% F.S., and fuel flow measurement accuracy of ±0.5 mL. An uncertainty analysis based on ASME PTC methodology, as shown in Section 2.7, below, yielded ±2.1% in brake power and ±2.5% in BSFC, primarily attributable to fuel flow measurement scatter and engine stability effects. A baseline validation run using commercial diesel (B0) confirmed conformity with reference behavior and established the benchmark for subsequent WSO biodiesel trials.
Table 1.
Engine and dynamometer specifications.
2.3. Data Acquisition and Signal Discipline
All experimental channels were acquired using a computerized variable compression ratio single-cylinder diesel engine test rig equipped with an eddy current dynamometer (Apex Innovation Pvt. Ltd., Sangli, India), panel-based transmitters (Apex Innovation Pvt. Ltd., Sangli, India), and EngineSoftLV logging (version 9.0, Apex Inovation Pvt, Ltd., Sangli, Maharashtra, India) The test bench provides dedicated measurement paths for fuel flow using a glass burette fuel metering column, airflow using an air box and orifice with differential measurement, torque using a strain-gauge load cell, speed using crank angle and speed sensing, and temperatures, with all signals interfaced to a PC through a data acquisition device within the EngineSoftLV performance analysis environment as shown in Figure 2. Data were captured at 1 Hz for 30 s at each steady-state operating point after stabilization. The averaging interval was selected to account for dynamometer response lag and exhaust analyzer stabilization to ensure representative mean values for speed, torque, fuel flow, airflow, and emissions. Signal filtering applied a three sigma rule to remove transient outliers caused by mechanical oscillations in the torque arm or pressure spikes in the orifice assembly. Fuel mass flow was derived from timed volumetric displacement in the burette and converted to a mass basis using a density–temperature correlation for BSFC and Brake Thermal Efficiency (BTE) calculations. Air mass flow was derived from the orifice differential pressure using a calibrated discharge coefficient and standard orifice flow relations. Repeat runs showed variance limits of plus or minus 1.5% for BSFC and BTE and plus or minus 3 to 5% for gaseous emissions, which is acceptable repeatability for a single-cylinder direct-injection research test bed operating under controlled steady-state conditions.
Figure 2.
Data acquisition and signal layout.
2.4. Experimental Procedure
Prior to testing, the engine was serviced and operated on diesel fuel to achieve thermal stabilization and ensure that baseline performance conformed to expected reference behavior. All tests were conducted at the constant speed of 1500 rpm, representative of a typical generator or small-engine operating point. The test matrix covered four compression ratios of 12, 14, 16, and 18, and three load levels per CR (low, medium, high). The low load was set to approximately 2.2 kW–2.5 kW, which is 25% of the engine’s max output on biodiesel; the medium load was set to 4.5–5 kW, which is 50%; and the high load was set at approximately 8.5 kW–9.5 kW, which is 75–100% of full load on biodiesel. In terms of the dynamometer, these corresponded to load cell readings of roughly 10 kg, 18 kg–19 kg, and 34 kg–35 kg, respectively, which were adjusted slightly at different CRs to achieve stable speed. The highest load at CR 18 resulted in 9.43 kW brake power close to the engine’s limits, considering the stock rating of 3.5 kW was far exceeded in these short-duration tests. It was noted that at CR 12, the maximum achievable power was slightly lower, at 8.66 kW, even with full fueling, due to reduced thermal efficiency at the lower compression ratio.
For each compression ratio setting, the engine was first stabilized at the low load. Compression ratio adjustments were done by loosening the VCR adjuster lock and rotating the adjustment screw to the desired CR marking, then tightening the lock bolts. This process took about 2–3 min, during which the engine was kept idling. After adjusting the CR, the engine was loaded and allowed to reach steady state. Coolant and exhaust temperatures stabilized, typically within 5 min. Data were then recorded for that load. The procedure was repeated for the medium and high load points at the same CR. Then the engine was unloaded, the CR was changed to the next value, and the sequence continued. The order of testing was from the lowest CR to the highest CR to minimize any potential effects of carbon deposits at high CR. However, an extra baseline run at CR 17.5 with diesel was conducted mid-way and at the end to check the consistency, with no significant drift observed. Throughout testing, the coolant outlet temperature was maintained at 75 ± 2 °C using a thermostat, and the airflow was naturally aspirated, unboosted.
Key calculated results included brake power (BP), obtained from torque and speed (BP = 2π·N·T/60, in kW), BSFC (fuel mass flow divided by BP, in g/kWh), and BTE (ratio of brake power output to fuel energy input). Fuel mass flow was measured by timing the consumption of 20 mL of fuel from the burette. The timing uncertainty (<0.2 s on 60 s readings) was negligible. Airflow was measured by the pressure drop across the intake orifice and converted to mass flow corrected for ambient temperature/pressure. From these, the excess air ratio and combustion stoichiometry at each point could be inferred. Generally, the engine was running lean, representing φ = 0.4 at low load to φ = 0.9 at full load. Combustion efficiency was not measured directly, but inferred from HC/CO levels and heat balance.
Each data point reported is the average of two runs, and repeatability was within ±1.5% for BSFC/BTE and ±3% for emissions, which is acceptable for engine experiments. No major operational issues were encountered. The engine ran smoothly on WSO biodiesel at all CR settings. It was observed that at CR 12, the engine’s idle and low-load combustion was rougher, with higher cycle variability, whereas at CR 18, the combustion noise and peak pressure were notably higher. These subjective observations align with expectations and are quantified in the results. After completing all biodiesel tests, the engine was again briefly run on diesel at standard CR to ensure no lasting performance degradation, with no perceived observation, indicating that short-term operation on WSO biodiesel did not harm the engine.
2.5. Fuel Physicochemical Characterization and Energy Basis for Performance Metrics
The fuel properties used in the present study were determined from direct laboratory measurements of the same waste swine oil biodiesel (B100) batch used in the engine experiments, thereby ensuring that subsequent performance and emissions interpretations reflect the tested fuel’s actual physicochemical profile. The batch-specific physicochemical characteristics are summarized in Table 2.
Table 2.
Fuel quality parameters of WSO and WCO biodiesels after purification, compared to ASTM D6751 limits.
2.5.1. Density at 15 °C (ASTM D4052)
Density was measured at 15 °C using an oscillating U-tube digital density meter (Anton Paar DMA 5000, (Anton Paar GmbH, Graz, Austria)), in accordance with ASTM D4052 [20], within the instrument operating range of approximately 0–3 g cm−3 and 0–90 °C. The method used is based on introducing a small aliquot of sample into a temperature-controlled oscillating tube and computing density from the oscillation response after thermal equilibrium is attained. Initial calibration and recalibration after any change in test temperature were performed by reconditioning the measuring cell and determining the instrument constants from measurements with dry air and freshly boiled and cooled reagent water. The cell was cleaned with a volatile solvent, dried with dry air, and conditioned to minimize carryover, followed by air adjustment (dry air) and water adjustment (reagent water). Instrument performance at the measurement temperature was verified using a single n-nonane check, and results were accepted when the measured value met the laboratory control limit of ±0.00010 g cm−3 relative to the n-nonane reference value at 15 °C. The verification outcome and instrument constants were documented and reviewed against acceptance criteria prior to reporting sample density values.
2.5.2. Kinematic Viscosity at 40 °C (ASTM D445)
Kinematic viscosity was measured at 40 °C using an automated calibrated capillary viscometry system (CANNON CAV 4.1, (CANNON Instrument Company, State College, PA, USA)), in accordance with ASTM D445 [21]. Each sample was equilibrated at 40 °C, and the efflux time required for a fixed volume to flow under gravity between two timing marks in a calibrated capillary was recorded. Kinematic viscosity was calculated as the product of the measured efflux time and the applicable viscometer constant, and two determinations were performed per sample to obtain the reported value. The viscometry bath was maintained under strict thermal control to ensure a stable test temperature consistent with high precision practice. System calibration and verification were conducted daily and repeated after any capillary replacement or cleaning by confirming and stabilizing bath temperature using a calibrated reference thermometer, verifying viscometer constants against current capillary calibration certificates, and measuring a certified viscosity reference oil at 40 °C to confirm agreement with the certified value. Following cleaning, a post-cleaning blank timing check was performed using n-heptane as a solvent to verify the absence of residual contamination prior to accepting and reporting the sample results.
2.5.3. Flash Point (ASTM D93)
Flash point was determined using an automatic Pensky–Martens closed-cup apparatus (Koehler K16270, (Koehler Instrument Company, Holtsville, NY, USA)) in accordance with ASTM D93 [22], Procedure C (automated method for biodiesel). The sample was charged into the closed cup and heated under continuous stirring. An initial approach heating phase was used to bring the sample to the test region, defined as the temperature range starting at approximately 24 °C below the expected flash point, after which heating proceeded at 2.5–3.5 °C min−1. The ignition source was applied automatically at defined temperature intervals within this region, commencing at the test region start point and subsequently at 2 °C increments until a transient flash was detected. The corresponding temperature was recorded as the flash point. Laboratory quality control included documented pre-run checks of cup and lid cleanliness, ignitor/shutter function, stirring performance, and verification of the temperature measurement system against a traceable reference. Method performance was monitored through periodic analysis of a Pensky–Martens-certified reference material and reviewed against laboratory control limits. Additional checks were conducted weekly after servicing and when drift was suspected, including confirmation of the programmed heating rate and ignition interval settings, functional checks of ignition and detection response, and repeat CRM analysis. Barometric pressure correction was applied in accordance with ASTM D93 and the instrument algorithm before reporting results.
2.5.4. Higher Heating Value (ASTM D240)
Higher heating value or the gross heat of combustion was determined by oxygen bomb calorimetry using a Parr 6200 calorimeter (Parr Instrument Company, Moline, IL, USA) in accordance with ASTM D240 [23] under controlled laboratory temperature conditions. A nominal 1.0 g test portion of biodiesel was used, with the mass controlled to produce a temperature rise equivalent to that obtained from combustion of 0.9–1.1 g benzoic acid as required by ASTM D240. The test portion mass was recorded to the nearest 0.1 mg before combustion. The sample was combusted completely in excess oxygen within a sealed bomb immersed in the calorimeter vessel, and Higher Heating Value (HHV) was calculated from the corrected temperature rise in the calorimeter system and the calibrated calorimeter energy equivalent. The calorimeter energy equivalent (W) was established by standardization with benzoic acid, performing at least six standard combustions over a minimum of three days using charge masses of 0.9–1.1 g. For each standardization burn, the corrected temperature rise (ΔT) and corresponding W were calculated, applying the prescribed corrections for ignition wire consumption and nitric acid formation. The calorimeter was re-standardized following maintenance, bomb replacement, or any indication of control drift. On each analytical day, a benzoic acid verification burn was performed at the start of the run to confirm instrument readiness prior to sample measurements. For brake thermal efficiency (BTE) calculations, the Lower Heating Value (LHV) was used as the energy basis and was derived from the measured HHV by accounting for the latent heat of vaporization of water formed during combustion, with the heating value term applied consistently with the BTE formula, as shown in Equations (6) and (7).
2.5.5. Cetane Index (ASTM D6890)
Ignition quality testing was performed on B100 WSO for the determination of Derived Cetane Number (DCN), in accordance with ASTM D6890 [24], using an Ignition Quality Tester (IQT–D6890-type constant volume chamber, CFR Engines (IQT Product Line), Ottawa, ON, Canada) operated as a closed combustion chamber system under controlled charge and temperature conditions. The IQT platform (laboratory rig) was operated with synchronized control and data acquisition implemented on a National Instruments CompactRIO real-time controller (NI CompactRIO-9012, NI National Instrument, Austin, TX, USA) with an NI 9112 eight-slot FPGA chassis (NI National Instrument, Austin, TX, USA). Temperature acquisition was implemented using K-type thermocouples connected to an NI 9213 thermocouple input module (NI National Instrument, Austin, TX, USA), while quasi-static analog acquisition for supporting channels, including charge pressure and injector actuation-related pressure, was implemented using an NI 9215 module (NI National Instrument, Austin, TX, USA). Combustion pressure, which provided the primary signal for ignition delay determination and DCN calculation, was measured using a Kistler 6121 piezoelectric pressure transducer (Kistler Group, Winterthur, Switzerland) mounted in a water-cooled tee arrangement. Optical and timing diagnostics were available as supporting checks, including ignition/flame luminosity detection using a Honeywell 5620 Optoschmitt detector (Honeywell, Charlotte, NC, USA) installed in the optical fitting and injection/spray timing confirmation using a diode laser–phototransistor arrangement comprising a Quarton VLM 635-01 LPA diode laser module (QUARTON Inc., New Taipei City, Xizhi District, Taiwan) and an Optek 803 SL phototransistor receiver (TT Electronics (Optek Technologies Brand, Woking, UK)).
Before each test session, the coolant system was energized through an uninterrupted power supply, and coolant circulation was confirmed using the instrument flow indicator. The chamber wall/surface temperature was set to the method set point and allowed to stabilize before injections commenced. System integrity was verified using a pre-test leak rate gate check. The exhaust valve was closed, the chamber was charged to the standard operating pressure, the intake valve was then closed to isolate the vessel, and pressure decay was monitored for 20 s with the charge amplifier in DC–Long mode. Testing proceeded only when the leak rate met the laboratory acceptance criterion of less than 3.5 kPa s−1 from an initial pressure of 21.37 bar, ensuring stable charge conditions during ignition delay acquisition.
Calibration and ongoing readiness control were implemented using n-heptane as the ASTM D6890 calibration reference material, with the n-heptane check performed at the start of each analytical day and repeated after any interruption, servicing activity, or indication of drift. The temperature setting was adjusted as required to reproduce the assigned ignition delay target (ID_ARV) of 3.78 ms. This n-heptane activity was applied as a commissioning and quality-control gate and was not treated as part of the biodiesel experimental matrix. Following successful n-heptane calibration, the biodiesel testing was conducted without multi-fuel switching, and the fuel system was conditioned with the same biodiesel before data acquisition to ensure stable delivery and repeatable injections. A short preliminary automated sequence was executed at the start of each session to confirm subsystem operation and optical alignment before the main test sequence was initiated. During testing, chamber charge conditions and temperature were maintained at their set points by the instrument regulators and control system, and results were accepted only when logged operating conditions remained within laboratory stability limits and ignition delay signals were repeatable across replicate injections. Measurement chain verification was performed for temperature and pressure channels. The thermocouple acquisition chain was verified using a Fluke 741B process calibrator (Fluke Corporation, Everett, WA, USA) configured to simulate K-type thermocouple outputs at defined temperatures. Pressure channel verification was performed using a Druck DPI 620 pressure calibrator (Druck (Baker Hughes), Leicester, UK) to confirm pressure signal conversion relationships used for monitoring charge conditions and for uncertainty assessment.
2.5.6. Acid Value (ASTM D664)
Acid value was determined by non-aqueous potentiometric titration in accordance with ASTM D664 [25].Test Method A and reported as milligrams of potassium hydroxide per gram of sample (mg KOH g−1), representing the amount of base required to neutralize acidic constituents in the fuel. The biodiesel sample test portion of approximately 10.0 g was dissolved in the ASTM D664 titration solvent composed of toluene, propan-2-ol, and water = 500:495:5 (mL per liter). The solution was titrated with 0.1 mol L−1 KOH in an alcoholic medium while monitoring electrode potential to obtain a potentiometric endpoint, thereby improving endpoint objectivity and repeatability. The KOH titrant normality was standardized against potassium hydrogen phthalate (KHP) as a primary standard, and titrant concentration control documentation was maintained. A solvent blank was analyzed routinely and applied as a correction to sample results, and an acid number check standard with oil-certified reference material was analyzed at least weekly to verify ongoing method performance. Electrode conditioning, cleaning, and storage were performed in accordance with the laboratory standard operating procedure to maintain a stable potentiometric response prior to reporting final acid value results.
2.5.7. Free and Total Glycerol (ASTM D6584)
Free and total glycerol were quantified using gas chromatography after derivatization, in alignment with ASTM D6584 [26], on a gas chromatography–mass spectrometer (Agilent 7890–5975C, Agilent Technologies, Santa Clara, CA, USA). The method is based on converting polar glycerol and glyceride species into more volatile derivatives to enable reliable chromatographic separation and quantification. Accordingly, samples and calibration solutions were derivatized by silylation using N-methyl-N-(trimethylsilyl) trifluoroacetamide (MSTFA) under fixed time–temperature conditions specified in the laboratory standard operating procedure. Following MSTFA addition, the derivatization mixture was maintained at room temperature, approximately 20–25 °C, for 20 min to complete silylation, after which the derivatized solution was diluted as required and analyzed by GC. Quantification was performed using an internal standard approach and multi-component calibration to determine free-glycerol and bound-glycerol species of mono-, di-, and triglycerides, which were subsequently expressed on an equivalent glycerol basis as required by the method.
For each analytical batch, a five-level calibration series was prepared using internal standards, and calibration acceptance was based on meeting the laboratory linearity criterion of r2 threshold and fit-for-purpose response performance. A solvent blank was analyzed to confirm the absence of carryover before sample injections, and continuing calibration verification standards were injected periodically throughout the sequence to confirm calibration stability. Retention time consistency and chromatographic performance were checked using the calibration/standard mixture for glyceride species, and instrument response stability was monitored across the run to ensure reliable identification and quantification before reporting final free and total glycerol results.
2.5.8. FAME Content (EN 14103)
FAME content was quantified directly on the finished biodiesel by gas chromatography in accordance with EN 14103 [27] using a Shimadzu GC-2014 system (Shimadzu Corporation, Kyoto, Japan) operated with a temperature program suitable for resolving the biodiesel methyl ester envelope. The method was based on an internal standard quantification approach using methyl nonadecanoate (C19:0) to support robust ester-content determination for WSO biodiesel. An internal standard solution of methyl nonadecanoate (C19:0) was prepared in GC-grade n-heptane at 10 mg mL−1, and a fixed volume (1.00 mL) of this internal standard solution was added to each weighed biodiesel test portion prior to GC analysis. Total ester content was then calculated from the integrated FAME peak region relative to the internal standard response under identical chromatographic conditions. The instrument was conditioned to achieve a stable baseline and consistent retention time performance at the programmed operating conditions. Calibration was established for each analytical batch by preparing a multi-level internal standard calibration series in accordance with EN 14103, ensuring that each calibration level contained the internal standard at the same concentration used for sample preparations. The calibration curve was accepted only after meeting the laboratory’s linearity acceptance criteria and demonstrating consistent internal standard response across the calibration range. Chromatographic resolution and retention order were verified using a certified FAME mixture to confirm adequate separation across the ester region and to validate peak identification boundaries for integration. A biodiesel quality control material was analyzed within the batch to confirm method performance under routine conditions, and results were accepted only when the QC outcome satisfied laboratory control limits.
Each biodiesel specimen was homogenized, combined with the internal standard, and injected under the same GC conditions used for calibration. Ester content was calculated by integrating the defined FAME peak region and applying the EN 14103 internal standard calculation, with batch calibration used to convert response ratios to ester content. Sequence integrity was maintained by monitoring internal standard area stability and retention time consistency throughout the run, and any deviation from control limits triggered corrective action and repeat analysis before the final results were released. Table 2 shows the measured key properties of the tested fuels used in BSFC/BTE calculations.
2.6. Engine Mapping
Engine maps were developed to characterize the variation in performance and regulated emissions as coupled functions of compression ratio and engine load. The mapping approach combined filled contour representations and three-dimensional surface conception to capture both local gradients and the global structure of the response fields across the operating domain. In the maps, color-filled isopleths were used to identify regions of rapid variation, local extrema, and transitional zones, thereby highlighting operating regimes where changes in compression ratio or load produce disproportionate effects on the measured outputs. Complementary three-dimensional surface plots were employed to represent the overall topology of the response variables and to facilitate the interpretation of interaction effects between the two control parameters. For each response variable, the mapping framework is expressed as a continuous response surface of the form
where Z denotes the performance or emission metric under consideration, including BTE, BSFC, NOx, CO, unburned HC, and CO2; f is an unspecified mapping function representing the dependence of Z on the operating inputs; CR is the compression ratio of the engine; and Load is the engine load or brake load. Because experimental measurements were obtained at discrete operating points, interpolation was applied using grid-based numerical methods to construct continuous surfaces over the compression ratio–load regime. This procedure ensured smooth transitions between measured points while preserving the underlying experimental trends, enabling consistent graphic comparison of performance and emissions behavior across the full operating blanket.
2.7. Uncertainty and Sensitivity Analysis
This uncertainty and sensitivity analysis quantifies the confidence intervals associated with measured operating variables, derived performance metrics, and regulated emission responses. The evaluation incorporates instrument accuracy limits, measurement repeatability, calibration drift, sampling resolution, and error propagation through the performance and emissions calculations. The objective is to establish statistically defensible uncertainty bounds for BP, BSFC, BTE, and regulated emissions NOx, CO, HC, and CO2 across the tested CR–load regime.
2.7.1. Measurement Channel Uncertainty Framework
For each measured variable g, the combined standard uncertainty is obtained by aggregating the dominant uncertainty contributors associated with the instrument and the steady-state data window. This is expressed as
where is the combined standard uncertainty of g, is the uncertainty component due to instrument accuracy from manufacturer specification with same unit as g, represents uncertainty component due to instrument drift over the measurement period with same unit as g, is the uncertainty component due to instrument resolution with same unit as g, and is the uncertainty component due to repeatability representing run to run variability under nominally identical conditions with same unit as g.
To report uncertainty at a confidence level suitable for engineering interpretation, the combined standard uncertainty is expanded using a coverage factor k = 2, giving the 95% confidence uncertainty band
where is the expanded uncertainty of g corresponding to an approximately 95% level of confidence; k represents the coverage factor used to expand the standard uncertainty to the stated confidence level; is the combined standard uncertainty of g, typically obtained by the root sum of squares of individual uncertainty components; and “k = 2” is the commonly used coverage factor for 95% confidence when the uncertainty distribution is approximately normal and degrees of freedom are sufficiently large.
Because BTE and BSFC are derived performance quantities, their uncertainty must be propagated from the uncertainties in torque, rotational speed, fuel flow, and heating value. The propagation begins with brake power, which is calculated from torque and speed as
where BP is the brake power, in kW; N represents engine speed, in revolutions per minute (rpm); and T is the brake torque, in N·m.
Since brake power depends multiplicatively on speed and torque, its relative combined standard uncertainty follows from standard first-order propagation of independent terms:
where is the standard uncertainty in brake power with the same unit as BP, represents standard uncertainty in engine speed with the same unit as N, and is the standard uncertainty in torque with the same unit as T.
With brake power established, BTE is obtained by relating useful shaft output to the chemical energy rate in the fuel stream:
Because BTE depends on brake power, fuel mass flow rate, and lower heating value, the relative combined standard uncertainty is obtained by propagating the relative uncertainties of these three terms:
where BTE is the brake thermal efficiency, typically reported as a fraction or %, is the combined standard uncertainty of BTE the same unit as BTE, BP represents brake power (kW), is the standard uncertainty in brake power (kW), mf is the fuel mass flow rate (kg/h), represents standard uncertainty in fuel mass flow rate, LHV is the lower heating value of WSO biodiesel (kJ/kg), and is the standard uncertainty in LHV (MJ/kg).
Brake-specific fuel consumption is then computed as the mass flow of fuel required per unit brake power, scaled to an hourly basis:
Since BSFC depends primarily on fuel mass flow and brake power, its relative combined standard uncertainty follows directly from the propagation of these two contributing terms:
where is the brake-specific fuel consumption, typically in g/kWh or kg/kWh, and is the standard uncertainty in BSFC with the same units as BSFC.
For completeness, the general first-order uncertainty propagation law applied to any derived response, y = f (xi), is written in expanded (95%) form as
where is the output quantity result calculated from several inputs , represents expanded uncertainty of y at approximately 95% confidence with the same units as y, is the i-th input variable used to calculate y, represents the expanded uncertainty of input at approximately 95% confidence with the same units as , and is the sensitivity coefficient of y with respect to .
Finally, the air–fuel ratio is obtained from the measured air and fuel mass flow rates as
where AFR is the air–fuel ratio, is the air mass flow rate (kg/h), and is the fuel mass flow rate.
The same propagation structure in Equation (10) can be applied to AFR when its uncertainty is required.
Figure 3 provides a consolidated representation of the confidence limits associated with each measured and derived parameter, complementing the numerical uncertainty bands reported. The figure presents a bar-based comparison of the expanded uncertainty () across all measurement channels, enabling direct identification of the dominant contributors to cumulative error within the measurement chain. Emissions-related variables (NOx, HC, and CO) exhibit the widest uncertainty bands, primarily due to analyzer accuracy constraints, span drift, and signal stability limitations at elevated exhaust temperatures. In contrast, performance metrics derived from torque and fuel flow measurements (BP, BSFC, and BTE) display comparatively lower uncertainty levels, reflecting the stability and repeatability of the mechanical and volumetric measurement systems over the tested operating window. Overall, Figure 3 establishes the relative weighting of each measurement channel in contributing to downstream uncertainty propagation and supports the robustness of the reported performance and emissions trends. The increasing error magnitude at higher compression ratios is consistent with elevated in-cylinder pressure and thermal gradients, which amplify analyzer sensitivity and drift. The pattern demonstrates that uncertainty is not uniform across the operating domain; instead, it is operationally dependent, with the highest sensitivity concentrated at conditions associated with advanced ignition and peak combustion temperature.
Figure 3.
Final uncertainty band across measured and derived variables.
2.7.2. Sensitivity Model for CR–Load Interaction
Data acquisition and online performance evaluation, including BP, BSFC, and BTE, were performed using EngineSoftLV® (LabVIEW 9.0), and the logged dataset was subsequently exported for offline analysis. Compression ratio–load response surface construction, interpolation of performance emissions maps, and standard sensitivity analysis to quantify the relative influence of compression ratio and engine load on each response variable were implemented in Python 3.13.12 using established scientific libraries such as NumPy (2.3.5), pandas (v2.2.3), SciPy (v1.17.0), statsmodels (v0.14.6), scikit-learn (v1.8.0), and Matplotlib (v3.10.8). Sensitivity outputs were computed directly from the fitted response surfaces and reported as normalized sensitivity indices to enable cross-metric comparison. Only the sensitivity results required to interpret the response maps are retained. Where applicable, GT-POWER (v2025) was employed for complementary one-dimensional engine simulation and parametric benchmarking of the observed trends.
The partial sensitivity of the response to each operating parameter is defined as
Normalization of these coefficients provides a direct comparison of influence across variables with differing measurement scales. The normalized indicators are therefore represented as
where “y” is the response output variable, e.g., BTE, BSFC, NOx, CO, HC, or CO2; CR represents the compression ratio; Load is the engine load; “” is the sensitivity coefficient of y to compression ratio with the same units of y per unit CR; “” is the derivative of y with respect to compression ratio, representing the local sensitivity of y to changes in CR while holding load constant; “” represents the partial derivative of y with respect to load, representing the local sensitivity of y to changes in load while holding CR constant; “” is the sensitivity coefficient of y to load with the same units of y per unit load; and “” is the larger of the two sensitivity magnitudes used as the normalization reference, with the larger one scaled to 1.
3. Results and Discussion
This section provides a structured interpretation of the experimental results obtained from the variable compression ratio engine operating on waste swine oil biodiesel, with emphasis on isolating and explaining the individual and combined effects of compression ratio and load on engine performance and regulated emissions. The steady-state measurements summarized in Table 3, including brake thermal efficiency, brake-specific fuel consumption, and the principal exhaust emission species (NOx, CO, HC, and CO2), establish the quantitative basis for the subsequent analysis. These data enable direct evaluation of combustion behavior and emission formation mechanisms across the investigated compression ratio–load domain and support the trend-based and map-based discussions presented in the following subsections.
Table 3.
WSO experimental results.
3.1. Engine Performance Characteristics
Engine performance characteristics are analyzed to quantify how compression ratio and load influence brake power output, fuel consumption, and thermal conversion behavior for WSO biodiesel across the tested operating regime.
3.1.1. Brake Thermal Efficiency
Figure 4 maps the BTE of the engine across the tested range of compression ratios and loads using WSO biodiesel. As expected, BTE improves noticeably with increasing engine load for all compression ratios, while a higher compression ratio also yields consistently better efficiency at a given load. At a low load of 25% (13–19 Nm torque output), BTE was in the range of 29–32% for biodiesel, with the lowest value of 29.0% occurring at CR 12 and the highest value of 32.4% at CR 18. The efficiency gain from raising CR is more pronounced at a light load of about a 3.3 percentage point increase, representing a relative 11% improvement, going from CR 12 to 18 at 2.7 kW output. This reflects the better combustion and reduced heat loss fraction at higher compression, which elevates the peak cycle temperature and pressure, thereby extracting more work from the fuel [14,16,17]. At medium load of 50% (30 Nm) to high loads of 75% to 100% (55–60 Nm), BTE reached much higher values of 36–42%. The peak efficiency observed was 41.7% at the highest load (9.4 kW) and CR 18. Interestingly, at these high loads, the effect of compression ratio on BTE became minor; BTE at CR 12 was 41.4% at 8.66 kW, essentially on par with 41.7% at CR 18 (9.43 kW). This convergence suggests that at full load, the engine operates near its air usage limit, i.e., nearly stoichiometric combustion in local regions, and additional compression does not significantly improve the already high combustion completeness. It may also be that pumping losses at high load offset some of the theoretical CR efficiency benefit. Any potential increase in rapid combustion at high CR did not reduce net efficiency in our data.
Figure 4.
Brake thermal efficiency (BTE) against brake torque for WSO biodiesel at various compression ratios.
From Figure 4, higher compression ratios increase efficiency slightly, especially at lower loads. BTE increases with load for all cases, reflecting reduced relative heat losses and more complete combustion at higher fueling rates. Each curve represents a different compression ratio (CR) from 12 to 18, with markers at the tested load points. Engine performance was evaluated across the full-load sweep and four compression ratios (see Supplementary Figure S1) to quantify the effects of waste swine oil biodiesel on thermal conversion, fuel consumption, and delivered shaft power. The parameters examined include brake thermal efficiency, brake-specific fuel consumption, brake power, and torque. These metrics establish the fundamental response of the variable compression ratio engine to WSO biodiesel under controlled experimental conditions. The line progression in Figure S1 reflects the monotonic rise in thermal conversion as load increases, driven by reduced relative heat losses. Figure S2 shows improved efficiency at elevated mechanical loading, indicating that higher compression improves charge temperature and supports more complete combustion. Figure S3 illustrates the gain in thermodynamic performance with increasing compression ratio, while Figure S4 mirrors BTE reaching its maximum values, reflecting enhanced in-cylinder thermodynamic conditions at this setting.
3.1.2. Brake-Specific Fuel Consumption
BSFC results are presented in Figure 5. The BSFC curves mirror the inverse of BTE, since BSFC (g/kWh) is essentially inversely proportional to efficiency for a given fuel. At a low load of 25%, BSFC for WSO was around 300–310 g/kWh at CR 12, dropping to 277 g/kWh at CR 18, which is again about an 11% improvement with higher CR at that point. These numbers are higher than typical diesel BSFC values in the same engine, as expected due to biodiesel’s lower energy content and slight efficiency differences [11]. For the record, published data indicate that diesel BSFC would be roughly 240–270 g/kWh at these light loads [1], indicating that the WSO biodiesel incurred about a 10–15% fuel consumption penalty consistent with its 11% lower LHV and a small additional loss from lower combustion efficiency at low load. As the load increased, BSFC fell substantially. The minimum BSFC recorded was 215 g/kWh at the highest load with CR 18 corresponding to the peak BTE above. Even at CR 12, BSFC at a full load of 75–100% was 216.5 g/kWh, nearly as low. Such values approach typical diesel engine figures at full load for this size engine, diesel BSFC = 200 g/kWh. The gap between biodiesel and diesel BSFC narrows at high loads because the relative effect of fuel heating value diminishes when the engine is operating near its optimal efficiency. We note that at medium to high loads, raising CR had a diminishing effect. BSFC at 30 Nm was 242 g/kWh for CR 14 against 239 g/kWh for CR 18, which represents only a 1.5% difference. Statistically, these differences are near experimental uncertainty, indicating that in the mid- to upper-load range, the compression ratio could be tuned primarily based on emissions or knock limits without greatly affecting fuel efficiency for biodiesel.
Figure 5.
Brake-specific fuel consumption (BSFC) versus brake torque for WSO biodiesel at various compression ratios.
Figure 5 shows that BSFC decreases, indicating that fuel economy improves with increasing load due to higher BTE. Higher compression ratios slightly reduce BSFC at each load. Complementing the BTE trends, brake-specific fuel consumption was assessed to quantify changes in fuel consumption per unit of power output in Figure S5a–d. WSO biodiesel tends to exhibit higher BSFC than petroleum diesel due to its lower calorific value. However, the effect of the compression ratio can partially offset this drawback. The figures indicate that increasing the compression ratio consistently reduces BSFC across the load range, due to improved combustion completeness and reduced ignition delay.
Comparing the performance results with other studies, the study’s BTE range of 29–42% for WSO aligns well with reported values for biodiesels in single-cylinder engines. Zheng and Cho [1] found BTE around 22–32% for B10–B20 lard biodiesel at 50% load and 1800 rpm, which is lower in absolute terms since their load and speeds were different, but they similarly noted 2–3% lower BTE for biodiesel blends compared to diesel. In this study, running neat biodiesel at high load still achieved over 40% efficiency, which is encouraging. Zheng and Cho [1] observed only a slight drop in BTE from 30.2% on diesel to 28.3% on B100 at 75% load in a 5 hp engine, which is in line with our finding that the WSO biodiesel can reach BTE nearly equivalent to diesel at high loads. The small efficiency penalty of biodiesel is often attributed to its lower heating value and possibly higher viscosity, affecting mixture formation. The results of this study reinforce that at high load, the oxygen content of biodiesel may actually enhance combustion enough to narrow the efficiency gap with diesel [1]. On the other hand, at very light loads, the poorer atomization due to higher viscosity and quenching of combustion causes a more noticeable drop in efficiency for biodiesel. This suggests that strategies like increasing CR, as was done in this study, or using pilot injection could be particularly beneficial in light load operation on biodiesel to maintain efficiency.
In summary, the engine performance mapping shows that WSO biodiesel provides robust performance across a wide range of conditions. The engine’s response to load is dominant; moving from 25% to full load roughly doubled the efficiency from 29% to 41%, and halved BSFC. The effect of compression ratio is secondary but still positive for efficiency, confirming that a higher CR is beneficial. The findings imply that running an engine at higher compression, if structurally feasible, could compensate for some of biodiesel’s efficiency loss at low loads. This must be balanced against other factors like NOx emissions and mechanical stress, as discussed next.
3.1.3. Torque and Brake Power Characteristics
Brake power and torque provide a direct understanding of the mechanical output of the engine. These quantities rise with load by definition but vary with compression ratio due to changes in combustion phasing and cylinder pressure development, as shown in Figures S6a–d and S7a–d. Torque output increased approximately linearly with dynamometer load, as expected for a fixed-speed engine. Differences across compression ratios were modest but consistent. Higher compression ratios produced slightly higher torque values at matching loads due to improved combustion stability and elevated peak pressure. Brake power followed the same general pattern, reflecting the direct relationship between torque and shaft output. The incremental gains at higher compression ratios align with established thermodynamic predictions, where higher compression ratios elevate indicated power through more favorable pressure–volume loop characteristics.
These results are compatible with diesel benchmark data and with findings reported in controlled studies by [28]. Figure S6a–d show that increasing the compression ratio produces measurable gains in delivered shaft output, attributable to improved thermodynamic efficiency of the charge. Figure S7a–d further indicate that the output response is largely linear and primarily governed by dynamometer load, with only marginal additional gains observed at higher compression ratios.
3.2. Emissions Characteristics
The influence of compression ratio and load on exhaust emissions for WSO biodiesel was significant and generally followed expected diesel engine behavior, with some distinctions due to the fuel’s characteristics. We present the emissions of NOx, CO, HC, and CO2 in Figure 6, Figure 7, Figure 8 and Figure 9 and discuss each in turn. Particulate matter emissions were not directly measured in this study, but qualitative observations of the exhaust smoke were noted.
Figure 6.
NOx emissions against brake torque for WSO biodiesel at different compression ratios.
Figure 7.
Carbon monoxide (CO) emissions against brake torque for WSO biodiesel at CR 12–18.
Figure 8.
Unburned hydrocarbon (HC) emissions versus brake torque for WSO biodiesel at different CRs.
Figure 9.
Carbon dioxide (CO2) emissions versus brake torque for WSO biodiesel at different CRs.
3.2.1. Nitrogen Oxides (NOx)
Figure 6 shows NOx emissions in ppm as a function of load for the four CRs. NOx increases with both load and CR. At 10 to 12 Nm, NOx ranged from 193 ppm at CR 12 to 269 ppm at CR 18, which corresponds to an increase of about 39% attributable to the CR increase. At 30 Nm, NOx increased to 342 ppm at CR 18 compared with 266 ppm at CR 12. The highest NOx emissions occurred at 55 to 60 Nm, reaching 488 ppm at a compression ratio of 18 and 413 ppm at a CR of 12. Generally, shifting from low load and low CR to high load and high CR increased NOx by a factor of approximately 2.5. This pattern is expected because NOx formation is strongly temperature-dependent. Higher compression increases the end of compression temperature, and higher fueling at elevated load increases the peak combustion temperature, which promotes thermal NOx formation through the Zeldovich mechanism [18]. Fuel-bound oxygen and a higher cetane number in biodiesel can also advance combustion phasing and elevate local temperatures, resulting in NOx levels that are often comparable to or higher than those of diesel under similar conditions [10,11]. The experimental result data also quantitatively clarify the relative influence of load and CR. Increasing the CR from 16 to 18 at high load increased NOx by 25 ppm, which corresponds to a 5.4% rise. In contrast, increasing the load at CR 18 from 18 Nm to 32 Nm increased NOx by 73 ppm, which corresponds to 23%, and a further increase from 32 Nm to 60 Nm increased NOx by 146 ppm, which corresponds to 40%. These comparisons indicate that load exerts a stronger influence on NOx formation than CR over the investigated regime, while CR contributes additively by increasing the NOx sensitivity to torque. The absolute NOx levels measured with WSO biodiesel at full load, 413 to 488 ppm, are comparable to levels typically reported for naturally aspirated diesel engines operating without aftertreatment. Based on reference benchmarking, diesel operation at high load and CR 18 would be approximately 400 ppm, whereas WSO biodiesel yielded 488 ppm, which corresponds to an increase of about 20%. At lower load, diesel would be approximately 180 ppm compared with about 269 ppm for WSO biodiesel at CR 18, which corresponds to an increase of roughly 50%. This indicates that the relative NOx increase associated with biodiesel can appear larger at light load because baseline diesel NOx is low in that regime, whereas at high load, NOx formation approaches thermodynamic limits and diesel NOx is already elevated. Godiganur, et al. [29] and Zheng and Cho [1] reported higher NOx for WSO biodiesel blends, and other studies have reported increases of around 20% for B20 relative to diesel at high load, with larger relative increases at higher biodiesel fractions. The use of B100 and elevated CR in the present work strengthened NOx formation while simultaneously supporting large reductions in smoke and particulate emissions.
NOx control therefore remains essential for application. Retarded injection timing, exhaust gas recirculation, and selective catalytic reduction (SCR) are established measures for reducing NOx during biodiesel operation [10,11]. Sathiyagnanam, et al. [11] demonstrated that selective catalytic reduction can substantially reduce NOx while maintaining low particulate emissions. The present results also show that CR adjustment has a measurable effect on NOx, with each two-unit increase in CR producing an approximate 5 to 10% rise. This suggests an operating strategy that applies a higher CR at low load to improve efficiency and moderate CR at high load to limit NOx, subject to validation under transient duty cycles and active CR control.
3.2.2. Carbon Monoxide (CO)
CO emissions provide a useful indicator of combustion completeness. Figure 7 shows CO emissions as a percentage of exhaust gas by volume across the same CR and load conditions. WSO biodiesel exhibited consistently low CO emissions over the full CR and load regime investigated, with concentrations generally in the range of 0.15 to 0.30% by volume, which is characteristic of a well-combusted diesel cycle. CO remained minimal even under light load operation, where incomplete combustion is typically most pronounced. In contrast, diesel operation is generally associated with higher CO emissions in this regime due to poorer mixing and the absence of fuel-bound oxygen, with typical low-load values of the order of 0.2 to 0.5%. In the present measurements, CO reached about 0.30% at the lowest load, then decreased steadily to below 0.17% under higher load conditions, confirming very complete combustion with WSO biodiesel.
The CO trends were opposite to those observed for NOx, with CO decreasing as load increased and also decreasing with increasing CR. At low load, CO was about 0.30% at CR 12 and decreased slightly to 0.287% at CR 18. This indicates that even at CR 12, the engine combusted WSO biodiesel reasonably well under excess air conditions, although incomplete oxidation persisted due to lower cylinder temperatures and wall quenching. At 30 Nm, CO decreased to about 0.25% at CR 12 and 0.24% at CR 18. At the highest load, CO emissions were extremely low, reaching 0.167% at CR 12 and 0.150% at CR 18, values close to the detection limit and indicative of near complete oxidation to CO2. The beneficial effect of CR on CO was less pronounced than that of load, but higher CR consistently reduced CO at a given torque by increasing in-cylinder temperature and pressure and promoting oxidation of CO to CO2. The low CO levels observed for WSO biodiesel are consistent with the behavior of oxygenated fuels. Fuel-bound oxygen promotes more complete oxidation, and biodiesel typically produces less CO than diesel under comparable conditions [8,18]. Khujamberdiev and Cho [7] reported 0.45% CO for diesel compared to 0.23% for B80 at high speed, representing a reduction of nearly 50%. Under the most favorable conditions in the present study, WSO biodiesel at CR 18 and high load produced about 0.15% CO, for which diesel would be expected to be higher, commonly around 0.2 to 0.3% in similar single-cylinder operation. Additional mechanisms may also contribute, since saturated fatty acid methyl esters typical of lard-derived biodiesel can shorten ignition delay and promote combustion characteristics that reduce locally quenched lean pockets where CO forms [1,6]. Generally, CO decreased monotonically with load because higher load increases combustion temperature and improves oxidation completeness, and no evidence of a high load incomplete combustion transition was observed. The near-zero CO at the highest load conditions also implies adequate air availability, consistent with an estimated equivalence ratio remaining below unity at the upper operating point. In summary, CO emissions were very low for WSO biodiesel across all tested conditions, and increasing CR further reduced CO, particularly in the low-load region.
CO emissions decline with increasing load from around 0.30% at low load down to 0.15% at high load, indicating more complete combustion at higher engine output. Higher compression ratios also yield slightly lower emissions. These low CO values, typically ≤0.3%, highlight the effectiveness of the oxygen-rich biodiesel in promoting complete fuel oxidation [7,8]. Diesel fuel under similar conditions would typically produce higher CO, particularly at low loads.
3.2.3. Unburned Hydrocarbons (HC)
Figure 8 presents total unburned HC emissions measured in ppm as propane equivalent. The HC trends closely mirror those of CO because both originate from incomplete combustion. HC emissions were consistently low for WSO biodiesel across the full CR and load regime. At low load, HC emissions were approximately 52 to 53 ppm at CR 12 and 14, decreasing slightly to about 51 ppm at CR 16 and 18. This corresponds to a modest 3 to 4% reduction with increasing CR and is within typical experimental scatter, indicating that CR had a limited influence on HC under idle and light-load conditions. In contrast, load exerted a stronger effect. At 30 Nm, HC decreased to about 45 ppm at CR 12 and 44 ppm at CR 18. At full load, HC emissions were very low, reaching about 30 ppm at CR 18 and 32 to 33 ppm at CRs 12 and 14. The small spread at high load indicates that combustion was close to complete across all CRs once sufficient temperature and fuel throughput were available. At low load, the slightly higher HC at lower CR suggests that a portion of fuel or quenched mixtures escaped oxidation when compression temperatures were lower.
These trends are consistent with general compression ignition engine behavior on biodiesel. Biodiesel fuels commonly reduce HC emissions relative to diesel because fuel-bound oxygen supports oxidation in locally lean zones, and higher cetane quality reduces ignition delay, limiting over-mixing and quenching. Reductions of approximately 20 to 50% relative to diesel are widely reported for biodiesel fuels [1]. Diesel engines commonly exhibit 80 to 100 ppm HC at idle, whereas WSO in the present study recorded values near 52 ppm, consistent with this established behavior. The present results also show that higher CR can further reduce HC, although the incremental effect is modest compared with the dominant load effect. A comparison of the tested load range indicates that increasing load from light to high conditions produced an approximately 40% reduction in HC emissions, confirming that higher combustion temperatures and improved oxidation at elevated load are the primary drivers of HC reduction.
The absolute HC levels measured here are also consistent with previous WSO biodiesel studies. Khujamberdiev and Cho [30] reported that HC decreased from 36 ppm for diesel to 20 ppm for WSO B80 at 1800 rpm, and the present B100 values of approximately 30 to 50 ppm fall within the same overall range, reinforcing that WSO biodiesel combustion leaves little unburned fuel, especially at higher load. The low HC emissions also have practical air quality relevance, as reductions in products of incomplete combustion lower emissions of toxic carbon monoxide and unburned HCs during biodiesel operation. In addition, biodiesel contains negligible aromatic compounds relative to petroleum diesel, and therefore, the HC species present in biodiesel exhaust are generally less dominated by polycyclic aromatic precursors that are associated with higher toxicity. Some fraction of the unburned HCs may also include FAME, such as methyl oleate, which exhibits comparatively lower chemical reactivity. Reported ranges indicate diesel operation at high load can be on the order of 0.5 to 1.0 g per kWh, while biodiesel operation commonly falls near 0.2 to 0.4 g per kWh, indicating a marked reduction [7,8]. Overall, HC emissions for WSO biodiesel were low and decreased with increasing load, with a modest improvement at higher CR, consistent with more complete combustion enabled by the oxygenated nature of biodiesel [30,31,32].
3.2.4. Carbon Dioxide (CO2)
CO2 emissions are a measure of complete combustion products and are directly related to fuel carbon consumption. Figure 9 shows the CO2 volume percentage in the exhaust. As expected, CO2 emissions rise with engine load, since more fuel is burned to release more power, thus producing more CO2. At the lowest load, CO2 concentrations were 2.47% at CR 12 to 2.58% at CR 18. These values represent the background CO2 in the exhaust under lean conditions. With increasing engine load, CO2 emissions increased to 2.85% at medium load for a compression ratio of 18, compared with 2.75% at a compression ratio of 12. At full load, CO2 reached about 3.4% vol at CR 18, compared to 3.3% at CR 12. The effect of compression ratio on CO2 is quite small. Higher CR gives slightly higher CO2 at a given load, which aligns with the slightly more complete oxidation of CO to CO2 and the slightly lower CO/HC observed. Essentially, the carbon that would have been in CO or HC is instead fully oxidized to CO2 when using a higher CR, hence a marginal CO2 increase. However, the dominant factor is load; CO2 roughly scales with fuel consumption and load output. The peak of 3.4% corresponds to the study’s highest fuel flow at 9.4 kW. If the theoretical maximum CO2 for stoichiometric combustion, which is around 10–12% CO2 for diesel engines at λ = 1, is considered, this study’s values indicate that the engine was running quite lean, showing λ on the order of 2–3 at low load, decreasing to 1.2 at full load. These CO2 numbers are consistent with a lean-burn diesel. In reported studies conducted at 25% load, WSO B80 produced a CO2 concentration of 2.9% compared with 2.4% for diesel fuel, a trend that is consistent with the mid-load results observed in the present investigation [33,34]. The slightly higher CO2 for biodiesel is mainly due to needing more fuel mass, depicting more carbon mass flow for the same power, given biodiesel’s lower energy content. In this study with WSO B100, this effect is present; WSO biodiesel’s carbon content per MJ is a bit higher than diesel’s, and the BSFC was 10% higher, so CO2 is expected to be a bit higher for the same load. If a diesel baseline at 9 kW produced approx. 3.2% CO2, the study’s 3.4% is in line with possibly 5% more CO2, which simply reflects the extra fuel burned. It is important to note that while tailpipe CO2 vol% is slightly higher for biodiesel due to higher fuel consumption, the net CO2 emissions are still far more climate-friendly because the carbon in biodiesel originates from atmospheric CO2 through animal feed, making it part of the biogenic carbon cycle. From a regulatory perspective, the increased CO2 in the exhaust is not a concern in terms of local pollution because CO2 is not a regulated pollutant in the same sense as CO, HC, NOx, and PM; rather, it ties into lifecycle greenhouse gas considerations. However, efficient combustion, reflected by high CO2 and low CO, is a sign of good combustion. The experimental results therefore indicate that the WSO biodiesel was combusted very completely with high CO2 and low CO, especially at higher loads. The slight increase of CO2 with CR emphasizes again that more complete combustion with less CO and HC was achieved at higher CR, converting more of the fuel’s carbon to CO2.
3.2.5. Particulate Matter (PM)/Smoke
Although PM mass was not measured directly, smoke opacity and visual exhaust observations were recorded qualitatively. Throughout the test campaign, the exhaust appeared visibly cleaner with WSO biodiesel than would typically be expected with petroleum diesel, particularly at high load, where conventional diesel operation commonly produces visible smoke. At full load on WSO biodiesel, the opacity meter indicated approximately 5%, corresponding to virtually smokeless combustion. For comparison, diesel operation at full load in an engine of this class often produces clearly visible smoke, with typical opacity levels on the order of 20 to 30%. These observations align with the literature showing that waste animal fat biodiesel can substantially reduce particulate emissions relative to diesel, commonly by 40 to 60% or more [7,8]. Khujamberdiev and Cho [30] also reported markedly reduced particulate emissions when operating on lard oil biodiesel, supporting the present qualitative findings.
The very low CO and HC levels measured in this study further suggest reduced soot formation, since improved combustion completeness generally limits soot precursor formation and promotes the oxidation of soot during the late combustion phase. The oxygen content of WSO biodiesel and its negligible aromatic fraction contribute to a more oxygen-rich flame structure and reduced soot propensity. In addition, the higher cetane quality of animal fat biodiesel shortens ignition delay, limiting the extent of premixed combustion and reducing the likelihood of locally rich pockets that promote soot formation. The CR effect observed in the present work is consistent with this mechanistic understanding. At CR 18, combustion temperatures are higher, and soot oxidation is enhanced when sufficient oxygen is available, which biodiesel provides, and the near-zero smoke observation at high load is consistent with this behavior. At CR 12, the cooler combustion environment could permit slightly higher soot formation than at higher CR, although overall smoke remained very low because the fuel was biodiesel.
From a practical emissions perspective, the effective elimination of visible smoke under high-load operation represents a meaningful advantage for particulate pollution control and regulatory compliance, particularly for older diesel configurations that lack oxidation catalysts or particulate filters. While elevated NOx at higher CR may, in principle, increase the fraction of nitrate-associated particulates, this contribution is expected to be minor relative to the substantial reduction in overall soot mass. Overall, the results indicate that WSO biodiesel produces a evidently cleaner exhaust with respect to CO, unburned HC, and particulate-related emissions, which are among the most critical pollutant species associated with diesel engines [7,8].
3.3. Engine Mapping and Surface Interpolation
Engine behavior over the investigated operating field was analyzed through a series of contour and surface maps, presented in Figure 10, Figure 11, Figure 12, Figure 13, Figure 14, Figure 15, Figure 16, Figure 17, Figure 18, Figure 19, Figure 20 and Figure 21, which collectively describe the coupled influence of compression ratio and load on performance and regulated emissions. Each response variable was treated as a two-input function of compression ratio and load, such that engine behavior can be expressed in the general form
where Z denotes brake thermal efficiency, brake specific fuel consumption, nitrogen oxides, carbon monoxide, and unburned hydrocarbons, or carbon dioxide. This mapping framework enables identification of operating regions where waste swine oil biodiesel benefits from increased compression ratio, where load-related drawbacks emerge, and where the combined effects of both parameters impose thresholds on thermal conversion or emissions concentration.
Figure 10.
Compression ratio–load map of BSFC for WSO biodiesel operation, showing the distribution of BSFC across the tested compression ratio and dynamometer load domain.
Figure 11.
Compression ratio–load map of BTE for WSO biodiesel operation, showing the spatial variation in BTE across the tested operating domain.
Figure 12.
Compression ratio–load map of CO emissions for WSO biodiesel operation, reported as volumetric concentration in the exhaust and mapped across the compression ratio and load domain.
Figure 13.
Compression ratio–load map of total unburned HC emissions for WSO biodiesel operation, reported in ppm as propane-equivalent concentration and mapped across the compression ratio and load domain.
Figure 14.
Compression ratio–load contour map of CO2 emissions for WSO biodiesel operation, reported as volumetric concentration in the exhaust and mapped across the compression ratio and load domain.
Figure 15.
Compression ratio–load contour map of NOx emissions for WSO biodiesel operation, reported in ppm and mapped across the compression ratio and load domain.
Figure 16.
Three-dimensional response surface of BSFC as a function of CR and dynamometer load for WSO biodiesel operation.
Figure 17.
Three-dimensional response surface of BTE as a function of CR and dynamometer load for WSO biodiesel operation.
Figure 18.
Three-dimensional response surface of CO emissions as a function of CR and dynamometer load for WSO biodiesel operation.
Figure 19.
Three-dimensional response surface of total unburned HC emissions as a function of CR and dynamometer load for WSO biodiesel operation.
Figure 20.
Three-dimensional response surface of CO2 emissions as a function of CR and dynamometer load for WSO biodiesel operation.
Figure 21.
Three-dimensional response surface of NOx emissions as a function of CR and dynamometer load for WSO biodiesel operation.
Because the experimental measurements were obtained at discrete compression ratios and load combinations, grid-based interpolation was applied to generate continuous response surfaces for conception and to interrogate compression ratio–load interaction effects that are not readily apparent from one-factor-at-a-time comparisons. Figure 10, Figure 11, Figure 12, Figure 13, Figure 14 and Figure 15 present filled maps for the primary performance and regulated emissions metrics across the investigated operating regime, while Figure 16, Figure 17, Figure 18, Figure 19, Figure 20 and Figure 21 present the corresponding three-dimensional response surfaces derived from the same discrete experimental dataset. The paired map and surface representations provide complementary understanding. Gradients and isolines support rapid identification of regions of rapid change and local extrema, whereas the three-dimensional surfaces confirm the global topology and help assess whether observed features reflect physically consistent trends rather than objects of contouring.
Figure 10 shows the compression ratio–load distribution of BSFC for WSO biodiesel operation. BSFC decreases strongly with increasing load, while the dependence on compression ratio is comparatively weaker over most of the regime. This pattern indicates that increasing brake output reduces the relative influence of friction and pumping losses and improves fuel use intensity, whereas compression ratio primarily modulates the consumption level through its influence on combustion effectiveness. Figure 11 presents the corresponding compression ratio–load map of BTE and exhibits the expected inverse structure relative to Figure 10. BTE increases with load and rises further with increasing compression ratio, with the most favorable efficiency region concentrated toward higher load and higher compression ratio. The close spatial correspondence between the high-BTE region in Figure 11 and the low-BSFC region in Figure 10 provides an internal consistency check for the performance maps and confirms that the interpolated fields reflect physically consistent energy conversion behavior.
Figure 12 and Figure 13 map incomplete combustion products. Figure 12 presents CO emissions and shows that CO declines with increasing load and also decreases with increasing compression ratio. This behavior is consistent with improved oxidation as in-cylinder temperature increases and quenching effects diminish. Figure 13 presents total unburned HC emissions and displays a similar directional tendency to Figure 12, with HC reductions driven primarily by increasing load and only modest additional benefit from increasing compression ratio once combustion temperatures are sufficiently high. The co-located low-CO and low-HC regions in Figure 12 and Figure 13 align with the high-efficiency region in Figure 11, indicating that improved BTE under the present steady-state conditions is accompanied by enhanced combustion completeness.
Figure 14 and Figure 15 separate emissions mechanisms governed by different controlling factors. Figure 14 shows the compression ratio–load distribution of carbon dioxide emissions. CO2 increases strongly with load, reflecting increased fuel throughput and higher total carbon conversion at higher brake output, while the compression ratio effect remains mild across the investigated range. When interpreted alongside Figure 12 and Figure 13, the CO2 behavior is consistent with more complete oxidation of intermediate species at higher load and higher compression ratio. Figure 15 presents the compression ratio–load distribution of NOx emissions and exhibits steep positive gradients with both increasing load and increasing compression ratio. This response is consistent with temperature-driven NOx formation, where higher load elevates heat release intensity and peak flame temperature, and higher compression ratio increases the end of compression temperature and promotes higher peak combustion temperatures and residence times in high-temperature zones.
The three-dimensional surfaces in Figure 16, Figure 17, Figure 18, Figure 19, Figure 20 and Figure 21 provide topographic confirmation of the trends observed in the maps. Figure 16 confirms that the BSFC field forms a smooth declining surface along the load axis with comparatively weaker curvature along the compression ratio axis. Figure 17 shows the complementary BTE surface with an efficiency rise toward higher load and higher compression ratio. Figure 18 and Figure 19 confirm that CO and HC surfaces decrease monotonically toward higher load, with additional but smaller reductions at higher compression ratios. Figure 20 reinforces the dominant load sensitivity of CO2, while Figure 21 highlights a pronounced NOx rise toward the high load, high compression region. Taken together, Figure 10, Figure 11, Figure 12, Figure 13, Figure 14, Figure 15, Figure 16, Figure 17, Figure 18, Figure 19, Figure 20 and Figure 21 consolidate the discrete experimental dataset into an operational decision framework. Operating regions associated with high efficiency and low CO and HC are readily identifiable, while the NOx escalation toward elevated compression ratio and load is explicitly resolved, motivating targeted calibration measures or NOx control strategies when operation is required near the high efficiency enclave.
3.4. Implications and Comparison with Diesel Baseline
The above results collectively illustrate the performance and emissions balance associated with operating a diesel engine on 100% waste swine oil biodiesel across different compression ratios. A direct comparison with diesel-fueled baseline operation is therefore necessary to assess the practical viability of WSO biodiesel as a potential diesel replacement.
3.5. Efficiency and Fuel Consumption
WSO biodiesel exhibited a marginal reduction in peak efficiency and a corresponding increase in fuel consumption relative to conventional diesel fuel. Based on the established literature and baseline validation, the BTE of diesel operation at 1500 rpm and full load of compression ratio ≈ 17.5 typically falls within the range of 42–44%. In the present study, an interpolated value of approximately 41.4% was obtained for WSO at an equivalent compression ratio, derived from the results at CR 16 and CR 18. This represents an absolute reduction in efficiency of about 2–3%, which is consistent with widely reported observations that biodiesel fuels generally yield brake thermal efficiencies that are 1–3 percentage points lower than those of petroleum diesel under comparable operating conditions. The BSFC of WSO was higher by about 10–12% than diesel on average, mainly due to the 11% lower LHV of the biodiesel. At a power output of 5 kW, WSO B100 exhibited a BSFC of approximately 240 g/kWh, compared with about 220 g/kWh for diesel, while at 2.5 kW, the corresponding values were approximately 295 g/kWh for WSO B100 and 270 g/kWh for diesel. These differences are consistent with the well-established tendency for biodiesel fuels to exhibit higher fuel consumption due to their lower calorific value [1,35]. It should be noted that increasing the compression ratio did not fully eliminate this difference. However, it slightly reduced the gap at low-load conditions by enhancing the efficiency of WSO in the operating region where it was most limited. In practical terms, an engine running on WSO biodiesel would need about 10% more fuel by volume for the same work output, and might see a slight drop in power if fuel flow is not increased. In this experimental study, fueling was adjusted to achieve comparable torque outputs when operating on biodiesel, and the engine was able to deliver nearly the same maximum power on WSO, approximately 9.4 kW, as under diesel operation, which reached about 9.5 to 10 kW at the same compression ratio, provided that adequate fueling was supplied. This confirms that WSO biodiesel can be used in the engine without a tangible loss of peak power, especially if injection settings are adjusted for the slightly higher fuel flow. The high cetane of biodiesel likely helped maintain good combustion timing even as more fuel was injected.
3.6. Compression Ratio Effects and Optimization
The experimental results offer an understanding of potential engine calibration strategies for biodiesel operation. From an efficiency perspective, the highest CR evaluated, at CR = 18, appears most favorable under low-load conditions, whereas an intermediate compression ratio in the range of CR = 14–16 is more suitable at medium to high loads, as further increases in compression ratio beyond CR = 16 yielded only marginal improvements in brake thermal efficiency at elevated loads. However, considering NOx emissions, extremely high CR may not be desirable at full load. Many modern diesel engines have a CR of around 16–18:1 as a compromise between efficiency, NOx, and peak pressure limits. The study’s results confirm that even at CR 12, the engine runs reasonably, with slightly reduced efficiency and more CO/HC. Therefore, an engine dedicated to biodiesel operation could employ a higher CR to recover efficiency under light-load conditions, where biodiesel performance is typically weaker, without incurring a disproportionate increase in NOx emissions when the load is low, since NOx formation is inherently limited under lean combustion conditions. At high-load conditions, where NOx control becomes a primary concern, it may be undesirable to operate at an excessively high CR. In engines equipped with variable CR capability, dynamic adjustment could be employed, with higher CR applied at low loads to maintain efficiency and reduced CR at full load to limit NOx escalation during biodiesel operation. Such an adaptive control strategy represents a promising direction for future research aimed at optimizing engine performance and emissions when operating on biodiesel or other alternative fuels.
3.7. Comparison with Other Biodiesel Feedstocks
The performance characteristics of WSO biodiesel observed in this study are broadly consistent with those reported for biodiesels derived from other feedstocks, such as soybean oil, canola oil, and waste cooking oil, with respect to overall trends, including slightly reduced efficiency, elevated NOx emissions, and lower emissions of HC, CO, and particulate matter. Notable distinctions arise from the physicochemical properties of WSO biodiesel, which is derived from animal fats and typically exhibits a higher cetane number and saturation levels. These attributes tend to shorten ignition delay and may moderate NOx formation relative to more unsaturated biodiesels, partially offsetting the general tendency of biodiesel fuels to produce higher NOx emissions. However, results in the literature are mixed, with several studies indicating that biodiesels derived from more saturated animal fats can produce lower NOx emissions than those derived from unsaturated feedstocks, a behavior often attributed to reduced flame temperatures and differences in combustion timing [4,5,6]. In the present study, a direct comparison among different biodiesel feedstocks was not undertaken. However, the absolute NOx levels measured for lard-derived biodiesel were not excessively high. For the record, some vegetable oil-based biodiesels operated under comparable conditions and without exhaust gas recirculation have been reported to exceed 1000 ppm of NOx at full load. The relatively moderate NOx emissions observed for WSO biodiesel may be partly attributed to its higher cetane number, which shortens ignition delay and moderates the intensity of the premixed combustion phase, thereby limiting peak combustion temperatures and associated NOx formation. This is consistent with reports from several studies indicating that biodiesels derived from more saturated animal fats can, under certain operating conditions, generate slightly lower NOx emissions than biodiesels produced from more unsaturated feedstocks such as soybean oil. Additionally, the lower iodine number of WSO biodiesel, which reflects its reduced degree of unsaturation, suggests a lower tendency to form particulate soluble organic fractions and NOx precursor radicals, thereby contributing to more complete and cleaner combustion [4,5,6]. Therefore, WSO biodiesel can be regarded as a favorable biodiesel fuel, as it exhibited very low carbonaceous emissions and delivered performance comparable to diesel operation, aside from the expected increase in fuel consumption associated with its lower calorific value.
4. Conclusions
This study developed and demonstrated a compression ratio–load engine mapping framework for waste swine oil biodiesel (WSO B100) under steady-state operation in a single-cylinder variable compression ratio compression ignition engine. The study’s primary innovation and contribution lies in the application of response surface mapping, supported by statistical modeling and sensitivity analysis, to quantify both main and interaction effects of compression ratio and load on performance and regulated emissions, thereby enabling operating region identification beyond conventional one-factor-at-a-time trends [1,2]. In addition, the study contributes a traceable performance calculation workflow that explicitly integrates batch-specific fuel properties and an experimentally referenced heating value into the mapping pipeline, thereby eliminating systematic bias in BSFC/BTE that can arise when generic properties are applied to variable waste-derived fuels [3]. Experimentally, WSO biodiesel delivered stable and satisfactory operation across the full CR–load matrix. Brake thermal efficiency increased with both CR and load, rising from 29% at light load and CR 12 to 42% at high load and CR 18, approaching diesel performance within 2–3 percentage points at high load and supporting complete diesel substitution with appropriate fueling [36]. Brake power reached 9.4 kW at CR 18, consistent with the reported short-term heavy load capability of comparable small single-cylinder and Kirloskar TV1-type research engines operated under elevated compression and dynamometer loading [37,38,39,40,41]. BSFC remained higher than diesel by 8–12%, consistent with the lower energy content of animal fat biodiesel and the ranges reported for biodiesel-fueled small CI engines [42,43,44,45,46]. However, increasing CR reduced BSFC at low load by improving combustion effectiveness, partially mitigating the typical biodiesel drawback in light load regimes [36,42]. Overall trends in BSFC and BTE align with the established biodiesel engine literature, reinforcing the validity of the observed response surfaces [46,47].
Regulated emissions exhibited pollutant-specific sensitivities across the mapped regime. NOx increased markedly with both CR and load, spanning approximately 193–488 ppm, reflecting temperature-driven formation and the well-documented biodiesel NOx effect, with CR increases from 12 to 18 producing an estimated 20–40% rise at fixed load [16,17,28,46,48]. In contrast, CO and HC were low and decreased with increasing load and CR, reaching 0.15% CO and 30 ppm HC at the highest operating condition, consistent with improved combustion completeness promoted by fuel-bound oxygen and higher cetane quality [28,46]. CO2 increased primarily with load, ranging from 2.5% to 3.4% vol, and showed only a mild dependence on CR, remaining characteristic of lean combustion in naturally aspirated small diesel engines [46]. Although particulate mass was not quantified, smoke opacity readings and visual observations indicated a pronounced reduction in smoke with WSO biodiesel, consistent with reported PM/smoke reductions for animal fat biodiesels. Collectively, the maps confirm that WSO biodiesel can operate effectively over a wide compression ratio range with broadly comparable performance to diesel, while achieving substantial reductions in incomplete combustion products. However, NOx escalation at elevated CR and reduced low-load efficiency highlights the need for targeted calibration and/or NOx mitigation strategies [1,4]. The response surfaces therefore provide quantitative guidance for compression ratio–load selection to balance efficiency and emissions outcomes for animal fat biodiesel operation [2,5].
Limitations and Future Work
The study is limited to a single-cylinder research platform, a discrete set of CR–load points, and steady-state operation, with response surfaces derived through interpolation rather than transient duty cycles. Fuel flow determination based on timed volumetric displacement, although corrected using a density–temperature correlation, remains sensitive to timing and meniscus reading. Future studies should employ gravimetric or Coriolis mass flow metering to further reduce uncertainty. Mechanistic attribution was inferred from global metrics and exhaust emissions. Future work should integrate in-cylinder pressure measurement, heat release analysis, and ignition delay quantification to directly resolve combustion phasing and peak pressure rise rates. Cold-start behavior and long-term durability, such as injector deposits and lubrication impacts, were outside the present scope but are relevant for deployment and should be assessed under extended operation. Available evidence suggests that such issues are manageable with appropriate additives and maintenance practices [1]. Finally, extending the mapping to broader speed ranges and evaluating calibration pathways such as injection timing, Exhaust Gas Recirculation (EGR), and aftertreatment-enabled NOx control will be essential to translate the identified operating regimes into deployment-ready calibration envelopes for WSO biodiesel [3,4,5].
Supplementary Materials
The following supporting information can be downloaded at https://www.mdpi.com/article/10.3390/cleantechnol8030076/s1: Figure S1: Brake thermal efficiency as a function of load at compression ratio 12 for WSO biodiesel; Figure S2: Brake thermal efficiency against load for ratio 14; Figure S3: Brake thermal efficiency against load at compression ratio 16 across the full load range; Figure S4: Brake thermal efficiency against load for compression ratio 18; Figure S5: (a–d) Brake-specific fuel consumption for WSO biodiesel under four compression ratios; Figure S6: (a–d) Brake power variation with load at each compression ratio; Figure S7: (a–d) Torque–load characteristics of the WSO engine at different compression ratios.
Author Contributions
Conceptualization, O.E.O.; methodology, O.E.O.; writing—original draft preparation, O.E.O.; writing—review and editing O.E.O.; supervision, R.S. All authors have read and agreed to the published version of the manuscript.
Funding
This research received no external funding.
Data Availability Statement
The original contributions presented in this study are included in the article/Supplementary Materials. Further inquiries can be directed to the corresponding author.
Conflicts of Interest
The authors declare no conflicts of interest.
Abbreviations
| B100 | Neat biodiesel (100% biodiesel) |
| BTE | Brake thermal efficiency |
| BSFC | Brake-specific fuel consumption |
| CI | Compression ignition |
| CO | Carbon monoxide |
| CO2 | Carbon dioxide |
| CR | Compression ratio |
| DCN | Derived cetane number |
| ECU | Engine control unit |
| FAME | Fatty acid methyl ester |
| FFA | Free fatty acid |
| GC–MS | Gas chromatography–mass spectrometry |
| HC | Unburned hydrocarbons |
| HHV | Higher heating value |
| IQT | Ignition quality tester |
| LHV | Lower heating value |
| NOx | Oxides of nitrogen |
| PM | Particulate matter (if used) |
| TDC | Top dead center |
| TLC | Thin-layer chromatography |
| WSO | Waste swine oil |
References
- Zheng, F.; Cho, H.M. A Study on the Performance and Emission Characteristics of Cotton and Waste Lard Biodiesel on a CI Engine. Energies 2025, 18, 5251. [Google Scholar] [CrossRef] [Scilit]
- Kathumbi, L.K.; Home, P.G.; Raude, J.M.; Gathitu, B.B. Performance and emission characteristics of a diesel engine fuelled by biodiesel from black soldier fly larvae: Effects of synthesizing catalysts with citric acid. Heliyon 2023, 9, e21354. [Google Scholar] [CrossRef] [Scilit]
- Venugopal, I.P.; Balasubramanian, D.; Rajarajan, A. Potential improvement in conventional diesel combustion mode on a common rail direct injection diesel engine with PODE/WCO blend as a high reactive fuel to achieve effective Soot-NOx trade-off. J. Clean. Prod. 2021, 327, 129495. [Google Scholar] [CrossRef] [Scilit]
- Hoekman, S.K.; Broch, A.; Robbins, C.; Ceniceros, E.; Natarajan, M. Review of biodiesel composition, properties, and specifications. Renew. Sustain. Energy Rev. 2012, 16, 143–169. [Google Scholar] [CrossRef] [Scilit]
- Moser, B.R. Biodiesel production, properties, and feedstocks. Vitr. Cell. Dev. Biol.-Plant 2009, 45, 229–266. [Google Scholar] [CrossRef] [Scilit]
- Knothe, G. Dependence of biodiesel fuel properties on the structure of fatty acid alkyl esters. Fuel Process. Technol. 2005, 86, 1059–1070. [Google Scholar] [CrossRef] [Scilit]
- Khujamberdiev, R.; Cho, H. Biodiesel Raw Material Characterization and its Production Process—A Review. Nat. Vol. Essent. Oils 2021, 8, 12112–12120. [Google Scholar]
- Bet-Moushoul, E.; Farhadi, K.; Mansourpanah, Y.; Nikbakht, A.M.; Molaei, R.; Forough, M. Application of CaO-based/Au nanoparticles as heterogeneous nanocatalysts in biodiesel production. Fuel 2016, 164, 119–127. [Google Scholar] [CrossRef] [Scilit]
- Ejikeme, P.; Anyaogu, I.D.; Egbuonu, A.C.C.; Eze, V.C. Pig-fat (Lard) derivatives as alternative diesel fuel in compression ignition engines. J. Pet. Technol. Altern. Fuels 2013, 4, 7–11. [Google Scholar]
- Öner, C.; Altun, Ş. Biodiesel production from inedible animal tallow and an experimental investigation of its use as alternative fuel in a direct injection diesel engine. Appl. Energy 2009, 86, 2114–2120. [Google Scholar] [CrossRef] [Scilit]
- Sathiyagnanam, A.; Vijayaraj, K.; Saravanan, C. Biodiesel production from waste pork lard and an experimental investigation of its use as an alternate fuel in a di diesel engine. Int. J. Mech. Eng. Robot. Res. 2012, 1, 176–191. [Google Scholar]
- Santana, J.C.C.; Miranda, A.C.; Souza, L.; Yamamura, C.L.K.; Coelho, D.d.F.; Tambourgi, E.B.; Berssaneti, F.T.; Ho, L.L. Clean production of biofuel from waste cooking oil to reduce emissions, fuel cost, and respiratory disease hospitalizations. Sustainability 2021, 13, 9185. [Google Scholar] [CrossRef] [Scilit]
- Duan, Q.; Li, T.; Liu, D.; Yin, X.; Zeng, K.; Wang, L. Improving the lean burn performance of a high compression ratio methanol engine by multiple-injection. Appl. Therm. Eng. 2024, 236, 121481. [Google Scholar] [CrossRef] [Scilit]
- Xi, H.; Fu, J.; Zhou, F.; Yu, J.; Liu, J.; Meng, Z. Experimental and numerical studies of thermal power conversion and energy flow under high-compression ratios of a liquid methane engine (LME). Energy 2023, 284, 128544. [Google Scholar] [CrossRef] [Scilit]
- Chidambaranathan, B.; Gopinath, S.; Aravindraj, R.; Devaraj, A.; Krishnan, S.G.; Jeevaananthan, J. The production of biodiesel from castor oil as a potential feedstock and its usage in compression ignition Engine: A comprehensive review. Mater. Today Proc. 2020, 33, 84–92. [Google Scholar] [CrossRef] [Scilit]
- Rajak, U.; Panchal, M.; Veza, I.; Ağbulut, Ü.; Verma, T.N.; Sarıdemir, S.; Shende, V. Experimental investigation of performance, combustion and emission characteristics of a variable compression ratio engine using low-density plastic pyrolyzed oil and diesel fuel blends. Fuel 2022, 319, 123720. [Google Scholar] [CrossRef] [Scilit]
- Wathakit, K.; Sukjit, E.; Kaewbuddee, C.; Maithomklang, S.; Klinkaew, N.; Liplap, P.; Arjharn, W.; Srisertpol, J. Characterization and impact of waste plastic oil in a variable compression ratio diesel engine. Energies 2021, 14, 2230. [Google Scholar] [CrossRef] [Scilit]
- Alotaibi, J.G.; Alajmi, A.E.; Alsaeed, T.; Al-Lwayzy, S.H.; Yousif, B.F. On the Influence of Engine Compression Ratio on Diesel Engine Performance and Emission Fueled with Biodiesel Extracted from Waste Cooking Oil. Energies 2024, 17, 3844. [Google Scholar] [CrossRef] [Scilit]
- Mahmood, H.A.; Al-Sulttani, A.O.; Alrazen, H.A.; Attia, O.H. The impact of different compression ratios on emissions, and combustion characteristics of a biodiesel engine. Aims Energy 2024, 12, 924–945. [Google Scholar] [CrossRef] [Scilit]
- ASTM D4052; Standard Test Method for Density, Relative Density, and API Gravity of Liquids by Digital Density Meter. ASTM International: West Conshohocken, PA, USA, 2022.
- ASTM D445; Standard Test Method for Kinematic Viscosity of Transparent and Opaque Liquids (and Calculation of Dynamic Viscosity). ASTM International: West Conshohocken, PA, USA, 2006.
- ASTM D93; Standard Test Methods for Flash Point by Pensky-Martens Closed Cup Tester. ASTM International: West Conshohocken, PA, USA, 2015.
- ASTM D240-25; Standard Test Method for Heat of Combustion of Liquid Hydrocarbon Fuels by Bomb Calorimeter. ASTM International: West Conshohocken, PA, USA, 2025.
- ASTM D6890; Standard Test Method for Determination of Ignition Delay and Derived Cetane Number (DCN) of Diesel Fuel Oils by Combustion in a Constant Volume Chamber. ASTM International: West Conshohocken, PA, USA, 2025.
- ASTM D664; Standard Test Method for Acid Number of Petroleum Products by Potentiometric Titration. ASTM International: West Conshohocken, PA, USA, 2024.
- ASTM D6584; Standard Test Method for Determination of Total Monoglycerides, Total Diglycerides, Total Triglycerides, and Free and Total Glycerin in B-100 Biodiesel Methyl Esters by Gas Chromatography. ASTM International: West Conshohocken, PA, USA, 2022.
- EN 14103; Fat and Oil Derivatives—Fatty Acid Methyl Esters (FAME)—Determination of Ester and Linolenic Acid Methyl Ester Contents. European Committee for Standardization (CEN): Brussels, Belgium, 2020.
- Dhar, A.; Agarwal, A.K. Performance, emissions and combustion characteristics of Karanja biodiesel in a transportation engine. Fuel 2014, 119, 70–80. [Google Scholar] [CrossRef] [Scilit]
- Godiganur, S.; Murthy, C.S.; Reddy, R.P. Performance and emission characteristics of a Kirloskar HA394 diesel engine operated on fish oil methyl esters. Renew. Energy 2010, 35, 355–359. [Google Scholar] [CrossRef] [Scilit]
- Khujamberdiev, R.; Cho, H. Impact of Biodiesel Blending on Emission Characteristics of One-Cylinder Engine Using Waste Swine Oil. Energies 2023, 16, 5489. [Google Scholar] [CrossRef] [Scilit]
- Singh, S.; Singh, D. Biodiesel production through the use of different sources and characterization of oils and their esters as the substitute of diesel: A review. Renew. Sustain. Energy Rev. 2010, 14, 200–216. [Google Scholar] [CrossRef] [Scilit]
- Agarwal, D.; Kumar, L.; Agarwal, A.K. Performance evaluation of a vegetable oil fuelled compression ignition engine. Renew. Energy 2008, 33, 1147–1156. [Google Scholar] [CrossRef] [Scilit]
- Shirneshan, A.; Almassi, M.; Ghobadian, B.; Borghei, A.M.; Najafi, G.H. Effects of biodiesel and engine load on some emission characteristics of a direct injection diesel engine. Curr. World Environ. 2012, 7, 207–212. [Google Scholar] [CrossRef] [Scilit]
- Elkelawy, M.; Mohamad, H.; Shenawy, E.; El-Fakharany, M.; Shafey, M. Experimental Study on the Performance and Emission Characteristics of Diesel Engine Fueled with WCO Biodiesel/Diesel Blends. In Proceedings of the Tanta University International Environmental Forum Green Environmental & Sustainable Development, Tanta, Egypt, 21–22 June 2020. [Google Scholar]
- Paraschiv, S.; Paraschiv, L.S. Trends of carbon dioxide (CO2) emissions from fossil fuels combustion (coal, gas and oil) in the EU member states from 1960 to 2018. Energy Rep. 2020, 6, 237–242. [Google Scholar] [CrossRef] [Scilit]
- Dahham, R.Y.; Wei, H.; Pan, J. Improving thermal efficiency of internal combustion engines: Recent progress and remaining challenges. Energies 2022, 15, 6222. [Google Scholar] [CrossRef] [Scilit]
- Heywood, J. Internal Combustion Engine Fundamentals; McGraw-Hill Education: Columbus, OH, USA, 2018. [Google Scholar]
- Dewangan, A.; Yadav, A.K.; Singh, D.; Majdi, H.S.; Rajhi, A.A.; Alamri, S.; Kareemullah, M. Comparative analysis of the performance and emissions of a multi-cylinder diesel engine using biodiesel from underutilized feedstocks. RSC Adv. 2025, 15, 41621–41647. [Google Scholar] [CrossRef] [Scilit] [PubMed]
- Mishra, S.; Mohanty, M.; Panigrahi, N.; Pattanaik, A. Impact of Simarouba glauca biodiesel blends as a fuel on the performance and emission analysis in an unmodified DICI engine. Renew. Energy Focus 2018, 26, 11–16. [Google Scholar] [CrossRef] [Scilit]
- Pulkrabek, W.W. Engineering fundamentals of the internal combustion engine, 2nd ed. J. Eng. Gas Turbines Power 2004, 126, 198. [Google Scholar]
- Singh, V.; Chavan, S.B.; Sharma, Y.C. Experimental Investigation of Engine Performance for 2nd Generation Biodiesel Derived from Mg2Zr5O12 Catalyst. Energies 2022, 15, 4044. [Google Scholar] [CrossRef] [Scilit]
- Demirbas, A. Progress and recent trends in biodiesel fuels. Energy Convers. Manag. 2009, 50, 14–34. [Google Scholar] [CrossRef] [Scilit]
- Van Gerpen, J. The Biodiesel Handbook; AOCS Press: Champaign, IL, USA, 2010. [Google Scholar]
- Zhang, Y.; Zhong, Y.; Lu, S.; Zhang, Z.; Tan, D. A comprehensive review of the properties, performance, combustion, and emissions of the diesel engine fueled with different generations of biodiesel. Processes 2022, 10, 1178. [Google Scholar] [CrossRef] [Scilit]
- Loo, D.L.; Teoh, Y.H.; How, H.G.; Teh, J.S.; Andrei, L.C.; Starčević, S.; Sher, F. Applications characteristics of different biodiesel blends in modern vehicles engines: A review. Sustainability 2021, 13, 9677. [Google Scholar] [CrossRef] [Scilit]
- Khujamberdiev, R.; Cho, H.M.; Mahmud, M.I. Experimental Investigation of Single-Cylinder Engine Performance Using Biodiesel Made from Waste Swine Oil. Energies 2023, 16, 7891. [Google Scholar] [CrossRef] [Scilit]
- García-Mariaca, A.; Villalba, J.; Carreño, U.; Aldana, D. Performance and Emissions of a CI-ICE Fuelled with Jatropha Biodiesel Blends and Economic and Environment Assessment for Power Generation in Non-Interconnected Areas. Energies 2023, 16, 5964. [Google Scholar] [CrossRef] [Scilit]
- Dinesh, M.; Pandey, J.K.; Kumar, G. Study of performance, combustion, and NOx emission behavior of an SI engine fuelled with ammonia/hydrogen blends at various compression ratio. Int. J. Hydrogen Energy 2022, 47, 25391–25403. [Google Scholar] [CrossRef] [Scilit]
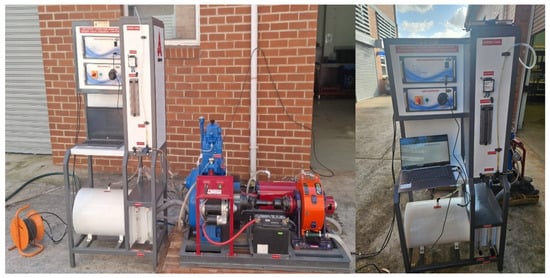
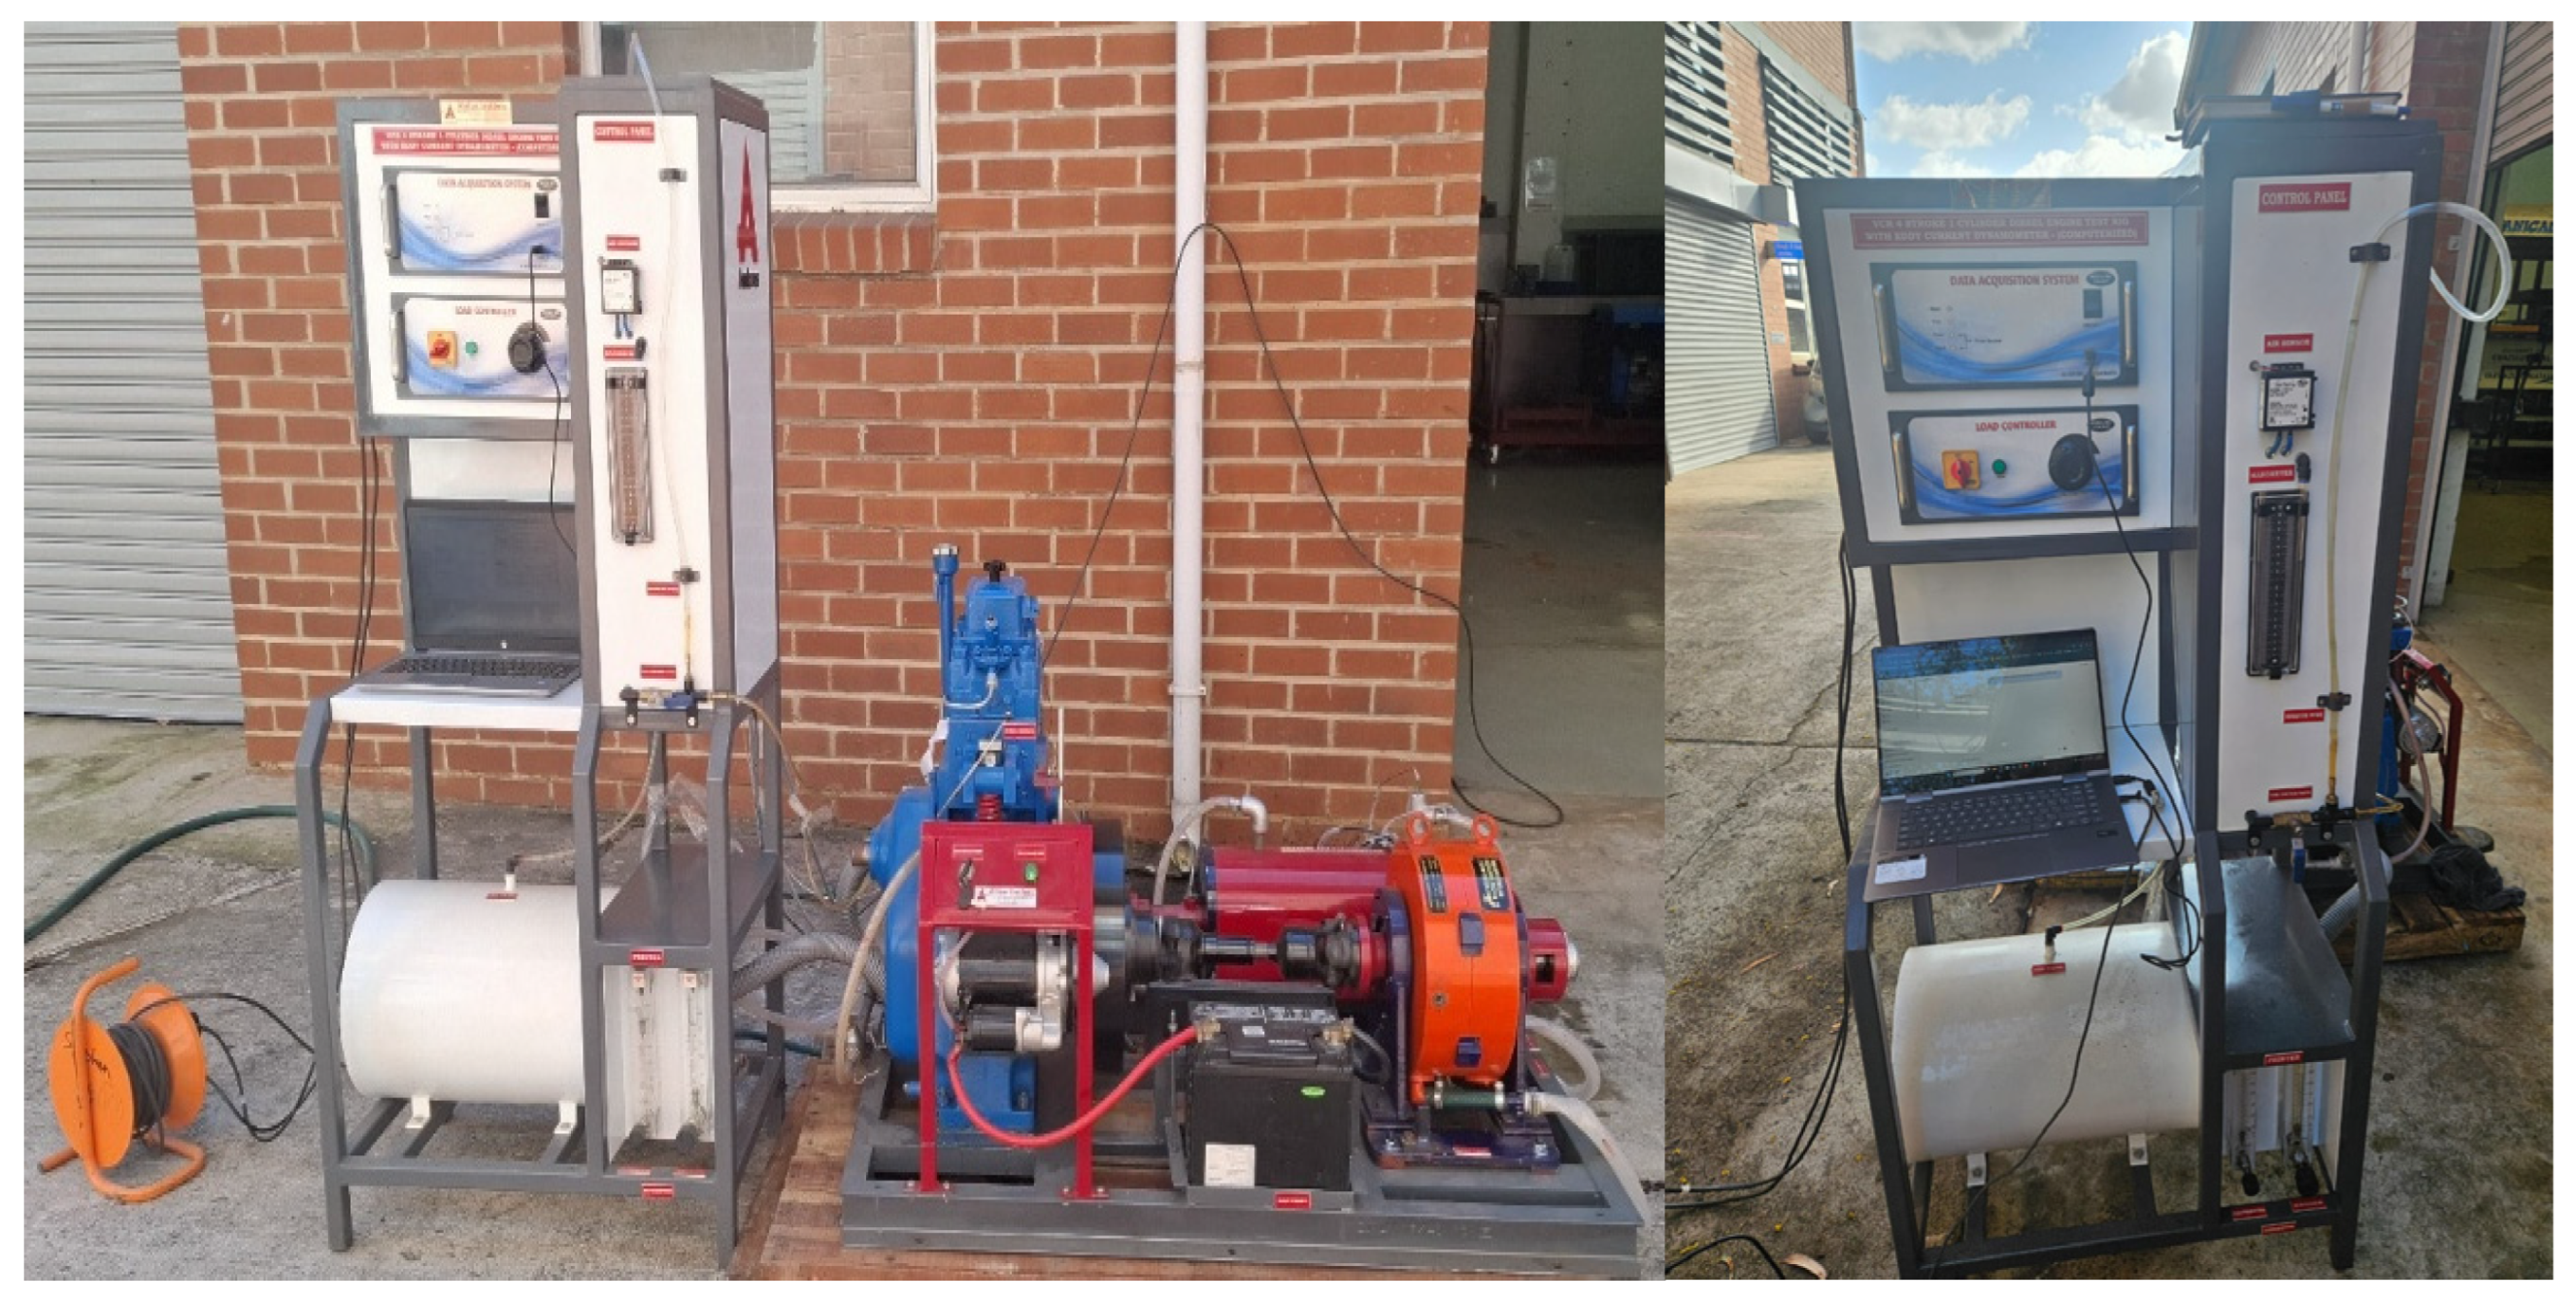
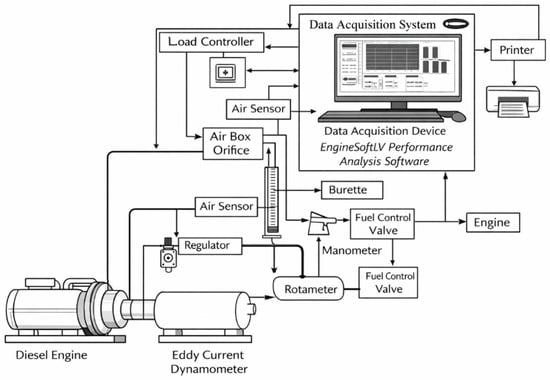
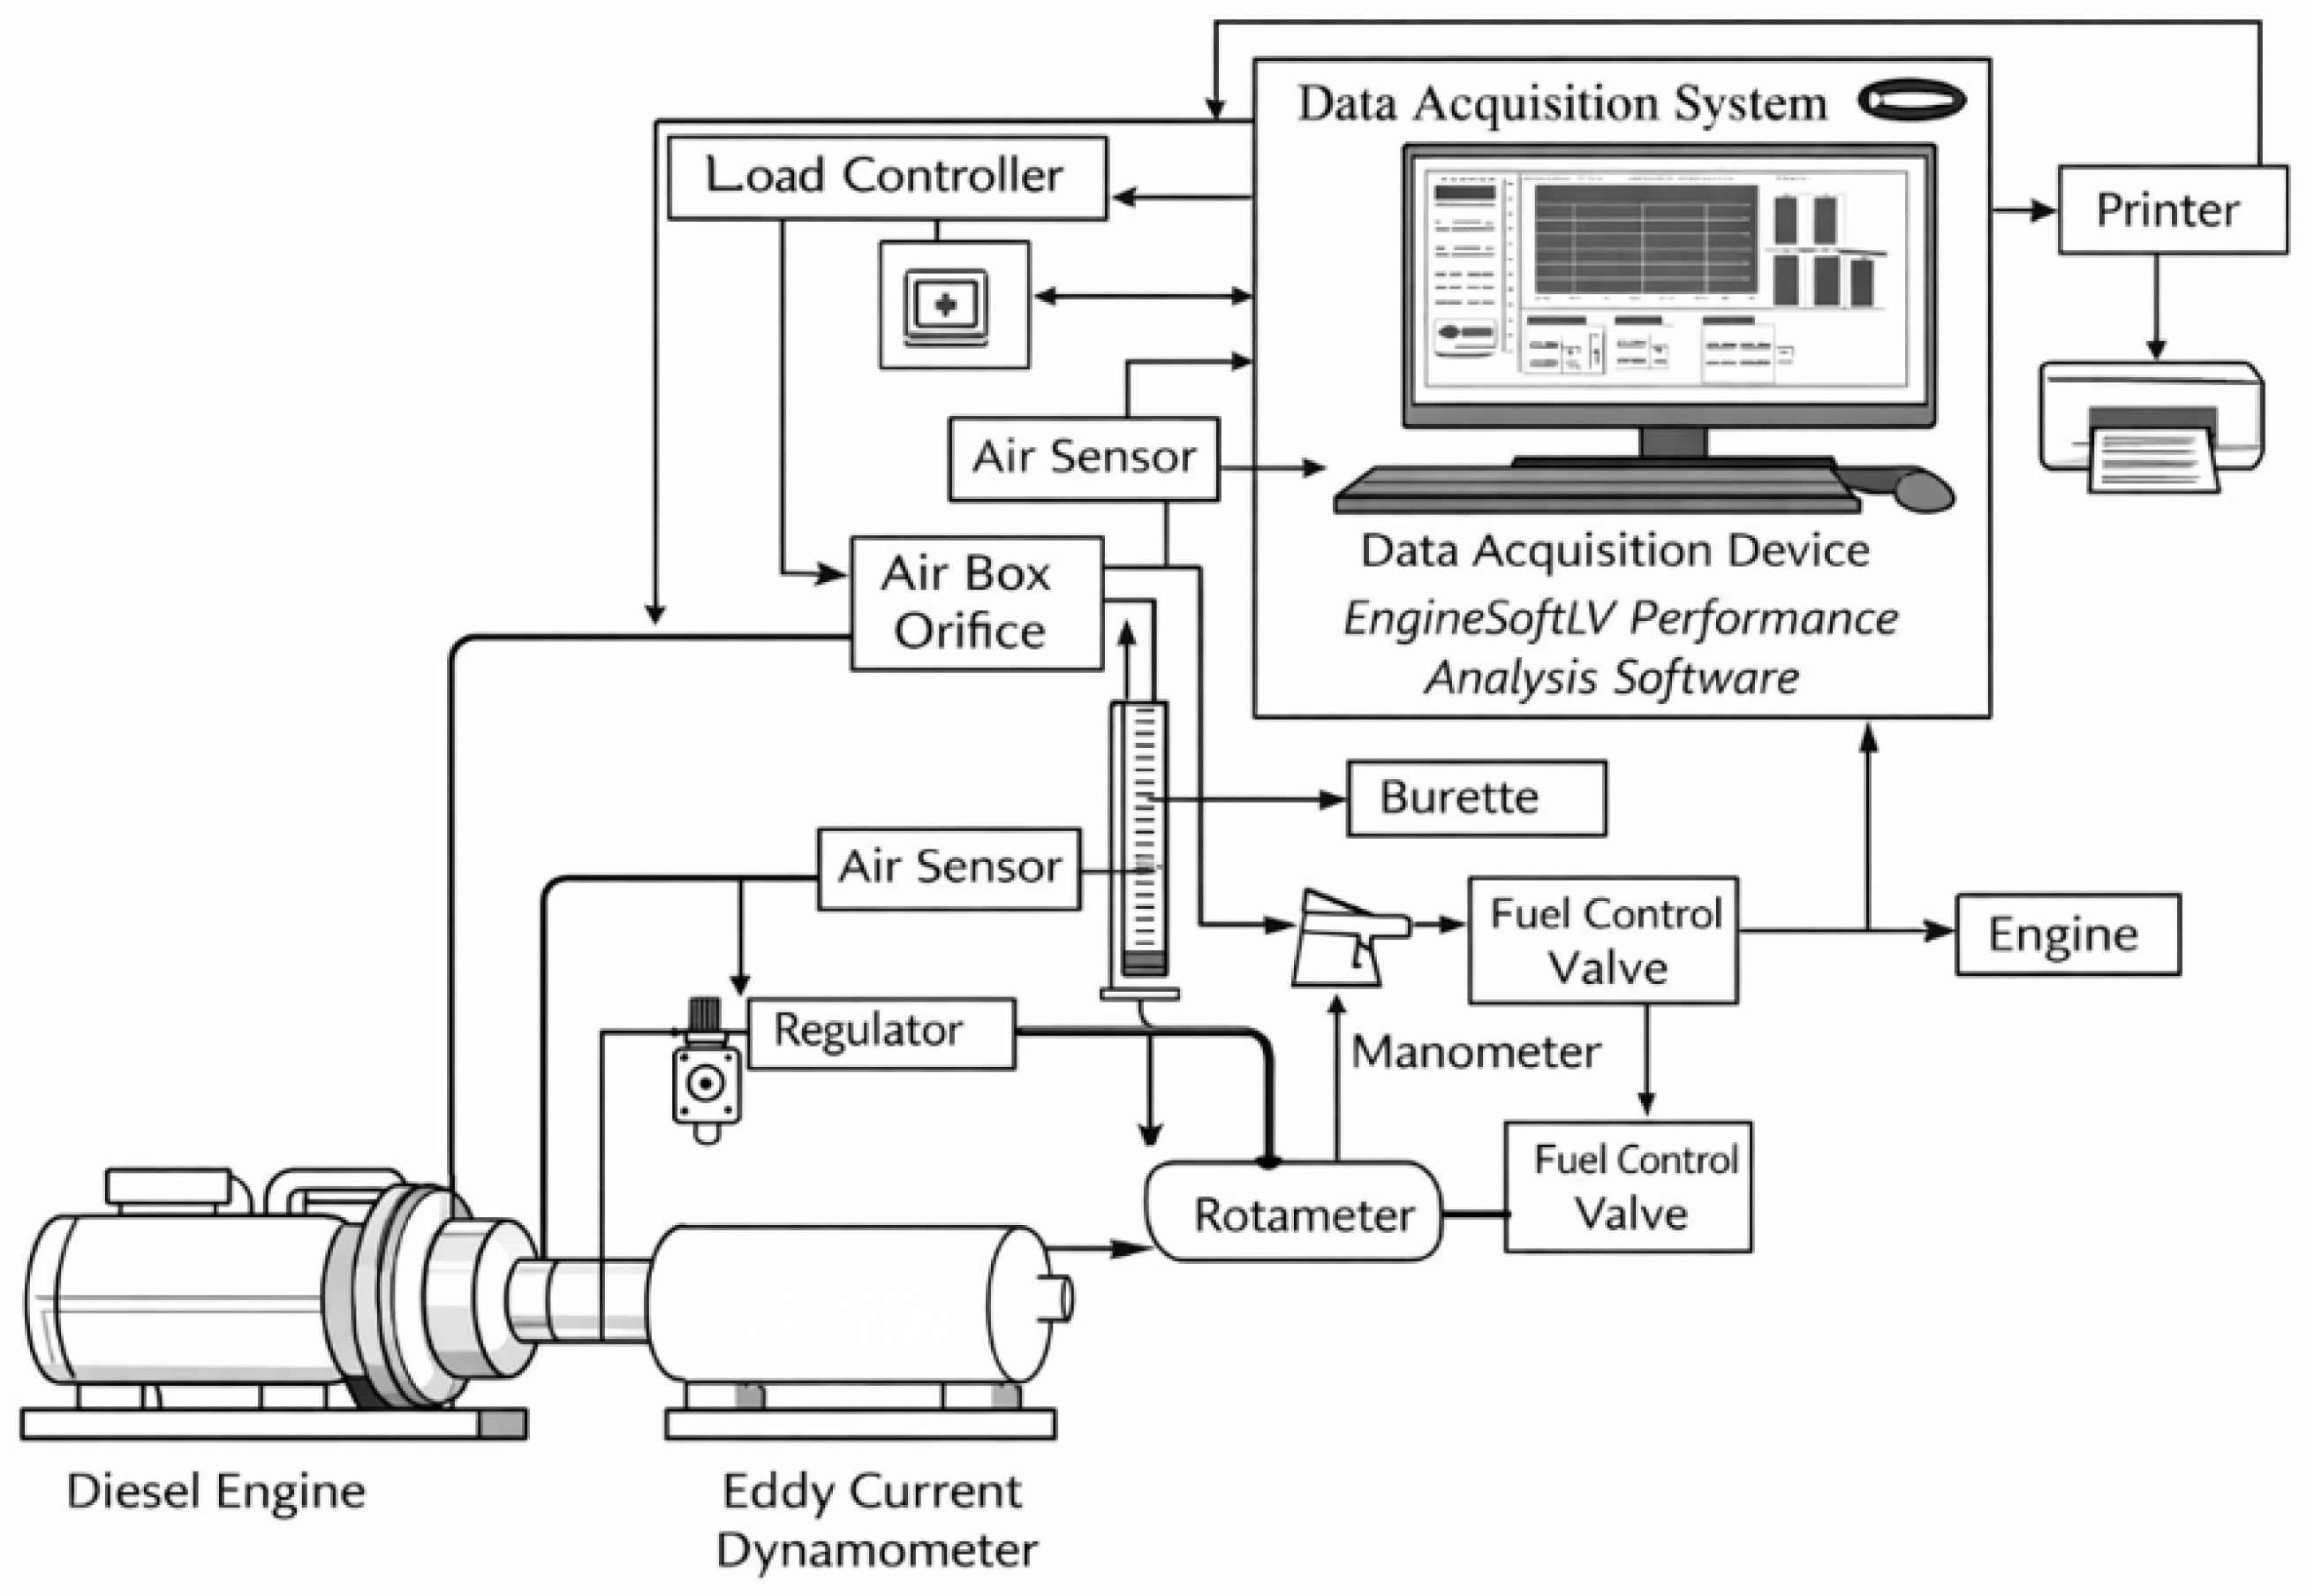
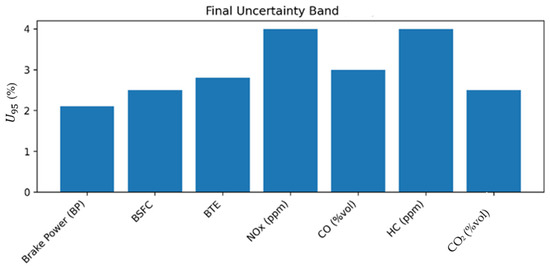
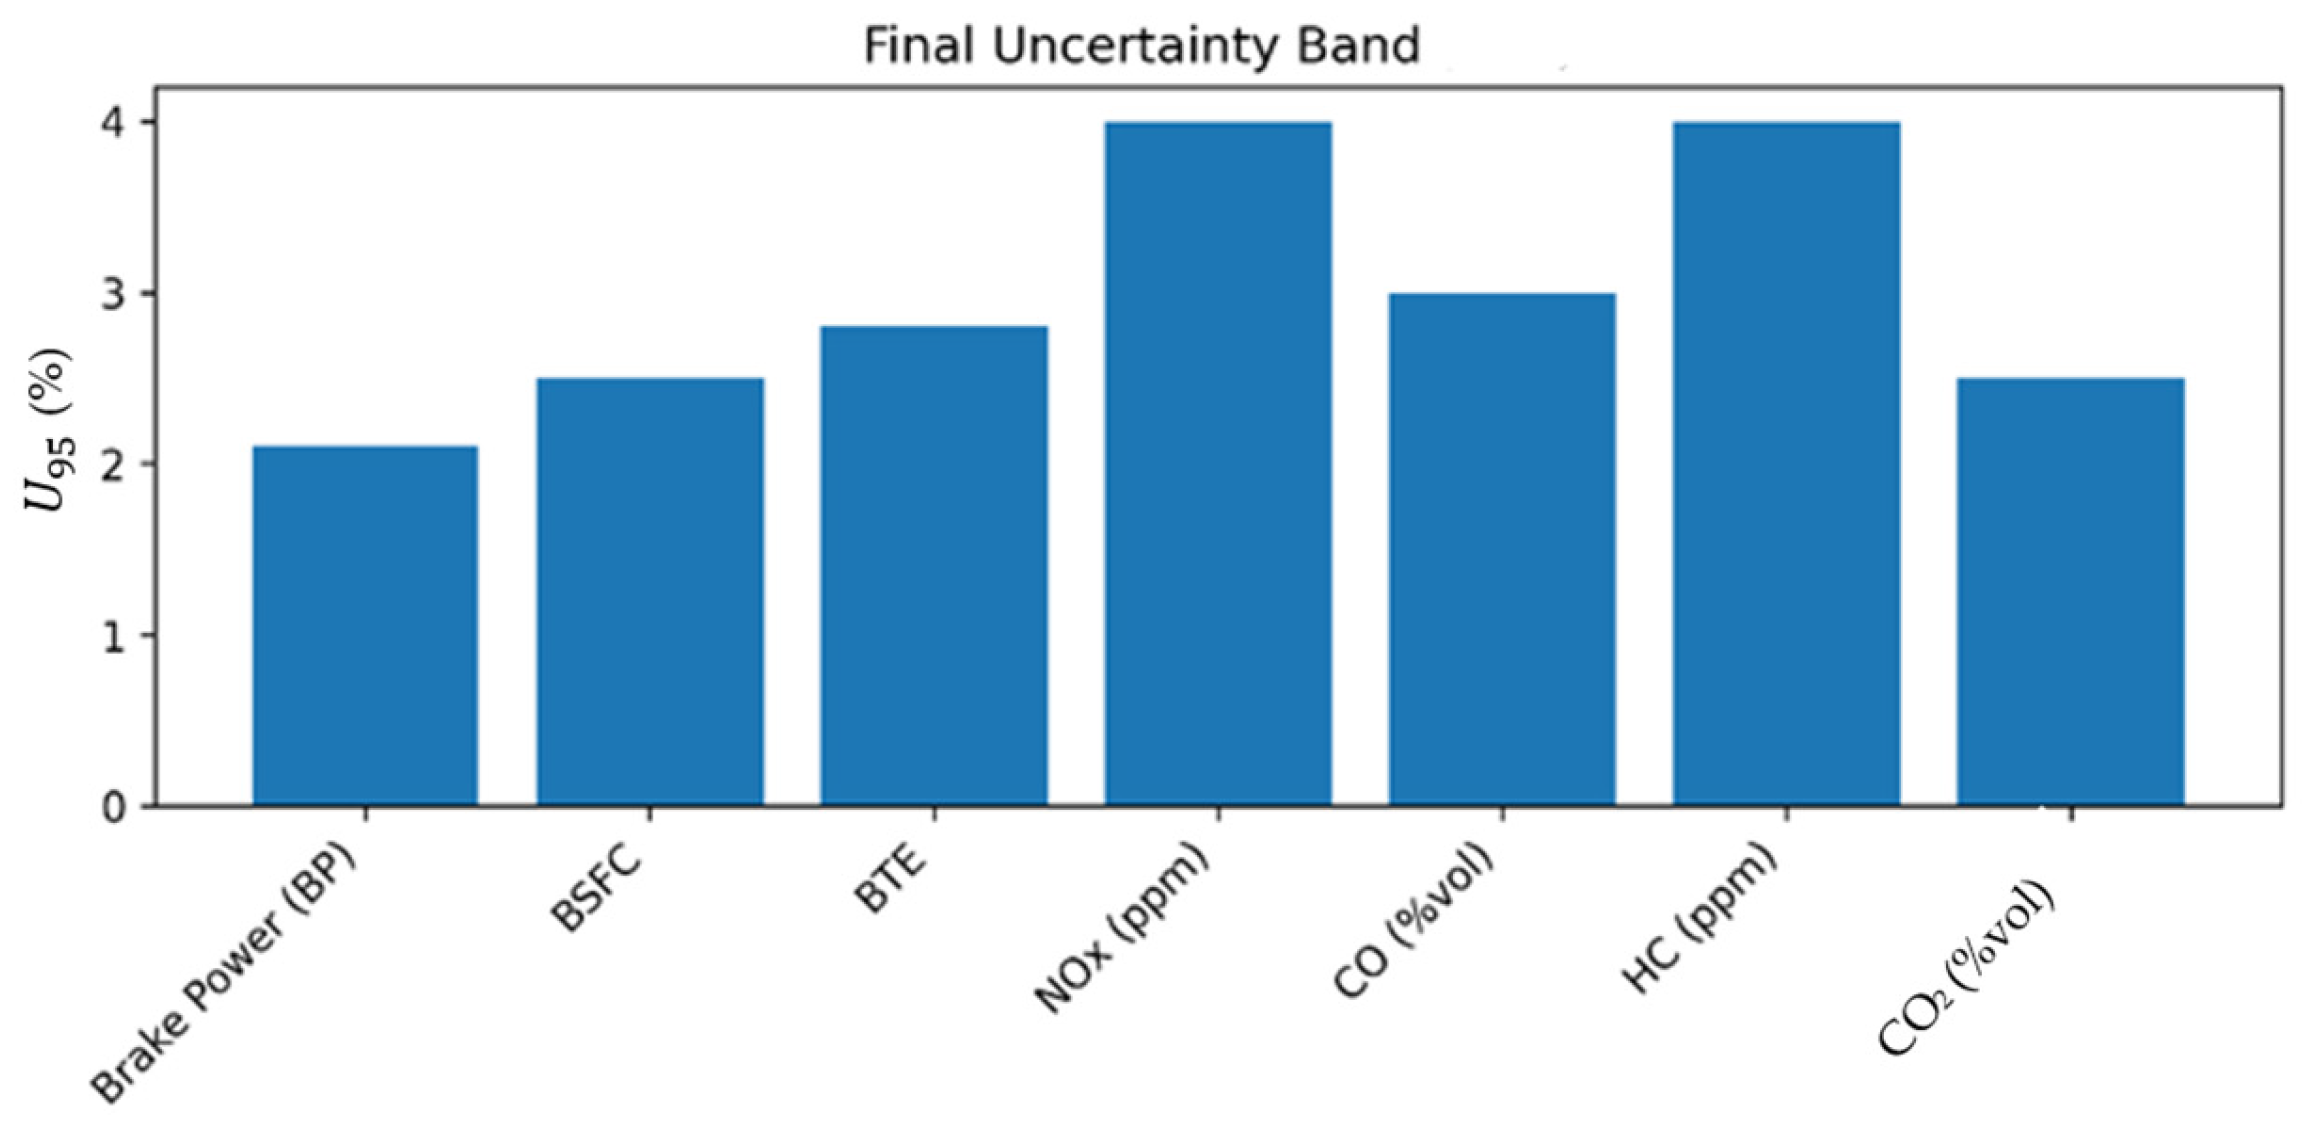
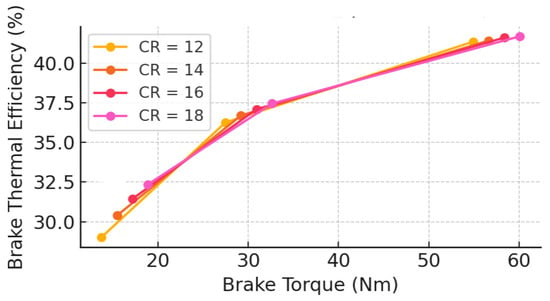
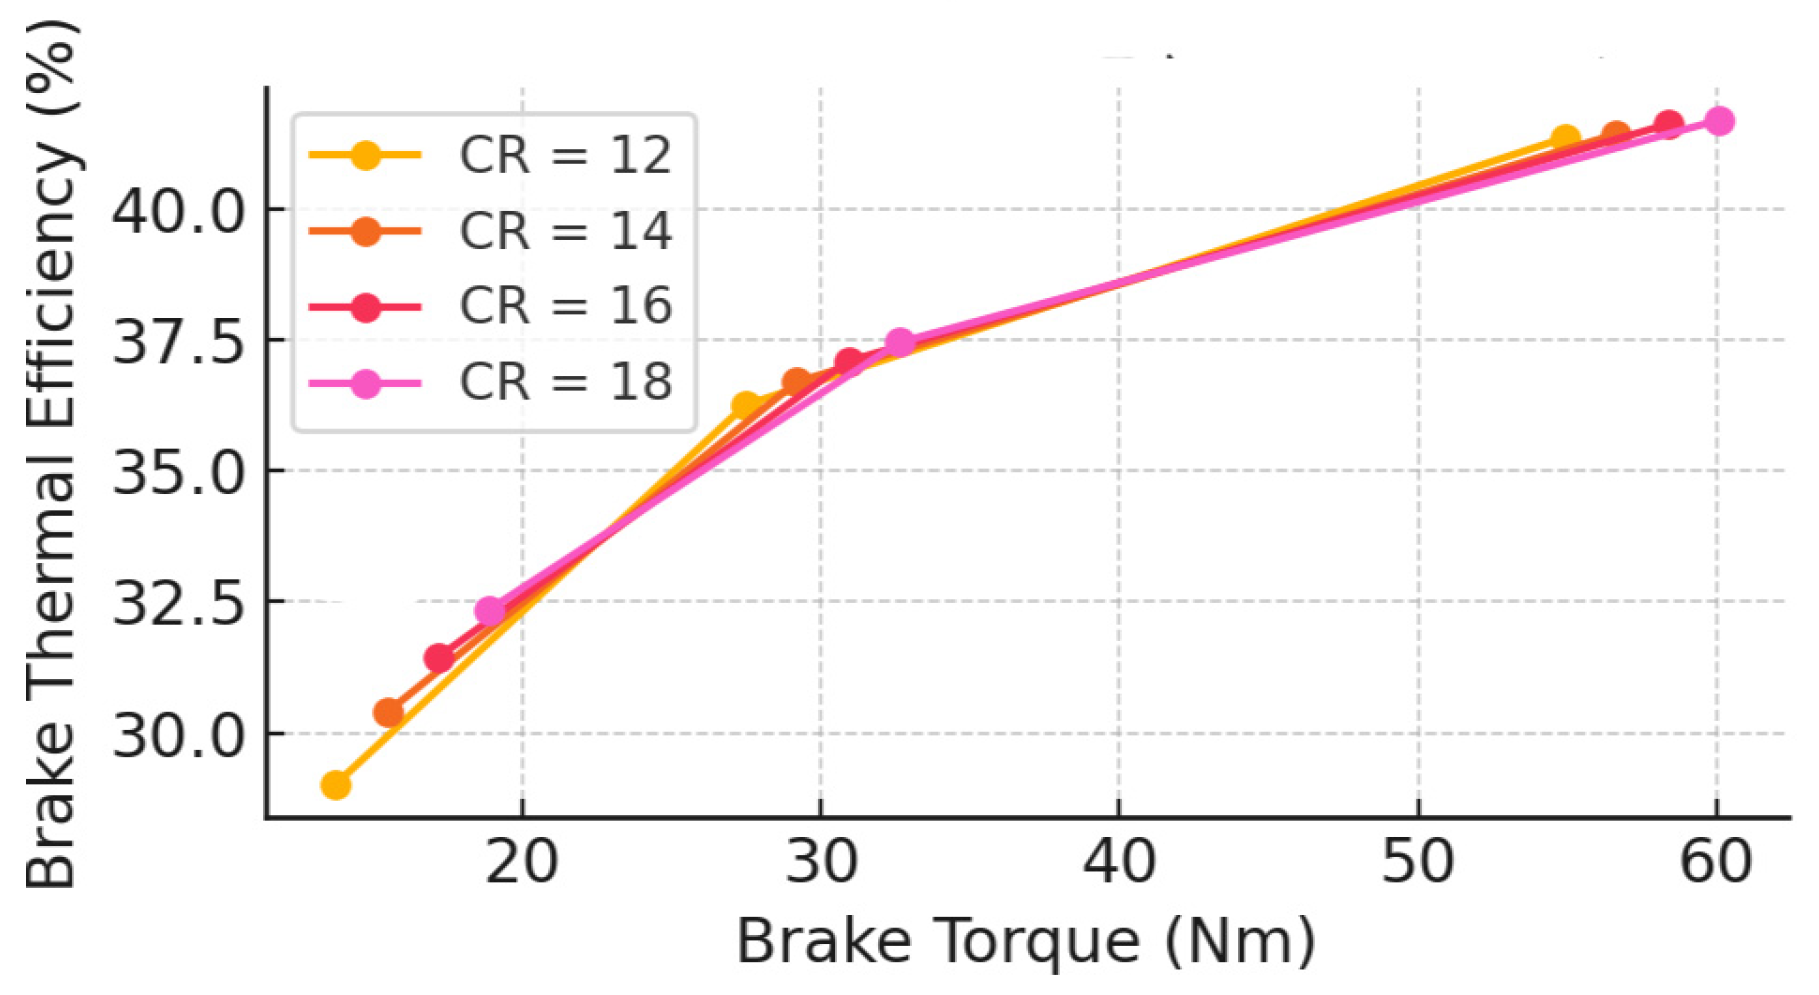
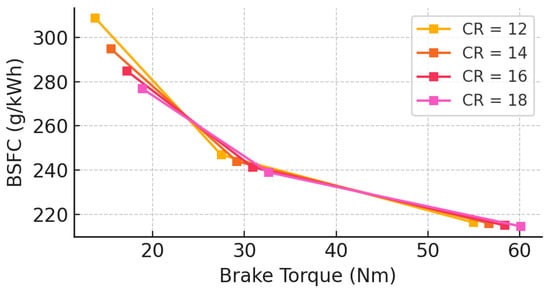
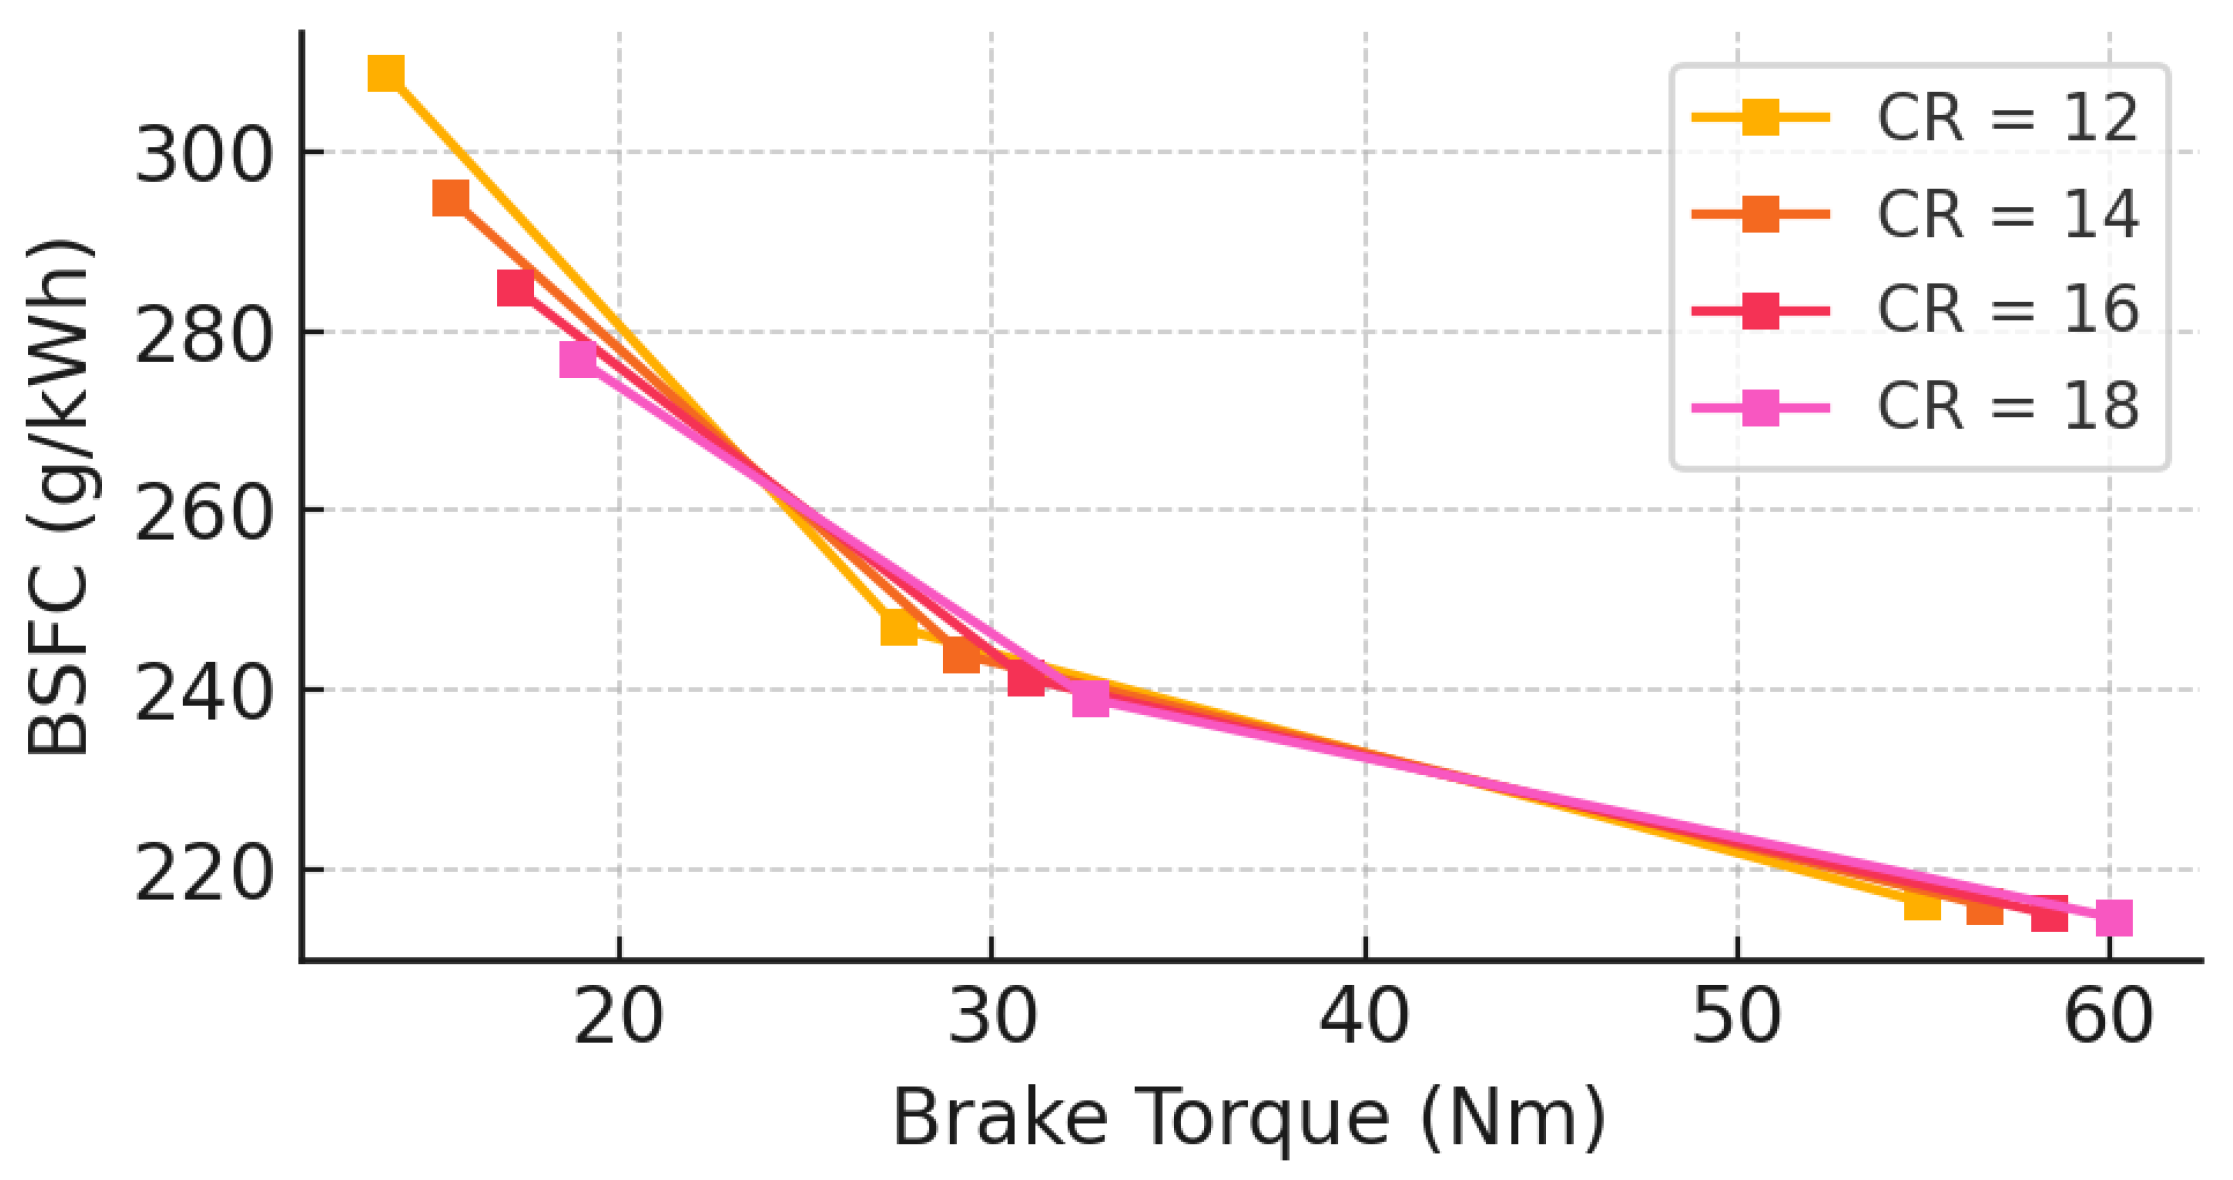
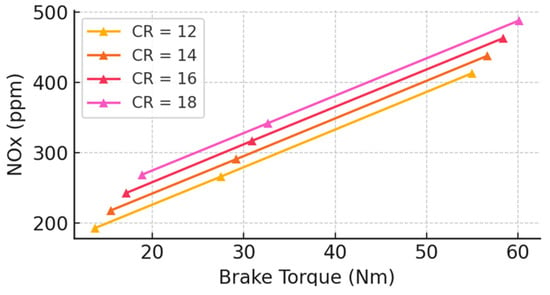
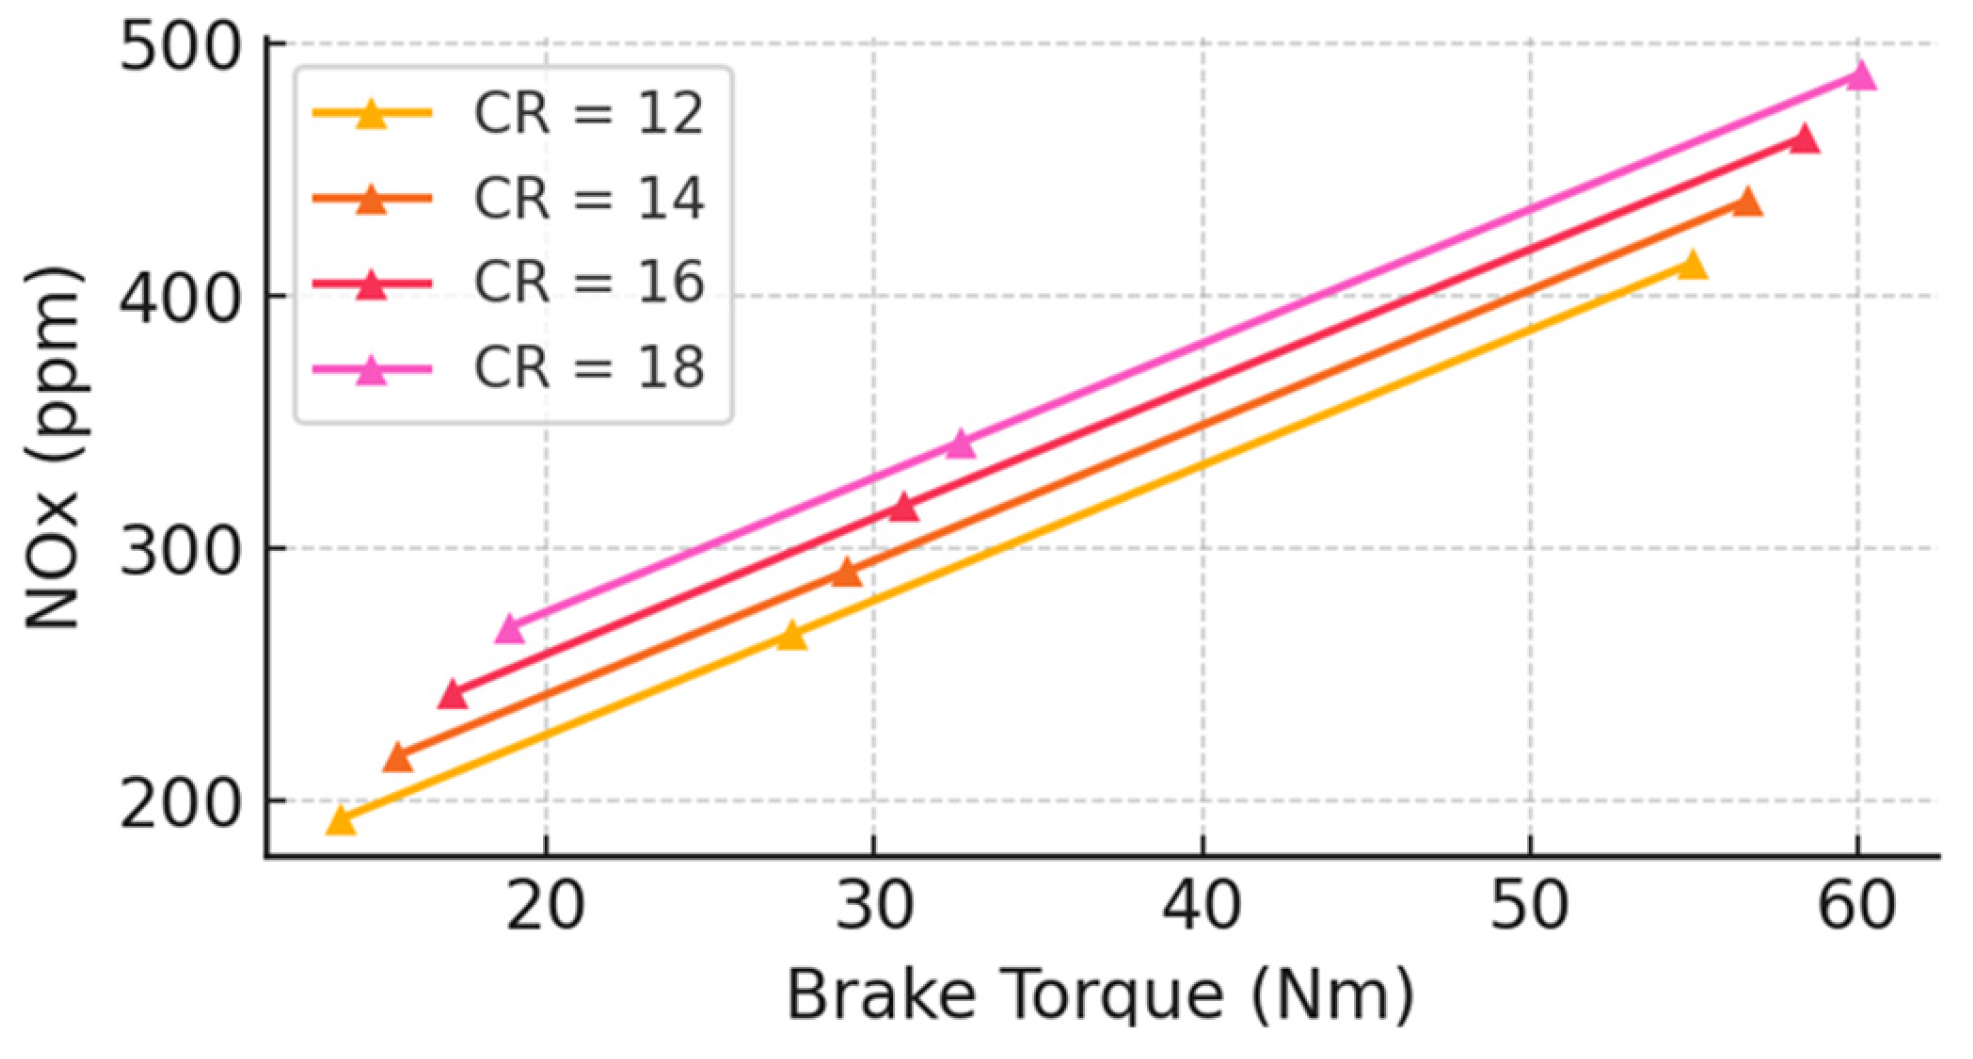
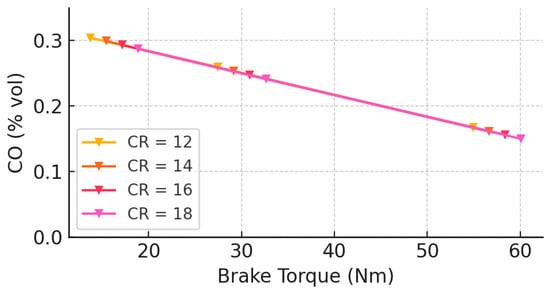
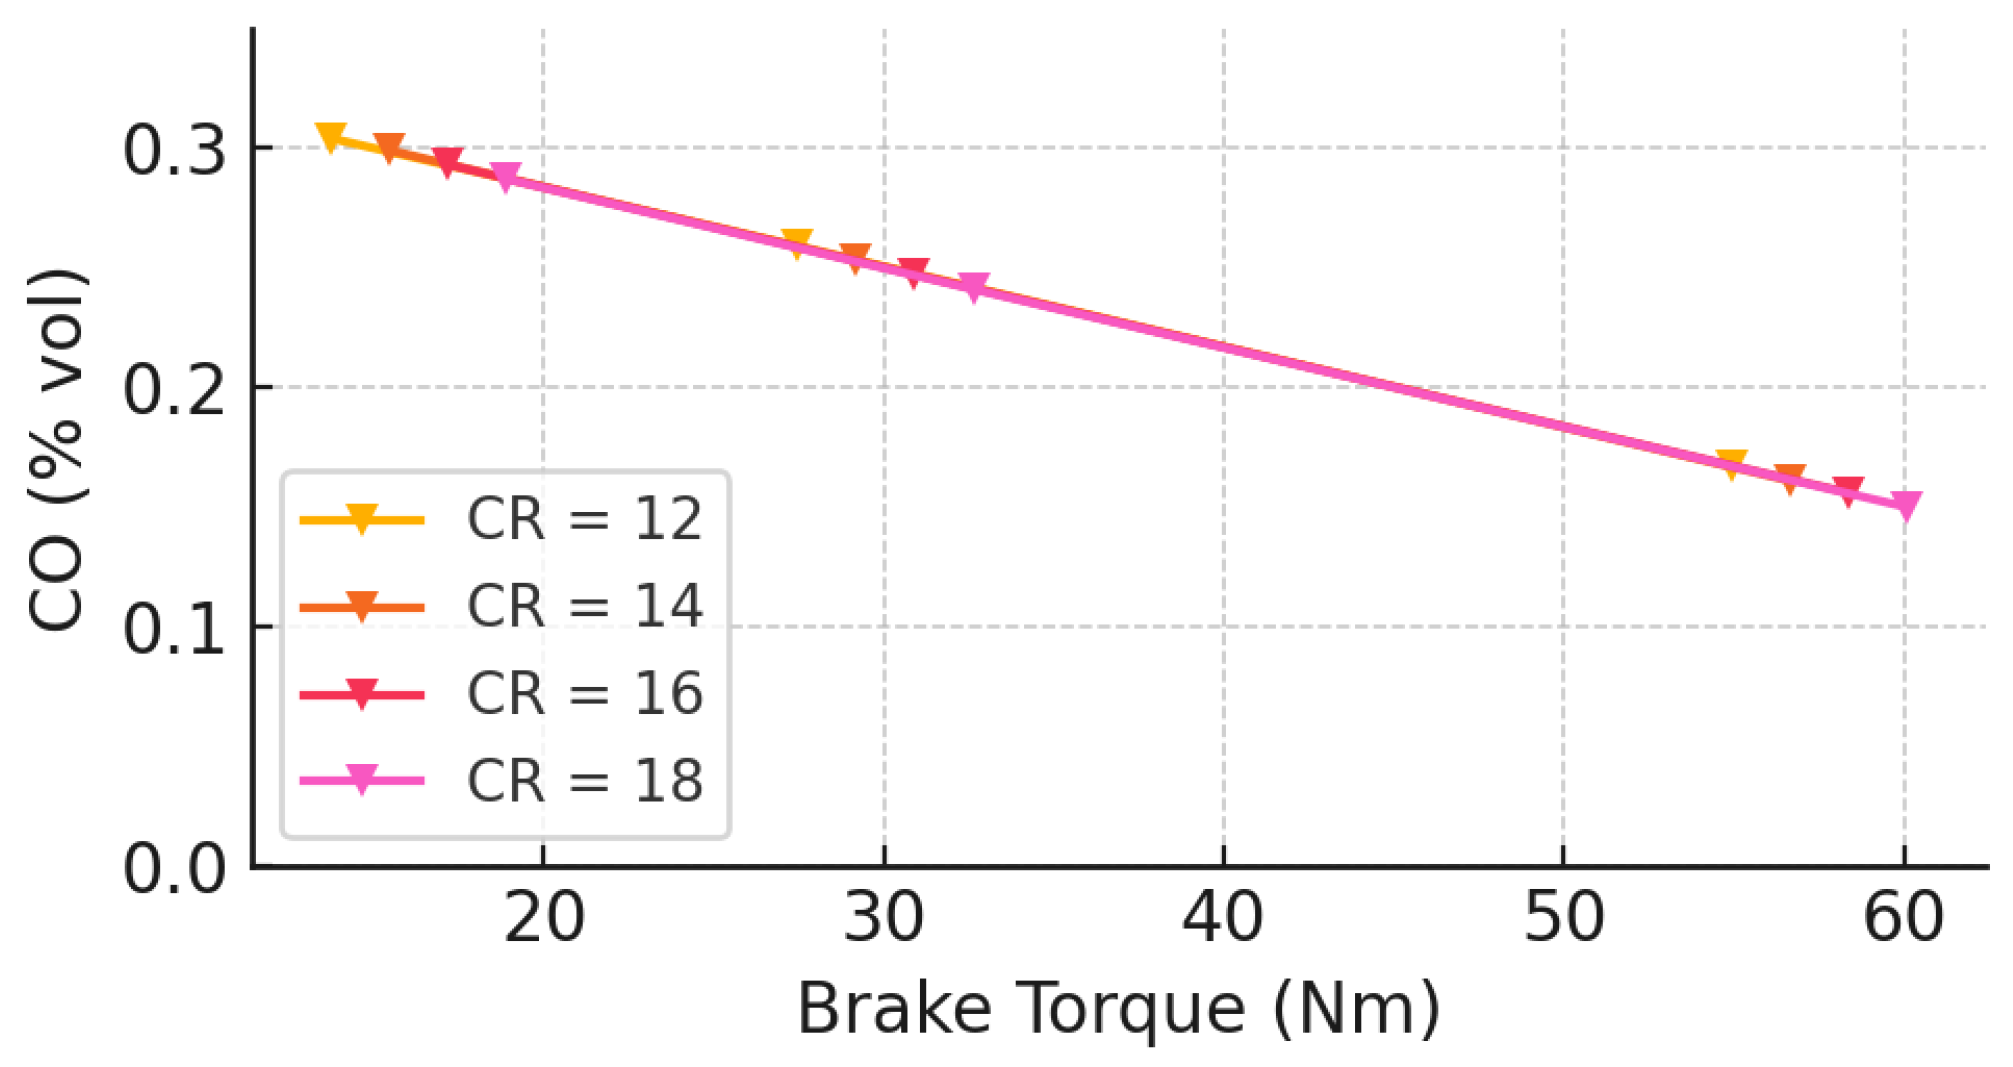
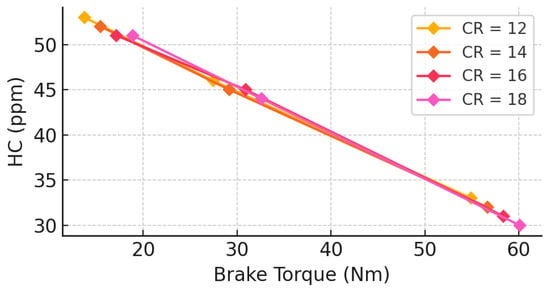
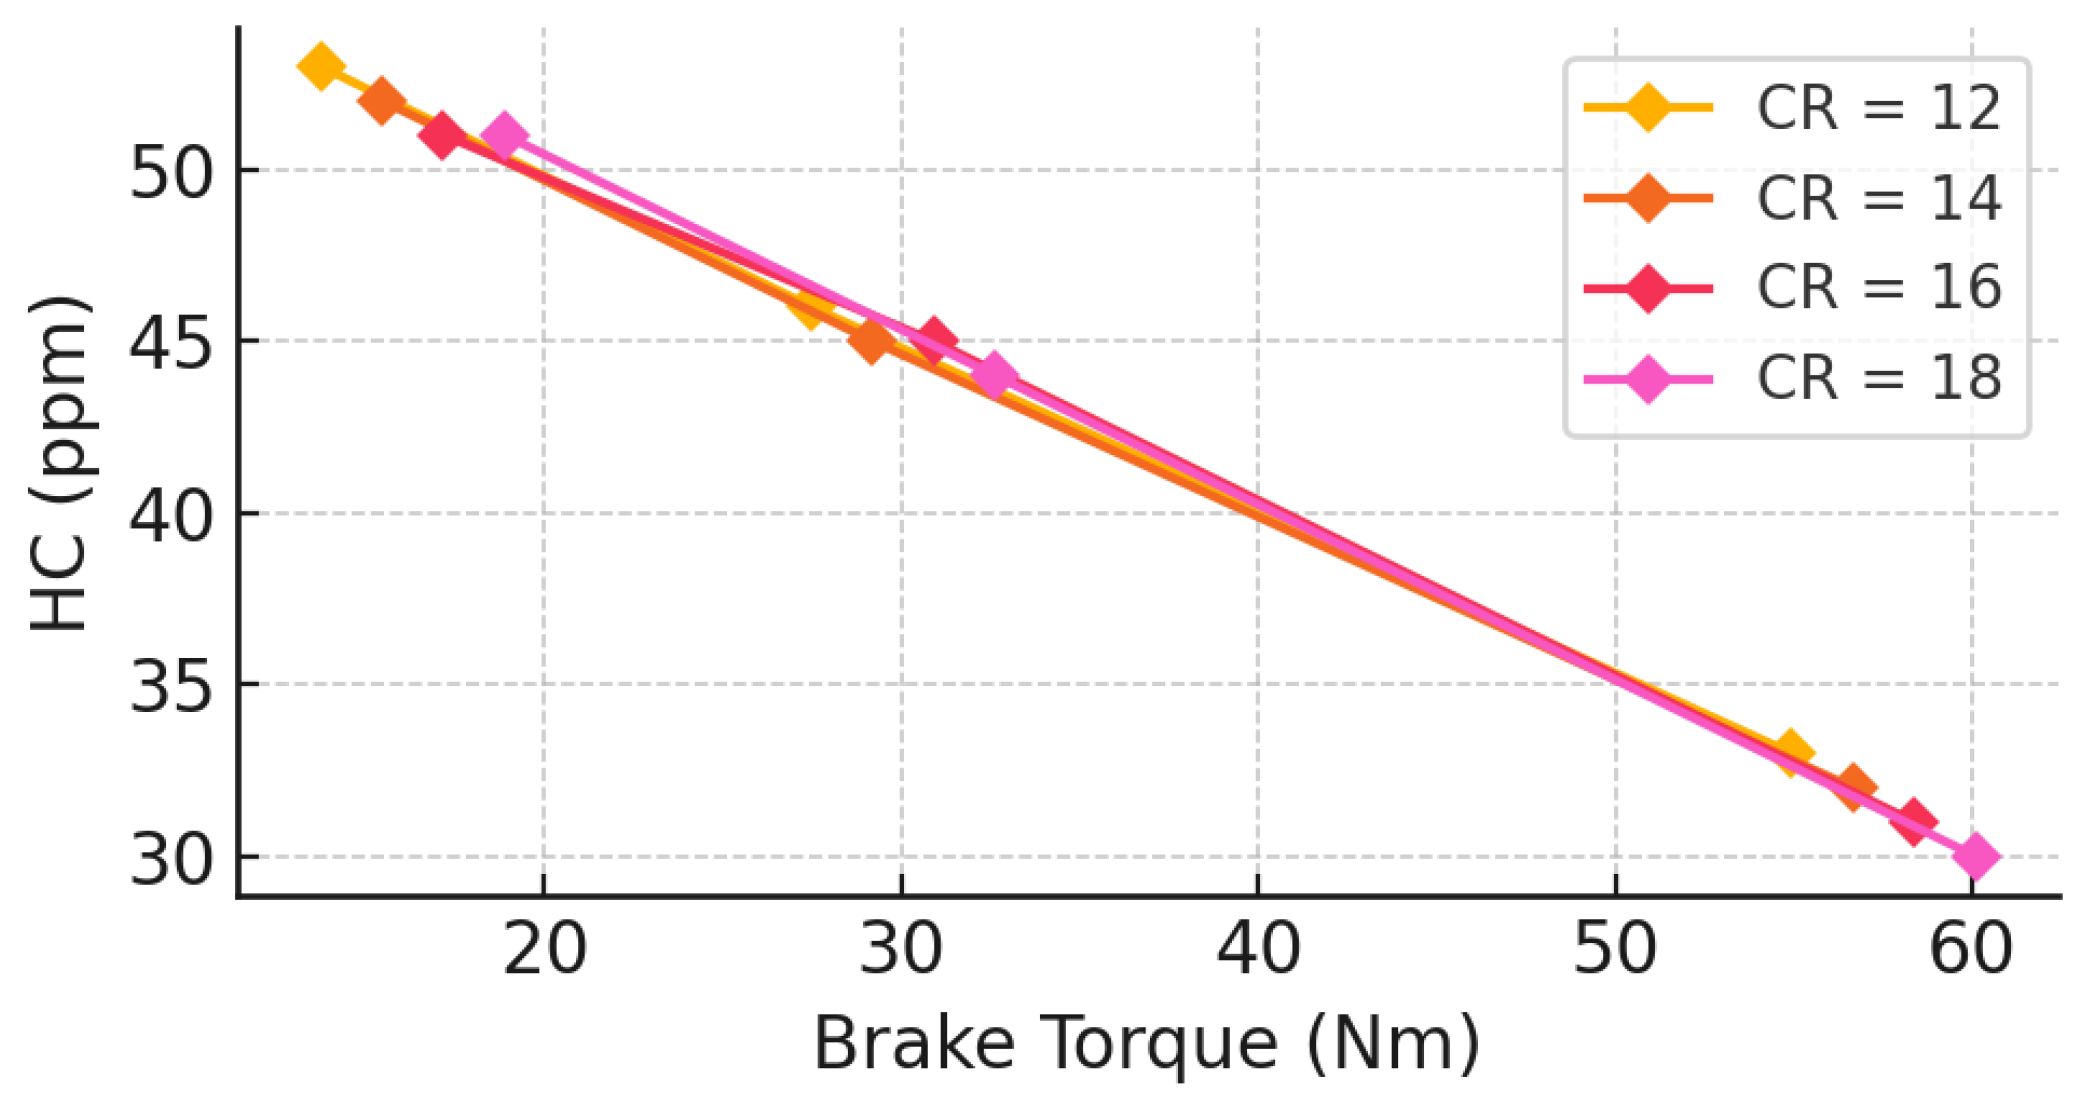
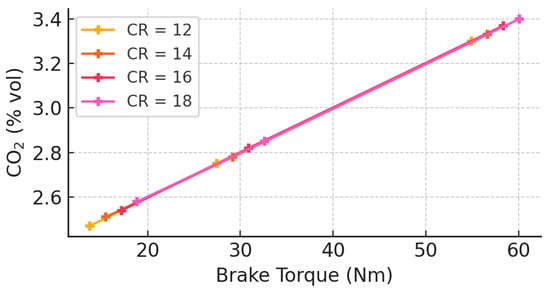
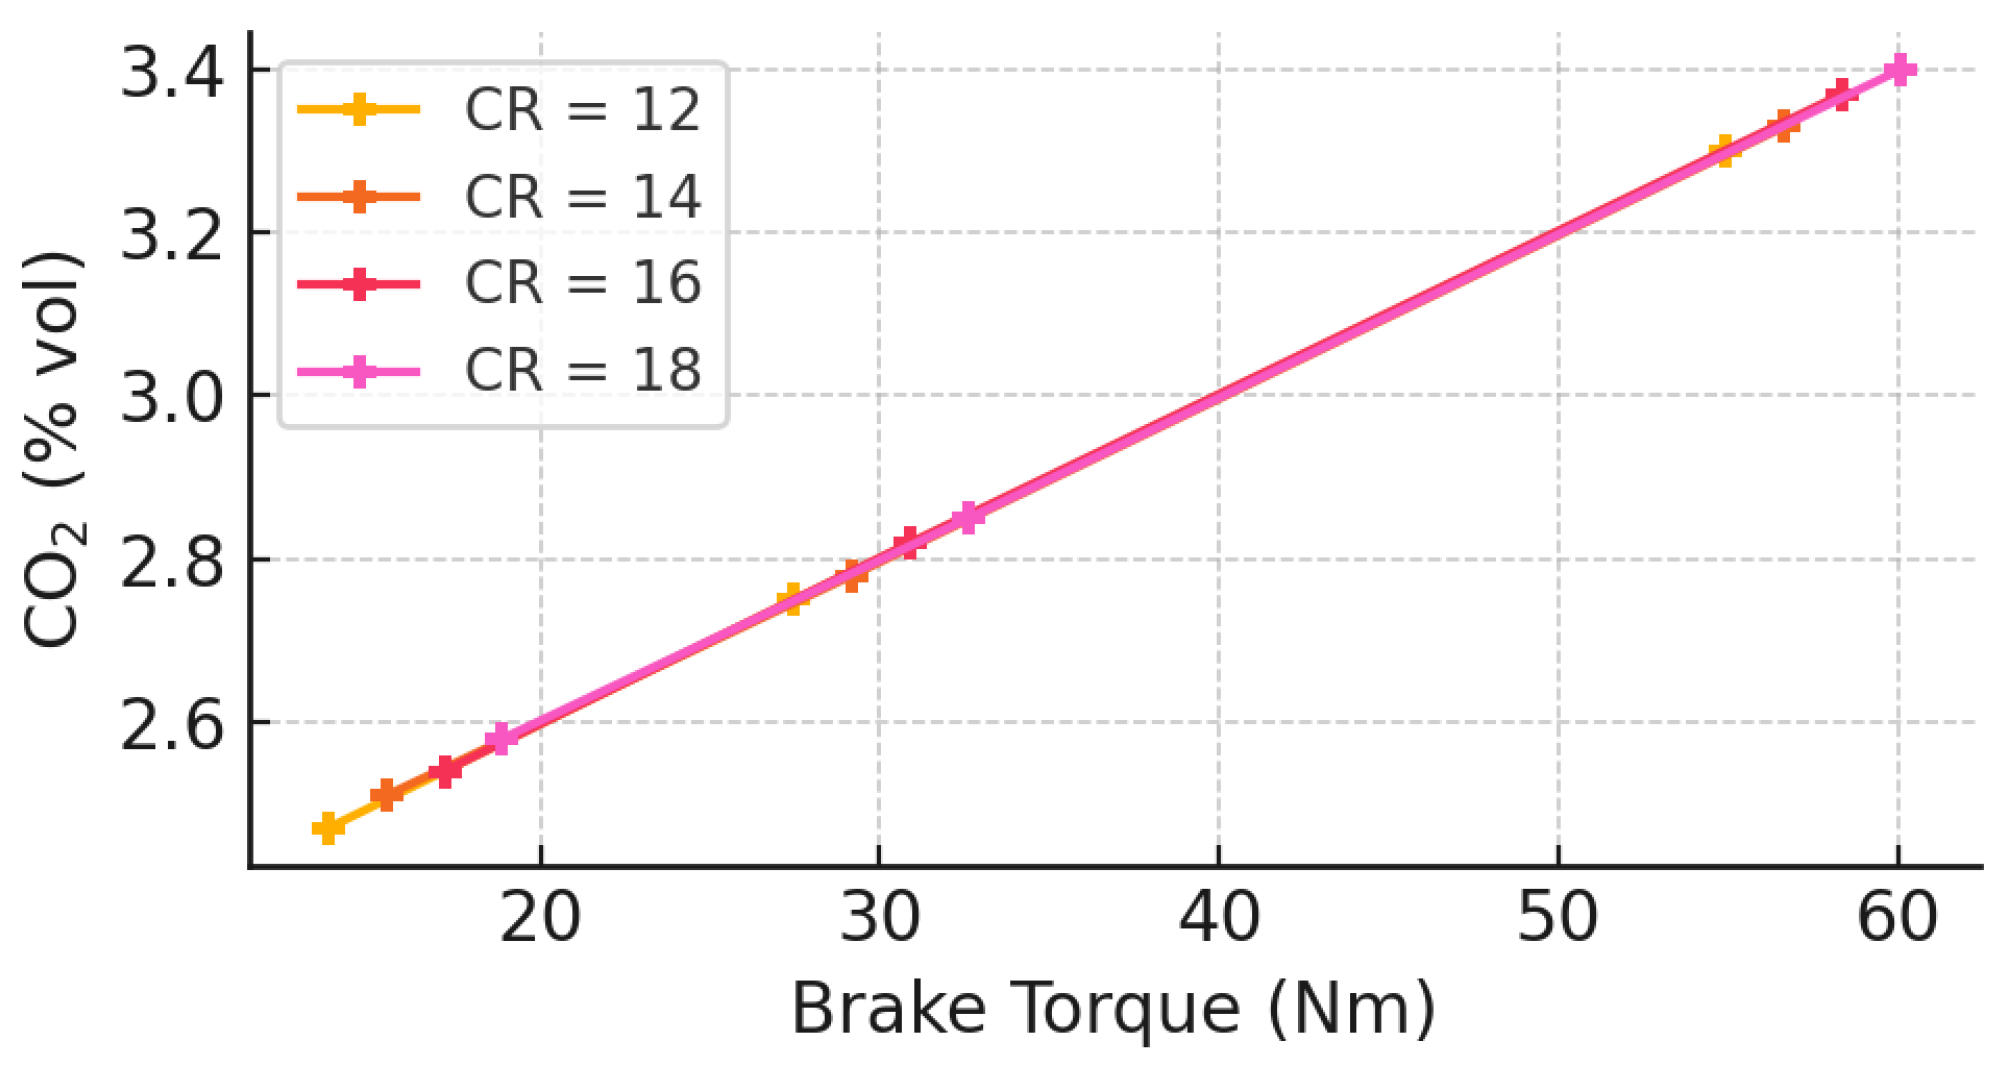
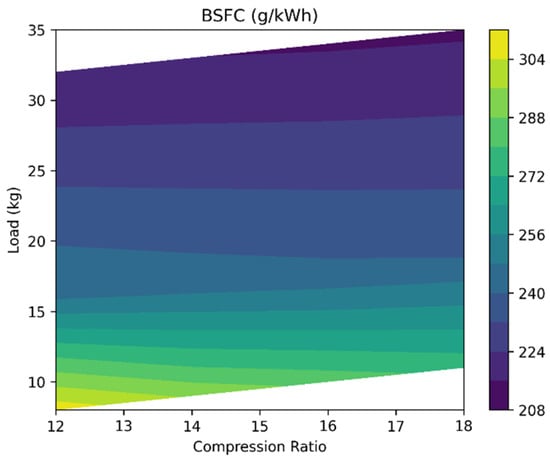
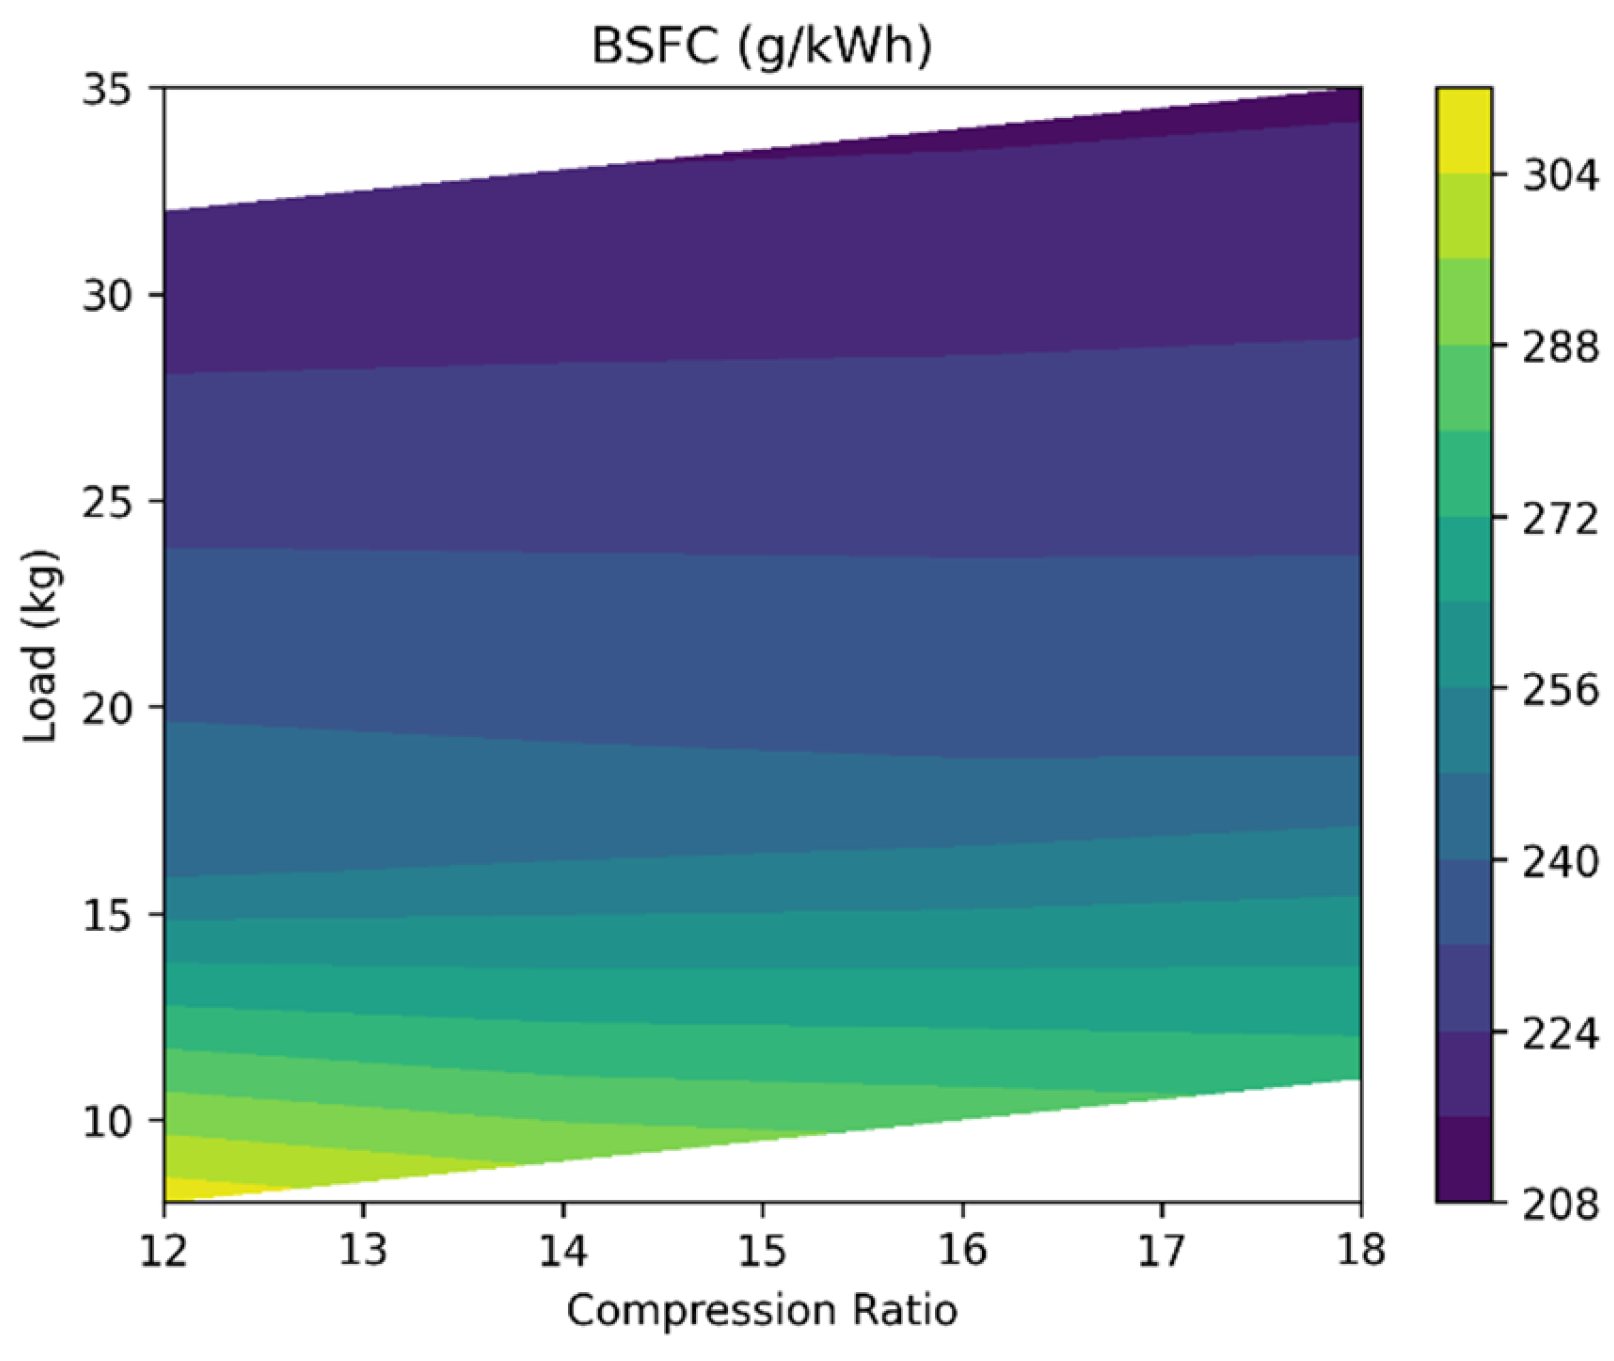
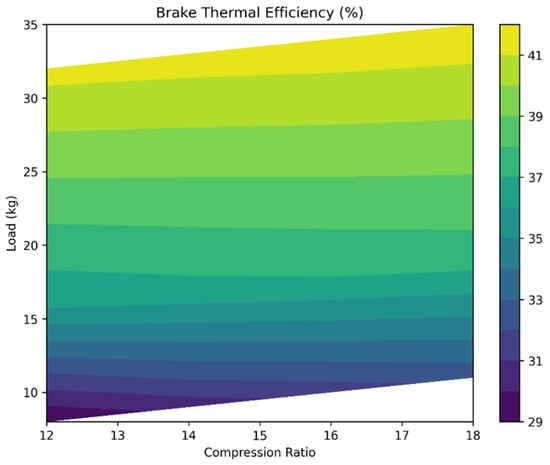
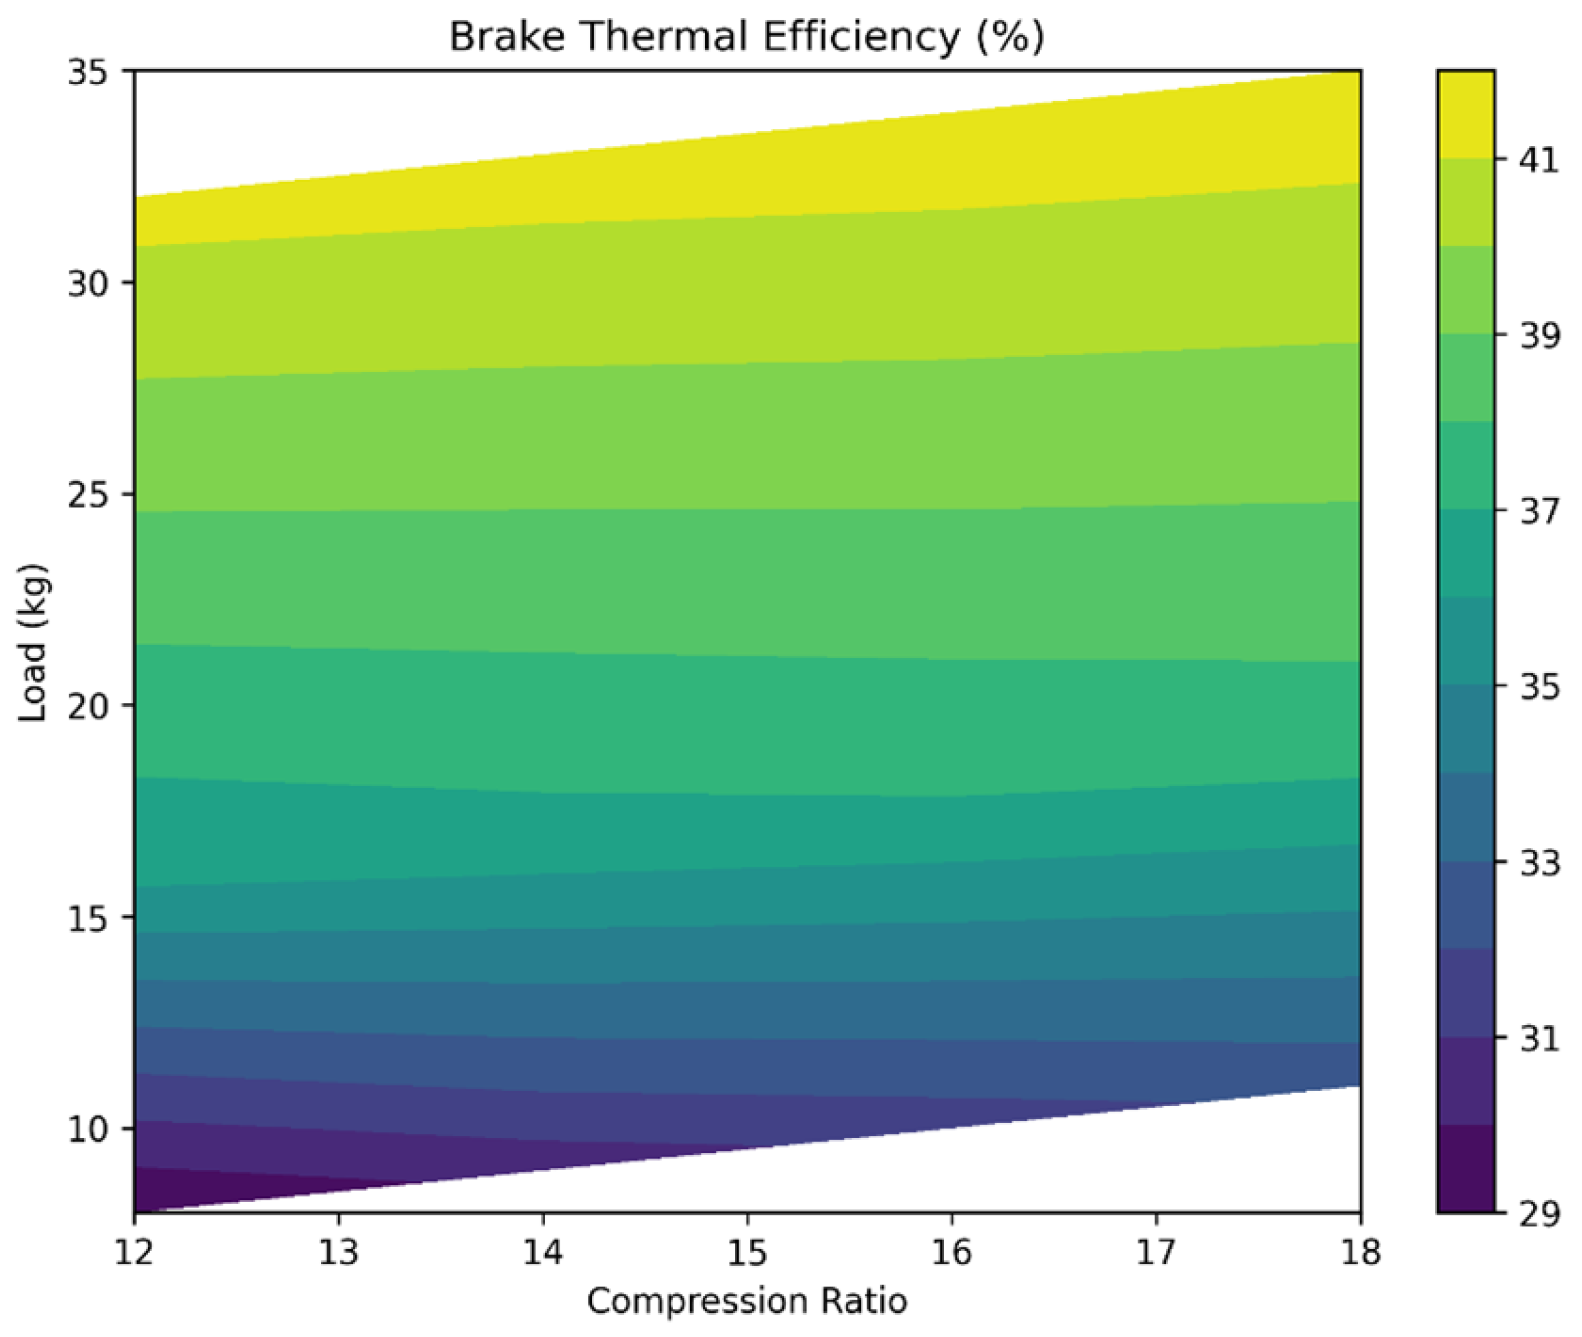
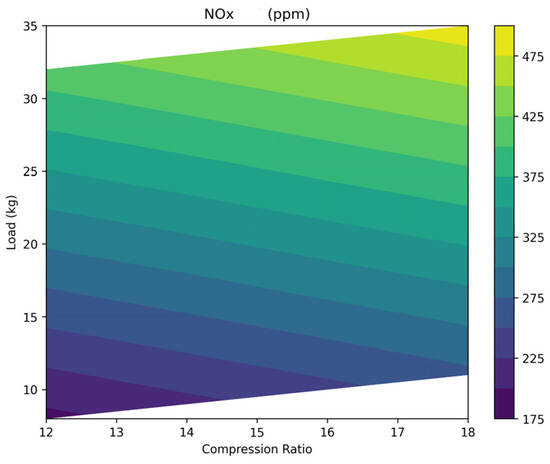
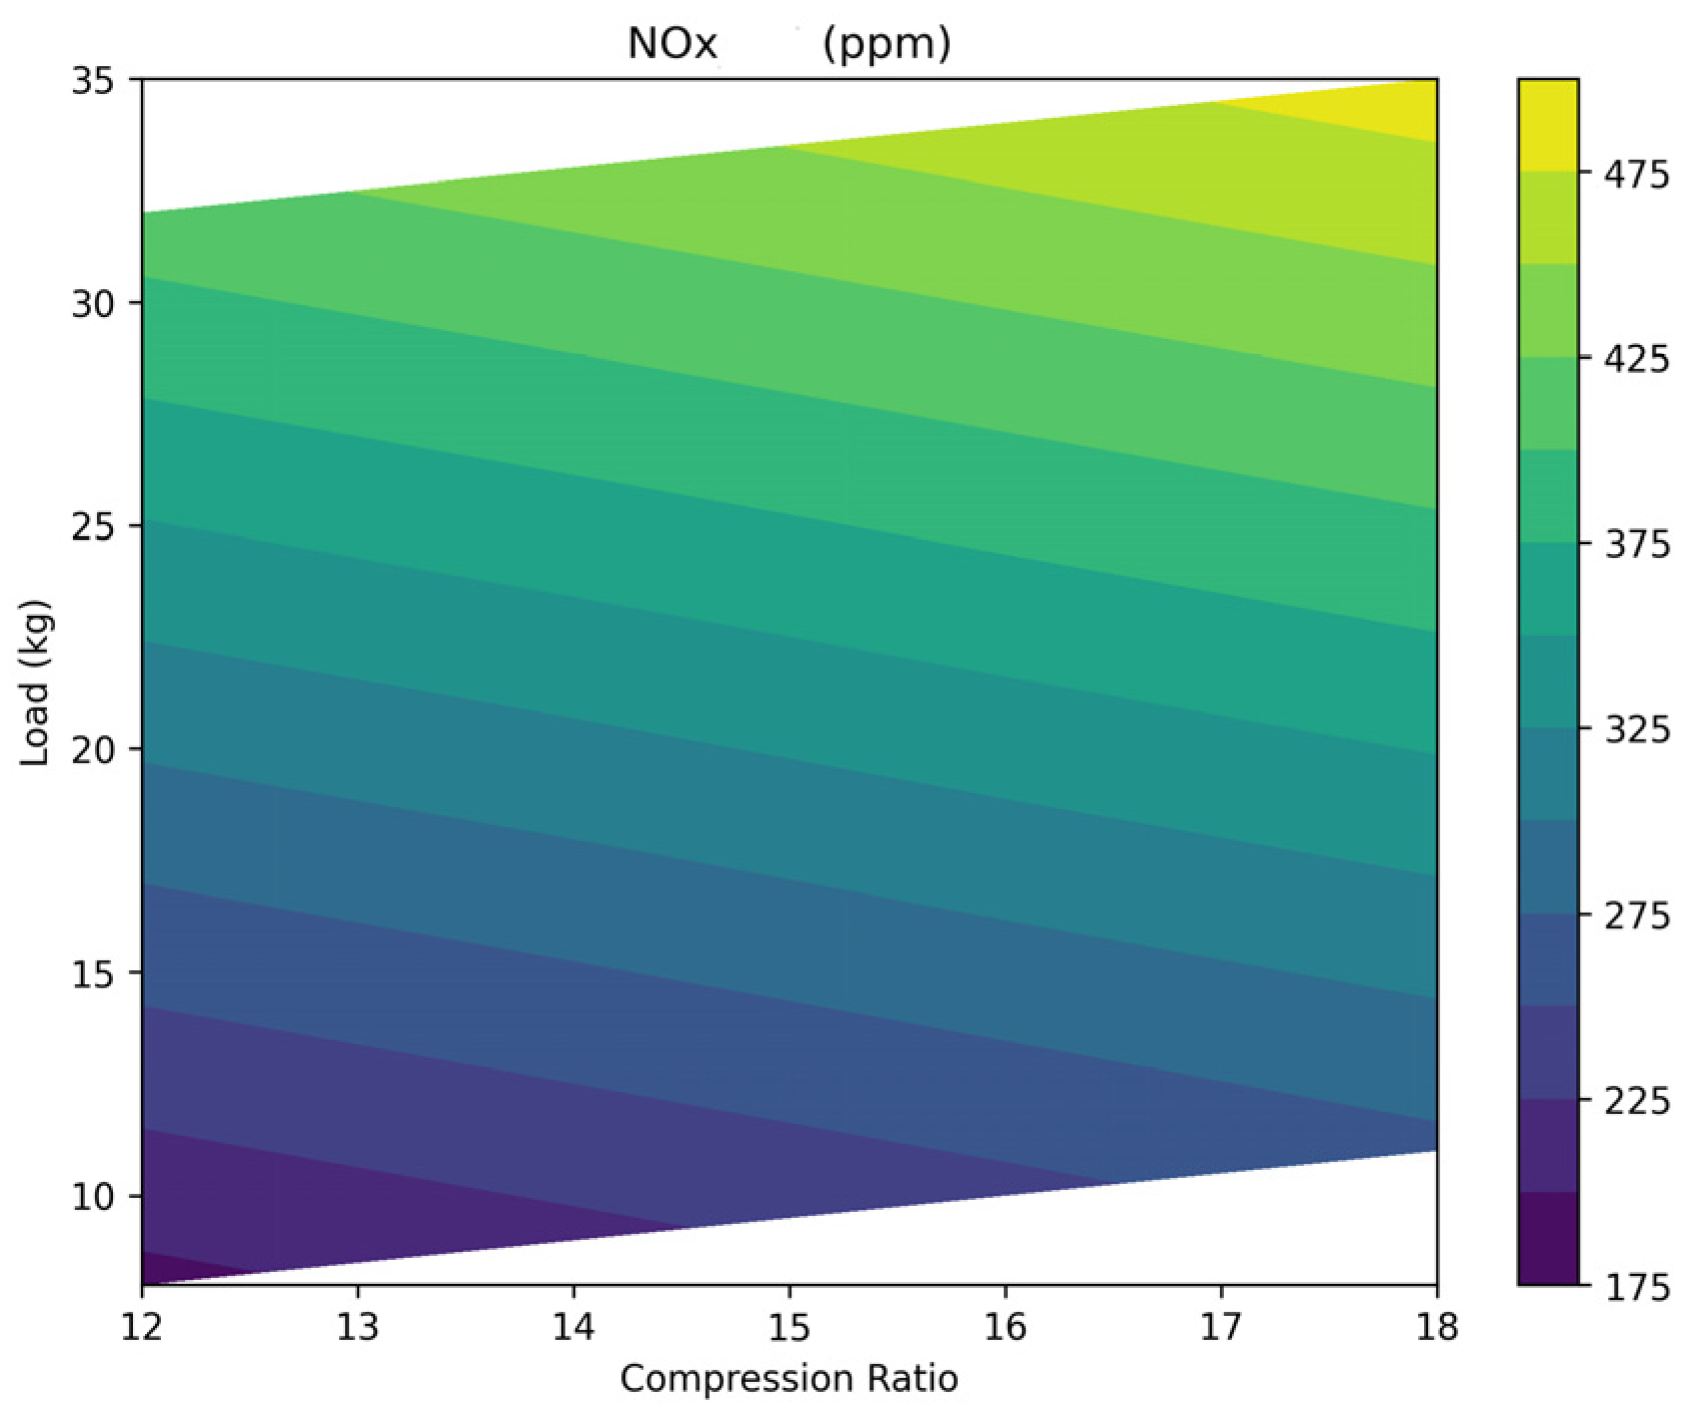
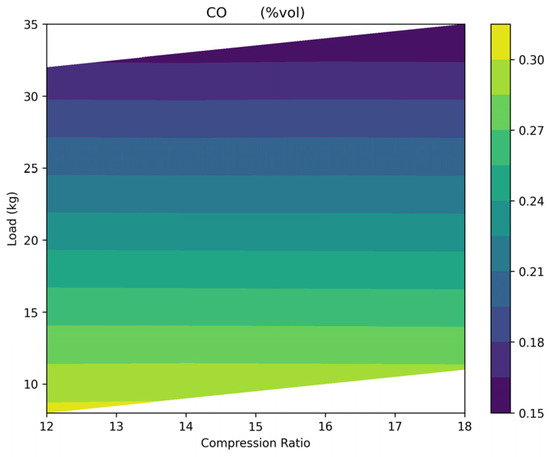
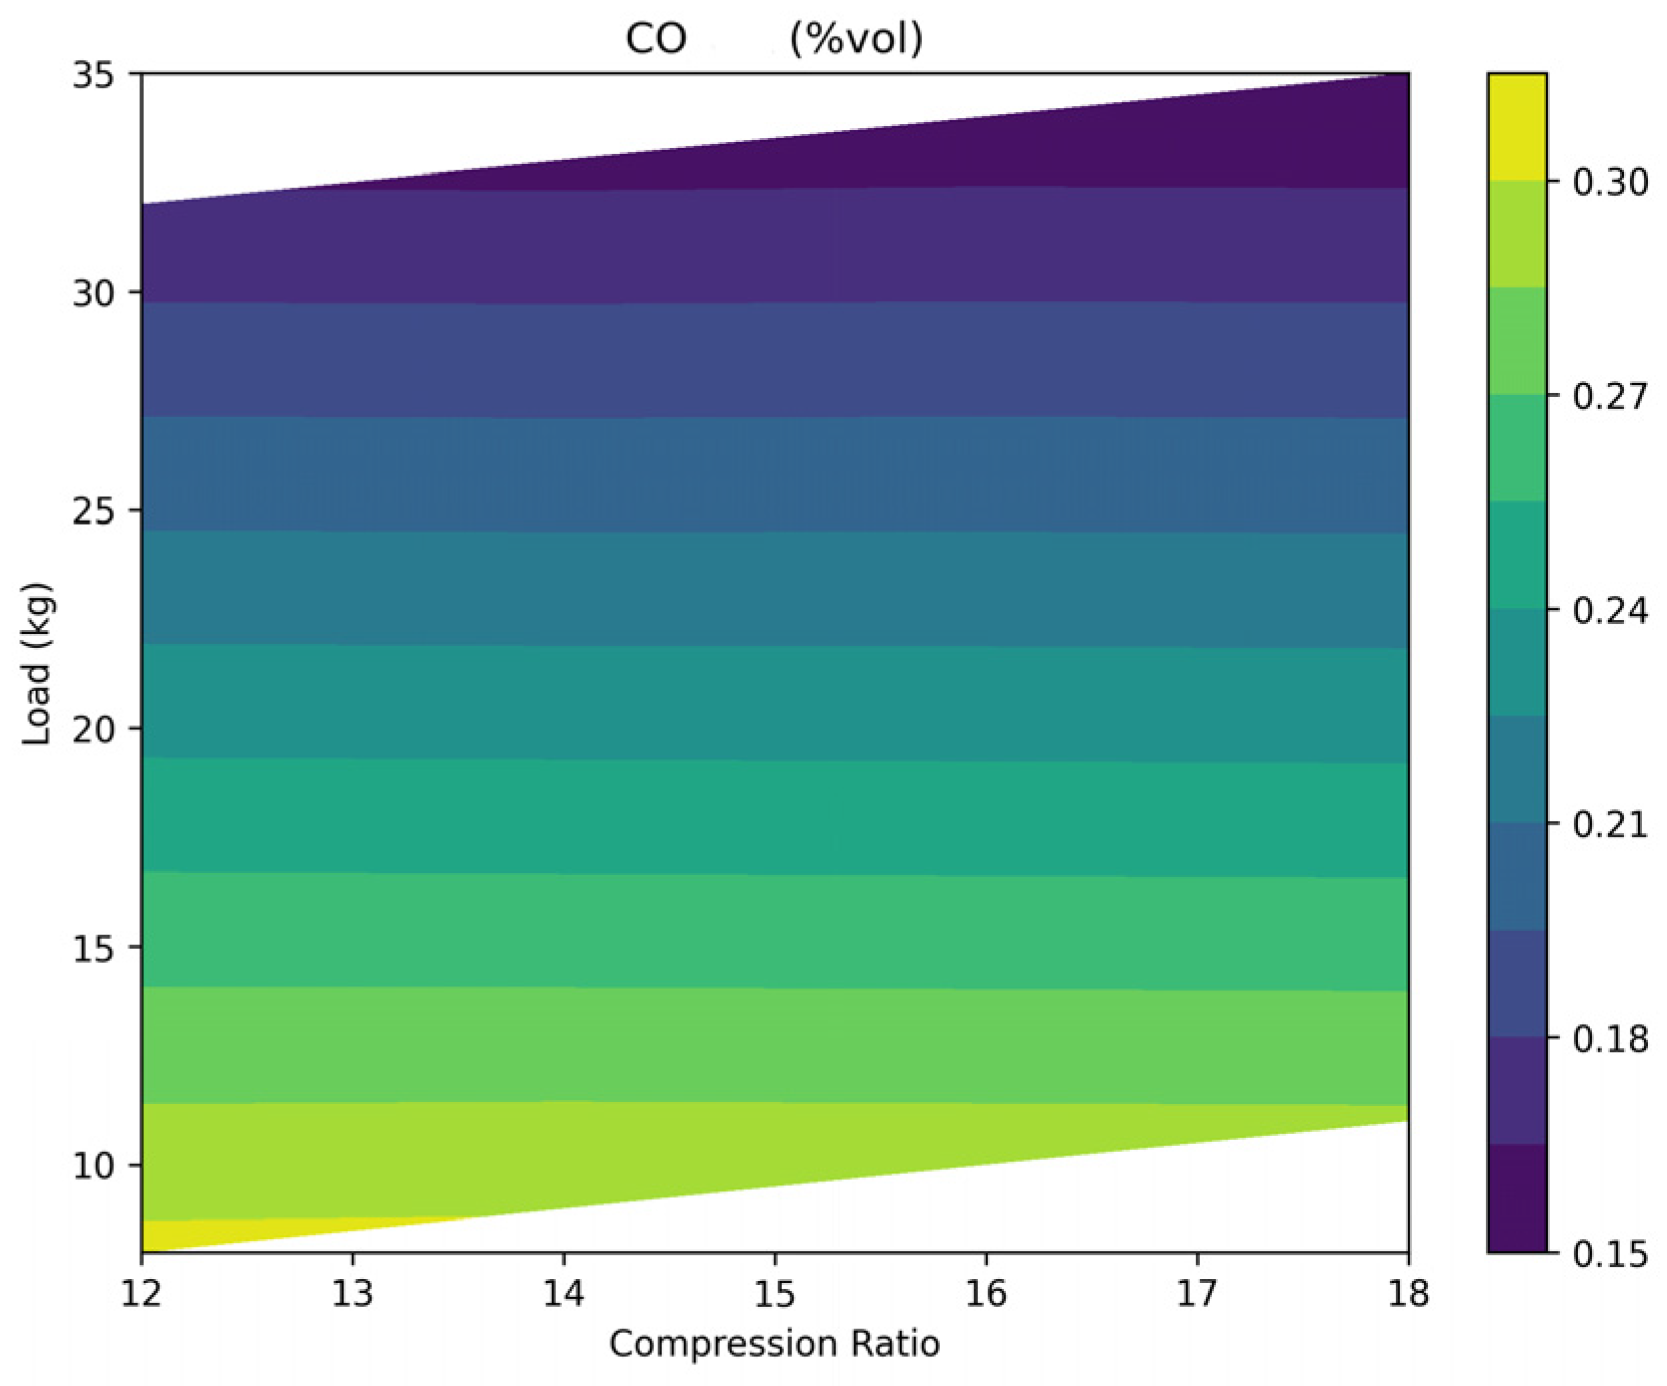
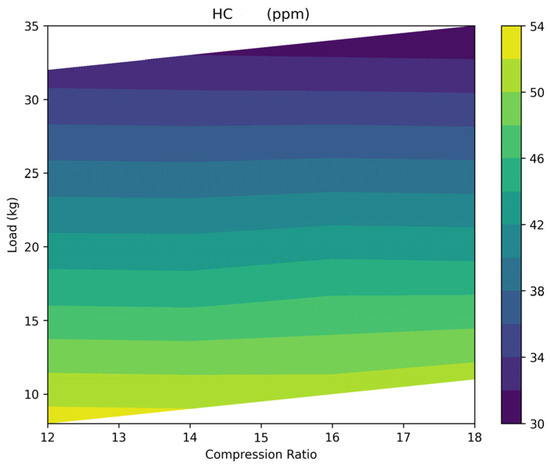
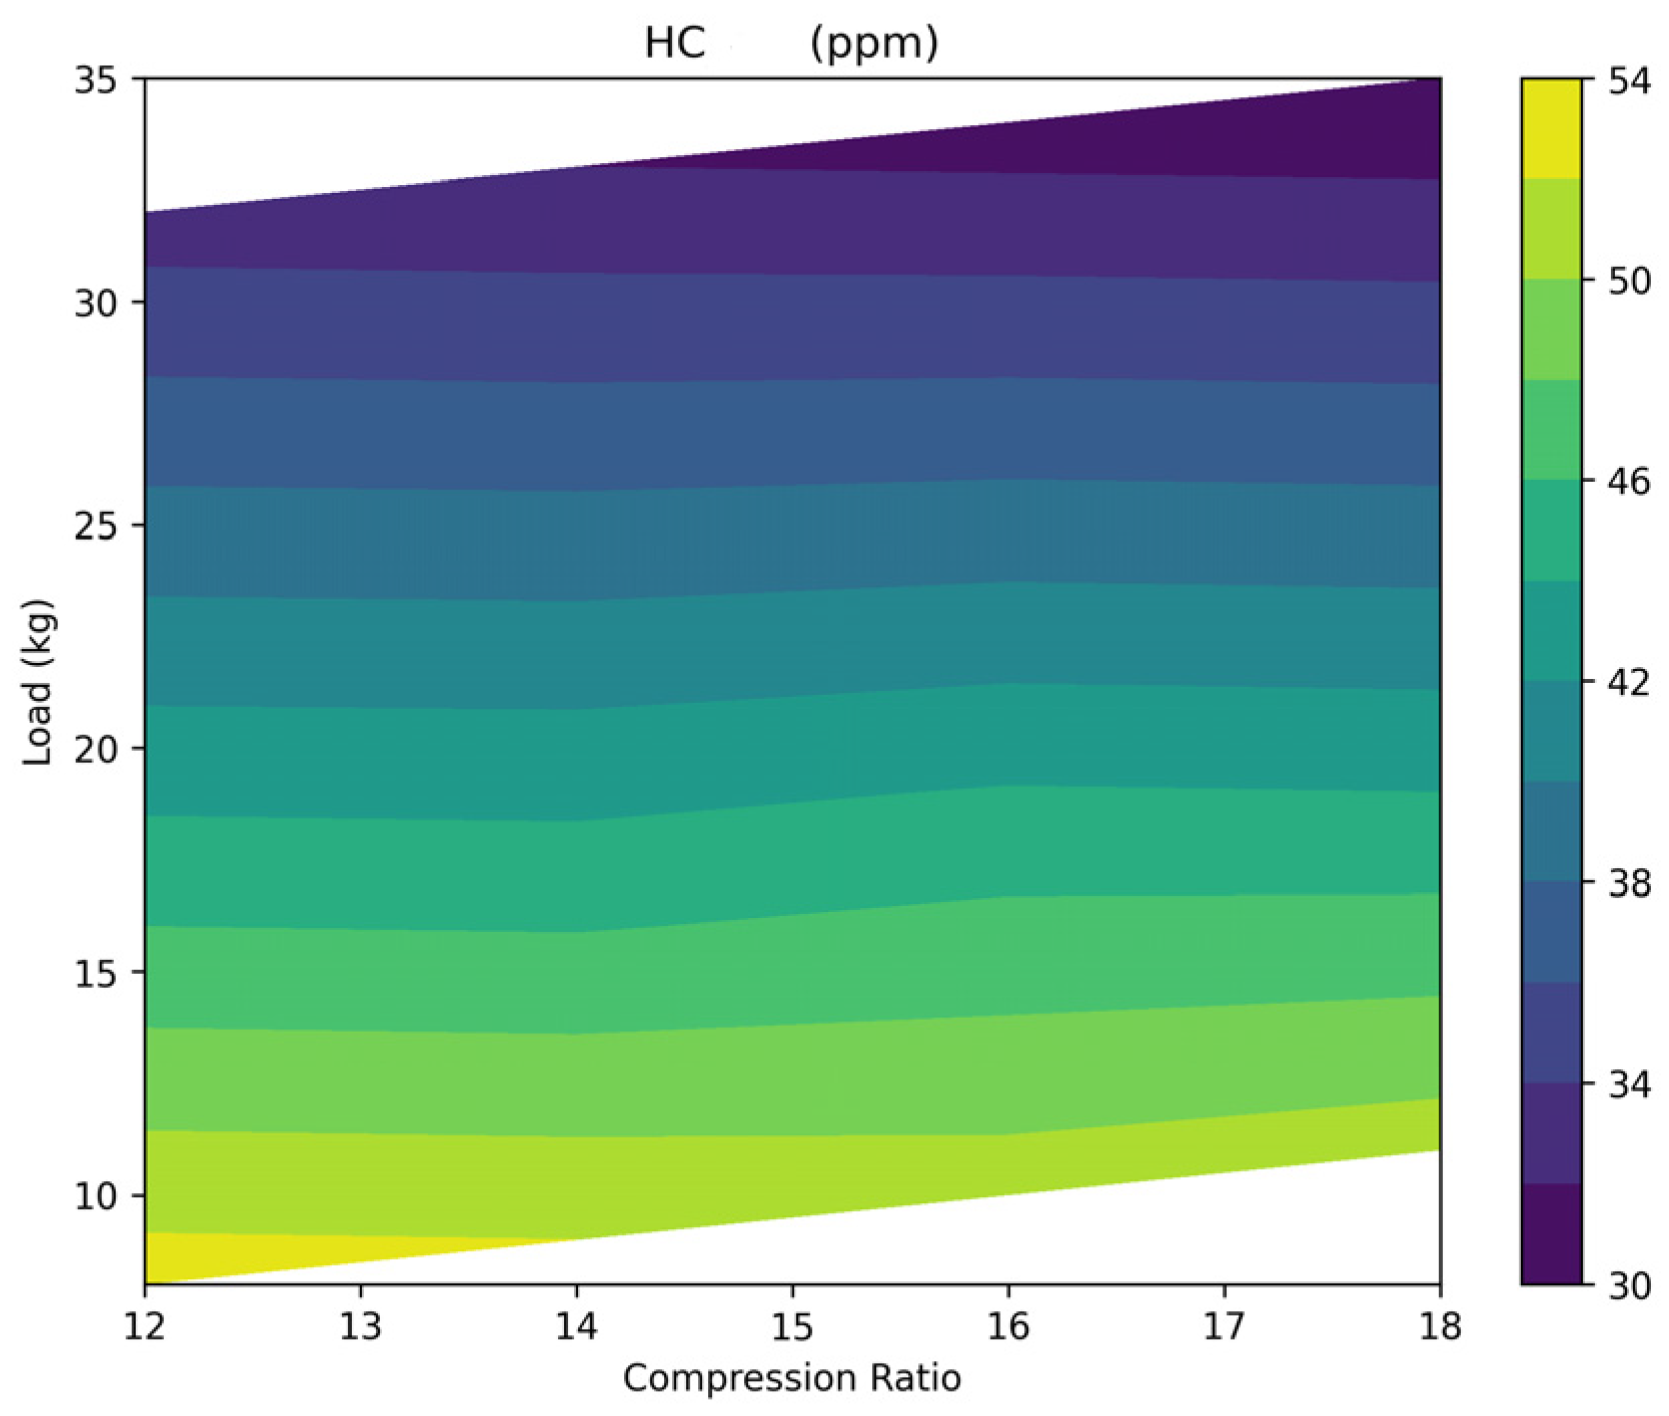
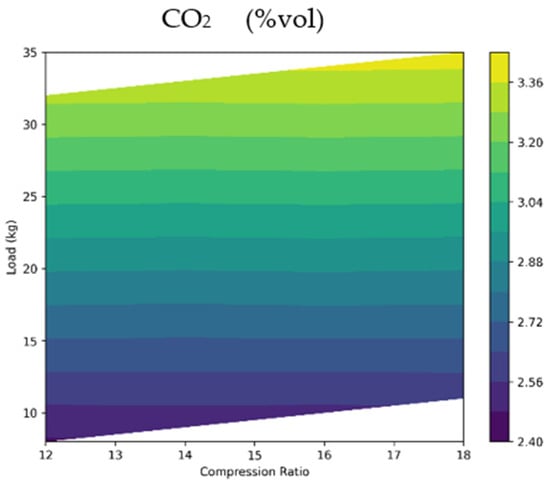
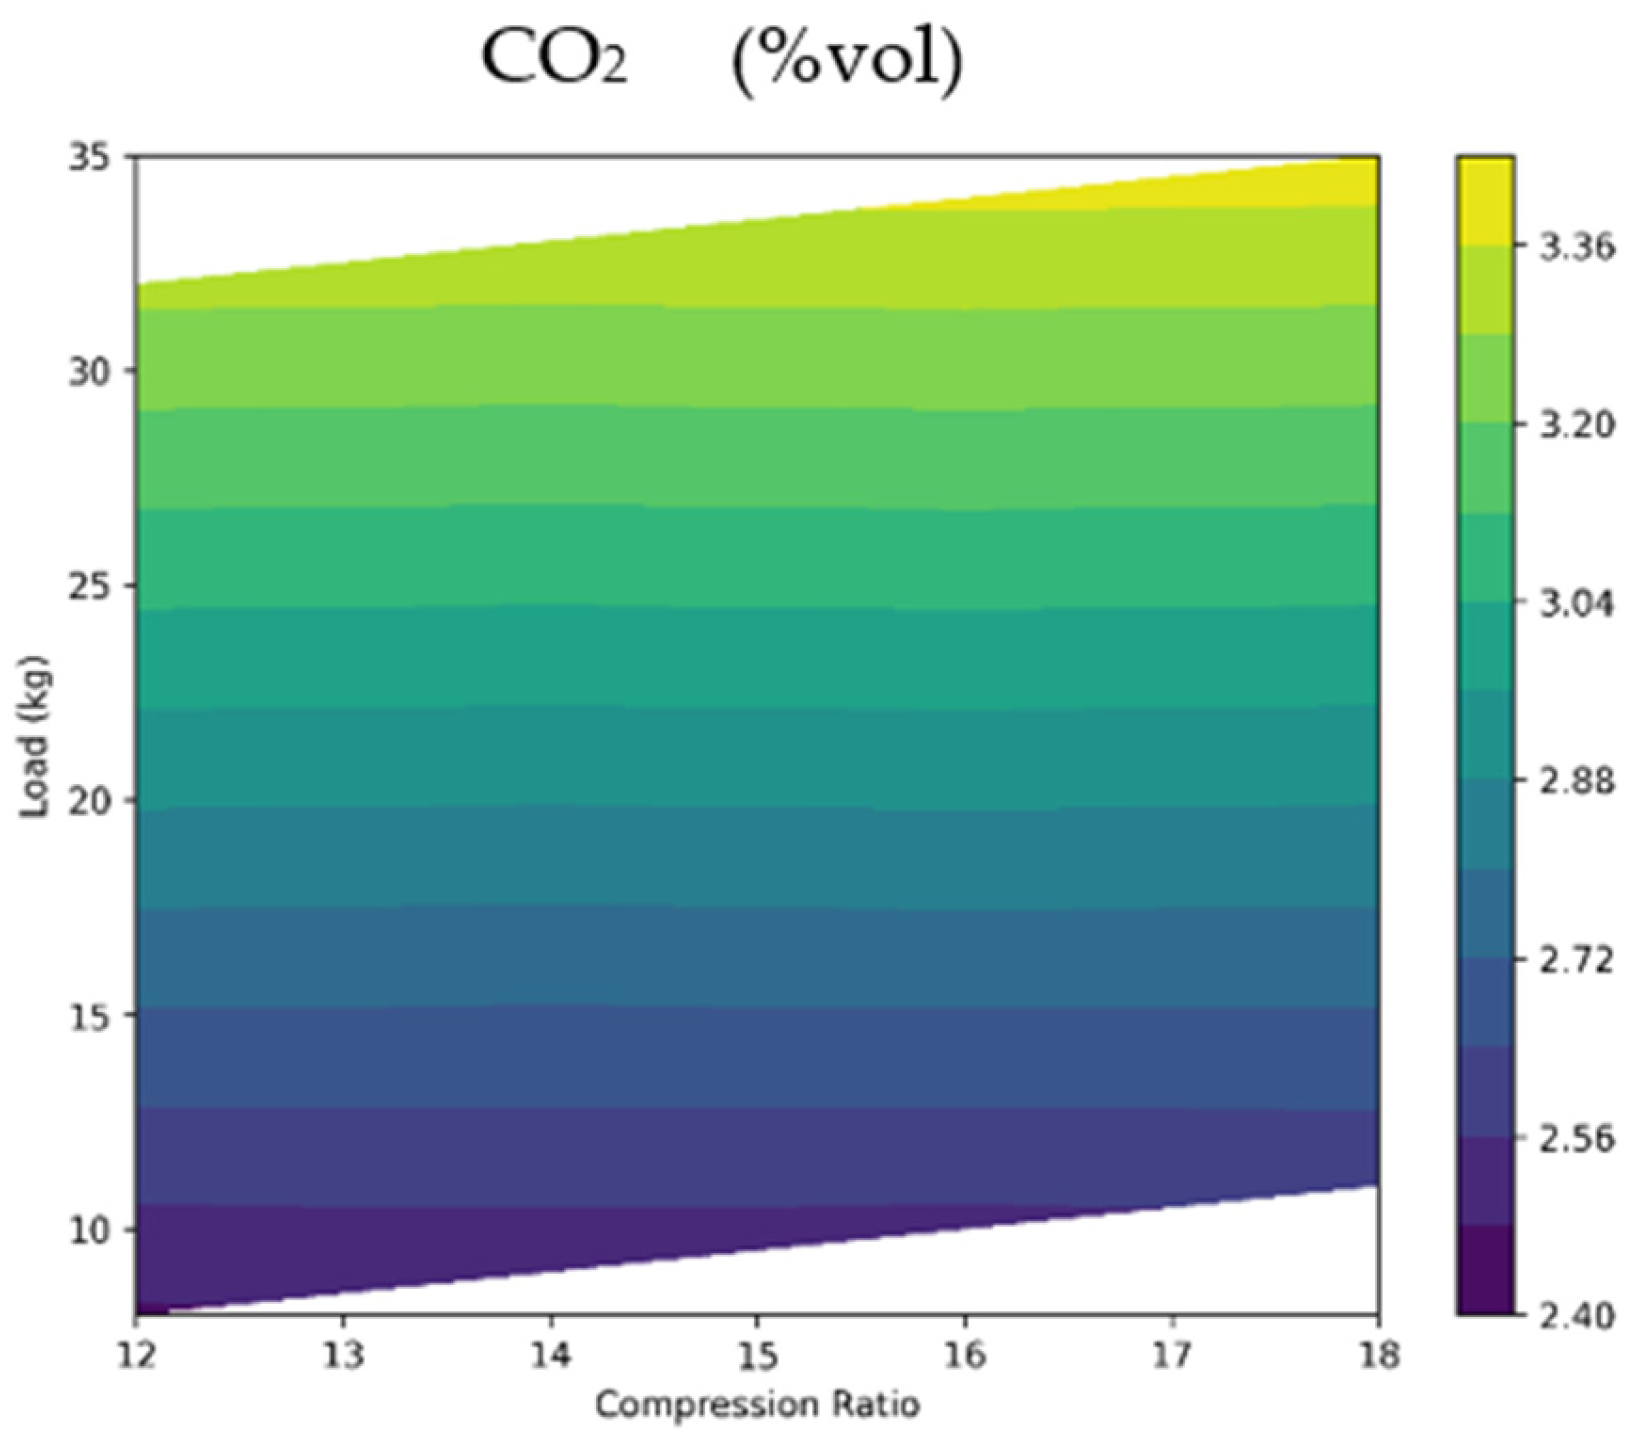
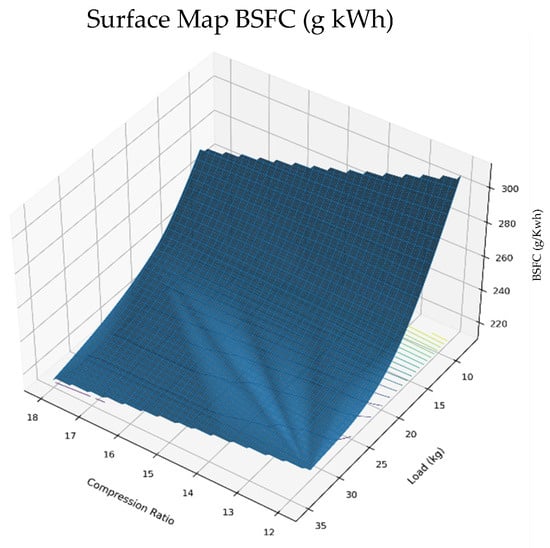
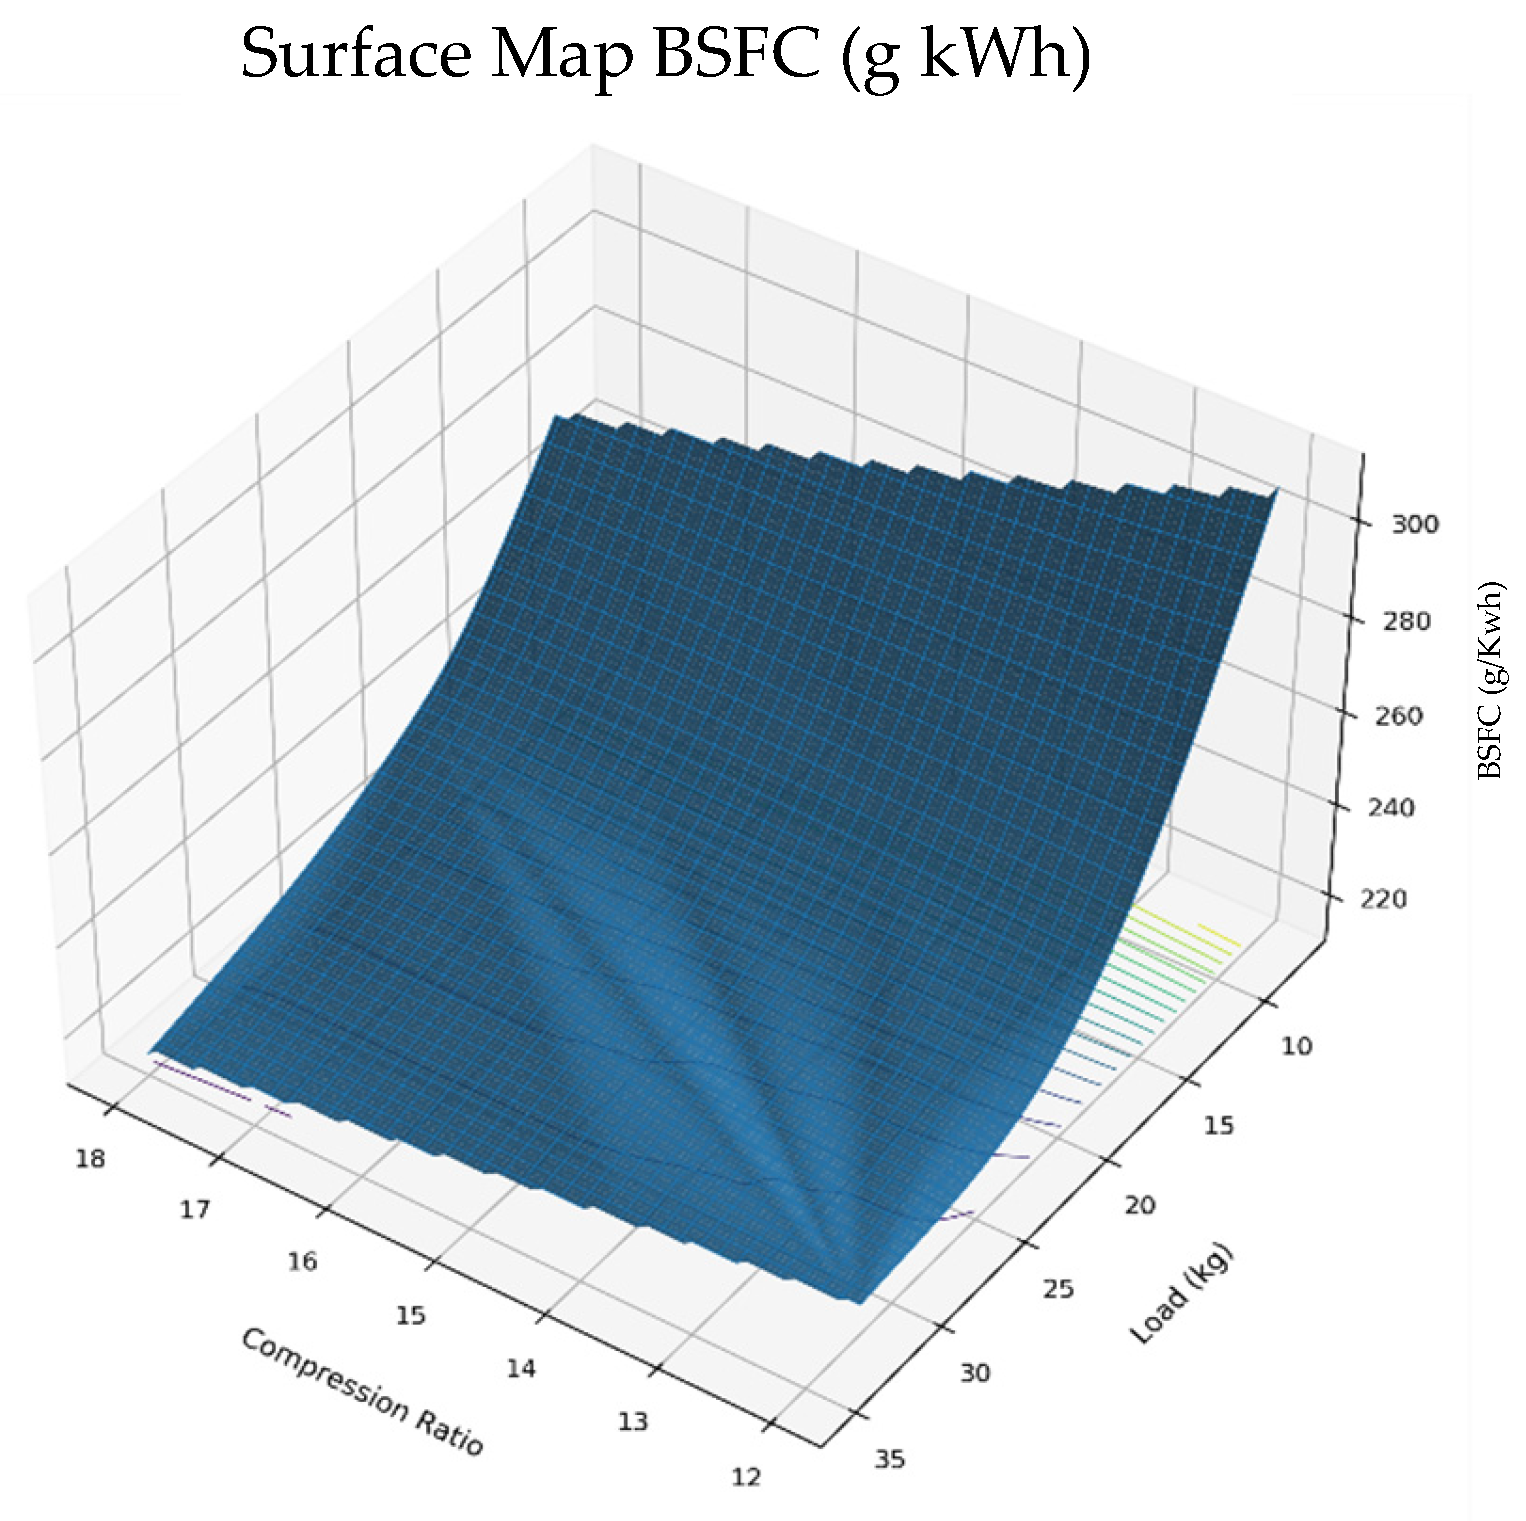
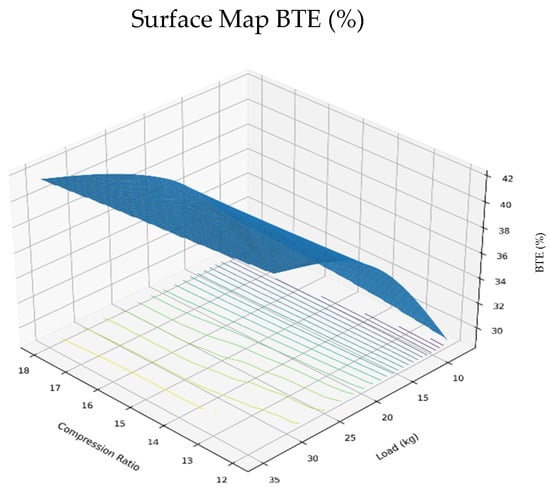
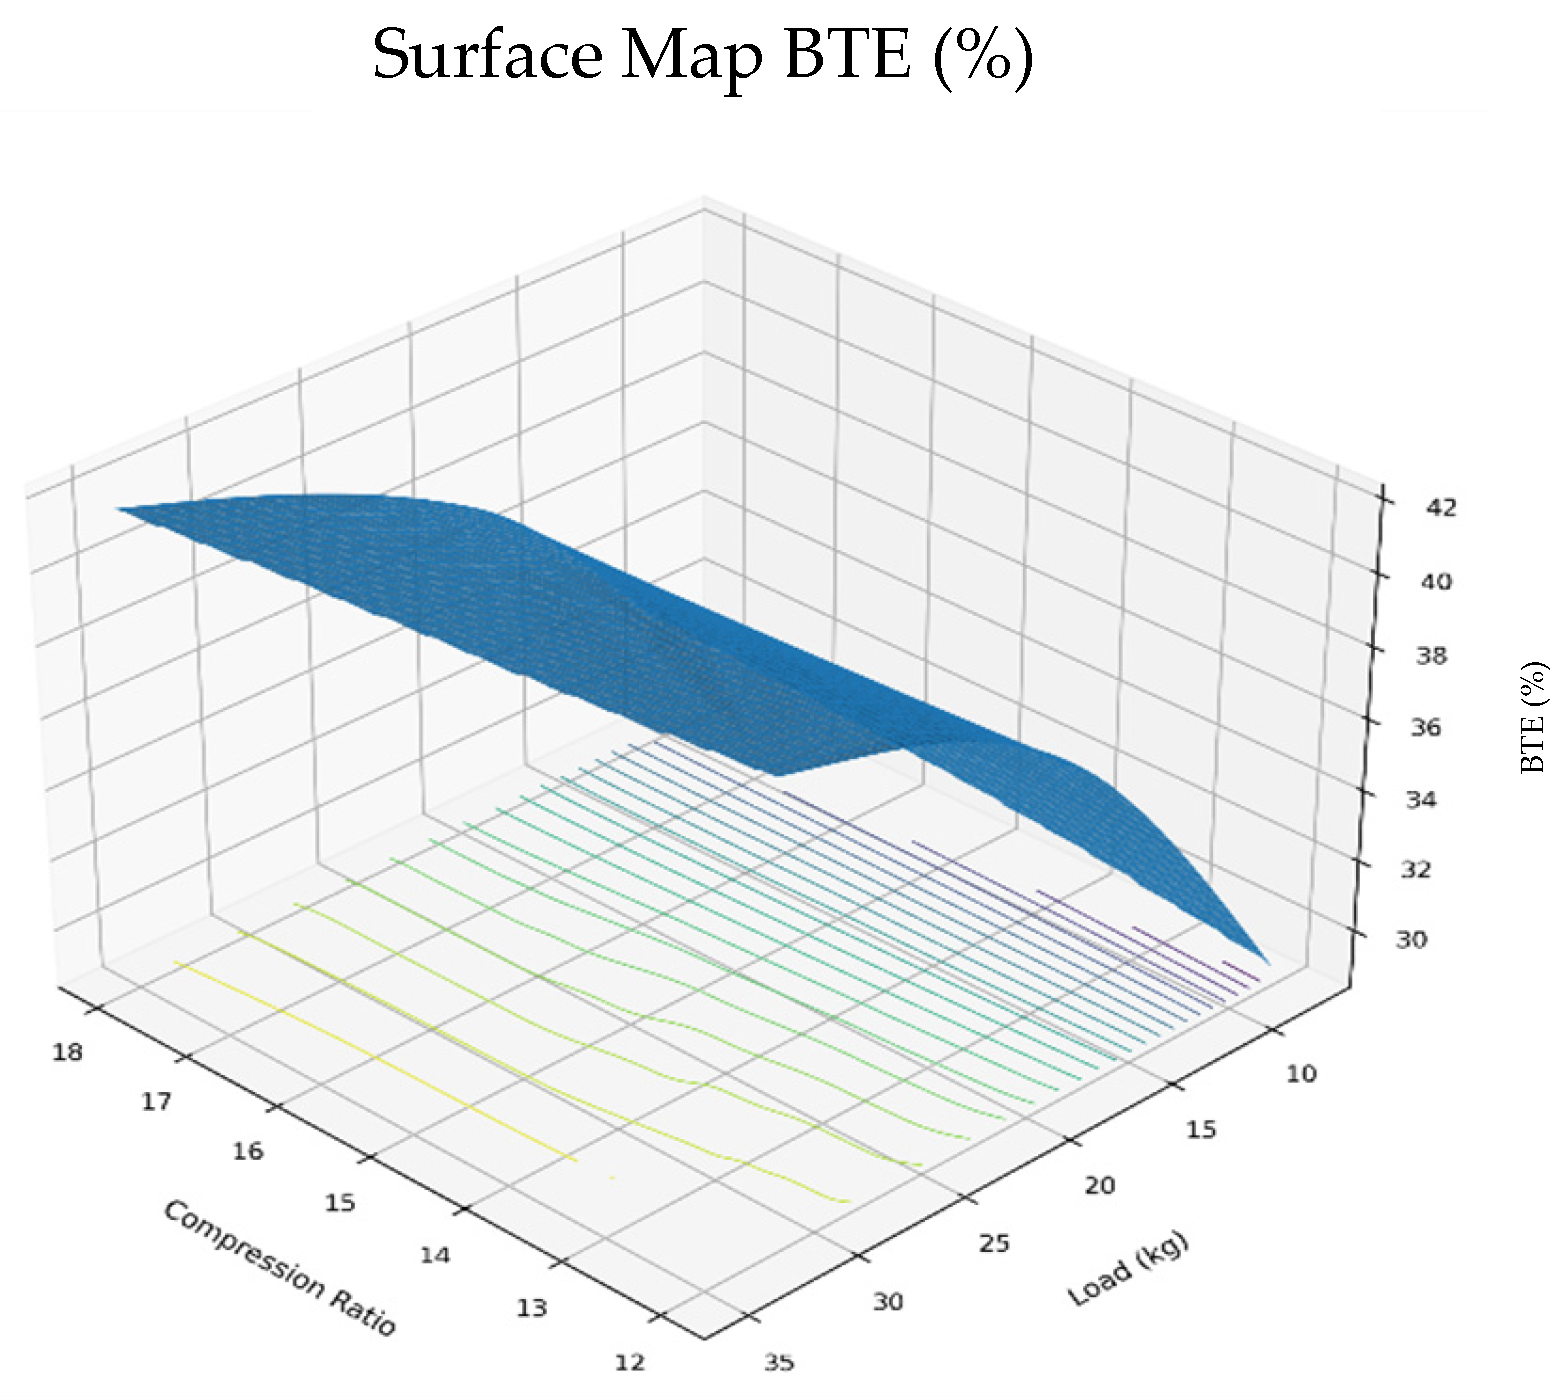
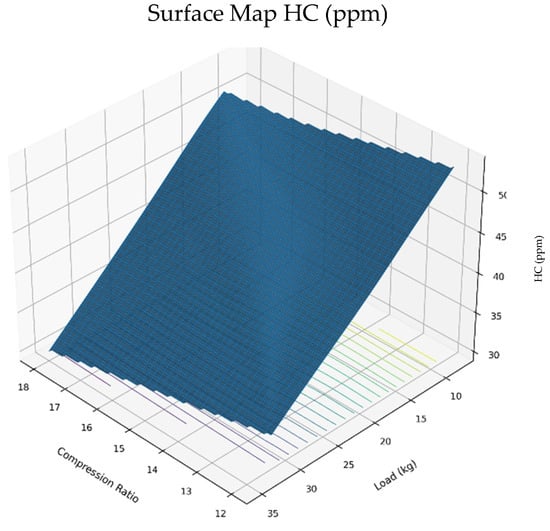
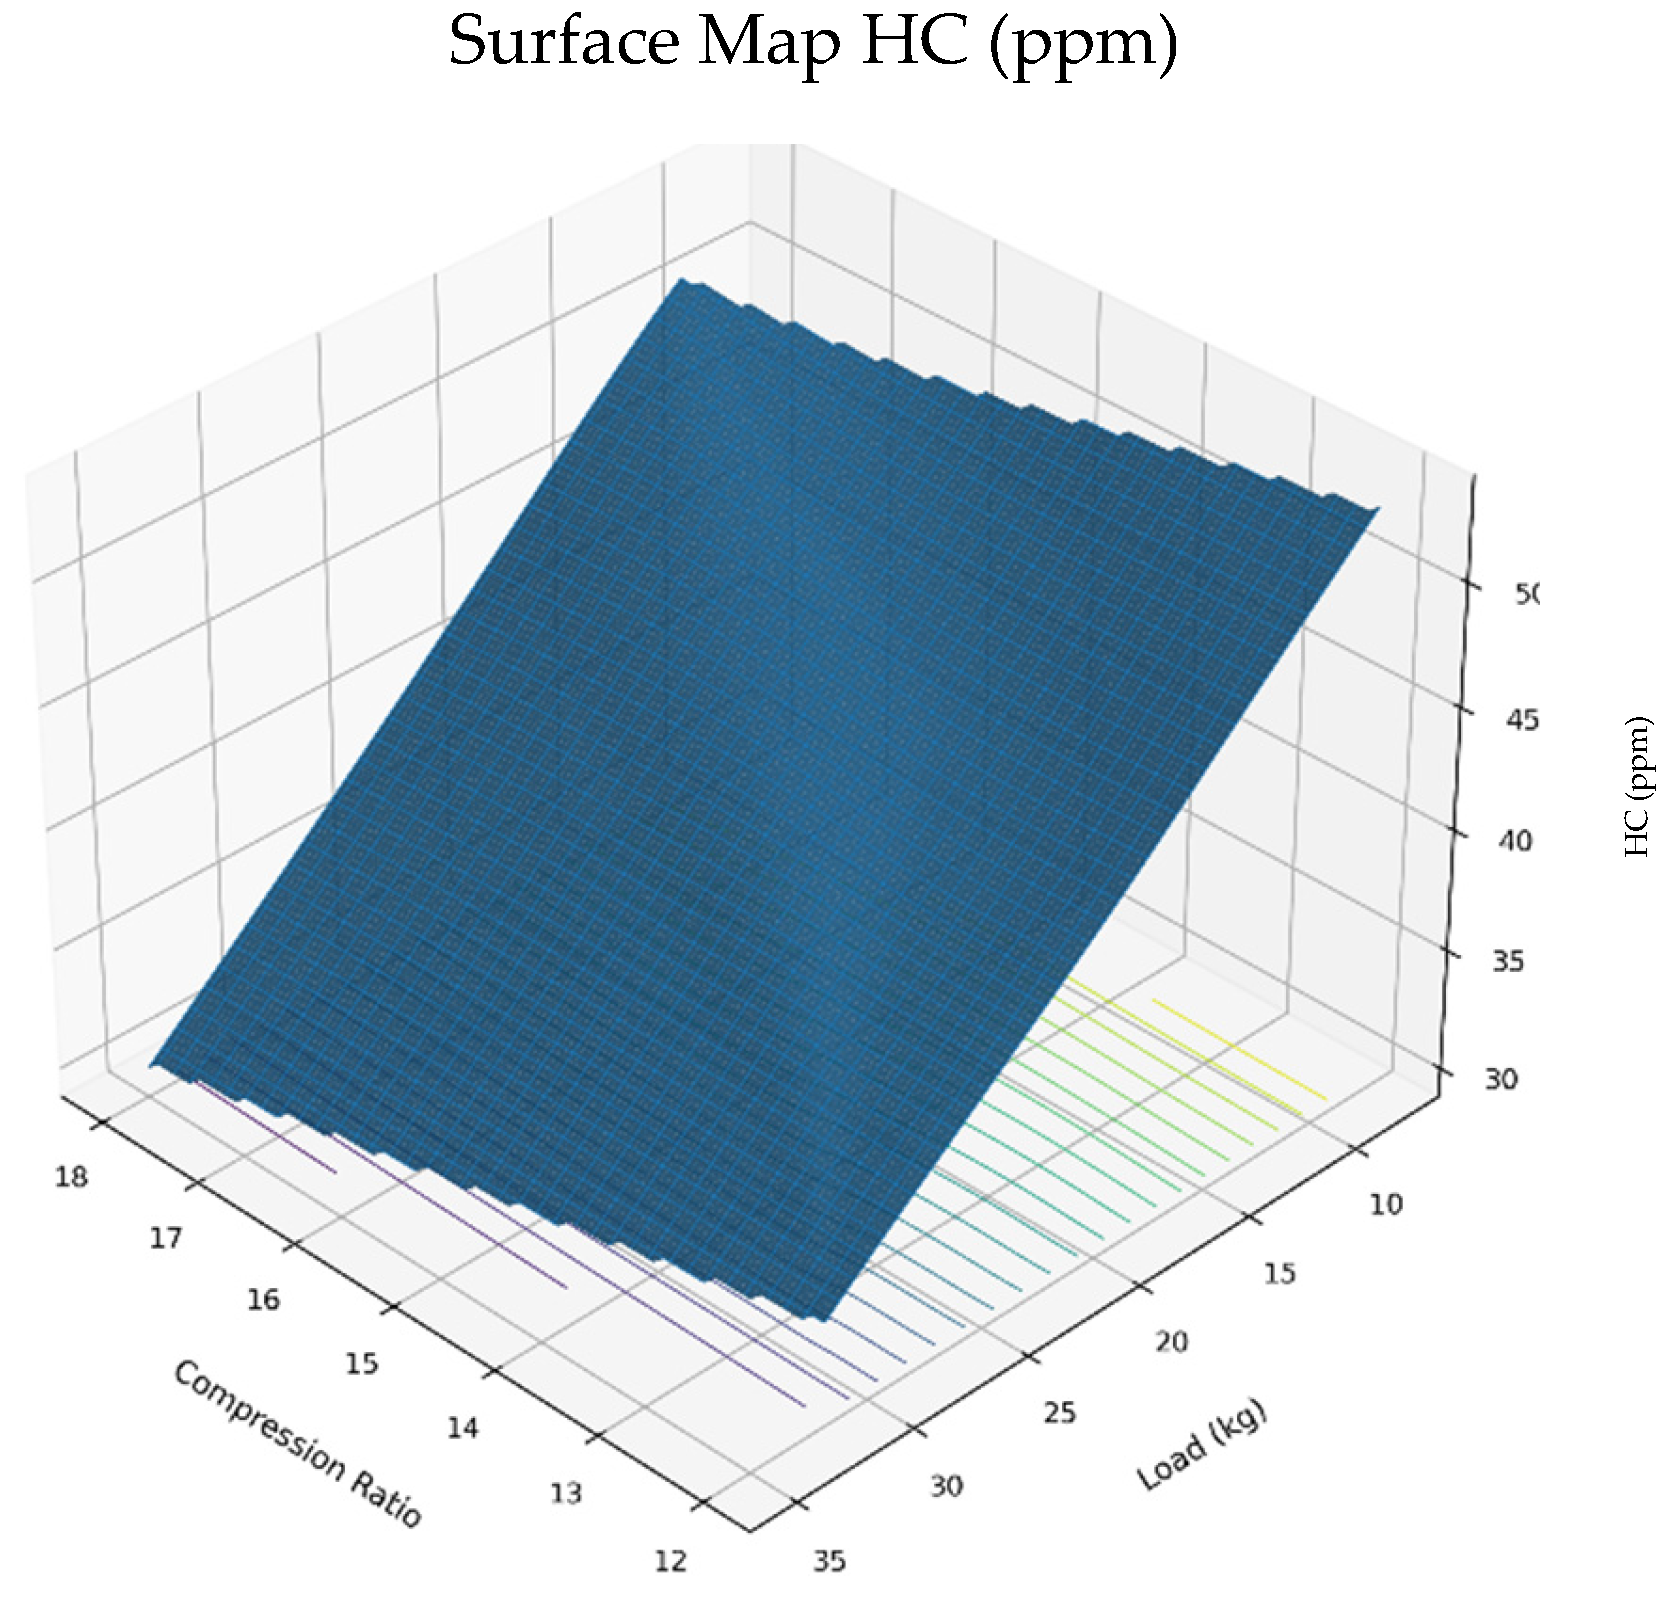
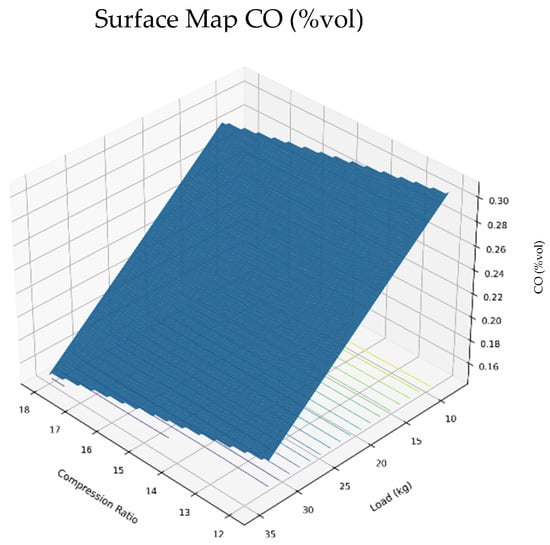
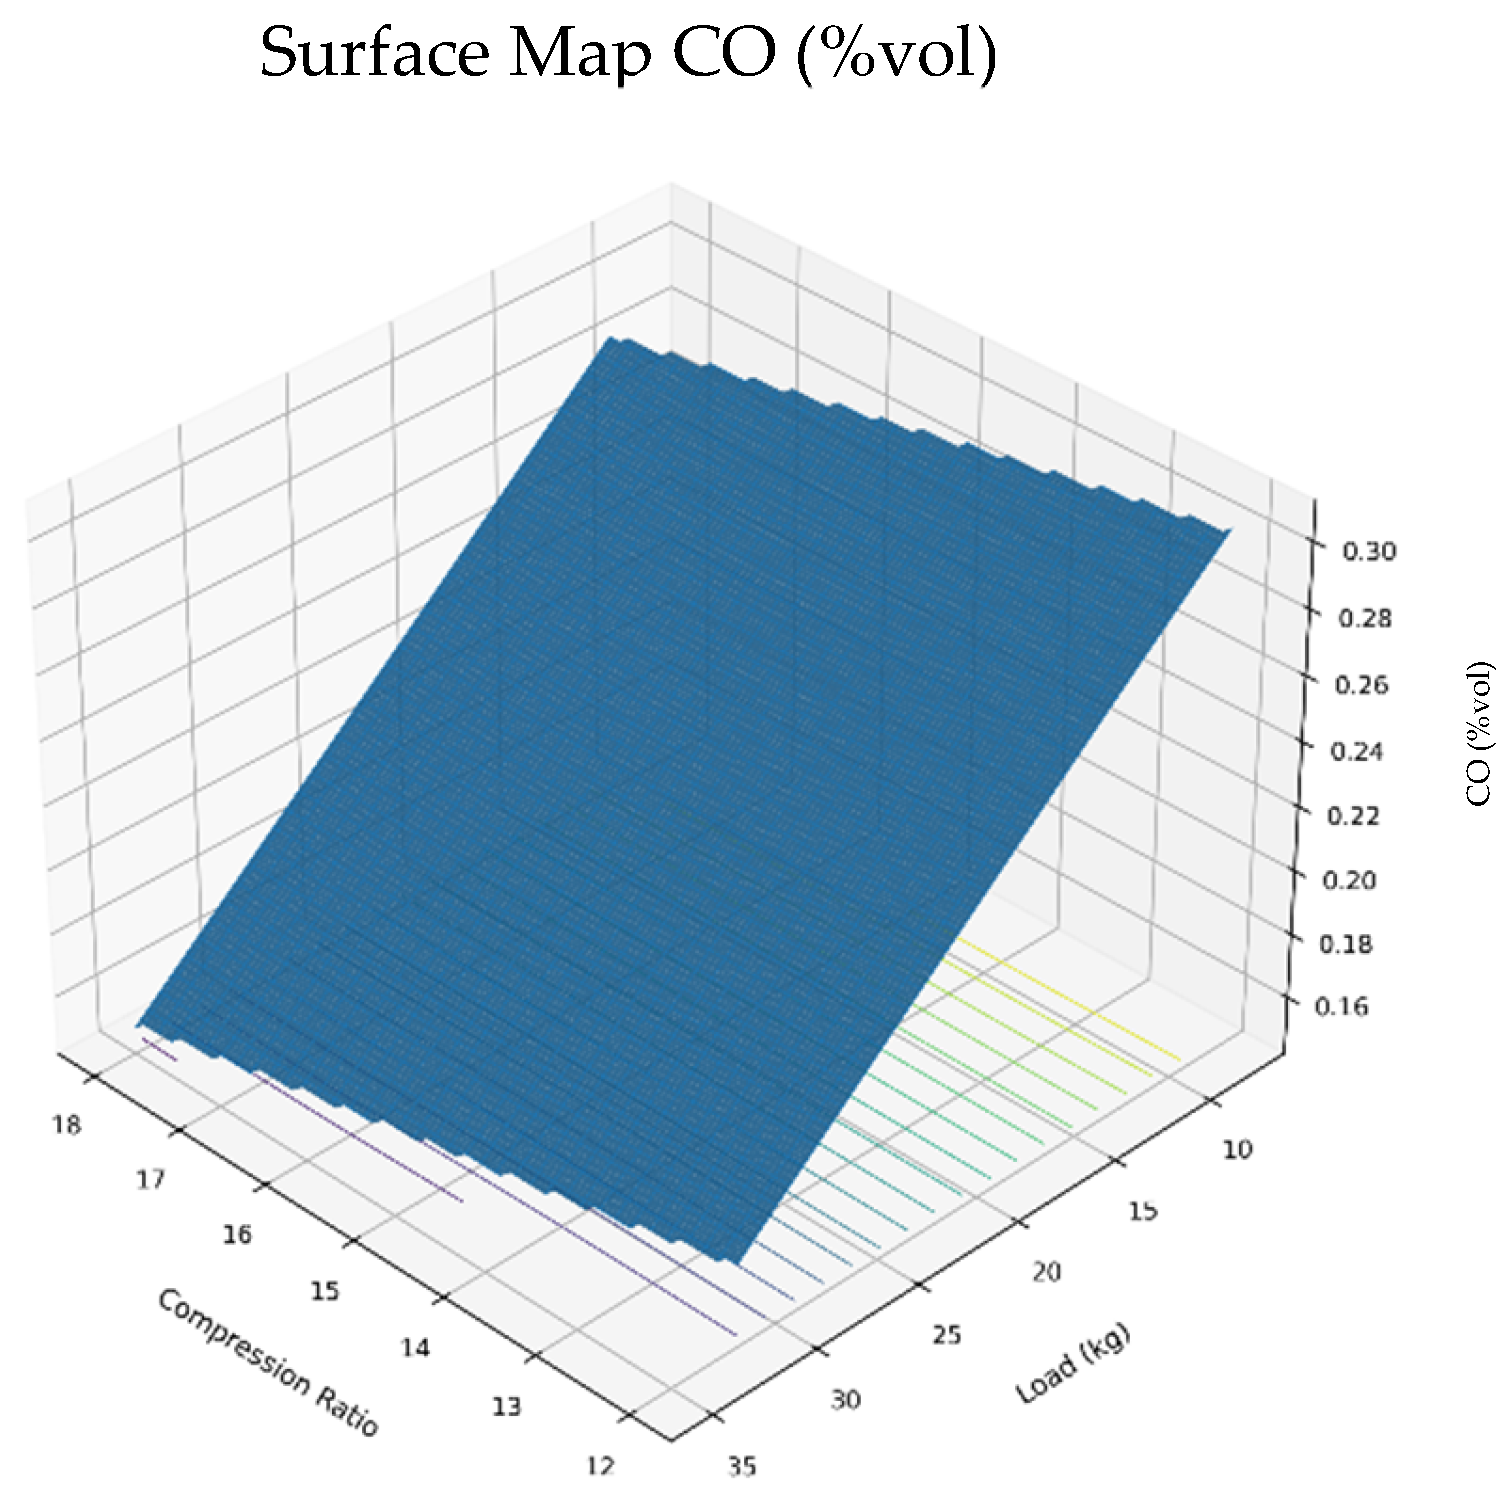
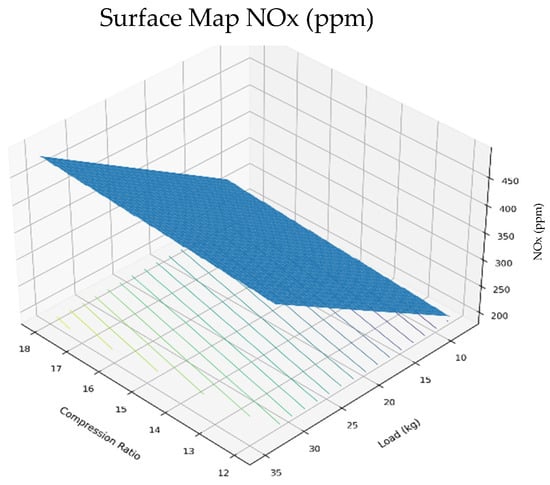
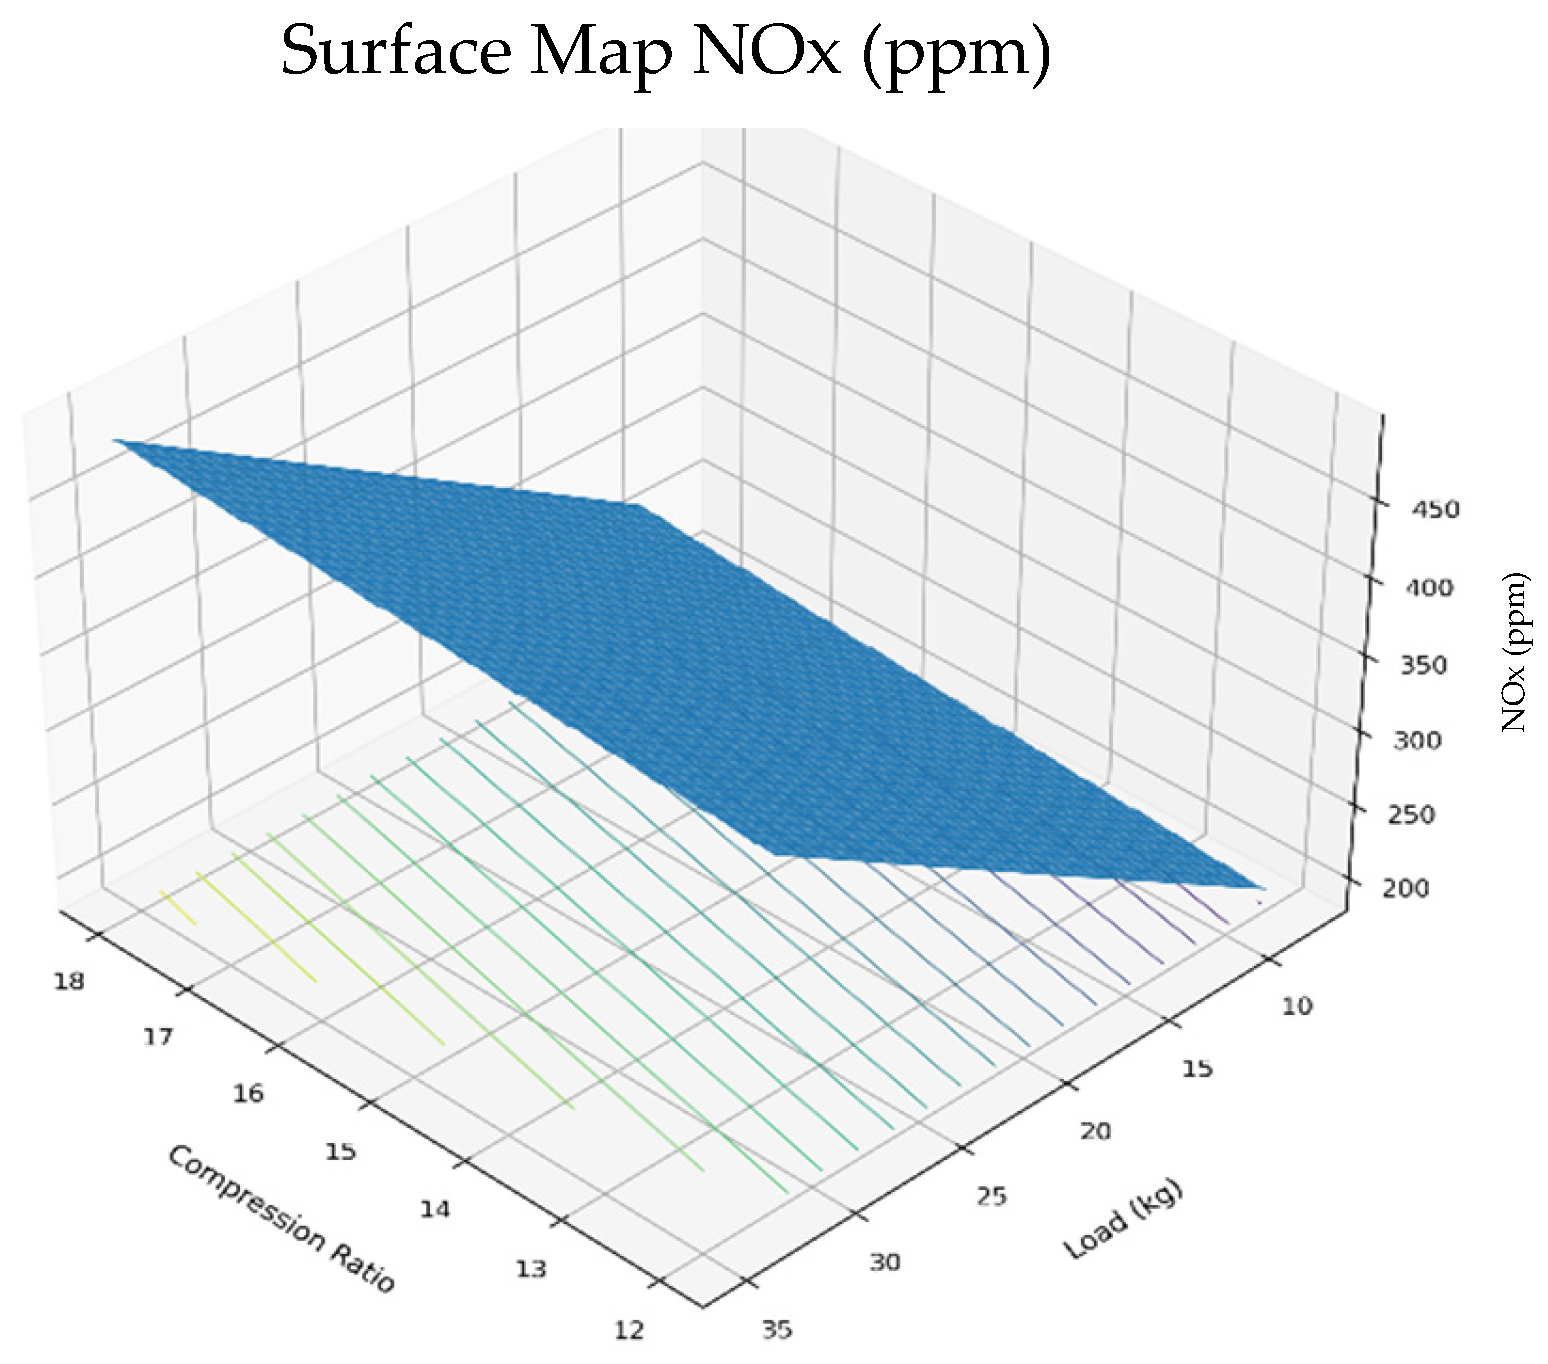
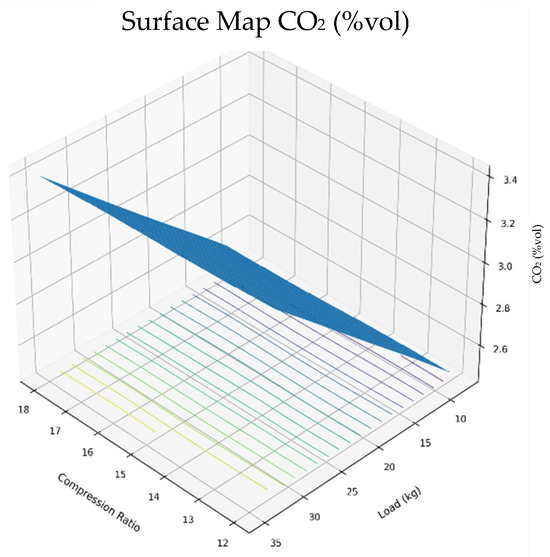
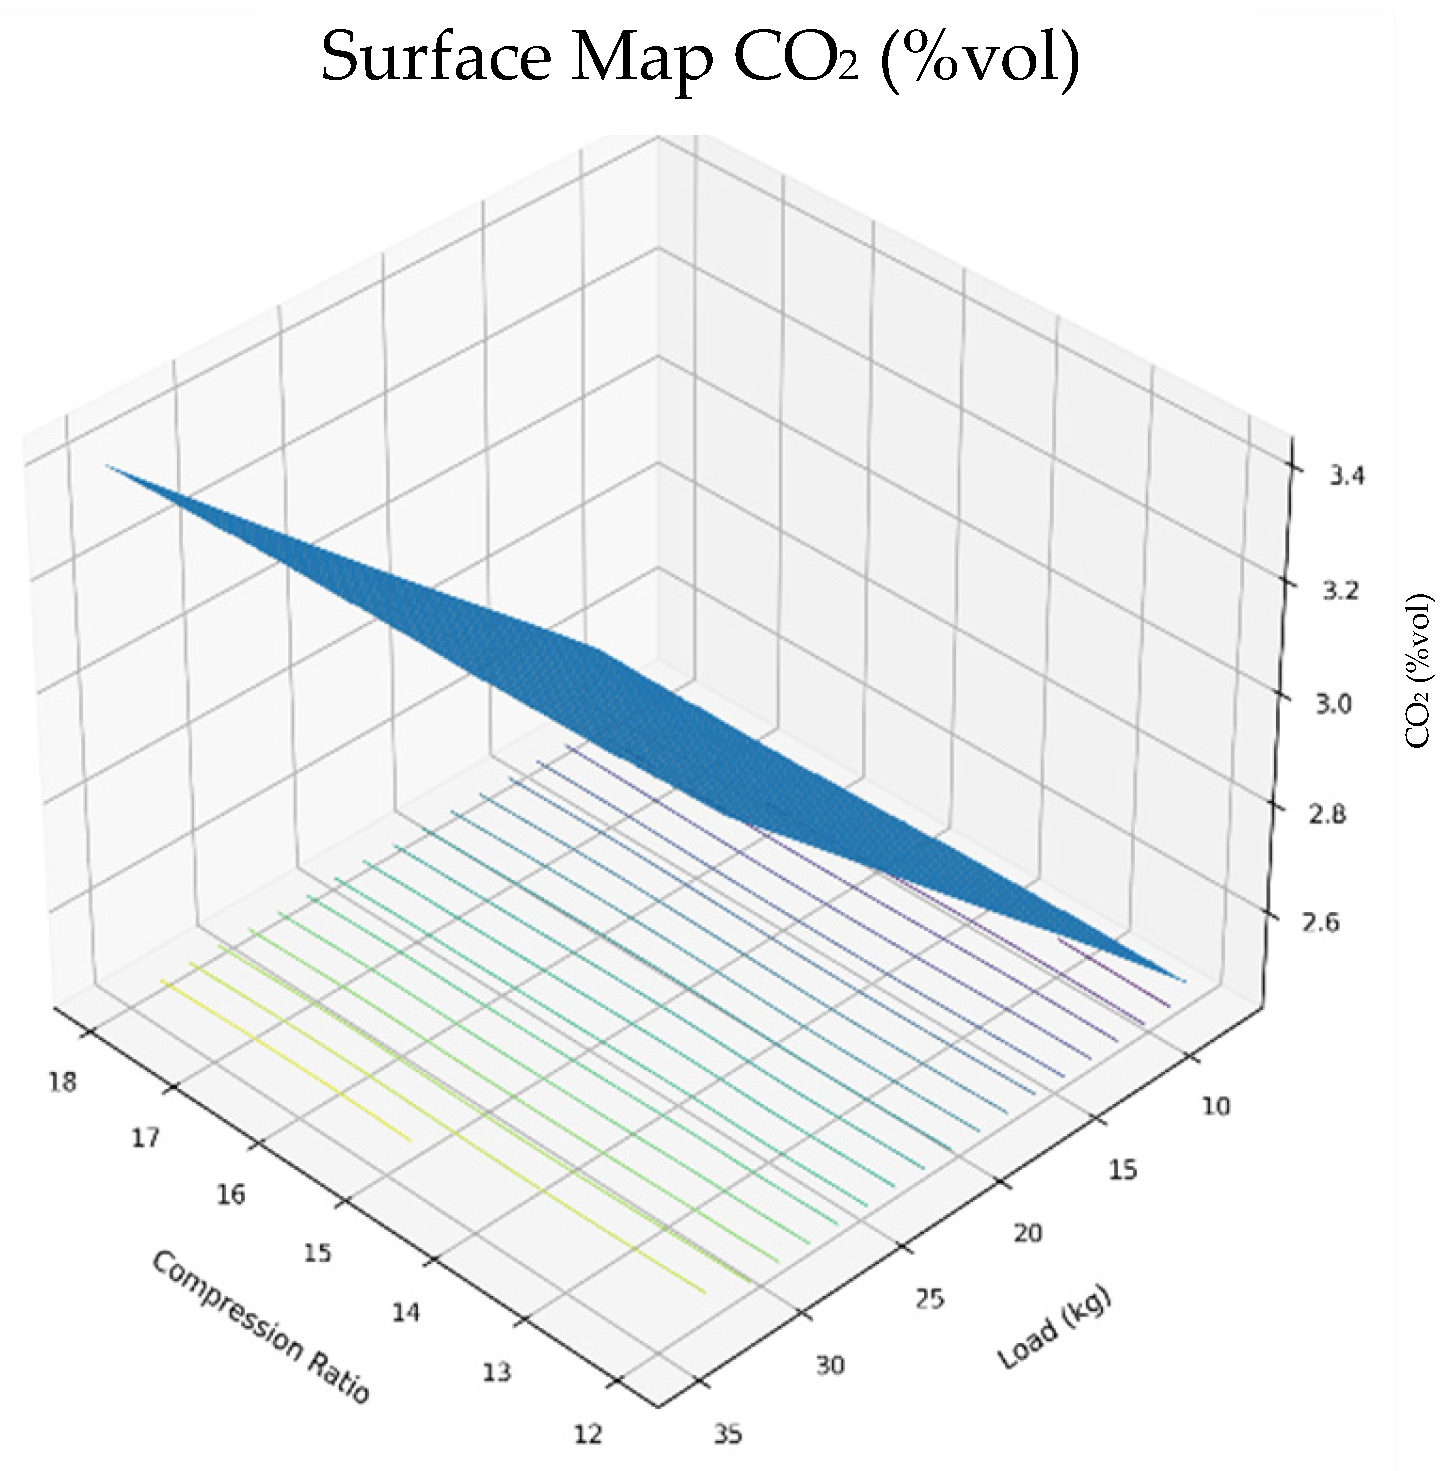

Disclaimer/Publisher’s Note: The statements, opinions and data contained in all publications are solely those of the individual author(s) and contributor(s) and not of MDPI and/or the editor(s). MDPI and/or the editor(s) disclaim responsibility for any injury to people or property resulting from any ideas, methods, instructions or products referred to in the content. |
© 2026 by the authors. Licensee MDPI, Basel, Switzerland. This article is an open access article distributed under the terms and conditions of the Creative Commons Attribution (CC BY) license.