Article

An Analytical Solution Model and Heat Exchange Performance Analysis for a Ground Heat Exchanger Integrated into Tunnel Lining


1
School of Environmental and Municipal Engineering, Qingdao University of Technology, Qingdao 266520, China
2
Key Laboratory of Geological Safety of Coastal Urban Underground Space, Ministry of Natural Resources, Qingdao 266101, China
*
Authors to whom correspondence should be addressed.
Clean Technol. 2026, 8(3), 75; https://doi.org/10.3390/cleantechnol8030075
Submission received: 11 March 2026 / Revised: 21 April 2026 / Accepted: 24 April 2026 / Published: 9 May 2026

Abstract

Compared with previous analytical models that mostly neglect air–lining coupled heat transfer, the proposed model innovatively introduces this mechanism and achieves a maximum error reduction of 0.5% against experimental data. The analytical solution of the model is obtained by using the Green’s function method. The reliability and accuracy of this model are confirmed through comparisons with existing experimental data. Research indicates that adjusting the tunnel air temperature improves the ground heat exchanger’s heat exchange efficiency more significantly than modifying the thermal conductivity of the lining. In the tested range, as the flow velocity increases, its influence on the heat transfer effect gradually weakens. The simulation results indicate that under summer operating conditions, only approximately 5–8% of the heat transferred by the ground heat exchanger is dissipated to the tunnel air-side environment, while the vast majority (92–95%) is conducted to the surrounding rock.

1. Introduction

With the sustained and stable development of the economy, human demand for energy has been on the rise. Against this backdrop, traditional energy sources such as coal, oil, and natural gas are gradually facing a situation where they cannot fully meet global energy demand [1]. In addition, these traditional energy sources often produce a large amount of carbon dioxide, sulfide, and other pollutants during use, which cause serious damage to the environment, including global warming, acid rain, and other problems [2]. As a result, there is an urgent need to find new energy sources to replace traditional ones. Geothermal energy, as a renewable energy source with large reserves and wide distribution, has attracted increasing attention and utilization in recent years because of its stable, reliable, green, and low-carbon characteristics [3]. The ground source heat pump (GSHP) system is widely used to achieve efficient utilization of geothermal energy in building cooling and heating. The GSHP system primarily consists of three key components: the ground heat exchanger, the central heat pump unit, and the user-side distribution system [4]. Furthermore, the literature indicates that heat transfer efficiency within the ground heat exchanger is widely regarded to influence the overall performance of GSHP [5]. The main ways for the ground heat exchanger of the conventional ground source heat pump to be embedded in the soil are vertical embedding [6] and horizontal embedding [7]. However, both methods require considerable additional construction work, such as drilling and excavation [8]. If the ground heat exchanger of the GSHP is combined with underground buildings to form an underground energy structure, this combination can reduce the need for extensive construction work and investment. Deep foundations, foundation piles, underground continuous walls, shallow foundations, tunnel lining, etc., can be used as underground energy structures. Compared with other underground energy structures, tunnel lining has attracted more and more attention in the past few years due to its larger contact area with the surrounding rock and better heat exchange effect [9].
In 2004, amid the comprehensive upgrading and renovation work of the Lanze Tunnel in Vienna, absorber tubes were installed. Consequently, Austria marked the inception of its first thermo-active tunnel [10]. Driven by technological advancements and strengthened policies, numerous nations and regions have implemented active exploration and practical applications of this technology. These efforts aim to accelerate renewable energy development while facilitating the realization of energy efficiency targets and carbon emission reduction objectives. Energy tunnels are expected to be more widely used and promoted in the world [11].

2. Background

Currently, the focus of energy tunnels research is mainly on theoretical modeling and field experimentation. Zhang et al. [12] conducted a study on the field measurements and theoretical analysis of the Forest Farm Tunnel in Boya, Inner Mongolia. They derived the theoretical solution for the temperature field in the heating section. Ogunleye et al. [13] examined how intermittent heat extraction functions in energy tunnels under varying temperatures, deducing that such operations are more thermally efficient than continuous ones. Yu et al. [14] established a three-dimensional heat exchange model through numerical simulation analysis, determining an optimal fluid velocity range of 0.04 m/s–0.06 m/s for the heat exchange pipes. Barrow et al. [15] conducted a Laplace transform-based investigation of tunnel heat transfer processes under sinusoidal air temperature variations, deriving the corresponding temperature distribution in the surrounding rock mass. Through analytical modeling, Sun et al. [16] implemented a capillary heat exchanger system and obtained closed-form solutions for the surrounding rock temperature field using the Green’s function method combined with the superposition principle, with experimental validation confirming the model’s reliability. Accounting for special geological conditions in permafrost zones, Lai et al. [17] streamlined heat conduction formulations for cylindrical subterranean structures. By employing dimensionless analysis combined with perturbation-based computational methodologies, they derived the mathematical solution for heat transfer in circular tunnels. Subsequently, Yuan et al. [18] developed a thermomechanical framework to compute spatiotemporal temperature distributions within rock masses surrounding underground passages, explicitly incorporating soil hydro-thermal phase transitions prevalent in arctic environments. Zhao [19] investigated the integration of capillary tube networks as an alternative to conventional ground heat exchangers within subway environmental control systems through numerical simulation. Under winter conditions, the air within the tunnel contributed 90.9% of the thermal energy, while a nearly negligible 9.1% came from the rock. Ji et al. [20,21] examined how heat exchangers function in both circular and rectangular tunnels in standard design scenarios, developed a rapid forecasting model for their heat transfer efficiency, and conducted an extended simulation study.
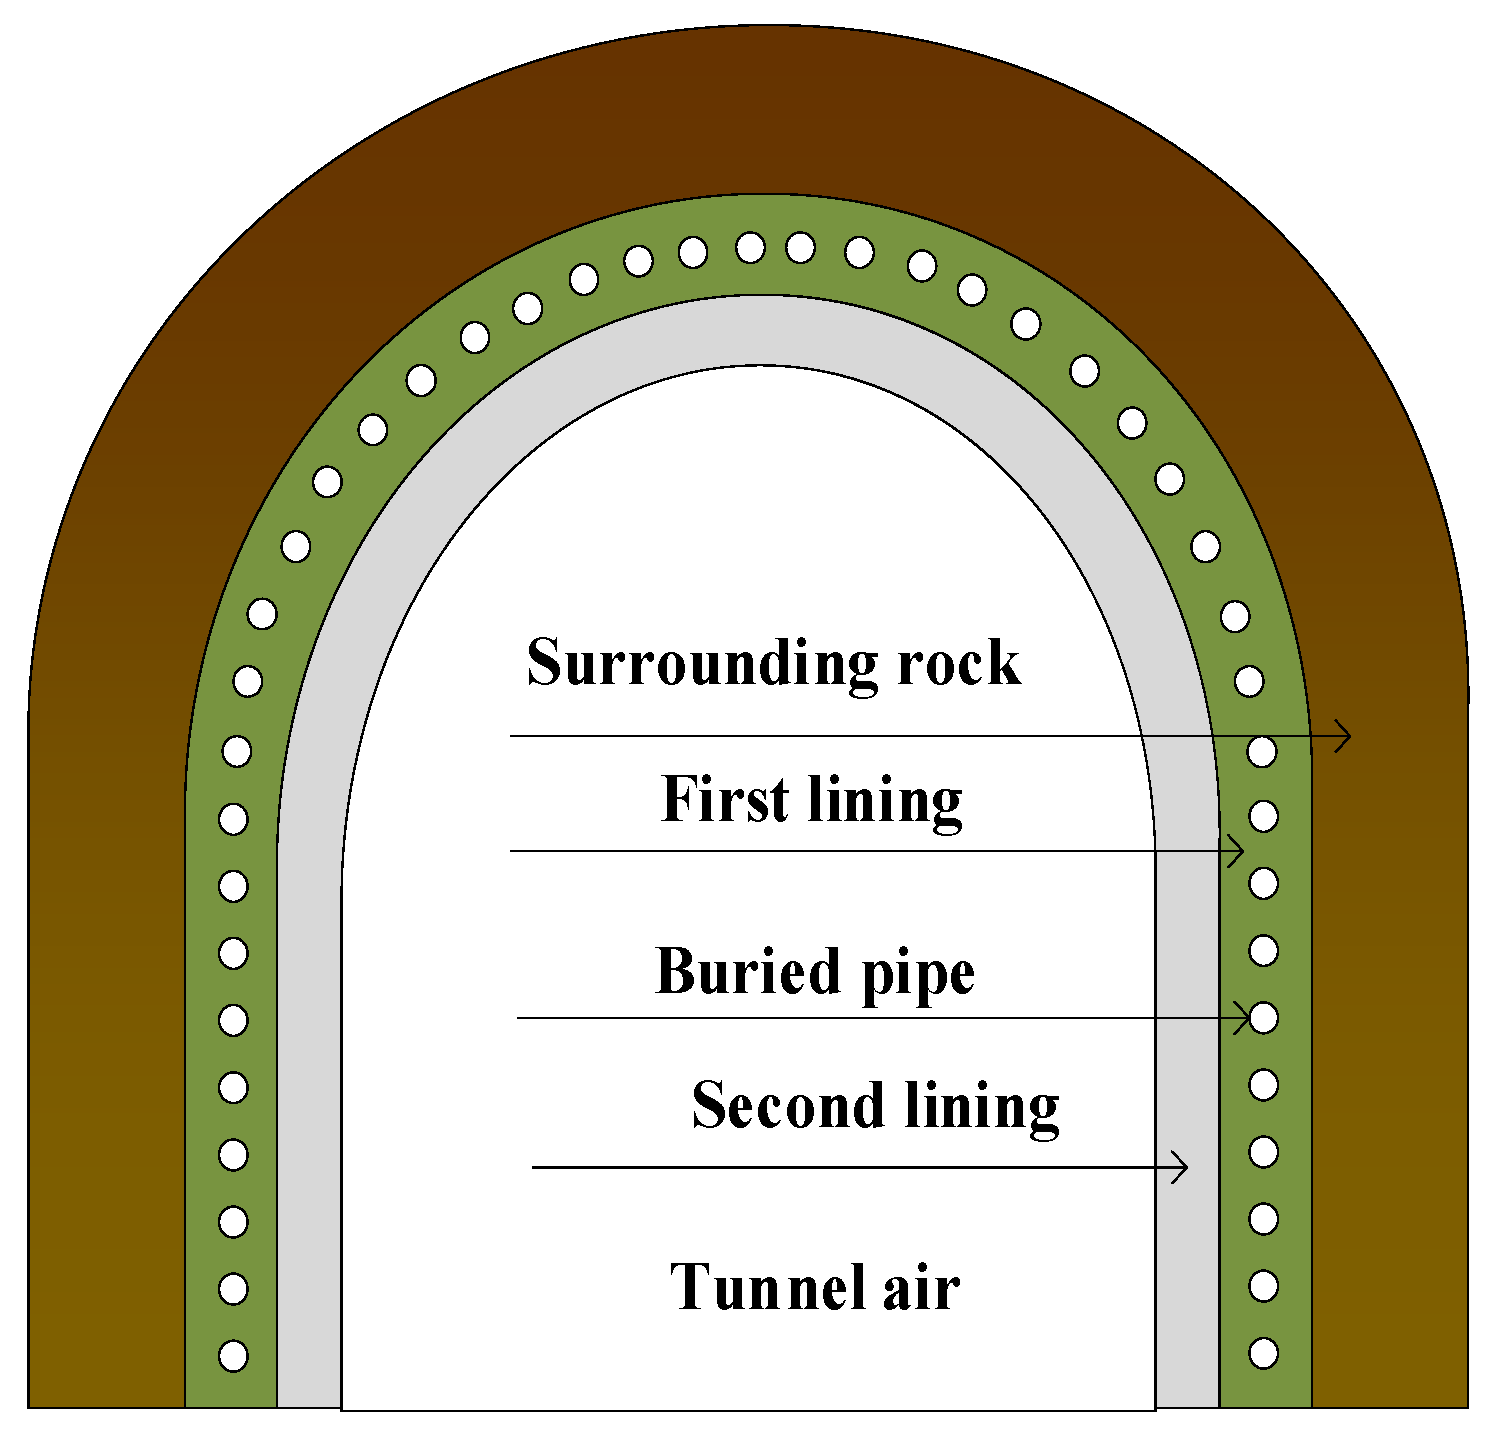
The preceding investigation substantiates the requirement for developing both numerical solution models and analytical solution models to comprehensively characterize the thermal performance of energy tunnel systems. Within this context, the analytical solution models have attracted considerable academic attention due to their clear physical meaning and computational efficiency [22]. Currently, research on energy tunnel systems primarily concentrates on simulation and experimental verification. Although a few studies have delved into the analytical solution models of energy tunnels, previous models have neglected the impact of air convection heat transfer on energy tunnels. Given this situation, this paper establishes a heat transfer model for energy tunnels under the Boundary Condition of the Third Type, taking into account the influence of air convection heat transfer. Current engineering practice predominantly places the ground heat exchanger within energy tunnels at the interface between the first lining and the secondary lining, as illustrated in Figure 1. Thus, two heat transfer paths exist in the heat transfer directions. The first is the heat transfer between the ground heat exchanger and the surrounding rock, and the second is the heat transfer between the ground heat exchanger and the tunnel air. Traditional linear heat sources and cylindrical heat sources are not applicable here. The current approach treats the heat transfer between the ground heat exchanger and the surrounding rock as a Neumann boundary condition, while neglecting the impact of ambient air on the heat transfer equation [22]. Drawing upon the aforementioned research findings, this study proposes a tunnel lining model with the Boundary Condition of the Third Type containing internal heat sources. The proposed model incorporates the thermal impact of air convection heat transfer on the heat conduction equations.
Although existing analytical solutions for energy tunnels have achieved good results in heat transfer simulation, most of them simplify the boundary conditions by ignoring air-to-lining convective heat transfer, leading to deviations between simulation results and actual engineering conditions. In this study, we address this limitation by explicitly introducing air–lining coupled heat transfer into the one-dimensional unsteady heat transfer model under the Boundary Condition of the Third Type and verifying the proposed model’s superiority over traditional simplified models through quantitative benchmarking.

3. Materials and Methods

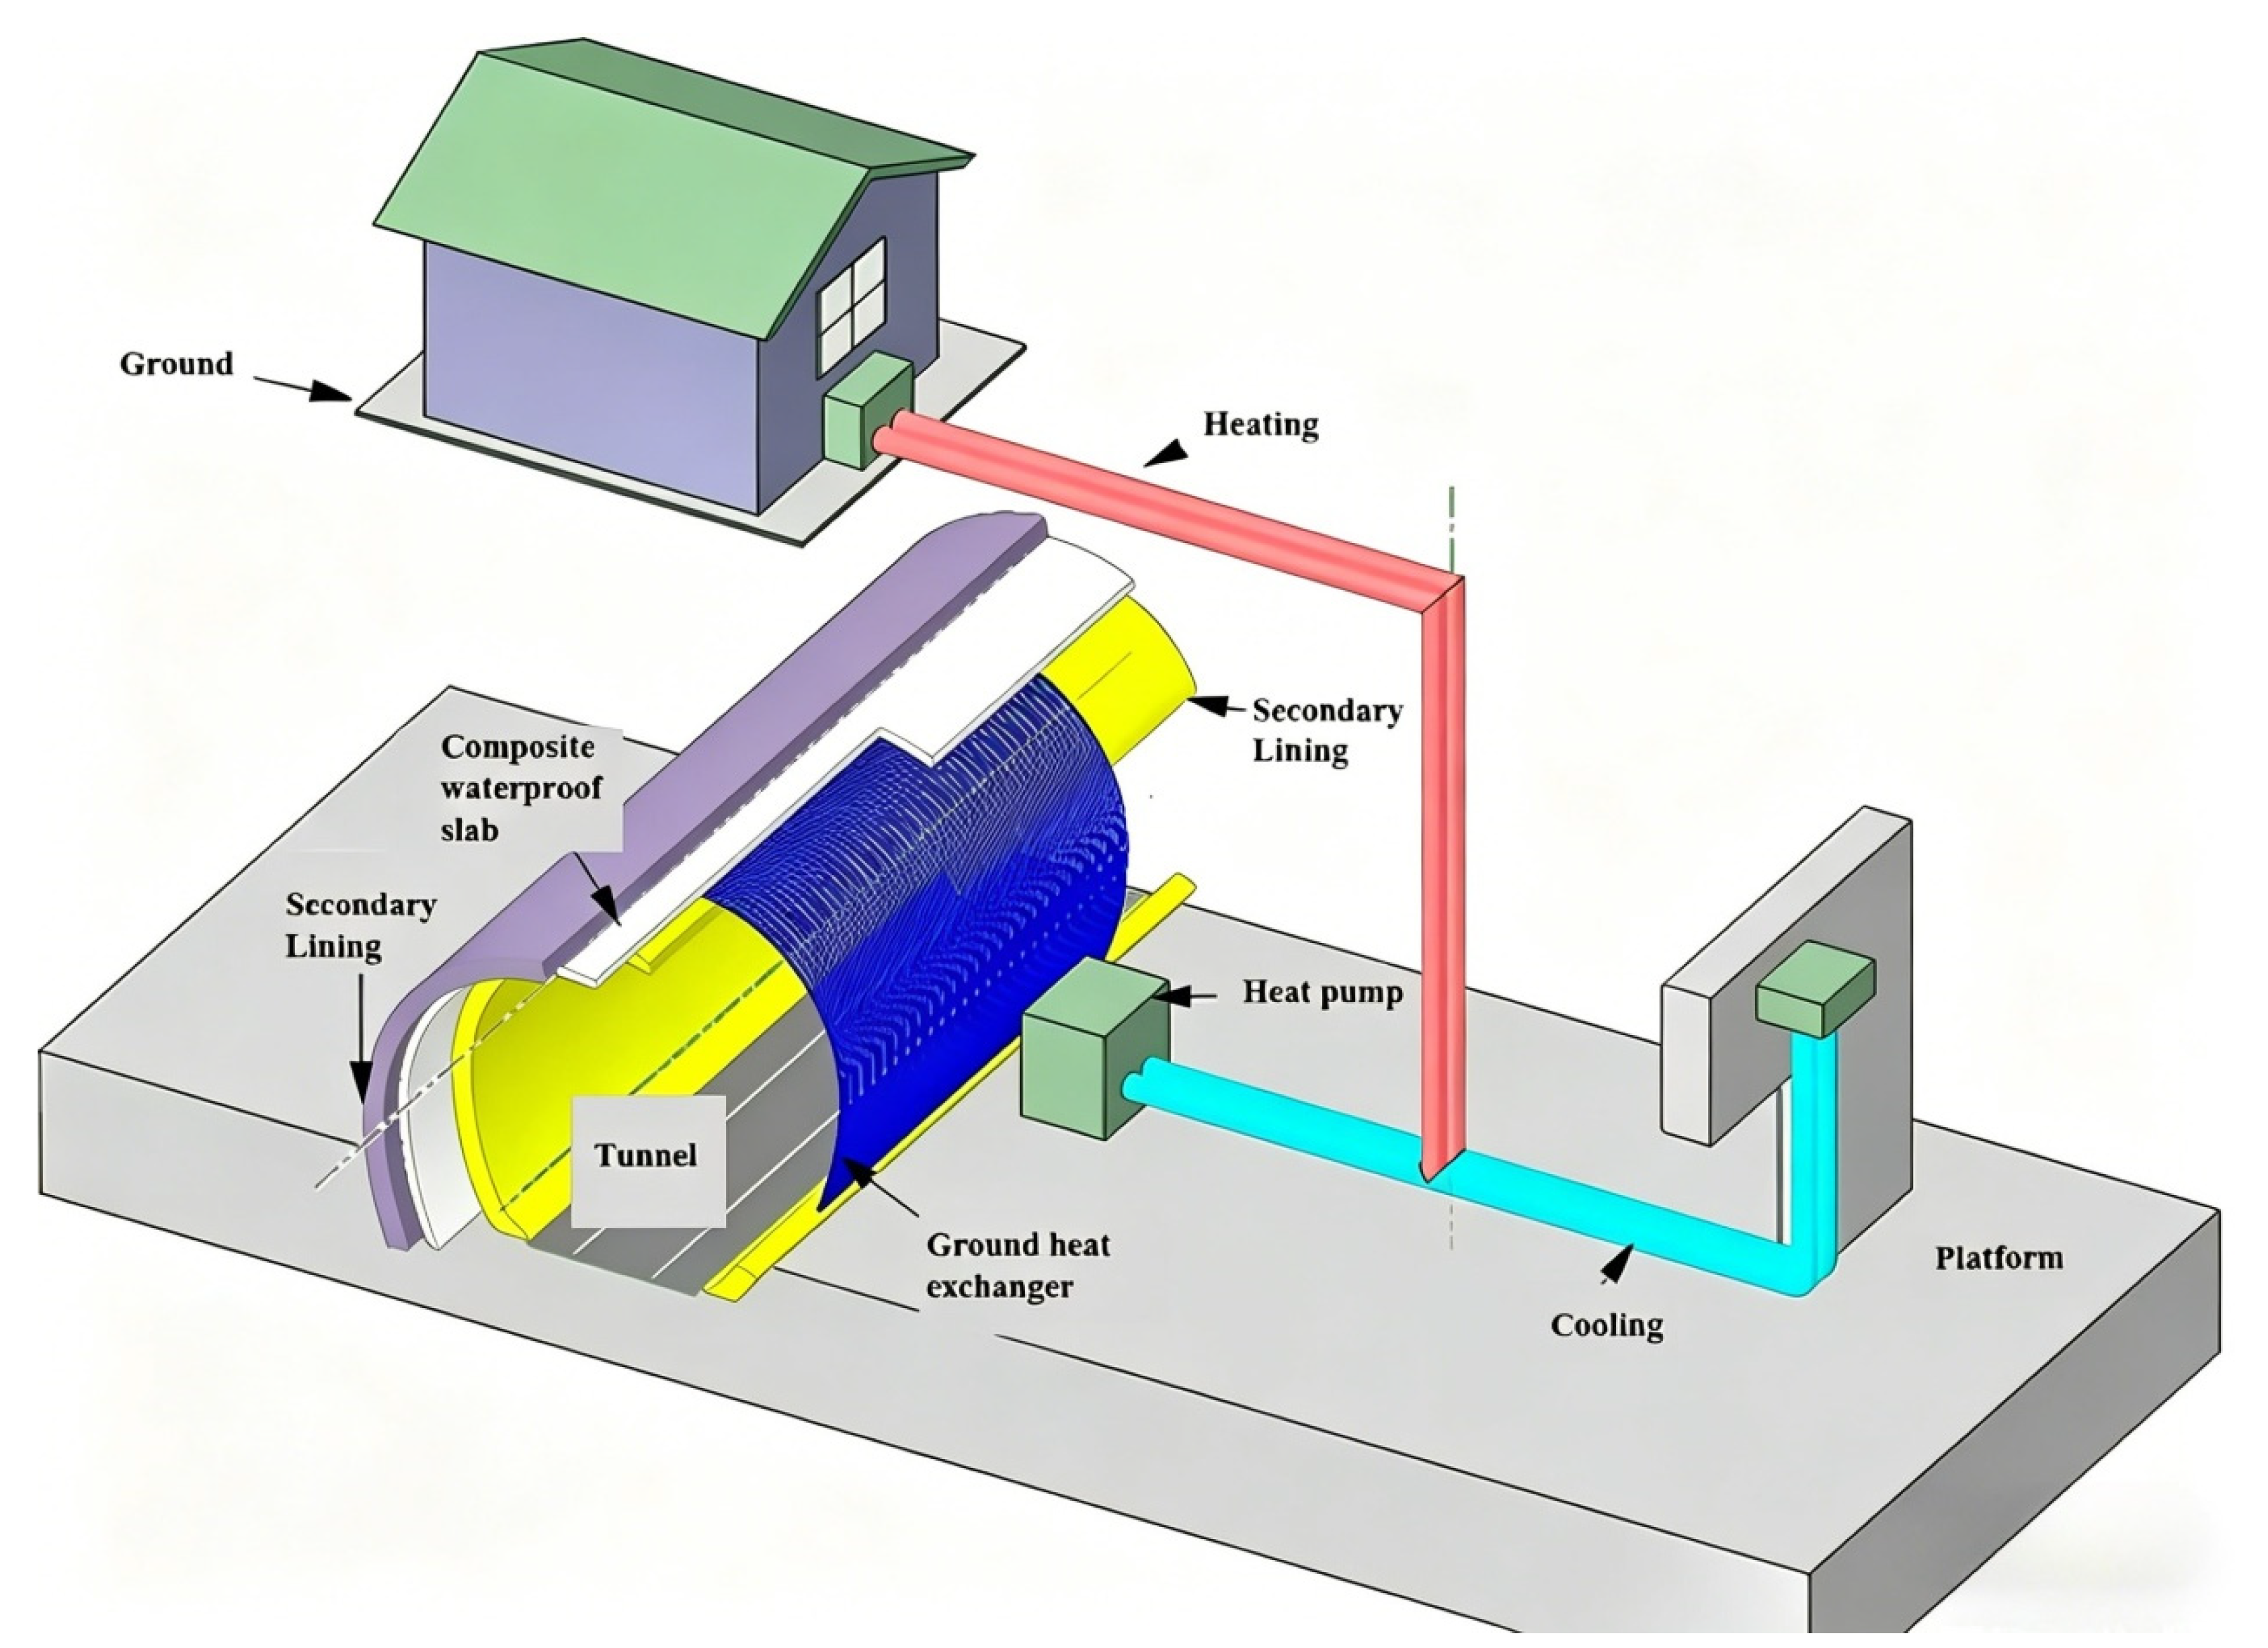
As schematized in Figure 2, the energy tunnel system mainly consists of the pipeline, the ground heat exchanger, the heat pump unit, and the building side. Within the energy tunnels, the fluid moving through the pipe takes in heat from the condenser, subsequently transferring it to the surrounding air and rock. During this process, the heat pump unit drives the heat to transfer from the end of the building to the tunnel lining. During operation, the working fluid within the piping network exchanges thermal energy with its surroundings through three heat transfer methods: convective heat transfer, thermal radiation, and heat conduction, constituting a coupled heat transfer model. The geometric shape of the tunnel section is generally an irregular horseshoe shape, which poses significant challenges to the establishment of mathematical models, and only a reasonable equivalent substitution can be used to establish mathematical models. In reference [12], the section shape of the tunnel is tested through field tests and numerical simulations. Experimental and numerical simulations confirm the viability of circular cross-sections as functional equivalents to conventional horseshoe-shaped tunnel profiles. Based on the above research, this paper adopts the tunnel’s cross-section as a circle for research on heat transfer within the tunnel.

3.1. Mathematical Model

The heat transfer process of a ground heat exchanger in tunnel lining is rather complex. Among them, two key heat transfer directions cannot be ignored, namely axial heat transfer and radial heat transfer. Considering that the actual tunnel channel is very long, ranging from several meters to more than ten kilometers, the axial heat transfer accounts for less than 1% of the total heat exchange, which is negligible and can be safely omitted. Therefore, most current studies only consider the influence of radial heat transfer on the tunnel air and surrounding rock [23,24]. The present model adopts several common simplifications widely used in tunnel heat transfer research:
(1)
The first lining is considered a part of the surrounding rock.
(2)
The various materials in the tunnel are considered to be isotropic and constant.
(3)
It is considered that the contact between each material is perfect, and the contact thermal resistance between materials is ignored.
(4)
The initial temperature field of the tunnel remains consistent everywhere.
(5)
In the research process, the influence exerted by groundwater seepage is not taken into consideration.
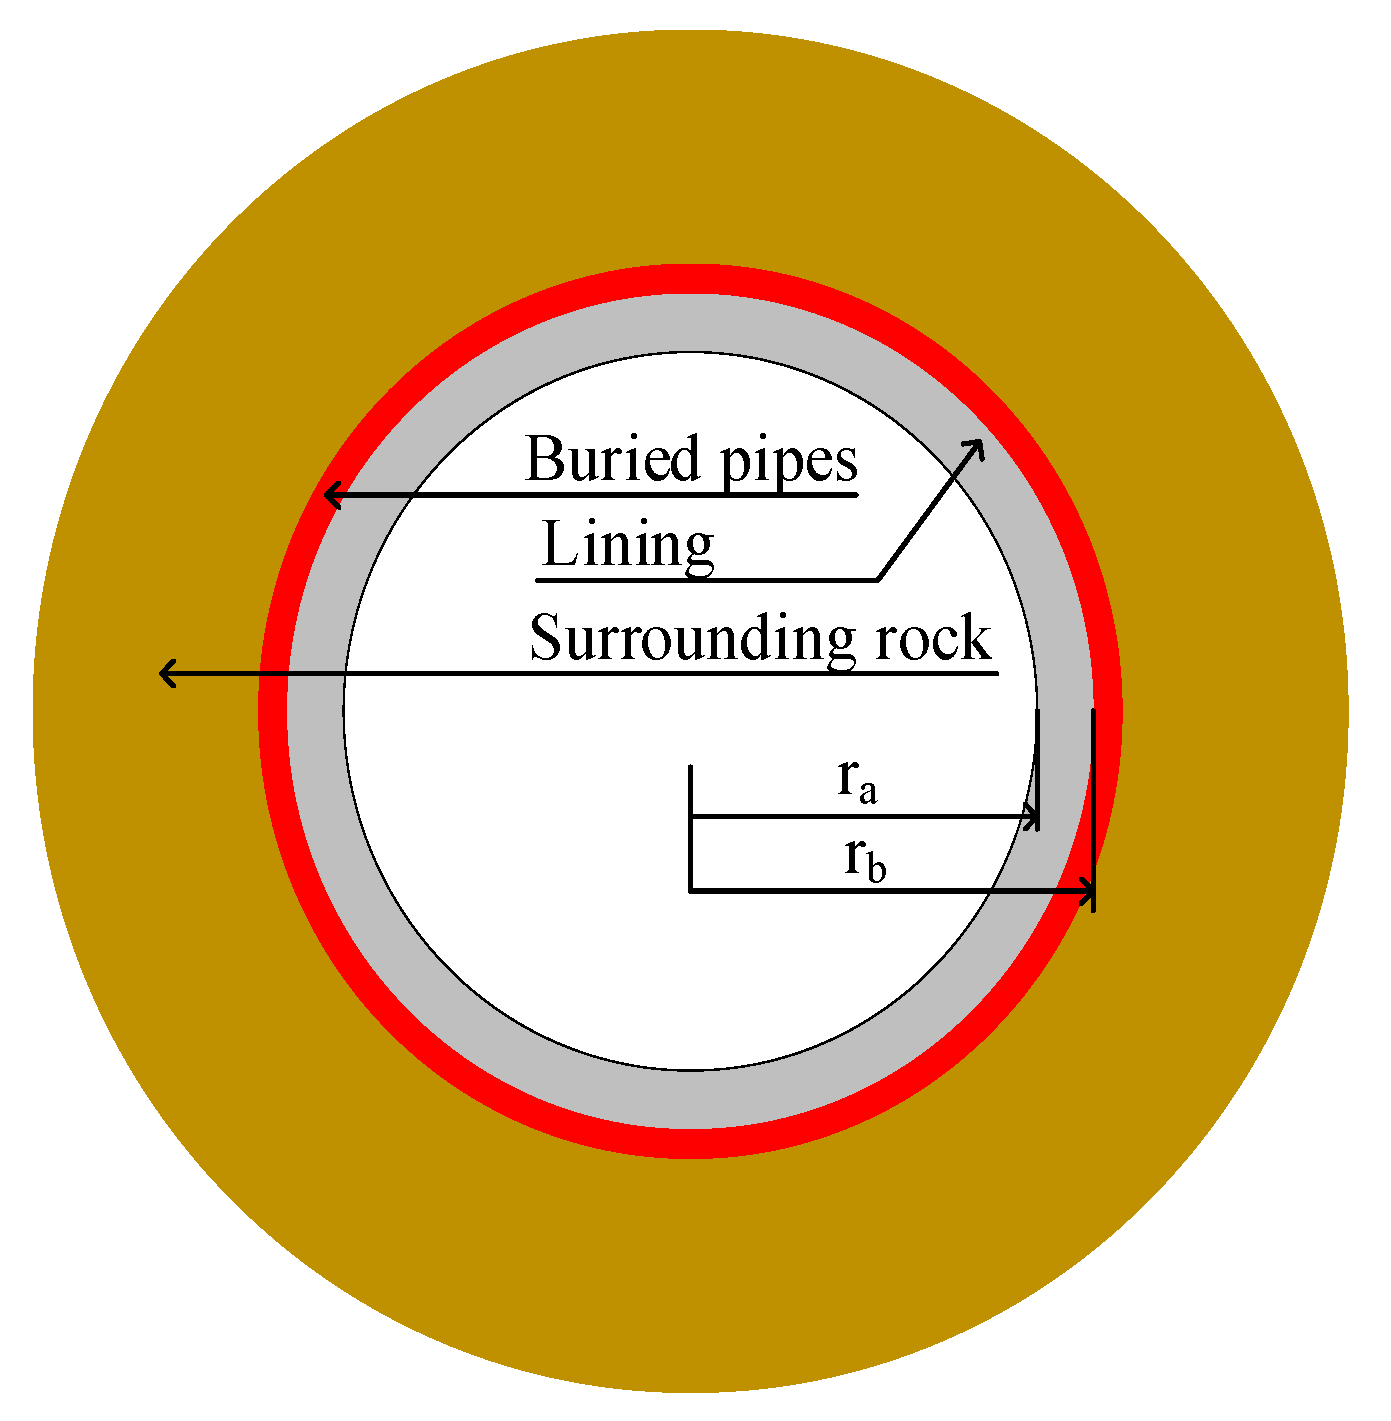
These assumptions are reasonable for deriving an analytical solution, but they also limit the scope of application. All conclusions regarding heat transfer proportions, parameter sensitivity, and optimal operation conditions are only valid under the above assumptions and modeled conditions. In the heat transfer process, the circulating fluid inside the ground heat exchanger functions as the heat transfer carrier. Since it exchanges heat with the surrounding rock in the energy tunnel, it can be regarded as the internal heat source of the energy tunnel. Considering the compact layout of the ground heat exchanger in the tunnel lining and the relatively small spacing between pipes, the heat accumulation of the ground heat exchanger within the cylindrical surface area defined by its radius is approximately treated as a surface heat source for analytical and computational simplicity. In addition, to comprehensively consider the impact of air convective heat transfer on the energy tunnel, the convective heat transfer between the air and the ground heat exchanger is defined as the boundary condition of the heat transfer equation, thereby ensuring the accuracy and reliability of the thermal performance assessment of the ground heat exchanger. This model can be characterized as a heat conduction issue involving a hollow cylindrical structure that contains an internal heat source under the Boundary Condition of the Third Type under one-dimensional conditions, as shown in Figure 3. In this study, the Boundary Condition of the Third Type is adopted to characterize the convective heat transfer between the tunnel air and the lining surface, which combines both heat conduction and convective heat transfer into a single boundary term. Physically, this boundary condition describes the heat flux exchanged at the lining–air interface as being proportional to the temperature difference between the lining surface and the tunnel air, rather than assuming a fixed temperature or a fixed heat flux. Given the aforementioned assumptions, the heat conduction equation of a hollow cylinder can be formulated as [25,26]:
T τ = a s ( 2 T r 2 + 1 r T r ) + g ρ s c s τ = 0 ,   T = T 0 r = r b ,   λ s T r = H a ( T T a ) r ,   T = T 0
where T is the temperature of the surrounding rock, °C; as is the thermal diffusivity of the surrounding rock, m2/s; ρs is the density of the surrounding rock, kg/m3; cs is the specific heat capacity of the surrounding rock, J/(kg·°C); λs is the thermal conductivity of the surrounding rock, W/(m·°C); τ is time, s; Ha is the heat transfer coefficient between the ground heat exchanger and tunnel air, and can be calculated using Equation (2), W/(m2·°C):
H a = 1 2 h a π r a + 1 2 π λ w ln r b r a + 1 2 H s π r b 2 π r b
The four key parameters included in Equation (2) are ha, ra, λw and Hs: ha is the convective heat transfer coefficient between the tunnel air and the lining surface, W/(m2·°C); ra is the internal radius of the tunnel lining, m; λw is the thermal conductivity of the tunnel lining, W/(m·°C); and Hs is the heat transfer coefficient between the ground heat exchanger and the surrounding rock, W/(m2·°C).

3.2. Determination of Green’s Function

In the heat conduction equation involving the heat source, complex boundary conditions, and initial conditions, the Green’s function method is commonly used. This method obtains the temperature change under any heat source by integral superposition [27]. The main difficulty in using the Green’s function method is determining the Green’s function for a given heat conduction problem. The determination of Green’s function is related to the form of a coordinate system, the boundary conditions, and the domain of the problem. One way to determine the Green’s function is to solve for the homogeneous form of the model above, which this paper represents as t(r,τ), for the same region:
t τ = a s ( 2 t r 2 + 1 r t r ) τ = 0 ,   t = 0 r = r b ,   λ s t r + H 1 t = 0 r ,   t = 0
The method of separating variables [28] is used to solve it, and its solution can be expressed as:
t ( r , τ ) = β = 0 ( exp ( a s β 2 τ ) ) β N ( β ) R 0 ( β , r ) d β r = r b r R 0 ( β , r ) T 0 d ( r )
where β is the eigenvalue; R0(β,r) is the characteristic function; N(β) is the norm; r′ represents the Sturm–Liouville weight function. According to reference [28], we have:
R 0 ( β , r ) = J 0 ( β r ) β Y 1 ( β r b ) H 1 λ s Y 0 ( β r b ) Y 0 ( β r ) β J 1 ( β r b ) H 1 λ s J 0 ( β r b )
N ( β ) = β J 1 ( β r b ) H 1 λ s J 0 ( β r b ) 2   + β Y 1 ( β r b ) H 1 λ s Y 0 ( β r b ) 2
where J0(βr) is the Bessel function of the first kind of order zero; J1(βrb) is the Bessel function of the first kind of first order; Y0(βr) is the Bessel function of the second kind of order zero; Y1(βrb) is the Bessel function of the second kind of first order. Equation (7) is obtained by changing the order of integration in Equation (4):
t ( r , τ ) = r = r b r ( β = 0 ( exp ( a s β 2 τ ) β N ( β ) R 0 ( β , r ) R 0 ( β , r ) d β ) F ( r ) d ( r ) )
Homogeneous Equation (3) can be solved using the Green’s function and expressed as Equation (8) [29]:
t r ,   τ = r = r b r G ( r ,   t | r ,   τ ) | τ = 0 F r d ( r )
The temperature distribution t(r,τ) of Equation (3) is given by Equation (8). Compare Equations (7) and (8), and replace τ with (ττ′) to obtain the required Green’s function:
G ( r ,   t | r ,   τ ) = β = 0 ( exp ( a s β 2 ( τ τ ) β N ( β ) R 0 ( β , r )   R 0 ( β , r ) d β

3.3. The Mathematical Analytical Formula of the Surrounding Rock Temperature Distribution

The literature [29] discusses the general solution of a one-dimensional heat transfer problem with Green’s function, which can be expressed as:
T ( r ,   τ ) = r = r b r G ( r ,   τ | r ,   τ ) τ = 0 F r d ( r ) + a λ τ = 0 τ d τ r = r b r G ( r ,   τ | r ,   τ ) g ( r ,   τ ) d ( r ) + a λ τ = 0 τ d τ r = r b r G ( r ,   τ | r ,   τ ) r = r b f i r ,   τ d ( r )
The three terms on the right-hand side of Equation (10) correspond to distinct physical meanings: the first term accounts for the influence of the initial temperature distribution; the second term accounts for the influence of the distributed heat source; and the third term accounts for the influence of the non-homogeneous boundary condition [28]. In the present model, the internal heat source g(r′,τ) is idealized as a surface heat source positioned at r′ = rb. Consequently, the heat source simplifies to a time-dependent function g(r′,τ) = g(rb,τ). The non-homogeneous boundary condition fi(r,τ) reduces to H1ta. Substituting Equation (9) into Equation (10) to yield Equation (11), we have:
T ( r ,   τ ) = T 0 + a s λ s g τ τ = 0 τ ( exp ( a s β 2 τ τ ) ) d ( τ ) β = 0 r b β R 0 β ,   r R 0 ( β , r b ) N ( β ) d β + a s H a T a λ s · τ = 0 τ ( exp ( a s β 2 τ τ ) ) d τ β = 0 r b β R 0 β ,   r R 0 ( β , r b ) N ( β ) d β
where R 0 ( β ,   r b ) = J 0 ( β r b ) Y 1 ( β r b ) Y 0 ( β r b ) J 1 ( β r b ) = 2 π β r b [30]. The temperature distribution of the surrounding rock can be obtained by substituting R0(β,r) into Equation (11) and integrating:
T ( r ,   τ ) = T 0 + 2 g τ + 2 H a T a λ s π β = 0 ( exp ( a s β 2 τ ) 1 ) R 0 ( β ,   r ) β N ( β ) d β
When r = rb, the wall temperature (Tw) can be determined:
T w ( τ ) = T 0 4 g τ + 4 H a T a λ s π 2 r b β = 0 exp ( a s β 2 τ ) 1 β N ( β ) d β

3.4. Calculation of the Fluid Outlet Temperature

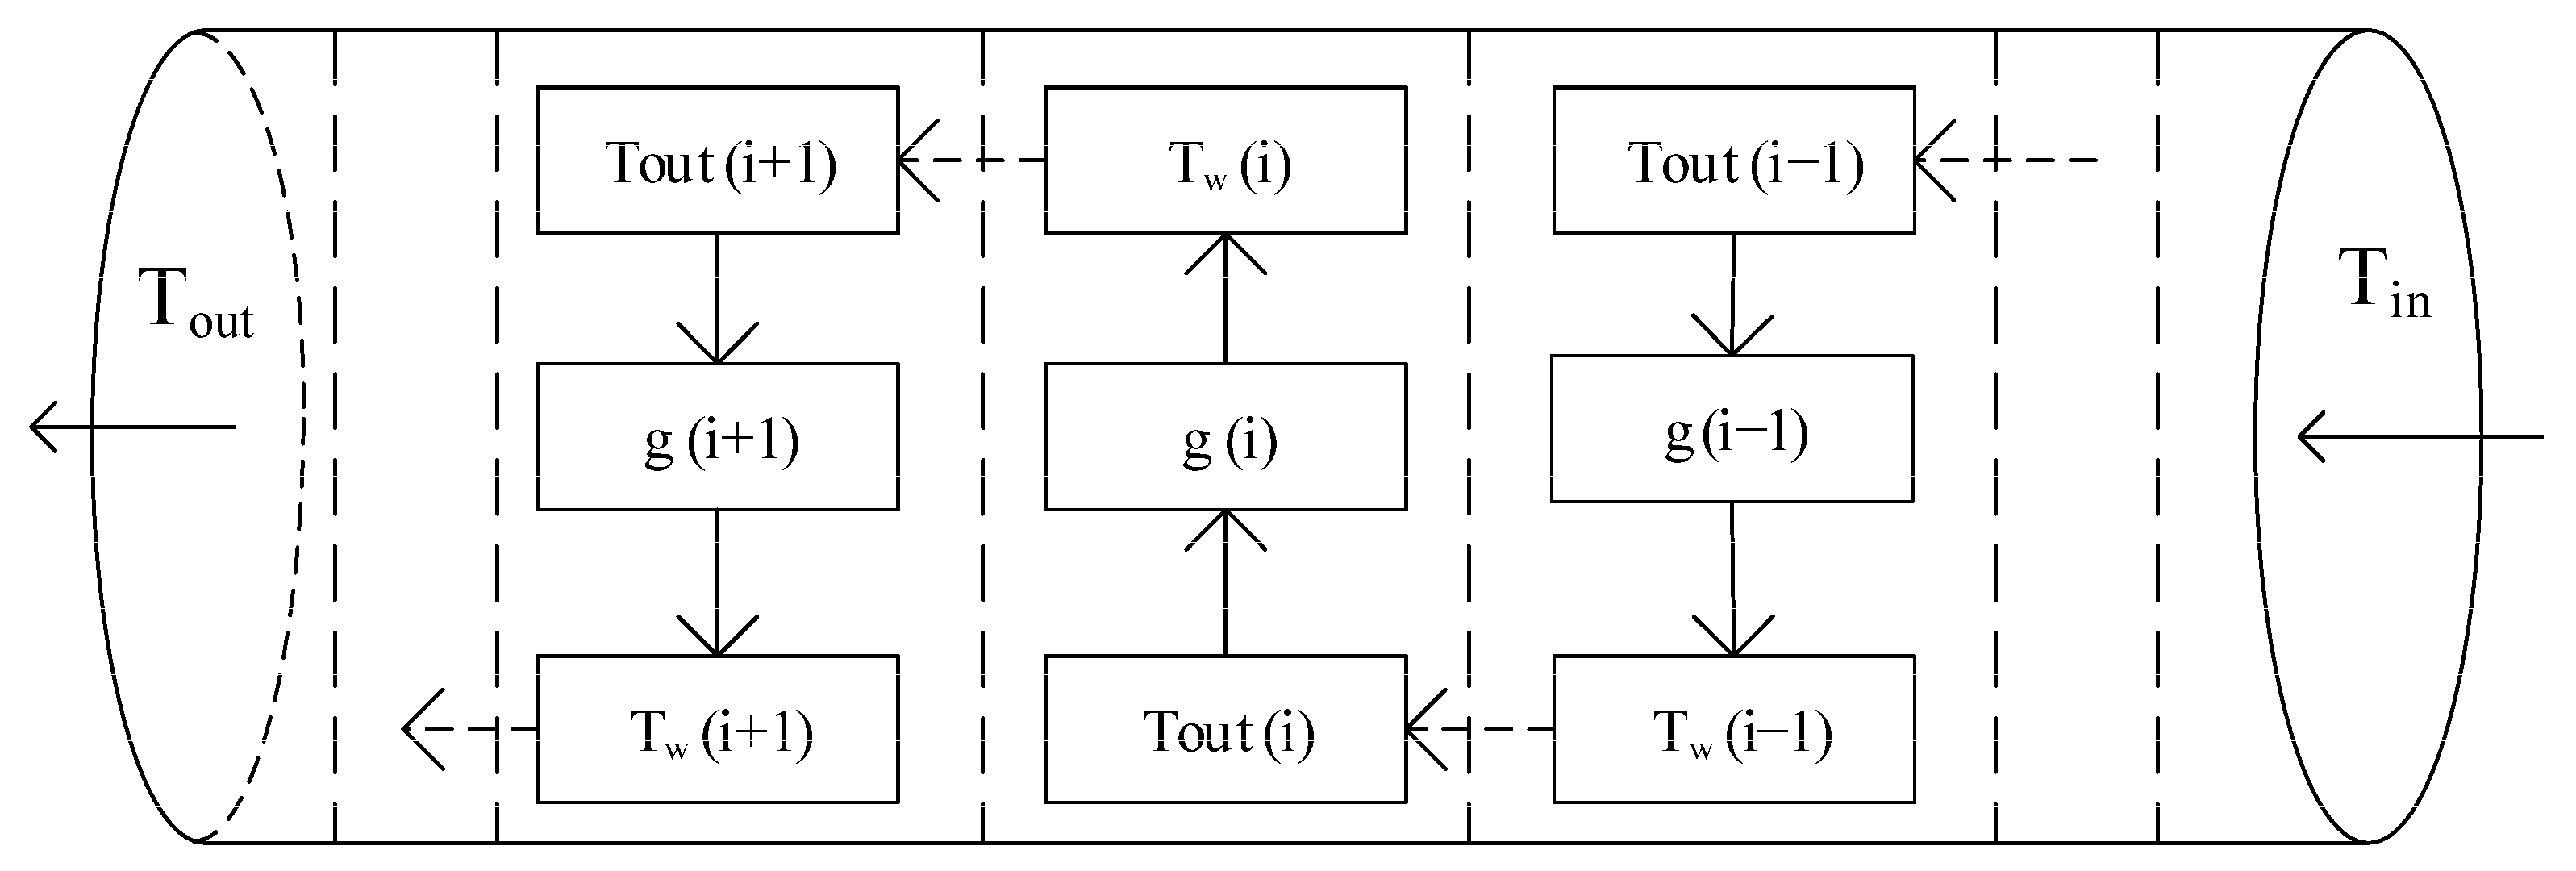
This iterative algorithm calculates the working fluid outlet temperature. The initial temperature value is substituted into Equation (14) to calculate the volumetric heat generation rate g at each time step. Tw of the time node is obtained by using Equation (15). The calculated Tw is used to determine the ground heat exchanger’s working fluid outlet temperature at the subsequent time step through Equations (16) and (17). This iterative process continues until the simulation reaches completion. The detailed computational procedure is illustrated in Figure 4:
g ( i ) = ρ f c f v s ( T i n T o u t ( i ) ) 2 π r b l
T W ( i ) = T 0 4 g i + 4 H a T a λ s π 2 r b β = 0 exp ( a s β 2 ( i ) ) 1 β N ( β ) d β
Equation (18) offers the computational formula for determining the thermal energy exchange that takes place between the ground heat exchanger and the tunnel air. Equation (19) provides the calculation formula for thermal energy exchange occurring between the ground heat exchanger and the tunnel surrounding rock:
T m = T i n + T o u t ( i + 1 ) 2
2 π r b ρ f c f v s ( T i n T o u t ( i + 1 ) ) 2 π r b l = q a + q s
q a = H a ( T m T a )
q s = H s ( T m T w ( i ) )
where ρf is the density of fluid, kg/m3; cf is the specific heat capacity of fluid, J/(kg·°C).

4. Model Verification

To ascertain the accuracy of the model, we carried out a comparative analysis using experimental data obtained from published literature. The model input parameters are the same as those of the experimental values in the literature, and detailed data are provided in Table 1.
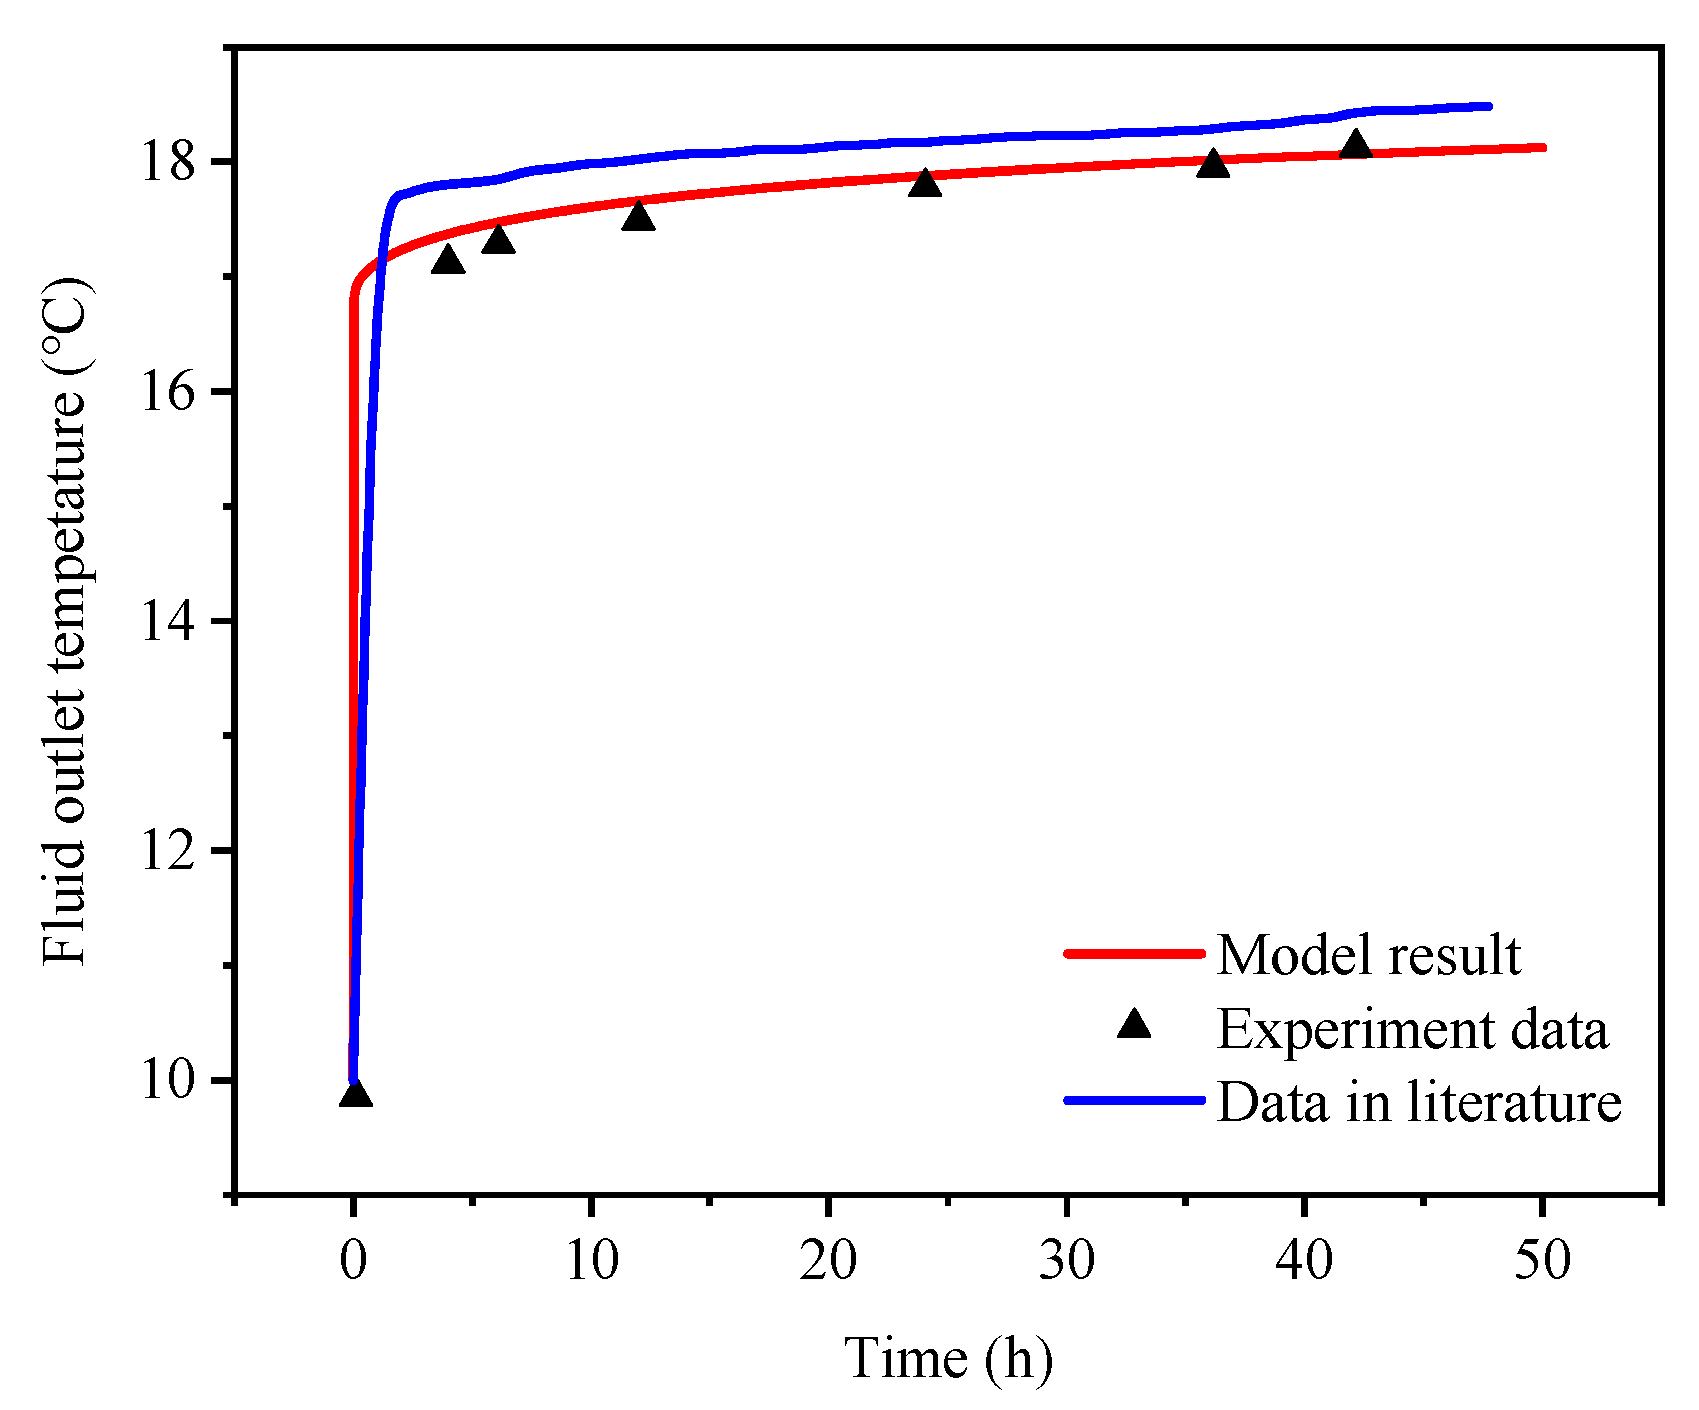
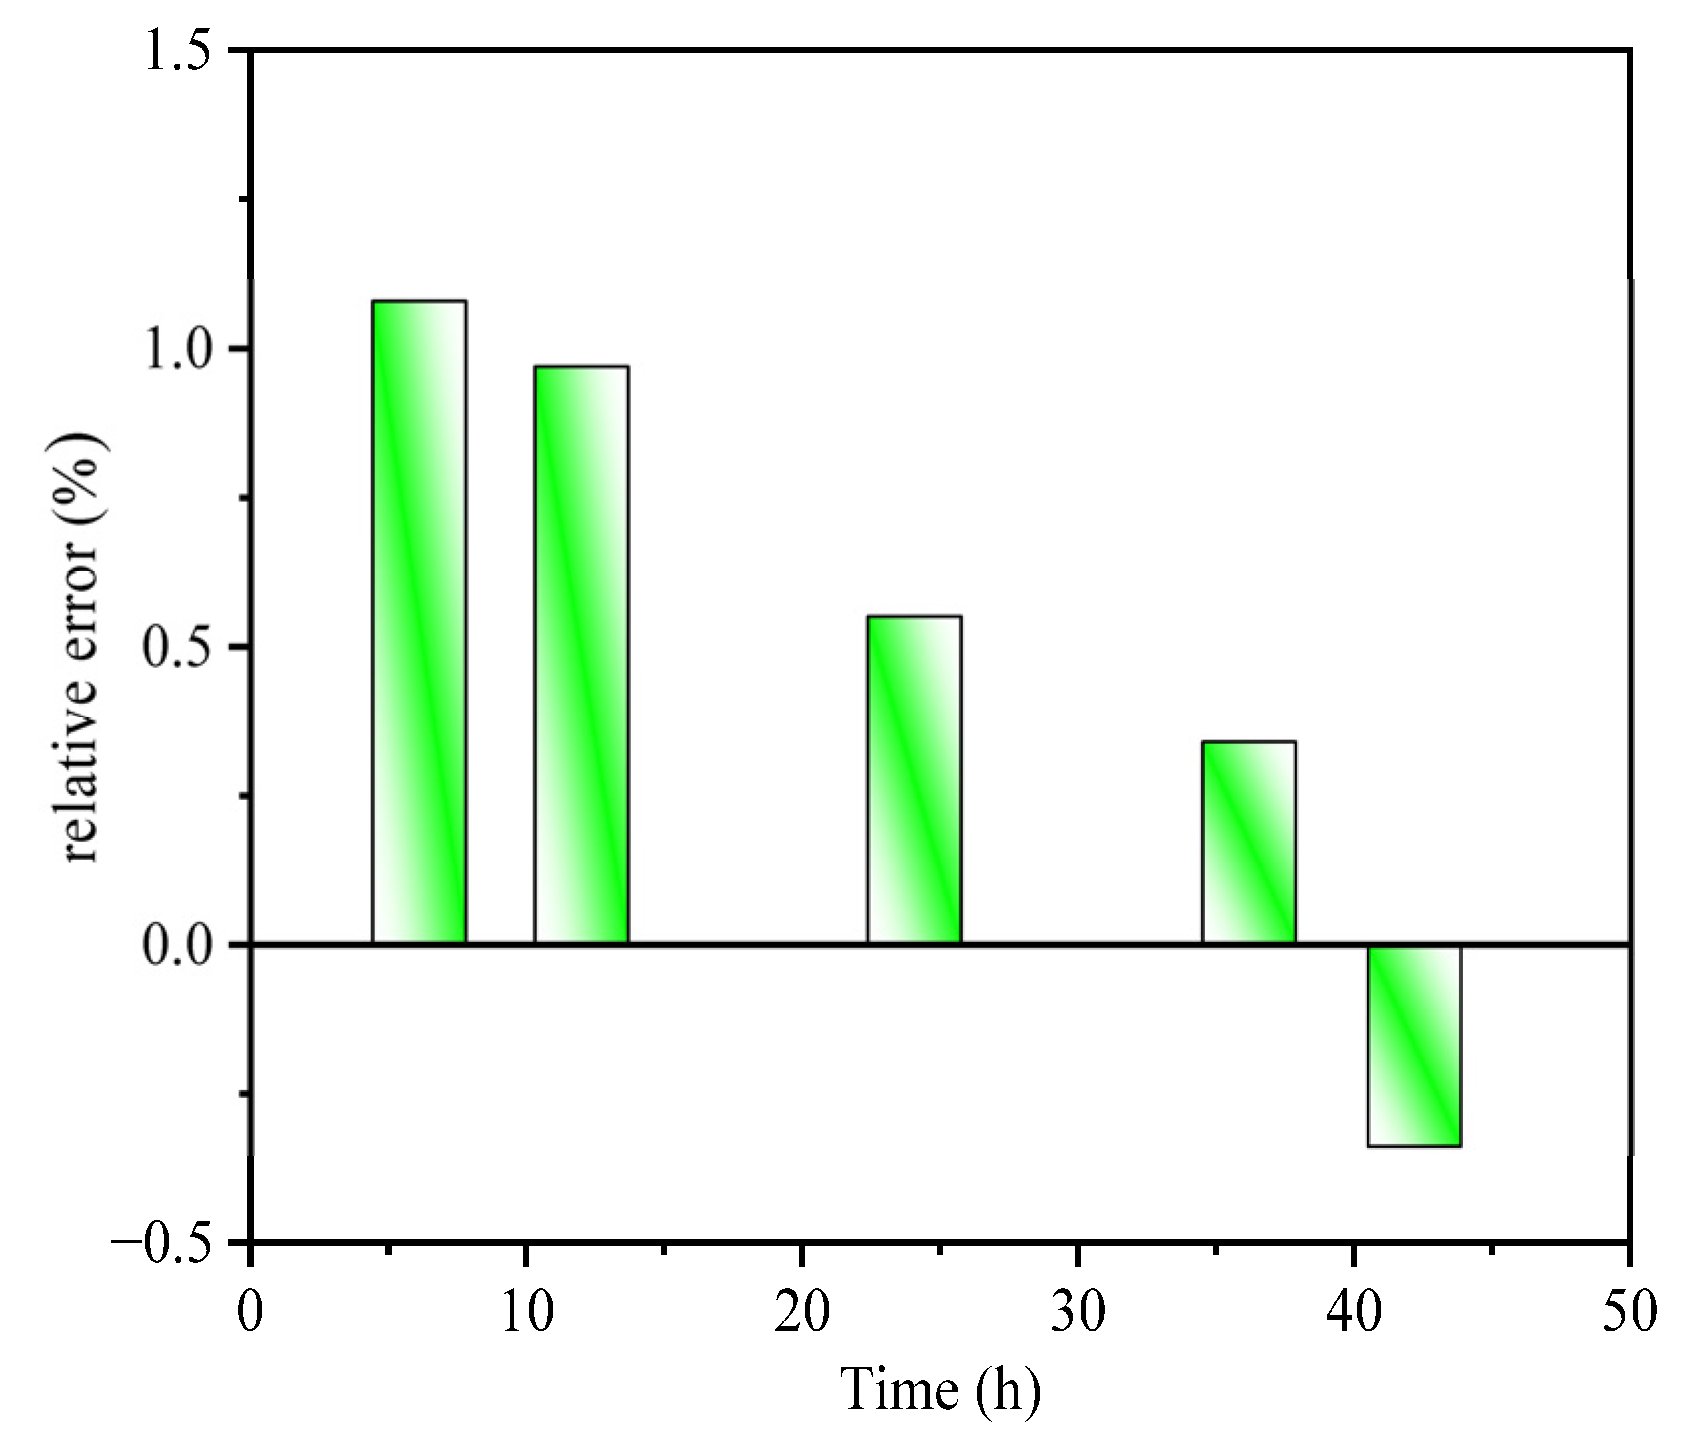
A comparison was made between the outlet fluid temperature determined by this model and both the experimental data from the literature and the simulation results from the model without considering tunnel air, in order to verify the accuracy of this model. The results of this comparison are shown in Figure 5. Compared with the model that does not take into account the air in the tunnel, this model is more in line with reality. As the computation time increases, there is a steady reduction in the discrepancy between the simulated outcomes and the actual experimental data, as shown in Figure 6. Consequently, it is concluded that this analytical model accurately depicts the transient and quasi-steady stage of heat transfer throughout a 50 h continuous cooling period.

5. Results and Discussion

The temperature differential measured between the inlet and the outlet of the ground heat exchanger directly indicates its heat transfer performance. There are numerous and complex factors influencing heat transfer performance. Among these factors, the temperature of the inlet fluid, the temperature of the tunnel air, the fluid flow rate, and the lining material’s thermal conductivity have the most significant impact on the heat transfer efficiency of the ground heat exchanger. By comparing the simulation results from this model with the experimental data, we find that compared with the existing analytical solution models in the literature, this model exhibits higher accuracy. This model significantly differs from the previous analytical solution models. Specifically, under summer conditions, the heat transfer between the tunnel air and the ground heat exchanger in this model only constitutes a small fraction of the total heat transfer.

5.1. Influence of Air Temperature in Tunnel

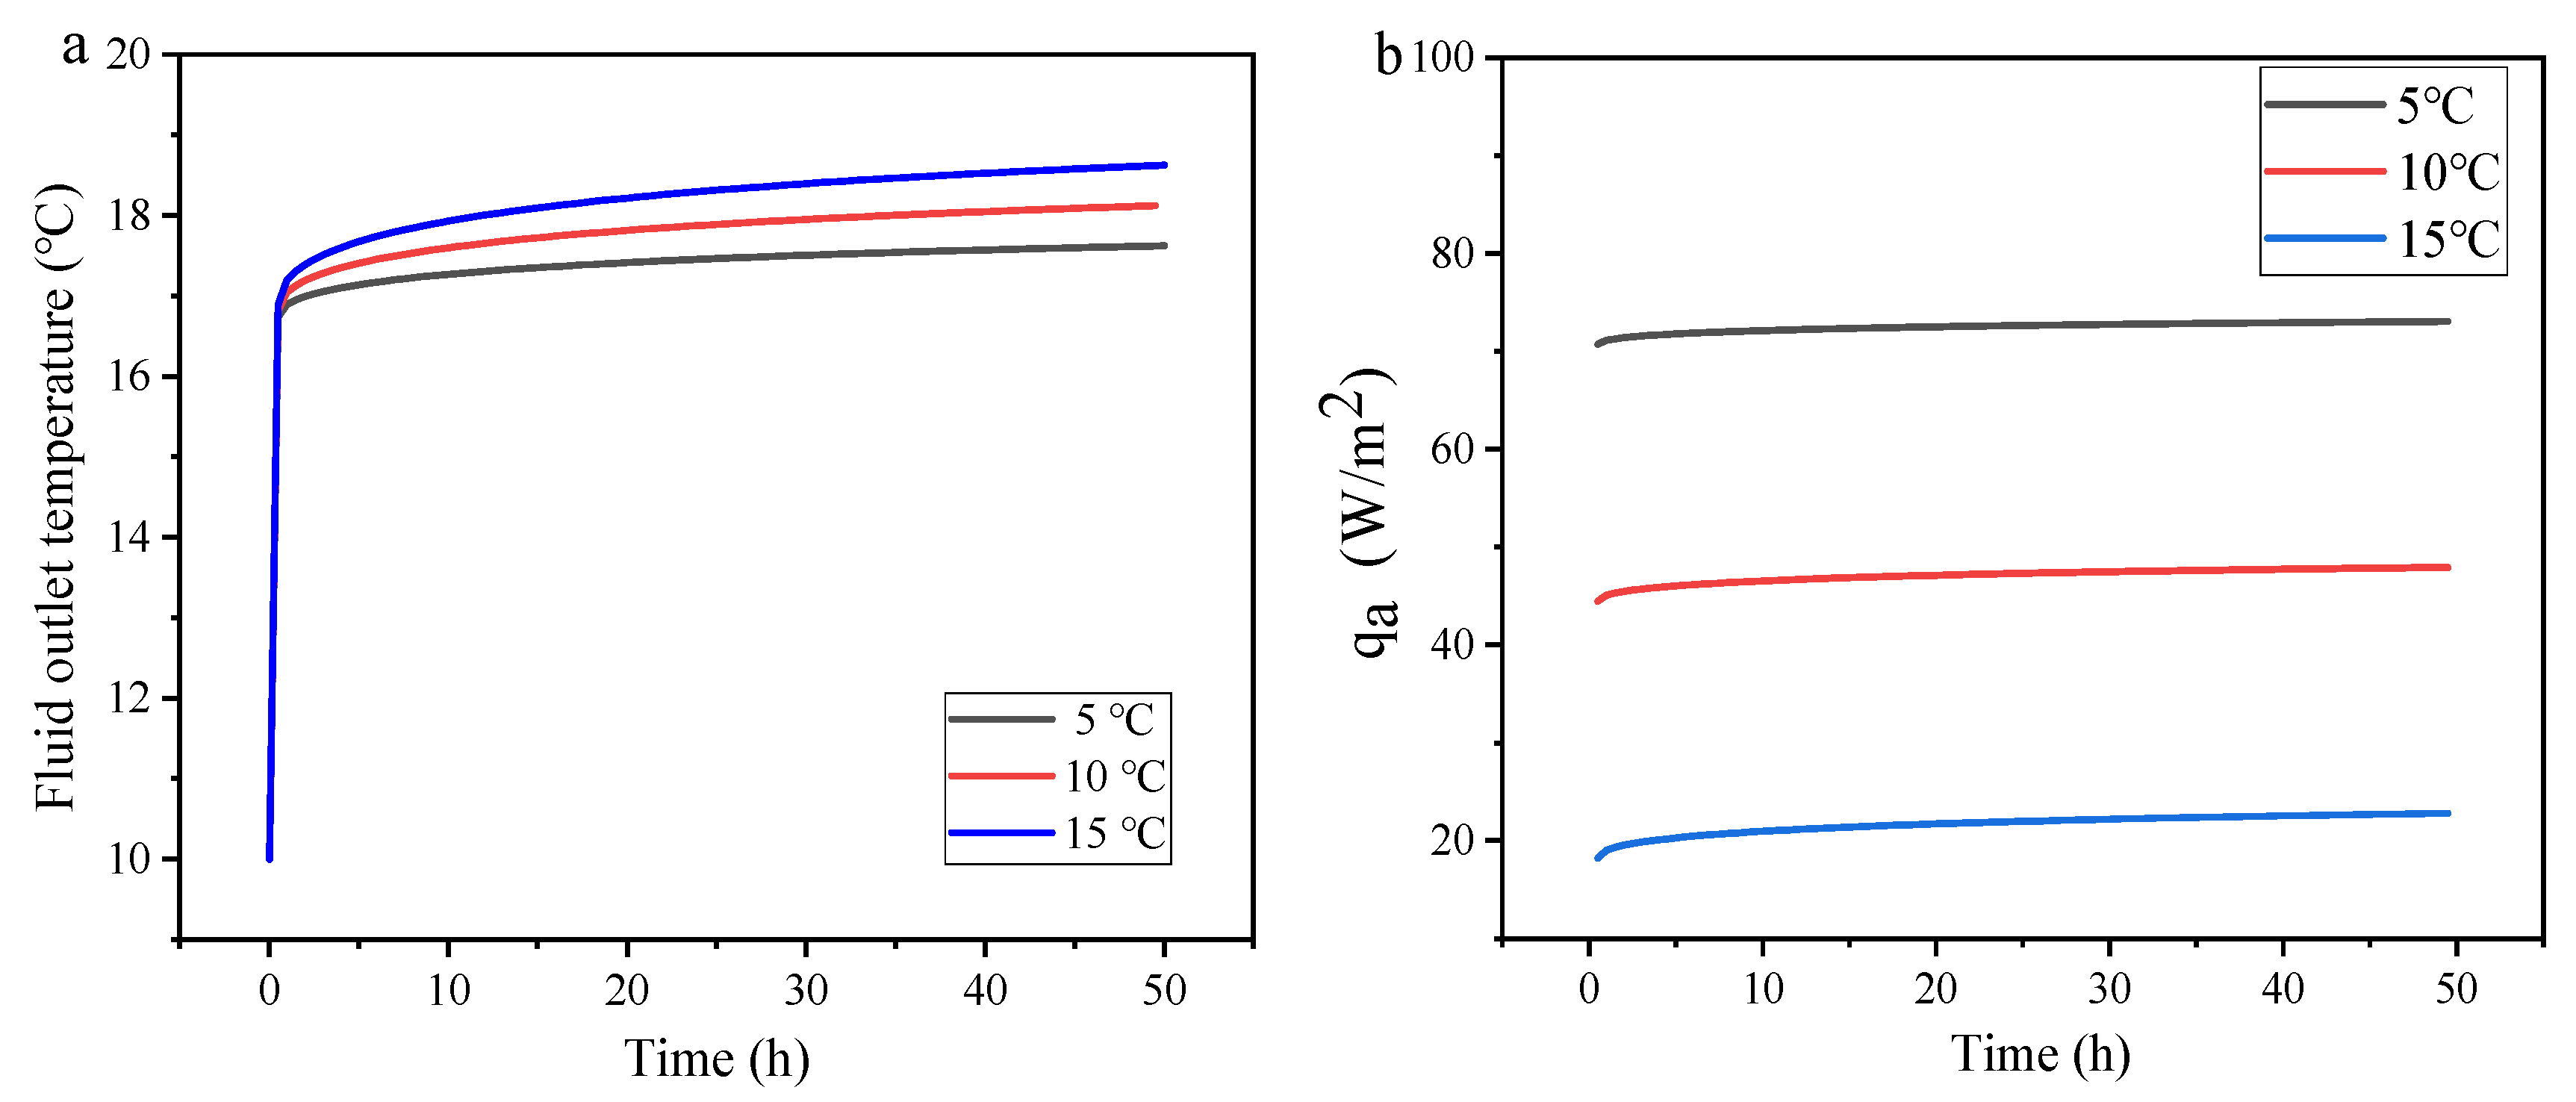
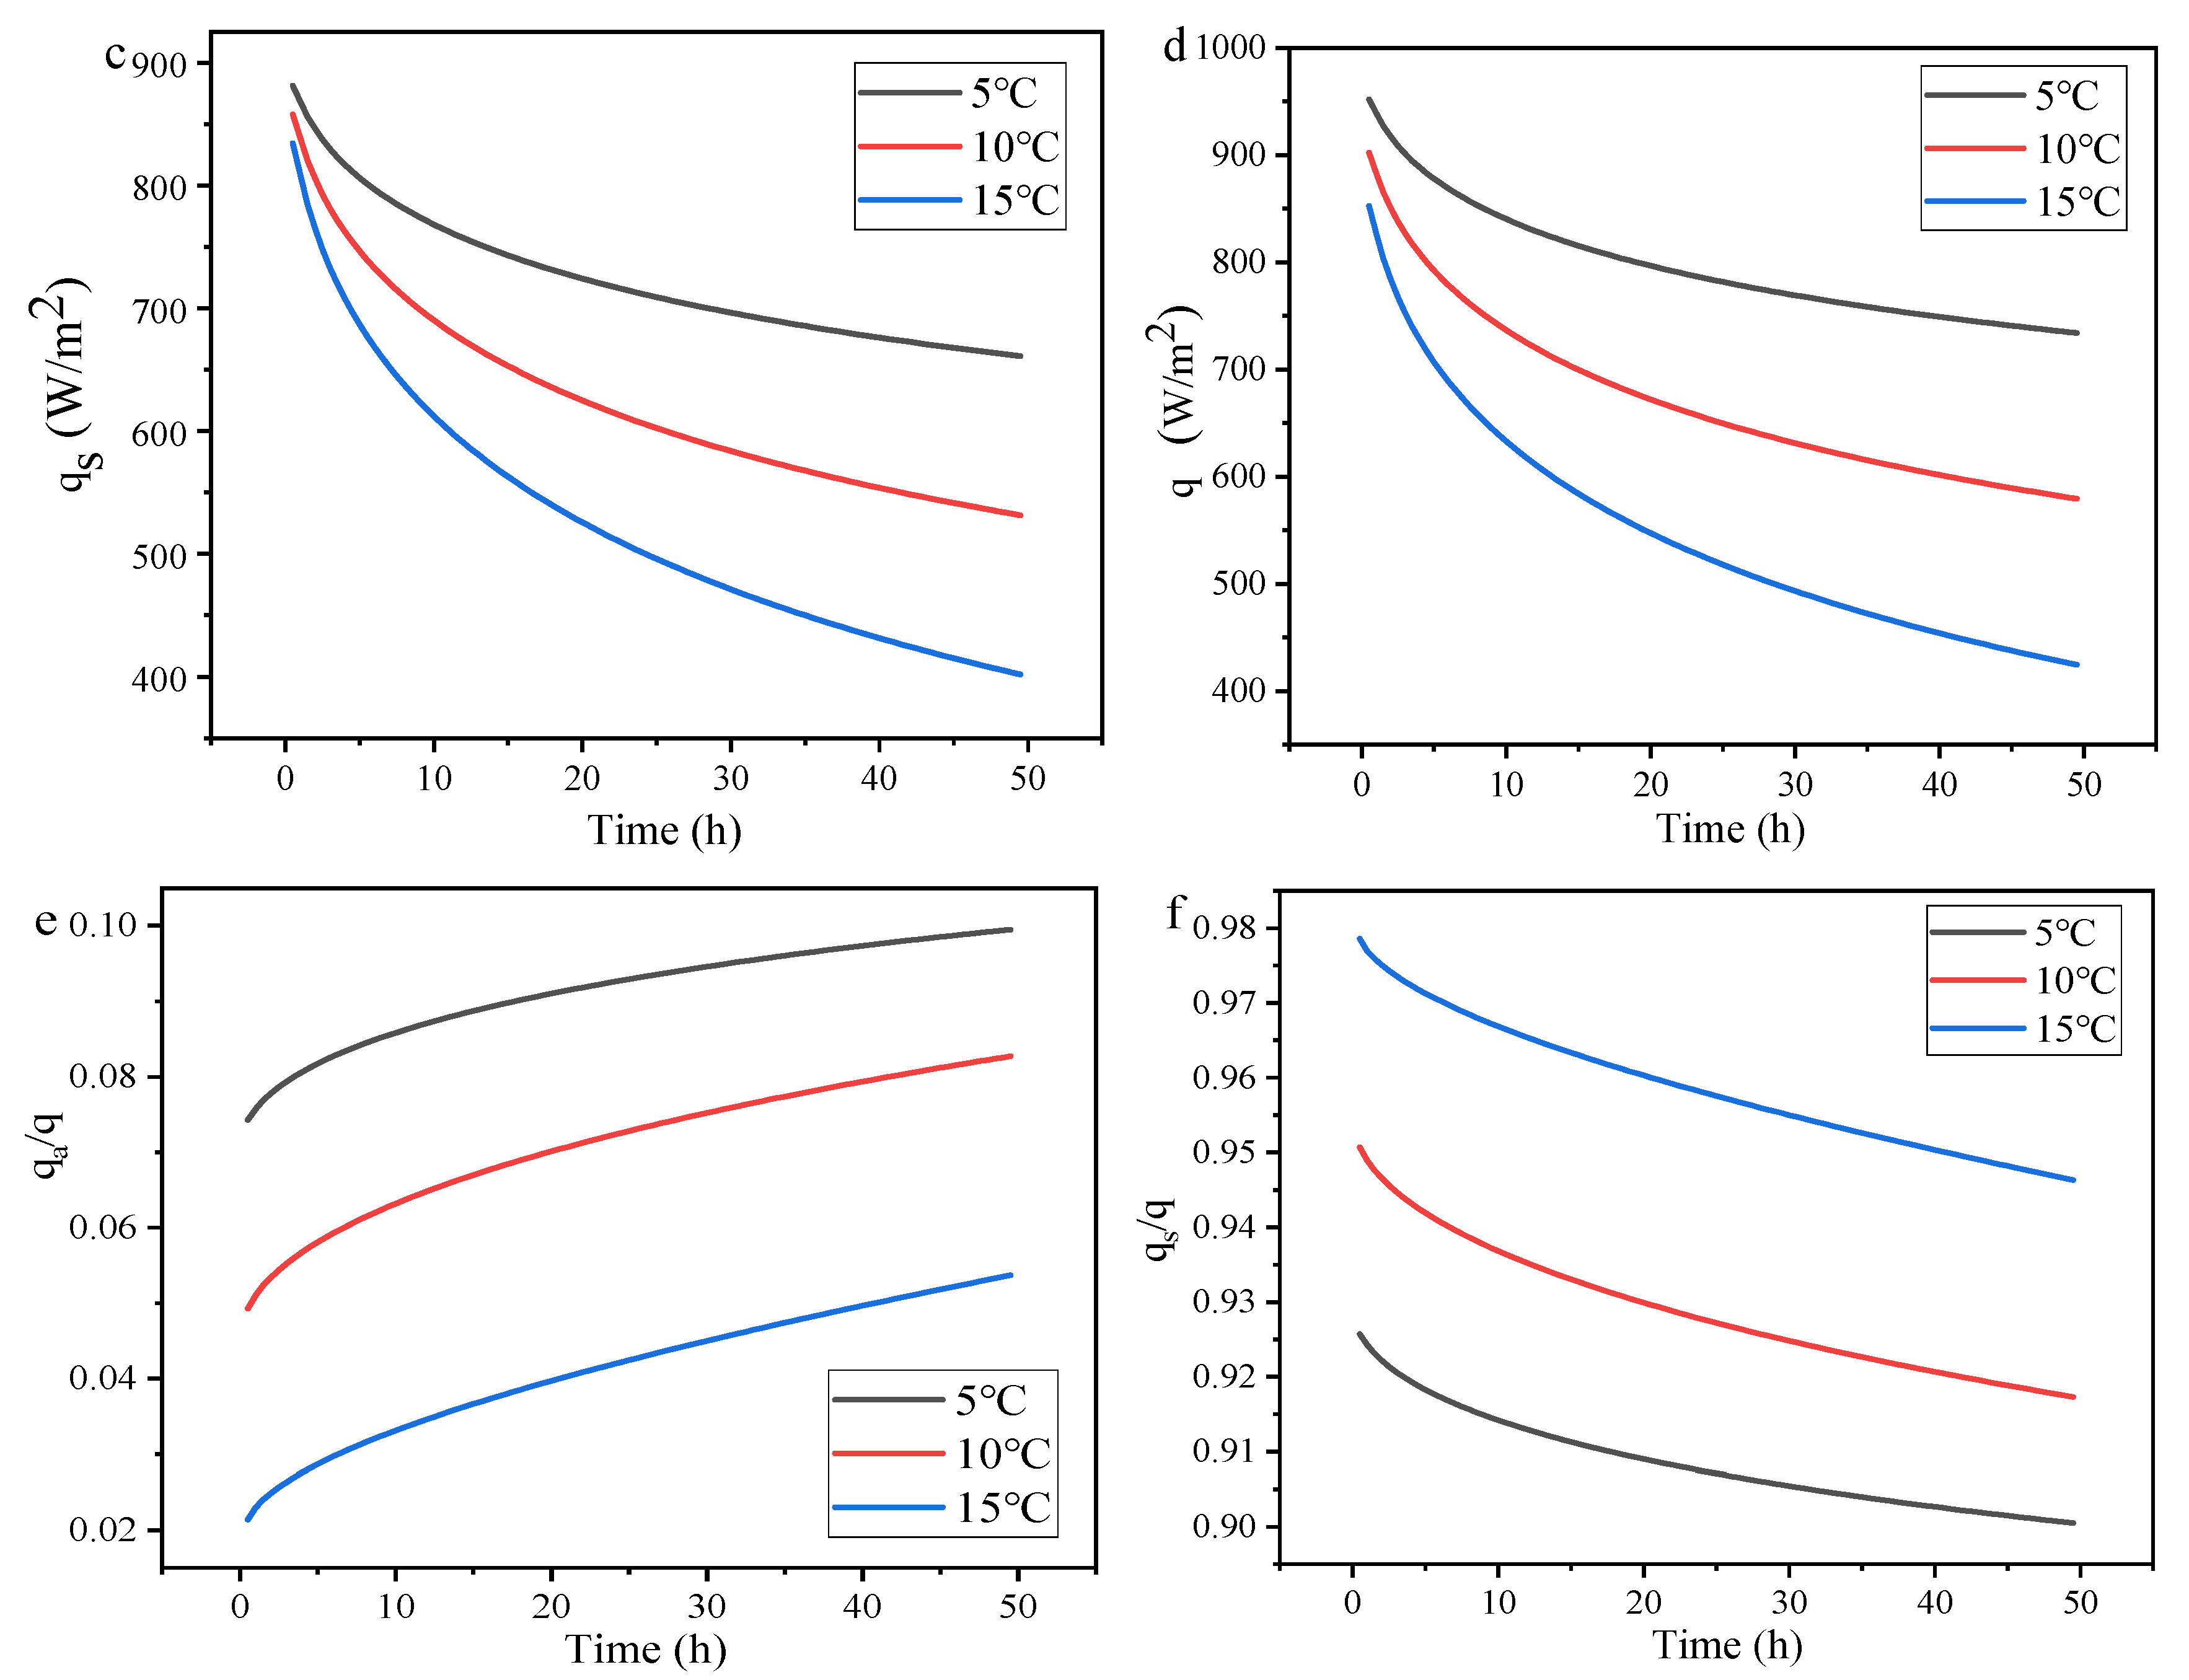
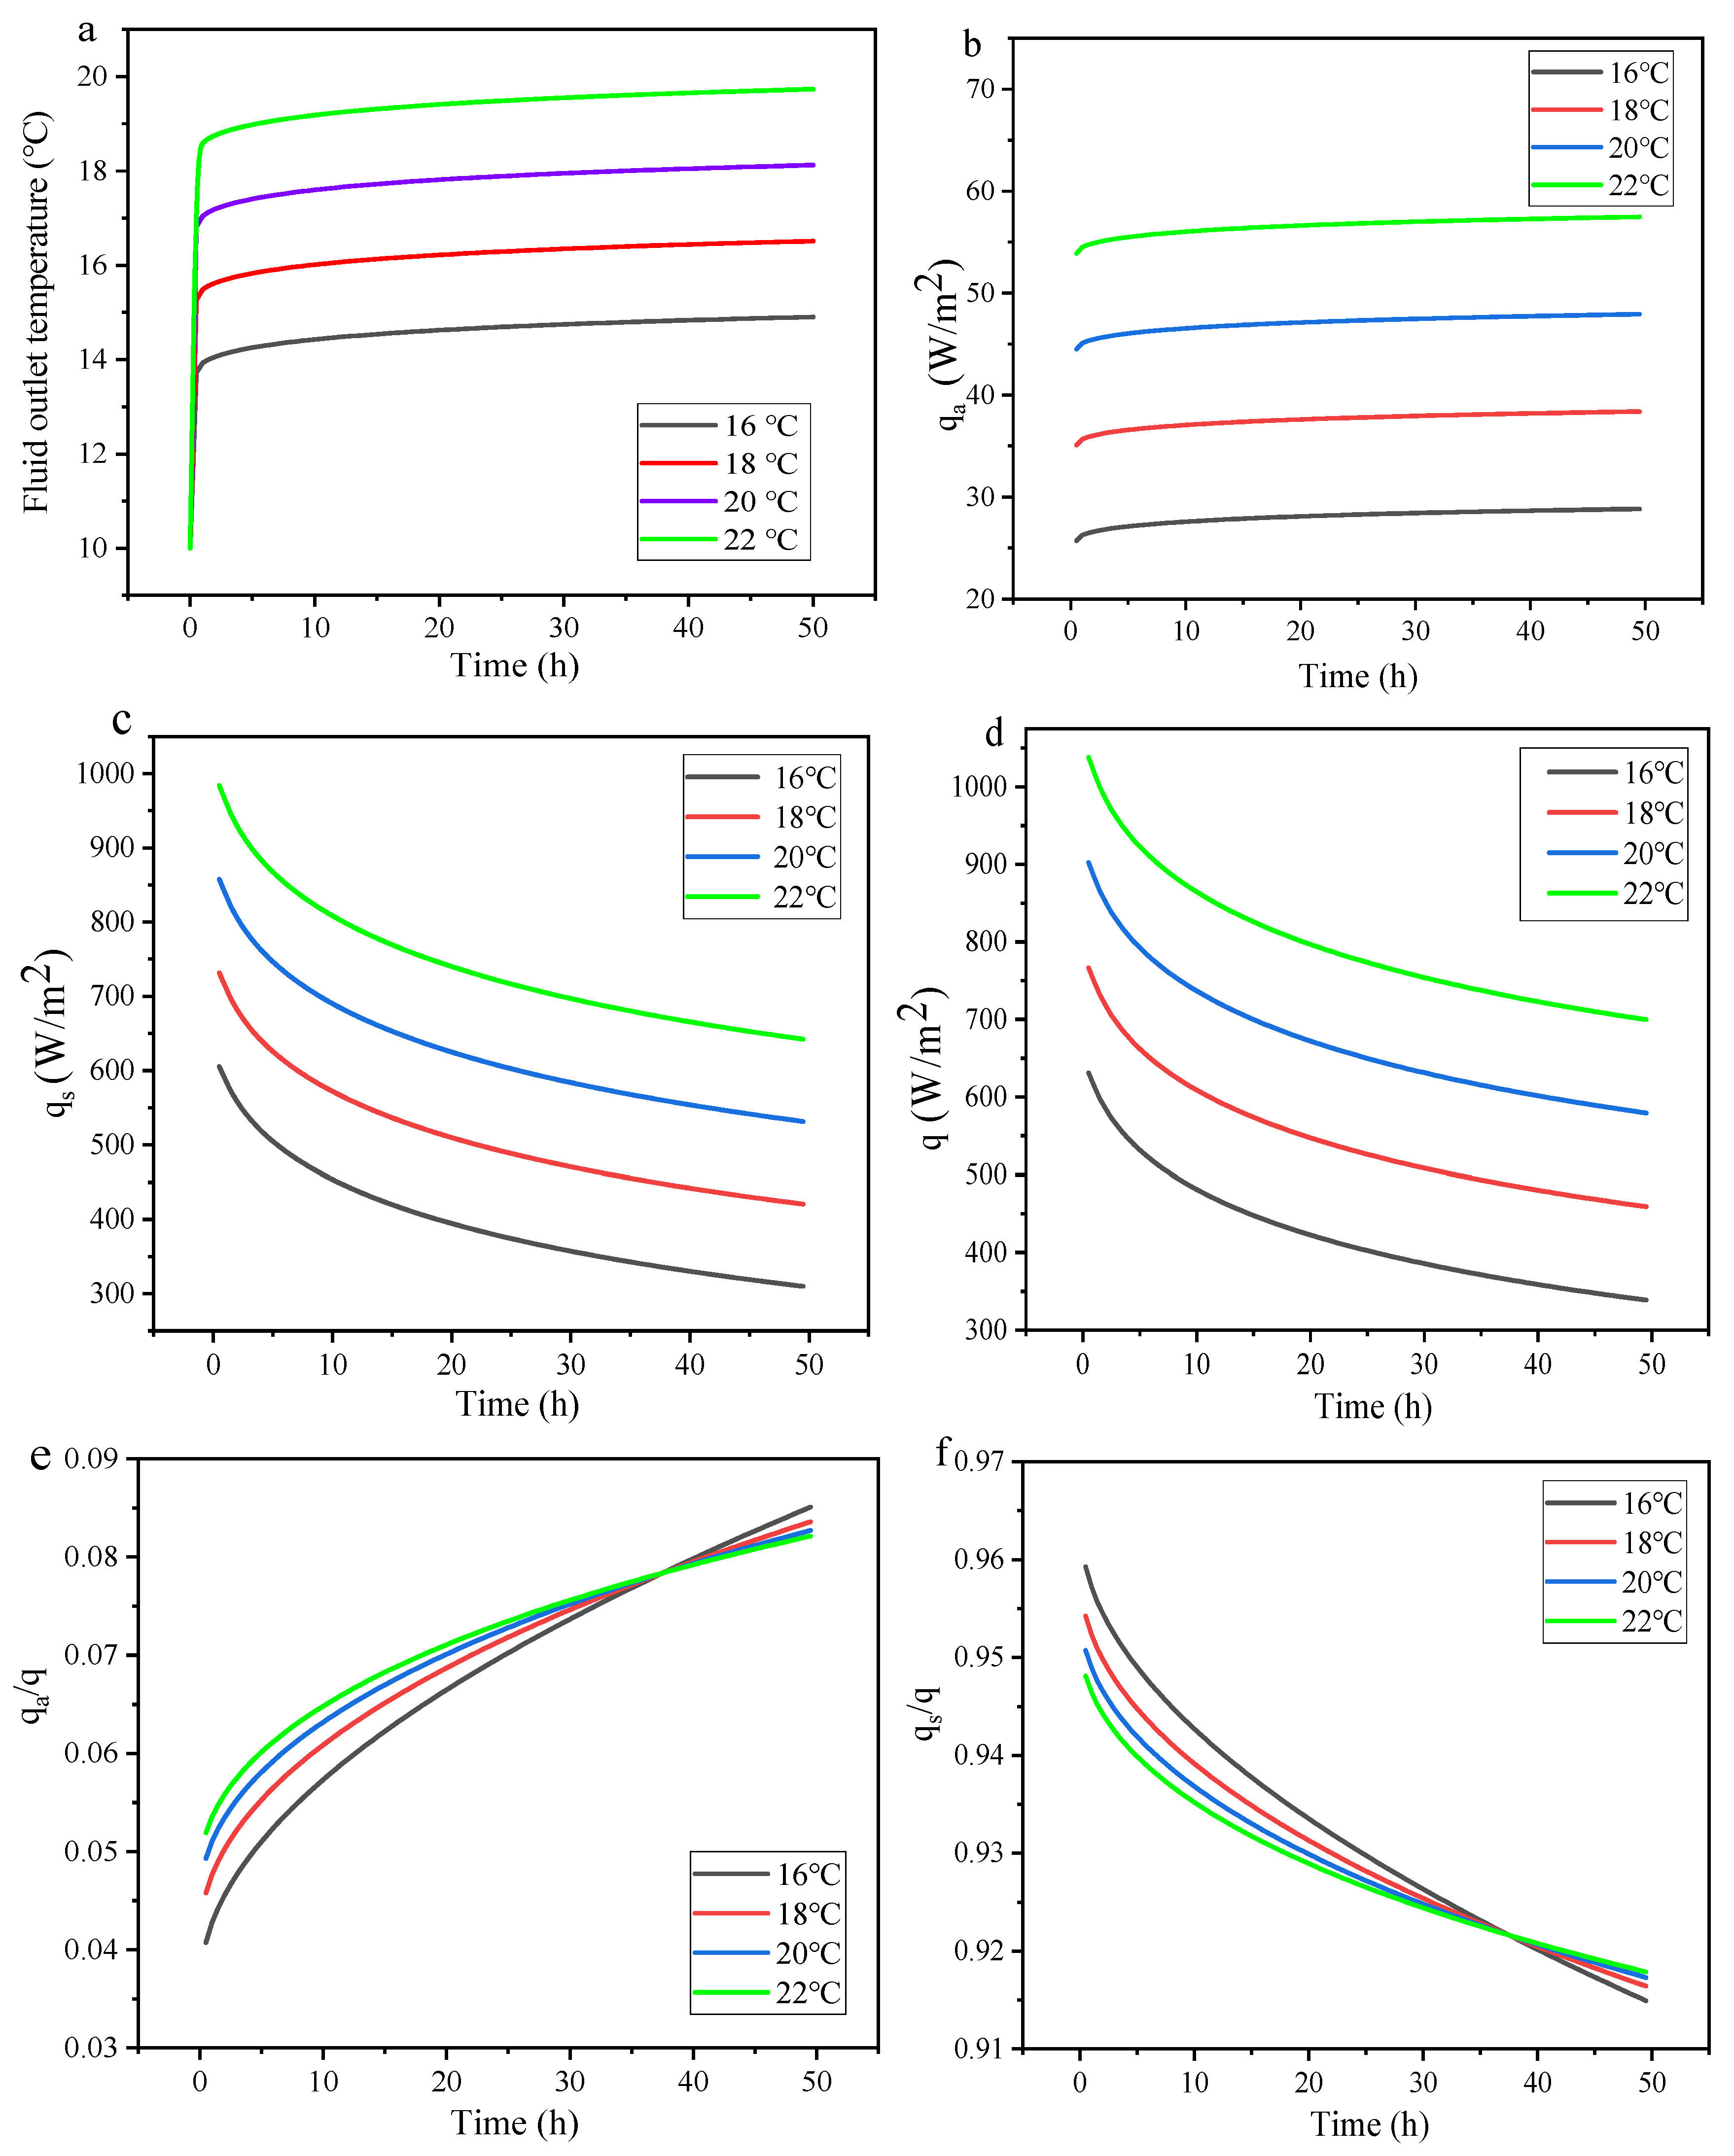
Figure 7 shows the impact of variations in tunnel air temperature on various parameters within the heat transfer process. Over time, the fluid temperature at the outlet of the ground heat exchanger gradually increases and stabilizes at approximately 18 °C. In the early stage of the simulation, the fluid temperature at the outlet of the ground heat exchanger shows a significant upward trend. Specifically, after the system runs for about three hours, the fluid temperature can rise to around 17 °C. Subsequent analysis reveals that the rise in air temperature diminishes the thermal gradient between the tunnel air and the ground heat exchanger. Under constant thermal resistance conditions, this reduced temperature difference directly decreases heat exchange efficiency, causing the working fluid outlet temperature to approach its inlet temperature.
With the passage of time, the air-side heat transfer changes relatively little. Notably, when the air temperature increases by 5 °C, the heat flux on the air side rises by approximately 25 W/m2. After 50 h of operation, the heat flux of the surrounding rock at an air temperature of 5 °C differs by approximately 300 W/m2 from that at an air temperature of 15 °C. The thermal gradient between the ground heat exchanger and the surrounding rock gradually weakens. This reduction becomes more pronounced with increasing tunnel air temperature. As the surrounding rock temperature rises over time, the thermal gradient between the ground heat exchanger and the surrounding rock diminishes, consequently reducing the heat transfer performance.
Under summer conditions, approximately 92–95% of the heat is released into the surrounding rock, while only 5–8% of the heat is released into the air inside the tunnel.

5.2. Influence of Fluid Inlet Temperature of Ground Heat Exchanger

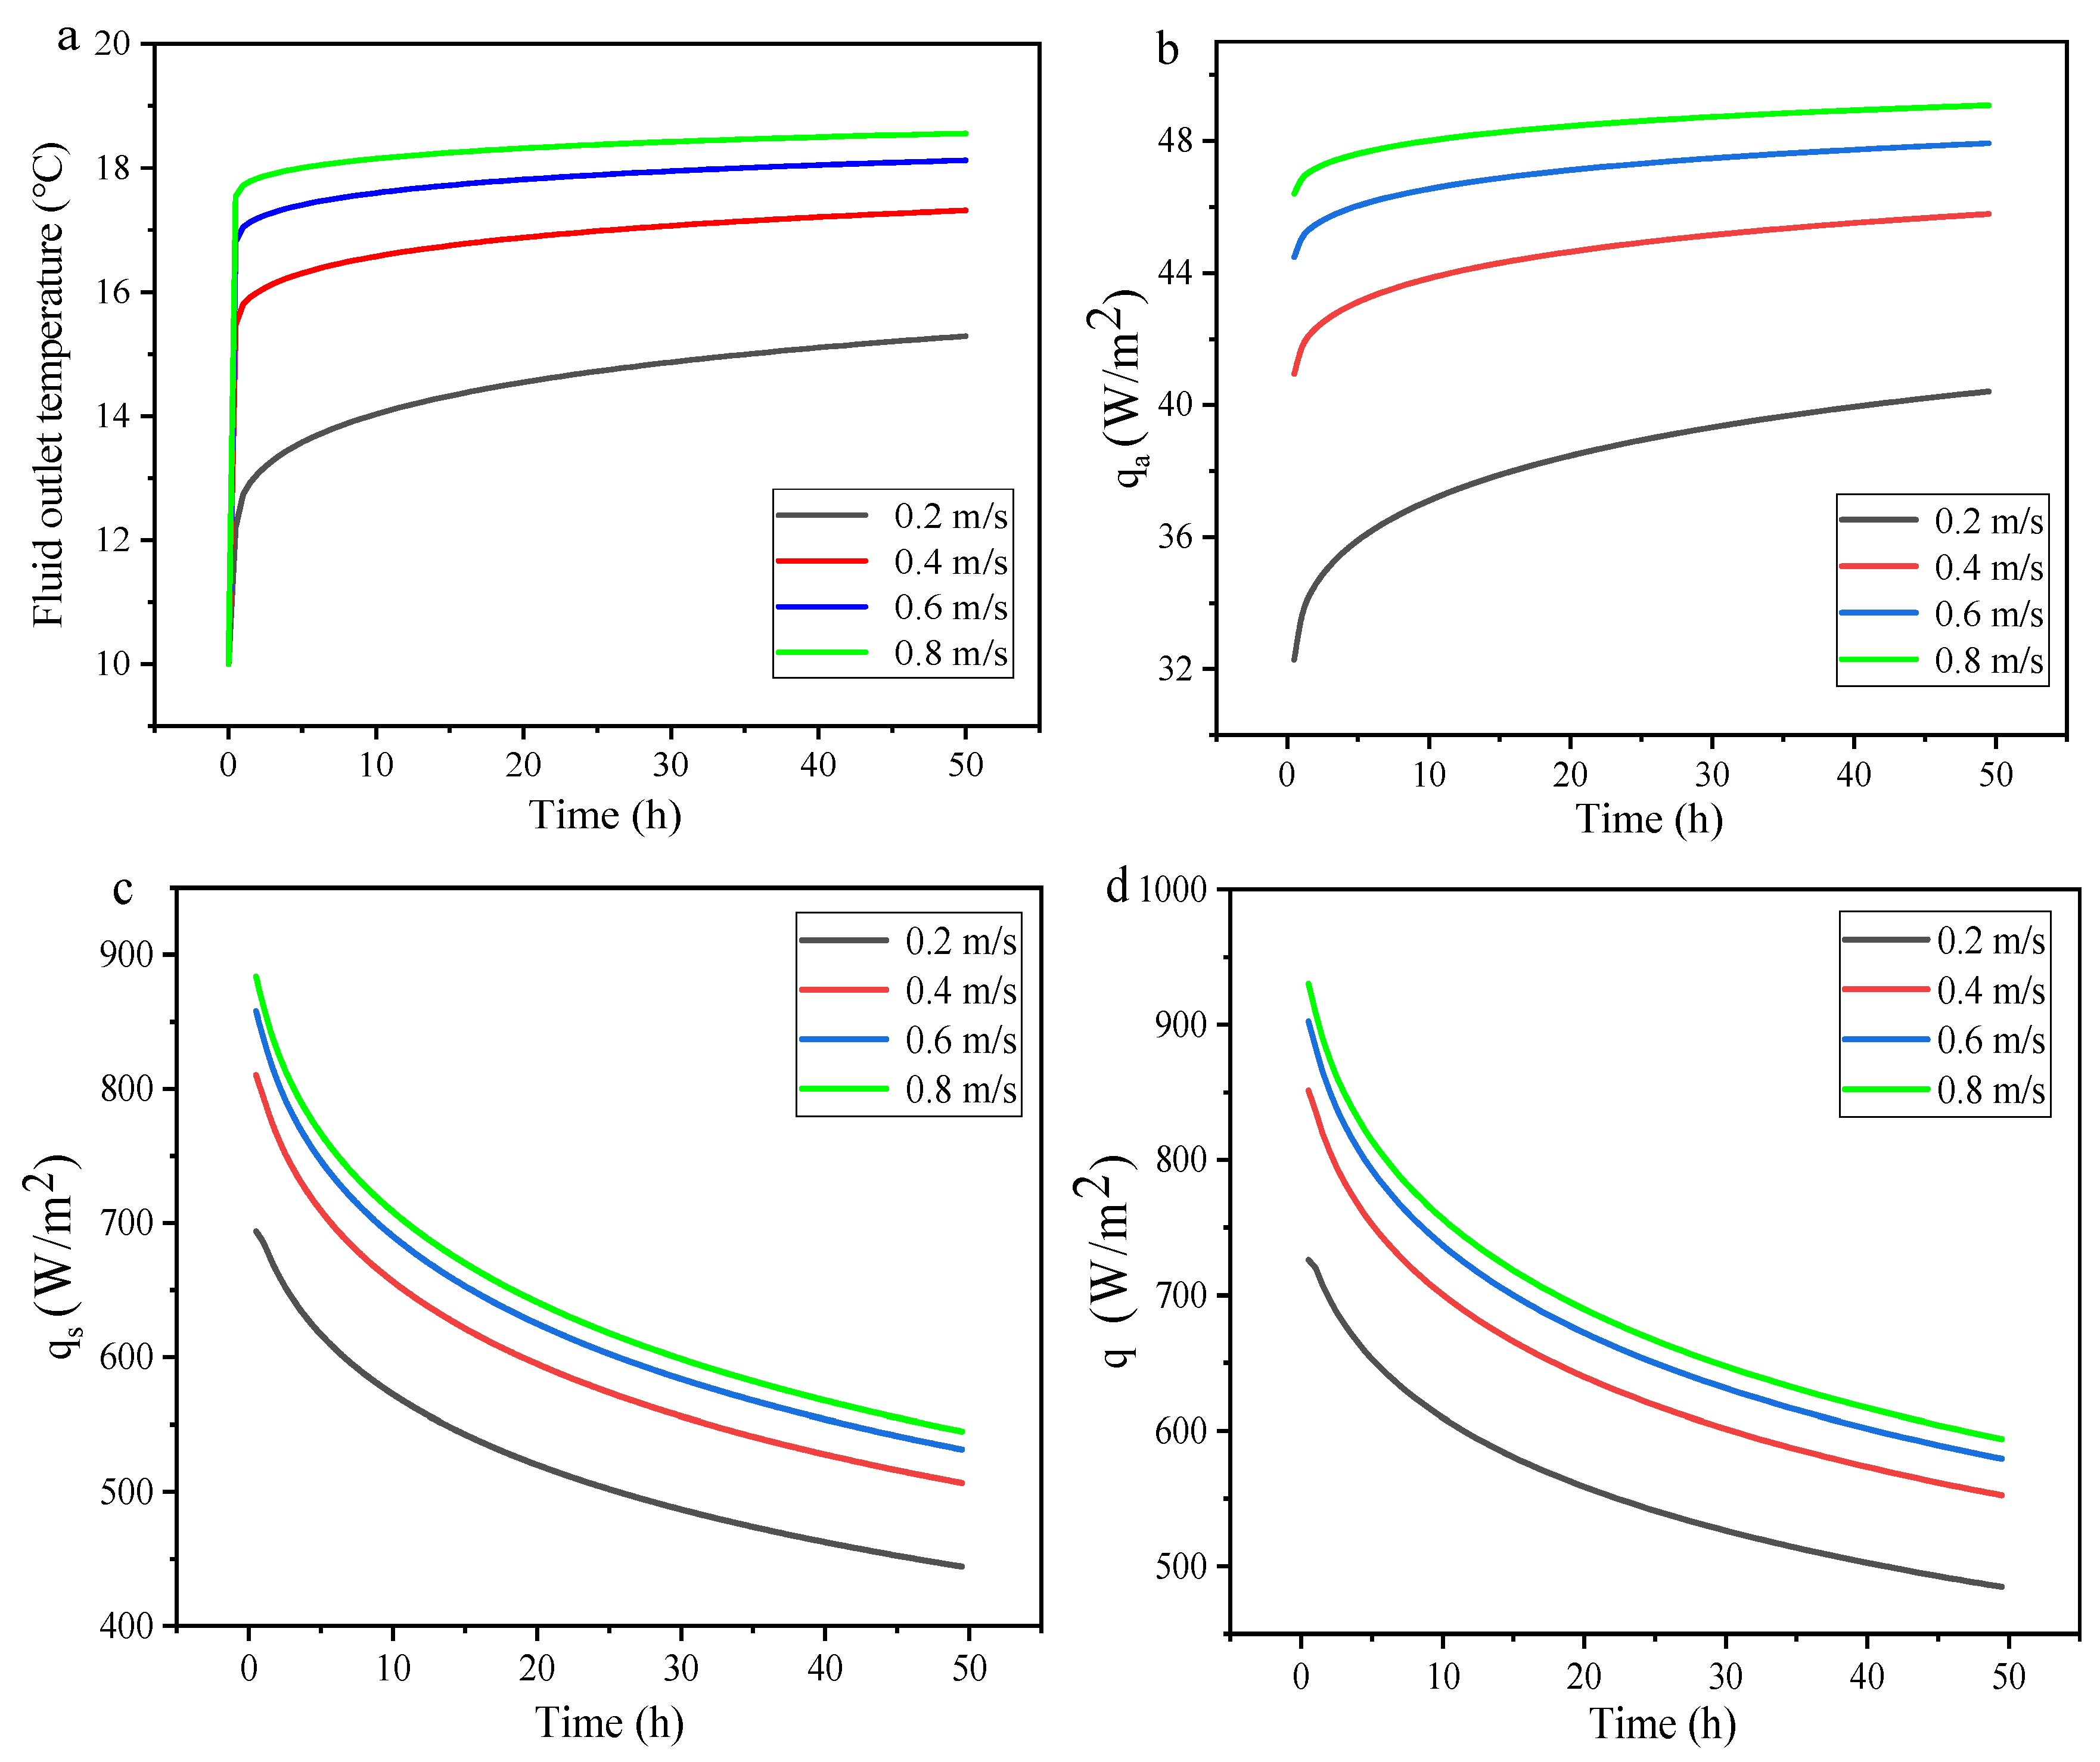
Figure 8 shows the impact of variations in fluid inlet temperature of the ground heat exchanger on various parameters within the heat transfer process. Figure 8a shows that after 50 h of continuous operation, the data reveal a direct proportional relationship, where increases in outlet temperature correspond to synchronous rises in inlet temperature. At a fluid inlet temperature of 16 °C, the outlet temperature exceeds 14 °C after 50 operational hours, with the temperature difference maintained below 2 °C. Conversely, when the inlet temperature reaches 22 °C, the outlet temperature remains below 20 °C, resulting in a temperature difference greater than 2 °C. This demonstrates proportional growth of the inlet–outlet temperature difference relative to the inlet temperature rise. In the field of heat transfer, the temperature gradient is the main driving force for heat transfer. When the initial temperatures of the surrounding rock and tunnel air are held constant, a larger temperature gradient between the circulating fluid and these initial temperatures enhances the thermal performance of the ground heat exchanger. This enhancement manifests as a greater difference between the fluid’s inlet and outlet temperatures.
Under the condition of constant inlet temperature, after the system has run for 50 h (reaching a steady state), qa has increased by approximately 5 W/m2 compared to the initial value, and qs has decreased by approximately 300 W/m2 compared to the initial value. As the increased convective heat transfer on the tunnel air side fails to compensate for the reduction in heat conduction in the rock, the system’s total heat transfer rate exhibits a downward trend.

5.3. Influence of the Circulating Fluid Velocities

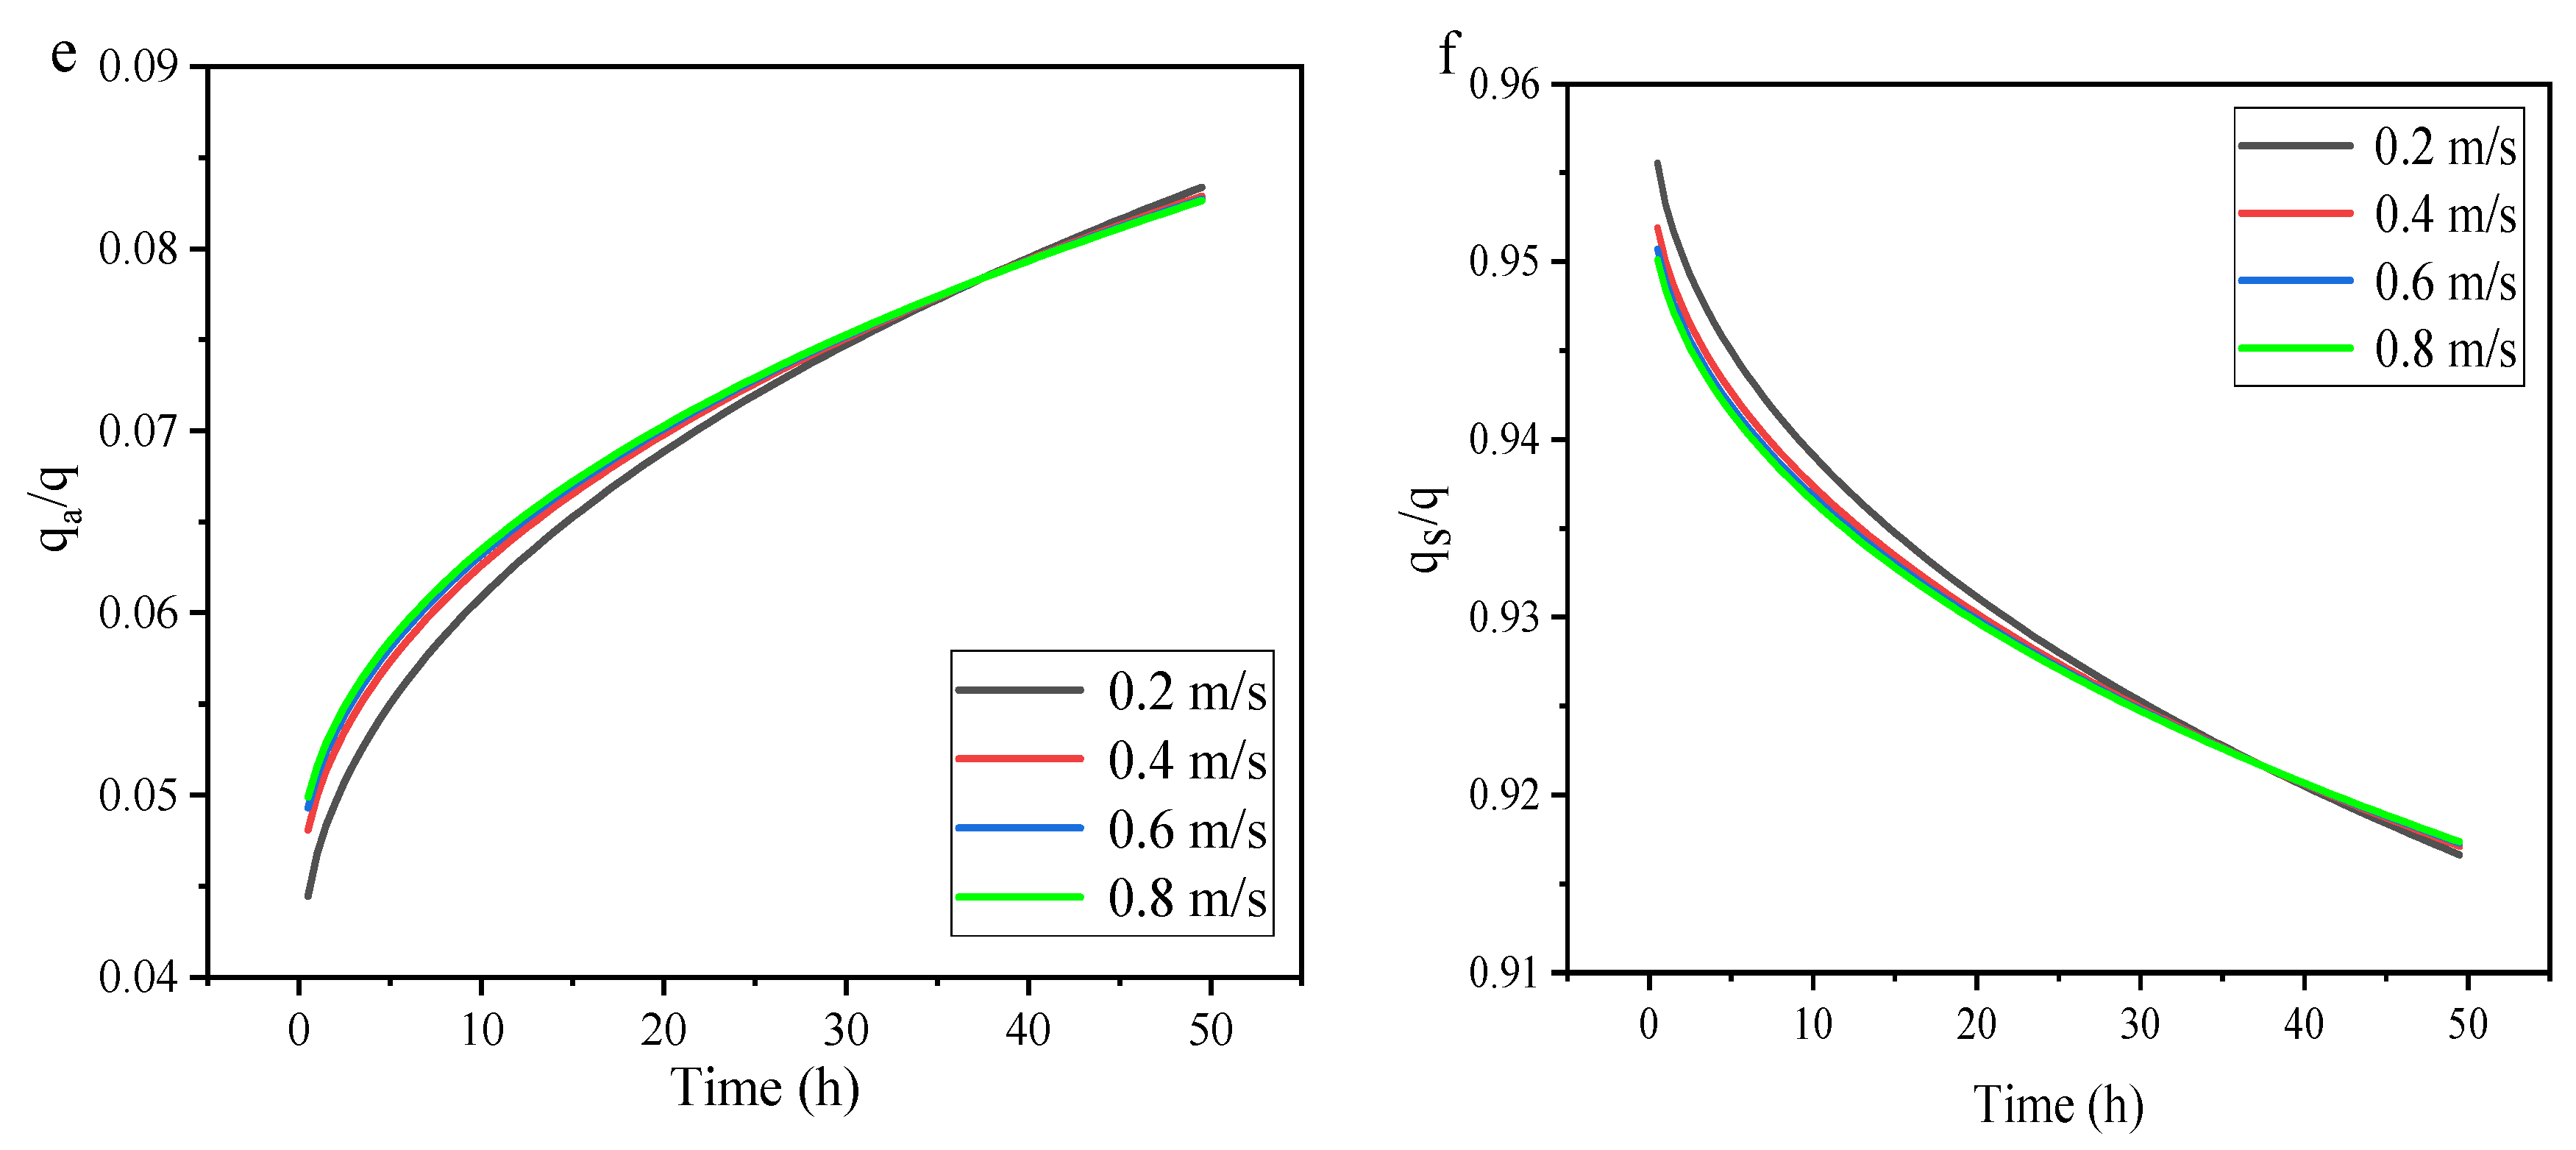
Figure 9 shows the effects of variations in the circulating fluid velocity on different parameters within the heat transfer process. Figure 9d shows that after 50 h of continuous operation, the system achieves a total heat flux of 484 W/m2 at a flow velocity of 0.2 m/s, increasing to 552 W/m2 when the velocity increases to 0.4 m/s. When the flow velocity rises from 0.2 m/s to 0.4 m/s, the total heat flux increases by 68 W/m2. When the flow velocity rises from 0.4 m/s to 0.6 m/s, the total heat flux increases by 27 W/m2. When the flow velocity rises from 0.6 m/s to 0.8 m/s, the total heat flux increases by 14 W/m2. The total heat flux does not increase linearly with fluid velocity. With the rise in flow velocity, the impact of enhancing the heat transfer mechanism slowly diminishes. Figure 9a indicates that under different flow velocities, the outlet temperature of the fluid gradually increases and eventually stabilizes. As the flow velocity increases, the fluid outlet temperature also increases, but the relationship between the two is not linear. Specifically, when the flow velocity increases by the same magnitude, the increment in heat flux at high flow velocities is significantly smaller than that at low flow rates. This observation indicates that there is a flow velocity threshold. Beyond this threshold, increasing the flow velocity does not enhance the heat exchange efficiency.

5.4. Influence of Thermal Conductivity of Lining

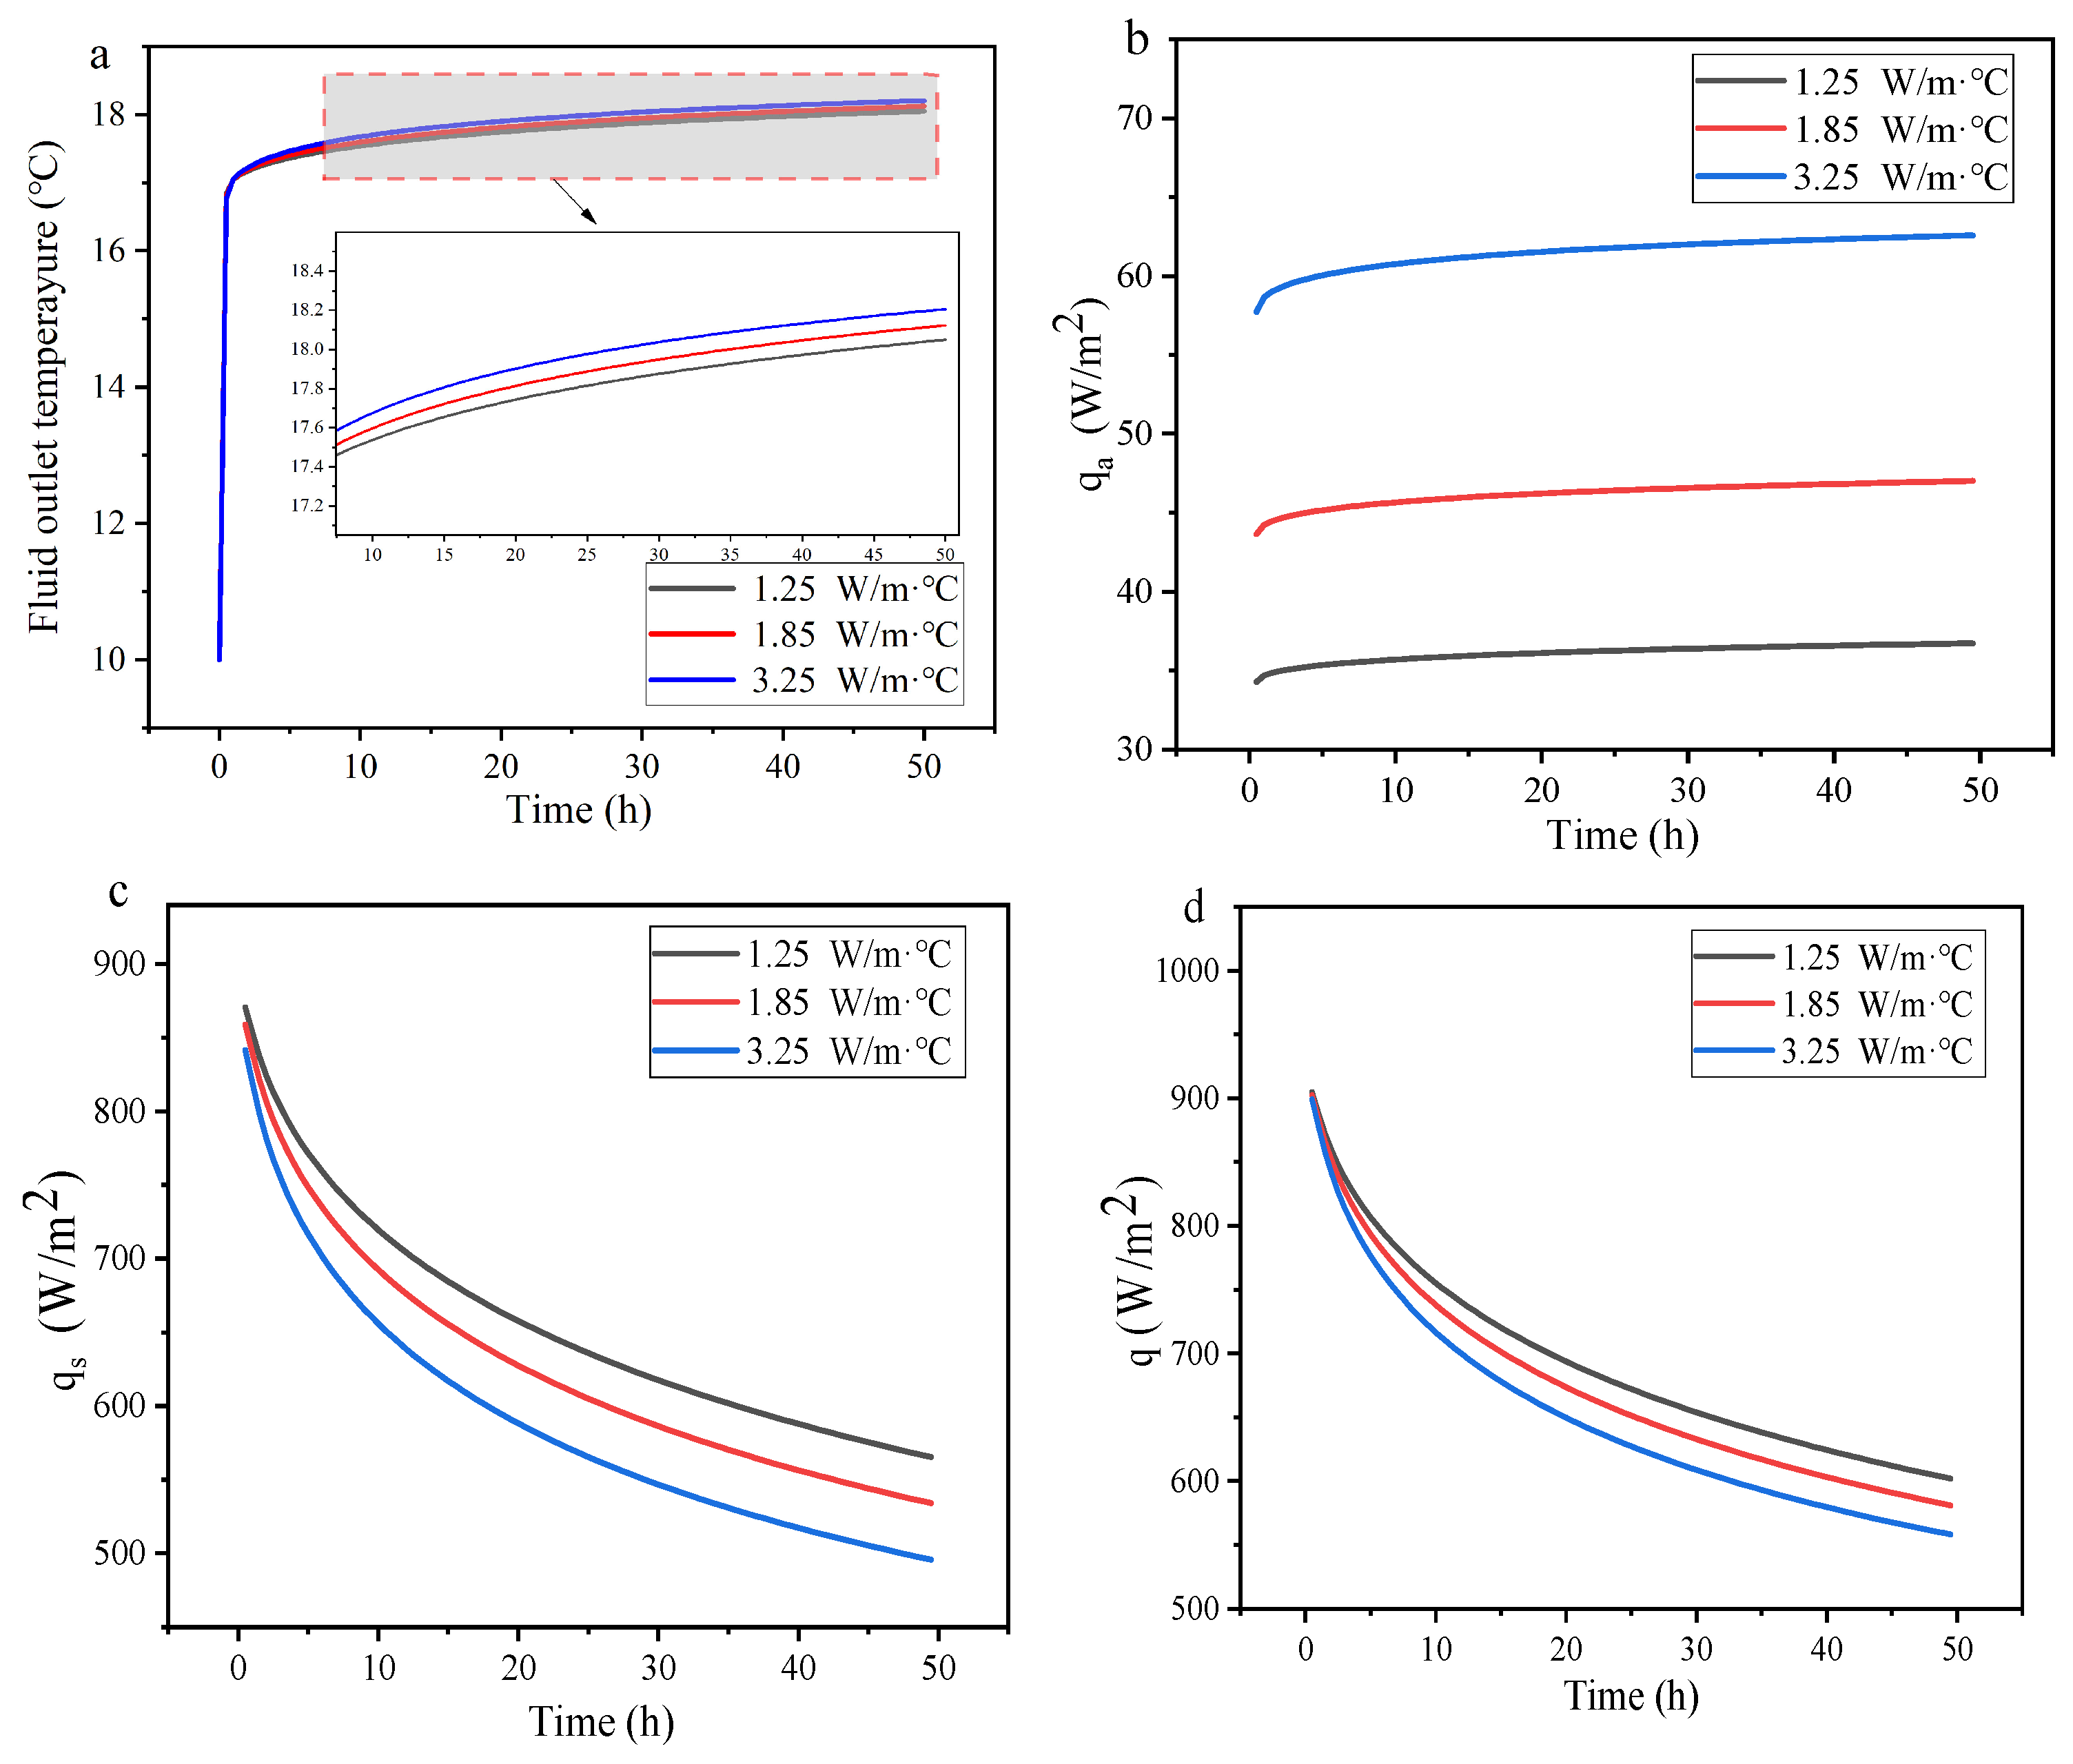
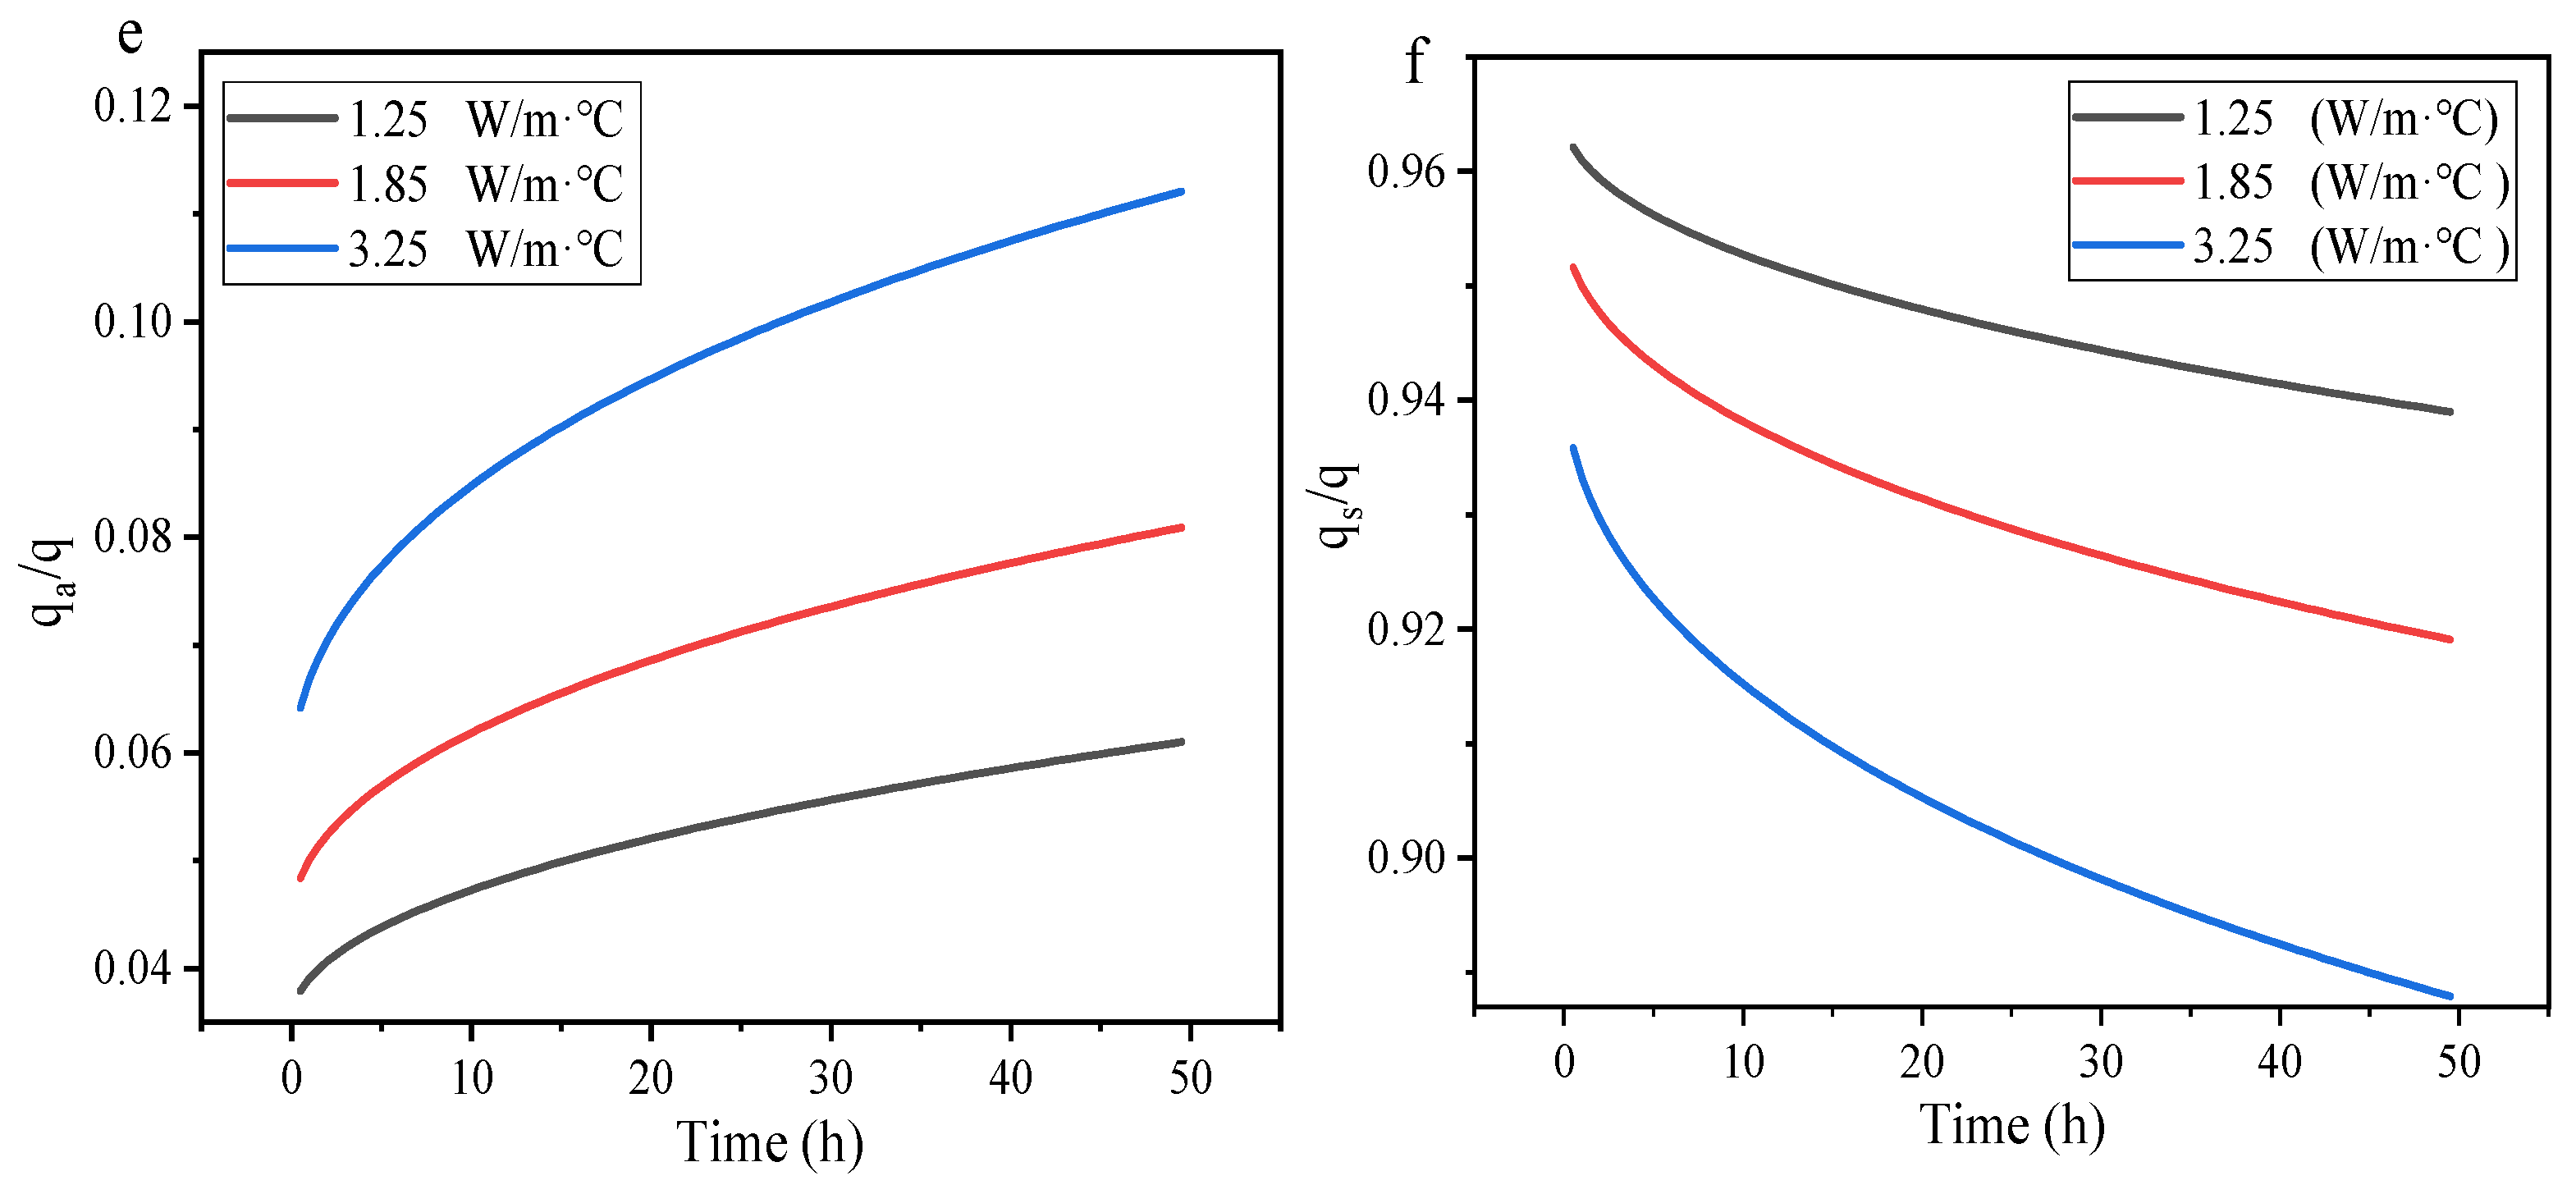
Figure 10 shows the impact of variations in thermal conductivity of the lining on various parameters within the heat transfer process. Over time, the outlet temperature gradually rises and eventually stabilizes. Notably, while increasing the thermal conductivity of the lining elevates the outlet temperature, the effect is relatively minor. The reason for this is that the increase in the thermal conductivity of the lining enhances the heat exchange between the ground heat exchanger and the tunnel air. However, a continuous increase in the surrounding rock temperature progressively reduces the thermal gradient between the ground heat exchanger and the surrounding rock. This reduction directly reduces the heat flux in both the ground heat exchanger and the surrounding rock. Under these conditions, the increased heat flux on the air side cannot compensate for the decrease on the rock side. As the thermal conductivity of the lining increases, the heat flux of the system decreases. Although adjusting the thermal conductivity of the lining can directly boost heat flux on the air side by reducing the thermal gradient between the ground heat exchanger and the air, it is worth noting that the air side contributes only a relatively small fraction, approximately 5–8%, to the overall heat exchange process. Enhancing the thermal performance of the ground heat exchanger merely by increasing the thermal conductivity of the lining has a limited effect.
Under the summer operating conditions of this model, although variations in the thermal conductivity of the lining have an impact on the fluid outlet temperature, this effect is not significant. The findings indicate that varying the tunnel air temperature can improve the heat transfer efficiency of the ground heat exchanger more obviously than changing the thermal conductivity of the lining.

6. Conclusions

Although traditional ground source heat pumps are energy-efficient, their widespread adoption is limited by prohibitively high drilling costs and extensive land requirements for well arrays. Through a systematic analysis of existing underground energy infrastructures, we propose a novel model that integrates ground heat exchangers (GHEs) into tunnel linings. This study comprehensively considers the convective heat transfer of tunnel air and establishes the corresponding heat conduction equations. The model derivation and solution methodology are presented subsequently. To verify the reliability of the model, experimental data from published literature are adopted to validate the simulation results of the model, and the main conclusions are summarized as follows:
(1)
By simplifying the tunnel heat transfer process, we established a one-dimensional analytical model for tunnel lining systems with internal heat sources. The analytical solution of the model was derived using the Green’s function method, and the fluid outlet temperature was further calculated. Comparative analysis with literature data shows that the proposed model can continuously simulate the tunnel heat transfer process for 50 h, which verifies the accuracy and practicality of the model.
(2)
Under summer operating conditions in this model, as the air temperature inside the tunnel rises, the fluid outlet temperature of the ground heat exchanger steadily increases and eventually stabilizes. Adjusting the tunnel air temperature to enhance the heat transfer efficiency of the ground heat exchanger proves more effective than altering the thermal conductivity of the lining.
(3)
Under summer operating conditions in this model, the increase in flow velocity leads to a higher outlet temperature. Flow intensification can effectively improve the heat transfer efficiency only at relatively low flow velocities.
(4)
Under the summer operating conditions investigated in this model, 5–8% of the thermal energy of the ground heat exchanger is dissipated to the tunnel air through convective heat transfer, while the remaining 92–95% is transferred to the surrounding rock by heat conduction.

Author Contributions

Conceptualization, Z.S. and S.X.; methodology, S.X. and P.H.; software, P.H. and L.Z.; validation, L.Z. and N.W.; formal analysis, Y.W. All authors have read and agreed to the published version of the manuscript.

Funding

This work was supported by the Open Project of the Key Laboratory of Geological Safety in Coastal Urban Underground Space of the Ministry of Natural Resources (NO. BHKF2023Z05) and Deyang City’s list of major key projects (2022JBZG002), and the National Natural Science Foundation of China (Grant No. 52078257).

Data Availability Statement

The data presented in this study are openly available in the published literature cited in the article.

Conflicts of Interest

The authors declare no conflict of interest.

Nomenclature

a Thermal diffusivity [m2/s]
τ Time [s]
r Radius [m]
g Volumetric heat generation rate [W/m3]
ρ Density [kg/m3]
cSpecific heat capacity [J/(kg·°C)]
TTemperature [°C]
T0Initial and infinite temperatures of the surrounding rock [°C]
rbRadius of the ground heat exchanger [m]
λ Thermal conductivity [W/(m·°C)]
HaHeat transfer coefficient between the ground heat exchanger and the tunnel air [W/(m2·°C)]
TwContact temperature between the ground heat exchanger and the surrounding rock [°C]
qHeat flux of the system [W/m2]
qaHeat flux between the ground heat exchanger and the tunnel air [W/m2]
qsHeat flux between the ground heat exchanger and the surrounding rock [W/m2]
vFlow velocity [m/s]
TinFluid inlet temperature of the ground heat exchanger [°C]
ToutFluid outlet temperature of the ground heat exchanger [°C]
TmMean fluid temperature of the ground heat exchanger [°C]
iIteration step i
tSurrounding rock temperature ignoring boundary conditions [°C]
sThe cross-sectional area of the ground heat exchanger [m2]
l Tunnel length [m]
HsHeat transfer coefficient between the ground heat exchanger and the surrounding rock [W/(m2·°C)]

References

  1. Amiri, M.; Ziółkowski, P.; Mikielewicz, D. Synergistic effects of a swirl generator and MXene/water nanofluids used in a heat exchanger pipe of a negative CO2 emission gas power plant. Numer. Heat Transf. Part A Appl. 2024, 87, 2368277. [Google Scholar] [CrossRef] [Scilit]
  2. Shang, Y.; Zhu, L. Role of green finance in renewable energy development in the tourism sector. Renew. Energy 2013, 206, 890–896. [Google Scholar] [CrossRef]
  3. Zhang, Z.; Liu, H.; Liu, P. Study on actual operation and influencing factors of middle-deep geothermal buried pipe. Acta Energiae Solaris Sin. 2022, 43, 503–509. [Google Scholar]
  4. Spitler, J.D. Ground-source heat pump system research-past, present, and future. HVAC R Res. 2005, 11, 165–167. [Google Scholar] [CrossRef] [Scilit]
  5. Javadi, H.; Ajarostaghi, S.S.M.; Mar, A.C. Performance of ground heat exchangers: A comprehensive review of recent advances. Energy 2019, 178, 207–233. [Google Scholar] [CrossRef] [Scilit]
  6. Ahmadfard, M.; Bernier, M. A review of vertical ground heat exchanger sizing tools including an inter-model comparison. Renew. Sustain. Energy Rev. 2019, 110, 247–265. [Google Scholar] [CrossRef] [Scilit]
  7. Lamarche, L. Horizontal ground heat exchangers modelling. Appl. Therm. Eng. 2019, 155, 534–545. [Google Scholar] [CrossRef] [Scilit]
  8. Jalaluddin, A. Thermal performance investigation of several types of vertical ground heat exchangers with different operation mode. Appl. Therm. Eng. 2012, 33, 167–174. [Google Scholar] [CrossRef] [Scilit]
  9. Qian, Q. Underground space utilization helps develop green buildings and green cities. Tunn. Constr. 2019, 39, 1737–1747. [Google Scholar]
  10. Brandl, H. Energy foundations and other thermo-active ground structures. Geotechnique 2006, 56, 81–122. [Google Scholar] [CrossRef] [Scilit]
  11. De Feudis, S.; Insana, A.; Barla, M. Seizing the opportunity of energy retrofitting of existing tunnels. Tunneling Undergr. Space Technol. 2024, 154, 106–109. [Google Scholar] [CrossRef] [Scilit]
  12. Zhang, G.; Xia, C.; Sun, M.; Zou, Y.; Zhao, F. Analysis of temperature filed heating section of ground source heat pump type heating system in tunnel in cold area. J. Rock Mech. Eng. 2012, 31, 3795–3802. [Google Scholar]
  13. Ogunleye, O.; Singh, R.M.; Cecinato, F.; Choi, J.C. Effect of intermittent operation on the thermal efficiency of energy tunnels under varying tunnel air temperature. Renew. Energy 2020, 146, 2646–2658. [Google Scholar] [CrossRef] [Scilit]
  14. Yu, H. Study on heat transfer theory of capillary network heat exchanger in subway tunnel. J. Hefel Univ. Technol. 2014, 37, 1239–1243. [Google Scholar]
  15. Barrow, H.; Pope, C.W. Theoretical global energy analysis for a railway tunnel and its environment with special reference to periodic temperature change. In Proceedings of the 7th International Symposium on the Aerodynamics and Ventilation of Vehicle Tunnels, Brighton, UK, 27–29 November 1991; pp. 267–280. [Google Scholar]
  16. Sun, F. Study on Heat Transfer Characteristics of Heat Exchanger in Capillary Heat Pump System of Subway Tunnel. Master’s Thesis, Qingdao Technological University, Qingdao, China, 2016. [Google Scholar]
  17. Lai, Y.; Yu, W. Approximate analytical solution for the temperature fields of a circular tunnel in cold region. J. Glaciol. Geocryol. 2001, 23, 126–130. [Google Scholar]
  18. Yuan, F.; You, S. CFD simulation and optimization of the ventilation for subway side-platform. Tunneling Undergr. Space Technol. 2007, 22, 474–482. [Google Scholar] [CrossRef] [Scilit]
  19. Zhao, R. Heat Transfer Research on Capillary Wall Heat Exchanger Applied to the Metro Environmental Control System. Master’s Thesis, Qingdao Technological University, Qingdao, China, 2013. [Google Scholar]
  20. Ji, Y.M.; Jiao, J.C.; Yin, Z.F. Rapid performance prediction model for capillary heat exchangers in subway tunnel linings. Appl. Therm. Eng. 2013, 232, 485–496. [Google Scholar] [CrossRef] [Scilit]
  21. Ji, Y.; Wu, W.; Hu, S. Long-term performance of a front-end capillary heat exchanger for a metro source heat pump system. Appl. Energy 2023, 335, 120772. [Google Scholar] [CrossRef] [Scilit]
  22. Wang, J.; Mao, J.; Han, X.; Li, Y. Study on analytical solution model of heat transfer of ground heat exchanger in the protection engineering structure. Renew. Energy 2021, 179, 998–1008. [Google Scholar] [CrossRef] [Scilit]
  23. Yang, W.; Yang, B.; Wang, F. Numerical simulation and experimental validation of the thermo-mechanical characteristics of phase change concrete energy pile. Trans. Chin. Soc. Agric. Eng. 2021, 37, 268–277. [Google Scholar]
  24. Batini, N.; Loria, A.F.R.; Conti, P.; Testi, D.; Grassi, W.; Laloui, L. Energy and geotechnical behavior of energy piles for different design solutions. Appl. Therm. Eng. 2015, 86, 199–213. [Google Scholar] [CrossRef] [Scilit]
  25. Carlslaw, H.S. Conduction of Heat in Solids; Clarendon Press: Oxford, UK, 1947. [Google Scholar]
  26. Zhang, X.; Ren, Z.; Mei, F. Heat Transfer, 5th ed.; China Architecture & Building Press: Beijing, China, 2007. [Google Scholar]
  27. Zhang, L.; Zhang, D.; Zhou, Y. Analytical mode and analysis of heat transfer of Ground heat exchangers in layered stratum. Acta Energiae Solaris Sin. 2022, 43, 378–385. [Google Scholar]
  28. Ozisik, M.N. Heat Conduction; John Wiley and Sons: Hoboken, NJ, USA, 1980; pp. 229–231. [Google Scholar]
  29. Hahn, D.W.; Ozisik, M.N. Heat Conduction, 3rd ed.; John Wiley and Sons: Hoboken, NJ, USA, 2012. [Google Scholar]
  30. Zhang, C.; Hu, S.; Li, X. Application of green function method in calculation on heat conduction of vertical u-tubes heat exchanger. Acta Energiae Solaris Sin. 2010, 31, 158–162. [Google Scholar]
Figure 1. Structural Figure of the ground heat exchanger in the tunnel lining.
Cleantechnol 08 00075 g001
Figure 2. Effect drawing of the GSHP system for tunnel lining.
Cleantechnol 08 00075 g002
Figure 3. Model of ground heat exchanger with one-dimensional hollow cylinder.
Cleantechnol 08 00075 g003
Figure 4. The calculation process diagram of the outlet fluid temperature of the ground heat exchanger.
Cleantechnol 08 00075 g004
Figure 5. The model simulation results are compared with the experimental data in the literature.
Cleantechnol 08 00075 g005
Figure 6. The relative error between the simulated value and the actual measured value.
Cleantechnol 08 00075 g006
Figure 7. The impact of variations in tunnel air temperature on various parameters within the heat transfer process (a) Temperature of fluid at the outlet of the ground heat exchanger: (b) qa, (c) qs, (d) q, (e) qa/q, and (f) qs/q.
Cleantechnol 08 00075 g007aCleantechnol 08 00075 g007b
Figure 8. The impact of variations in fluid inlet temperature on various parameters within the heat transfer process. (a) Temperature of fluid at the outlet of the ground heat exchanger: (b) qa, (c) qs, (d) q, (e) qa/q, and (f) qs/q.
Cleantechnol 08 00075 g008
Figure 9. The impact of variations in circulating fluid velocity on various parameters within the heat transfer process. (a) Temperature of fluid at the outlet of the ground heat exchanger: (b) qa, (c) qs, (d) q, (e) qa/q, and (f) qs/q.
Cleantechnol 08 00075 g009aCleantechnol 08 00075 g009b
Figure 10. The impact of variations in thermal conductivity of the lining on various parameters within the heat transfer process. (a) Temperature of fluid at the outlet of the ground heat exchanger: (b) qa, (c) qs, (d) q, (e) qa/q, and (f) qs/q.
Cleantechnol 08 00075 g010aCleantechnol 08 00075 g010b
Table 1. Each physical parameter value [13,22].
SymbolData in the LiteratureUnit
ra5.7m
Ha5.29W/(m2·°C)
rb5.9m
ha15W/(m2·°C)
Hs73.3W/(m2·°C)
d25mm
Tin20°C
λ s 3.22W/(m·°C)
v0.6m/s
λ w 1.85W/(m·°C)
Ta10°C
T05.6°C
l 4m
ρs2544Kg/m3
ρ f 1000Kg/m3
cs1293J/(kg·°C)
cf4200J/(kg·°C)
Disclaimer/Publisher’s Note: The statements, opinions and data contained in all publications are solely those of the individual author(s) and contributor(s) and not of MDPI and/or the editor(s). MDPI and/or the editor(s) disclaim responsibility for any injury to people or property resulting from any ideas, methods, instructions or products referred to in the content.