


Highlights
What are the main findings?
- Thirty-one percent reduction in CO2 emissions with regional H2 production.
- With air cooling, the water requirement for H2 production can be reduced by eighty percent.
What is the implication of the main finding?
- Quantification of water quality and quantity required for H2 production.
- H2 blending with natural gas does not give significant emissions benefit.
Abstract
Given the large natural gas (NG) reserves of the Intermountain West (I-WEST) region in the USA, it can emerge as a leader in hydrogen (H2) production. Currently, H2 production via steam methane reforming (SMR) of NG releases carbon dioxide (CO2) and the natural gas infrastructure has fugitive NG and H2 losses during production, conversion and transportation. Integrated carbon capture and sequestration (CCS) is a promising approach for producing hydrogen and CO2 from the SMR process for industrial uses including power, chemicals and fuels. However, the NG losses and regional water availability can be limiting factors for H2 production. H2 production assessments are often made at the global scale and neglect regional factors such as abundant gas and limited water in the I-WEST. We demonstrate that a regional SMR process unit sitting near NG wells offers opportunities to significantly reduce fugitive NG losses. We show that regional H2 production by SMR has a lower emissions profile than widespread natural gas combustion in the I-WEST and reduces the H2 production cost as well. Replacing the I-WEST transportation sector with H2 fuel cell vehicles and using 100% H2-powered electricity can provide substantial reductions in water consumption and fuel costs. This is better than blending H2 with NG which is more expensive. The captured CO2 can be effectively used for enhanced oil recovery in I-WEST. Finally, the potential of utilizing produced, brackish and treated impaired water sources is assessed to meet the water needs for H2 production in the I-WEST.
1. Introduction
Hydrogen (H2) is projected to be used significantly across different energy sectors, including the electricity, transportation, and industrial sectors [1,2,3]. Currently, H2 is predominantly used in the petroleum and chemical manufacturing industries and for ammonia production [4]. In 2020, 90 million tons of H2 were produced globally, of which 70 million tons were used to produce ammonia and for refinery operations, with the rest used for methanol and steel production [4]. Similarly, around 10 million tons of H2 was used in the USA for industrial processes and fertilizer production [5]. H2 also provides an opportunity to increase the reliability and capacity factor, where it can act as energy storage [2,6]. H2 can be used with gas turbines, integrated power plants and fuel cells for electricity generation [7,8,9]. The most prevalent way of producing H2 is steam methane reforming (SMR) and has been used in industries for decades [10,11]. Recently Digilo et al. [12] proposed gold nanoparticles on poly(2,6-dimethyl-1,4-phenylene oxide) for formic acid dehydrogenation, while Impemba et al. [13] proposed indium oxide–copper(I) oxide–titanium dioxide composites for solar water splitting for H2 production.
Numerous life cycle assessments of net carbon dioxide (CO2) emissions for various H2 production scenarios have been reported. Howarth and Jacobson [14] concluded that SMR with carbon capture and storage (CCS) modestly reduces lifecycle greenhouse-gas emissions compared to SMR process and can still result in higher net CO2 emissions than direct natural gas combustion, largely due to methane leakage rates and high energy requirement for SMR process. Bauer et al. [15] concluded that lower CH4 leakage can significantly lower the carbon footprint for SMR with CCS, and the net emission can potentially be lower than electrolyzer powered by renewable. Additionally, they concluded cost competitiveness of SMR with CCS depends on the expense of mitigating residual emissions and the availability of geological CO2 storage. Patel et al. [16] compared different NG delivery options for H2 production and showed that gaseous NG delivery by pipelines has 20% lower CH4 leakage than liquified NG. The study also highlighted the strong influence of short-lived methane emissions and demonstrated that fossil-based hydrogen pathways remain conditional and assumption-dependent from a climate perspective. Zang et al. [17] carried out a life cycle and cost analysis for H2 production from different NG basins in the USA with lower fugitive CH4 emissions than published global assessments [14,15]. The study underscores that regional gas supply characteristics and energy prices critically affect both economics and net emission, suggesting that CCS deployment is not universally cost-effective. Kolb et al. [18] compared the net emission associated with H2 imports to Germany with domestic H2 production and concluded that shipping of H2 can be a significant contributor to net CO2 emissions. Li et al. [19] optimized SMR CCS configuration with piperazine solvent to reduce the CO2 capture energy penalty by ~36% and lower the cost of H2 by ~20%. Al-Khelaiwi et al. [20] emphasized on SMR-CCS short-term economic advantage depends on underlining the need for CCS infrastructure and low-carbon electricity. Most of these studies focused on global greenhouse gas emissions but neglected regional mitigation strategies.
H2 production is water intensive [21,22,23,24]. Olaitan et al. [22] quantified that the freshwater requirement for H2 production can vary from 9.2 L/kgH2 for electrolysis powered by wind energy to 105 L/kgH2 for H2 generated from coal. Simoes et al. [23] assessed the environmental, social, and financial costs of water used for various H2 production methods. These studies focused on net water requirements and water treatments of impaired water for H2 generation. Shi et al. [24] calculated the net water impacts of solar-powered H2 electrolysis for domestic and cross-border and found these to be greatest for China. However, none of these studies have examined the different water quality requirements for various processes used in H2 production.
The I-WEST region in the USA (which includes New Mexico, Arizona, Colorado, Utah, Montana, and Wyoming) has large NG reserves. The I-WEST region contributes 17.5% of the total energy production of the USA [25], and can become the leading producer of H2 for local usage and export to other regions [1]. While H2 is a clean fuel, the CO2 released from H2 production SMR and fugitive CH4 emissions are significant greenhouse gas sources [14,26]. Integrated CCS is a potential path-forward for reducing the emissions generated from SMR processes [27]. The captured CO2 can also be utilized for enhanced oil recovery with permanent storage, reducing the carbon intensity of oil production by up to 63% compared to conventional methods [28]. CO2 mixes with oil at the molecular level, reducing its viscosity and enhancing displacement and flow through reservoir rocks, thereby enhancing the oil recovery [29,30].
This study performs a detailed regional life cycle analysis for different scenarios for H2 production from NG. These scenarios include H2 production by SMR with and without CCS and SMR with renewables as heat sources with integrated CCS. The sources for fugitive NG losses are identified, and solutions to reduce these emissions are proposed. A detailed process model for the SMR process was developed and validated to estimate the net energy requirement for hydrogen production. In addition, the water quality and quantity for different processes within the H2 production industry are determined. A techno-economic analysis (TEA) is conducted to calculate the cost of H2 production. Finally, based on the NG emissions and water requirements, the net impact on carbon emissions, water requirement and cost resulting from the transition to H2 as a source of energy for meeting the I-WEST electricity, transportation and industrial sectors needs is estimated.
2. Methodology
Here, we briefly discuss various H2 production methods, namely SMR (H2,SMR, grey H2), SMR with carbon capture (H2,SMR+CCS, blue H2), and renewable energy-driven H2 production from NG (blue-green H2). Natural gas can contain sulfur species (e.g., H2S and organosulfur odorants such as mercaptans) at ppm levels. Sulfur is a severe poison for Ni-based steam-reforming catalysts; therefore, commercial SMR facilities include a desulfurization section upstream of the reformer. A typical pretreatment train hydrogenates/hydrodesulfurizes organosulfur compounds to H2S and then removes H2S in a ZnO guard bed (forming ZnS). In this work, we assume desulfurized, pipeline-quality NG at the reformer inlet; hence sulfur species are not included in natural gas composition used in this study.
A detailed analysis of H2,SMR+CCS is conducted to quantitively evaluate its potential in reducing regional carbon dioxide emissions. Finally, we present an initial evaluation of H2 production in the I-WEST region.
2.1. Steam Methane Reforming
SMR is the dominant commercial route for H2 production. In conventional SMR commercial production plants, CO2 generated from a SMR process is released into the environment and the H2 produced is called “grey H2”. The SMR production process generates substantial emissions and it carbon footprints are significantly greater than direct NG burning [14].
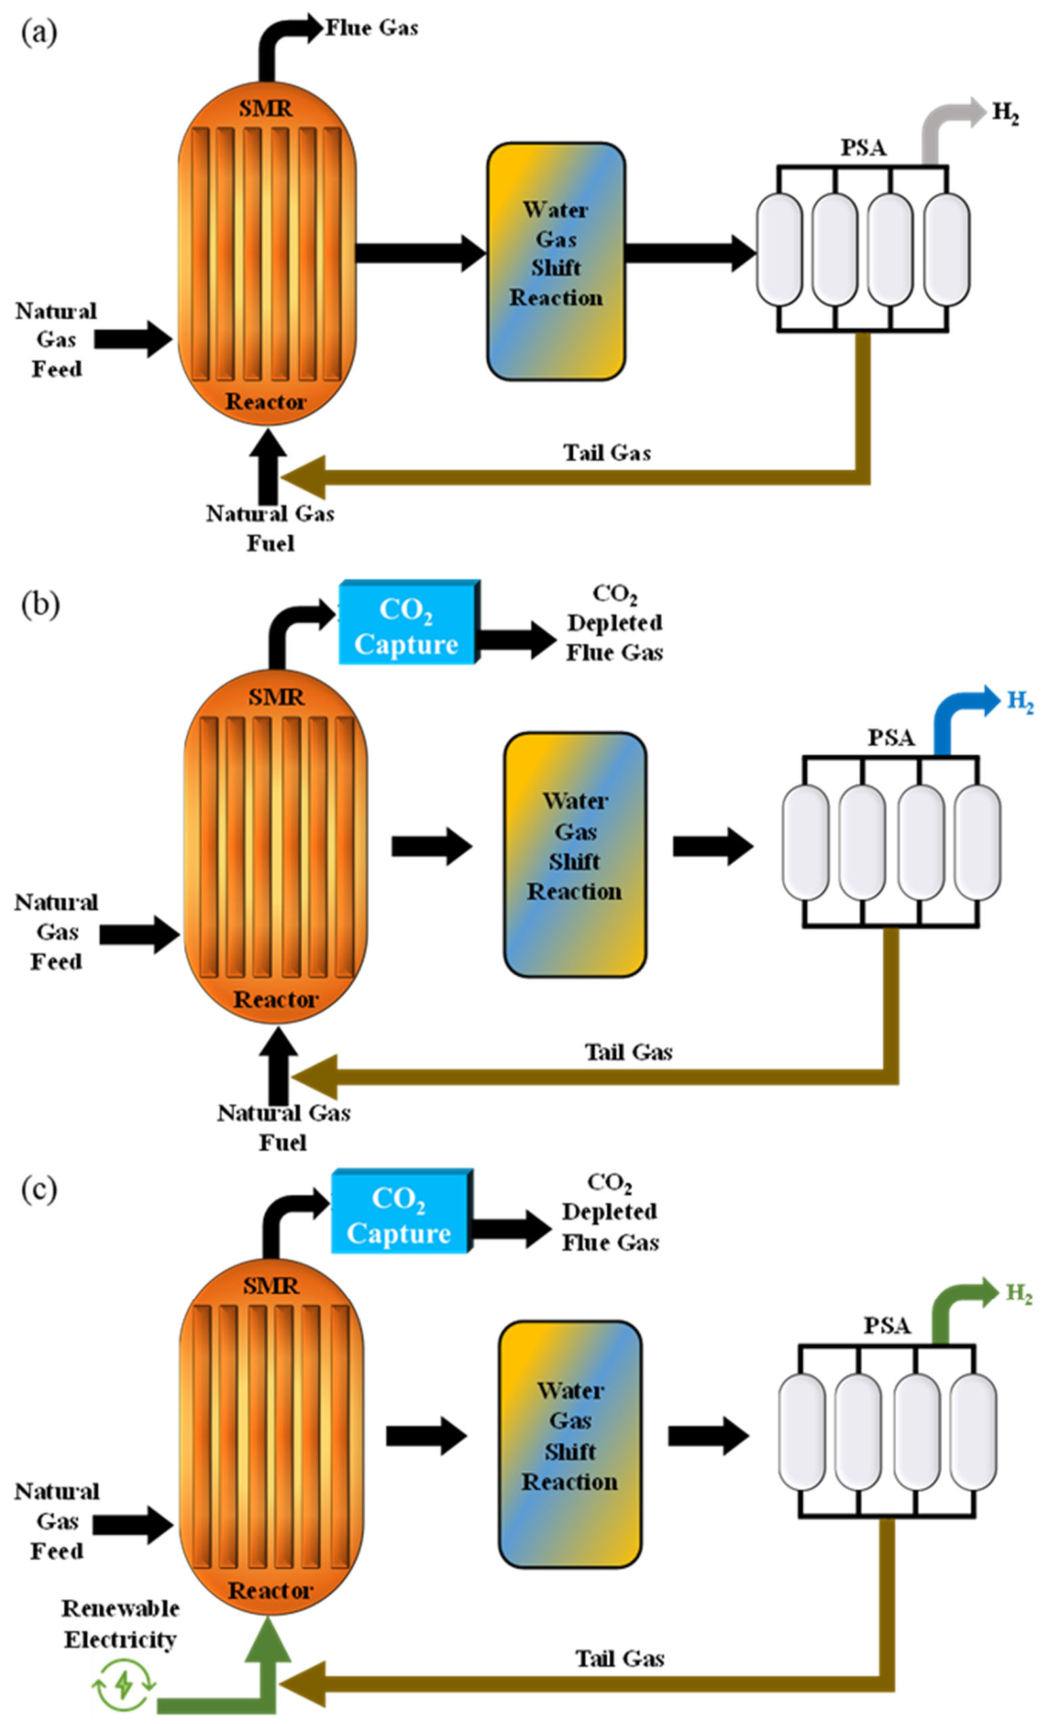
Figure 1a shows the schematic for a traditional SMR process. The NG and steam feed streams are heated to 700–900 °C before flowing into the reformer. The NG is reduced to synthesis gas (syngas):
The resulting syngas product then flows into the water gas shift reactor and here, CO is reacted with more steam to produce more H2:
The resulting residual syngas mixture then flows into the pressure swing adsorber (PSA) for H2 purification greater than 99% H2. The overall reaction can be written as:
Figure 1.
Schematic for different H2 production process methods as a function of carbon capture and energy source: (a) traditional SMR process (grey H2), (b) SMR with carbon capture (blue H2), (c) SMR with carbon capture and energy supplied from renewables (blue-green H2).
Typically, NG is >90% methane (by mass), with heavier hydrocarbons present in low fractions. The typical composition of NG is given in Table S1. The higher hydrocarbons present in NG undergo reforming similar to methane [31], and the reactions are discussed in Supplementary Materials S1.
Xu and Froment [32] developed a kinetic model of the SMR process using a Langmuir-Hinshelwood formulation for heterogeneous catalyst. This model is utilized for predicting the SMR reaction kinetics and assumes methane is the only component of NG. Assuming methane as the most significant component of NG, we therefore use the kinetic model from Xu and Froment [32] as follows:
where , , and represents the adsorption parameters for and respectively. is the dissociative adsorption parameter for . , and represents the equilibrium-based parameters of the reactions. Similarly, , and represents the kinetic constant parameters of the reactions, respectively. , and represents the partial pressures of gas species accordingly. represents a dimensionless parameter.
In this work, Equation (5) is also used to model the reaction kinetics of the water gas shift reactor (WGS) process. The results of this model are validated against the previous WGS models in literature to justify the use of these reaction kinetics for the WGS.
We adopt the modeling assumptions of Marin et al. [33] which assumes an axial dispersed plug flow model across the reaction tube. 1D partial differential equation model which assumes negligible radial heat or mass gradients, Peng-Robinson-Stryjek-Vera equation of state for properties of the gas mixture, and the use of Ergun equation for calculating the pressure drop across the reaction tube. The 1D modeling equations are discussed in Table S2.
The SMR model was validated under isothermal, constant-pressure conditions, showing good agreement with Aspen Plus simulation from Thengane et al. [34], with deviations below 2% across key parameters as shown in Table 1. Methane conversion (64.33%) closely matched Aspen Plus predictions (63.29%), and product compositions showed an average deviation of 1.76%. Similarly, the WGS model exhibited strong agreement with Aspen Plus, with CO conversion differing by only 0.15%. Product compositions had an average deviation of 0.57%, confirming high accuracy for both reactor models.
Table 1.
Validation of SMR and WGS models.
With operating temperature of 850 °C, pressure of 10 bar, steam to carbon ratio of 3, the SMR conversion efficiency is 95%. The reformed NG undergoes the WGS reaction in two stages: at ca. 350 °C and 200 °C. The reformed gas leaving the SMR reactor is at a high temperature (850 °C) and is cooled before flowing to the WGS reactor. The WGS process conversion efficiency is close to 100% [35], where predominantly all CO is converted to CO2 and generates additional H2.
The shifted syngas is cooled to near 40 °C before flowing in the PSA where the H2 is separated. We have used the model proposed by Ribeiro et al. [36], for H2 purification (>99.99% purity) over a layered combination of activated carbon and zeolite. Langmuir isotherm adsorption model was used to compute the average adsorbed concentration of each species () and is given as:
where, is the saturation adsorbed concentration and is the number of sites occupied by the adsorbate [36]. For the feed quality shown by Equation (7), and operating pressure and temperature of 10 bar and 40 °C, the H2 recovery ratio calculated is 78%, very close to typical PSA recovery ratio of 80% () [37].
To calculate the net energy requirements for the system, we used principle of process integration commonly used to calculate the energy requirement for thermal process [38,39,40]. Process integration has been commonly used to calculate the energy requirement for SMR process for H2 production [41,42]. Using similar methodology, we calculated the net energy requirement for hydrogen production. A detailed description is given in Supplementary Materials S1.2.
The flue gas exhaust stream from the SMR process has a high CO2 concentration, nominally 20 wt.%, that can be readily separated using commercial CO2 separation technologies such as a monoethanolamine (MEA) absorber and sequestered [43]. In general, CO2 capture is implemented as post-combustion, pre-combustion, or oxy-fuel/looping schemes, with separation achieved via absorption, adsorption, membranes, cryogenic separation, and looping-based processes [44]. For post-combustion flue gas (dilute CO2 at near-ambient pressure), chemical absorption (amines and advanced solvent formulations) remains the most mature approach, while adsorption-based processes using solid sorbents (e.g., zeolites/amine-functionalized materials) and membrane-based separations are active development areas [45]. For pre-combustion capture (high-pressure, CO2-rich shifted gas), physical solvent systems (e.g., Selexol and Rectisol) are established commercial options, and recent reviews summarize performance and techno-economic considerations for these solvents in hydrogen/syngas applications [45,46].
The H2 produced by this process is known as the blue hydrogen and is abbreviated as SMRCCS [see Figure 1]. We have used the modeling approach proposed by Kim et al. [47] to calculate the thermal energy for carbon capture () and is given as:
where is the sensible heating required across the CO2 stripper, is the energy required for desorption of CO2, is the latent heat needed for evaporating water and is the mass of CO2 captured. From vapor liquid equilibrium for MEA solution, the loading of CO2 in MEA can be calculated as a function of partial pressure of CO2 in the effluent flue gas [48,49]. For a given value of CO2 leading in rich and lean sample, the operating temperature across the stripper can be calculated and similarly the amount of water evaporated can be estimated [47].
Using NG to provide reformer heat duty produces CO2 with additional greenhouse gas emissions due to NG leakage. Using renewables as a source of heat can reduce the carbon footprints. We assessed the use of solar photovoltaics (PV) and wind energy for running an electric SMR [50,51,52], and concentrating solar thermal (CST) as a renewable energy source for the SMR process [53,54]. In an electric SMR, the electrical resistance heating reactor is used to maintain the SMR reactor temperature [52], while heat from CST is transferred to molten salt which is subsequently used for heating the SMR reformer [53]. The renewable energy-integrated SMR process is referred to as SMRCCS+RE.
2.2. Life Cycle Analysis
A cradle-to-grave life cycle analysis (LCA) is performed for H2 production from SMR. Figure 2 shows the overarching process schematic and the system boundary. The process involved in NG-derived H2 production includes extraction, processing, and treatment to produce pipeline-grade natural gas. The process also includes, natural gas compression and transportation, H2 reaction and separation, and H2 compression. In addition, CO2 capture, compression, transportation, and sequestration are also required for H2 production with integrated carbon capture (SMRCCS). The analysis relies on the assumptions listed below in Table 2.
Figure 2.
Process schematic for hydrogen production from NG and system boundaries for the LCA.
Table 2.
Assumption made for carrying out life-cycle analysis [55].
The net CO2 generated for the standalone SMR process includes the net emissions during NG extraction, NG leakage, emissions from the electricity source used for NG and H2 compression, water pumping and treatment, H2 leakage, and CO2 emissions from the SMR and combustion process, which is provided as:
The net emissions from NG and H2 leaks is converted to equivalent CO2 emissions using respective gases GWP (global warming potential). Energy required for gas (NG, H2 and CO2) compression is discussed in Supplementary Materials S2.1. The carbon capture (CC) process requires additional thermal and electrical energy. The thermal energy for carbon capture is supplied via NG combustion and the associated CO2 emissions are also captures. These net emissions are given as:
where f is the fraction of CO2 captured.
2.3. Technoeconomic Analysis
To estimate the cost of H2 produced we have also carried out a techno-economic analysis. The cost H2 () is given as:
where, FCR is fixed charge rate, Ccapital is the total capital cost of the equipment (including indirect, installation and direct capital cost), CNG is the natural gas cost, Celec is the electricity cost, Cwater is the water cost, mNG and mwater is the mass of NG and water used per kg of H2, Ccatlyst is the catalyst cost and CO&L is the operation and labor cost.
3. Results
3.1. Process Modeling Result
The parameters and inputs used for process modeling of the system are listed in Table 3. The SMR conversion is obtained as 95%, while WGS conversion ratio was 99.3% and 99.6% for stage 1 and 2. Figure 3 shows the composite curve for the 1 kg of H2 product. PSA recovery ratio was calculated to 78%. The mass flowrate and the enthalpy values for each stream are listed in Table S5, in Supplementary Materials. Using process integration principle, the net energy required for H2 production comes out to be 23.9 kWhth/kgH2. As can be seen from Figure 3, the heat of hot streams including cooling of SMR syngas, heat from water gas shift reactor and condensate cooling is sufficient to heat the water and NG mixture to 530 °C (inlet temperature for steam and NG into the SMR reactor). The flue gas energy can be utilized for preheating the air, NG and tail gas. By recovering the flue gas energy for pre-heating, it can be cooled to 420 °C. The net cooling required for the SMR and fuel gas is 6.5 kWhth/kgH2.
Table 3.
Input parameters for SMR.
Figure 3.
Composite curve for production of 1 kg of the H2.
The effluent gas leaving the PSA is used as energy source along with additional NG supplied to the combustor unit. The CO2 concentration leaving the combustion chamber is 19.8% by volume for dry gas (while the wet gas CO2 concentration is 16.5%). From vapor liquid equilibria for MEA, the rich loading for MEA is calculated to be 54%. For minimum energy consumption, the lean loading for MEA is 20%. The net energy required for carbon capture is calculated to be 0.96 kWhth/kgCO2. Similarly, we are also trying to capture CO2 generated due to NG burning to supply heat to carbon capture process. The CO2 composition for NG flue gas is around 9% (by volume for dry gas) and the energy required to capture CO2 is 1.02 kWhth/kgCO2.
3.2. Greenhouse Gas Emissions
Figure 4 show the net CO2-equivalent emissions breakdown for H2 production estimated over a 100-year timescale with a GWP of 25.8 for different production scenarios. For H2 production from SMR without carbon capture, the major contributor to CO2 emissions (approximately 63%) is the NG reforming as well as combustion of NG to provide heat for the reformer. NG leaks contribute 21% of the total CO2 emissions, NG extraction contributes 8%, H2 compression is 5% and NG compression is 3%. The other minor contributors are H2 leaks and the electrical energy required for pumping and running the cooling system (<0.1% combined). The net calculated CO2 emission for H2 production using SMR is 16.4 kgCO2/kgH2. It may be noted that hydrogen leakage contributes only 0.5% when a GWP value of 8 is assumed. However, recent literature reports H2 GWP values in the range of 11–12, which would increase the contribution of H2 leakage to approximately 0.7%, while the net CO2 emissions increase by only about 0.2%.
Figure 4.
(a) CO2 net emissions source breakdown for H2 production and (b) calculated net CO2 generation, capture, NG leakage, and net CO2 emissions. Plot of carbon emission and captured CO2. NG losses are fixed at 3.5%, SMR heating requirements of 23.9 kWhth/kgH2, carbon capture efficiency and energy consumption 90% and 0.96 kWhth/kgCO2. To generate 1 kg of H2, SMR, SMRCCS, and SMRCCS+RE need 4, 4.9, and 2.6 kg of NG, respectively. A detailed energy balance for different scenarios is discussed in Supplementary Materials S2.2 and net emissions is discussed in Supplementary Materials S3.
For SMRCCS, NG required increases by 21% in comparison to the SMR base case, to supply more energy for the CO2 capture from the tail gases. Therefore, the CO2 generation increases by 27% [see Figure 4b] relative to SMR without carbon capture. For 90% CO2 capture from the flue gas, around 11.6 kgCO2/kgH2 can be captured and the net CO2 emissions for SMRCCS production reduces to 9.8 kgCO2/kgH2 (around 43% lower than SMR). For SMRCCS the major CO2 emissions contributor is NG leakage (45%, see Figure 4). Therefore, to further reduce the CO2 emissions for SMRCCS, NG usage should be minimized, and leaks should be restricted.
By using renewables, including solar or wind (both in abundance in the Intermountain-West of the U.S.) as the energy source for both the SMR and CO2 capture units, the net CO2 release are lowered by 70% to 5.1 kgCO2/kgH2. Similarly, for SMRCCS+RE the major CO2 emissions contributors are the NG fugitive emissions (51%), followed by NG extraction, H2 compression, and CO2 not captured.
H2 combustion generates 120 MJth of heat per kg, and 2.55 kg of NG is required to generate the same quantity of heat energy. Compared to the SMR processes with or without carbon capture, direct combustion of NG will generate around 12 kgCO2/kgH2-eq. Therefore, carbon capture from SMR gives a marginal reduction in net CO2 emission of 22% compared to direct burning of CO2.
The main drivers of the net CO2 release are the NG leaks and thermal energy required for the reformer. In Supplementary Materials Section S4, a comprehensive sensitivity analysis was conducted to evaluate how key parameters influence the overall CO2 footprints of H2 production. For the SMR-CCS process, methane leakage from the NG supply chain was identified as a critical factor. Reducing the leakage rate from the assumed 3.5% to 1% can lead to a substantial decrease of approximately 50% in CO2-equivalent emissions, highlighting the sensitivity of the system to upstream methane emissions. Similarly, improvements in the efficiency of the conventional SMR process can significantly lower CO2 emissions, with potential reductions of up to 40% compared to baseline scenarios. Furthermore, increasing the carbon capture efficiency within the SMR-CCS system contributes to an additional reduction of around 10% in CO2 emissions, demonstrating the complementary role of capture technology in mitigating the climate impact of blue hydrogen. This analysis underscores that both upstream methane management and process optimization are crucial levers for minimizing the carbon intensity of hydrogen production.
3.3. Regional Hydrogen
Here, we quantitatively assess the benefits of regional H2 production by SMR, SMRCCS, and SMRCCS+RE and compare them with direct NG combustion. As discussed in Section 3.1, NG leaks contribute 21%, 45% and 51% of the CO2-equivalent emissions over a 100-year timescale for SMR, SMRCCS and SMRCCS+RE, respectively. Figure 5 shows the major contributors for NG leakage. Gas compressors account for largest NG leaks (45%). In reciprocating units, leaks occur at the rod-packing system, whereas centrifugal compressors commonly leak from wet seals. Storage and pipeline NG leakage accounts for 27% due to gas diffusion from the valves and pipes. Drilling and extraction account for 28% of the NG emissions, including flared gas and pipeline leakage [70,71].
Figure 5.
Fugitive emissions from natural gas [64,65].
To generate 1 kg of H2, SMR, SMRCCS, and SMRCCS+RE need 4, 4.9, and 3 kg of NG, respectively. From the stoichiometry alone, 1 kg of H2 requires 2 kg of NG. The additional NG is required due to the external energy required for the SMR process. However, due to the incomplete conversion in SMR, lower H2 recovery from the PSA, and energy losses, the NG consumption increases significantly. Due to higher NG requirements, the NG leaks significantly contribute to the net carbon emissions for H2 production.
One possible solution to mitigate NG leaks is regional H2 production plants near abundant gas supplies and fossil reservoirs. Rather than compressing the NG and transporting it to distant SMR facilities, hydrogen can be locally produced via the siting of SMR plants close to NG production sites. It may also facilitate CO2 sequestration due to the proximity of the geological reservoirs and will reduce CO2 transportation costs. Even so, the volumetric energy density of H2 is three times smaller relative to NG (11.5 MJ H2,STP/m3 compared to 35.5 MJ CH4,STP/m3). This increases the pumping-related energy required from 4% for NG to 15% for H2. In addition, as H2 is a much lighter fluid relative to CH4, it is estimated to have 1.3× to 3× more leakage [72]. In our studies, we considered a hydrogen leakage of about 2.5 times of NG. Furthermore, H2 has an indirect global warning potential of 8 over 100 years [72].
Regional H2 production with carbon capture reduces CO2 emissions by 31% compared to non-regional SMRCCS [see Figure 6a]. This reduction is primarily due to NG leakage during compression, as the compression duty in the regional case is minimal because of the lower outlet pressure of 10 bar. In addition, NG transportation is not required, which further reduces NG leakage. Although parasitic H2 leakage increases slightly, the combined effect is a net CO2 emission reduction of 2.9 kg. As a result, siting SMR near NG sites can lower CO2 emissions. Furthermore, due to proximity to NG resources and geological reservoirs, regional H2 production requires a more compact infrastructure, resulting in lower leakage compared to a centralized H2 production approach. Even with a higher GWP of 12 for H2, the net CO2 emissions for regional H2 production with regional SMRCCS are only 1.5% higher compared to a GWP of 8.
Figure 6.
(a) CO2 net emission source breakdown for regional hydrogen production. Plot of carbon emission and captured CO2. NG leakage is fixed at 3.5%, SMR heating energy consumption of 24.1 kWhth/kgH2, carbon capture efficiency of 90%. (b) Net CO2 emissions for regional H2 productions as a function of NG leakage, while the SMR heating energy requirement and carbon capture efficiency are kept constant at 24.1 kWhth/kgH2, and 90%.
3.4. Water Usage
Water is a scarce resource in the I-WEST region that is needed in SMR as a feedstock for cooling and CO2 capture. Here, we evaluate both the quality and quantity needed for our regional H2 economy. Figure 7 shows the water requirements for different H2 generation process schemes per kg H2 production. We note that various processes used in H2 production require different water qualities. For example, SMR and carbon capture units require deionized (DI) quality water. The use of DI water prevents salt deposition on the process equipment. Here, we have used a reverse osmosis (RO) system to generate DI water from potable water sources. Typically, a RO system operates with an 80% recovery ratio, i.e., 80% of the DI water is generated from the potable water source and the rest is rejected as waste [73]. The SMR process needs around 5.7 L of potable water to generate 4.5 L of DI water, which is later utilized for 1 kg H2 production. It may be noted that any unused water leaving the WGS reactor is condensed and recycled. All H2 generation processes require electricity from pumping, water purification, compression, cooling towers, and carbon capture systems. For electricity produced from a natural gas combined cycle (NGCC) power plant, the net potable water required is around 0.74 L/kWhe [74]. Water is predominantly required to cool the power cycle. The net potable water required to supply electrical energy for SMR is 1.8 L/kgH2, and with carbon capture it increases to 2.4 L//kgH2. The renewable energy source needs around 0.4 L/kWhe of potable water for photovoltaic panel cleaning [66,67]. The CST mirror cleaning would require around 0.2 L/kWhth for mirror cleaning. The net potable water required to generate electricity and thermal energy for SMR with carbon capture powered with renewable energy is around 5.5 L/kgH2. NG extraction also requires water and can use impaired water sources like brackish water with salt concentrations up to 5000 ppm. The net water required for NG extraction is 1.8 L/kgH2 for SMRCCS.
Figure 7.
Water requirement for different H2 production processes. The water required for mining, NG extraction and panel cooling are taken from [67,75,76].
It may be noted instead of using potable water, brackish water could also be used as a feed for generating DI water; however, depending on the feed concentration of brackish water the energy demand could be in the range 0.5–2 kWhe/m3 and the recovery ratio will further go down. However, with use of brackish water, the potable water use will reduce to 6.6 and 29 L/kgH2 for SMR and SMRCCS, while the total water usage will increase to 14.4 and 38.5 L/kgH2.
MEA solutions (30% wt.) demand DI water, while cooling (including flue gas and MEA cooling) requires potable water. The flue gas leaving the carbon capture unit carries MEA that needs to be washed (dissolved) in water [55,56]. Since brackish water contains only salt, it can be used to remove MEA from flue gas during the MEA washout. The SMRCCS process requires an additional 22.4 L/kgH2 of potable water for the carbon capture process and 1.2 L/kgH2 of brackish water for the MEA washout.
The total potable water required for the SMRCCS is 44.8 L/kgH2. In comparison, the H2 generated from water electrolysis powered with photovoltaics would need around 35.8 L/kgH2 of potable water.
It is worth noting that I-WEST is an oil and gas producer, has massive produced and brackish water resources [77]. However, potable water can be scarce. In the carbon capture and power cycle, cooling is the major contributor to the net potable water demand. Supplementary Materials S5 shows the results for the use of the produced water or brackish water as cooling water sources. The net potable water demand can be reduced to 5.9 L/kgH2 for SMR with carbon capture and regional SMR with carbon capture [see Figure S4]. Note that the pumping power required for the system will increase due to a significant increase in the produced water demand for once through cooling. The overall increase in net CO2 emissions is around 3.3% for regional H2 with carbon capture.
The other approach to reduce the cooling water demand is using an air cooler for cooling the power cycle, carbon capture unit and SMR process cooling. The net effect is a reduction in total water consumption to 8.9 and 9 L/kgH2 for SMRCCS, and regional SMRCCS, respectively [see Figure S5] while the net potable water demand reduces to 5.9 L/kgH2. Compared to the electrolysis process, the net potable water demand for regional H2 production reduces by 81% with air cooling. With air cooling, the electricity requirement increases slightly for H2 production, resulting in a net increase in net CO2 emissions by 3.1%, while the net water requirement can be reduced by 84.4%.
Thermal management and cooling represent major challenges in hydrogen energy systems due to their high energy and water requirements. These challenges arise not only during hydrogen production but also in end-use technologies such as fuel cells, where effective heat dissipation is critical for performance. Recent advances in thermal management solutions, such as novel liquid-cooled plate designs, have shown potential to improve efficiency while reducing the overall cooling burden [78].
3.5. Techno-Economic Analysis Results
Table 4 lists the input parameters used for TEA. Figure 8a shows the production cost for different H2 processes. The H2 cost is cheapest for standalone SMR and is 1.73 $/kgH2. The major cost is the cost of NG, followed by capital cost, O&M cost and electricity cost. Water and catalyst cost are marginal. With carbon capture the capital cost almost doubles, resulting to increase in H2 cost to 2.9 $/kgH2. For SMR powered with renewable energy, the lower capacity factor increases the capital cost, and the price increases to 3.22 $/kgH2. Regional H2 cost is slightly cheaper compared to SMRCC due to lower electricity consumption. If the CO2 sequestration credit of 85 $/tonneCO2 is included, the cost of H2 reduces to 1.88, 2.6 and 1.79 $/kgH2 for SMRCC, SMR powered with renewable and regional H2. With air cooler, the regional H2 will increase merely by 0.4%.
Table 4.
Input parameters for TEA.
Figure 8.
(a) H2 production cost bifurcation, (b) Effect of CO2 tax credit on H2 production cost.
4. Case Study
We have considered the case study of the I-WEST region, situated on the rocky mountain range and contributing 17.5% of the total energy production in the USA [25], for decarbonizing regional transportation, electricity generation and fuel production.
4.1. Transportation
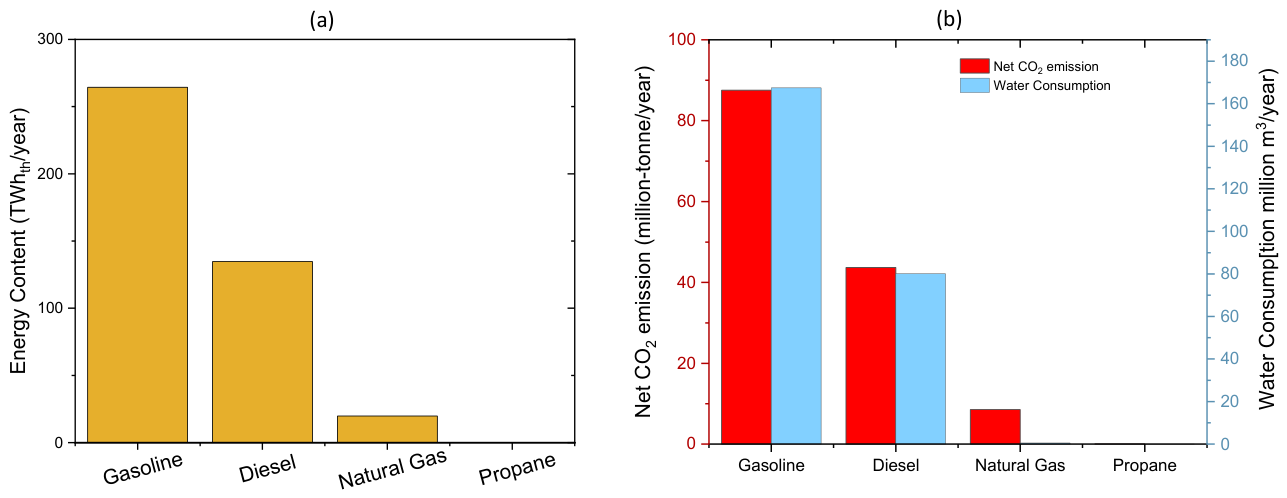
The primary drivers of transportation energy in I-WEST include gasoline (63%) and diesel (32.2%), with a total net energy content of ca. 419 TWhth/year [see Figure 9a] [84]. The major contributor to transportation in I-WEST is Arizona, followed by Colorado, Utah, New Mexico, Wyoming, and Montana, and is 32%, 23.4%, 15.2%, 14.8%, 7.6% and 7.1%, respectively. The net CO2 emissions from the transportation sector are 139.86 million-tonne/year [see Figure 9b]. The overall water usage for the total fuel production is 248 million m3/year, of which 67.5% is required by gasoline and 32.3% by diesel. NG-specific water consumption is 90% lower than gasoline and diesel [see Figure 9b].
Figure 9.
(a) Net energy content, (b) CO2 emissions and overall water use to produce hydrocarbon fuel for transportation in the I-WEST [75,84,85]. The net CO2 emissions for gasoline, diesel are 4.1 kgCO2/kggasoline and 4.08 kgCO2/kgdiesel, respectively [86], while for NG is 5.7 kgCO2/kgNG [calculated from Figure 4]. Water consumption for extraction and processing of: gasoline is 0.65 and 5 L/Lgasoline [75,87], diesel is 0.3 and 5 L/Ldiesel [75,87], and NG is 0.004 and 0.34 L/kgNG [56].
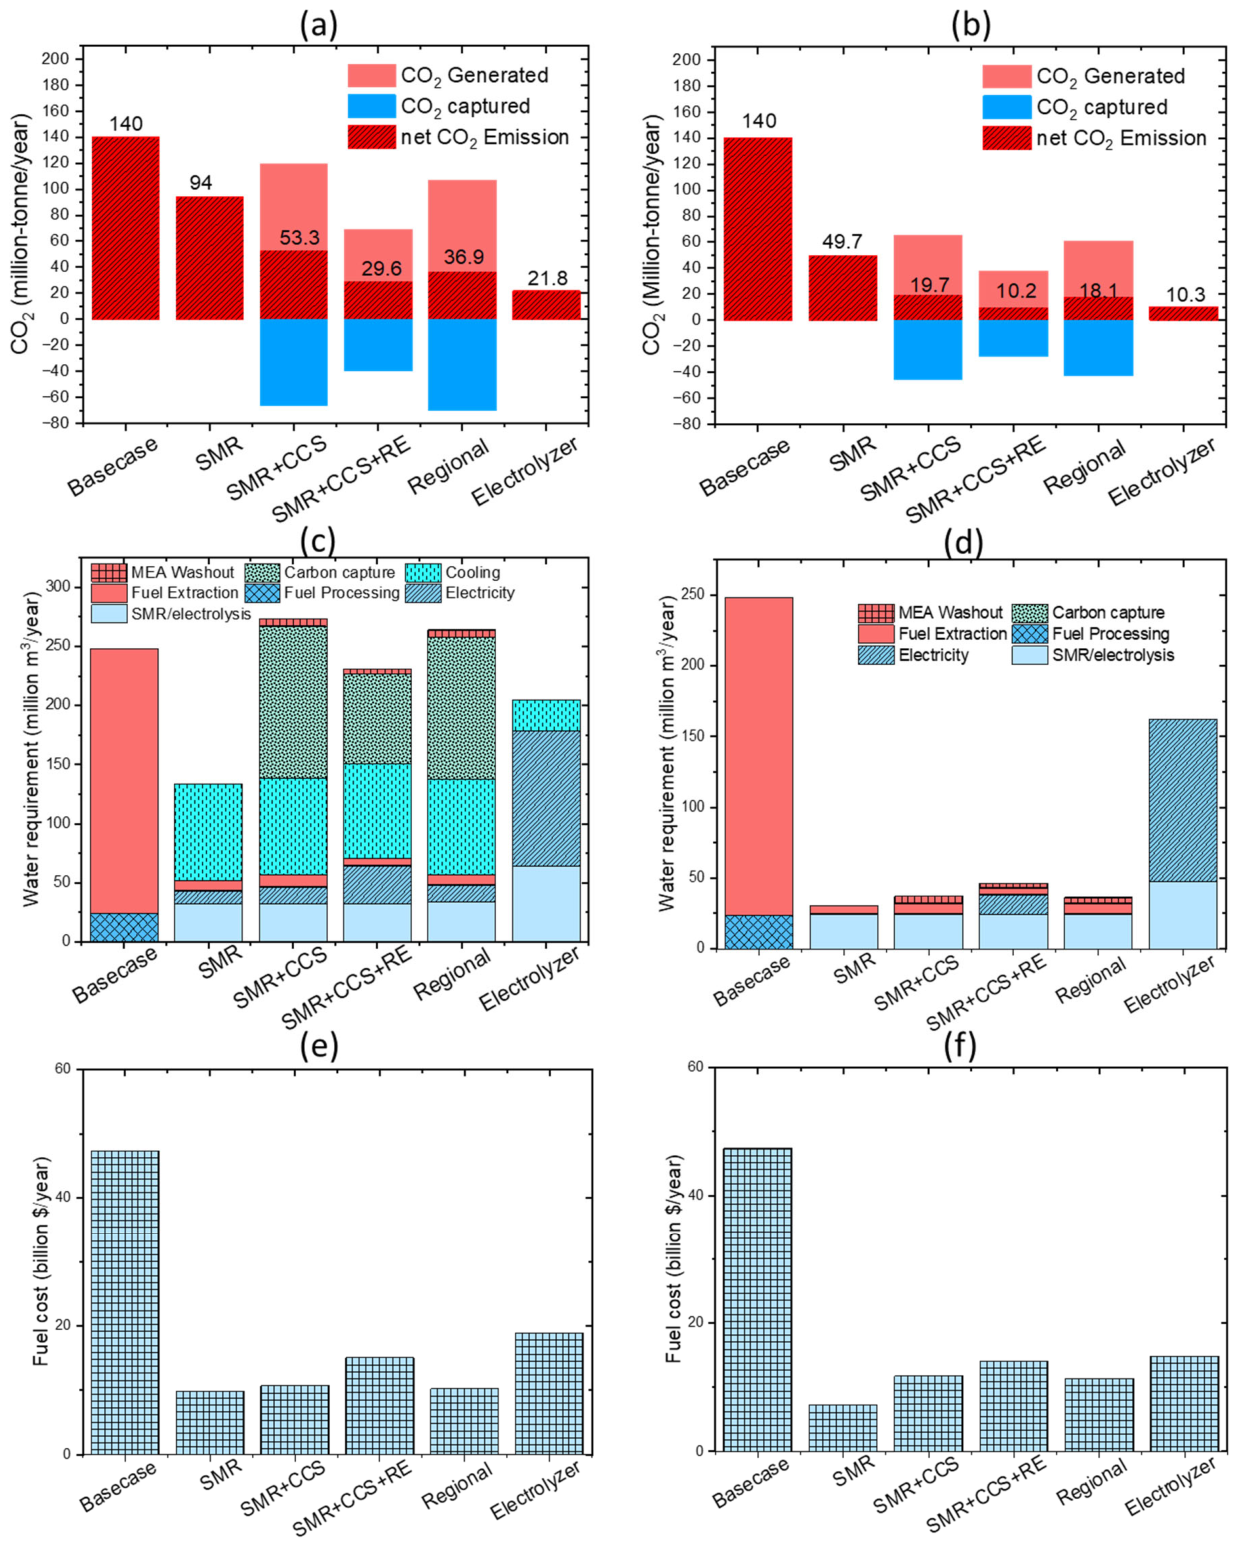
We can reduce the net CO2 emissions by displacing gasoline and diesel combustion in transportation with H2 fuel cells. The conversion efficiency for internal combustion engines using gasoline is only 19%, diesel is 31% and NG is 17% [88] while the H2 fuel cell efficiency varies from 40% to 60% [89]. Supposing a mean efficiency of about 50% for an H2 fuel cell vehicle, the overall H2 required for the transportation demand is 5.72 million-tonne/year. The effect of shifting away from hydrocarbon fuels to H2 fuel cells is shown in Figure 10a. For the current scenario with 3.5% NG leaks, replacing the existing hydrocarbon fuel source with H2,SMR+CCS could lower the CO2 emissions by 56%, while regional H2,SMR+CCS could lower the net CO2 emissions by 71%. While transitioning to H2 fuel-cell vehicles with H2 generated from SMRCCS the net water requirement increases by 10% to 274 million m3/year relative to current water demand for the transportation sector. Water electrolysis powered with RE has a net water requirement of 230 million m3/year [Figure 10c]. In addition to the total water requirement, the water quality is also a key parameter since electrolysis and SMR need deionized water, and is generated by the reverse osmosis of freshwater (<500 ppm total dissolved salts, TDS) with 80% recovery. For mining and NG extraction, brackish water (<5000 ppm, TDS) can be used. Moving towards H2,SMR+CCS, and regional H2,SMR+CCS for transportation with the current state of the art will help in reducing the CO2 emissions by 62–74%, while the water requirement is almost the same. Transitioning from hydrocarbon to H2 fuel source is significantly cheaper, with a potential saving in fueling cost by 75% with regional H2 [Figure 10e]. Similarly with use of H2 generated from electrolysis the net reduction in fuel cost is 60%. For current scenario, CO2 sequestration credit of 85 $/tonCO2 is assumed while for electrolyzer a credit of 3 $/kgH2 is used. For a current cost of H2 from electrolyzer is around 6.3 $/kgH2, and with H2 credit it reduces to 3.3 $/kgH2.
In the second example, we evaluate a futuristic case of SMR-H2 process where the NG leak is decreased to 1%, which is justified by compact infrastructure with increased efficiency of the SMR process. Since the leading driver of NG emissions are leaks, a potential solution is placing the compressors inside boxes to capture all the leaked NG for use as an energy source for compressor pumping. Efforts are also being utilized for lowering emissions using advanced natural gas storage designs with pipeline materials selection. Deploying these advanced designs with process intensification will reduce the energy required in the SMR to 10.4 kWhth/kgH2 [see Figure S2 for details]. These cutting edge improvements can also increate capture efficiency to 97% and potential future increases of efficiency to 60% of H2 fuel cell vehicles [89]. By utilizing the advanced SMR-H2 process, the transition to H2,SMR+CCS, and regional H2,SMR+CCS, can further reduce the net CO2 emission by 86%, and 87% respectively [see Figure 10b]. In addition, the overall water required can also reduce [Figure 10d]. Therefore, H2,SMR+CCS, and regional H2,SMR+CCS can be critical in reducing the net CO2 emissions provided technological advancements reduce both CH4 leakage and SMR energy consumption. To reduce the water requirement, air cooling is used and with an optimized SMR process, the net water requirement can be reduced by 85%, for both H2,SMR+CCS, and regional H2,SMR+CCS. The net saving in fueling cost is around 78% regional H2 and 68% with electrolyzer. For future scenarios the cost of H2 for SMR, SMR+CCS, SMR+RE, regional SMR+CC and electrolyzer is calculated to be 1.5, 2.5, 3, 2.4 and 3.1 $/kgH2. For future scenarios the carbon credit and hydrogen credit are not considered.
It may be noted that constant average efficiency of 50% and 60% for hydrogen fuel cell vehicles for current and future scenario provides a transparent basis for system-level comparison. In real-world operation, vehicle efficiency is dynamic and incorporating real-time traffic information into energy management frameworks can further enhance vehicle efficiency [90].
Figure 10.
Role of H2,SMR+CCS, H2,SMR+CCS+RE and regional H2,SMR+CCS in decarbonizing the transportation sector for I-WEST for (a,b) present and future scenario, (c,d) the net water consumption for use of H2 for transportation and (e,f) fuel cost incurred with different H2 for present and future scenario. For current scenario (NG leak of 3.5%, heating energy of 24.1 kWh/kg, carbon capture efficiency of 90%, fuel cell efficiency of 50%, electrolysis energy requirement of 50 kWhe/kgH2 [91] and electrolysis net CO2 emissions of 3.8 kgCO2/kgH2 [92]). For future H2 production (NG leak of 1%, heating energy of 10.3 kWh/kgH2, carbon capture efficiency of 97%, fuel cell efficiency of 60% and electrolysis energy requirement of 25 kWhe/kgH2 [91] and net CO2 emissions of 1.8 kgCO2/kgH2 [92]). Note that SMR/electrolysis, cooling, processing, and cleaning require freshwater with <500 ppm salt concentration, while mining and MEA washout could utilize brackish water with <5000 ppm salt concentration.
It also may be noted that currently over 80% of the world CO2 injection is taking place in Permian basin, located in New Mexico and Texas [93]. Just of the many oil and gas operators are currently storing around 6.5 million-tons of CO2 per year. The CO2 captured from transportation sector can be used directly for enhanced oil recovery in Permian basin [93].
4.2. Electricity Generation
Figure 11a shows electricity requirement for the I-WEST region, indicating a yearly production of 315 TWhe. Coal accounts for 37.7% contribution, NG power plant is 12.7%, NGCC is 12.7%, wind energy 13.5%, nuclear energy 10.1%, hydro energy 6.1%, solar energy is 4.5%, along with modest contributions from petroleum, geothermal and biomass (combined for 0.7%) is also included. The net annual CO2 emissions from electricity plants is 171 million tons/year, see Figure 11b. Due to the lower efficiency of a coal power plant (33%), the net CO2 emissions are highest at 69.6%. NGCC contributes 17.5%, while the NGCC contributes 10.7% of the total CO2 emissions. The net water required for electricity generation is 766 million m3/year [see Figure 11b]. Due to the evaporation of water from the surface of the reservoir surface, hydropower contributes 42% of the total water use, followed by coal 36%, nuclear at 9.6%, NG at 6.4%, and NGCC at 3.9%.
Figure 11.
(a) Net electricity production and (b) net CO2 emissions and water requirements for different energy sources in the I-WEST. The specific CO2 emissions from coal, petroleum, NG, NGCC, hydropower, solar PV, wind, nuclear, geothermal and biomass are assumed to be 1000, 735, 453, 647, 20, 25, 122 and 300 kg/MWhe, respectively [56,60,94,95,96,97,98]. The net water usage of a coal power plant is 250 L/tonnecoal for coal mining [99] and 2250 L/kWhe electricity production [100], petroleum requires 0.65 and 5 L/LPetroleum for processing and extraction [75,87] while petroleum power cycle cooling requires 1060 L/MWhe (updated from [56]), NG and NGCC require 954 and 654 L/MWhe (updated from [56]), hydropower requires 16,850 L/kWhe [100], photovoltaic requires 400 L/MWhe for panel cleaning, [66,67], nuclear power requires 137, 294 and 1875 L/MWhe (for mining, fuel processing and cooling) [101], geothermal requires 1730 L/MWhe [100], and biomass requires 2075 L/MWhe [100].
Figure 12a illustrates the potential pathways towards lowering the CO2 emissions from electric power generation in the I-WEST. The first potential pathway involves replacing the entire coal-fired units, NG units, and remaining hydrocarbon plants with a NGCC. With the NGCC operating at peak efficiencies (60%), net CO2 emissions could be lowered by 45% (based on a mean NG leakage of 3.5%), while the net water requirement is reduced by 27% [Figure 10c]. Another approach can be blending the NG with 30% H2 (by volume) [102,103], as the current NGCC operation is limited to 30% H2. By blending with 30% regional H2,SMR+CCS while running it as a combined cycle, can reduce the CO2 emissions by 45%. Similarly, the water requirement reduces by 23.6%, with blended 30% regional H2,SMR+CCS. It may be noted that the potential benefit of 30% H2 blending with NG is marginal, and it is better to replace all hydrocarbon power production with NGCC. In addition, the cost of electricity generation also increases marginally due to use of H2 [see Figure 10e].
Figure 12.
Role of blending 30% by volume H2,SMR+CCS, H2,SMR+CCS+RE and regional H2,SMR+CCS in decarbonizing the electricity sector for I-WEST for (a,b) present and future scenario, (c,d) the net water consumption for use of H2 for transportation and (e,f) electricity cost different H2 as energy source for present and future scenario. For current scenario (NG leak of 3.5%, heating energy of 24.1 kWh/kg, carbon capture efficiency of 90% and fuel cell efficiency of 50%). For future H2 production (NG leak of 1%, heating energy of 10.3 kWh/kgH2, carbon capture efficiency of 97% and fuel cell efficiency of 60%). Note that SMR/electrolysis, cooling, processing, and cleaning require freshwater with <500 ppm salt concentration, while mining and MEA washout could utilize brackish water with <5000 ppm salt concentration.
As emerging high-efficiency turbines advances, NGCC might be able to operate with 100% H2 [104]. Moreover, with less NG leaks, energy-efficient SMR, with improved carbon capture, the net CO2 emissions can be lowered by 77% with regional H2,SMR+CCS [see Figure 10b]. With the use of 100% pure H2,SMR+CCS the amount of carbon capture increases to 100 million-tonne/year. Also, air cooling can reduce the cooling water requirements to zero, thereby the net water requirements can be reduced by 45% for regional H2,SMR+CCS [see Figure 10d]. The major contributor to water requirements is hydropower, requiring around 324 million m3/year of freshwater. However, with use of regional H2, the cost of electricity generation increases by 73%, and this is predominantly due to higher H2 cost compared to NG [see Figure 10f].
4.3. Hydrogen Replacement Fuel for Natural Gas in the I-WEST Region
Figure 13a illustrate the overall natural gas capacity in the I-WEST region is about 1894 TWhth/year [25], corresponding to 143 million tons/year of NG. In the I-WEST region, New Mexico is the major contributor to NG production at 40.2%. It may be noted that Arizona does not produce NG. If we have to convert all the NG to regional H2,SMR+CCS, around 30 million-tonne/year of H2 can be produced [see Figure 13b], (for current SMR with 3.5% NG leak). However, for the future scenario (1% NG leak), 40 million-tons/year of regional H2,SMR+CCS can be produced respectively. Notably, net H2 production varies significantly as the net NG demand varies with H2 process [see Section 3.3].
Figure 13.
(a) annual NG output, (b) estimated H2 output based on yearly NG production for near-term and long-term scenarios, (c) impact on CO2 emissions during the shift from NG to hydrogen in the near-term (d) long-term scenario, and (e) net water demand to transition towards different hydrogen production based on the current scenario and (f) future scenario. The current scenario assumes 3.5% NG leak, 24.1 kWhth/kgH2 SMR heating required with a CO2 capture efficiency of 90%). The future scenario assumes 1% NG leak, 10.3 kWhth/kgH2 heating required with a CO2 capture efficiency of 97%. It may be noted MEA washout and fuel extraction require brackish quality water with total salt concertation <5000 ppm, while the process, cooling and carbon capture require fresh water with salt concentration <500 ppm.
Figure 13c,d show the net CO2 generated while producing H2 from NG. For the base case of NG production with a 3.5% NG leak, the net CO2 emissions is 676 million-tonne/year. With H2,SMR+CCS+RE and regional H2,SMR+CCS can help in reducing the CO2 emissions by 63%, and 70%, respectively. Notably, the net reduction in CO2 emissions with H2,SMR+CCS+RE is lower due to the 60% higher H2 production than regional H2,SMR+CCS. With a future scenario of 1% NG leak, the net reduction in CO2 emission can be 73% for regional H2,SMR+CCS.
Figure 13e,f show the water use for different cases under a base case of 105 million m3/year. The net rise in overall water use in comparison with the base case is by a factor of 19 and 14 for H2,SMR+CCS+RE, and regional H2,SMR+CCS, respectively. As already explained, the major contributor to water demand is cooling water, which is required for electricity, systems, and carbon capture. Using an air cooler, for future scenarios, net water demand can be reduced by 70% compared to the current scenario [see Figure 13f].
5. Conclusions
Our life cycle analysis demonstrates that regional H2 can be important in decarbonizing the energy sector of the I-WEST region. Numerous studies presented in the literature have compared different hydrogen production scenarios from a large-scale perspective and neglected the advantages of regional resource availability. Our study quantifies the primary drivers of carbon footprints when making hydrogen. Although NG leaks remain the dominant factor in adopting H2 energy, the other dominant factor is still the specific energy usage for H2 processes.
To highlight the practical relevance of H2 in achieving a low-emissions energy sector, we have considered substituting fossil fuels currently used in the transportation and electrical power generation sectors with H2 in the I-WEST region. I-WEST transportation contributes to 140 million-tons/year of CO2 and requires 248 million m3/year of water. For the base case scenario, the regional H2 with carbon management can lower the overall CO2 emissions by 74%, and the fuel cost for transportation can be reduced by 76%. Replacing all fossil fuel powered electricity production with the natural gas combined cycle can reduce CO2 emissions by 45%. However, H2 blending with natural gas does not give a significant improvement in CO2 reduction relative to converting all NG to NGCC plants. However, future scenarios using 100% hydrogen for electricity generation can result in an 77% reduction in CO2 emissions, but the electricity cost will increase by 73%. Using regional H2 in the I-WEST transportation and electricity sectors can potentially reduce the net CO2 emission by 87%, and water consumption by 55% in the future. However, this would need a 50.5% increase in natural gas production.
Making hydrogen requires substantial amounts of water, especially when potable water is the source. Future research will focus on developing an adoption curve for these H2 production technologies. In addition, other H2 production processes, including autothermal reforming, partial oxidation, biomass reforming, and electrolysis, will be assessed in detail, together with the industry standard SMR process.
Our future work will focus on dynamic modeling with detailed control schemes to optimize hydrogen production. Additionally, we plan to extend the current analysis of transportation to supply-chain models that incorporate dynamic, traffic-informed vehicle energy management strategies.
Supplementary Materials
The following supporting information can be downloaded at: https://www.mdpi.com/article/10.3390/cleantechnol8030077/s1. Figure S1. Composite curve for steam methane reformer process; Figure S2. Composite curve for steam methane reformer process with pinch temperature of 10 °C; Figure S3. (a) Net CO2 emission as a function of NG leakage while the SMR energy requirement, carbon capture efficiency and heating energy requirement are kept constant at 24.1 kWhth/kgH2 and 90%. (b) Net CO2 emission as a function of SMR energy requirement, while the NG leakage and carbon capture efficiency are kept constant at 3.5% and 90%. (c) Net CO2 emission as a function of carbon capture efficiency and NG leak, while the SMR heating energy requirement is kept constant at 24.1 kWhth/kgH2 and (d) Comparison between the performance of H2,SMR+CCS and H2,SMR+CCS+RE powered with different renewable energy including solar photovoltaics, wind energy, concentrating solar thermal and battery powered Renewable energy. NG leak, carbon capture efficiency and energy requirement are kept constant at 3.5%, and 90%; Figure S4. Water requirement for different H2 production process, with cooling water supplied from produced water; Figure S5. Water requirement for different H2 production process, with air cooling for electricity, SMR and carbon capture; Table S1. Typical pipeline composition of NG flowing through an interstate pipeline; Table S2. Mass, energy, and momentum balance equations of the SMR and WGS models; Table S3. Global warming potential for different constituent of natural gas; Table S3. Global warming potential for different constituent of natural gas; Table S4. Compressor energy required for natural gas; Table S5. Stream flow data for the SMR process; Table S6. Net energy consumption for H2 production; Table S7. Net energy consumption for H2 production with optimized scenario; Table S8. Life cycle analysis for H2 production for 3.5% NG leak, 1% H2 leak from compressor while the SMR energy heating energy requirement of 24.1 kWhth/kgH2; Table S9. Operating parameters for different renewable energy sources. References [41,55,60,61,63,70,71,77,105,106,107,108,109,110] are cited in the Supplementary Materials.
Author Contributions
Conceptualization, P.S.; Methodology, P.S. and L.E.Y.; Software, P.S.; Validation, L.E.Y.; Formal analysis, P.S. and M.H.; Investigation, H.T.; Writing – original draft, P.S. and L.E.Y.; Writing – review & editing, M.D., H.T., M.M., T.S., M.H. and R.S.; Supervision, M.D., T.S. and R.S.; Funding acquisition, M.D. and R.S. All authors have read and agreed to the published version of the manuscript.
Funding
This work was supported by the Los Alamos National Laboratory Technology Evaluation and Demonstration fund & the Laboratory Directed Research and Development program (WC3N00-22BLH2LC).
Data Availability Statement
The original contributions presented in this study are included in the article/Supplementary Materials. Further inquiries can be directed to the corresponding author.
Acknowledgments
We would also like to thank Duncan Mcbranch (Los Alamos National Laboratory), and Geroge Guthrie (Los Alamos National Laboratory) for their continuous feedback during the project.
Conflicts of Interest
The authors declare no conflict of interest.
Nomenclature
| a | Site occupied by the adsorbate in PSA |
| Gas mixture heat capacity | |
| Concentration of gas component | |
| CCS | Carbon capture and sequestration |
| CH4 | Methane |
| C2H6 | Ethane |
| C3H8 | Propane |
| C4H10 | Butane |
| CO | Carbon Monoxide |
| CO2 | Carbon Dioxide |
| DI | Deionized |
| Axial mass dispersion constant | |
| Particle diameter | |
| Energy required | |
| Isentropic enthalpy | |
| Inlet enthalpy | |
| H2O | Water |
| I-WEST | Intermountain West USA |
| H2 | Hydrogen |
| Mass flowrate | |
| MEA | Monoethanolamine |
| N2 | Nitrogen |
| NG | Natural gas |
| NGCC | Natural gas combined cycle |
| q | Saturation concentration |
| Q | Heat transferred |
| PSA | Pressure swing adsorption |
| P | Pressure |
| RE | Renewable Energy |
| RO | Reverse osmosis |
| Reaction rate of reaction | |
| S | Steam to methane ratio |
| SMR | Steam Methane reforming |
| T | Temperature |
| Wall temperature | |
| Time | |
| TEA | Techno-economic Analysis |
| Interstitial velocity | |
| Solid thermal conductivity | |
| Compressor work | |
| WGS | Water gas shift |
| x | SMR conversion efficiency |
| Isentropic efficiency of compressor | |
| Reactor axial length | |
| Bed porosity | |
| Catalyst density | |
| Gas mixture density | |
| Stoichiometry coefficient of reaction component | |
| Effectiveness factor of reaction | |
| Effectiveness thermal conductivity | |
| Heat of reaction | |
| Gas mixture viscosity |
References
- Chen, F.; Ma, Z.; Nasrabadi, H.; Chen, B.; Mehana, M.Z.S.; Van Wijk, J. Capacity assessment and cost analysis of geologic storage of hydrogen: A case study in Intermountain-West Region USA. Int. J. Hydrogen Energy 2023, 48, 9008–9022. [Google Scholar] [CrossRef] [Scilit]
- Erdener, B.C.; Sergi, B.; Guerra, O.J.; Chueca, A.L.; Pambour, K.; Brancucci, C.; Hodge, B.M. A review of technical and regulatory limits for hydrogen blending in natural gas pipelines. Int. J. Hydrogen Energy 2023, 48, 5595–5617. [Google Scholar] [CrossRef] [Scilit]
- Dawood, F.; Anda, M.; Shafiullah, G.M. Hydrogen production for energy: An overview. Int. J. Hydrogen Energy 2020, 45, 3847–3869. [Google Scholar] [CrossRef] [Scilit]
- Ajanovic, A.; Sayer, M.; Haas, R. The economics and the environmental benignity of different colors of hydrogen. Int. J. Hydrogen Energy 2022, 47, 24136–24154. [Google Scholar] [CrossRef] [Scilit]
- Epstein, P. Hydrogens Present and Future in the us Energy Sector, New York. 2021. Available online: https://www.aoshearman.com/en/insights/hydrogens-present-and-future-in-the-us-energy-sector (accessed on 24 April 2024).
- Turner, J.A. A Realizable Renewable Energy Future. Science 1999, 285, 687–689. [Google Scholar] [CrossRef] [Scilit]
- Meziane, S.; Bentebbiche, A. Numerical study of blended fuel natural gas-hydrogen combustion in rich/quench/lean combustor of a micro gas turbine. Int. J. Hydrogen Energy 2019, 44, 15610–15621. [Google Scholar] [CrossRef] [Scilit]
- Pocha, C.K.R.; Chia, W.Y.; Silvanir; Kurniawan, T.A.; Khoo, K.S.; Chew, K.W. Thermochemical conversion of different biomass feedstocks into hydrogen for power plant electricity generation. Fuel 2023, 340, 127472. [Google Scholar] [CrossRef] [Scilit]
- Welder, L.; Stenzel, P.; Ebersbach, N.; Markewitz, P.; Robinius, M.; Emonts, B.; Stolten, D. Design and evaluation of hydrogen electricity reconversion pathways in national energy systems using spatially and temporally resolved energy system optimization. Int. J. Hydrogen Energy 2019, 44, 9594–9607. [Google Scholar] [CrossRef] [Scilit]
- Zhang, Y.; Cheng, X.; Zhao, J.; Yang, F.; Cheng, F. Effect of Particle Size on Simultaneous Calcination and Sulfation of Limestone. Int. J. Energy A Clean. Environ. 2023, 24, 163–175. [Google Scholar] [CrossRef] [Scilit]
- Zapantis, A. Blue Hydrogen, n.d. Available online: https://www.globalccsinstitute.com/wp-content/uploads/2021/04/Circular-Carbon-Economy-series-Blue-Hydrogen.pdf (accessed on 2 April 2024).
- Diglio, M.; Contento, I.; Impemba, S.; Berretti, E.; Della Sala, P.; Oliva, G.; Naddeo, V.; Caporali, S.; Primo, A.; Talotta, C.; et al. Hydrogen production from formic acid decomposition promoted by gold nanoparticles supported on a porous polymer matrix. Energy Fuels 2025, 39, 14320–14329. [Google Scholar] [CrossRef] [Scilit]
- Impemba, S.; Provinciali, G.; Filippi, J.; Caporali, S.; Muzzi, B.; Casini, A.; Caporali, M. Tightly Interfaced Cu2O with In2O3 to Promote Hydrogen Evolution in Presence of Biomass-Derived Alcohols. ChemNanoMat 2024, 10, e202400459. [Google Scholar] [CrossRef] [Scilit]
- Howarth, R.W.; Jacobson, M.Z. How green is blue hydrogen? Energy Sci. Eng. 2021, 9, 1676–1687. [Google Scholar] [CrossRef] [Scilit]
- Bauer, C.; Treyer, K.; Antonini, C.; Bergerson, J.; Gazzani, M.; Gencer, E.; Gibbins, J.; Mazzotti, M.; McCoy, S.T.; McKenna, R.; et al. On the climate impacts of blue hydrogen production. Sustain. Energy Fuels 2022, 6, 66–75. [Google Scholar] [CrossRef] [Scilit]
- Patel, G.H.; Havukainen, J.; Horttanainen, M.; Soukka, R.; Tuomaala, M. Climate change performance of hydrogen production based on life cycle assessment. Green. Chem. 2024, 26, 992–1006. [Google Scholar] [CrossRef] [Scilit]
- Zang, G.; Graham, E.J.; Mallapragada, D. H2 production through natural gas reforming and carbon capture: A techno-economic and life cycle analysis comparison. Int. J. Hydrogen Energy 2024, 49, 1288–1303. [Google Scholar] [CrossRef] [Scilit]
- Kolb, S.; Müller, J.; Luna-Jaspe, N.; Karl, J. Renewable hydrogen imports for the German energy transition—A comparative life cycle assessment. J. Clean. Prod. 2022, 373, 133289. [Google Scholar] [CrossRef] [Scilit]
- Li, Y.; Ren, J.; Ma, H.; Campbell, A.N. Technical and economic performance assessment of blue hydrogen production using new configuration through modelling and simulation. Int. J. Greenh. Gas. Control 2024, 134, 104112. [Google Scholar] [CrossRef] [Scilit]
- Mehmeti, A.; Angelis-Dimakis, A.; Arampatzis, G.; McPhail, S.J.; Ulgiati, S. Life cycle assessment and water footprint of hydrogen production methods: From conventional to emerging technologies. Environments 2018, 5, 24. [Google Scholar] [CrossRef] [Scilit]
- Al-Khelaiwi, M.S.; Al-Masaabi, T.A.; Farag, H.; Rehman, S. Evaluation of Green and Blue Hydrogen Production Potential in Saudi Arabia. Energy Convers. Manag. X 2024, 24, 100742. [Google Scholar] [CrossRef] [Scilit]
- Olaitan, D.; Bertagni, M.; Porporato, A. The water footprint of hydrogen production. Sci. Total Environ. 2024, 927, 172384. [Google Scholar] [CrossRef] [Scilit] [PubMed]
- Simoes, S.G.; Catarino, J.; Picado, A.; Lopes, T.F.; di Berardino, S.; Amorim, F.; Gírio, F.; Rangel, C.M.; de Leão, T.P. Water availability and water usage solutions for electrolysis in hydrogen production. J. Clean. Prod. 2021, 315, 128124. [Google Scholar] [CrossRef] [Scilit]
- Shi, X.; Liao, X.; Li, Y. Quantification of fresh water consumption and scarcity footprints of hydrogen from water electrolysis: A methodology framework. Renew. Energy 2020, 154, 786–796. [Google Scholar] [CrossRef] [Scilit]
- EIA. State Profiles and Energy Estimates. 2024. Available online: https://www.eia.gov/state/data.php?sid=NM (accessed on 16 January 2024).
- Romano, M.C.; Antonini, C.; Bardow, A.; Bertsch, V.; Brandon, N.P.; Brouwer, J.; Campanari, S.; Crema, L.; Dodds, P.E.; Gardarsdottir, S.; et al. Comment on “How green is blue hydrogen?”. Energy Sci. Eng. 2022, 10, 1944–1954. [Google Scholar] [CrossRef] [Scilit]
- Longden, T.; Beck, F.J.; Jotzo, F.; Andrews, R.; Prasad, M. Clean’ hydrogen?—Comparing the emissions and costs of fossil fuel versus renewable electricity based hydrogen. Appl. Energy 2022, 306, 118145. [Google Scholar] [CrossRef] [Scilit]
- Karacan, C.Ö.; Brennan, S.T.; Buursink, M.L.; Freeman, P.A.; Lohr, C.D.; Merrill, M.D.; Olea, R.A.; Warwick, P.D. A residual oil zone (ROZ) assessment methodology with application to the central basin platform (Permian Basin, USA) for enhanced oil recovery (EOR) and long-term geologic CO2 storage. Geoenergy Sci. Eng. 2023, 230, 212275. [Google Scholar] [CrossRef] [Scilit]
- Olalotiti-Lawal, F.; Onishi, T.; Datta-Gupta, A.; Fujita, Y.; Watanabe, D.; Hagiwara, K. Model calibration and optimization of a post-combustion CO2 WAG pilot in a mature oil field. Fuel 2019, 255, 115810. [Google Scholar] [CrossRef] [Scilit]
- Zhang, R.; Datta-Gupta, A.; Park, J.; Nunna, K.; Briz, E.; Gordillo, R.; Chen, H. Multi-stage three-phase and compositional history matching: Field application to CO2 enhanced oil recovery in the Permian Basin, Texas. Fuel 2025, 387, 134339. [Google Scholar] [CrossRef] [Scilit]
- Anzelmo, B.; Wilcox, J.; Liguori, S. Hydrogen production via natural gas steam reforming in a Pd-Au membrane reactor. Comparison between methane and natural gas steam reforming reactions. J. Memb. Sci. 2018, 568, 113–120. [Google Scholar] [CrossRef] [Scilit]
- Xu, J.; Froment, G.F. Methane steam reforming, methanation and water-gas shift: I. Intrinsic kinetics. AIChE J. 1989, 35, 88–96. [Google Scholar] [CrossRef] [Scilit]
- Marín, P.; Patiño, Y.; Díez, F.V.; Ordóñez, S. Modelling of hydrogen perm-selective membrane reactors for catalytic methane steam reforming. Int. J. Hydrogen Energy 2012, 37, 18433–18445. [Google Scholar] [CrossRef] [Scilit]
- Thengane, S.K.; Hoadley, A.; Bhattacharya, S.; Mitra, S.; Bandyopadhyay, S. Exergy efficiency improvement in hydrogen production process by recovery of chemical energy versus thermal energy. Clean. Technol. Environ. Policy 2016, 18, 1391–1404. [Google Scholar] [CrossRef] [Scilit]
- Minette, F.; de Almeida, L.C.; Ratan, S.; De Wilde, J. Pressure drop and heat transfer of ZoneFlowTM structured catalytic reactors and reference pellets for Steam Methane Reforming. Chem. Eng. J. 2021, 417, 128080. [Google Scholar] [CrossRef] [Scilit]
- Tabrizi, F.F.; Mousavi, S.A.H.S.; Atashi, H. Thermodynamic analysis of steam reforming of methane with statistical approaches. Energy Convers. Manag. 2015, 103, 1065–1077. [Google Scholar] [CrossRef] [Scilit]
- Moon, D.K.; Lee, D.G.; Lee, C.H. H2 pressure swing adsorption for high pressure syngas from an integrated gasification combined cycle with a carbon capture process. Appl. Energy 2016, 183, 760–774. [Google Scholar] [CrossRef] [Scilit]
- Sharan, P.; Bandyopadhyay, S. Integration of multiple effect evaporators with background process. Chem. Eng. Trans. 2015, 45, 1591–1596. [Google Scholar] [CrossRef] [Scilit]
- Bandyopadhyay, S.; Sahu, G.C. Modified problem table algorithm for energy targeting. Ind. Eng. Chem. Res. 2010, 49, 11557–11563. [Google Scholar] [CrossRef] [Scilit]
- Sharan, P.; Bandyopadhyay, S. Integration of thermo-vapor compressor with multiple-effect evaporator. Appl. Energy 2016, 184, 560–573. [Google Scholar] [CrossRef] [Scilit]
- Song, C.; Liu, Q.; Ji, N.; Kansha, Y.; Tsutsumi, A. Optimization of steam methane reforming coupled with pressure swing adsorption hydrogen production process by heat integration. Appl. Energy 2015, 154, 392–401. [Google Scholar] [CrossRef] [Scilit]
- Peng, X.D. Analysis of the thermal efficiency limit of the steam methane reforming process. Ind. Eng. Chem. Res. 2012, 51, 16385–16392. [Google Scholar] [CrossRef] [Scilit]
- Biermann, M.; Normann, F.; Johnsson, F.; Hoballah, R.; Onarheim, K. Capture of CO2 from Steam Reformer Flue Gases Using Monoethanolamine: Pilot Plant Validation and Process Design for Partial Capture. Ind. Eng. Chem. Res. 2022, 61, 14305–14323. [Google Scholar] [CrossRef] [Scilit]
- Nema, A.; Kumar, A.; Warudkar, V. An in-depth critical review of different carbon capture techniques: Assessing their effectiveness and role in reducing climate change emissions. Energy Convers. Manag. 2025, 323, 119244. [Google Scholar] [CrossRef] [Scilit]
- Akinmoladun, A.; Tomomewo, O.S. Advances and future perspectives in post-combustion carbon capture technology using chemical absorption process: A review. Carbon Capture Sci. Technol. 2025, 16, 100461. [Google Scholar] [CrossRef] [Scilit]
- Smith, K.H.; Ashkanani, H.E.; Morsi, B.I.; Siefert, N.S. Physical solvents and techno-economic analysis for pre-combustion CO2 capture: A review. Int. J. Greenh. Gas. Control 2022, 118, 103694. [Google Scholar] [CrossRef] [Scilit]
- Kim, H.; Hwang, S.J.; Lee, K.S. Novel shortcut estimation method for regeneration energy of amine solvents in an absorption-based carbon capture process. Environ. Sci. Technol. 2015, 49, 1478–1485. [Google Scholar] [CrossRef] [Scilit] [PubMed]
- Puxty, G.; Maeder, M. A simple chemical model to represent CO2-amine-H2O vapour-liquid-equilibria. Int. J. Greenh. Gas. Control. 2013, 17, 215–224. [Google Scholar] [CrossRef] [Scilit]
- Aronu, U.E.; Lauritsen, K.G.; Grimstvedt, A.; Mejdell, T. Impact of heat stable salts on equilibrium CO2 absorption. Energy Procedia 2014, 63, 1781–1794. [Google Scholar] [CrossRef] [Scilit]
- Ambrosetti, M.; Beretta, A.; Groppi, G.; Tronconi, E. A Numerical Investigation of Electrically-Heated Methane Steam Reforming Over Structured Catalysts. Front. Chem. Eng. 2021, 3, 747636. [Google Scholar] [CrossRef] [Scilit]
- From, T.N.; Partoon, B.; Rautenbach, M.; Østberg, M.; Bentien, A.; Aasberg-Petersen, K.; Mortensen, P.M. Electrified steam methane reforming of biogas for sustainable syngas manufacturing and next-generation of plant design: A pilot plant study. Chem. Eng. J. 2024, 479, 147205. [Google Scholar] [CrossRef] [Scilit]
- Wismann, S.T.; Engbaek, J.S.; Vendelbo, S.B.; Bendixen, F.B.; Eriksen, W.L.; Aasberg-Petersen, K.; Frandsen, C.; Chorkendorff, I.; Mortensen, P.M. Electrified Methane Reforming: A Compact Approach to Greener Industrial Hydrogen Production n.d. Available online: https://www.science.org (accessed on 24 April 2024).
- Shagdar, E.; Lougou, B.G.; Shuai, Y.; Ganbold, E.; Chinonso, O.P.; Tan, H. Process analysis of solar steam reforming of methane for producing low-carbon hydrogen. RSC Adv. 2020, 10, 12582–12597. [Google Scholar] [CrossRef] [Scilit]
- Gunawan, A.; Singh, A.K. A solar thermal sorption-enhanced steam methane reforming (SE-SMR) approach and its performance assessment. Sustain. Energy Technol. Assess. 2022, 52, 102036. [Google Scholar] [CrossRef] [Scilit]
- Florida Power & Light Company. Natural Gas Specs Sheet. 2004. Available online: https://www.naesb.org/pdf2/wgq_bps100605w2.pdf (accessed on 24 April 2024).
- Laurenzi, I.J.; Jersey, G.R. Life cycle greenhouse gas emissions and freshwater consumption of marcellus shale gas. Environ. Sci. Technol. 2013, 47, 4896–4903. [Google Scholar] [CrossRef] [Scilit]
- Boms, A.; Aka, N.; Godwin, C.; Jacob, E.; Emmanuel, O. Estimating Pressure Drop in Natural Gas Pipeline: (A Case Study of Rumuji-Bonny NLNG Pipeline). Int. J. Sci. Eng. Res. 2017, 8, 822–830. [Google Scholar]
- Chen, J.; Song, W.; Xu, D. Compact Steam-Methane Reforming for the Production of Hydrogen in Continuous Flow Microreactor Systems. ACS Omega 2019, 4, 15600–15614. [Google Scholar] [CrossRef] [Scilit]
- Hydrogen and Fuel Cell Technologies Office. Gaseous Hydrogen Delivery. 2023. Available online: https://www.energy.gov/cmei/fuels/2023-hydrogen-and-fuel-cell-technologies-office-webinar-archives (accessed on 24 April 2024).
- Life Cycle Greenhouse Gas Emissions from Concentrating Solar Power (Fact Sheet), NREL (National Renewable Energy Laboratory), (n.d.). Available online: https://www.google.com/url?sa=t&rct=j&q=&esrc=s&source=web&cd=&ved=2ahUKEwiNqviHgsf6AhVtjokEHf5nCMUQFnoECAYQAQ&url=https%3A%2F%2Fwww.nrel.gov%2Fdocs%2Ffy13osti%2F56416.pdf&usg=AOvVaw2EZQxNcLYAn_pJZdql-cRr (accessed on 3 October 2022).
- Sharan, P.; Neises, T.; McTigue, J.; Turchi, C. Cogeneration using multi-effect distillation and a solar-powered supercritical carbon dioxide Brayton cycle. Desalination 2019, 459, 20–33. [Google Scholar] [CrossRef] [Scilit]
- Sharan, P.; Neises, T.; Turchi, C. Thermal desalination via supercritical CO2 Brayton cycle: Optimal system design and techno-economic analysis without reduction in cycle efficiency. Appl. Therm. Eng. 2019, 152, 499–514. [Google Scholar] [CrossRef] [Scilit]
- Aili, A.; Zhao, D.; Tan, G.; Yin, X.; Yang, R. Reduction of water consumption in thermal power plants with radiative sky cooling. Appl. Energy 2021, 302, 117515. [Google Scholar] [CrossRef] [Scilit]
- Panja, P.; McPherson, B.; Deo, M. Techno-Economic Analysis of Amine-based CO2 Capture Technology: Hunter Plant Case Study. Carbon Capture Sci. Technol. 2022, 3, 100041. [Google Scholar] [CrossRef] [Scilit]
- Liu, F.; Qi, Z.; Fang, M.; Wang, T.; Yi, N. Evaluation on water balance and amine emission in CO2 capture. Int. J. Greenh. Gas. Control. 2021, 112, 103487. [Google Scholar] [CrossRef] [Scilit]
- Meldrum, J.; Nettles-Anderson, S.; Heath, G.; Macknick, J. Life cycle water use for electricity generation: A review and harmonization of literature estimates. Environ. Res. Lett. 2013, 8, 015031. [Google Scholar] [CrossRef] [Scilit]
- Sinha, P.; Meader, A.; De Wild-Scholten, M. Life cycle water usage in CdTe photovoltaics. IEEE J. Photovolt. 2013, 3, 429–432. [Google Scholar] [CrossRef] [Scilit]
- Tran, A.; Aguirre, A.; Durand, H.; Crose, M.; Christofides, P.D. CFD modeling of a industrial-scale steam methane reforming furnace. Chem. Eng. Sci. 2017, 171, 576–598. [Google Scholar] [CrossRef] [Scilit]
- Tutar, M.; Üstün, C.E.; Campillo-Robles, J.M.; Fuente, R.; Cibrián, S.; Arzua, I.; Fernández, A.; López, G.A. Optimized CFD modelling and validation of radiation section of an industrial top-fired steam methane reforming furnace. Comput. Chem. Eng. 2021, 155, 107504. [Google Scholar] [CrossRef] [Scilit]
- Spath, P.L.; Mann, M.K. Life Cycle Assessment of Hydrogen Production via Natural Gas Steam Reforming; Technical Report No. NREL/TP-570-27637; National Renewable Energy Lab: Golden, CO, USA, 2000. [Google Scholar]
- Kirchgessner’, D.A.; Lotf, R.A.; Cowgiilp, R.M.; Harrison, M.R.; Shires, T.M. Estimate of Methane Emissions from the U.S. Natural Gas Industry. Chemosphere 1997, 35, 1365–1390. [Google Scholar] [CrossRef] [Scilit]
- Ocko, I.B.; Hamburg, S.P. Climate consequences of hydrogen emissions. Atmos. Chem. Phys. 2022, 72, 9349–9368. [Google Scholar] [CrossRef] [Scilit]
- Sharan, P.; Yoon, T.J.; Jaffe, S.M.; Ju, T.; Currier, R.P.; Findikoglu, A.T. Can capacitive deionization outperform reverse osmosis for brackish water desalination? Clean. Eng. Technol. 2021, 3, 100102. [Google Scholar] [CrossRef] [Scilit]
- Ali, S.W.M.; Vahedi, N.; Romero, C.; Oztekin, A. An optimization for water requirement in natural gas combined cycle power plants equipped with once-through and hybrid cooling systems and carbon capture unit. Water-Energy Nexus 2020, 3, 117–134. [Google Scholar] [CrossRef] [Scilit]
- Wu, M.; Mintz, M.; Wang, M.; Arora, S. Water consumption in the production of ethanol and petroleum gasoline. Environ. Manag. 2009, 44, 981–997. [Google Scholar] [CrossRef] [Scilit]
- Macknick, J.; Newmark, R.; Heath, G.; Hallett, K.C. A Review of Operational Water Consumption and Withdrawal Factors for Electricity Generating Technologies. 2011. Available online: http://www.osti.gov/bridge (accessed on 24 April 2024).
- Sharan, P.; Thengane, S.K.; Yoon, T.J.; Lewis, J.C.; Singh, R.; Currier, R.P.; Findikoglu, A.T. A novel approach for produced water treatment: Supercritical water oxidation and desalination. Desalination 2022, 532, 115716–115727. [Google Scholar] [CrossRef] [Scilit]
- Qi, W.; Lan, P.; Yang, J.; Chen, Y.; Zhang, Y.; Wang, G.; Peng, F.; Hong, J. Multi-U-Style micro-channel in liquid cooling plate for thermal management of power batteries. Appl. Therm. Eng. 2024, 256, 123984. [Google Scholar] [CrossRef] [Scilit]
- Lee, S.; Kim, H.S.; Park, J.; Kang, B.M.; Cho, C.H.; Lim, H.; Won, W. Scenario-based techno-economic analysis of steam methane reforming process for hydrogen production. Appl. Sci. 2021, 11, 6021. [Google Scholar] [CrossRef] [Scilit]
- EIA. Natural Gas Prices. Available online: https://www.eia.gov/dnav/ng/ng_pri_sum_dcu_nus_m.htm (accessed on 24 April 2024).
- Yoon, T.J.; Sharan, P.; Craddock, E.P.; Lewis, J.C.; Matteson, J.A.; Seong, J.G.; Singh, R.P.; Maerzke, K.A.; Currier, R.P.; Findikoglu, A.T. Selective recovery of critical materials in zero-liquid discharge supercritical water desalination. Desalination 2022, 537, 115849. [Google Scholar] [CrossRef] [Scilit]
- Bright, M. A The Inflation Reduction Act Creates a Whole New Market for Carbon Capture. Clean Air Task Force. 2022. Available online: https://www.catf.us/2022/08/the-inflation-reduction-act-creates-a-whole-new-market-for-carbon-capture/ (accessed on 24 April 2024).
- Ding, Y.; Baldino, C.; Zhou, Y. Understanding the Proposed Guidance for the Inflation Reduction Act’s Section 45V Clean Hydrogen Production Tax Credit n.d. Available online: https://theicct.org/publication/proposed-guidance-for-the-inflation-reduction-act-45v-clean-hydrogen-tax-credit-mar29/ (accessed on 28 August 2024).
- DOE. Alternative Fuels Data Center: State Information. Available online: https://afdc.energy.gov/states (accessed on 20 October 2022).
- Magnuson, M.L.; Julie, P.E.; Valdez, M.; Lawler, C.R.; Nelson, M.; Petronis, L. New Mexico Water Use by Categories. 2015. Available online: https://mainstreamnm.org/wp-content/uploads/2024/01/2015-Water-Use-and-Conservation-Report.pdf (accessed on 20 October 2024).
- Wang, M.; Han, J.; Elgowainy, A. The Life-Cycle Analysis of Petroleum Fuels and Biofuels with GREET. 2016. Available online: https://ww2.arb.ca.gov/sites/default/files/classic/fuels/lcfs/lcfs_meetings/12132016wang.pdf (accessed on 20 October 2024).
- Sun, P.; Elgowainy, A.; Wang, M.; Han, J.; Henderson, R.J. Estimation of U.S. refinery water consumption and allocation to refinery products. Fuel 2018, 221, 542–557. [Google Scholar] [CrossRef] [Scilit]
- Albatayneh, A.; Assaf, M.N.; Alterman, D.; Jaradat, M. Comparison of the Overall Energy Efficiency for Internal Combustion Engine Vehicles and Electric Vehicles. Environ. Clim. Technol. 2020, 24, 669–680. [Google Scholar] [CrossRef] [Scilit]
- Cigolotti, V.; Genovese, M.; Fragiacomo, P. Comprehensive review on fuel cell technology for stationary applications as sustainable and efficient poly-generation energy systems. Energies 2021, 14, 4963. [Google Scholar] [CrossRef] [Scilit]
- Zhang, Y.; Xu, S.; Song, Y.; Qi, W.; Guo, Q.; Li, X.; Kong, L.; Chen, J. Real-Time Global Optimal Energy Management Strategy for Connected PHEVs Based on Traffic Flow Information. IEEE Trans. Intell. Transp. Syst. 2024, 25, 20032–20042. [Google Scholar] [CrossRef] [Scilit]
- Aulakh, D.J.S.; Boulama, K.G.; Pharoah, J.G. On the reduction of electric energy consumption in electrolysis: A thermodynamic study. Int. J. Hydrogen Energy 2021, 46, 17084–17096. [Google Scholar] [CrossRef] [Scilit]
- Weidner, T.; Tulus, V.; Guillén-Gosálbez, G. Environmental sustainability assessment of large-scale hydrogen production using prospective life cycle analysis. Int. J. Hydrogen Energy 2023, 48, 8310–8327. [Google Scholar] [CrossRef] [Scilit]
- Duncan, I. CO2 Enhanced Oil Recovery: A Key Bridge to Large Scale CO2 Sequestration n.d. Available online: https://naturalresources.house.gov/uploadedfiles/duncantestimony06.12.08.pdf (accessed on 31 October 2025).
- EIA. Carbon Dioxide Emissions Coefficients. 2024. Available online: https://www.eia.gov/environment/emissions/co2_vol_mass.php (accessed on 24 April 2024).
- Schlömer, S.; Bruckner, T.; Fulton, L.; Austria, E.H.; McKinnon, A.U.; Perczyk, D.; Roy, J.; Schaeffer, R.; Hänsel, G.; de Jager, D.; et al. Annex III: Technology-specific Cost and Performance Parameters. In Climate Change 2014: Mitigation of Climate Change; Cambridge University Press: Cambridge, UK, 2014; pp. 1329–1356. Available online: https://www.ipcc.ch/site/assets/uploads/2018/02/ipcc_wg3_ar5_annex-iii.pdf (accessed on 24 April 2024).
- Pomponi, F.; Hart, J. The greenhouse gas emissions of nuclear energy—Life cycle assessment of a European pressurised reactor. Appl. Energy 2021, 290, 116743. [Google Scholar] [CrossRef] [Scilit]
- Fridriksson, T.; Merino, A.M.; Orucu, A.Y.; Audinet, P. Greenhouse Gas Emissions from Geothermal Power Production; World Bank: Washington, DC, USA, 2016. [Google Scholar] [CrossRef] [Scilit]
- Beagle, E.; Belmont, E. Comparative life cycle assessment of biomass utilization for electricity generation in the European Union and the United States. Energy Policy 2019, 128, 267–275. [Google Scholar] [CrossRef] [Scilit]
- Moon, E. Why Do Coal Mines Need so Much Water? 2017. Available online: https://phys.org/news/2017-04-coal.html (accessed on 24 April 2024).
- Macknick, J.; Newmark, R.; Heath, G.; Hallett, K.C. Operational water consumption and withdrawal factors for electricity generating technologies: A review of existing literature. Environ. Res. Lett. 2012, 7, 045802. [Google Scholar] [CrossRef] [Scilit]
- 101. UCSUSA. How It Works: Water for Nuclear. 2013. Available online: https://www.ucsusa.org/resources/water-nuclear#sources (accessed on 24 April 2024).
- Zeng, G.; Xu, Z.; Zhang, Z.; Bai, H. Natural gas-hydrogen hybrid combustion retrofit method and practice for F-class heavy-duty combustion engines. Eng. Res. Express 2023, 5, 035061. [Google Scholar] [CrossRef] [Scilit]
- EPA. Hydrogen in Combustion Turbine Electric Generating Units Technical Support Document New Source Performance Standards for Greenhouse Gas Emissions from New. Modified, and Reconstructed Fossil Fuel-Fired Electric Generating Units; Emission Guidelines for Greenhouse Gas Emissions from Existing Fossil Fuel-Fired Electric Generating Units; and Repeal of the Affordable Clean. 2023. Available online: https://www.eia.gov/todayinenergy/detail.php?id=24612 (accessed on 24 April 2024).
- 104. Blending Hydrogen into Natural Gas Pipeline Networks. Nature Portfolio. Available online: https://www.nature.com/articles/d42473-020-00545-7 (accessed on 27 November 2023).
- Hodnebrog, Ø.; Dalsøren, S.B.; Myhre, G. Lifetimes, direct and indirect radiative forcing, and global warming potentials of ethane (C2H6), propane (C3H8), and butane (C4H10). Atmos. Sci. Lett. 2018, 19, e804. [Google Scholar] [CrossRef] [Scilit]
- Skytt, T.; Nielsen, S.N.; Jonsson, B.G. Global warming potential and absolute global temperature change potential from carbon dioxide and methane fluxes as indicators of regional sustainability—A case study of Jämtland, Sweden. Ecol. Indic. 2020, 110, 105831. [Google Scholar] [CrossRef] [Scilit]
- Sharan, P.; McTigue, J.; Yoon, T.J.; Currier, R.; Findikoglu, A.T. Energy efficient supercritical water desalination using a high-temperature heat pump: A zero liquid discharge desalination. Desalination 2021, 506, 115020. [Google Scholar] [CrossRef] [Scilit]
- Bernardo, G.; Araújo, T.; da Silva Lopes, T.; Sousa, J.; Mendes, A. Recent advances in membrane technologies for hydrogen purification. Int. J. Hydrogen Energy 2020, 45, 7313–7338. [Google Scholar] [CrossRef] [Scilit]
- Jasper, F.B.; Späthe, J.; Baumann, M.; Peters, J.F.; Ruhland, J.; Weil, M. Life cycle assessment (LCA) of a battery home storage system based on primary data. J. Clean. Prod. 2022, 366, 132899. [Google Scholar] [CrossRef] [Scilit]
- Hiremath, M.; Derendorf, K.; Vogt, T. Comparative life cycle assessment of battery storage systems for stationary applications. Environ. Sci. Technol. 2015, 49, 4825–4833. [Google Scholar] [CrossRef] [Scilit]
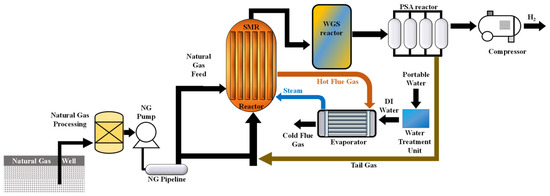
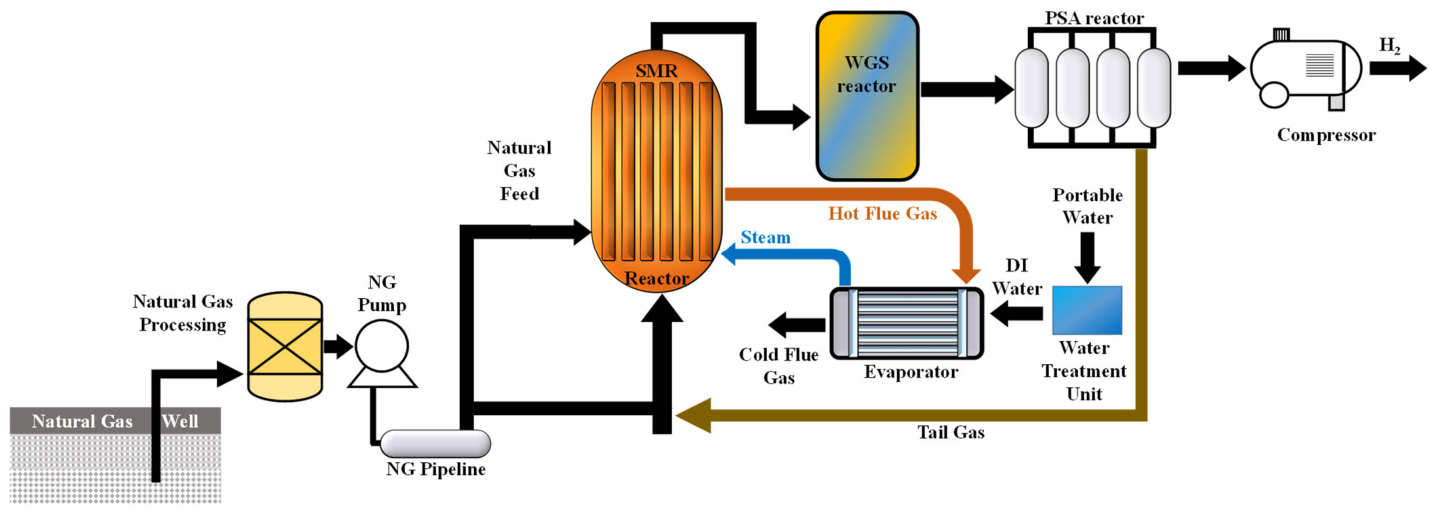
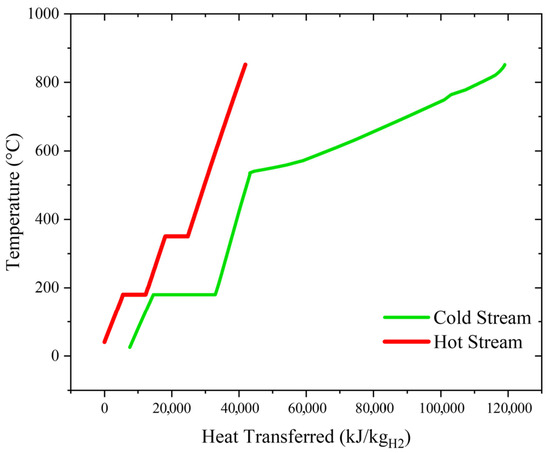
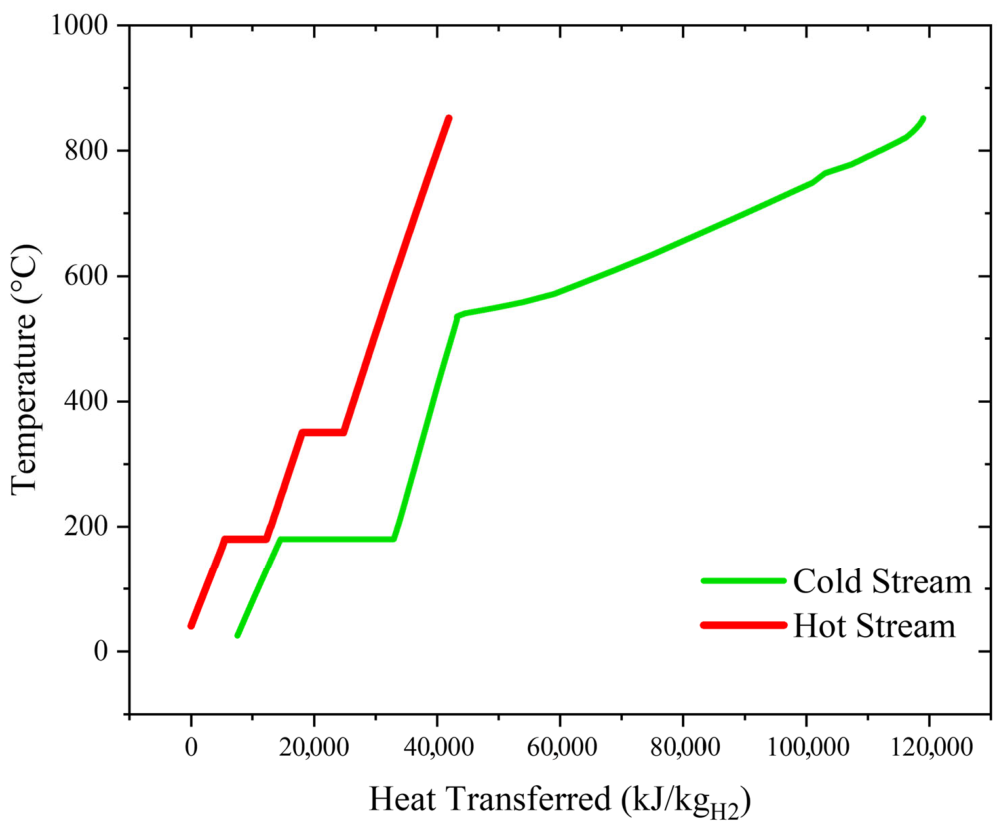
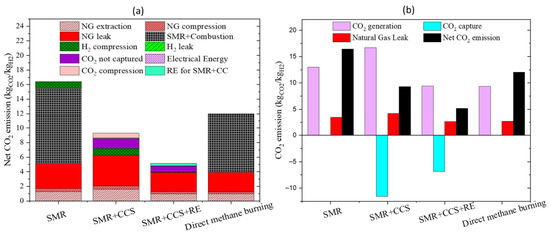
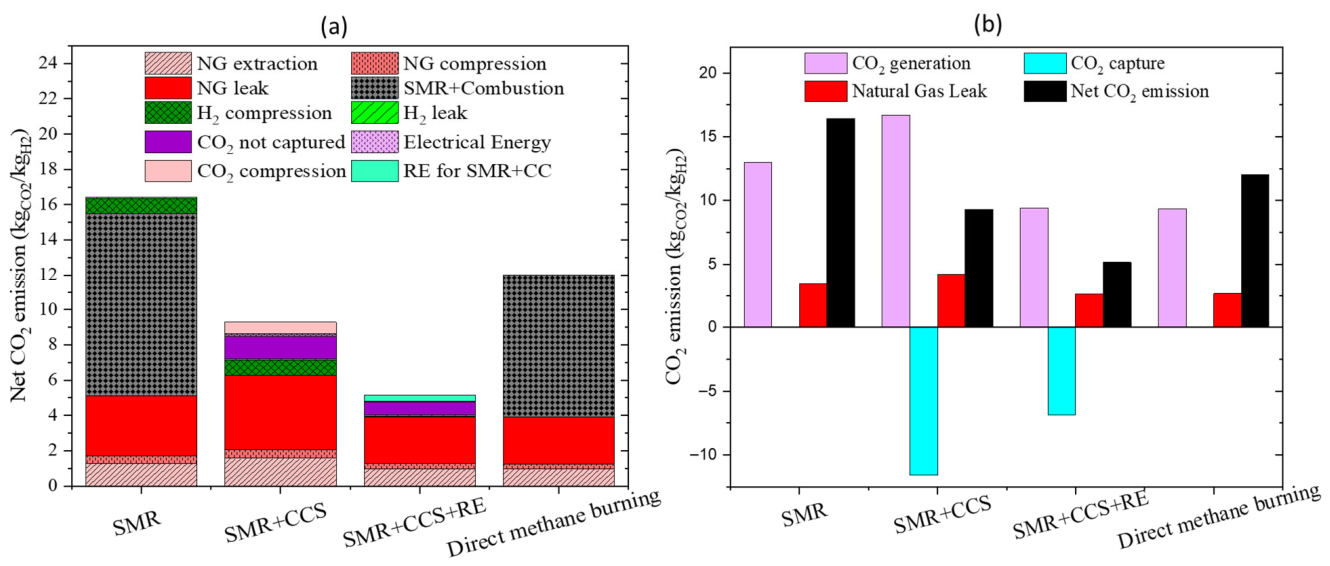
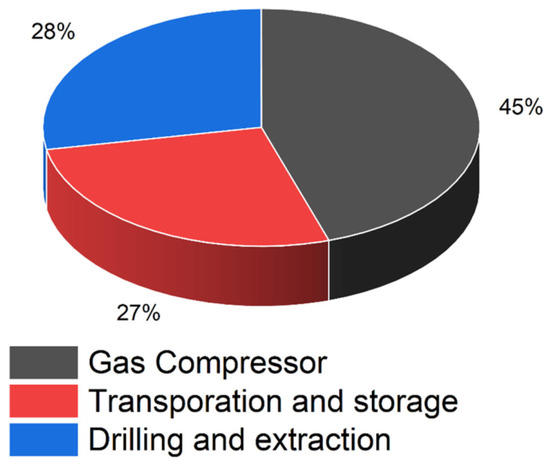
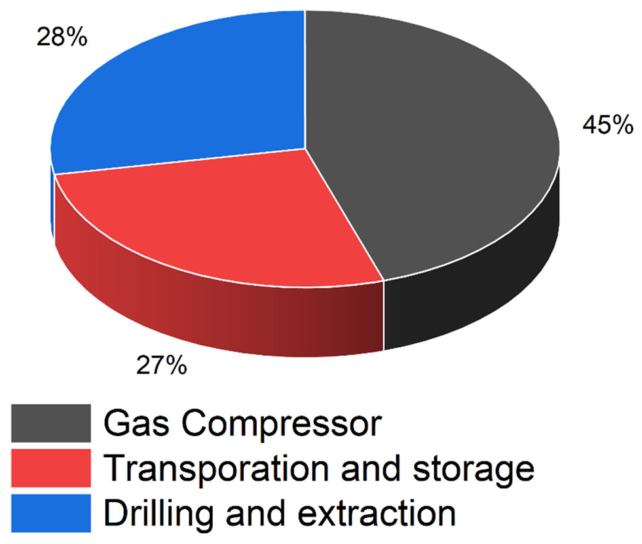
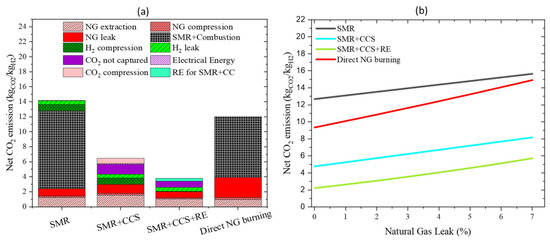
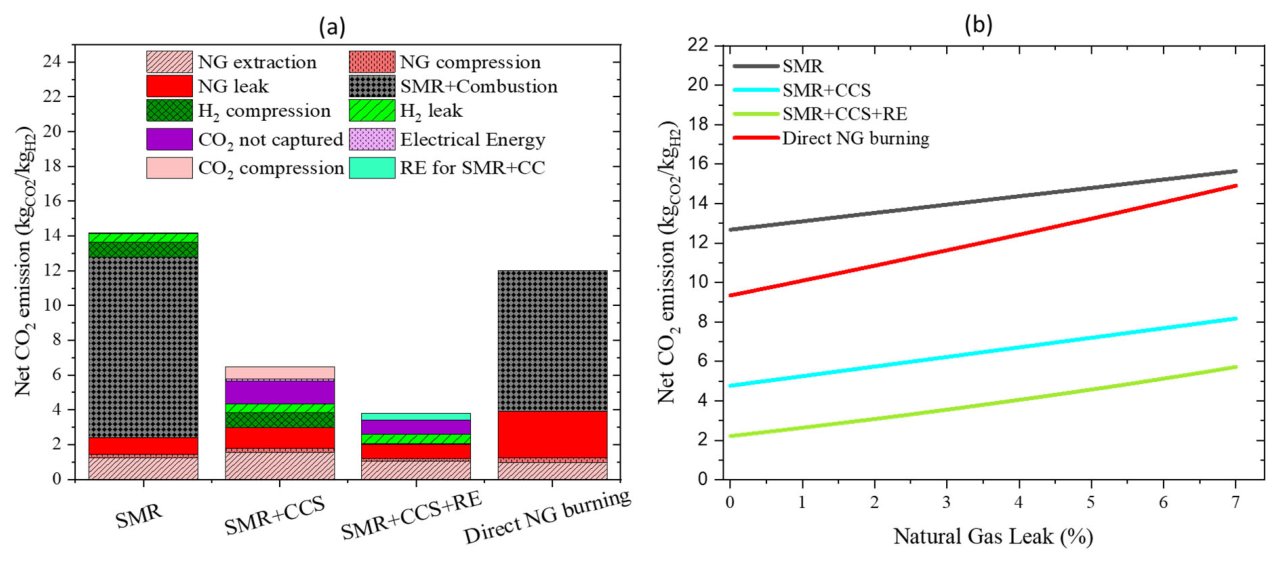
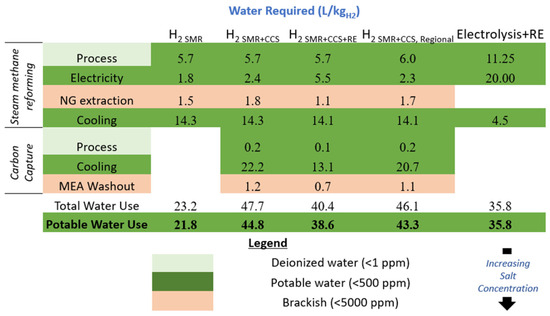
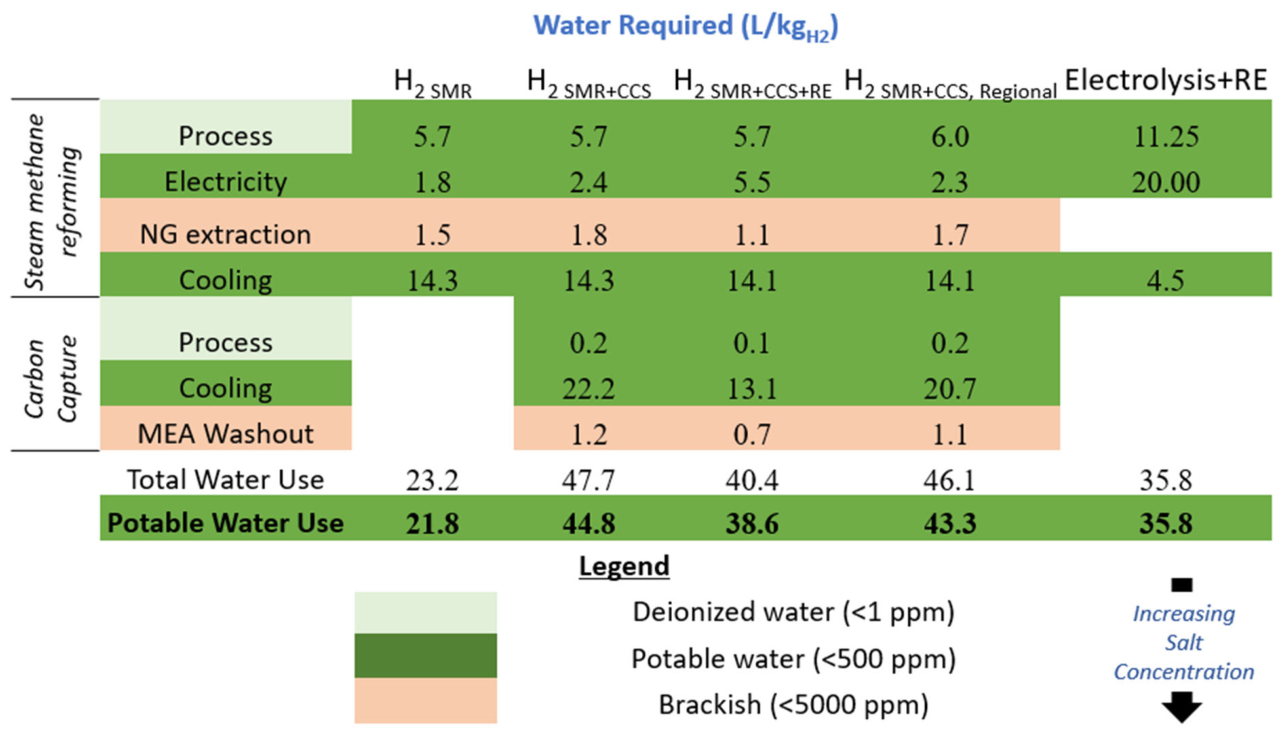
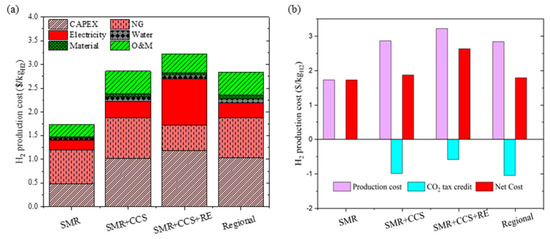
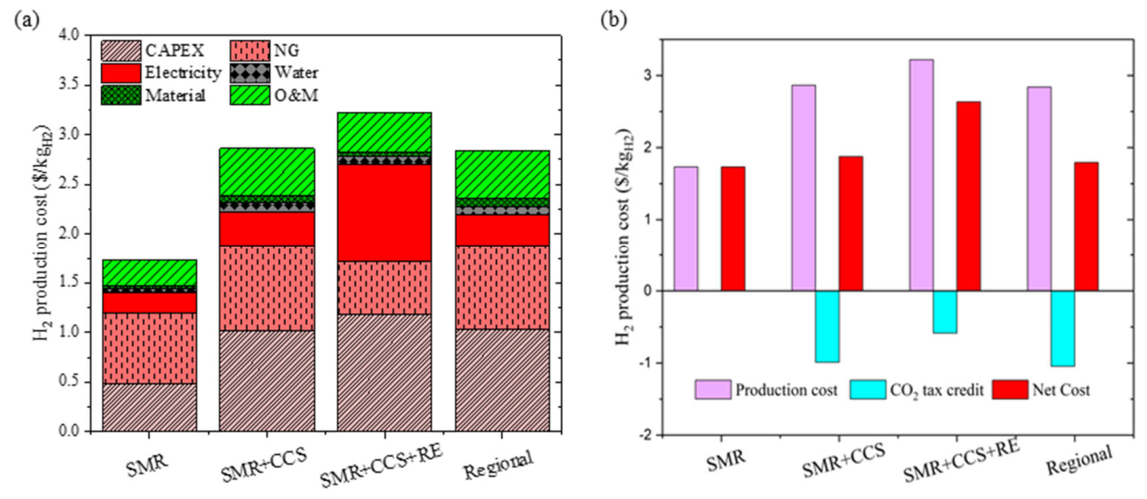
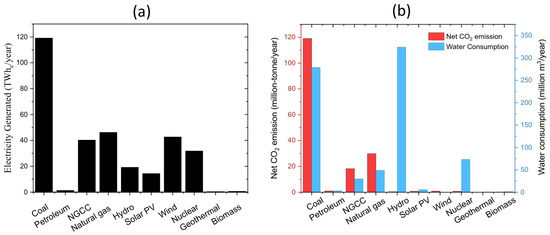
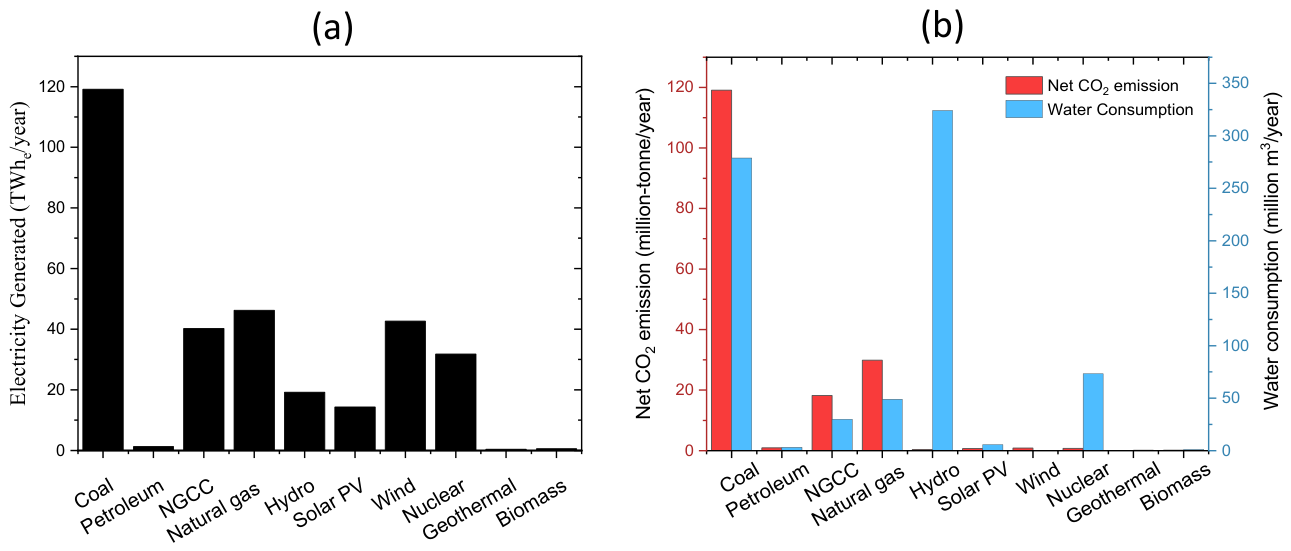
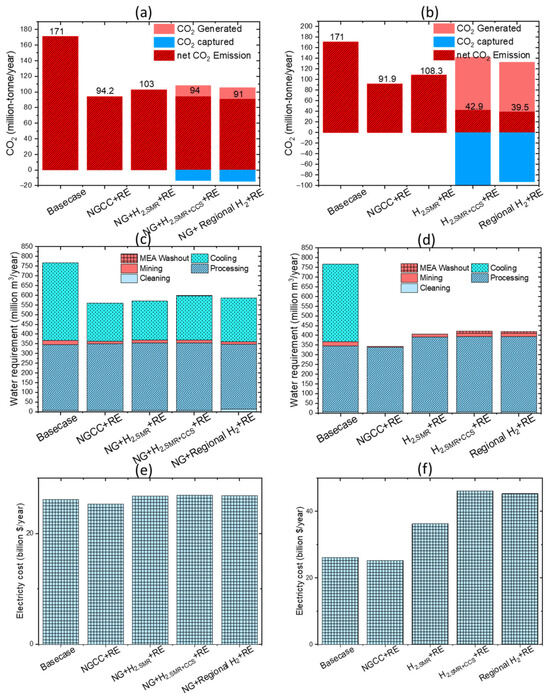
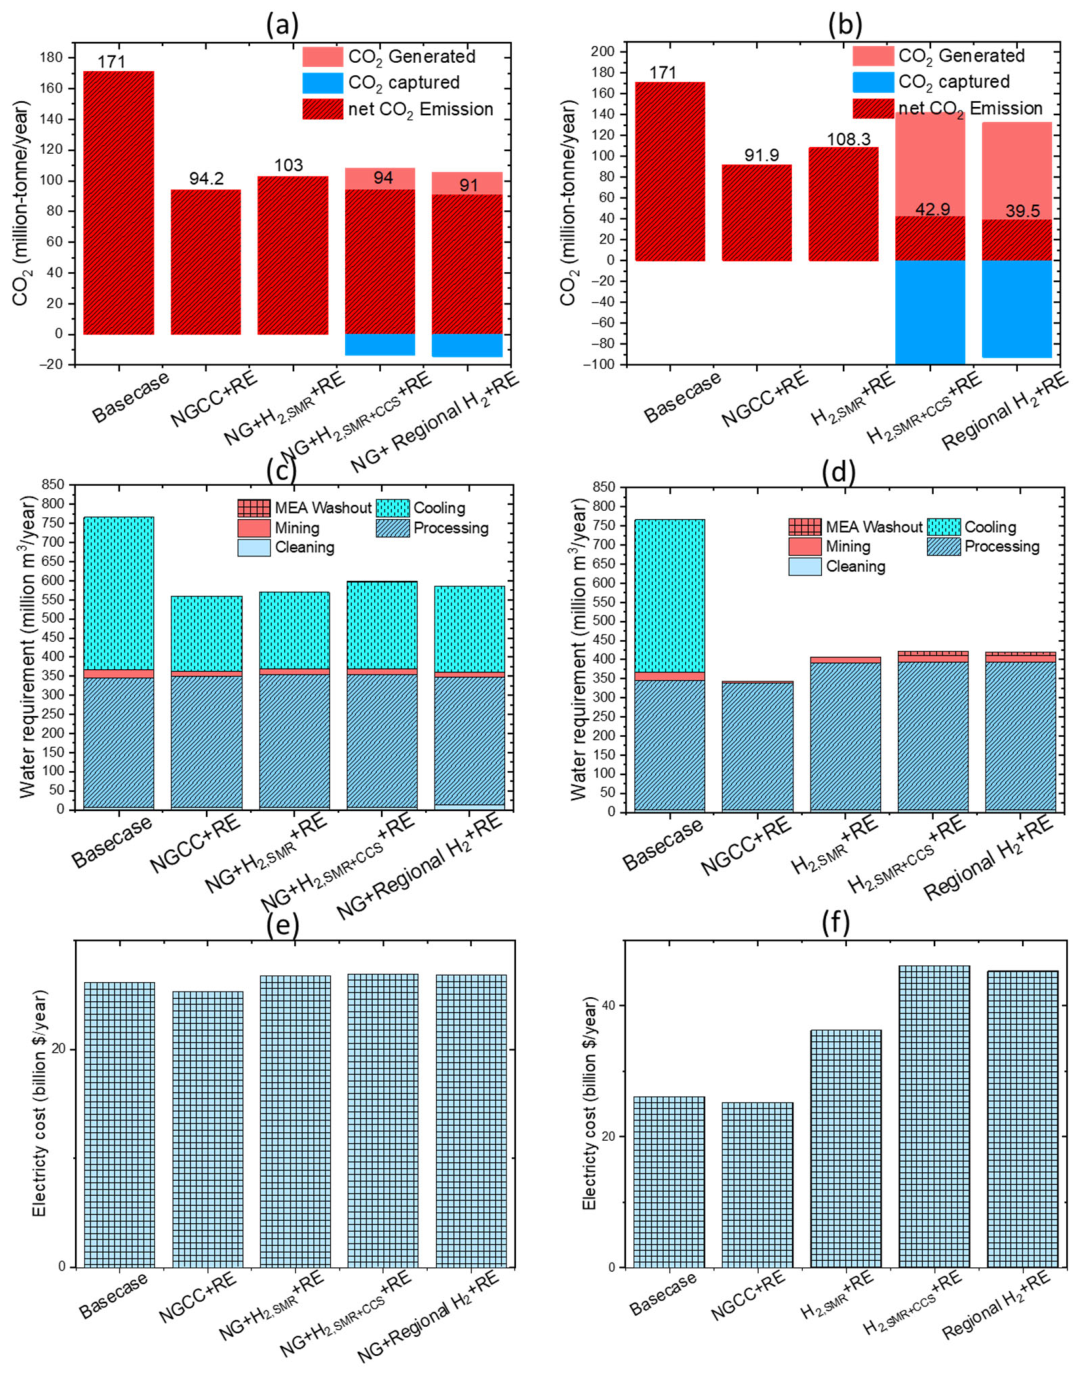
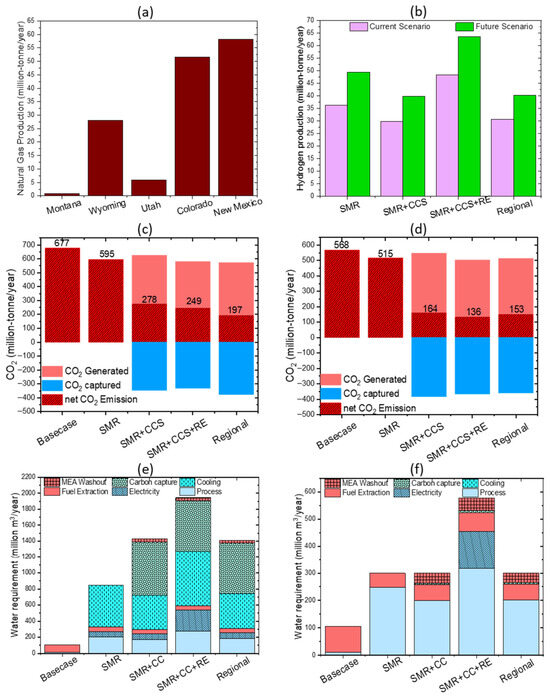
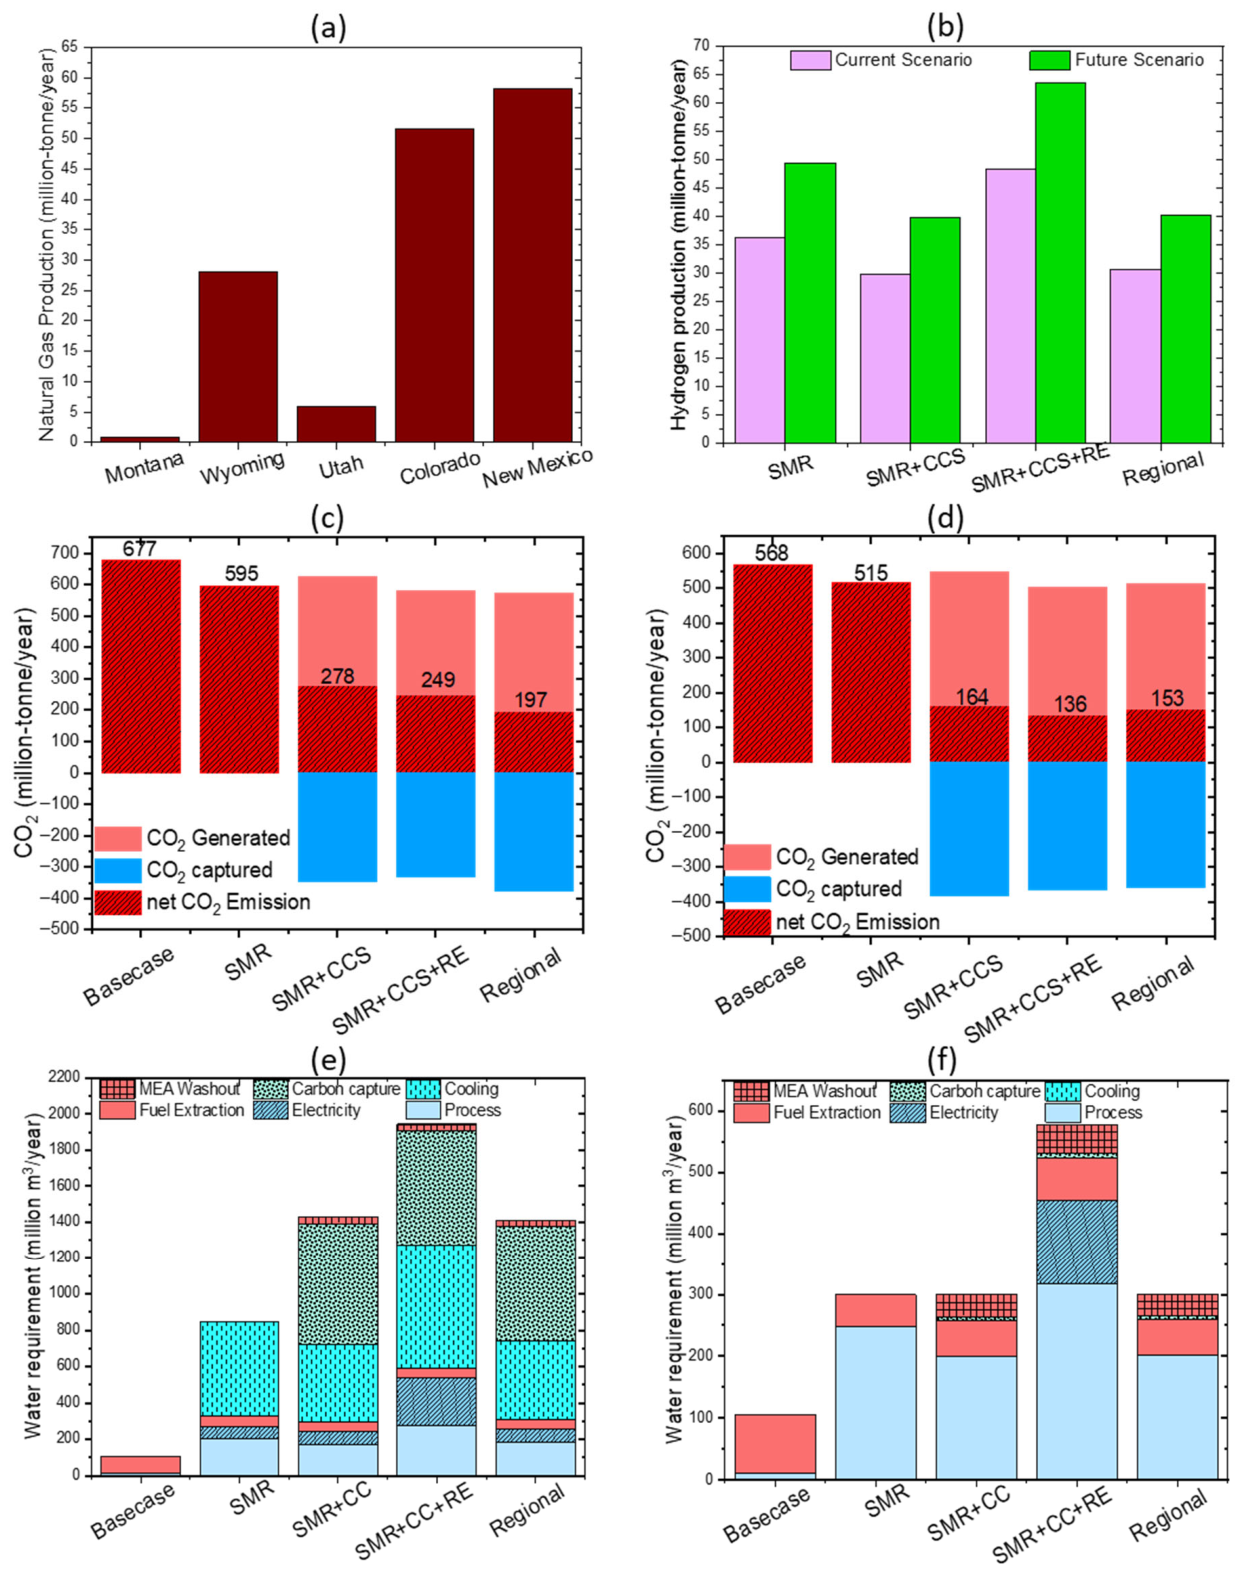

Disclaimer/Publisher’s Note: The statements, opinions and data contained in all publications are solely those of the individual author(s) and contributor(s) and not of MDPI and/or the editor(s). MDPI and/or the editor(s) disclaim responsibility for any injury to people or property resulting from any ideas, methods, instructions or products referred to in the content. |
© 2026 by the authors. Licensee MDPI, Basel, Switzerland. This article is an open access article distributed under the terms and conditions of the Creative Commons Attribution (CC BY) license.