


Abstract
Improving the absorption of visible light in photocatalysts could enhance photocatalytic reactions and reduce energy consumption, particularly in sunny regions like Ecuador. This study reports the synthesis of ZnO and ZnO nanoparticles doped with 1.5 at.% Er, 5 at.% Al, and 1.5 at.% Er, 5 at.% Al using the sol–gel method. The effect of doping on the structure, morphology, absorption spectra, and photocatalytic properties was analyzed by XRD, SEM, EDS, and UV-Vis spectrophotometry. XRD confirmed the presence of the wurtzite ZnO structure, and UV-Vis diffuse reflection spectra showed a red shift in the band gap for doped ZnO compared to pristine ZnO. Photocatalytic activity was evaluated through the degradation of methyl orange (MO) under artificial visible light and natural sunlight in Quito, Ecuador. ZnO doped with Er/Al nanoparticles exhibited significantly enhanced photocatalytic performance under solar light, suggesting the potential for replacing artificial light and reducing operating costs in photocatalytic processes. Moreover, all doped samples retained the antibacterial properties of ZnO against B. subtilis, and Er/Al co-doping improved the inhibition of E. coli compared to undoped ZnO.
1. Introduction
Protecting the environment requires effective removal of organic pollutants from wastewater, particularly synthetic dyes widely used in textiles, paper, plastics, leather, and food industries [1,2]. Textile effluents often contain azo dyes, which are non-biodegradable, persistent, and hazardous to aquatic life [3].
Advanced oxidation processes (AOPs) are effective, eco-friendly methods for removing such pollutants [4], mainly through the in situ generation of hydroxyl radicals (•OH) via chemical, photochemical, sonochemical, or electrochemical reactions [5]. In heterogeneous photocatalysis, semiconductors like TiO2, ZnO, ZrO2, and SiO2 are photoexcited, generating electron–hole pairs that produce reactive oxygen species responsible for dye degradation [6]. Among these, TiO2 and ZnO are the most studied [7,8], both with wide band gaps (3.2 eV for TiO2 anatase and 3.4 eV for ZnO) [9,10]. TiO2 has been widely used for dye degradation [11], but ZnO offers additional advantages such as antibacterial activity, multifunctionality, low cost, and high surface-to-volume ratio [12,13,14].
Despite these benefits, ZnO absorbs only a small fraction of solar radiation (<5% UV) and suffers from electron–hole recombination, limiting large-scale applications [15,16]. Doping ZnO with other elements is a promising strategy to reduce its band gap and improve charge separation [17]. Cationic dopants such as Ce, Mn, Cu, Mg, and Al can introduce energy levels within the band gap, lower activation energy, and act as electron traps, thus enhancing photocatalytic efficiency and visible light response [18,19,20].
Rare-earth ions also present unique optical properties derived from their 4f electronic configuration, enabling efficient photon conversion across the UV–visible–IR range [21,22]. Their narrow, matrix-independent emission bands make them ideal for luminescent and photocatalytic applications [23,24].
Moreover, rare earths increase oxygen adsorption on ZnO surfaces, forming superoxide anions and boosting photodegradation [20].
The co-doping of ZnO with Al3+ and Er3+ is especially promising. Al3+ ions can inhibit electron–hole recombination [19], while Er3+ ions can extend visible light absorption and enhance photocatalytic activity [22].
This approach is particularly relevant for countries with high solar incidence, such as Ecuador. However, few studies have explored Er/Al co-doping in ZnO, and most have focused only on nanoparticles. For instance, ZnO nanoparticles co-doped with 2% Er and up to 3% Al showed reduced band gap energy and high degradation efficiency of Rhodamine B under visible irradiation [25]. Yet, little is known about thin films or the antimicrobial effects of Er/Al co-doped ZnO.
In this study, Er3+/Al3+ co-doped ZnO nanoparticles were synthesized via the sol–gel method, which ensures structural control and homogeneity [19]. Their photocatalytic efficiency was tested for methyl orange degradation under visible light and natural sunlight in Quito, Ecuador, and further applied to real textile wastewater. Additionally, their antimicrobial activity was evaluated against Gram-positive (Bacillus subtilis) and Gram-negative (E. coli). The aim was to demonstrate how Er/Al co-doping enhances the optical, photocatalytic, and antimicrobial properties of ZnO nanoparticles for environmental remediation.
2. Experimental Section
2.1. Materials
Zinc nitrate hexahydrate (99%, metal basis) and erbium nitrate hydrate (99.9%) were purchased from Alfa Aesar, Ward Hill, MA, USA. Oxalic acid dihydrate (99.5%) and aluminum nitrate nonahydrate (95.5%) were supplied by Sigma-Aldrich, St. Louis, MO, USA. Ethanol (EtOH, absolute alcohol) was provided by VWR International, Radnor, PA, USA). Methyl orange (MO) was obtained from Sigma-Aldrich, St. Louis, MO, USA. All chemicals were analytical grade and utilized as received, without additional purification.
2.2. Synthesis of Catalysts
ZnO was produced via the standard sol–gel technique [26]. Specifically, 1.503 g (0.005 mol) of zinc nitrate was dissolved in 30 mL of ethanol and stirred at 60 °C for 30 min. Based on Zhang’s work [23], to determine the optimal dopant concentrations, Er(NO3)3 and Al(NO3)3 at varying Er and Al levels (Table 1) were dissolved in the suspension and stirred for 30 min, yielding solution A. Separately, solution B was prepared by dissolving 2.507 g (0.02 mol) of oxalic acid dihydrate in 80 mL of ethanol and stirring at 50 °C for 30 min. Solution B was then added dropwise to the preheated solution A under continuous stirring for 1 h, producing a white sol, which was aged to form a gel and dried at 80 °C for 24 h. Finally, ZnO doped and undoped were obtained by thermal treatment at a calcination temperature of 400 °C for 1 h.
Table 1.
Composition of the catalyst with different dopant ratios.
2.3. Characterization of Catalyst
Scanning electron microscopy (SEM) was employed to analyze the surface morphology of the samples with a JEOL IT300 instrument, which includes an energy-dispersive X-ray (EDX) detector, at accelerating voltages of 15 kV.
The structures of both doped and undoped ZnO powders were analyzed by X-ray diffraction (XRD) was performed using a Bruker AXS D8 Advance diffractometer (Bruker Corporation, Billerica, MA, USA) equipped with a Cu Kα1 source (λ = 1.5406 Å). XRD patterns were recorded in the 2θ range from 20° to 80° with a scan rate of 2° min−1 and a step of 0.02°.
The Scherrer equation D = Kλ/β cosθ was applied to estimate the mean crystallite size, where K is a constant (0.92) reflecting the shape factor, λ = 0.154 nm is the wavelength of CuKα1 radiation, β is the full width at half maximum (FWHM) of the Bragg peak, and θ is the Bragg angle in radians.
We recorded the diffuse reflectance UV–Vis (DRUV) spectra using a Shimadzu UV–Vis–NIR spectrometer (Shimadzu Corporation, Kyoto, Japan) fitted with a Praying Mantis diffuse reflectance accessory (Harrick Scientific Products, Pleasantville, NY, USA). The spectral range we covered spanned from 200 to 600 nm, utilizing the UVProbe software (version 2.70, Shimadzu Corporation, Kyoto, Japan). For background measurement, we used a Spectralon pellet, and we calculated the Kubelka–Munk function F(R) based on the reflectance (R). To determine the band gap energy value (Eg), we analyzed the optical absorption edge in the DRUV spectra using the Tauc method, expressed as (F(R) hv) = A(hv − Eg)n, where F(R) denotes the Kubelka–Munk function, A is a constant, h represents Planck’s constant, v is the photon frequency, Eg corresponds to the optical band gap, and n equals 2 for a direct semiconductor [18].
Finally, the BET surface area was measured using the Micromeritics AutoChem II apparatus (Micromeritics Instrument Corporation, Norcross, GA, USA).
2.4. Photocatalytic Activity
The photocatalytic performance of pure ZnO and Er, Al co-doped ZnO was assessed by monitoring the degradation of methyl orange (MO). 0.01, 0.03, and 0.05 g of the photocatalyst were added to 100 mL of MO solution at concentrations of 10, 25, and 50 mg/L within a 200 mL beaker under constant stirring.
Under artificial visible light, the suspension was irradiated by three different commercial lamps: a 20 W UV Blacklight lamp (Sylvania MLX 20 W BL368), an 18 W LED lamp (4000 K, 2000 lumens, Philips CorePro LED bulb A67 18 W 840 Mat), and a 9 W LED lamp (4000 K, 987 lumens, Osram Parathom Classic A 9 W 840 Matt). All lamps were provided by Budgetlight, Eindhoven, The Netherlands, and were positioned 15 cm above the liquid level.
Under solar light, the catalysts’ photocatalytic properties were further investigated through the degradation of aqueous methyl orange solution at the concentrations. The tests were conducted in Quito, Ecuador, during the hours of 11:00 a.m. to 2:00 p.m. to standardize the UV irradiation conditions [27]. Testing was conducted when the UV Index in Quito began at 10, according to the Ecuadorian National Institute of Meteorology and Hydrology [28].
Throughout the experiment, 2 mL aliquots of the solution were taken at different time intervals, centrifuged at 13,000 rpm for 15 min, and analyzed with a UV–Vis spectrophotometer to measure MO concentration at 464 nm. All tests were carried out in a dark chamber to eliminate ambient light interference and performed in triplicate, with mean values recorded.
The removal rate (η) of MO was determined by applying the following equations:
where Co and Ct are the concentrations of MO at t = 0 and after an irradiation time t, respectively, and Ao and At are the absorbance of MO at t = 0 and after an irradiation time t, respectively.
2.5. Antibacterial Activity
The antimicrobial performance of four catalyst suspensions was evaluated by measuring culture turbidity as an estimation of cell growth in test tubes. The test tubes containing each sample were placed in a thermostatic bath with agitation. Experiments were conducted under both dark and light conditions to assess the effect of visible light on the antibacterial properties of the synthesized nanoparticles. To simulate dark conditions, the test tubes were wrapped in aluminum foil. For light conditions, an 18 W artificial light bulb (2000 lumens) was positioned 30 cm above the liquid level.
Bacillus subtilis (Gram-positive) and Escherichia coli (Gram-negative) bacterial strains were employed to evaluate the nanoparticles’ antibacterial activity. Fresh bacterial suspensions were prepared at an initial concentration of 102 CFU/mL in the test tubes.
Aqueous catalyst stock suspensions (10,000 mg/L) were prepared under constant stirring. Then, test tubes containing 10 mL of Iso-Sensitest broth medium were supplemented with the appropriate volume of each catalyst’s stock suspension to achieve a final catalyst concentration of 300 mg/L. Finally, 100 µL of bacterial suspension was added to each test tube. Blanks were also prepared for each sample.
To evaluate bacterial growth behavior, the optical density (OD) at 600 nm was measured using a Hach DR1900 UV–Vis spectrophotometer (Hach Company, Loveland, CO, USA). Blank readings were taken to measure the OD due to the culture medium and nanoparticle suspensions. A tube containing only 10 mL of culture medium and 102 CFU/mL of bacteria was used as a positive control. This was used as a reference for comparison with the tubes containing bacteria and catalysts.
These test tubes were placed in a shaker and were allowed to grow at 35 °C overnight, for B. subitilis and E. coli, respectively. The OD at 600 nm of the suspension (containing the bacteria and catalysts) was periodically monitored, and the OD of the test tubes after 24 h was measured. The percentage of growth inhibition compared to the positive control was used as an indicator of the antimicrobial action exhibited by the nanoparticles. Control cultures without nanoparticles, maintained under identical growth conditions, were used as the negative control.
To prevent possible optical measurement interference from the light-scattering behavior of the nanoparticles, a blank control containing the same culture was used as a sterile liquid medium containing the same nanoparticle concentration but no microorganisms. After 24 h, cultures were diluted to 10−6 and spread in triplicate onto tryptic soy agar (TSA) plates, followed by incubation at 37 °C to assess bacterial viability. Colony counts were taken, and growth inhibition percentages were calculated and plotted for each catalyst. Each test was performed at least three times.
3. Results and Discussion
3.1. Morphology of Composites
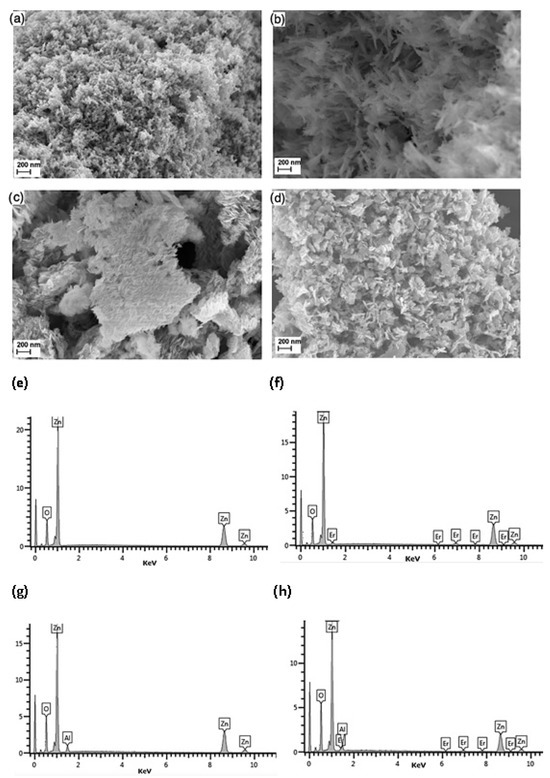
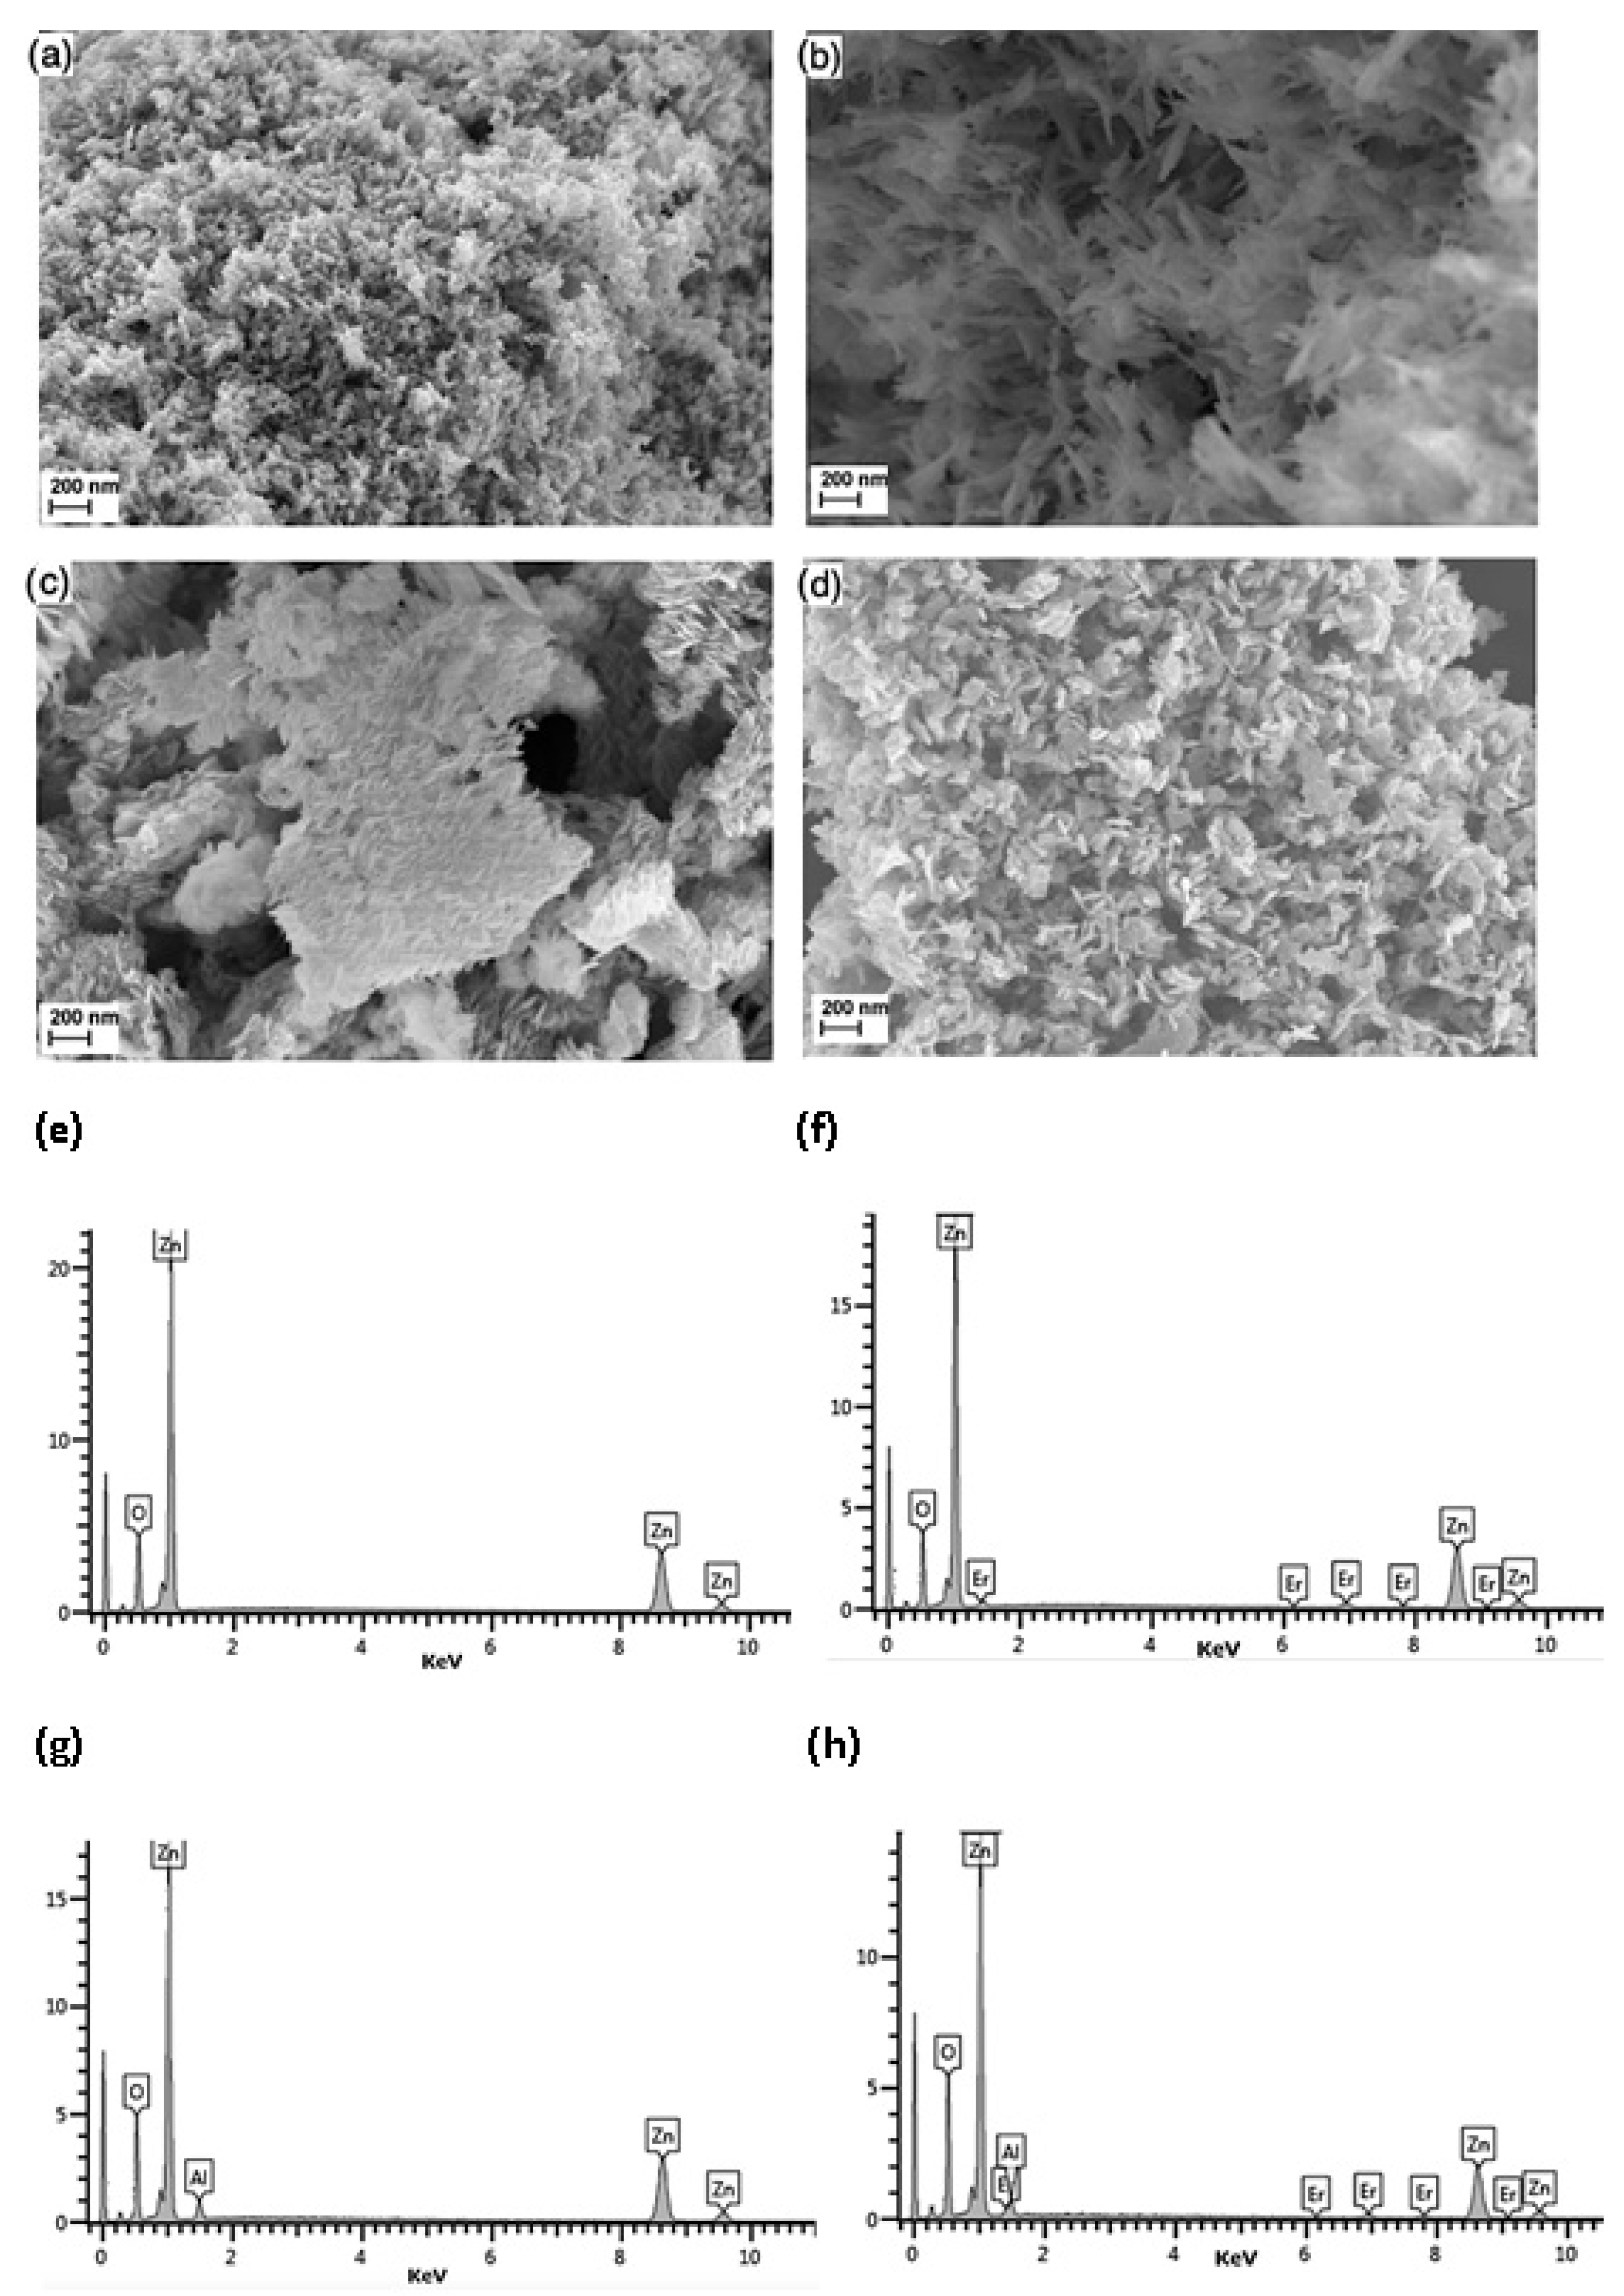
The morphology of synthesized pristine ZnO and doped ZnO samples was investigated using SEM. Figure 1a–d show that Er-Al co-doped ZnO synthesized by the sol–gel method exhibits the typical morphology of ZnO nanoparticles. The pristine ZnO structures in Figure 2a align with the literature, showing a granular form [26]. However, ZnO-Er, ZnO-Al, and ZnO-Er/Al nanoparticles displayed a mixed structure of rod-like and flake shapes, with an increased presence of flake shapes when erbium and aluminum were used as dopants (Figure 1b–d). The inclusion of both Er3+ and Al3+ ions replacing the Zn2+ lattice could influence the formation of nano-sized rods.
Figure 1.
SEM images: (a) pristine ZnO, (b) ZnO-Er, (c) ZnO-Al, and (d) ZnO-Er/Al; EDX spectra: (e) pristine ZnO, (f) ZnO-Er, (g) ZnO-Al, and (h) ZnO-Er/Al.
Figure 2.
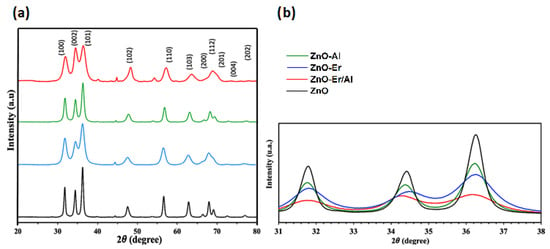
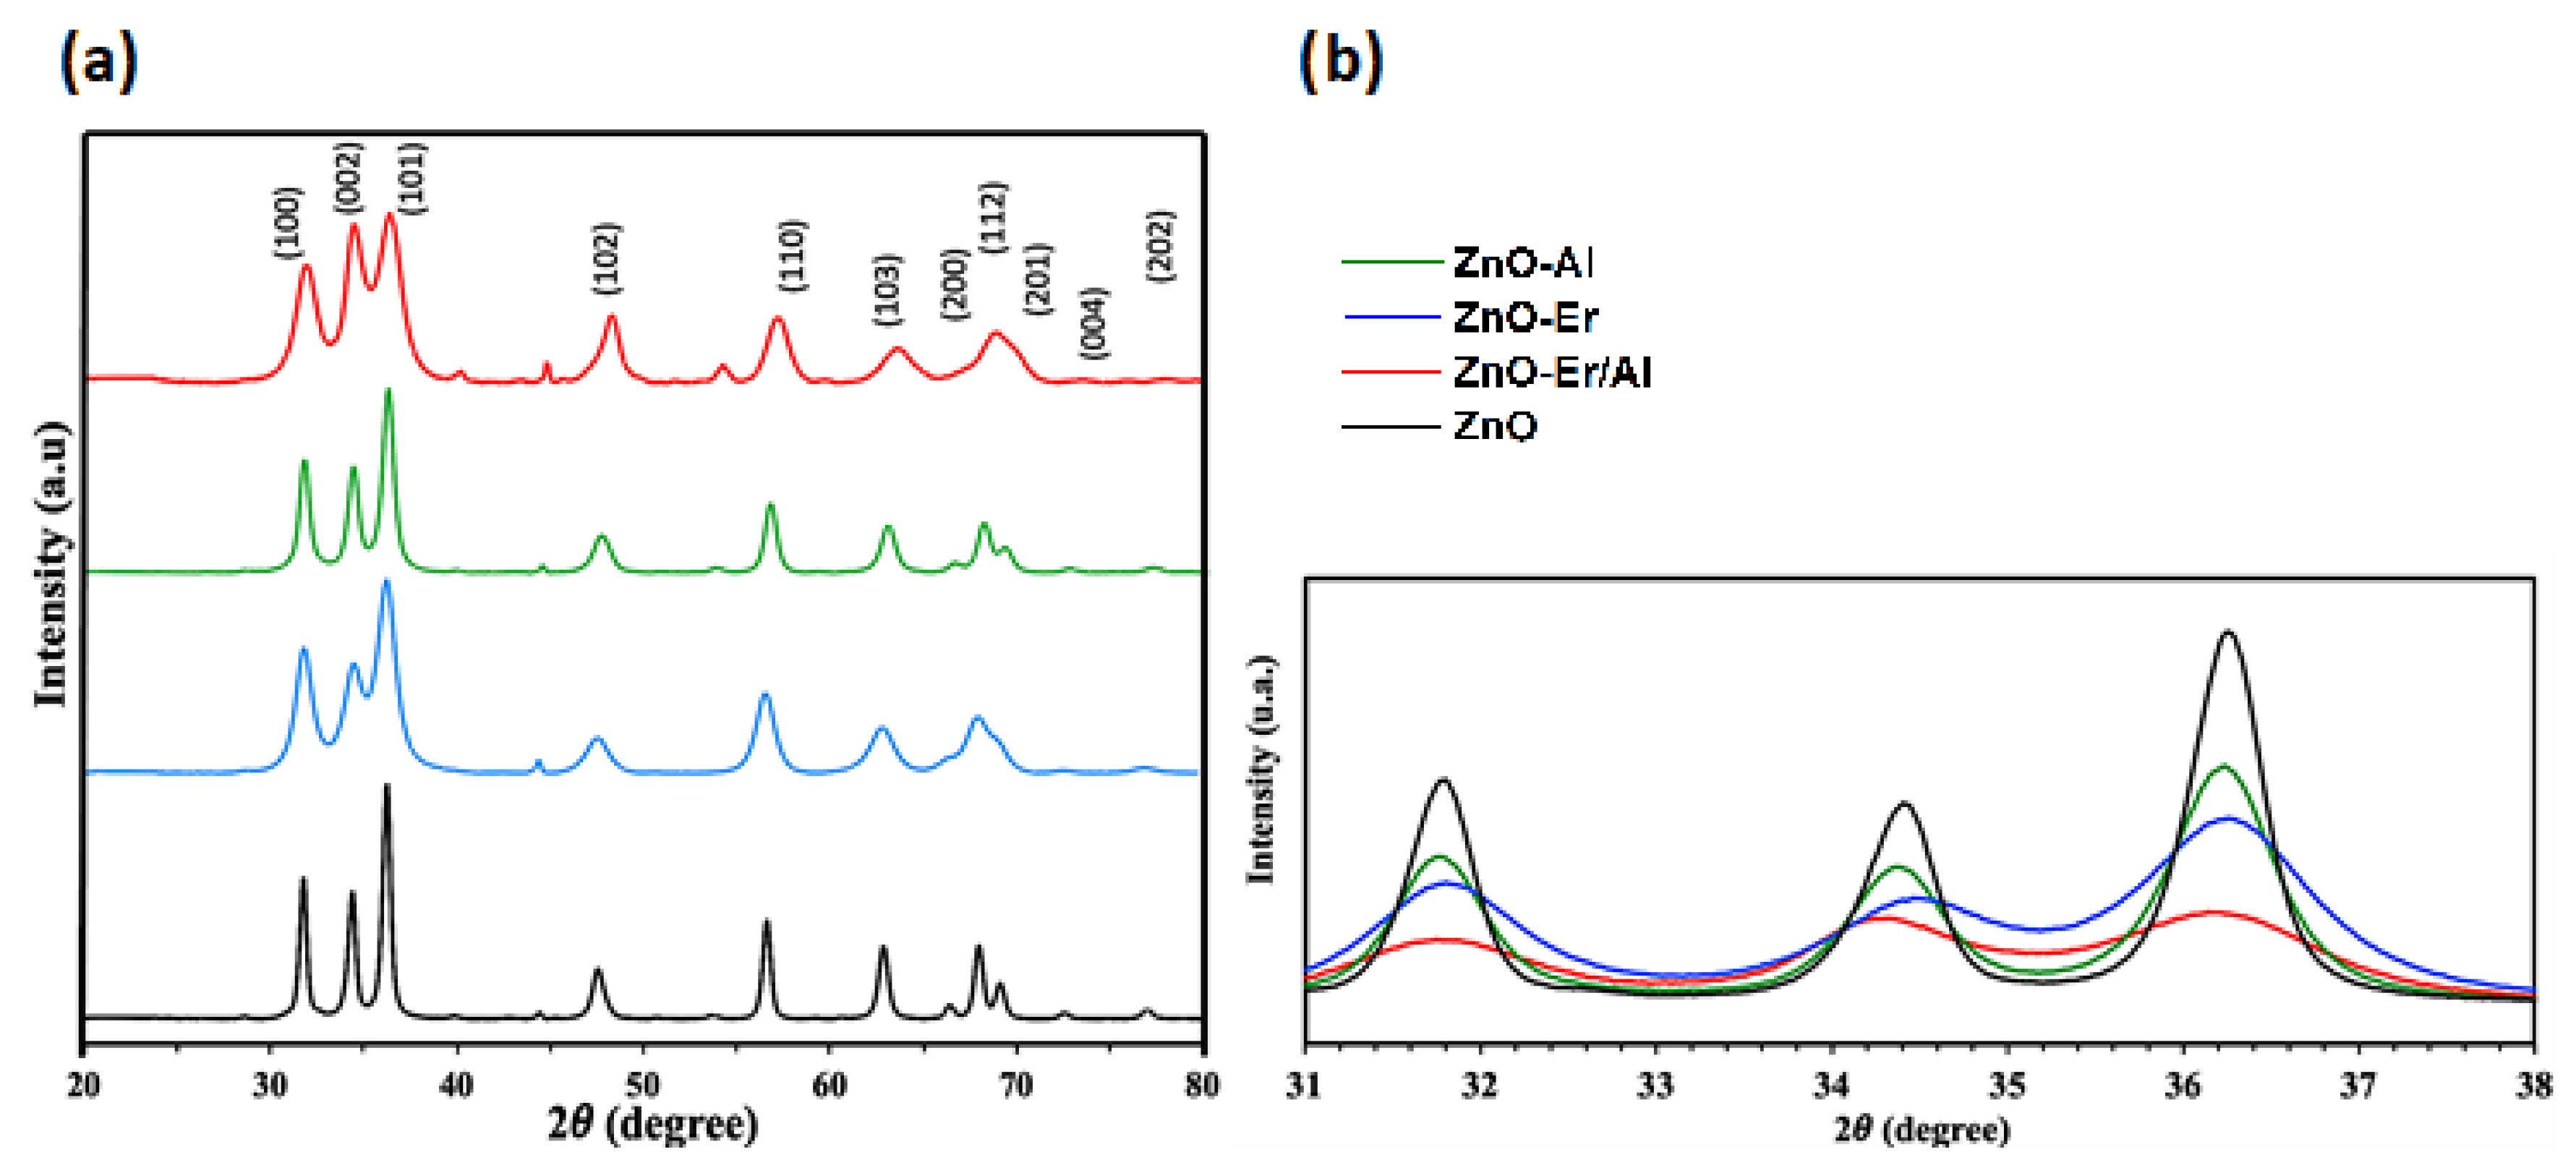
XRD patterns: (a) undoped ZnO and doped ZnO with Er, Al, and Er/Al. (b) Zoom of the XRD pattern in the 31–38° 2θ region to highlight the characteristic diffraction peaks.
In addition, the increase in particle size in Er-Al co-doped ZnO indicates that the presence of dopant elements can restrict the grain growth of ZnO particles can be hindered by the presence of doping elements (Er and Al) [29]. Moreover, the small size of the particles results in a large specific surface area, leading to strong local aggregation visible in the images. In agreement with this observation, BET analysis revealed that all samples (ZnO, ZnO-Er, ZnO-Al, and ZnO-Er/Al) exhibited similar values of specific surface area, with ≈10.99 m2/g. This suggests that the incorporation of Er and Al into the ZnO lattice did not substantially alter the textural properties of the material. The comparable BET values indicate that the photocatalytic performance differences observed later are likely attributed to electronic and structural modifications induced by doping, rather than to variations in surface area. The micrograph also shows some larger particles, possibly resulting from the agglomeration or overlap of smaller ones [30].
The EDX spectra of ZnO (Figure 1e) were compared with doped ZnO samples (Figure 1f–h), showing the presence of Al, Er, and the Al/Er ratio. The weight percentage of oxygen content was reduced in the co-doped nanopowders, confirming the incorporation of Al and Er into the ZnO matrix. The atomic percentages in all samples were verified and found to be as expected based on the synthesis (Table 2). All doped samples contained only O, Zn, Al, and Er, with no impurity-related peaks observed, indicating the high compositional purity of the samples.
Table 2.
Elemental composition of synthesized pristine ZnO and doped ZnO samples.
3.2. XRD Analysis
The prepared nanopowders’ crystal structure was analyzed by powder X-ray diffraction (XRD). Figure 2 displays the XRD patterns of pure ZnO (Figure 2a: ZnO) and doped ZnO samples (Figure 3b: 0% Al, 1,5% Er; Figure 1c: 5% Al, 0% Er; and Figure 1d: 5% Al, 1,5% Er). The XRD peaks at 2θ values of 31.8°, 34.4°, 36.3°, 47.6°, 56.6°, 62.9°, 66.5°, 68.0°, 69.1°, and 77.0° were indexed to the (100), (002), (101), (102), (110), (103), (200), (112), (201), and (202) planes of the ZnO crystal, as per the standard data file. These peaks align with the wurtzite crystal structure, consistent with data from JCPDS card No. 36-1451.
Figure 3.
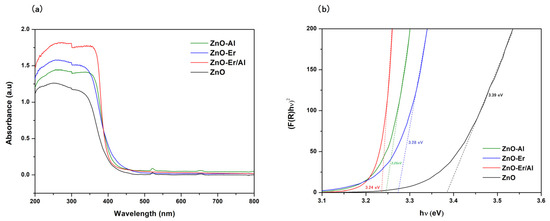
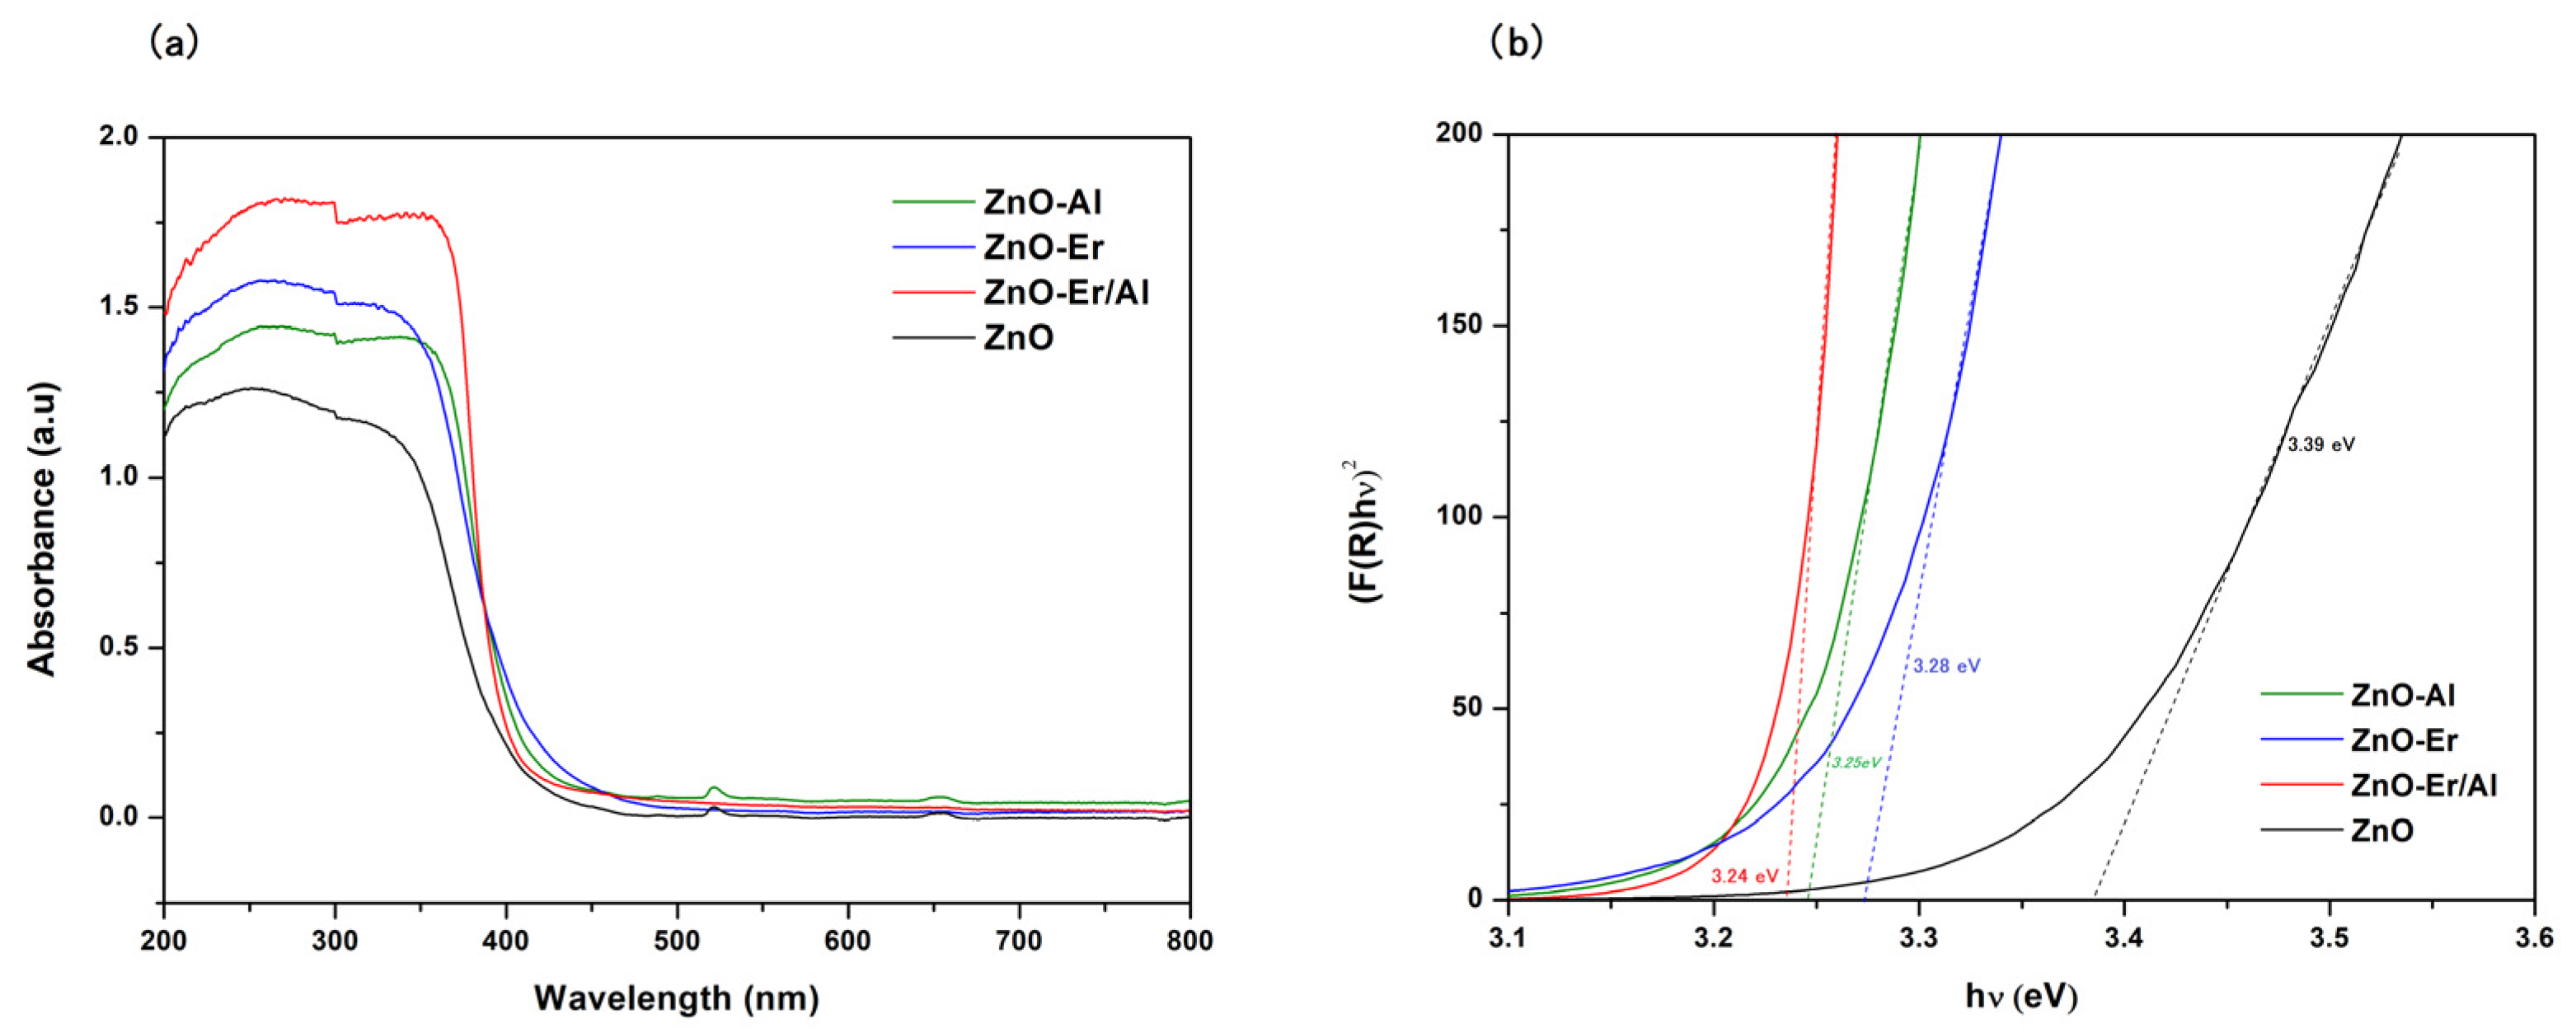
(a) UV–Vis diffuse absorbance spectra of undoped and doped ZnO; (b) zoom-in view for the range 31–38°; (FR hv)2 versus hν plots used to determine the band gap of ZnO and doped ZnO nanoparticles.
No extra peaks indicative of Al or Er oxides were detected (Figure 2a–b), indicating the complete dissolution of Er and Al dopants within the ZnO crystal lattice, where they occupy Zn sites [25]. Interestingly, the presence of Er and Al caused a decrease in all ZnO peak intensities (Figure 1 f–h), resulting in a broader full width at half maximum (FWHM), suggesting that Er–Al co-doping suppressed crystal size growth of the crystal size. This suggests that Al3+ and Er3+ ions substituted Zn2+ ion sites within the ZnO crystal, leading to changes in the lattice parameters. Despite these changes, all samples exhibited a dominant orientation in the (101) plane of the ZnO phase.
The calculated crystallite sizes of ZnO-Er, ZnO-Al, ZnO-Er/Al, and pristine ZnO were 17.46 nm, 13.90 nm, 10.28 nm, and 21.84 nm, respectively, according to the Scherrer equation [18].
3.3. Optical Properties
Diffuse reflectance spectroscopy (DRS) was employed to examine the optical characteristics of pure and co-doped ZnO nanopowders. The band gap energy (Eg) was obtained from Tauc’s plot by using the following equation: (FR hν)2 = A(hν − Eg) [31]. From the intercept of the linear segment in Figure 3b, it can be observed that the calculated band gap energy was 3.24 eV for ZnO-Er/Al, 3.25 eV for ZnO-Al, 3.28 eV for ZnO-Er, and 3.39 eV for pure ZnO, as determined by the extrapolation of the (FR hν)2 versus hν plots [32].
The results showed that Er and Al co-doping slightly lowered the band gap energy (Eg) relative to pure ZnO (Figure 3b). This decrease is attributed to defect formation from the dopants and alterations in lattice parameters due to the incorporation of Er and Al into the ZnO crystal lattice. Moreover, these dopants can lead to the creation of oxygen vacancies and extra energy states, which expand the average atomic spacing and reduce the band gap [33,34], which can harvest more photons to excite the electron from the valence band [25]. In addition, minor absorption features around ≈520 nm and ≈655 nm observed in ZnO and ZnO-Al can be attributed to defect-related states (e.g., oxygen vacancies or color centers). These features are absent in ZnO-Er and ZnO-Er/Al due to the incorporation of Er3+, which modifies the defect landscape and can promote energy transfer to Er-related states, suppressing visible defect absorption. The smallest Eg leads to the highest photocatalytic efficiency under visible light illumination [33,35], which corresponds to the sample co-doped with both Er and Al.
3.4. Catalyst Dosage on Metil Orange Degradation
To determine the optimal catalyst concentration for methyl orange (MO) degradation, experiments were conducted using three different concentrations of ZnO-Er/Al, 0.01%, 0.03, and 0.05% wt, under an 18 W LED lamp with 25 mg/L MO solutions. The results indicated MO removal efficiencies of 85.8%, 98.7%, and 97.5% for the 0.01%, 0.03%, and 0.05% wt concentrations, respectively.
This trend suggests that increasing the photocatalyst concentration leads to a higher quantity of active surface sites on the catalyst, thereby enhancing the formation of reactive radicals and increasing the degradation efficiency of MO [26]. However, there is a slightly higher value for the 0.03% wt (0.3 g/L) concentration compared to the following concentration of 0.05% wt (0.5 g/L), which could be due to the probability that at higher catalyst concentration, the probability of aggregation of catalyst molecules also increases, decreasing the amount of available active sites where photocatalysis takes place. Thus, 0.3 g/L (0.03% wt) of catalyst was chosen as the optimal amount to continue the study.
3.5. Photocatalytic Performance of Synthesized Nanoparticles
Following a comparison of various light sources (see Supporting Information S1), it was concluded that there were no significant differences in photocatalytic performance across the different lamps. Therefore, only the results obtained using the 18 W LED lamp are presented here, due to its lower energy consumption compared to the other light sources tested.
Because photocatalytic reactions occur on the catalyst surface and photogenerated electron–hole pairs recombine within nanoseconds, effective charge transfer to reactants is only possible if the electron donor or acceptor is pre-adsorbed onto the surface before the reaction starts [36]. To account for this, the adsorption equilibrium of MO was studied. Suspensions of the catalyst were stirred in darkness for 30 min to allow MO adsorption on the oxide surfaces to reach equilibrium. The amount of MO adsorbed on each oxide was determined by measuring the concentration difference before and after stirring.
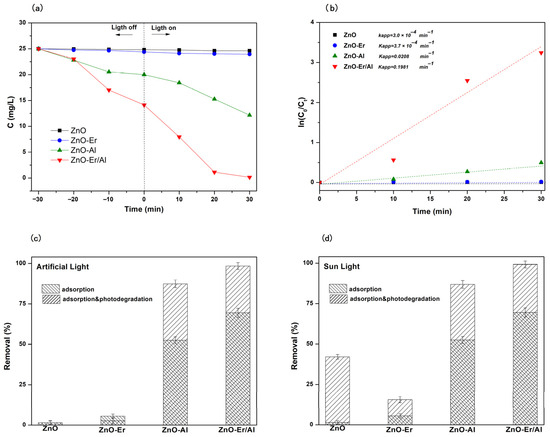
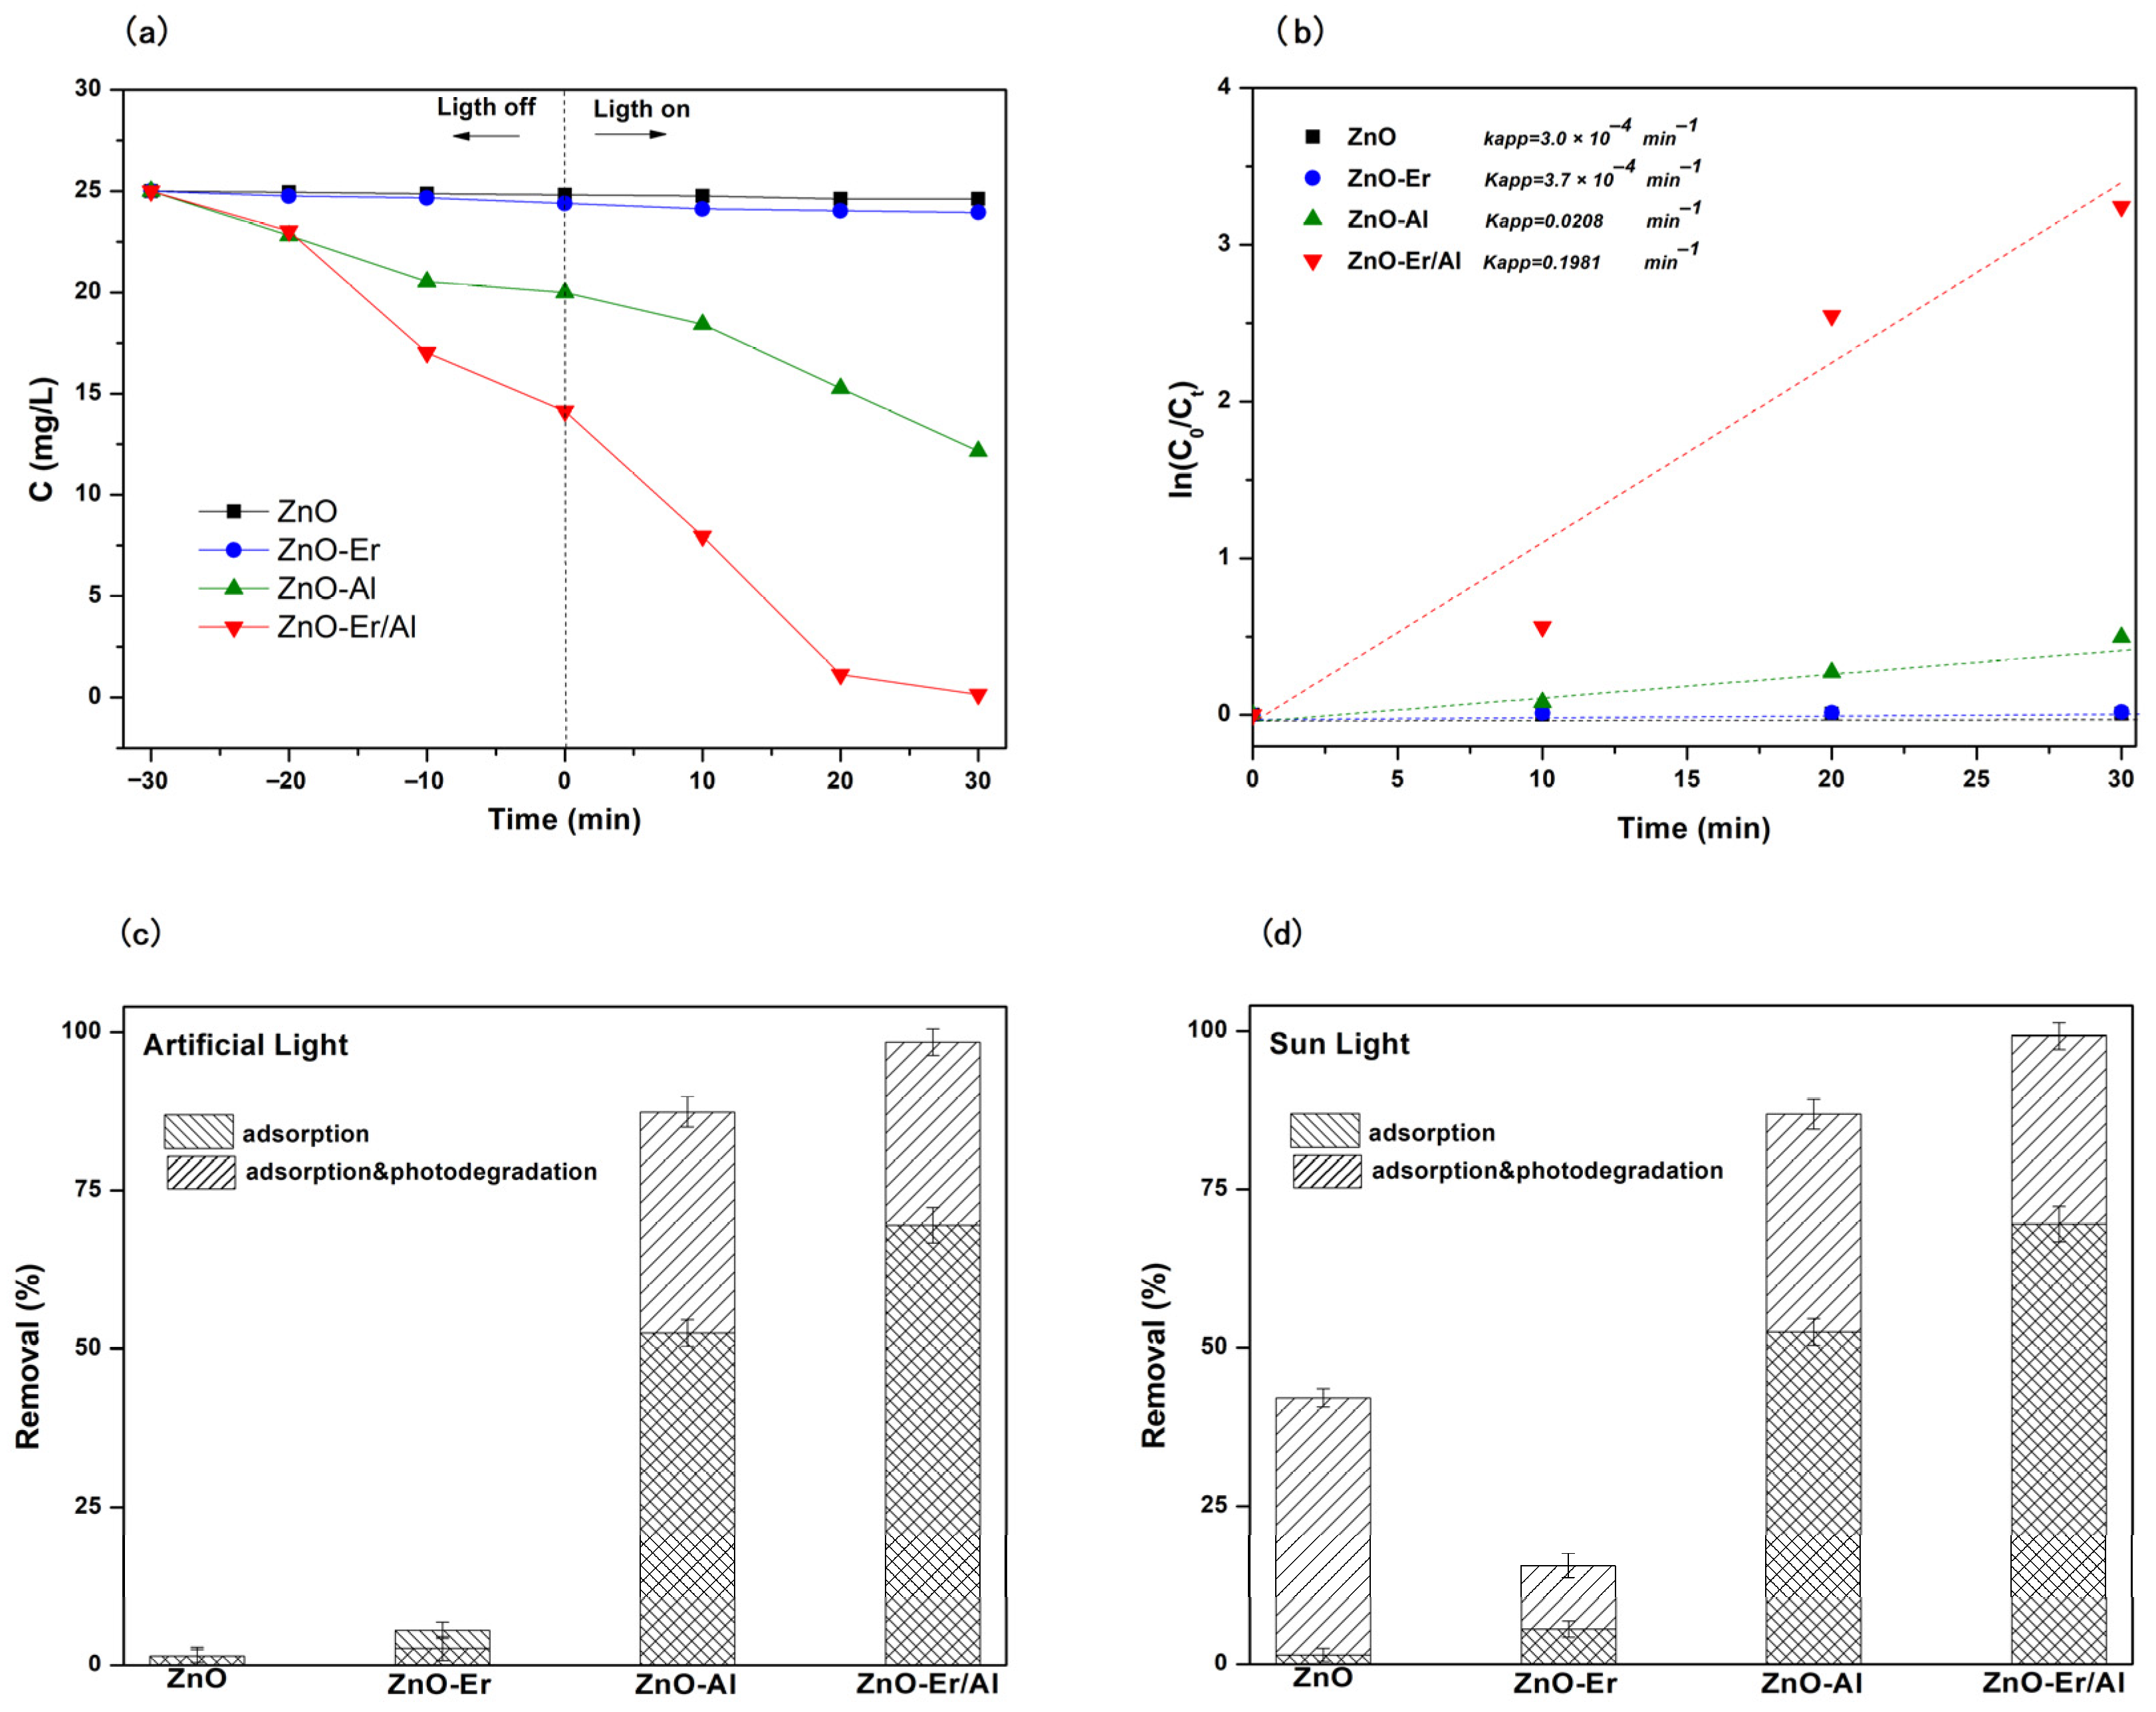
Preliminary adsorption of substrates is a critical factor for achieving high degradation efficiency. As summarized in Figure 4a, the adsorption capacity of the catalysts followed the order ZnO-Er/Al > ZnO-Al > ZnO-Er > ZnO. ZnO exhibited the lowest adsorption capacity for MO, while ZnO-Er/Al had the highest. All doped ZnO samples demonstrated stronger adsorption capacities than pure ZnO, suggesting that higher reactivity is likely in samples with stronger adsorption capacities. These data show a clear positive correlation between photocatalytic activity and the amount of substrate adsorbed on the catalyst surface, indicating that adsorption is crucial in defining the photocatalytic performance.
Figure 4.
Methyl orange photocatalytic degradation profiles (25 mg/L): (a) comparative photodegradation rates of MO in the presence of ZnO, ZnO-E, ZnO-Al and ZnO-Er/Al catalysts after 30 min of exposure; (b) kinetics of photocatalytic degradation of MO under visible light irradiation; (c,d) elimination of MO by photodegradation and adsorption in the dark plus photodegradation obtained from (a).
Additionally, ZnO co-doped with Er and Al exhibited a significantly enhanced removal efficiency, followed by ZnO doped solely with Al. In this study, the Al3+ ions act as electron and hole traps, effectively preventing recombination and thereby improving photocatalytic activity [19,37]. This improvement is linked to the presence of Al3+ ions on the catalyst surface, which, when positioned at the donor level, suppresses the recombination of excited electrons and holes within the valence band. Additionally, Al doping decreases the band gap energy, producing a side band that generates an intermediate energy level between the conduction and valence bands. This reduced band gap facilitates more efficient photocatalysis by reducing the energy barrier for electron excitation [19,38,39]. The following equations describe the proposed mechanism:
As shown in Equations (4) and (5), Al3+ ions may interact with electrons and holes, forming Al2+ and Al4+ species. These species are less stable than Al3+ and subsequently react with oxygen and hydroxyl ions on the catalyst surface to stabilize, generating superoxide and hydroxyl radicals [19]. Consequently, Al3+ ions capture electrons and holes, preventing recombination, and release them at the catalyst surface (Equations (6) and (7)).
Moreover, Er doping in ZnO-Al facilitated visible-to-UV up-conversion, which enhanced the photocatalytic oxidation of MO. This is due to Er3+’s ability to accommodate discrete 4f energy levels of rare-earth ions within ZnO’s broad forbidden band gap, thereby tuning excitation and emission wavelengths [40]. Although Er3+ has efficient luminescence in the green spectrum and low UV absorption, its doping with ZnO enhances both absorption and luminescence efficiency. Additionally, Er doping reduces the crystal size of ZnO, leading to an overall improvement in photocatalytic activity [32]. As a result, ZnO-Er/Al presents a promising class of luminescent materials.
In turn, Figure 4b shows ln(C0/Ct) as a function of irradiation times, and the calculated values of the apparent rate constant for ZnO and ZnO with different dopants. The highest value of the pseudo-first-order apparent rate constant (kapp) was obtained with a ZnO-Er/Al catalyst, compared to all other catalysts, and the lowest value was observed with ZnO. This result indicates that doping improves the photodegradation efficiency by almost a factor of 518, 259, and 9 with respect to ZnO doped with Al, Er, and pure ZnO, respectively. This result shows that MO degrades rapidly in the presence of the ZnO-Er/Al photocatalyst at a composition of 1.5 atomic % Er and 5 atomic % Al.
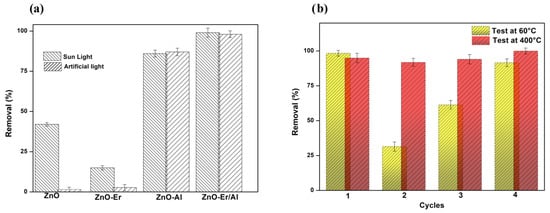
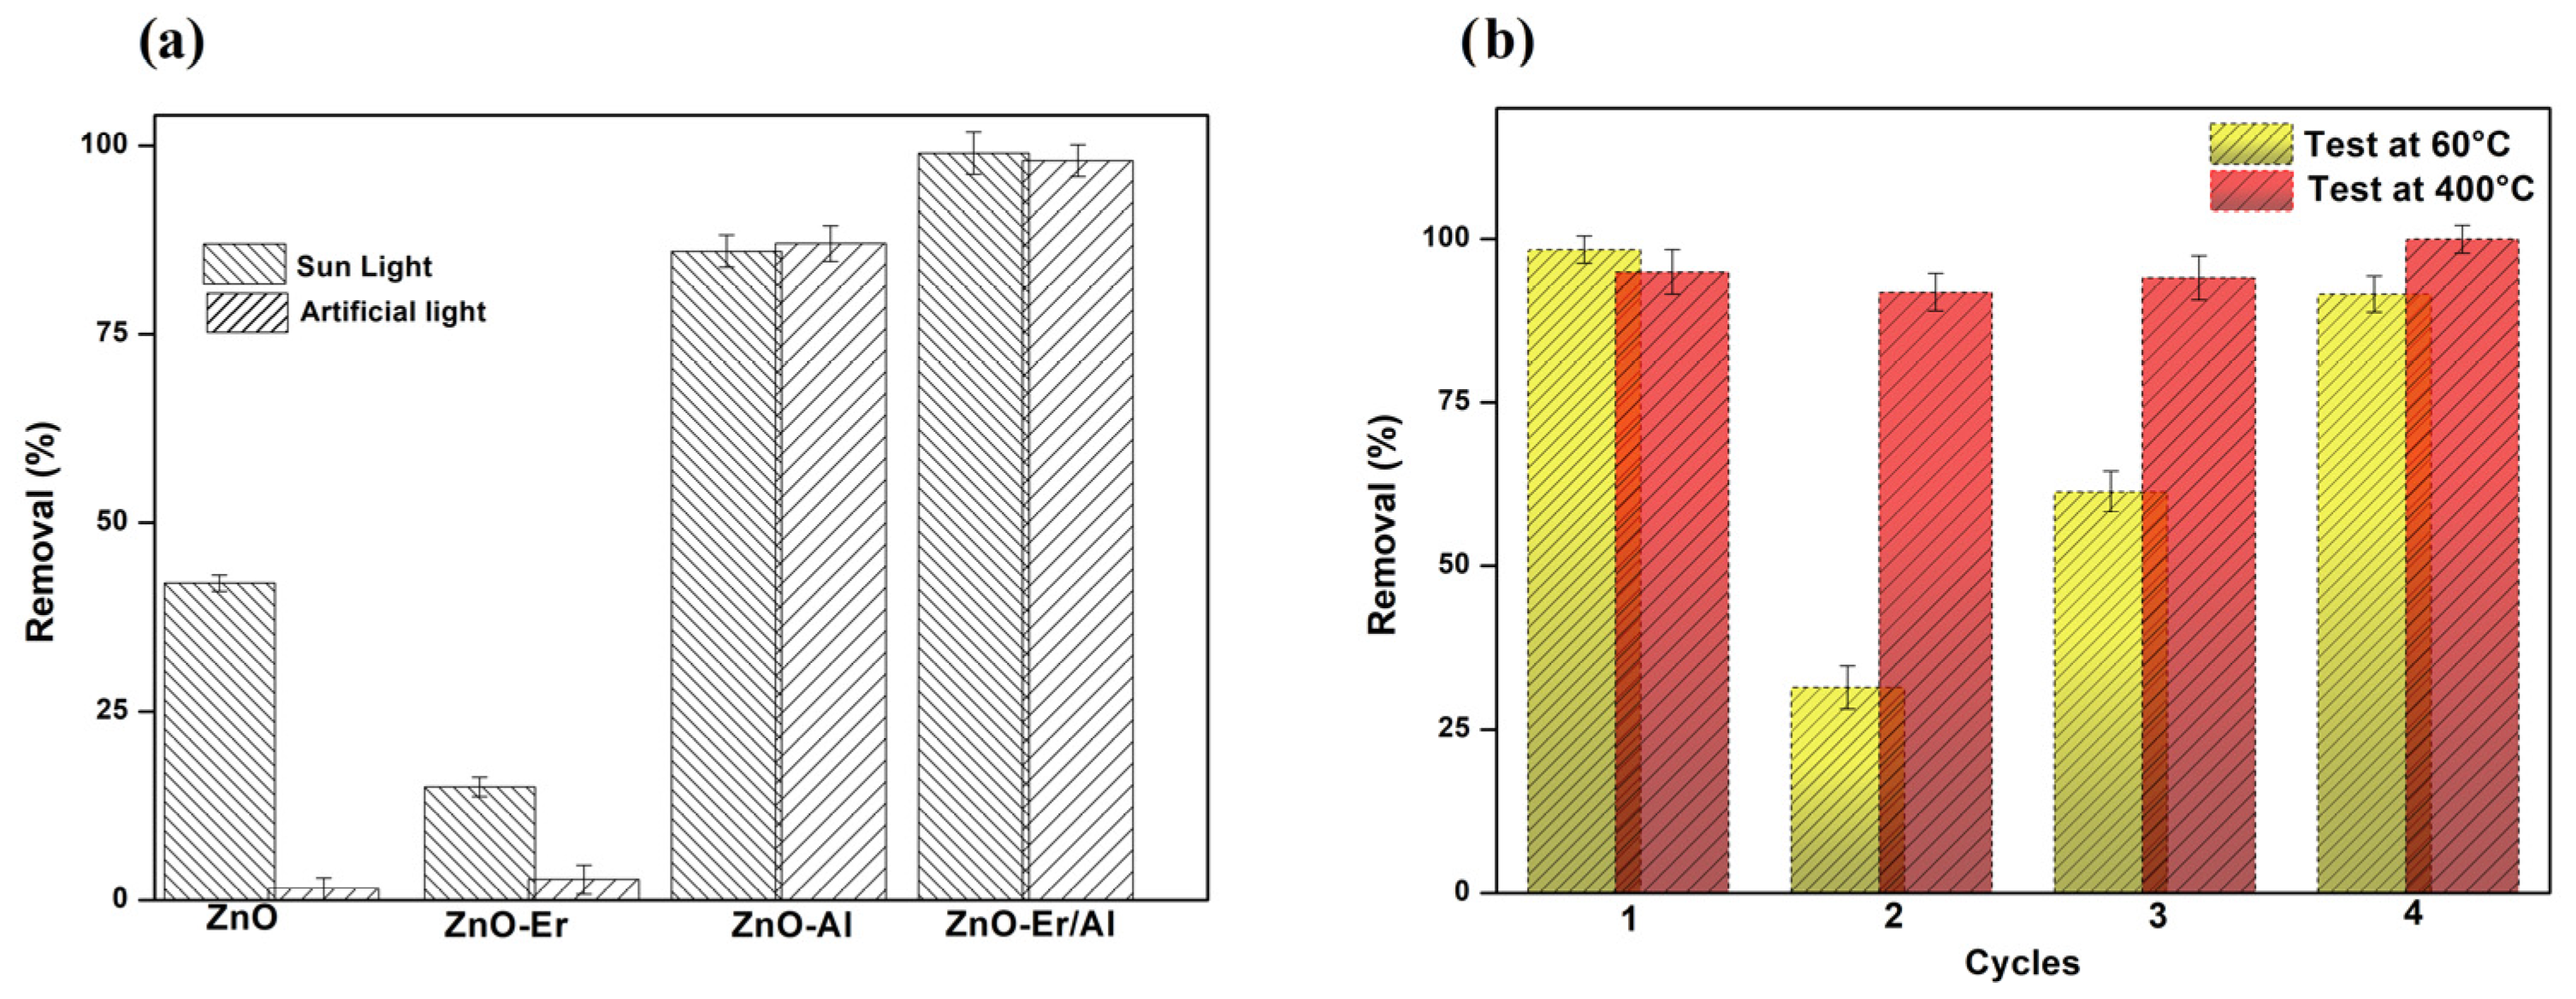
Interestingly, the Er-doped ZnO exhibited lower photocatalytic activity under artificial light (Figure 5a). This result may stem from the fact that the band gap energies of the rare the observation that the rare-earth oxides employed had band gap energies too low to trigger photocatalytic activity following UV irradiation [40,41]. In contrast, ZnO-Er showed a slight improvement in photocatalytic activity under sunlight (Figure 5a), which may be attributed to the high level of UV radiation in Quito, Ecuador, during the evaluation period. This observation is further supported by an increase in pure ZnO’s photocatalytic activity under sunlight as well. Also, under irradiation of sunlight, the ZnO-Er/Al catalyst showed high MO removal.
Figure 5.
(a) Comparison of MO degradation under artificial white light (18 W) and sunlight irradiation; (b) cyclic performance of the ZnO-Er/Al catalyst for two reuse conditions.
The cyclic performance was carried out in two ways to obtain a more robust result. The first method was carried out by simply drying the catalyst at 60 °C for 1 h. The catalyst was then used in the next cycle, and this procedure was repeated for each cycle. On the other hand, the second method was carried out by calcining the sample at 400 °C after each cycle. The results are shown in Figure 5b.
As can be seen in Figure 5b, there is a decrease in kinetic performance if the catalyst is only dried at 60 °C for the second cycle of use. This may be due to the inevitable loss of photocatalysts during the cyclic processes. However, ZnO-Er/Al showed an increase in performance for the following cycles, improving photocatalytic activity and stability under visible irradiation during the following cycles. It could be due to the catalyst being conditioned. In addition, the photocatalytic performance after being treated at 400 °C shows high photocatalytic activity and stability under light irradiation over time and cycles of use, demonstrating that the ZnO-Er/Al photocatalyst can maintain stable performance.
3.6. Determination of Antibacterial Activity of Doped and Undoped ZnO Samples
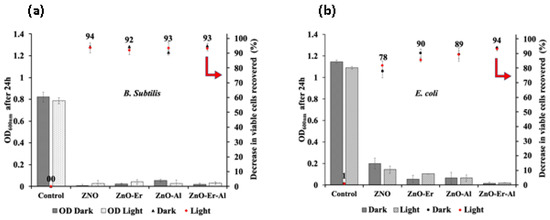
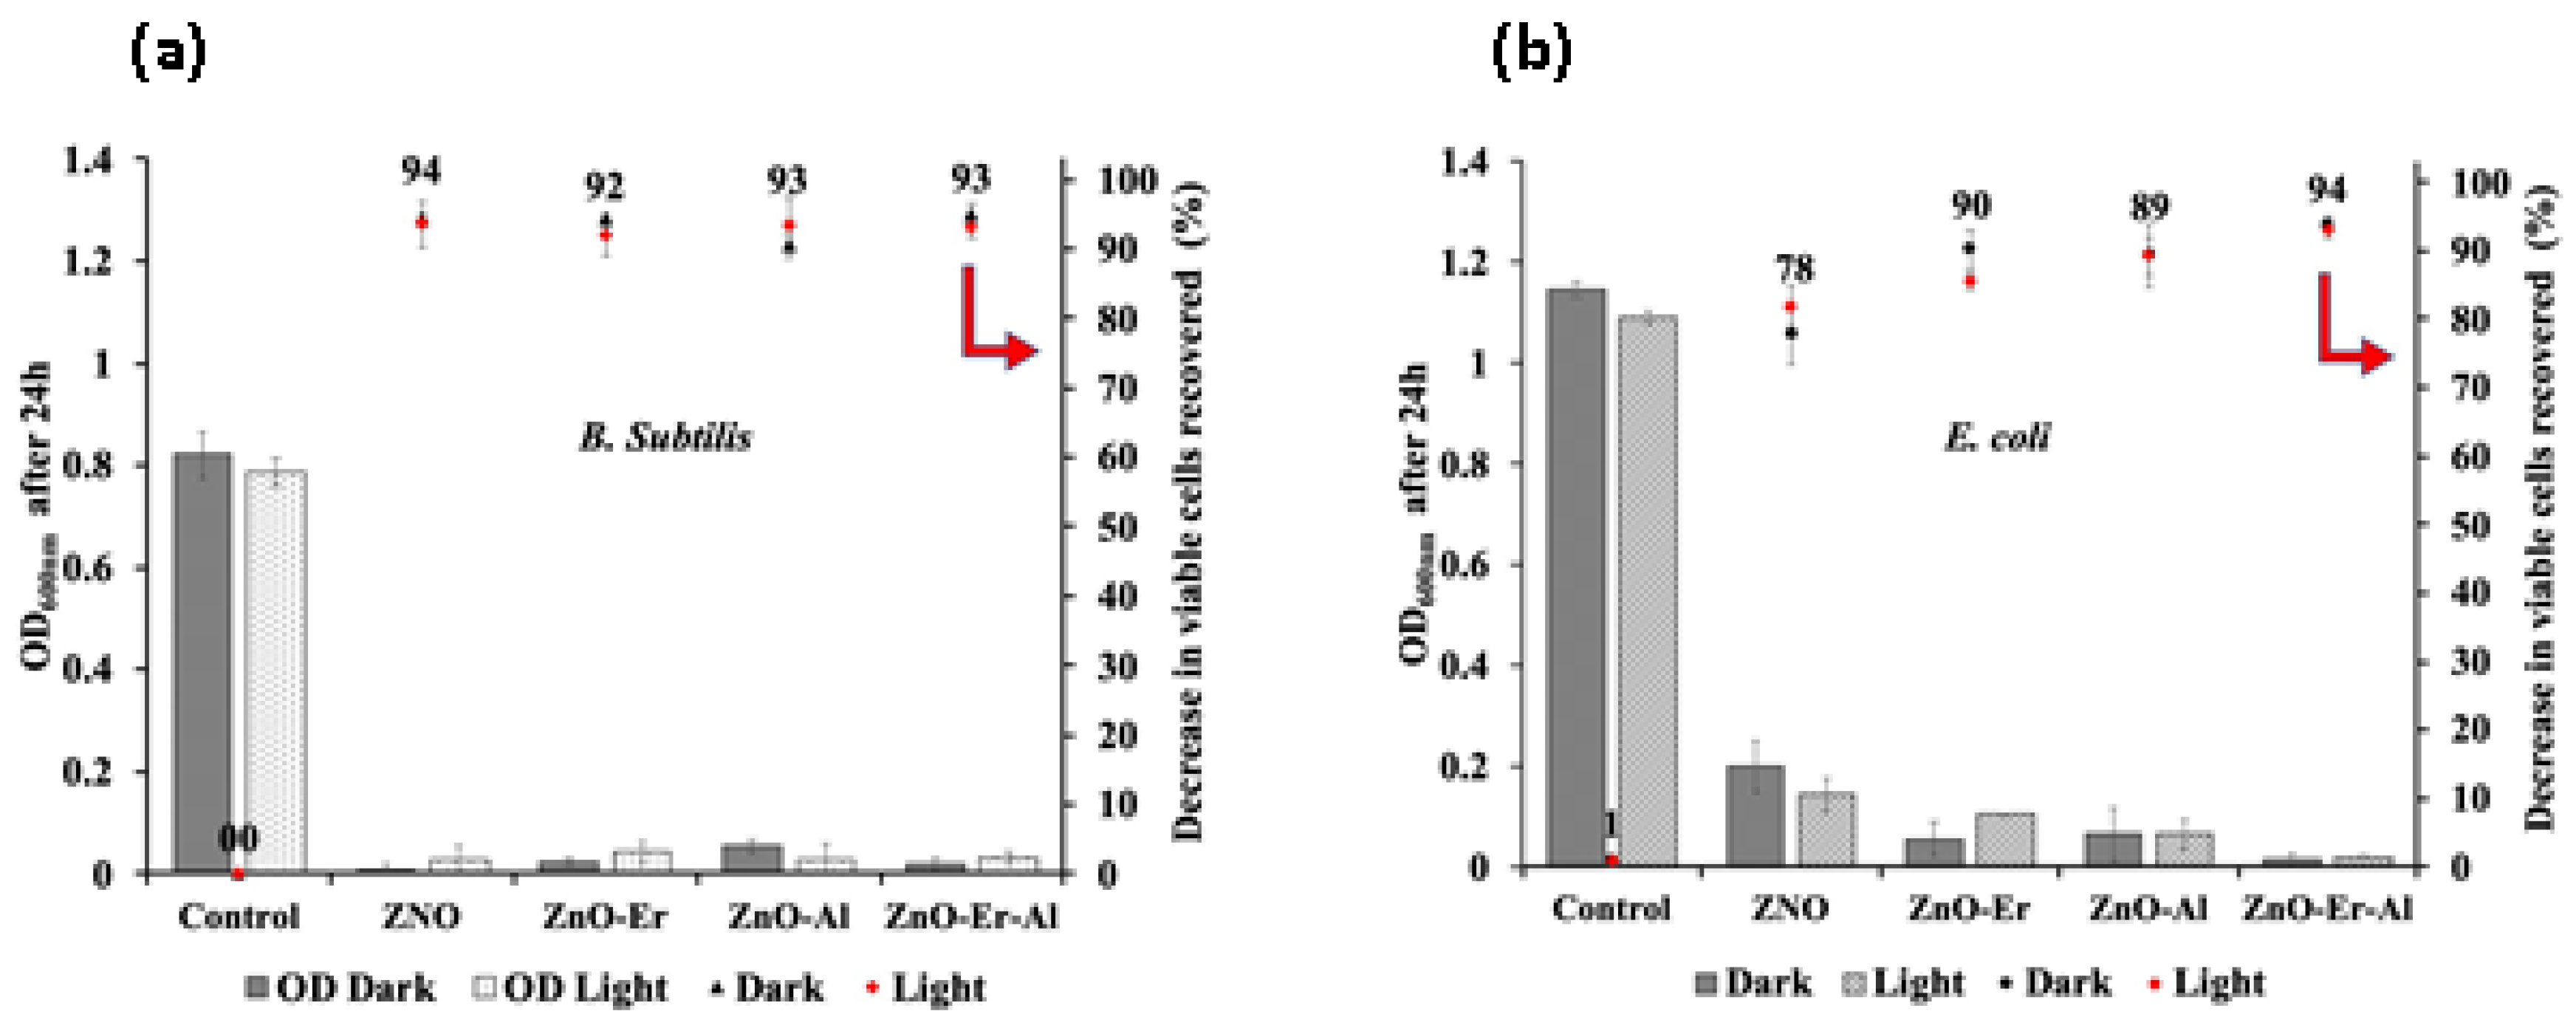
The catalyst concentration of 0.03% wt was found to be an effective minimum inhibitory concentration (MIC) against Bacillus subtilis and Escherichia coli under both dark and illuminated conditions, as depicted in Figure 6.
Figure 6.
Effect of dopant on ZnO nanoparticles in inhibiting the growth of (a) B. subtilis and (b) E. coli strains. Bacterial growth was assessed by measuring optical density (OD) at 600 nm after 24 h, while inhibition was determined by counting viable colonies recovered from TSA plates after 24 h of incubation at 37 °C.
For B. subtilis, all catalysts exhibited remarkable bacterial growth inhibition (~93%). Notably, the dopants had no adverse effect on the inhibition of B. subtillis growth, as shown in Figure 5a. In the case of E. coli, the undoped ZnO displayed a lower inhibitory activity (78%) compared to the doped samples. Doping appeared to enhance the inhibitory effects, with the ZnO-Er/Al sample demonstrating the highest antibacterial activity (94%) among the doped samples (Figure 6b).
ZnO is known to function as a photocatalyst under UV irradiation, which could lead to the production involving the generation of reactive oxygen species (ROS). Nevertheless, the antibacterial assays in this study also produced positive outcomes under dark conditions. These findings indicate that ZnO retains its antibacterial properties even in the absence of light, consistent with previous studies [42].
The antimicrobial effect of ZnO nanoparticles on Gram-positive and Gram-negative bacteria may stem from their capacity to produce reactive oxygen species (ROS) and form coordination bonds between metal ions and the nitrogen, oxygen, or sulfur atoms present in biomolecules [41,43]. The enhanced inhibition of B. subtilis could be due to the greater ability of Zn2+ ions to penetrate and damage the cell walls of Gram-positive bacteria, which tend to be softer than those of Gram-negative species such as E. coli. Although the exact reason for zinc’s different affinity towards Gram-positive bacteria remains unclear, it could be related to differences in the protein composition of their cell walls [44].
ROS promote mass transport and dispersion of reactive molecules produced by mitochondria. They can damage cellular DNA and proteins either directly via diffusion or through the formation of endocytic vesicles. Once particles enter the cytoplasm or nucleus, they may disrupt the plasma membrane or DNA integrity [45]. Additionally, doping ZnO nanoparticles with ions may enhance their antibacterial activity. Saxena & Pandey (2019) demonstrated that Al-doped ZnO nanoparticles showed superior antibacterial activity against E. coli and E. hirae compared to undoped ZnO, likely due to electrostatic interactions between the bacterial cell and positively charged Al-doped nanoparticles [46]. Similarly, studies have found that lanthanide oxide nanoparticles, including Er oxide, are effective against E. coli and Pseudomonas aeruginosa under both dark and light conditions [47].
In this study, Er and Al co-doping of ZnO significantly increased antibacterial activity against E. coli compared to undoped ZnO. Furthermore, the co-doping did not negatively affect the high antibacterial efficacy exhibited by pure ZnO against B. subtillis.
The ANOVA analysis showed that there is a significant difference in the antibacterial properties against Bacillus subtilis and E. coli among all photocatalysts. A Tukey test was performed to highlight the differences between catalysts. The Tukey test showed that the addition of erbium to ZnO decreased the activity against B. subtilis from 94% for ZnO to 92% for ZnO-Er. However, both ZnO-Al and ZnO-Er/Al did not show a decrease in the inhibition of B. subtilis, which means that the excellent antibacterial properties of ZnO against this Gram-positive bacterium are maintained when doped with Al and Er-Al. In turn, there is a significant difference in the antibacterial properties against E. coli. These results show that the dopants increased the antibacterial activity against this Gram-negative bacterium, which went from 78% for ZnO to 94% inhibition for ZnO-Er/Al. This shows that doping ZnO with these metals improves its antibacterial properties.
In order to obtain a better overview of the results obtained in this manuscript, Table 3 shows a comparison between recent studies of similar dopants.
Table 3.
Schematic representation of different doped ZnO nanostructures.
Table 3 shows that the removal time of our catalyst is superior in comparison with the studies reported. It can also be observed that the concentration of the pollutant treated in this study is among the highest compared with the other studies. Also, even though there are studies with similar dopants but different compositions, the light source used in this study is one of the lowest energy consumption ones (18 W LED and solar light). This could be since the composition and porosity of this catalyst have increased the contact surface, improving adsorption and subsequent photocatalysis [22].
4. Conclusions
The ZnO–Er/Al photocatalyst synthesized via the sol–gel method demonstrated a straightforward and versatile preparation process, yielding materials with high photocatalytic efficiency. SEM-EDX analysis confirmed the successful incorporation of Er3+ and Al3+ ions into the ZnO lattice. While Er doping alone slightly reduced photocatalytic activity, Al doping significantly enhanced it, and co-doping with both elements produced the highest degradation efficiency of methyl orange (MO). Comparable performance was observed under artificial and natural sunlight, with a slight improvement under sunlight, attributed to the extended light absorption of the co-doped catalyst and the resulting band gap narrowing. This indicates that natural sunlight can effectively substitute artificial irradiation for MO degradation, offering a cost-effective alternative for photocatalytic applications. Regarding antibacterial activity, Er/Al co-doping enhanced the suppression of E. coli compared to pure ZnO, while maintaining strong antibacterial performance against B. subtilis. Overall, these results underscore the potential of ZnO–Er/Al photocatalysts as multifunctional materials for environmental remediation and antimicrobial applications.
Supplementary Materials
The following supporting information can be downloaded at: https://www.mdpi.com/article/10.3390/cleantechnol8020053/s1, Figure S1: Following a comparison of various light sources, it was concluded that there were no significant differences in photocatalytic performance across the different lamps. Therefore, only the results obtained using the 18W LED lamp are presented here, due to its lower energy consumption compared to the other light sources tested.; Table S1: Tukey HSD—B. subtilis. The statistical significance of the differences was confirmed by ANOVA.; Table S2: Tukey HSD—E. coli. The statistical significance of the differences was confirmed by ANOVA.
Author Contributions
Conceptualization, R.B.S. and J.E.; Methodology, R.B.S., J.E., M.N., B.D.C.-P., L.E.M., K.V. and M.R.-B.; Software, H.P.; Validation, V.T. and P.L.; Formal analysis, R.B.S. and J.E.; Investigation, R.B.S., J.E., I.G., M.N., B.D.C.-P., L.E.M., K.V. and M.R.-B.; Resources, H.P.; Data curation, H.P. and V.T.; Writing—original draft preparation, J.E. and R.B.S.; Writing—review and editing, R.B.S., H.P. and P.L.; Visualization, R.B.S. and H.P.; Supervision, R.B.S.; Project administration, R.B.S.; Funding acquisition, R.B.S. and P.L. All authors have read and agreed to the published version of the manuscript.
Funding
Senior Projects at the Central University of Ecuador Research Department—No. DI-CONV-2025-018.
Institutional Review Board Statement
Not applicable.
Informed Consent Statement
Not applicable.
Data Availability Statement
The original contributions presented in this study are included in the article/Supplementary Material. Further inquiries can be directed to the corresponding author(s).
Acknowledgments
The authors would like to thank the Académie de Recherche et d’Enseignement Supérieur (ARES) and the Central University of Ecuador for funding this work (No. DI-CONV-2025-018). The authors are very grateful to Frédéric Van Wonterghem and Laurence Ryelandt, from the Materials and Processes Engineering (IMAP) center at UCLouvain, for the SEM and EDX measurements. Finally, the authors would like to thank Eric Gaigneaux and the National Fund for Scientific Research (FNRS-FRS, Belgium) for the UV-VIS DRS and Alexis Debut Department of Life Sciences and Agriculture, Center for Nanoscience and Nanotechnology, Armed Forces ESPE University, Sangolquí, Ecuador.
Conflicts of Interest
The authors declare no conflict of interest.
References
- Singhal, N.; Selvaraj, S.; Sivalingam, Y.; Venugopal, G. Study of photocatalytic degradation efficiency of rGO/ZnO nano-photocatalyst and their performance analysis using scanning Kelvin probe. J. Environ. Chem. Eng. 2022, 10, 107293. [Google Scholar] [CrossRef] [Scilit]
- Anandan, S.; Ponnusamy, V.K.; Ashokkumar, M. A review on hybrid techniques for the degradation of organic pollutants in aqueous environment. Ultrason. Sonochem. 2020, 67, 105130. [Google Scholar] [CrossRef] [Scilit]
- Zhu, H.; Jiang, R.; Fu, Y.; Guan, Y.; Yao, J.; Xiao, L.; Zeng, G. Effective photocatalytic decolorization of methyl orange utilizing TiO2/ZnO/chitosan nanocomposite films under simulated solar irradiation. Desalination 2012, 286, 41–48. [Google Scholar] [CrossRef] [Scilit]
- Mirzaeifard, Z.; Shariatinia, Z.; Jourshabani, M.; Rezaei Darvishi, S.M. ZnO Photocatalyst Revisited: Effective Photocatalytic Degradation of Emerging Contaminants Using S-Doped ZnO Nanoparticles under Visible Light Radiation. Ind. Eng. Chem. Res. 2020, 59, 15894–15911. [Google Scholar] [CrossRef] [Scilit]
- Oturan, M.A.; Aaron, J.J. Advanced oxidation processes in water/wastewater treatment: Principles and applica-tions. A review. Crit. Rev. Environ. Sci. Technol. 2014, 44, 2577–2641. [Google Scholar] [CrossRef] [Scilit]
- Weldegebrieal, G.K. Synthesis method, antibacterial and photocatalytic activity of ZnO nanoparticles for azo dyes in wastewater treatment: A review. Inorg. Chem. Commun. 2020, 120, 108140. [Google Scholar] [CrossRef] [Scilit]
- Pan, L.; Shen, G.-Q.; Zhang, J.-W.; Wei, X.-C.; Wang, L.; Zou, J.-J.; Zhang, X. TiO2-ZnO Composite Sphere Decorated with ZnO Clusters for Effective Charge Isolation in Photocatalysis. Ind. Eng. Chem. Res. 2015, 54, 7226–7232. [Google Scholar] [CrossRef] [Scilit]
- Zyoud, A.H.; Zubi, A.; Hejjawi, S.; Helal, M.H.; Zyoud, S.H.; Qamhieh, N.; Hajamohideen, A.; Hilal, H.S. Removal of acetaminophen from water by simulated solar light photodegradation with ZnO and TiO2 nanoparticles: Catalytic efficiency assessment for future prospects. J. Environ. Chem. Eng. 2020, 8, 104038. [Google Scholar] [CrossRef] [Scilit]
- Tekin, D.; Kiziltas, H.; Ungan, H. Kinetic evaluation of ZnO/TiO2 thin film photocatalyst in photocatalytic degradation of Orange G. J. Mol. Liq. 2020, 306, 112905. [Google Scholar] [CrossRef] [Scilit]
- Araújo, E.S.; Da Costa, B.P.; Oliveira, R.A.P.; Libardi, J.; Faia, P.M.; De Oliveira, H.P. TiO2/ZnO hierarchical heteronanostructures: Synthesis, characterization and application as photocatalysts. J. Environ. Chem. Eng. 2016, 4, 2820–2829. [Google Scholar] [CrossRef] [Scilit]
- Rajeshwar, K.; Osugi, M.; Chanmanee, W.; Chenthamarakshan, C.; Zanoni, M.; Kajitvichyanukul, P.; Krishnan-Ayer, R. Heterogeneous photocatalytic treatment of organic dyes in air and aqueous media. J. Photochem. Photobiol. C Photochem. Rev. 2008, 9, 171–192. [Google Scholar] [CrossRef] [Scilit]
- Adams, L.K.; Lyon, D.Y.; Alvarez, P.J.J. Comparative eco-toxicity of nanoscale TiO2, SiO2, and ZnO water suspensions. Water Res. 2006, 40, 3527–3532. [Google Scholar] [CrossRef] [Scilit]
- Balta, S.; Sotto, A.; Luis, P.; Benea, L.; Van der Bruggen, B.; Kim, J. A new outlook on membrane enhancement with nanoparticles: The alternative of ZnO. J. Membr. Sci. 2012, 389, 155–161. [Google Scholar] [CrossRef] [Scilit]
- Yoon, J.; Oh, S.-G. Synthesis of amine modified ZnO nanoparticles and their photocatalytic activities in micellar solutions under UV irradiation. J. Ind. Eng. Chem. 2021, 96, 390–396. [Google Scholar] [CrossRef] [Scilit]
- Daghrir, R.; Drogui, P.; Robert, D. Modified TiO2 for environmental photocatalytic applications: A review. Ind. Eng. Chem. Res. 2013, 52, 3581–3599. [Google Scholar] [CrossRef] [Scilit]
- Gomez-Solís, C.; Ballesteros, J.; Torres-Martínez, L.; Juárez-Ramírez, I.; Torres, L.D.; Zarazua-Morin, M.E.; Lee, S.W. Rapid synthesis of ZnO nano-corncobs from Nital solution and its application in the photodeg-radation of methyl orange. J. Photochem. Photobiol. A Chem. 2015, 298, 49–54. [Google Scholar] [CrossRef] [Scilit]
- Ahmad, I.; Shukrullah, S.; Naz, M.Y.; Bhatti, H.N.; Ahmad, M.; Ahmed, E.; Ullah, S.; Hussien, M. Recent Progress in Rare Earth Oxides and Carbonaceous Materials Modified ZnO Heterogeneous Photocatalysts for Environmental and Energy Applications. J. Environ. Chem. Eng. 2022, 10, 107762. [Google Scholar] [CrossRef] [Scilit]
- de Lara Andrade, J.; Oliveira, A.G.; Mariucci, V.V.G.; Bento, A.C.; Companhoni, M.V.; Nakamura, C.V.; Lima, S.M.; da Cunha Andrade, L.H.; Moraes, J.C.G.; Hechenleitner, A.A.W.; et al. Effects of Al3+ concentration on the optical, structural, photocatalytic and cytotoxic properties of Al-doped ZnO. J. Alloys Compd. 2017, 729, 978–987. [Google Scholar] [CrossRef] [Scilit]
- Mahdavi, R.; Talesh, S.S.A. Sol-gel synthesis, structural and enhanced photocatalytic performance of Al doped ZnO nanoparticles. Adv. Powder Technol. 2017, 28, 1418–1425. [Google Scholar] [CrossRef] [Scilit]
- Lee, K.M.; Lai, C.W.; Ngai, K.S.; Juan, J.C. Recent developments of zinc oxide based photocatalyst in water treatment technology: A review. Water Res. 2016, 88, 428–448. [Google Scholar] [CrossRef] [Scilit]
- Eliseeva, S.V.; Bünzli, J.-C.G. Rare earths: Jewels for functional materials of the future. New J. Chem. 2011, 35, 1165–1176. [Google Scholar] [CrossRef] [Scilit]
- Shukla, S.; Sharma, D.K. A review on rare earth (Ce and Er)-doped zinc oxide nanostructures. Mater. Today Proc. 2021, 34, 793–801. [Google Scholar] [CrossRef] [Scilit]
- Zhang, X.; Dong, S.; Zhou, X.; Yan, L.; Chen, G.; Zhou, D. A facile one-pot synthesis of Er-Al co-doped ZnO nanoparticles with enhanced photocatalytic performance under visible light. Mater. Lett. 2015, 143, 312–314. [Google Scholar] [CrossRef] [Scilit]
- Prathap Kumar, M.P.; Suganya Josephine, G.A.; Tamilarasan, G.; Sivasamy, A.; Sridevi, J. Rare earth doped semiconductor nanomaterials and its photocatalytic and antimicrobial activities. J. Environ. Chem. Eng. 2018, 6, 3907–3917. [Google Scholar] [CrossRef] [Scilit]
- Ghomri, R.; Shaikh, M.N.; Ahmed, M.I.; Song, W.; Cai, W.; Bououdina, M.; Ghers, M. Pure and (Er, Al) co-doped ZnO nanoparticles: Synthesis, characterization, magnetic and photocata-lytic properties. J. Mater. Sci. Mater. Electron. 2018, 29, 10677–10685. [Google Scholar] [CrossRef] [Scilit]
- Chen, X.; Wu, Z.; Liu, D.; Gao, Z. Preparation of ZnO Photocatalyst for the Efficient and Rapid Photocatalytic Degradation of Azo Dyes. Nanoscale Res. Lett. 2017, 12, 4–13. [Google Scholar] [CrossRef] [Scilit]
- Rajamanickam, D.; Shanthi, M. Photocatalytic degradation of an organic pollutant, 4-nitrophenol by zinc oxide—UV process. Res. J. Chem. Environ. 2012, 9, S1858–S1868. [Google Scholar]
- Secretaría de Ambiente del Gobierno de Quito. Available online: https://iuv.quito.gob.ec/ (accessed on 10 November 2025).
- Divya, N.K.; Pradyumnan, P.P. Solid state synthesis of erbium doped ZnO with excellent photocatalytic activity and enhanced visible light emission. Mater. Sci. Semicond. Process. 2016, 41, 428–435. [Google Scholar] [CrossRef] [Scilit]
- Bououdina, M.; Azzaza, S.; Ghomri, R.; Shaikh, M.N.; Dai, J.H.; Song, Y.; Song, W.; Cai, W.; Ghers, M. Structural and magnetic properties and DFT analysis of ZnO:(Al,Er) nanoparticles. RSC Adv. 2017, 7, 32931–32941. [Google Scholar] [CrossRef] [Scilit]
- Makuła, P.; Pacia, M.; Macyk, W. How To Correctly Determine the Band Gap Energy of Modified Semiconductor Photocatalysts Based on UV-Vis Spectra. J. Phys. Chem. Lett. 2018, 9, 6814–6817. [Google Scholar] [CrossRef] [Scilit]
- Viezbicke, B.D.; Patel, S.; Davis, B.E.; Birnie, D.P. Evaluation of the Tauc method for optical absorption edge determination: ZnO thin films as a model system. Phys. Status Solidi B Basic Res. 2015, 252, 1700–1710. [Google Scholar] [CrossRef] [Scilit]
- Ullattil, S.G.; Periyat, P.; Naufal, B.; Lazar, M.A. Self-Doped ZnO Microrods—High Temperature Stable Oxygen Deficient Platforms for Solar Photocatalysis. Ind. Eng. Chem. Res. 2016, 55, 6413–6421. [Google Scholar] [CrossRef] [Scilit]
- Kumar, M.R.A.; Ravikumar, C.R.; Nagaswarupa, H.P.; Purshotam, B.; Gonfa, B.; Murthy, H.A.; Sabir, F.K.; Tadesse, S. Evaluation of bi-functional applications of ZnO nanoparticles prepared by green and chemical methods. J. Environ. Chem. Eng. 2019, 7, 103468. [Google Scholar] [CrossRef] [Scilit]
- Zhang, X.; Chen, Y.; Zhang, S.; Qiu, C. High photocatalytic performance of high concentration Al-doped ZnO nanoparticles. Sep. Purif. Technol. 2017, 172, 236–241. [Google Scholar] [CrossRef] [Scilit]
- Xu, A.W.; Gao, Y.; Liu, H.Q. The preparation, characterization, and their photocatalytic activities of ra-re-earth-doped TiO2 nanoparticles. J. Catal. 2002, 207, 151–157. [Google Scholar] [CrossRef] [Scilit]
- Tao, S.; Yang, M.; Chen, H.; Zhao, S.; Chen, G. Continuous Synthesis of Ag/AgCl/ZnO Composites Using Flow Chemistry and Photocatalytic Application. Ind. Eng. Chem. Res. 2018, 57, 3263–3273. [Google Scholar] [CrossRef] [Scilit]
- Fu, M.; Li, Y.; Wu, S.; Lu, P.; Liu, J.; Dong, F. Sol-gel preparation and enhanced photocatalytic performance of Cu-doped ZnO nanoparticles. Appl. Surf. Sci. 2011, 258, 1587–1591. [Google Scholar] [CrossRef] [Scilit]
- Dong, S.; Xu, K.; Liu, J.; Cui, H. Photocatalytic performance of ZnO:Fe array films under sunlight irradiation. Phys. B Condens. Matter 2011, 406, 3609–3612. [Google Scholar] [CrossRef] [Scilit]
- Layek, A.; Banerjee, S.; Manna, B.; Chowdhury, A. Synthesis of rare-earth doped ZnO nanorods and their de-fect-dopant correlated enhanced visible-orange luminescence. RSC Adv. 2016, 6, 35892–35900. [Google Scholar] [CrossRef] [Scilit]
- Prasert, A.; Sontikaew, S.; Sriprapai, D.; Chuangchote, S. Polypropylene/ZnO Nanocomposites: Mechanical Properties, Photocatalytic Dye Degradation, and Antibacterial Property. Materials 2020, 13, 914. [Google Scholar] [CrossRef] [Scilit]
- Zhang, L.; Jiang, Y.; Ding, Y.; Povey, M.; York, D. Investigation into the antibacterial behaviour of suspensions of ZnO nanoparticles (ZnO nanofluids). J. Nanopart. Res. 2007, 9, 479–489. [Google Scholar] [CrossRef] [Scilit]
- Raghupathi, K.R.; Koodali, R.T.; Manna, A.C. Size-dependent bacterial growth inhibition and mechanism of antibacterial activity of zinc oxide nanoparticles. Langmuir 2011, 27, 4020–4028. [Google Scholar] [CrossRef] [Scilit] [PubMed]
- Soria, R.B.; Zhu, J.; Gonza, I.; Van der Bruggen, B.; Luis, P. Effect of (TiO2: ZnO) ratio on the anti-fouling properties of bio-inspired nanofiltration membranes. Sep. Purif. Technol. 2020, 251, 117280. [Google Scholar] [CrossRef] [Scilit]
- Munawar, T.; Yasmeen, S.; Mukhtar, F.; Nadeem, M.S.; Mahmood, K.; Saif, M.S.; Hasan, M.; Ali, A.; Hussain, F.; Iqbal, F. Zn0.9Ce 0.05M0.05O (M = Er, Y, V) nanocrystals: Structural and energy bandgap engineering of ZnO for enhancing photocatalytic and antibacterial activity. Ceram. Int. 2020, 46, 14369–14383. [Google Scholar] [CrossRef] [Scilit]
- Saxena, V.; Pandey, L.M. Synthesis, characterization and antibacterial activity of aluminum doped zinc oxide. Mater. Today Proc. 2019, 18, 1388–1400. [Google Scholar] [CrossRef] [Scilit]
- Dědková, K.; Kuzníková, Ľ.; Pavelek, L.; Matějová, K.; Kupková, J.; Barabaszová, K.Č.; Váňa, R.; Burda, J.; Vlček, J.; Cvejn, D.; et al. Daylight induced antibacterial activity of gadolinium oxide, samarium oxide and erbium oxide nanoparticles and their aquatic toxicity. Mater. Chem. Phys. 2017, 197, 226–235. [Google Scholar] [CrossRef] [Scilit]
- Jangir, L.K.; Bansal, P.; Kumari, Y.; Swami, K.; Kumar, M.; Singh, G.; Awasthi, K. Effective Doping of Er3+ in ZnO Nanoparticles to Control Its Luminescent Properties. Macromol. Symp. 2017, 375, 1700005. [Google Scholar] [CrossRef] [Scilit]
- Bedhouche, F.; Soualah, A.; Djouadi, D.; Ahouari, H.; Tayeb, K.B. Photoactivity Properties of ZnO-Doped Erbium: Synthesis, Characterization, and EPR Spectroscopy Investigation. Water Air Soil Pollut. 2024, 235, 6. [Google Scholar] [CrossRef] [Scilit]

Disclaimer/Publisher’s Note: The statements, opinions and data contained in all publications are solely those of the individual author(s) and contributor(s) and not of MDPI and/or the editor(s). MDPI and/or the editor(s) disclaim responsibility for any injury to people or property resulting from any ideas, methods, instructions or products referred to in the content. |
© 2026 by the authors. Licensee MDPI, Basel, Switzerland. This article is an open access article distributed under the terms and conditions of the Creative Commons Attribution (CC BY) license.