


Abstract
Ecoenzymatic stoichiometry links extracellular enzyme allocation to microbial resource-acquisition patterns, yet its behavior in managed subtropical soils remains poorly resolved. This uncertainty is especially important where strong edaphic heterogeneity may modify within-season enzyme patterns. We compared Pre (before cover-crop planting) and Post (after cover-crop termination) soils in two contrasting Florida agroecosystems: a calcareous South Florida Summer system (six farms; n = 104) and a sandy North Florida Winter system (four farms; n = 90). Each system was analyzed independently because season, geography, soil order, and cover-crop assemblage were confounded. In the Summer system, BG and NAG were higher Post than Pre, whereas ACP and AS did not differ significantly; vector length was lower Post, while circular vector-angle summaries remained within the P-acquisition domain. In the Winter system, BG, NAG, ACP, and microbial biomass C were lower Post, whereas AS was higher; C:N and N:P enzyme ratios did not differ significantly, and only C:P declined. Circular statistics showed that apparent shifts based on arithmetic vector-angle means could result from angular wraparound at ±180°. Variance partitioning indicated a larger pure Phase fraction in Summer than Winter, but these fractions are descriptive within-system associations rather than evidence of a climatic effect. Overall, ecoenzymatic responses differed between Pre and Post phases in a system-specific manner, and circular treatment of vector angles together with soil-specific interpretation is necessary for robust subtropical soil-health assessment.
1. Introduction
Soil extracellular enzymes catalyze the proximate steps of organic-matter decomposition and nutrient mineralization in terrestrial ecosystems [1,2], and their sensitivity to substrate supply and microbial demand makes them widely used indicators of soil quality and nutrient status [3,4]. Because enzyme production reflects both microbial metabolic demand and the stoichiometric balance between substrate supply and biomass requirements [5,6], enzyme activities integrate information on resource limitation, community functional composition, and environmental conditions that no single chemical measurement can capture. Quantifying how land-management practices modify this enzymatic interface is therefore central to understanding nutrient cycling in working agricultural soils.
The ecoenzymatic stoichiometry framework of Sinsabaugh et al. [7], refined by Moorhead et al. [6,8], provides a quantitative approach for inferring microbial nutrient-acquisition strategies from enzyme data. Building on the ecological stoichiometry theory of Sterner and Elser [9], the framework posits that the relative investment of microbial communities in carbon- (C), nitrogen- (N), and phosphorus- (P) acquiring enzymes mirrors the balance between microbial demand and environmental supply. Vector length and vector angle therefore integrate information on extracellular enzyme allocation and stoichiometric imbalances between resource supply and microbial biomass [10]. β-glucosidase (BG) catalyzes the terminal step of cellulose degradation; N-acetyl-β-glucosaminidase (NAG) hydrolyzes chitin oligomers for N acquisition [11]; and acid phosphatase (ACP) releases orthophosphate from organic phosphoesters [12]. Log-transformed ratios of these three activities can be decomposed into vector length, an index of relative C limitation, and vector angle, an index of relative N versus P acquisition [6]. Although sulfur (S) is not formally embedded in the original C:N:P framework, arylsulfatase (AS) activity is a key biological diagnostic of organic-S mineralization that has been shown to covary with C-acquisition enzymes in agricultural soils [13,14]. Including AS alongside the C:N:P enzyme suite extends ecoenzymatic interpretation to a more complete C:N:P:S resource-acquisition picture while preserving compatibility with the Sinsabaugh–Moorhead vector framework.
Despite the conceptual maturity of this framework, two challenges persist for its application to managed subtropical soils. First, much of the empirical foundation derives from temperate or boreal natural ecosystems, with comparatively limited evaluation in managed subtropical agroecosystems where year-round biological activity, rapid organic-matter turnover, and strong edaphic heterogeneity may generate nutrient-acquisition dynamics not anticipated by temperate-biased models. Recent large-scale syntheses have begun to extend the framework into broader continental and biome-level contexts: Cui et al. [15], for example, applied vector analysis to 504 soil samples from 181 Chinese forest sites spanning a 19–54° N gradient and reported widespread P-acquisition emphasis (vector angles > 45°) in 80% of soils, with substantial variation across climate zones, vegetation types, and soil horizons. Such findings establish P-acquisition emphasis as a globally common signal in ecoenzymatic stoichiometry data and motivate extending the analysis to managed subtropical agricultural systems, which remain underrepresented. Second, vector-analysis interpretation has rarely been examined critically with respect to the angular geometry on which it relies. The vector angle, computed as atan2(ln(BG/NAG), ln(BG/ACP)) × 180/π, is a circular variable on the half-open interval (−180°, 180°]. When microbial communities invest proportionally more in N and P acquisition than in C acquisition, the angle falls in the third quadrant near ±180°, and the arithmetic means of broadly distributed angles can be biased by the discontinuity at the wrap. To our knowledge, this wraparound issue has not been explicitly addressed in cover-cropping studies that report directional shifts in microbial nutrient-acquisition strategies.
Florida’s agricultural regions span a 600 km latitudinal gradient encompassing fundamentally different climatic and edaphic contexts. Summer cover cropping is practiced under warm, humid conditions in calcareous Histosols and Spodosols of South Florida, where high pH (>7.0) promotes calcium-phosphate precipitation and constrains biological P availability [16]. Winter cover cropping, by contrast, proceeds under cooler conditions in sandy Entisols and Ultisols of North Florida, which typically exhibit low pH-buffering capacity, limited organic-matter content, and substantially different microbial community structure. These systems also differ in P-sorption dynamics, S availability, soil mineralogy, cover-crop assemblages, and farm management. Accordingly, the Florida transect represents a naturally occurring observational gradient in which Season is fully confounded with geography, soil order, climate, and cover-crop species. Cross-system comparisons are therefore descriptive contrasts only; they do not constitute statistically tested Phase × Season interactions or permit attribution of differences to climate alone.
Cover cropping is widely promoted as a regenerative practice that enhances soil health by increasing organic-matter inputs, improving microbial habitat quality, and diversifying rhizosphere chemistry [17,18,19]. Cover-crop residues provide labile C that stimulates enzyme production while introducing organic N, P, and S through biomass mineralization [20]. In tillage-intensive vegetable systems, frequent cover cropping has been identified as the primary driver of changes in BG, NAG, and ACP activities, with cover-crop residue inputs—rather than compost additions—exerting the dominant control on enzyme responses [3]. Legume and grass cover crops further drive divergent seasonal trajectories in microbial enzyme allocation and resource limitation [21]. The joint behavior of BG, NAG, ACP, and AS in subtropical systems, particularly under contrasting edaphic regimes, nonetheless remains incompletely characterized.
The objectives of this study were to (i) quantify Pre-to-Post differences in individual enzyme activities, stoichiometric ratios, and vector-analysis indicators within each of two contrasting Florida agroecosystems; (ii) evaluate the relative contributions of Phase and measured edaphic context to multivariate enzyme structure within each system; and (iii) re-examine vector-angle interpretation with explicit attention to angular geometry. We predicted that (H1) vector length would be lower Post than Pre in both systems, with a larger within-system contrast in the Summer system; (H2) BG and NAG would show detectable Pre-to-Post differences, whereas the direction and magnitude of ACP and AS contrasts would differ between systems in association with their distinct edaphic contexts; and (H3) circular summaries of vector angle would indicate Pre-to-Post displacement primarily within, rather than between, the conventional N- and P-acquisition domains. These predictions concern within-system contrasts and do not imply causal effects of season or climate.
2. Materials and Methods
2.1. Study Area and Experimental Design
The study area encompassed 10 commercial farms distributed across a 600 km latitudinal gradient in Florida, USA (25–31° N). Six farms in South Florida (Areca, GMI, Hollman, Miami, Treasure Coast, and US Sugar; hereafter the Summer system) operated summer cover-cropping rotations on calcareous Histosols and Spodosols. Four farms in North Florida (Jackson, Okaloosa, Shalimar, and Rondeau; hereafter the Winter system) operated winter cover-cropping rotations on sandy Entisols and Ultisols. North Florida sites experienced humid subtropical climates (Köppen Cfa), with mean annual temperatures of 19.8–20.5 °C and annual precipitation of 1300–1600 mm. South Florida sites experienced tropical savanna climates (Köppen Aw), with mean annual temperatures of 23.5–25.5 °C and annual precipitation of 1200–1500 mm concentrated in a wet season from June to October.
A Before–After–Control–Impact (BACI) design was implemented at each farm with spatially paired treatment (cover crop) and control (no cover crop/fallow) plots. Winter cover crops—cereal rye (Secale cereale L.), oats (Avena sativa L.), annual ryegrass (Lolium multiflorum Lam.), and crimson clover (Trifolium incarnatum L.)—were planted in October–November 2023 and terminated in February–March 2024 in North Florida. Summer cover crops—sunn hemp (Crotalaria juncea L.), sorghum-sudangrass (Sorghum bicolor × S. sudanense), cowpea (Vigna unguiculata L.), and pearl millet (Pennisetum glaucum L.)—were planted in May–June 2024 and terminated in August–September 2024 in South Florida. Cover-crop species were selected by cooperating growers to represent locally adapted practices, ensuring ecological realism at the cost of standardized species across farms. Farm-specific termination methods and several management covariates (including N fertilizer rate, irrigation regime, and previous-crop history) were not recorded consistently enough for quantitative inclusion; this limitation is addressed in Section 4.6.
2.2. Soil Sampling and Physicochemical Analyses
Composite soil samples (0–15 cm depth, five cores per composite) were collected from each plot before cover-crop planting (Pre) and after cover-crop termination (Post). A total of 194 samples were analyzed across all farms, phases, and treatments (Summer: n = 104; Winter: n = 90). Samples were transported on ice, sieved (2 mm), and stored at 4 °C for biological analyses or air-dried for physicochemical analyses within 48 h of collection. Bulk density (BD) was determined by the core method [22]. Water-holding capacity (WHC) was measured gravimetrically after saturation and drainage to field capacity. Soil pH was determined in a 1:2 soil: water suspension. Organic matter (OM) was quantified by loss-on-ignition at 550 °C for 4 h. Total nitrogen (TN) was determined by dry combustion. Total phosphorus (TP) was analyzed by inductively coupled plasma–optical emission spectrometry after perchloric acid digestion. Plant-available phosphorus (AP) was extracted in Mehlich-3 solution and measured colorimetrically. Microbial biomass carbon (MBC) was determined by chloroform fumigation–extraction with 0.5 M K2SO4 and a kEC factor of 0.45 [23].
2.3. Extracellular Enzyme Assays
Four extracellular enzyme activities were measured using standard colorimetric assays with p-nitrophenol (pNP)-linked substrates incubated at 37 °C for 1 h [14]. β-glucosidase (BG; EC 3.2.1.21) was assayed using p-nitrophenyl-β-D-glucopyranoside, representing C acquisition through cellulose hydrolysis. N-acetyl-β-glucosaminidase (NAG; EC 3.2.1.52) was assayed with p-nitrophenyl-N-acetyl-β-D-glucosaminide, representing N acquisition through chitin hydrolysis [11]. Acid phosphatase (ACP; EC 3.1.3.2) was assayed with p-nitrophenyl phosphate, reflecting hydrolysis of organic phosphoesters. Arylsulfatase (AS; EC 3.1.6.1) was assayed with p-nitrophenyl sulfate, reflecting hydrolysis of sulfate-ester compounds [13]. All enzyme activities are expressed as mg pNP kg−1 soil h−1 after correction for soil moisture and substrate blanks.
2.4. Ecoenzymatic Stoichiometry Calculations
Ecoenzymatic stoichiometric ratios were calculated following Sinsabaugh et al. [7]: C:N enzyme ratio = BG/NAG; C:P enzyme ratio = BG/ACP; N:P enzyme ratio = NAG/ACP. Vector length (VL) and vector angle (VA), which together quantify the position of a sample in the BG/ACP × BG/NAG plane, were computed as VL = √[ln(BG/ACP)2 + ln(BG/NAG)2] and VA = atan2(ln(BG/NAG), ln(BG/ACP)) × 180/π. Larger VL values indicate proportionally greater investment in BG relative to NAG and ACP and are interpreted as relative C limitation; VA on the conventional Sinsabaugh–Moorhead diagram crosses 45° as the boundary between N- and P-acquisition emphasis, with VA > 45° indicating relative P limitation and VA < 45° indicating relative N limitation [4,6,21]. Three samples with non-positive enzyme readings (sub-blank values for BG, NAG, ACP, or AS) were set to missing prior to log-transformation, since negative values are not biologically meaningful in this framework and propagate as NaN through ratios and vectors.
VA is a circular variable on (−180°, 180°], so arithmetic means can be biased when observations span the wraparound boundary. We therefore summarized VA using the arithmetic mean (reported only for comparison with prior literature), median, circular mean [24], and the proportion of samples in the P-acquisition domain (VA > 45°). Circular means were calculated as atan2(mean[sin θ], mean[cos θ]). Because the available mixed-model workflow treated VA as linear and would violate circular geometry when distributions span ±180°, no linear inferential test was retained for VA in the revised analysis. Vector-angle interpretation is therefore descriptive and gives precedence to circular means, medians, domain proportions, and the observed angular distributions. Inferential mixed-model tests were retained for enzyme activities, MBC, stoichiometric ratios, and vector length.
2.5. Statistical Analysis
All analyses were performed in R version 4.5.1 [25]. Because Season in this study is confounded with geographic region and soil order—Summer cover cropping was practiced exclusively in calcareous Histosols and Spodosols and Winter cover cropping exclusively in sandy Entisols and Ultisols—we did not fit a single Phase × Season factorial model. A cross-season interaction term in such a design conflates climatic, edaphic, mineralogical, and biogeographic effects that cannot be disentangled from a single regional gradient. Instead, each seasonal agroecosystem was analyzed independently for the effect of cover-cropping phase, and patterns were then compared qualitatively across systems.
For each seasonal subset, linear mixed-effects models were fitted in lmerTest [26] with the structure Response ~ Phase + (1|Farm), where Phase (Pre, Post) was a fixed factor, and Farm was a random intercept absorbing site-level heterogeneity. Type III ANOVA used Kenward–Roger denominator degrees of freedom [27]. Estimated marginal means and Pre → Post contrasts were obtained with emmeans (version 1.11.2) [28]; contrast direction was set so that positive estimates indicate Post > Pre, and effect sizes are reported as Cohen’s d using the residual standard deviation. These linear mixed-effects tests were applied to enzyme activities, MBC, stoichiometric ratios, and vector length but not to vector angle because VA requires circular treatment. Model adequacy was evaluated using DHARMa (version 0.4.7) scaled-residual simulation [29]; intraclass correlation coefficients (ICC) and marginal/conditional R2 were obtained from performance [30]. Two Winter responses (C:N ratio and VL) yielded singular random-intercept variances; for these, fixed-effect estimates and F statistics remain valid [31], but ICC and conditional R2 are not reported.
Environmental controls on enzyme stoichiometry were evaluated separately within each seasonal system using (i) Pearson correlations between the enzyme/stoichiometry matrix (BG, NAG, ACP, AS, VL, VA) and seven edaphic predictors (pH, OM, TN, TP, AP, WHC, BD); (ii) variance inflation factors on a representative linear model to screen for multicollinearity; (iii) distance-based redundancy analysis (vegan::capscale, vegan version 2.7-1) on standardized responses constrained by the edaphic predictors, with global, term, and axis significance tested by 999 permutations; (iv) envfit overlay vectors with permutation-based p values; and (v) variance partitioning between Phase and the edaphic block (vegan::varpart [32]), with permutation tests on each unique fraction. Principal component analyses on standardized enzyme activities (BG, NAG, ACP, AS) were also conducted separately within each system using FactoMineR [33]. Significance was assessed at α = 0.05 throughout.
3. Results
3.1. Within-Season Enzyme Activity Responses
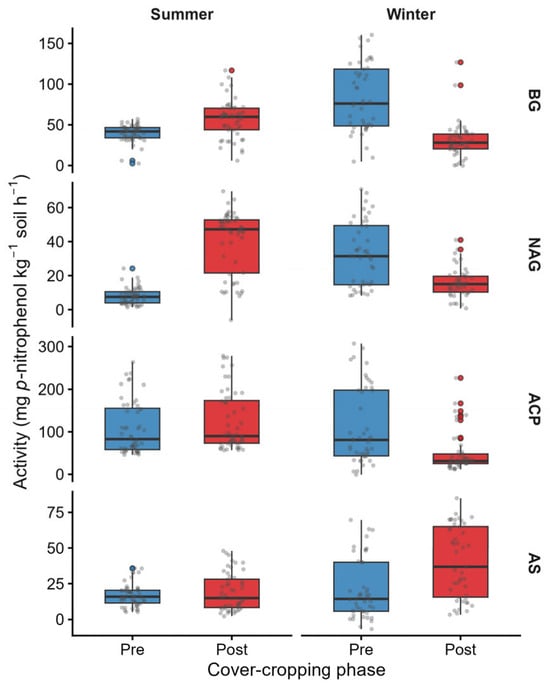
In the Summer system, BG and NAG differed strongly between phases, whereas ACP and AS did not differ significantly (Figure 1; Table 1). β-glucosidase activity increased from 39.7 ± 3.2 (estimated marginal mean ± SE) to 56.9 ± 3.2 mg pNP kg−1 h−1 (LMM Pre → Post contrast: +17.3, F1,97 = 25.8, p < 0.001, d = +1.00), and N-acetyl-β-glucosaminidase increased from 8.0 ± 2.4 to 39.9 ± 2.4 mg kg−1 h−1 (+32.8, F1,96.1 = 183.4, p < 0.001, d = +2.67). Acid phosphatase did not differ significantly (109.5 → 124.1; +14.6, F1,97 = 1.88, p = 0.174, d = +0.27), and arylsulfatase was likewise statistically unchanged (16.9 → 19.0; +2.1, F1,97 = 1.42, p = 0.237, d = +0.23). Microbial biomass C was lower Post than Pre (0.91 → 0.73 mg g−1; −0.18, p = 0.019, d = −0.47). The concurrent increase in BG/NAG and decline in MBC could reflect greater enzyme activity per unit biomass, altered microbial community composition, extracellular-enzyme persistence, substrate availability, or other management and environmental differences; the present data do not distinguish among these mechanisms.
Figure 1.
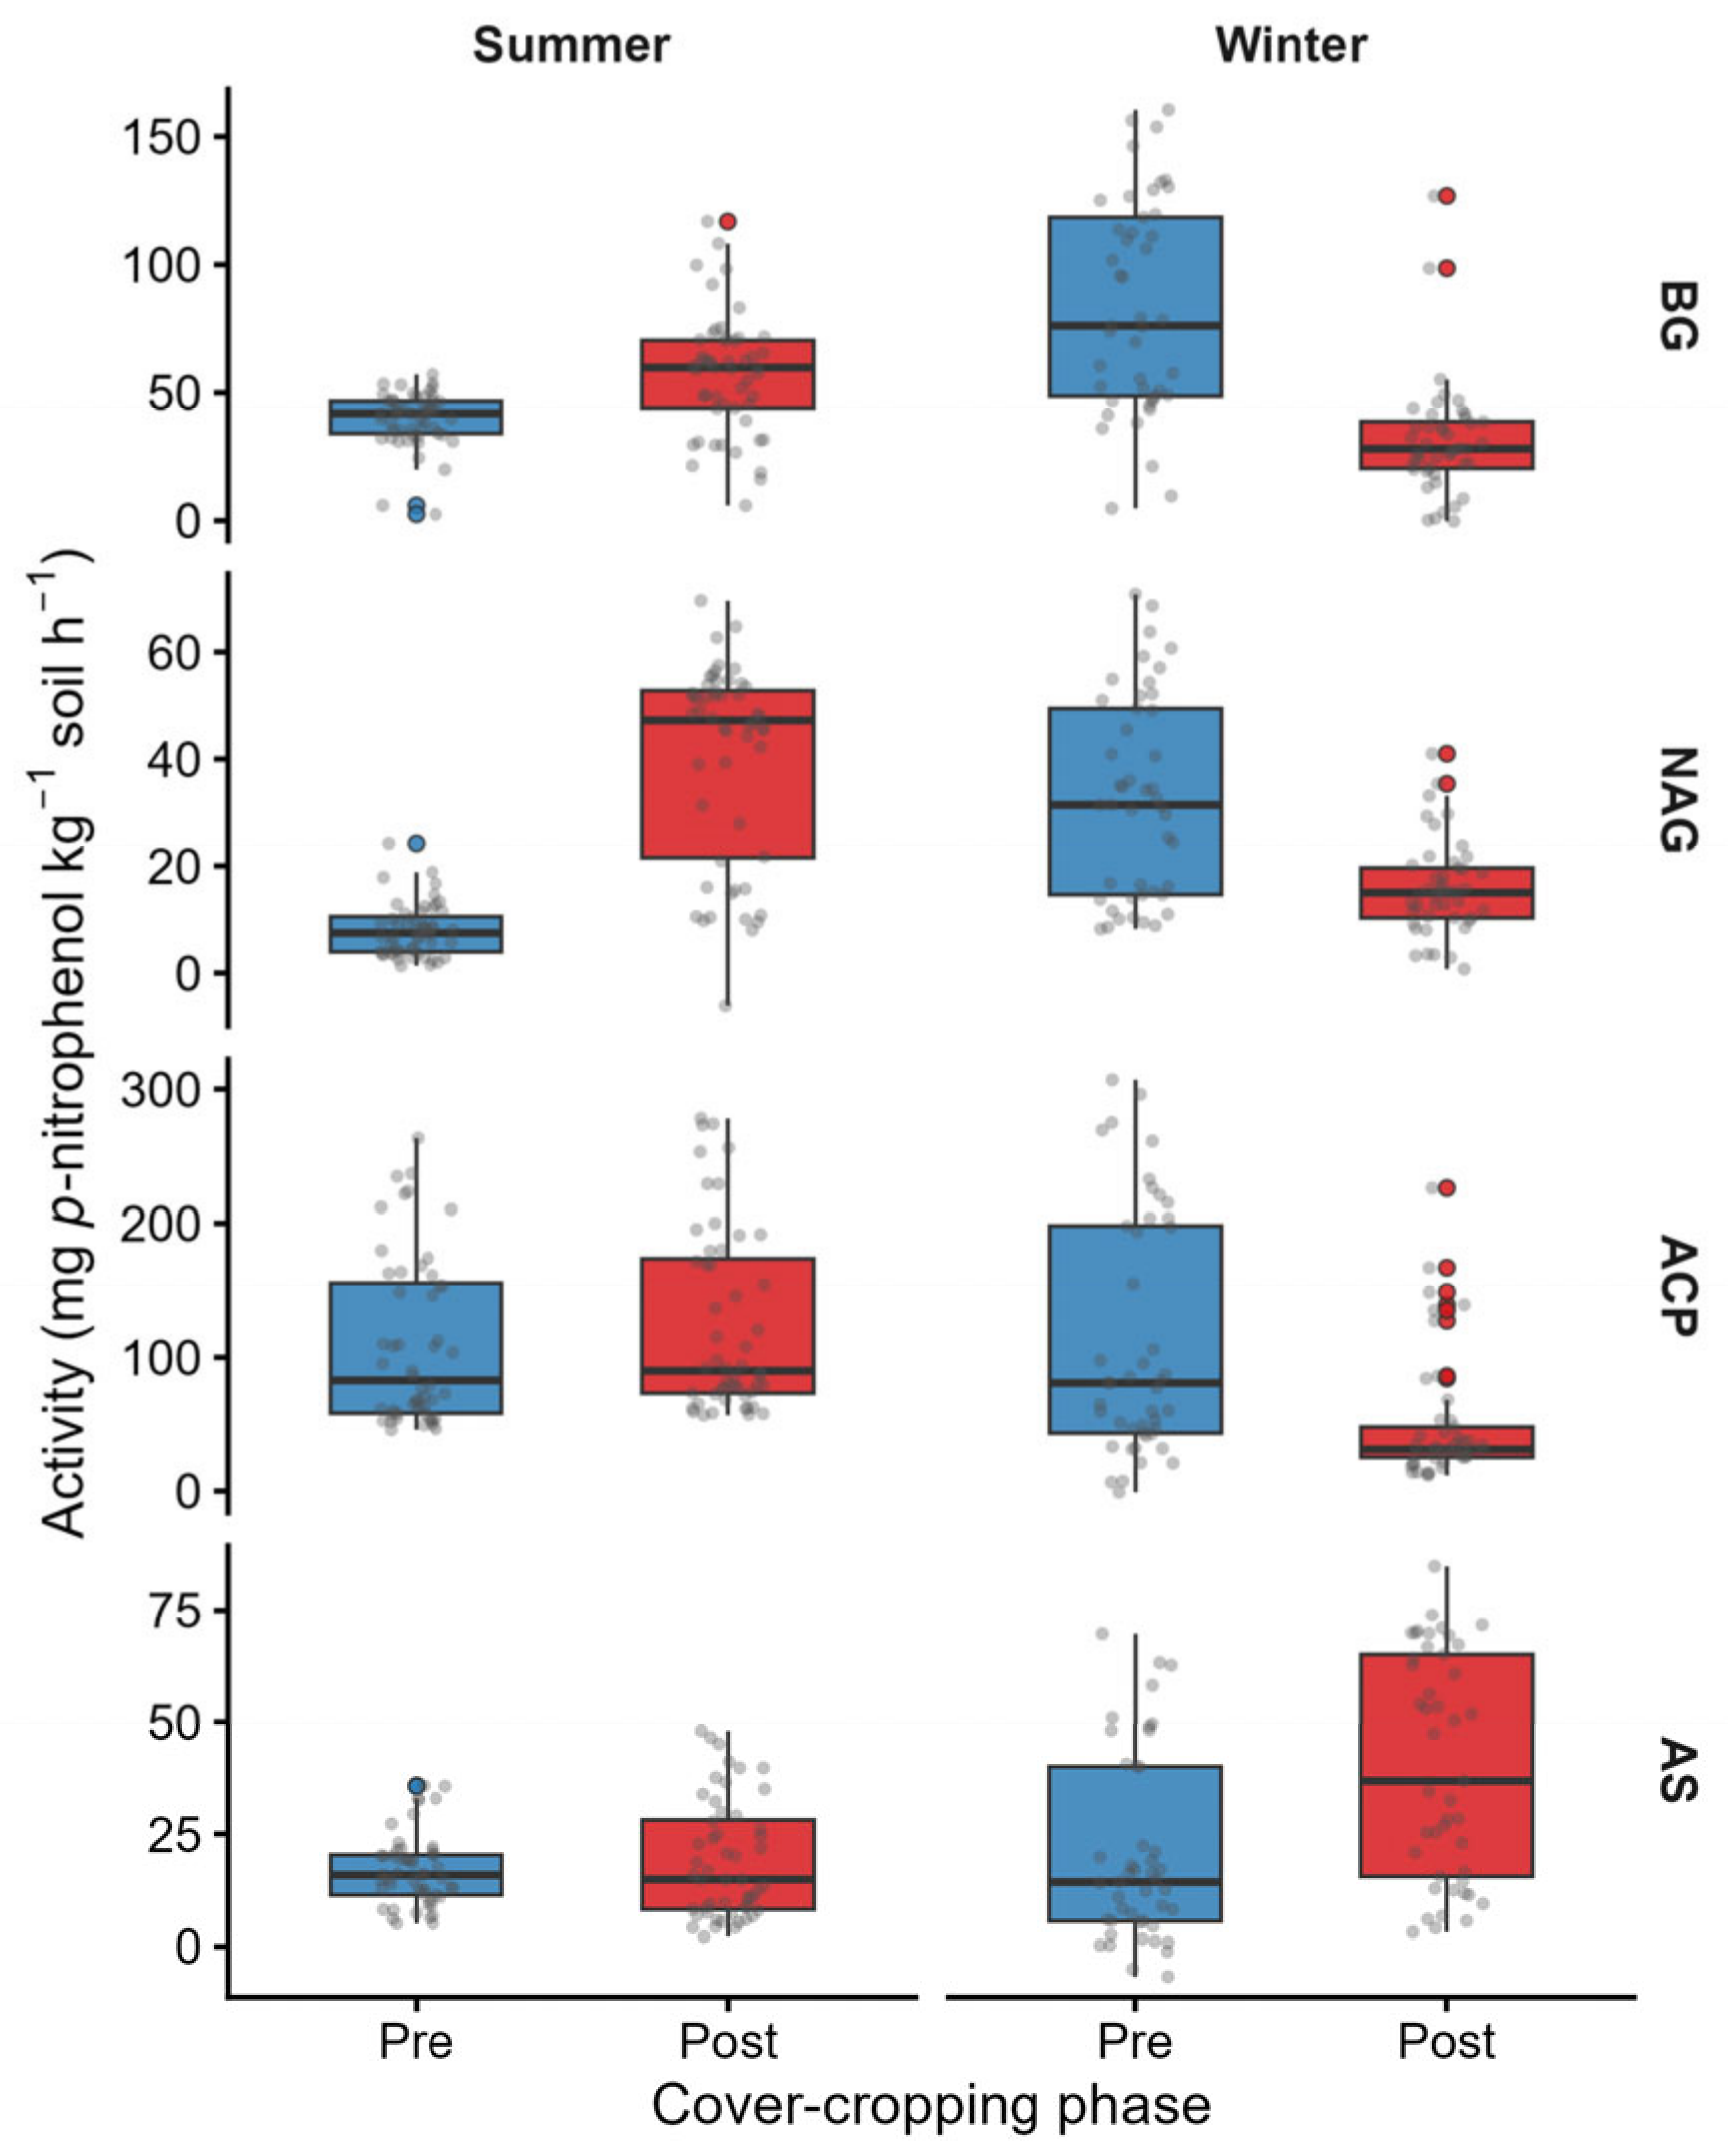
Soil extracellular enzyme activities by cover-cropping phase (Pre vs. Post) within each seasonal system. Panels show β-glucosidase (BG), N-acetyl-β-glucosaminidase (NAG), acid phosphatase (ACP), and arylsulfatase (AS), faceted by enzyme (rows) and Season (columns). Box plots show median, interquartile range, 1.5 × IQR whiskers, and outliers; jittered points display all observations. Activities in mg p-nitrophenol kg−1 soil h−1.
Table 1.
Within-season linear mixed-effects model (Response ~ Phase + (1|Farm)) Pre → Post contrasts (Post–Pre) for soil enzyme activities, microbial biomass C, ecoenzymatic stoichiometric ratios, and vector length across 10 Florida commercial farms. Estimates (β), standard errors (SE), denominator degrees of freedom (df, Kenward–Roger), t ratios, p values, and standardized effect sizes (Cohen’s d, computed using residual SD) are reported. Vector angle is excluded because inferential treatment requires circular statistics; descriptive circular summaries are reported in Table 2.
Table 2.
Vector-angle (VA) summaries for each Season × Phase combination, reported using arithmetic, median, and circular statistics. Arithmetic means are shown only for comparison with prior literature; circular means and medians are the preferred summaries when observations span the ±180° boundary. For example, angles of +170° and −170° are only 20° apart directionally, yet their arithmetic mean is 0°, which spuriously places the average in a different angular domain. Percentage of samples in the P-acquisition domain (VA > 45°) provides an additional wraparound-robust descriptor. No linear inferential p values are assigned to VA in the revised analysis.
Table 3.
Variance partitioning of multivariate enzyme structure (BG, NAG, ACP, AS, vector length, vector angle) between cover-cropping Phase and the edaphic block (pH, OM, TN, TP, AP, WHC, BD) within each seasonal system. Adjusted R2 is reported for each fraction following the variance-partitioning convention of Borcard et al. [34] as implemented in vegan::varpart.
In the Winter system, the Pre-to-Post pattern differed from that observed in Summer (Figure 1; Table 1). β-glucosidase declined from 83.0 ± 6.6 to 31.2 ± 6.6 mg kg−1 h−1 (Pre → Post contrast: −51.0, F1,84 = 57.0, p < 0.001, d = −1.60), N-acetyl-β-glucosaminidase declined from 32.9 ± 2.5 to 15.9 ± 2.5 (−17.1, p < 0.001, d = −1.42), and acid phosphatase declined from 112.3 ± 12.9 to 49.7 ± 12.9 (−64.1, p < 0.001, d = −1.03). Microbial biomass C also declined (1.19 → 0.51 mg g−1; −0.69, p < 0.001, d = −2.46). In contrast, arylsulfatase increased from 20.4 ± 4.8 to 40.4 ± 4.8 mg kg−1 h−1 (+18.4, p < 0.001, d = +0.81), showing a phase pattern distinct from the C-, N-, and P-cycling enzyme suite.
3.2. Ecoenzymatic Stoichiometric Ratios
In the Summer system, the large NAG difference was accompanied by a strong reduction in the C:N enzyme ratio (BG/NAG: 7.68 → 1.70; p < 0.001, d = −1.15) and an increase in the N:P ratio (NAG/ACP: 0.09 → 0.40; p < 0.001, d = +1.87), while the C:P ratio (BG/ACP) was statistically unchanged (p = 0.149, d = +0.29) (Table 1). In the Winter system, despite significant absolute declines in BG, NAG, and ACP, most stoichiometric ratios remained unchanged: C:N (4.0 → 3.7, p = 0.851, d = −0.04) and N:P (0.36 → 0.49, p = 0.337, d = −0.20) did not differ significantly, and only C:P declined (p = 0.016, d = −0.52). Thus, the Winter phase contrast was expressed more strongly in absolute enzyme activities than in their relative C:N:P allocation.
3.3. Vector Analysis of Microbial Nutrient Acquisition
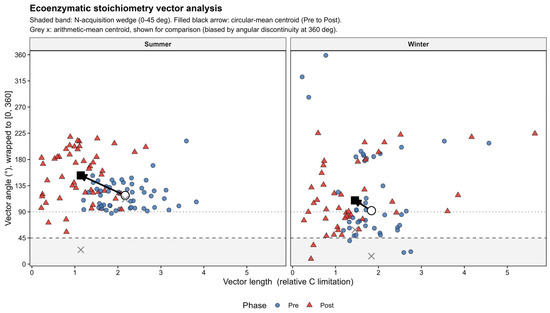
Vector length was lower Post than Pre in both systems, a pattern consistent with lower relative C limitation after termination but not by itself evidence of a causal residue effect (Figure 2). The Summer contrast (Pre → Post: 2.17 → 1.14; Δ = −1.03, p < 0.001, d = −1.75) was larger than the Winter contrast (1.84 → 1.45; Δ = −0.38, p = 0.059, d = −0.41). The marginal Winter result (and singular random-intercept variance for VL in this system) indicates that the Pre-to-Post difference in sandy Winter soils was smaller or more variable across farms than in the calcareous Summer system.
Figure 2.
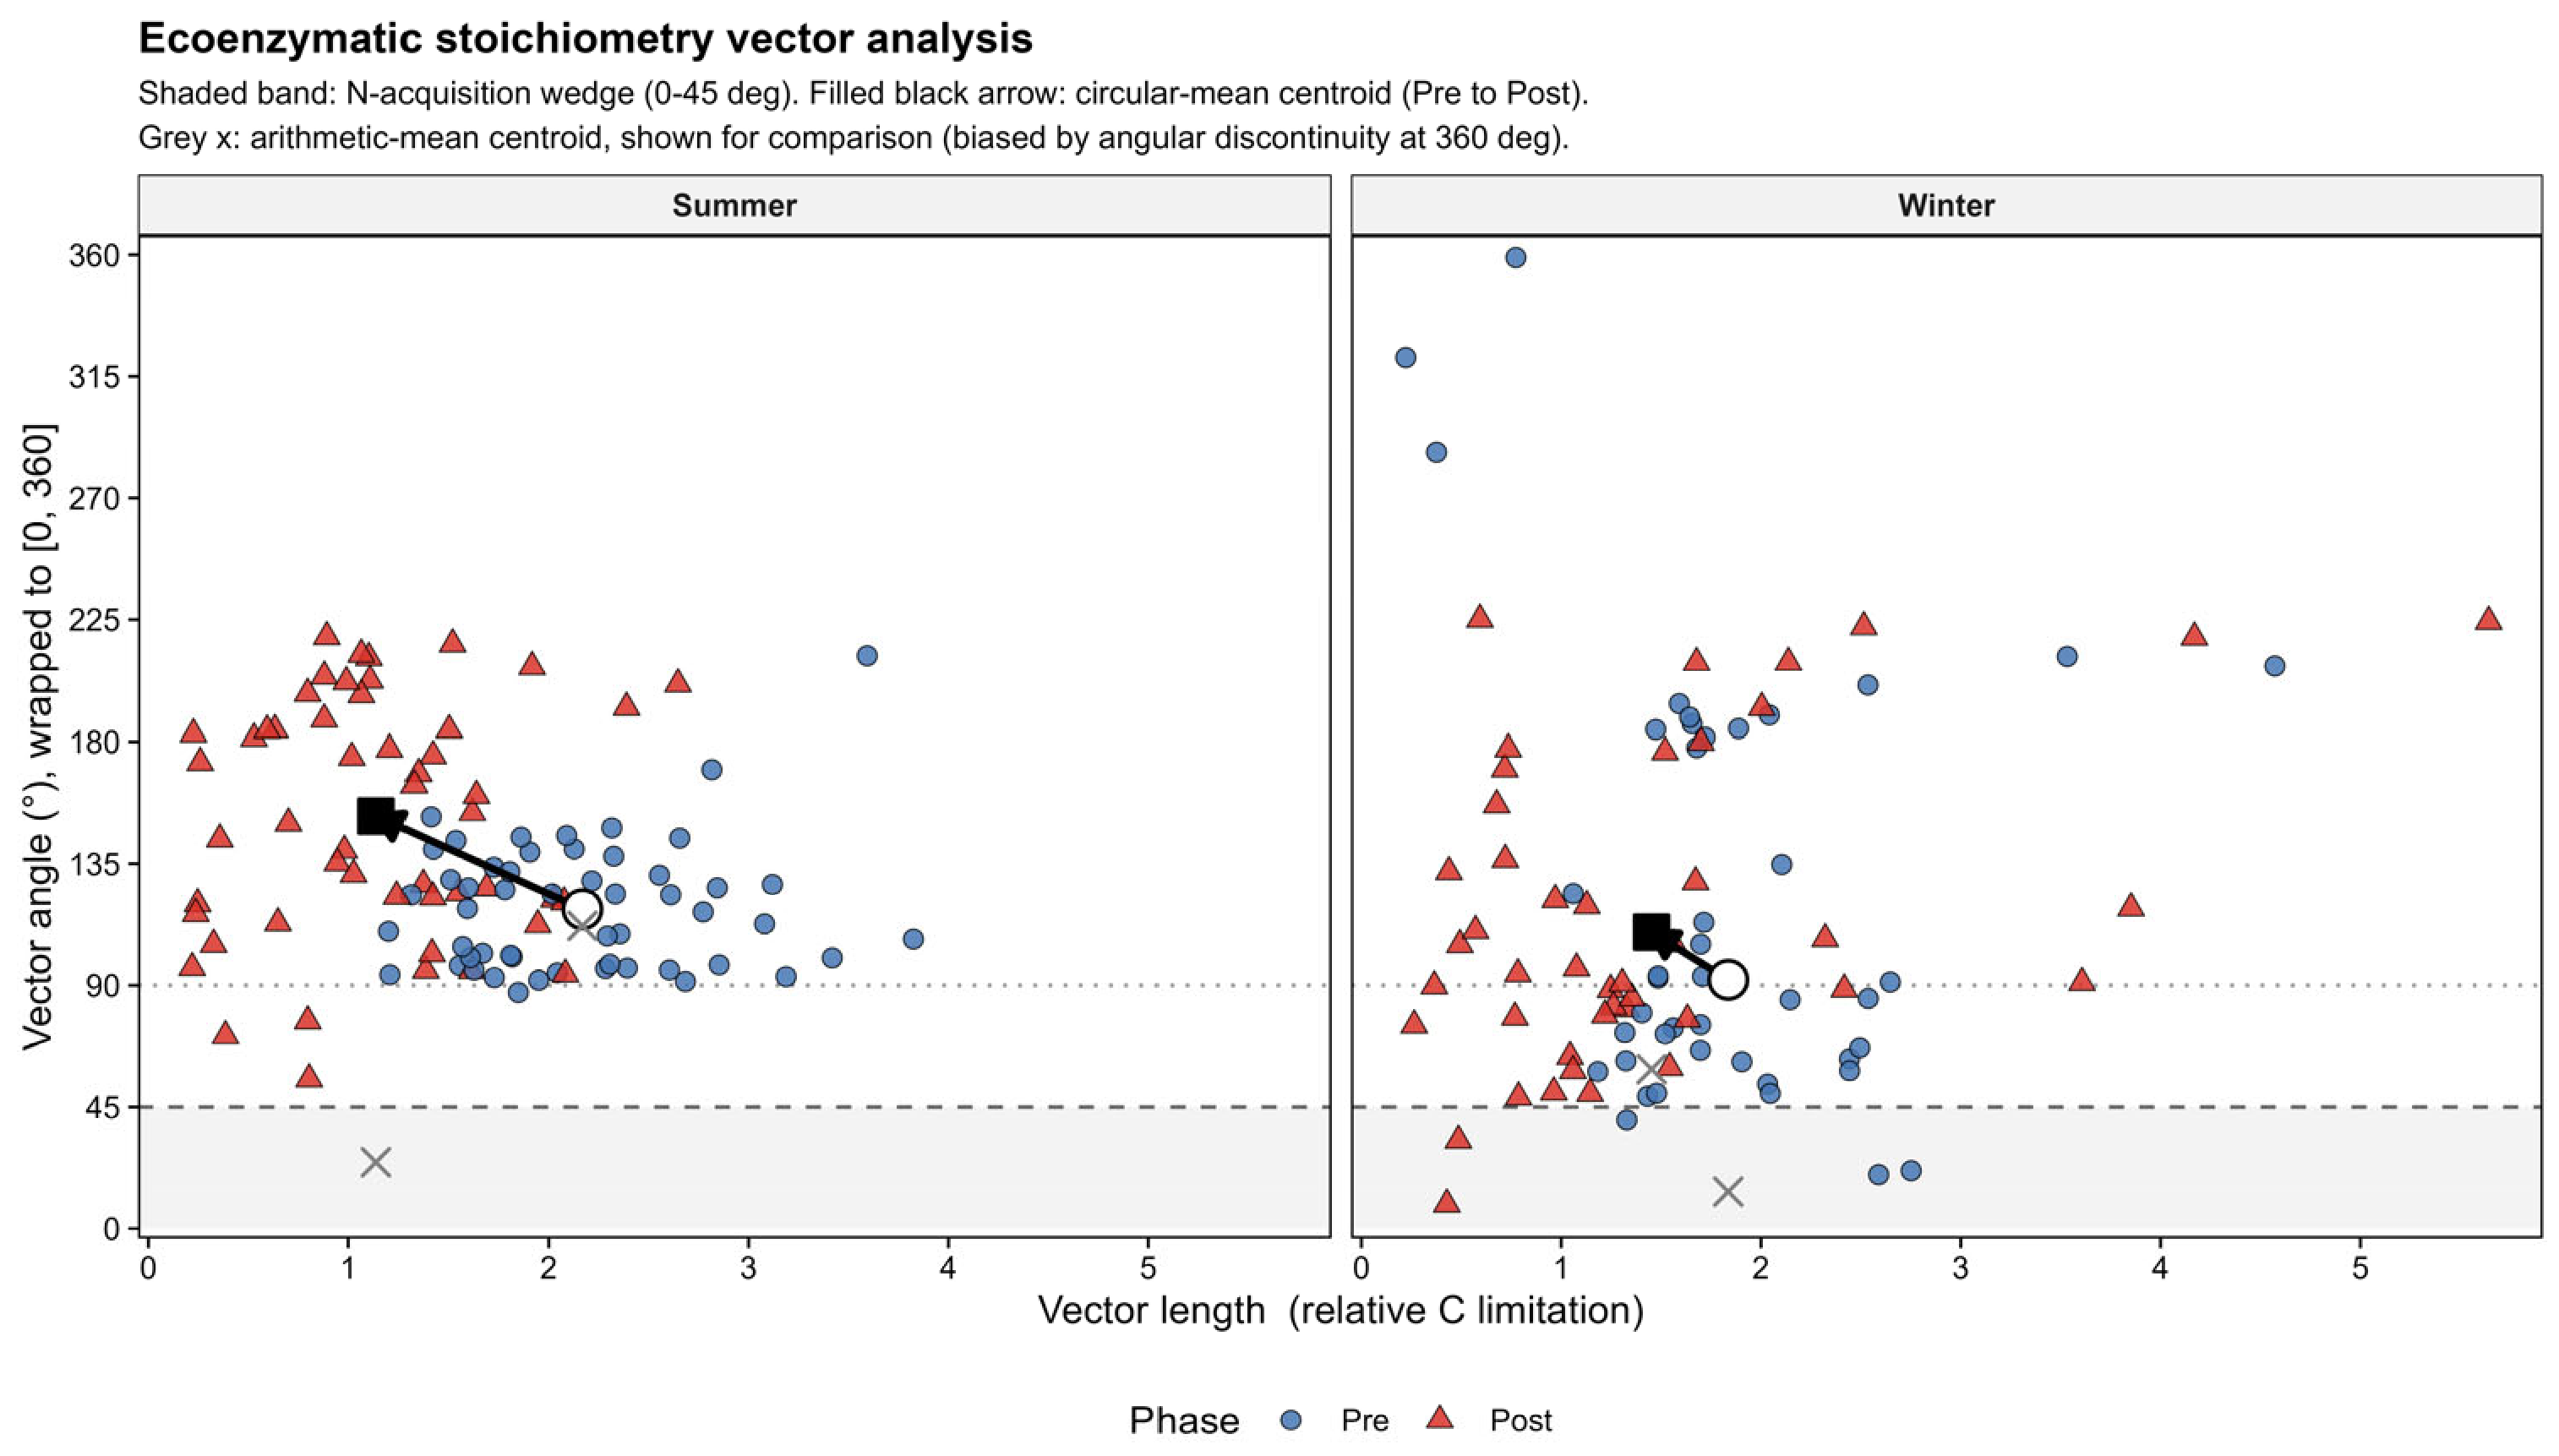
Ecoenzymatic stoichiometry vector analysis. Vector length (relative C limitation) on x-axis; vector angle wrapped to [0°, 360°] on y-axis. Shaded grey band: N-acquisition wedge (0–45°). Filled black symbols and arrow: Pre → Post trajectory of the circular-mean centroid. Grey × symbols: arithmetic-mean centroid (shown for comparison; biased by angular discontinuity at 360°). Dashed horizontal line: 45° boundary between the N-acquisition wedge and the P-acquisition domain; dotted horizontal line: 90° reference, at which ln(BG/ACP) = 0 (equal BG and ACP activities).
Vector-angle interpretation required explicit attention to angular geometry. The linear arithmetic mean of VA in the Summer Post sub-sample (24.6°) would suggest N-acquisition emphasis if interpreted naively. However, the median (101.7°), circular mean (152.6°), and 64.7% of observations at VA > 45° placed the same distribution predominantly within the P-acquisition domain (Figure 2; Table 2). The discrepancy reflects the ±180° discontinuity: observations near +180° and −180° are directionally adjacent but can average toward 0° on a linear scale. The Summer circular mean differed descriptively from 118.2° Pre to 152.6° Post, a 34° displacement within the P-acquisition half-plane. The Winter circular means were 92.1° Pre and 109.7° Post, with 79.5% of Post samples at VA > 45°. Because no circular inferential test was applied, these angular differences are reported as descriptive within-system patterns rather than statistically significant phase effects.
3.4. Correlation Structure Between Enzymes and Edaphic Context
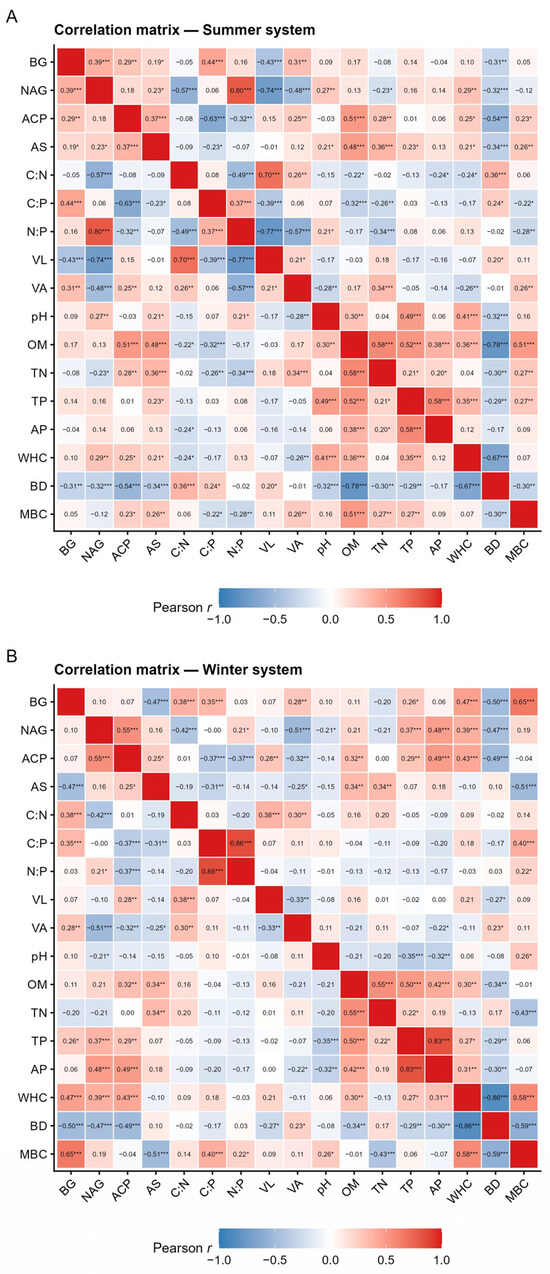
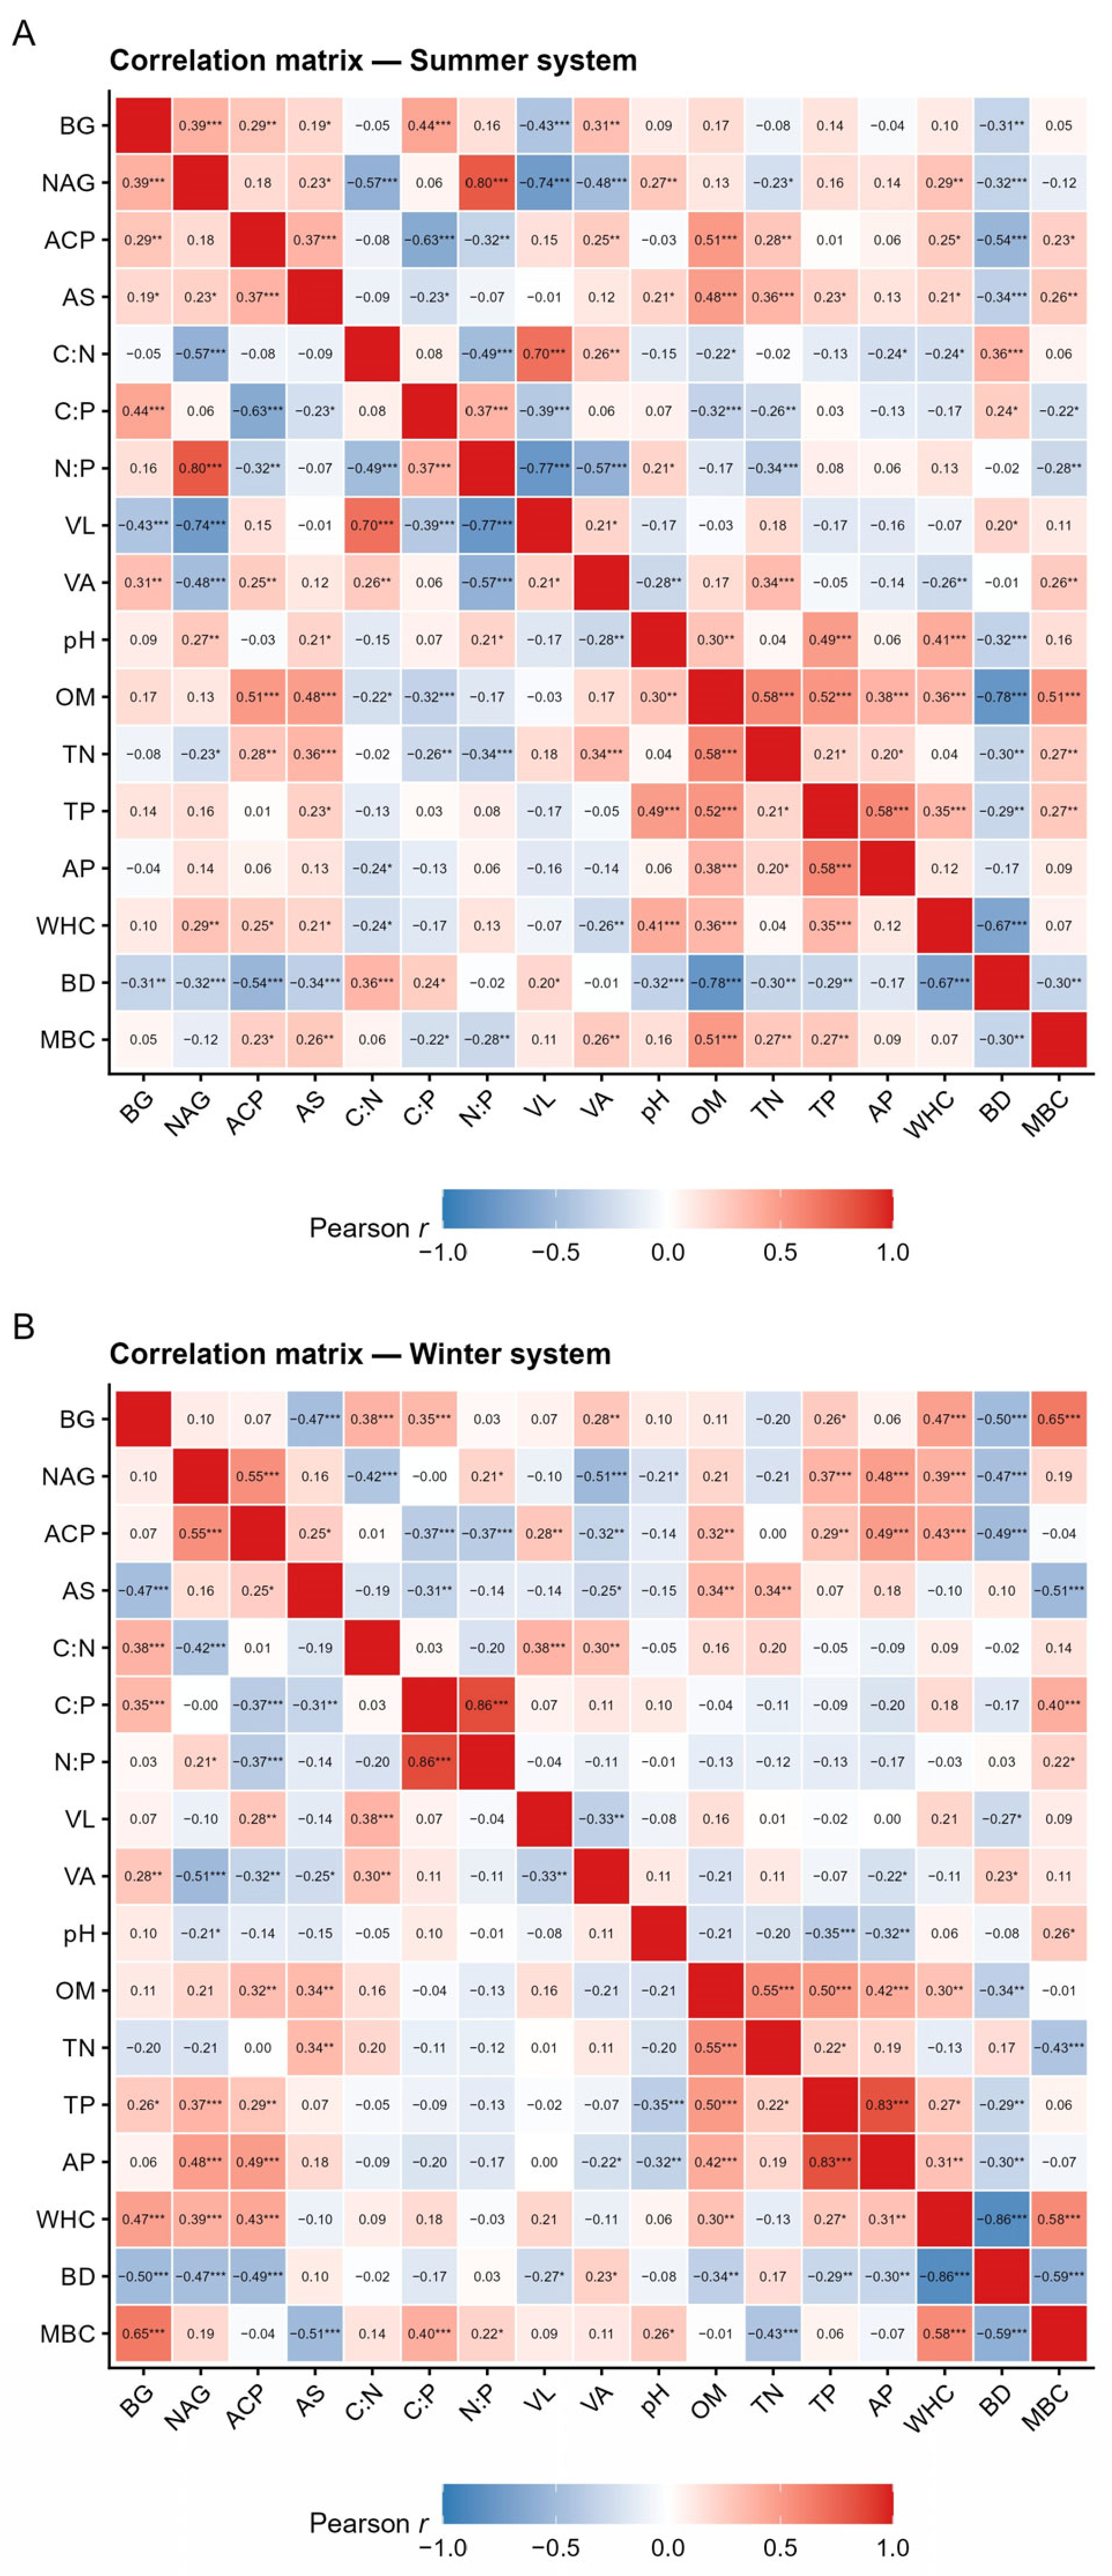
Within-season Pearson correlations identified system-specific associations between enzyme activity and measured soil properties (Figure 3). In the Summer system, OM was strongly correlated with ACP (r = +0.51) and AS (r = +0.48; both p < 0.001), and AS additionally correlated with TN (r = +0.36) and TP (r = +0.23). β-glucosidase showed weak correlations with the measured edaphic variables (|r| ≤ 0.17). MBC is included in the Summer correlation matrix (Figure 3A) and the Winter matrix. In the Winter system, plant-available P (Mehlich-3) correlated with NAG (r = +0.48) and ACP (r = +0.51), and TP correlated positively with NAG, ACP, and BG (r = +0.31 to +0.36). MBC correlated positively with BG (r = +0.66) and negatively with AS (r = −0.51). These correlations identify candidate edaphic covariates but do not establish regulation or causal media
Figure 3.
Within-season Pearson correlation matrix among enzyme activities, stoichiometric ratios, vector indicators, and edaphic/microbial variables. (A) Summer system. (B) Winter system. MBC is included in both panels. Cell color scales with the correlation coefficient (blue = negative, red = positive); cell labels show the coefficient and significance code (* p < 0.05; ** p < 0.01; *** p < 0.001). Correlations are descriptive associations and should not be interpreted as causal effects.
3.5. Multivariate Enzyme Structure (PCA)
Principal component analysis on standardized enzyme activities (BG, NAG, ACP, AS) extracted two components in each system. In the Summer PCA, the first two axes explained the majority of multivariate variance, with PC1 dominated by NAG and BG and showing Pre/Post separation, whereas PCA, PC1 separated Pre and Post samples primarily through joint differences in BG, NAG, and ACP, while AS loaded with high specificity on PC2. Phase-coloPC2 was dominated by ACP and AS. In the Winter red 95% confidence ellipses in the per-season biplots (Supplementary Materials) visualized the multivariate separation between Pre and Post samples in both systems.
3.6. Environmental Controls on Multivariate Enzyme Structure (dbRDA)
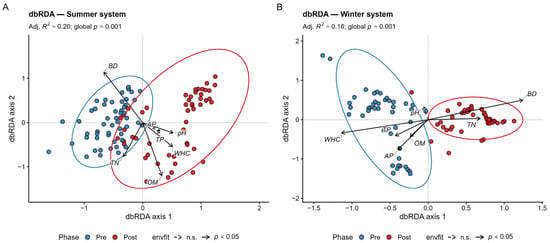
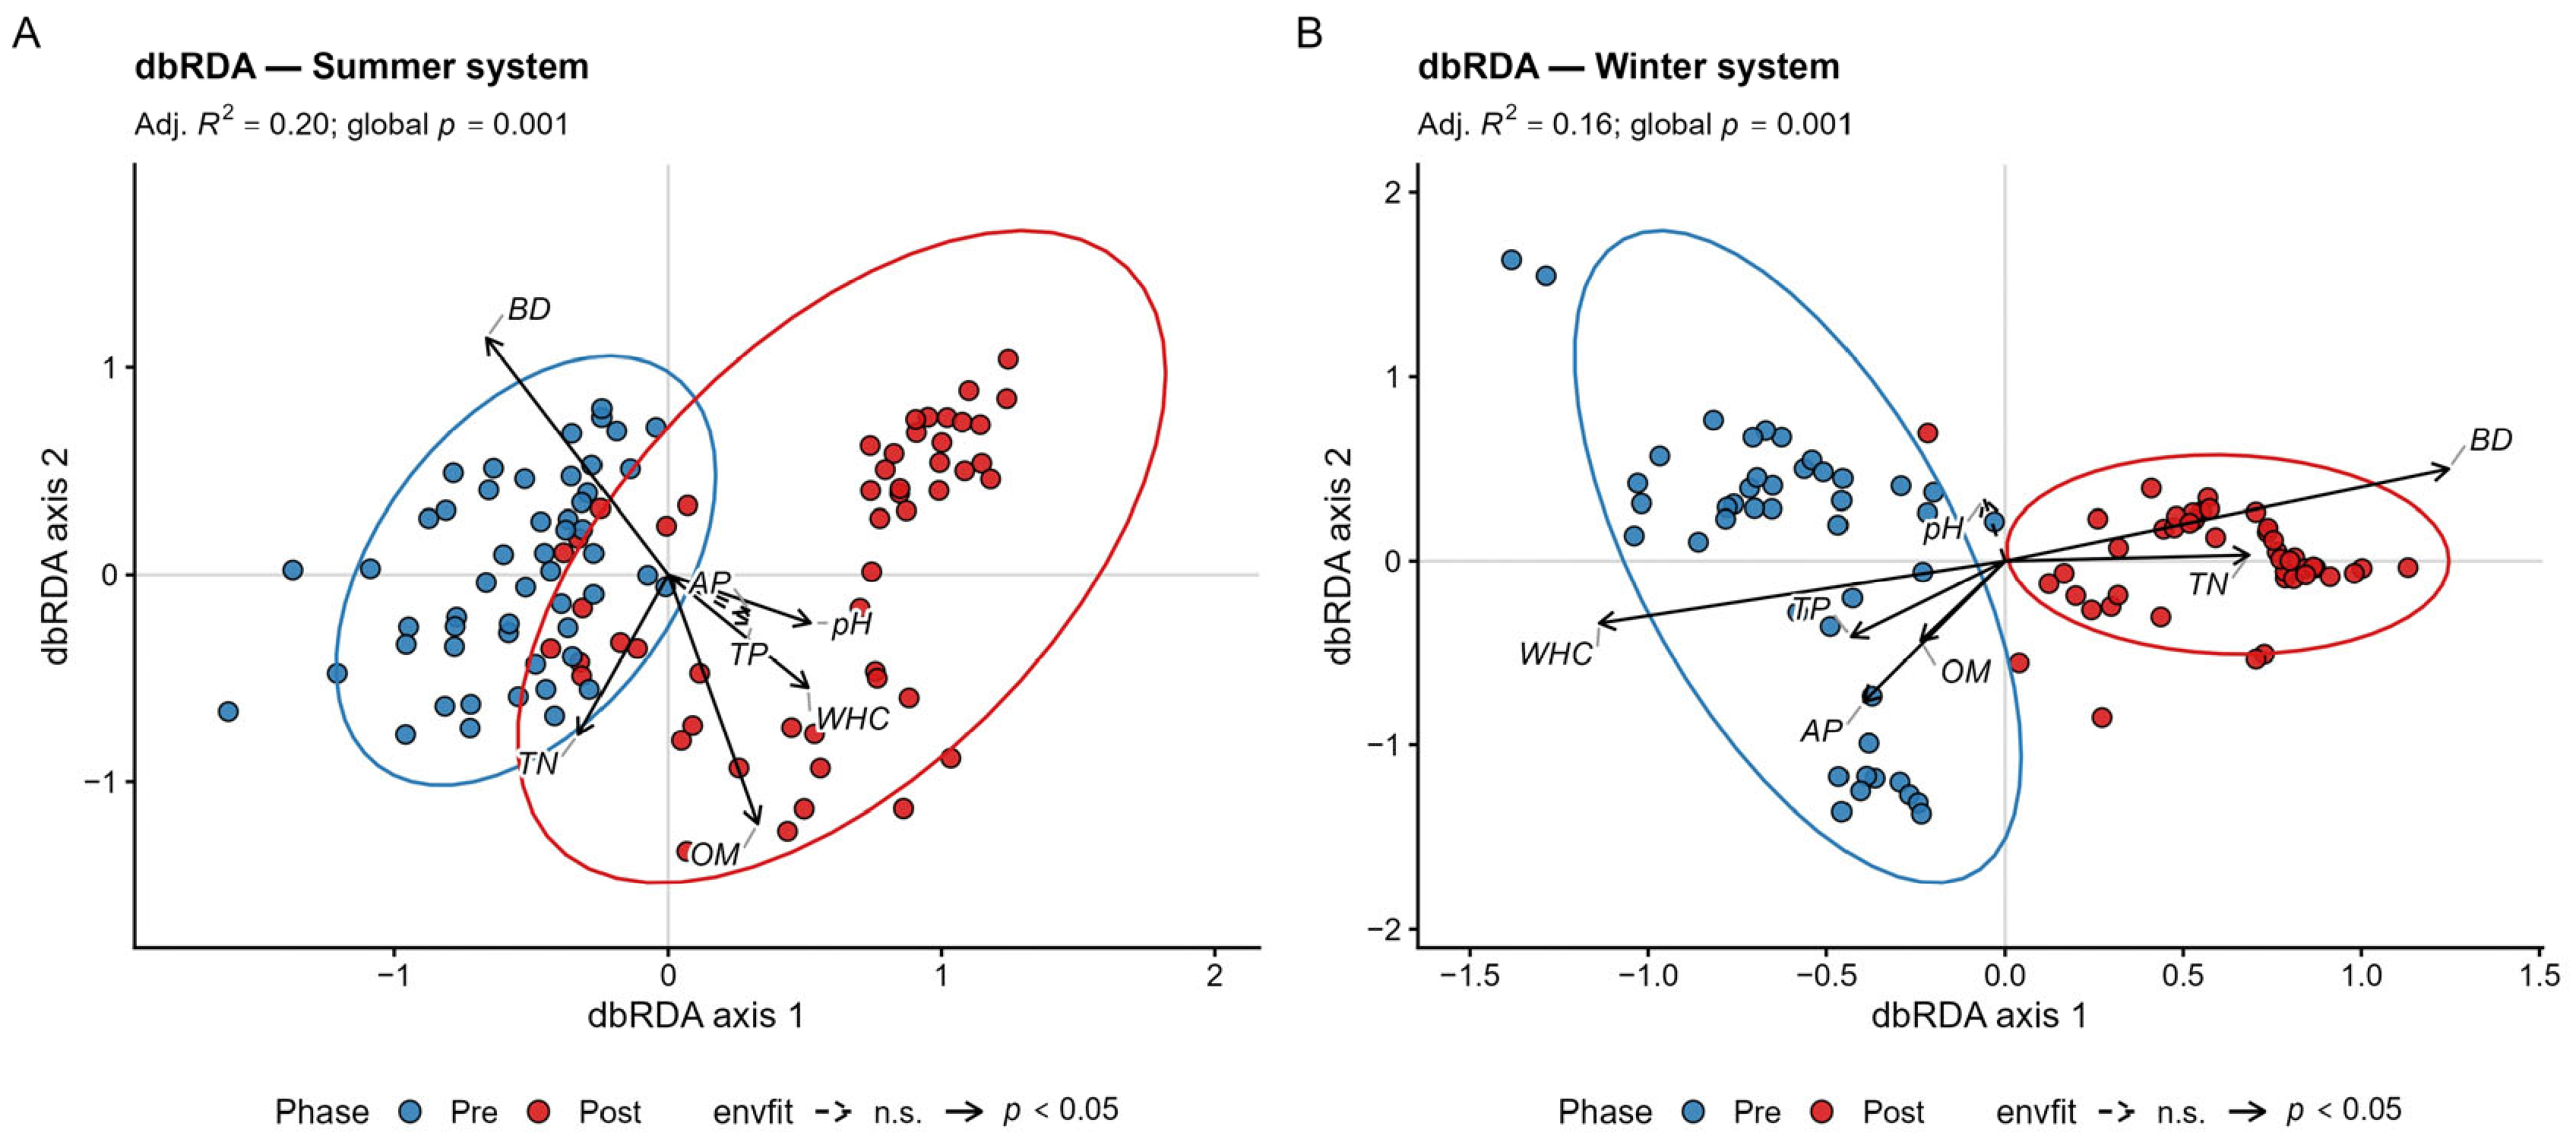
Distance-based redundancy analysis constrained by the seven edaphic predictors explained 24.3% (Summer; adjusted R2) and 28.0% (Winter; adjusted R2) of multivariate enzyme variance, with both global tests significant at p = 0.001 (999 permutations) (Figure 4). In the Summer system, envfit identified pH, OM, TN, WHC, and BD as significant constraint vectors (p < 0.05), with Post samples displaced toward higher pH, AP, TP, and WHC and Pre samples toward higher BD and TN. In the Winter system, envfit identified OM, TN, TP, AP, WHC, and BD as significant vectors, with Post samples associated with higher TN, BD, and pH and Pre samples associated with higher AP, OM, TP, and WHC. The Pre and Post ellipses were nearly separated along dbRDA axis 1 in both systems, indicating strong multivariate phase separation without establishing that Phase itself caused the separation.
Figure 4.
Distance-based redundancy analysis (dbRDA) of multivariate enzyme structure constrained by edaphic predictors, with envfit overlay vectors. (A) Summer system (adj. R2 = 0.24, global p = 0.001). (B) Winter system (adj. R2 = 0.28, global p = 0.001). Points colored by Phase (blue = Pre, red = Post); 95% confidence ellipses by Phase. Solid arrows: envfit-significant predictors (p < 0.05); dashed arrows: non-significant. Permutation tests used 999 permutations.
3.7. Variance Partitioning Between Phase and Edaphic Context
Variance partitioning between Phase and the edaphic block (Table 3) showed contrasting structures in the two systems. In the Summer system, the pure Phase fraction (Phase|Edaphic) explained 14.0% of the multivariate enzyme variance, and the pure Edaphic fraction (Edaphic|Phase) explained 15.7%, with 8.6% shared variance and 61.7% residual. In the Winter system, the pure Phase fraction was 4.2%, the pure Edaphic fraction was 15.3%, the shared variance was 12.8%, and the residual was 67.8%. Thus, Phase accounted for a larger unique fraction of measured multivariate variation in the Summer dataset than in the Winter dataset after conditioning on the measured edaphic block. Because unmeasured management and environmental variables may covary with Phase, these fractions are interpreted as variance components rather than causal effects.
4. Discussion
4.1. Season-Specific Enzyme Responses Interpreted Within an Observational Regional Gradient
The two agroecosystems showed qualitatively distinct Pre-to-Post enzyme patterns. In Summer, BG and especially NAG were higher Post than Pre, whereas ACP and AS were statistically unchanged; in Winter, BG, NAG, and ACP were lower Post, while AS was higher. Because the systems differ simultaneously in soil order, climate, cover-crop assemblage, and farm management, these patterns are interpreted within each agroecosystem rather than as a tested Phase × Season interaction. The larger pure Phase fraction in Summer (14.0%) than in Winter (4.2%) likewise reflects differences in the within-system variance structure and does not isolate a climatic or residue-driven mechanism.
In the calcareous Summer soils, a strong increase in NAG was observed against a background of sustained ACP activity and predominantly P-acquisition vector angles. This pattern is consistent with, but does not prove, an increase in relative N-acquisition investment after termination, while P-acquisition demand remained high. Similar persistence of P-acquisition emphasis has been reported across temperate and other non-agricultural systems: Cui et al. [15] found VA > 45° in 80% of 504 Chinese forest soils, while Sui et al. [21] reported coexistence of reduced relative C limitation and continued P-acquisition emphasis under cover cropping. The recurrence of this signal across ecosystems with very different vegetation and climate suggests a broader stoichiometric principle: when biologically available P remains scarce relative to microbial demand, phosphatase investment can remain high even as C and N substrate supply changes. In calcareous soils, precipitation and phosphate sorption provide an additional edaphic mechanism that can meet this demand. Thus, convergence with forest studies should not be interpreted as evidence of identical controls; rather, it indicates that similar vector positions may emerge from different proximate constraints. This distinction is important for ecoenzymatic-stoichiometry theory because vector angle is best viewed as a relative allocation phenotype conditioned by substrate supply, mineral protection, microbial composition, and management, not as a direct measurement of a single limiting nutrient.
In the sandy Winter soils, the joint decline of BG, NAG, ACP, and microbial biomass C after termination was consistent with a smaller active microbial pool and lower hydrolytic-enzyme activity, but the observational design cannot distinguish substrate limitation from temperature, moisture, leaching, management, or community-composition effects. The positive BG–MBC correlation (r = +0.66; Figure 3) parallels the association reported by Brennan and Acosta-Martinez [3] in tillage-intensive vegetable systems and is compatible with BG tracking microbial biomass as well as substrate supply. The increase in AS, together with its negative correlation with MBC, indicates a distinct S-acquisition pattern, but plausible explanations—including changes in residue S chemistry, enzyme persistence, or the relative abundance of sulfatase-producing taxa—remain hypotheses requiring targeted measurements.
4.2. Vector-Angle Interpretation and the Angular Wraparound Problem
A key methodological observation from this study concerns the sensitivity of vector-angle interpretation to the choice of summary statistic. The linear arithmetic mean of VA in Summer Post (24.6°) would, at face value, indicate a shift from P-acquisition (Summer Pre, 112.0°) to N-acquisition. Yet the same data have a circular mean of 152.6°, a median of 101.7°, and 64.7% of samples in the P-acquisition domain (VA > 45°). The discrepancy reflects the angular geometry: when (BG < NAG) and (BG < ACP), the angle falls in the third quadrant near ±180°, and the arithmetic mean of {+170°, +160°, −170°, −175°} is biased toward zero by averaging across the ±180° discontinuity. Studies reporting large vector-angle changes from arithmetic means alone may therefore overstate inferred shifts in microbial nutrient-acquisition strategy. The issue applies generally to any vector-analysis application whose sample distributions span the ±180° boundary, including large-scale syntheses [2,15]. We recommend that future analyses report vector angles using both arithmetic and circular statistics and that visualizations wrap angles to [0°, 360°] or use polar plots, so that wraparound clusters are not visually split.
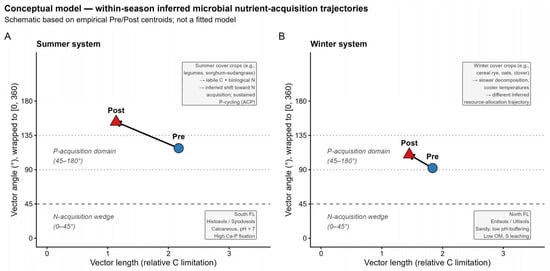
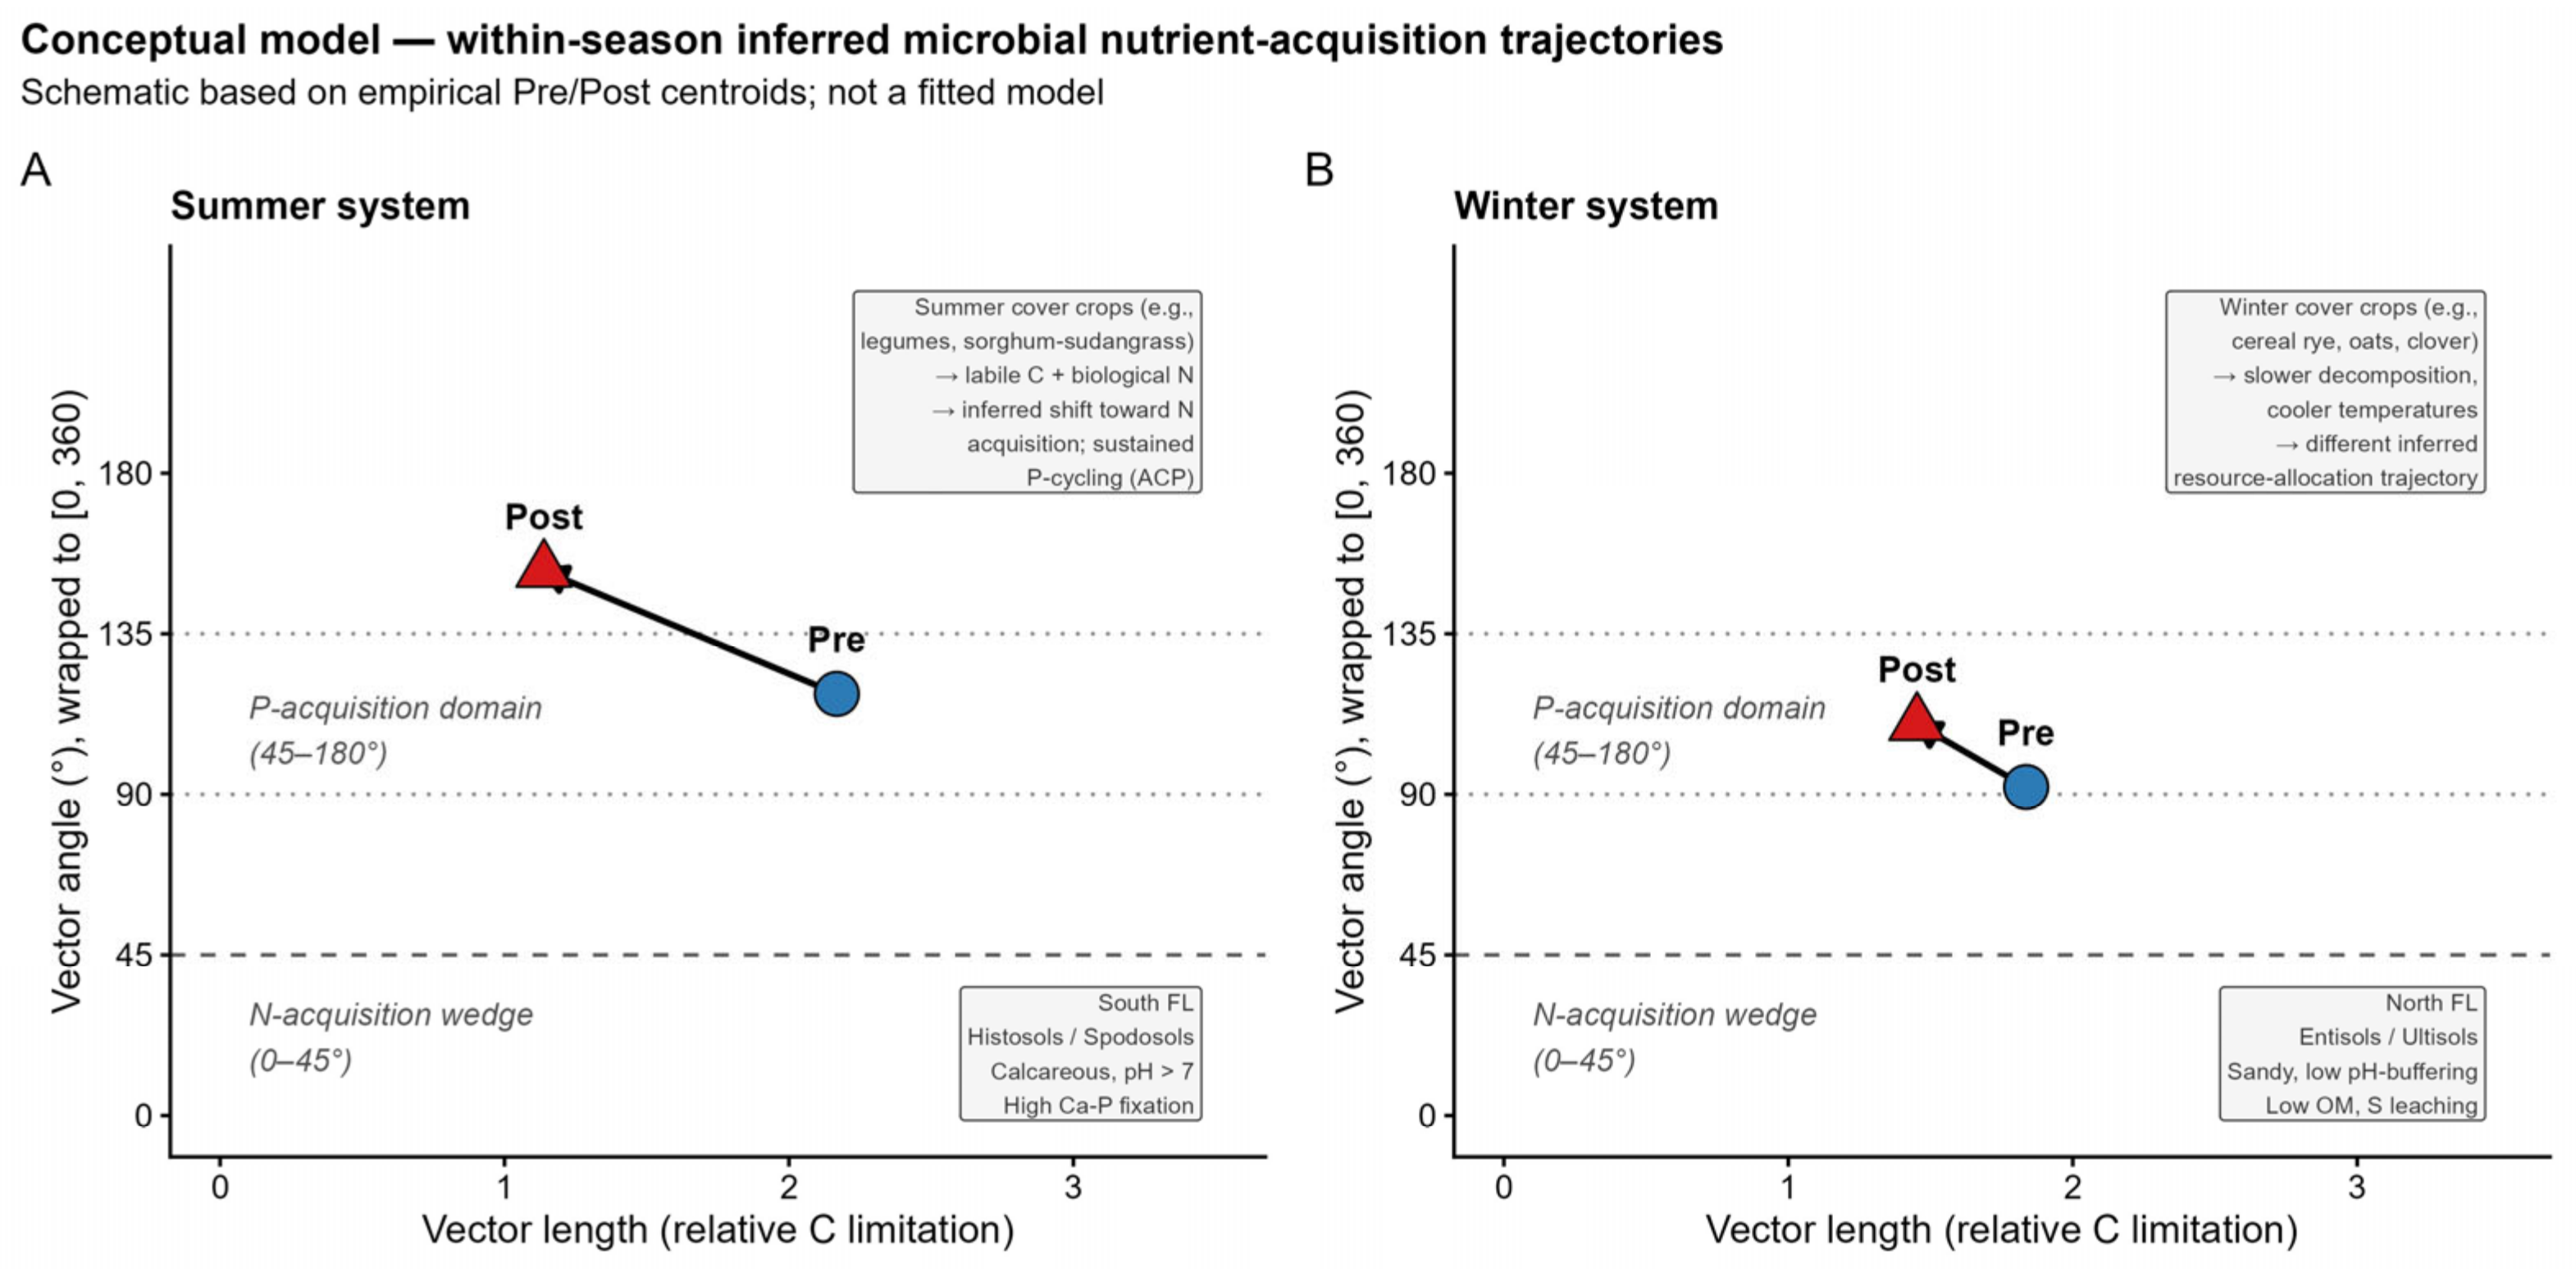
With circular summaries given precedence, the Summer data showed a 34° Pre-to-Post displacement in circular-mean VA within the P-acquisition half-plane (118° to 153°; Figure 5), accompanied by a 1.0-unit reduction in vector length and a large increase in NAG activity. These observations are consistent with altered relative enzyme allocation within a continuing P-acquisition regime, rather than a categorical switch from P to N limitation. The Winter data showed a smaller descriptive angular displacement (92° to 110°) and a smaller vector-length difference. Because the present revision does not apply a circular inferential test to VA, neither angular displacement is described as a statistically demonstrated Phase effect.
Figure 5.
Conceptual schematic of within-season inferred microbial nutrient-acquisition trajectories on the vector-analysis plane. (A) Summer system: a large reduction in vector length (~1.0 unit), accompanied by a 34° displacement in the circular-mean vector angle within the P-acquisition domain (118° → 153°). (B) Winter system: smaller vector-length reduction (~0.4 unit) and a 17° angular displacement within the P-acquisition domain (92° → 110°). Edaphic context in bottom-right callouts; system-specific mechanistic narratives in top-right callouts. Schematic based on empirical Pre/Post centroids; not a fitted model. Solid arrows in the plots show the Pre → Post displacement of the empirical circular-mean centroids; the arrows (→) inside the callout boxes link elements of proposed interpretive mechanisms and do not represent measured pathways. The dashed line marks the 45° boundary between the N- and P-acquisition domains; the dotted lines at 90° and 135° are visual reference lines only.
4.3. Edaphic Mediation of Cover-Crop Responses
Within-season correlation and dbRDA results identified system-specific associations between enzyme structure and measured edaphic variables. In Summer, OM correlated most strongly with ACP and AS, whereas BG and NAG were weakly associated with the measured edaphic variables. In Winter, plant-available P was among the strongest correlates of NAG and ACP. These patterns are compatible with different proximate constraints across the two systems, but they do not establish that OM or AP directly mediated the Pre-to-Post enzyme differences. The dbRDA-adjusted R2 values (24.3% Summer; 28.0% Winter) and variance partitioning further indicate that substantial residual variation remained unexplained. Consequently, system-specific models that explicitly measure both soil properties and farm management are more defensible than a single generalized ‘subtropical cover-crop response.’
4.4. Implications for Biological P Cycling in Calcareous Agroecosystems
The persistence of high ACP activity in the Summer system across both phases, combined with the dramatic NAG response, suggests that summer cover cropping in calcareous South Florida soils may augment biological P-cycling capacity without displacing the chronic phosphatase pool dictated by calcium-phosphate mineralogy. Acid phosphatase activity in Summer Pre soils (109.5 mg pNP kg−1 h−1) was already high relative to most temperate agricultural systems (cf. [2]), reflecting the strong biological investment in P acquisition that high-pH, carbonate-rich soils select for [4,16]. The maintenance of ACP activity at this level following cover-crop termination, while NAG increased fourfold, is consistent with a microbial strategy of additive recruitment of N-acquisition capacity rather than substitution between N and P acquisition. From a management perspective, this enzymatic evidence broadly supports the hypothesis that cover-crop-mediated organic-matter inputs may enhance organic-P mineralization capacity, thereby complementing rather than replacing chemical P management. A similar coexistence of elevated available P with sustained P-acquisition emphasis, indicating demand-driven rather than supply-driven P limitation, has been reported under diversified cropping [10]. Direct measurement of in situ P fluxes would be required to confirm this interpretation; the present enzyme data should be regarded as evidence of capacity rather than realized flux.
4.5. Sulfur Acquisition in the Ecoenzymatic Stoichiometry Framework
Although AS is not part of the formal Sinsabaugh–Moorhead C:N:P framework, its inclusion in this study revealed system-specific behavior that contributes to a more complete picture of C:N:P:S resource acquisition. In the Summer system, AS tracked C-cycling activity loosely on PC2 of the principal component analysis but did not respond significantly to cover-crop phase. In the Winter system, AS responded in the opposite direction to BG, NAG, ACP, and MBC: it increased markedly after cover-crop termination, was anti-correlated with MBC (r = −0.51), and loaded on its own principal component. The functional interpretation is preliminary, but the pattern is consistent with reports that sulfatase production can be regulated separately from carbohydrate-cycling enzymes in agricultural soils where atmospheric S deposition has declined and crop S deficiencies are emerging [13,14]. AS may therefore be a useful additional indicator in soil-health monitoring frameworks for sandy subtropical systems, where its decoupling from C-acquisition activity could carry diagnostic information that the C:N:P enzyme suite alone does not capture.
4.6. Limitations
Several limitations qualify these interpretations. First, the observational regional design confounds Season with edaphic context, regional climate, prevailing cover-crop species, and farming-system identity; cross-system comparisons are therefore qualitative. Replicated summer and winter cover-crop plantings within the same farms and soils would be required to separate seasonal from edaphic effects. Second, farm-level management was not standardized, and several potentially important covariates were not recorded consistently enough for quantitative analysis, including N fertilizer application rates, irrigation regimes, previous crop history, cover crop history, and cover crop termination methods. Mechanical rolling or mowing, chemical desiccation, and tillage can differ in residue placement, tissue disruption, soil disturbance, and decomposition kinetics and could therefore alter microbial substrate availability and enzyme activities in different directions. Because farm-specific termination methods cannot be reconstructed reliably from the present dataset, we do not assign methods to individual farms. Future observational studies should record these variables prospectively, whereas factorial experiments should manipulate termination method and nutrient inputs under a common soil and crop background. Third, the BACI design does not identify the specific cover-crop traits responsible for the observed phase contrasts; species-level effects require within-farm comparisons. Fourth, two Winter responses (C:N ratio and VL) yielded singular random-intercept variances with only four Winter farms; conditional R2 is therefore not reported for these responses, although fixed-effect estimates remain valid [31]. Fifth, enzyme stoichiometry represents potential activity rather than realized nutrient flux. Direct measurements of in situ N, P, and S mineralization, microbial community composition, residue chemistry and crop nutrient uptake would be required to test the proposed mechanisms. Finally, vector angle is circular; arithmetic summaries can be misleading near ±180°, so the revised interpretation relies on circular means, medians, and domain proportions and does not assign linear-model significance to VA.
5. Conclusions
Across the two Florida agroecosystems, Pre-to-Post enzyme patterns were system-specific. Summer soils had higher BG and NAG, unchanged ACP and AS, and lower vector length Post than Pre, whereas Winter soils had lower BG, NAG, ACP, and MBC but higher AS. In Winter, these large absolute enzyme differences were accompanied by little change in C:N and N:P ratios, indicating that phase contrasts in enzyme magnitude did not necessarily translate into proportional reallocation among C, N, and P acquisition. Circular vector-angle summaries placed both systems predominantly within the P-acquisition domain and showed why arithmetic angular means can yield misleading biological classifications.
These results support two practical conclusions. Ecoenzymatic indicators should be interpreted against soil- and management-specific baselines rather than pooled across edaphically distinct subtropical production systems, and vector angles should be summarized with circular statistics whenever observations approach the ±180° boundary. Arylsulfatase also provided information not captured by the conventional C:N:P enzyme suite, particularly in the sandy Winter system. Future replicated experiments that standardize soil context while manipulating cover-crop species, termination method, nutrient inputs, and irrigation will be necessary to determine which management factors generate these phase-associated patterns and to translate enzyme stoichiometry into defensible soil-health benchmarks.
Supplementary Materials
The following supporting information can be downloaded at: https://www.mdpi.com/article/10.3390/soilsystems10090107/s1, Tables S1 and S2 give the full within-season linear mixed-effects ANOVA output and estimated marginal means underlying the Pre → Post contrasts of Table 1. Tables S3 and S4 give the per-season Pearson correlation matrices between enzyme/stoichiometric responses and edaphic predictors that underlie Figure 3. Table S5 provides variance inflation factors for the seven edaphic predictors used in the dbRDA analysis (Figure 4). Figure S1 shows per-season principal component analysis biplots that complement the dbRDA results.
Author Contributions
H.A.: conceptualization, methodology, formal analysis, data curation, writing—original draft, writing—review and editing, visualization. T.J.: investigation, data curation, writing—review and editing. N.M.: investigation, methodology, writing—review and editing. S.M.: investigation, visualization. J.C.: investigation (North Florida sites), writing—review and editing. H.S.: investigation (West Florida sites), writing—review and editing. B.J.V.: investigation, laboratory analyses. K.K.: methodology (microbial assays), writing—review and editing. A.R.: investigation, data curation. T.S.: investigation (Tropical REC sites). Z.B.: supervision, writing—review and editing. J.H.B.: conceptualization, supervision, project administration, funding acquisition, writing—review and editing. All authors have read and agreed to the published version of the manuscript.
Funding
This research was supported by grant number 29756 from the Florida Department of Agriculture and Consumer Services Agricultural Water Policy, and by USDA Hatch Award FLA-ERC-006097. The funders had no role in study design, data collection, analysis, decision to publish, or preparation of the manuscript.
Data Availability Statement
The cleaned dataset, derived stoichiometric variables, R analysis code, and Supplementary Tables are archived in the GitHub repository https://github.com/Arfania-coder/Ecoenzyme_Cover_Cropping (accessed on 11 September 2026). The raw enzyme-assay data and farm metadata are available from the corresponding author upon reasonable request, subject to grower confidentiality agreements.
Acknowledgments
We thank the cooperating growers at the 10 Florida farms for site access and management records and the laboratory staff at the Everglades Research and Education Center for soil sampling and assay support. We thank colleagues at the South Florida Water Management District and the University of Florida Tropical, North Florida, and West Florida Research and Education Centers for logistical assistance.
Conflicts of Interest
The authors declare no conflicts of interest.
References
- Burns, R.G.; DeForest, J.L.; Marxsen, J.; Sinsabaugh, R.L.; Stromberger, M.E.; Wallenstein, M.D.; Weintraub, M.N.; Zoppini, A. Soil enzymes in a changing environment: Current knowledge and future directions. Soil Biol. Biochem. 2013, 58, 216–234. [Google Scholar] [CrossRef] [Scilit]
- Sinsabaugh, R.L.; Lauber, C.L.; Weintraub, M.N.; Ahmed, B.; Allison, S.D.; Crenshaw, C.; Contosta, A.R.; Cusack, D.; Frey, S.; Gallo, M.E.; et al. Stoichiometry of soil enzyme activity at global scale. Ecol. Lett. 2008, 11, 1252–1264. [Google Scholar] [CrossRef] [Scilit] [PubMed]
- Brennan, E.B.; Acosta-Martinez, V. Cover crops and compost influence soil enzymes during six years of tillage-intensive, organic vegetable production. Soil Sci. Soc. Am. J. 2019, 83, 624–637. [Google Scholar] [CrossRef] [Scilit]
- Chang, S.; Li, C.; Miao, Y.; Wang, Y.; Zhang, W.; Li, Q.; Kou, Z.; Zeng, X.; Chen, J. Extracellular enzyme activity and stoichiometry reveal P limitation in the wild panda habitat of the Qinling Mountains. Soil Sci. Soc. Am. J. 2024, 88, 2295–2310. [Google Scholar] [CrossRef] [Scilit]
- Allison, S.D.; Weintraub, M.N.; Gartner, T.B.; Waldrop, M.P. Evolutionary–economic principles as regulators of soil enzyme production and ecosystem function. In Soil Enzymology; Shukla, G., Varma, A., Eds.; Springer: Berlin/Heidelberg, Germany, 2011; pp. 229–243. [Google Scholar] [CrossRef] [Scilit]
- Moorhead, D.L.; Sinsabaugh, R.L.; Hill, B.H.; Weintraub, M.N. Vector analysis of ecoenzyme activities reveals constraints on coupled C, N and P dynamics. Soil Biol. Biochem. 2016, 93, 1–7. [Google Scholar] [CrossRef] [Scilit]
- Sinsabaugh, R.L.; Hill, B.H.; Follstad Shah, J.J. Ecoenzymatic stoichiometry of microbial organic nutrient acquisition in soil and sediment. Nature 2009, 462, 795–798, Erratum in Nature 2010, 468, 122. [Google Scholar] [CrossRef] [Scilit] [PubMed]
- Moorhead, D.L.; Rinkes, Z.L.; Sinsabaugh, R.L.; Weintraub, M.N. Dynamic relationships between microbial biomass, respiration, inorganic nutrients and enzyme activities: Informing enzyme-based decomposition models. Front. Microbiol. 2013, 4, 223. [Google Scholar] [CrossRef] [Scilit] [PubMed]
- Sterner, R.W.; Elser, J.J. Ecological Stoichiometry: The Biology of Elements from Molecules to the Biosphere; Princeton University Press: Princeton, NJ, USA, 2002. [Google Scholar]
- Zhang, W.; Li, W.; Li, Z.; Li, X.; Duan, R.; Luo, D.; Xiong, G.; Li, M.; Tao, J.; Li, S.; et al. Diversified cropping combined with nutrient optimization regulates microbial resource limitations, thereby influencing ecoenzymatic carbon and nitrogen use efficiencies. Agric. Ecosyst. Environ. 2026, 407, 110470. [Google Scholar] [CrossRef] [Scilit]
- Ekenler, M.; Tabatabai, M.A. Tillage and residue management effects on β-glucosaminidase activity in soils. Soil Biol. Biochem. 2003, 35, 871–874. [Google Scholar] [CrossRef] [Scilit]
- Sinsabaugh, R.L.; Shah, J.J.F. Ecoenzymatic stoichiometry and ecological theory. Annu. Rev. Ecol. Evol. Syst. 2012, 43, 313–343. [Google Scholar] [CrossRef] [Scilit]
- Acosta-Martínez, V.; Tabatabai, M.A. Enzyme activities in a limed agricultural soil. Biol. Fertil. Soils 2000, 31, 85–91. [Google Scholar] [CrossRef] [Scilit]
- Tabatabai, M.A. Soil enzymes. In Methods of Soil Analysis, Part 2. Microbiological and Biochemical Properties; Weaver, R.W., Angle, J.S., Bottomley, P.S., Eds.; SSSA Book Series No. 5; SSSA: Madison, WI, USA, 1994; pp. 775–833. [Google Scholar] [CrossRef] [Scilit]
- Cui, Y.; Bing, H.; Moorhead, D.L.; Delgado-Baquerizo, M.; Ye, L.; Yu, J.; Zhang, S.; Wang, X.; Peng, S.; Guo, X.; et al. Ecoenzymatic stoichiometry reveals widespread soil phosphorus limitation to microbial metabolism across Chinese forests. Commun. Earth Environ. 2022, 3, 184. [Google Scholar] [CrossRef] [Scilit]
- DeBusk, W.F.; Reddy, K.R.; Koch, M.S.; Wang, Y. Spatial distribution of soil nutrients in a northern Everglades marsh: Water Conservation Area 2A. Soil Sci. Soc. Am. J. 1994, 58, 543–552. [Google Scholar] [CrossRef] [Scilit]
- Abdalla, M.; Hastings, A.; Cheng, K.; Yue, Q.; Chadwick, D.; Espenberg, M.; Truu, J.; Rees, R.M.; Smith, P. A critical review of the impacts of cover crops on nitrogen leaching, net greenhouse gas balance and crop productivity. Glob. Change Biol. 2019, 25, 2530–2543. [Google Scholar] [CrossRef] [Scilit] [PubMed]
- Blanco-Canqui, H.; Shaver, T.M.; Lindquist, J.L.; Shapiro, C.A.; Elmore, R.W.; Francis, C.A.; Hergert, G.W. Cover crops and ecosystem services: Insights from studies in temperate soils. Agron. J. 2015, 107, 2449–2474. [Google Scholar] [CrossRef] [Scilit]
- Kaye, J.P.; Quemada, M. Using cover crops to mitigate and adapt to climate change. A review. Agron. Sustain. Dev. 2017, 37, 4. [Google Scholar] [CrossRef] [Scilit]
- Finney, D.M.; White, C.M.; Kaye, J.P. Biomass production and carbon/nitrogen ratio influence ecosystem services from cover crop mixtures. Agron. J. 2016, 108, 39–52. [Google Scholar] [CrossRef] [Scilit]
- Sui, X.; Bao, X.; Xie, H.; Ba, X.; Yu, Y.; Yang, Y.; He, H.; Liang, C.; Zhang, X. Contrasting seasonal effects of legume and grass cover crops as living mulch on the soil microbial community and nutrient metabolic limitations. Agric. Ecosyst. Environ. 2025, 380, 109374. [Google Scholar] [CrossRef] [Scilit]
- Blake, G.R.; Hartge, K.H. Bulk density. In Methods of Soil Analysis, Part 1. Physical and Mineralogical Methods, 2nd ed.; Klute, A., Ed.; ASA: Madison, WI, USA; SSSA: Madison, WI, USA, 1986; pp. 363–375. [Google Scholar]
- Joergensen, R.G. The fumigation-extraction method to estimate soil microbial biomass: Calibration of the kEC value. Soil Biol. Biochem. 1996, 28, 25–31. [Google Scholar] [CrossRef] [Scilit]
- Mardia, K.V.; Jupp, P.E. Directional Statistics; Wiley: Chichester, UK, 2000. [Google Scholar] [CrossRef] [Scilit]
- R Core Team. R: A Language and Environment for Statistical Computing; R Foundation for Statistical Computing: Vienna, Austria, 2025; Available online: https://www.R-project.org/ (accessed on 11 September 2026).
- Kuznetsova, A.; Brockhoff, P.B.; Christensen, R.H.B. LmerTest package: Tests in linear mixed effects models. J. Stat. Softw. 2017, 82, 1–26. [Google Scholar] [CrossRef] [Scilit]
- Halekoh, U.; Højsgaard, S. A Kenward-Roger approximation and parametric bootstrap methods for tests in linear mixed models—The R package pbkrtest. J. Stat. Softw. 2014, 59, 1–32. [Google Scholar] [CrossRef] [Scilit]
- Lenth, R. Emmeans: Estimated Marginal Means, Aka Least-Squares Means, R package version 1.11.2; University of Iowa: Iowa City, IA, USA, 2024. Available online: https://CRAN.R-project.org/package=emmeans (accessed on 11 September 2026).
- Hartig, F. DHARMa: Residual Diagnostics for Hierarchical (Multi-Level/Mixed) Regression Models, R package version 0.4.7; University of Regensburg: Regensburg, Germany, 2022. Available online: https://CRAN.R-project.org/package=DHARMa (accessed on 11 September 2026).
- Lüdecke, D.; Ben-Shachar, M.S.; Patil, I.; Waggoner, P.; Makowski, D. Performance: An R package for assessment, comparison and testing of statistical models. J. Open Source Softw. 2021, 6, 3139. [Google Scholar] [CrossRef] [Scilit]
- Bates, D.; Kliegl, R.; Vasishth, S.; Baayen, H. Parsimonious mixed models. arXiv 2015, arXiv:1506.04967. [Google Scholar]
- Oksanen, J.; Simpson, G.L.; Blanchet, F.G.; Kindt, R.; Legendre, P.; Minchin, P.R.; O’Hara, R.B.; Solymos, P.; Stevens, M.H.H.; Szoecs, E.; et al. Vegan: Community Ecology Package, R package version 2.7-1; University of Helsinki: Helsinki, Finland, 2024. Available online: https://CRAN.R-project.org/package=vegan (accessed on 11 September 2026).
- Lê, S.; Josse, J.; Husson, F. FactoMineR: An R package for multivariate analysis. J. Stat. Softw. 2008, 25, 1–18. [Google Scholar] [CrossRef] [Scilit]
- Borcard, D.; Legendre, P.; Drapeau, P. Partialling out the spatial component of ecological variation. Ecology 1992, 73, 1045–1055. [Google Scholar] [CrossRef] [Scilit]
Disclaimer/Publisher’s Note: The statements, opinions and data contained in all publications are solely those of the individual author(s) and contributor(s) and not of MDPI and/or the editor(s). MDPI and/or the editor(s) disclaim responsibility for any injury to people or property resulting from any ideas, methods, instructions or products referred to in the content. |
© 2026 by the authors. Licensee MDPI, Basel, Switzerland. This article is an open access article distributed under the terms and conditions of the Creative Commons Attribution (CC BY) license.