


Abstract
This study addresses the need for reliable field-based tools to assess soil structural quality in semi-arid rangelands, where existing visual methods such as the Visual Evaluation of Soil Structure (VESS) and its modified version for grasslands (GrassVESS) may be limited by site conditions. The objective was to develop and evaluate a modified visual soil structure assessment method (RangelandVESS) adapted to livestock grazed rangelands in northern Mexico. Soil sampling was conducted in grazed and exclusion zones and soil structure was assessed using VESS, GrassVESS, and RangelandVESS. Thereafter, the scores of each method were compared with soil health indicators and above-ground biomass. Results showed distinctions in soil structural conditions between exclusion and overgrazed areas. RangelandVESS seems to demonstrate greater sensitivity to degradation, particularly in sandy soils, where it identified poorer structural quality compared to the other methods. Significant correlations were obtained between RangelandVESS scores and bulk density, infiltration, and biomass supporting its robustness. In contrast, no significant differences among methods scores were observed in clayey–loamy soils. However, RangelandVESS may provide a more reliable assessment of degradation. Overall, the findings suggest that RangelandVESS is a suitable tool for assessing soil structure in semi-arid rangelands and offers improved capacity to detect grazing induced degradation.
1. Introduction
Rangelands are ecosystems composed of natural or semi-natural vegetation that provide forage for domestic and wild animals [1]. They cover about 50% of earth’s surface area [2] and are commonly extensively managed lands, meaning that they require a low input of energy [3,4,5]. These lands mainly include shrublands, grasslands, savannas, semideserts, and deserts which are also described as drylands. Therefore, they are characterized by low rainfall and high evaporation rates with an aridity index below 0.65 [6]. However, rangelands can also be found in humid areas [7]. Regarding ecosystem services, rangelands not only provide forage for livestock production, but are also recognized by their cultural, supporting, and regulating services. Despite their relevance, they are threatened mainly by human activities. For instance, overgrazing can lead to structural deterioration by shearing as livestock exert pressure through their hooves in the soil [8,9,10,11]. The hoof pressure refers to the weight per unit area, i.e., the contact area of the hooves, of a standing animal [12]. Other influencing factors in soil health and soil structural degradation include stock density, grazing duration, soil water content, and climatic conditions [13,14,15,16].
Soil health threats are a consequence of poor management practices and soil susceptibility under driving factors [17]. Soil structural degradation is a central factor influencing soil health, as numerous soil degradation processes are either caused by or expressed through alterations in soil structure [18]. In response to the need for practical and reliable soil assessment tools, several field-based methods for the direct evaluation of soil structure have been developed [19]. Among these, visual soil assessment approaches, such as spade-based techniques including the Visual Evaluation of Soil Structure (VESS) [20], have been related well to laboratory measurements [21,22,23] and widely applied across diverse soil types, land uses, and climatic regions [23,24]. However, the applicability of VESS in grasslands can be influenced by the presence of a dense root-mat layer [25]. To address this limitation, Emmet-Booth et al., (2018) [26] developed the GrassVESS method, a modified version of VESS that evaluates the root-mat layer separately from the underlying soil profile. While GrassVESS represents an important adaptation of the method for pasture systems, rangelands from arid or semi-arid environments present distinct soil conditions that may require further methodological adaptation for reliable field assessment of soil structural status.
Regarding rangeland soil health, different indicators and methodologies have been applied. Some authors [27,28] used physical, chemical, and biological quality indicators such as visual soil erosion features, soil surface cover, and soil organic matter. A widely used method is the Interpreting Indicators of Rangeland Health (IIRH) by [29], which evaluates visual changes in soil structure as part of its rating system. These visual indicators include a reduction in macropores, platy aggregates near the surface as well as the presence of massive, angular, and homogeneous aggregates [29]. Nonetheless, the IIRH methodology provides only generic descriptions and lacks visual guidance for each description. Visual soil evaluation techniques, such as VESS, are useful not only because they correlate with quantitative parameters but also because they provide immediate results, are low-cost and labor efficient [30]. This is especially relevant in threatened ecosystems such as rangelands in semi-arid and arid regions. Although GrassVESS [26] and VESS have been applied in tropical, temperate, and mediterranean climates in agricultural and pasture systems [31,32,33,34], their application in rangelands remains limited. Pulido-Moncada et al. [19] argued that the development of visual techniques is in response to local needs. The unique structural dynamics of semi-arid rangeland soils, influenced by limited vegetation cover and grazing pressure, may not be sufficiently addressed by existing VESS approaches.
Therefore, this study aimed to develop and evaluate a modified version of the VESS method adapted for rangeland ecosystems (RangelandVESS). Specifically, the objectives were (i) to adapt the VESS protocol to better reflect soil structural conditions under livestock grazing in semi-dry rangelands, (ii) to examine the relationship between the visual scores and selected soil physical and chemical properties, and (iii) to compare the performance of the adapted method with the original VESS and GrassVESS approaches.
2. Materials and Methods
2.1. Study Site and Soil Sampling
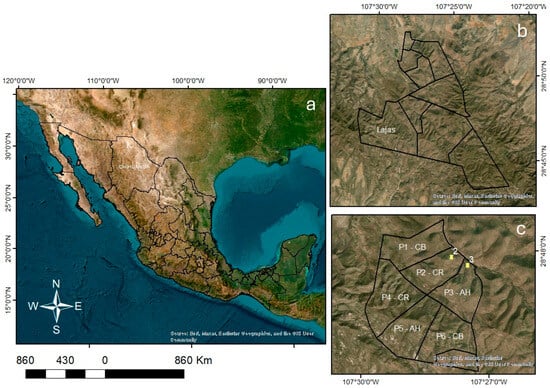
The study site, “Lajas”, is located in the Teseachi experimental ranch (Figure 1) of the Autonomous University of Chihuahua (UACh), municipality of Namiquipa, Chihuahua, in northern Mexico, with an approximate area of 12,500 ha. According to the Koppen Climate Classification modified by Garcia (2004) [35], the climate in Teseachi is BS1kw (semidry-temperate or steppe). The average annual temperature is 13 °C and the average annual rainfall is 580 mm with a mean annual evaporation of 1878 mm [36]. The altitude ranges from 1900 to 2800 m.a.s.l. [37] and according to the World Reference Base (WRB), the soil at Teseachi is classified as Leptosol [38]. These soils are characterized as soils of less than 25 cm depth, and they have a volume of rocks and stones of approximately 80% [39].
Figure 1.
Location of the study area (a) Chihuahua located in northern Mexico, (b) Lajas paddock within Teseachi experimental ranch and (c) Lajas sub-paddocks assigned to different cattle breeds for grazing. AH is Angus × Hereford crossbred, CR is Criollo, and CB is the crossbreed of AH and CR. Yellow markers correspond to the two exclusion zones that were sampled which belong to paddock number 2 and 3.
The study site is divided into six paddocks, each with an approximately 60 m2 grazing exclusion zone. Figure 1c shows the cattle breed assigned to each paddock (P1 to P6). The cattle breeds are commercial beef breed Angus × Hereford crossbreds (AH), heritage breed Criollo (CR), and the crossbreed (CB) of AH and CR. Criollo cattle present favorable traits that make them well suited to arid and semi-arid rangelands. For instance, they appear to adjust their foraging behavior to seasonal changes, have lighter body weight, and exhibit greater tolerance to high temperatures [40].
To minimize topographic influences and due to the prevalence of rocky terrain, soil and aboveground biomass (AGB) samples were collected from lower altitudes (2120–2184 m), on north-facing slopes. A comprehensive soil characterization campaign was conducted in November 2022. Thereafter, two sampling campaigns were conducted in November 2023 and September 2024. In each sampling campaign, five sampling points were selected per paddock in areas showing visible signs of overgrazing. Of the six exclusion zones, only two were sampled (Figure 1c), and three sampling points were selected within each. The main reason for sampling only two exclusion areas was their greater accessibility under the existing terrain conditions. Furthermore, the selected areas were considered representative of the remaining exclusion zones, and all six exclusion areas had been ungrazed for the same length of time. At each sampling point, soil samples were taken and in situ evaluations were performed. Undisturbed soil samples from each sampling point were collected at a depth of 5 cm for aggregate stability and pH assessment. Aggregate stability was assessed following Nyamasoka-Magonziwa et al. (2020) [41], based on a method adapted from Elliot (1986) [42]. Briefly, 70 g of air-dried soil was carefully passed through an 8 mm sieve to remove large aggregates. The soil was then sieved through a 2 mm mesh and submerged in water with the water level maintained 2 cm above the sieve, allowing the sample to slake for 5 min. Subsequently, using the Tempo mobile application set at 50 beats per minute, the sieve was moved vertically in and out of the water 50 times over 2 min. The remaining soil aggregates (>2 mm) were collected on a filter and oven-dried to represent the >2 mm fraction. The material that passed through the sieve was then transferred to a 250 µm sieve, and the procedure was repeated, ensuring that the water level completely covered the soil. The mean weight diameter (MWD) was calculated according to Equation (1):
where Wi is the proportion of the total sample in the corresponding size fraction, n is the number of size fractions, and Xi is the mean diameter of the ith class (mm).
Subsamples of the 2 mm sieved soil were used for soil pH determination in a soil–water suspension at a 1:2 ratio following the method described in NOM-021-RECNAT-2000 [43]. In situ assessment involved soil infiltration and bulk density (BD). Soil water infiltration was measured with the single-ring method [44]. Briefly, a metallic ring (19.5 cm height and 12.5 cm diameter) was inserted into the soil to a depth of 5 cm, and infiltration was recorded at 5 min intervals over a total period of 30 to 60 min. One infiltration measurement was performed at each sampling point. For BD, the method for gravelly and rocky soils was used [45]. This involved excavating a hole in known dimensions of approximately 10 cm × 10 cm × 10 cm which was then filled with water to obtain the exact volume. The excavated soil was collected and transported to the laboratory to determine its oven-dry mass.
In addition, a soil block was collected at each sampling point for structural assessment then carefully packed and transported to the laboratory for evaluation using the VESS, GrassVESS, and RangelandVESS methods. The standard VESS method [20] involved manual breakdown of the soil blocks followed by scoring of aggregates (1–5) based on size, shape, porosity, root presence, and internal features where 1 represents the best soil structure quality. GrassVESS [26] briefly consisted of a visual scoring system applied to two soil layers. The lower soil layer is scored on a four-level scale based on aggregate shape and size, while the upper (root-mat) layer is evaluated using a three-level scale considering aggregate characteristics, porosity, and root growth pathways. The assessment is guided by decision flow charts supported by reference images [26]. RangelandVESS assessments were conducted at each sampling point following the protocol developed in this study, as described below.
2.2. Development of RangelandVESS
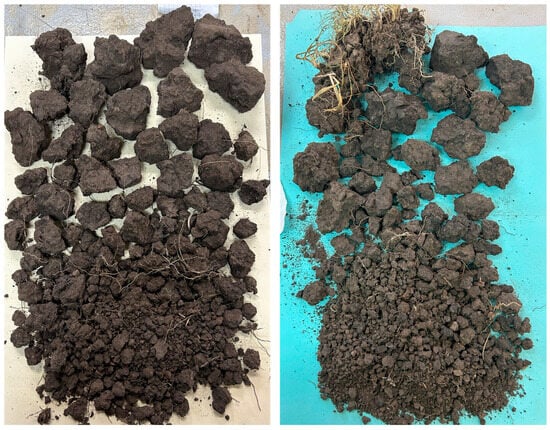
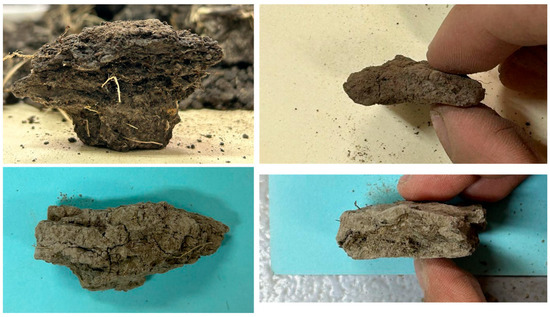
During the sampling campaign of November 2023, soil blocks were collected systematically across all paddocks, with five samples per paddock and three samples in two of the five grazing exclusion zones. The exclusion zones are areas with expected minimal or no structural degradation. The November 2023 sampling campaign aimed to capture the full range of soil structural variability, evaluate the relevance of VESS and GrassVESS criteria, and identify additional characteristics needed for soil structure quality assessment in rangeland soils. Extracted blocks were visually evaluated, segregated, and photographed in the laboratory (Figure 2). While VESS and GrassVESS protocols use a spade to extract soil blocks, the soil conditions in the studied rangeland area required the use of a mattock to extract larger soil blocks (20–25 × 20–25 × 20–25 cm, adjustable for terrain), from which smaller blocks (~10 × 10 × 10 cm, adjustable for terrain) were obtained for assessment. Therefore, across the paddocks, only the 10 cm of topsoil was assessed as the presence of rock fragments prevented sampling of deeper layers.
Figure 2.
Example of photographic records of the soil blocks assessed from the study site. The photos are from soil samples from paddock 2 near a water stream where heritage breed Criollo cattle graze.
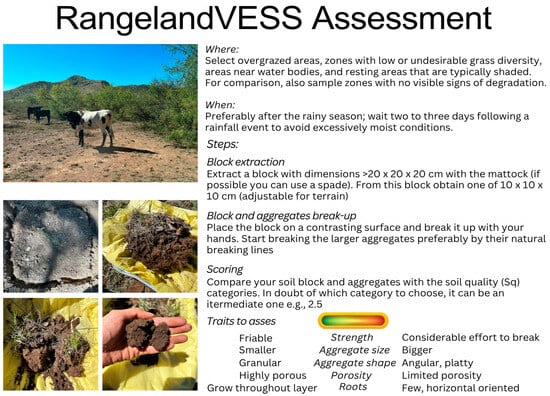
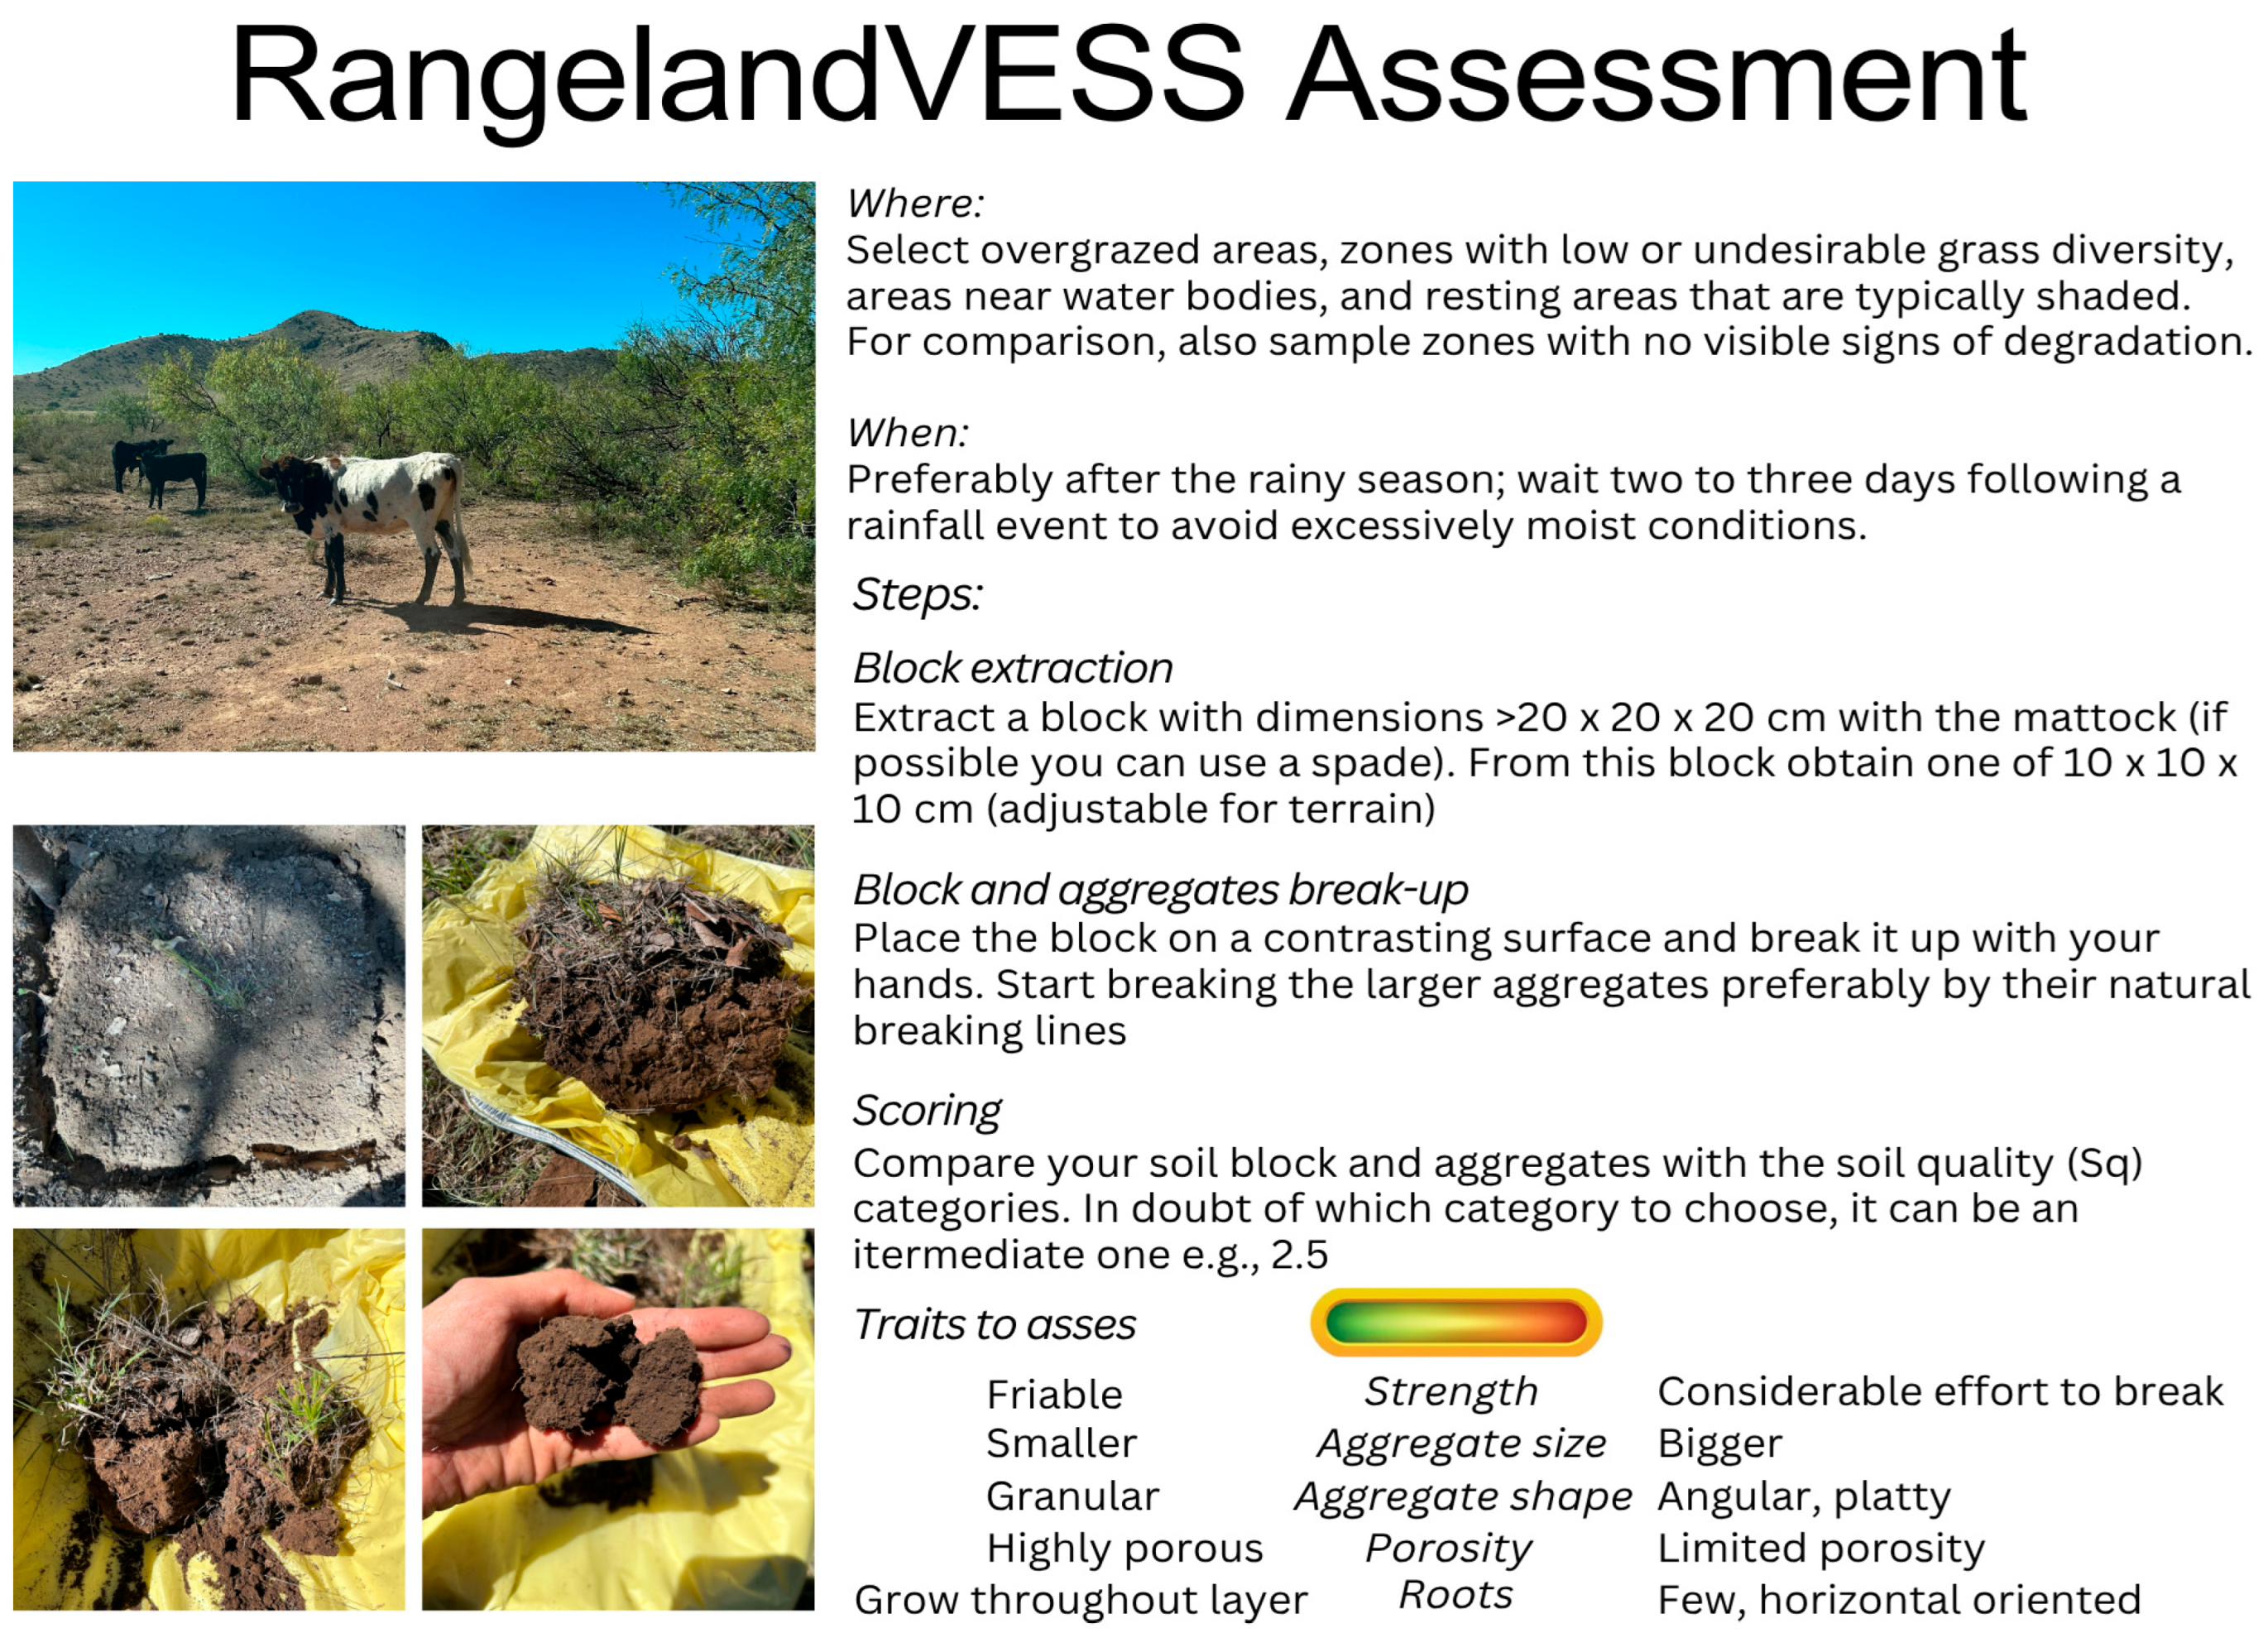
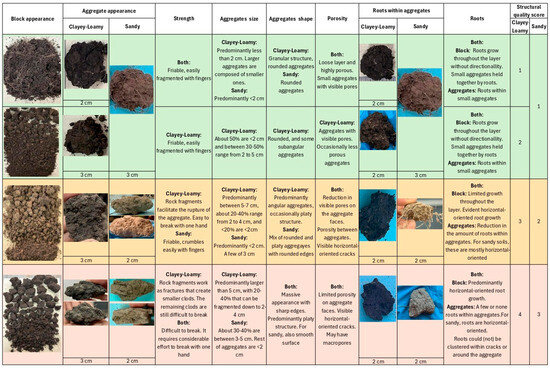
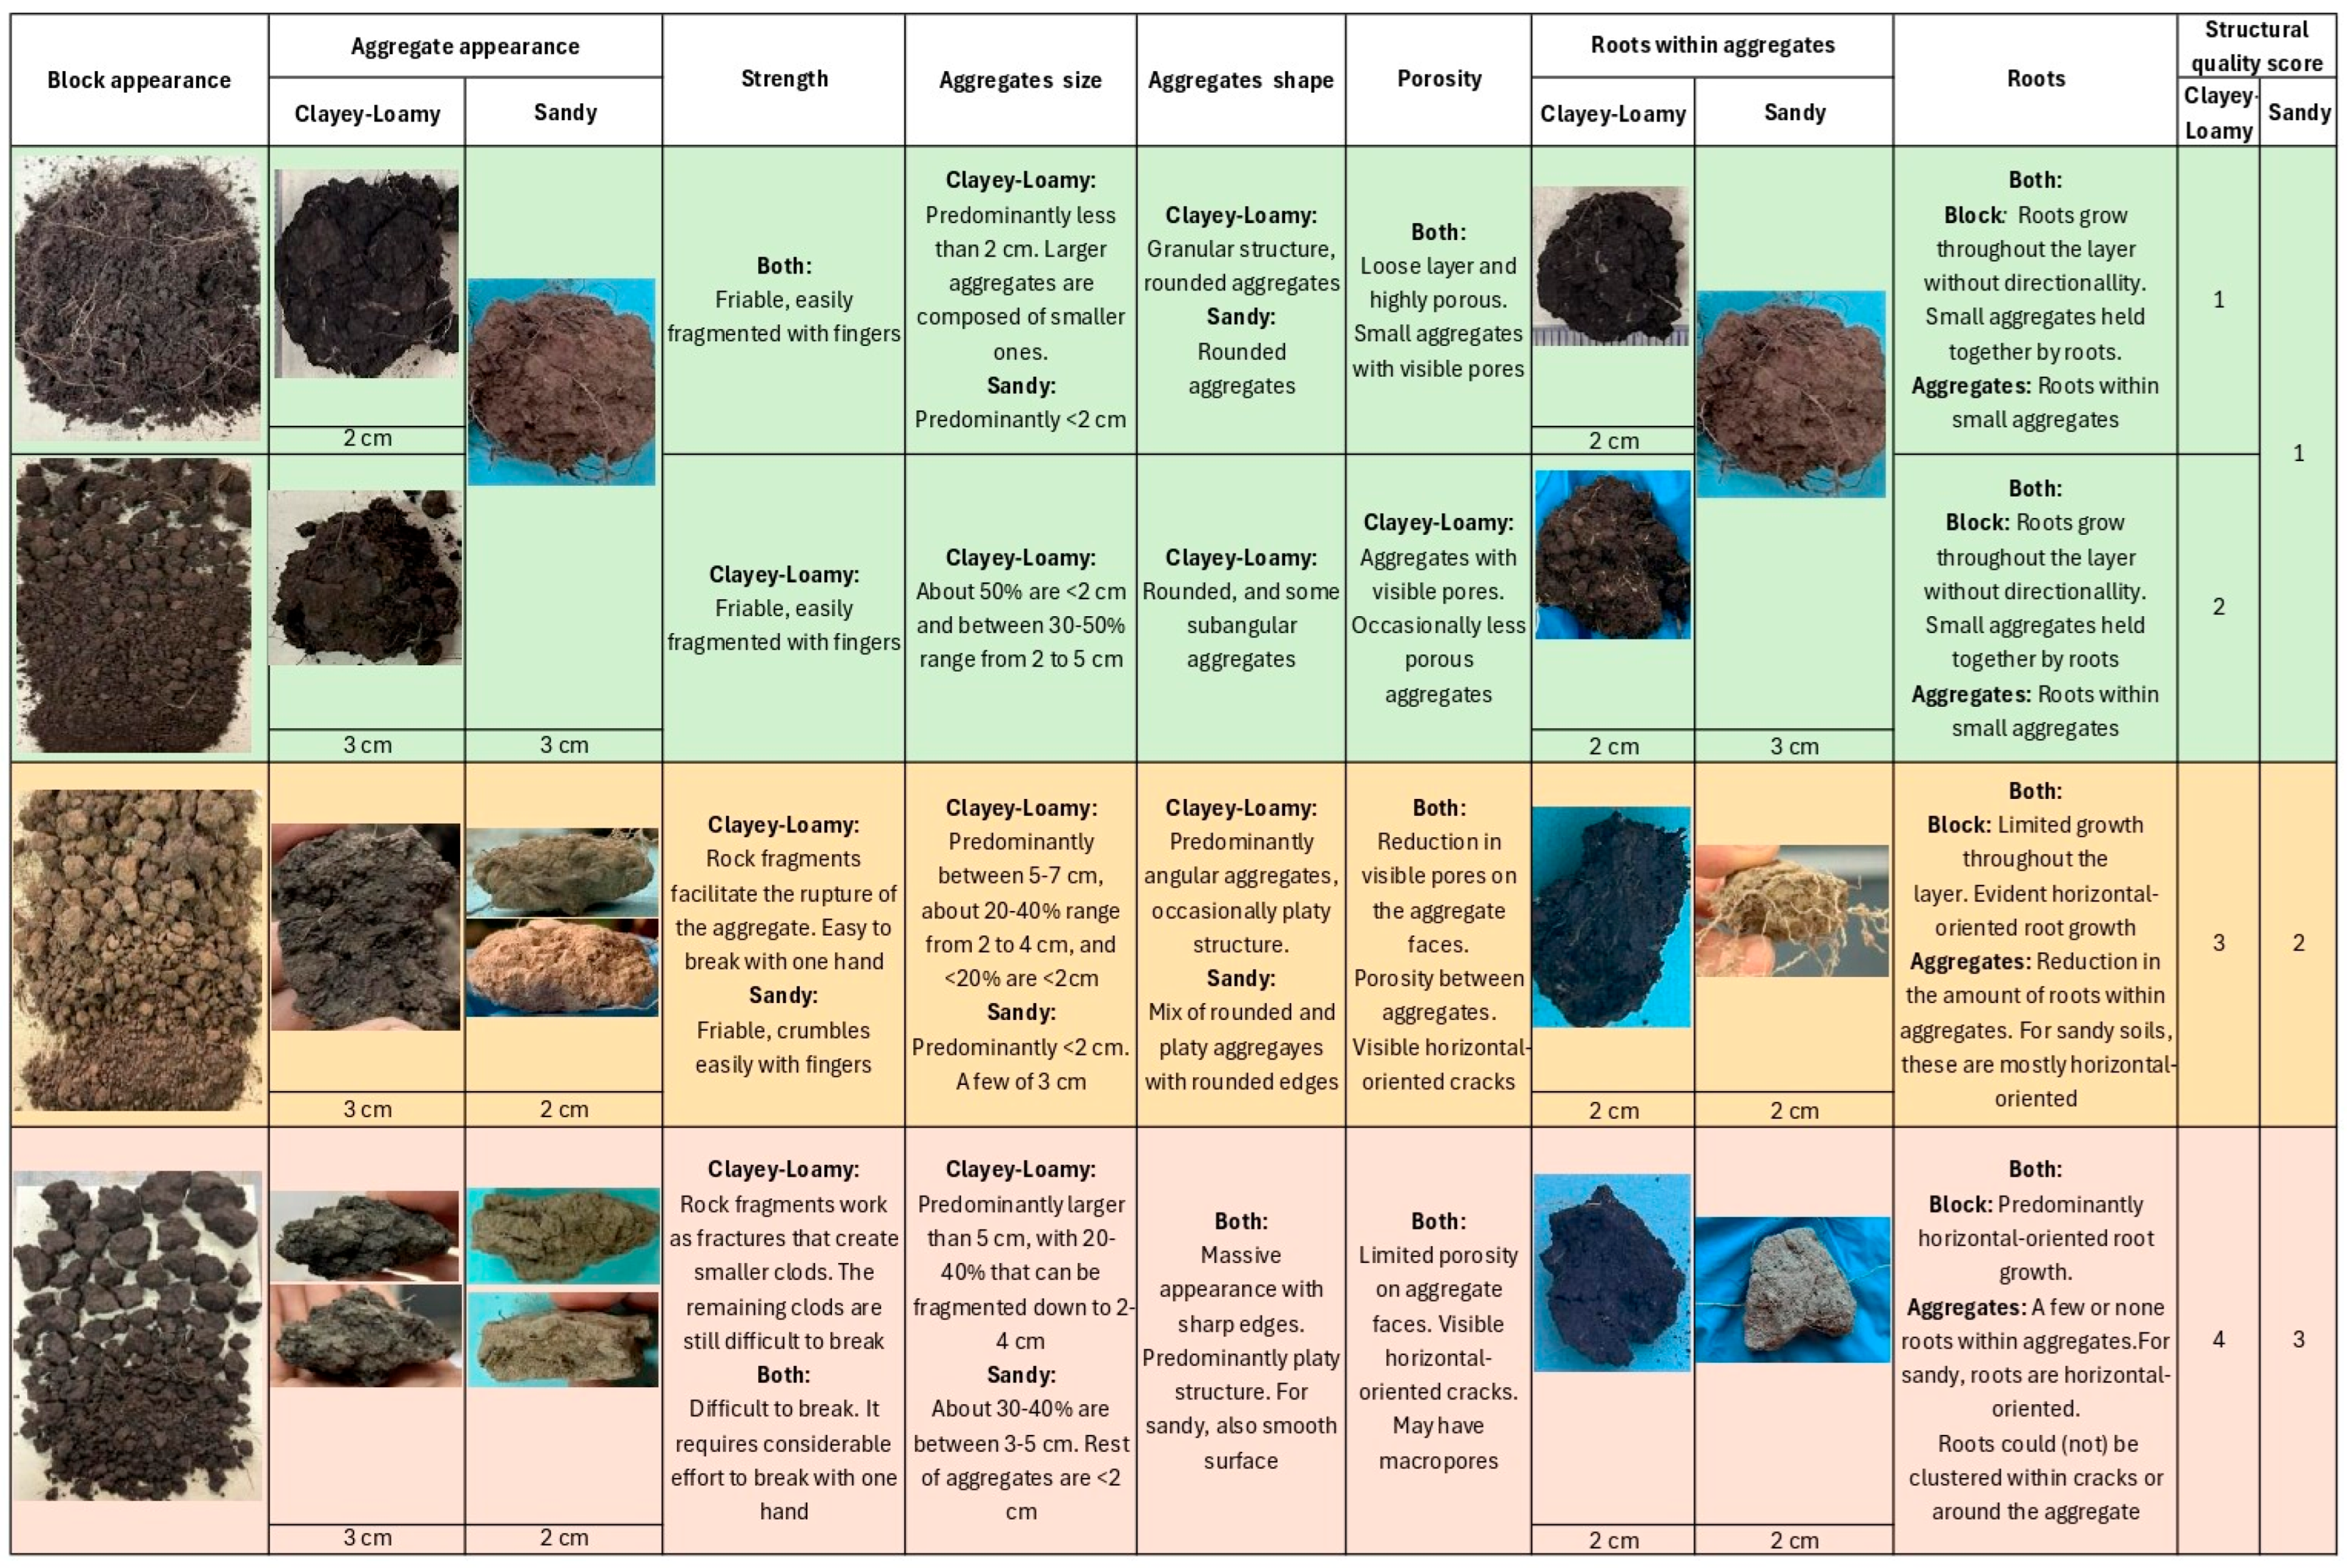
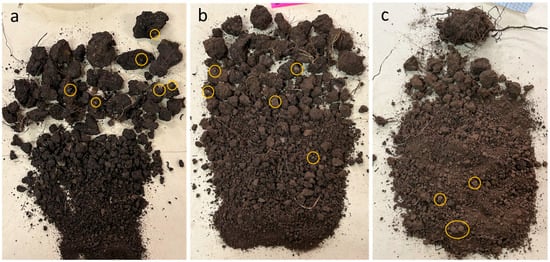
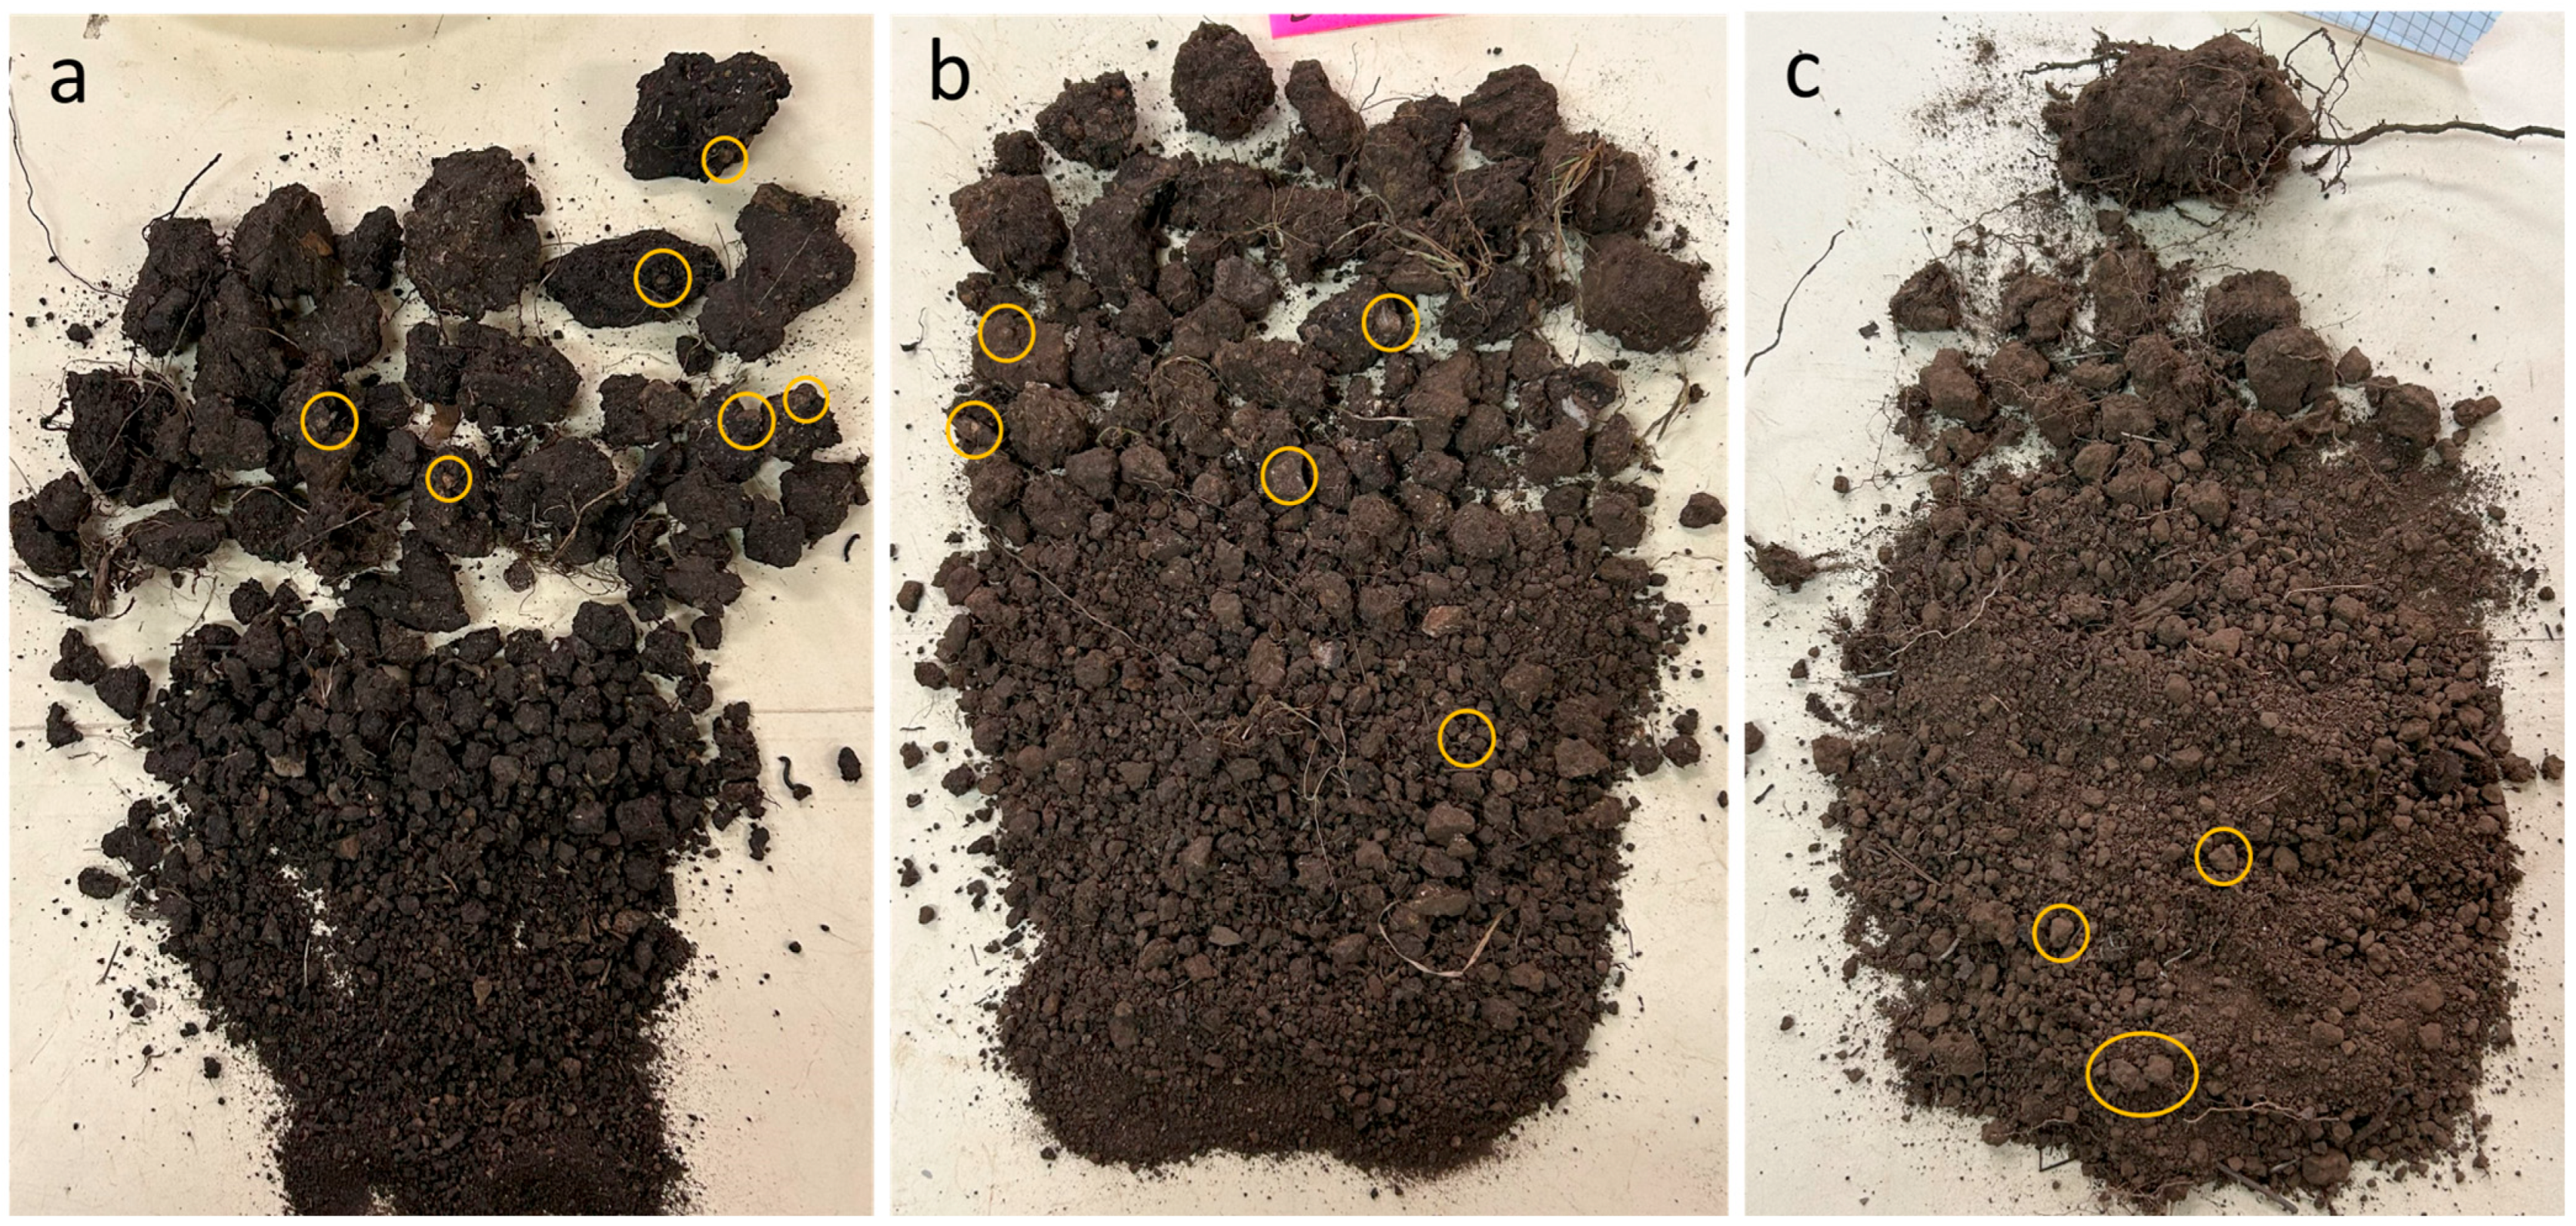
RangelandVESS was developed as a variant of the standard VESS retaining its core criteria for assessing soil block fragmentation, aggregate morphology, ease of break-up, visible porosity, and root presence [20]. In this new variant of VESS method RangelandVESS (Figure 3 and Figure 4), visible porosity, root characteristics, and aggregate strength (resistance to rupture) were evaluated in separate fields, and root growth directionality (horizontal or vertical growth) was additionally recorded. Rock fragments (Figure 5) were incorporated into the two highest quality scores (Sq) to account for their influence on aggregate rupture.
Figure 3.
Rangeland Visual Evaluation of Soil Structure (RangelandVESS) instructions page.
Figure 4.
Rangeland Visual Evaluation of Soil Structure (RangelandVESS) assessment page with description of considered parameters.
Figure 5.
Rock fragments (yellow circles) visible within soil aggregates after breaking the soil blocks. Blocks (a,b) correspond to paddock 3, where AH (Angus × Hereford crossbred) cattle graze, and (c) to paddock 1, where CB (crossbreed of AH and Criollo) cattle graze.
After the second sampling campaign, which captured the soil structural variability of the study area, key visual features were iteratively classified in the laboratory, resulting in a scoring system comprising four Sq classes for clayey–loamy soils and three Sq classes for sandy soils. Subsequently, the scoring system was validated during the September 2024 sampling campaign which also served to compare the three assessment methods. Following standard VESS principles, blocks sharing characteristics between two categories were assigned to intermediate scores.
2.3. Comparison Between Visual Soil Evaluation Methods
The September 2024 sampling campaign was conducted with the purpose of comparing VESS, GrassVESS, and RangelandVESS. The same number of soil blocks as in the first campaign were collected in the exclusion zones and in sites showing visible overgrazing (three and five samples, respectively). The same soil block from each sampling point was used to perform the assessment with the three methods. The evaluations were performed by one operator to reduce variability due to human factors. The rock fragments restriction of the area allowed only for the evaluation of one layer of soil in the three methods. For GrassVESS, the evaluation was based on the lower portion (Sq) score which refers to the soil layer beneath the root mat.
2.4. Statistical Analysis
The non-parametric Spearman correlation coefficient was used to correlate the VESS scores to the measured soil properties. The Kruskal–Wallis and Dunn’s post hoc test with Holm adjustment tests were used to compare the results between the visual soil structure assessment methods according to soil textural types. All the analyses were performed in RStudio 2025.05.1 software.
3. Results
3.1. Description of Soil Structure Assessment
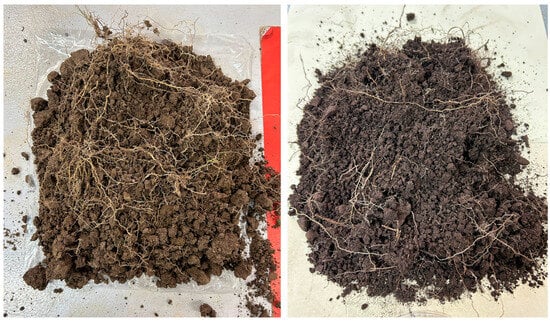
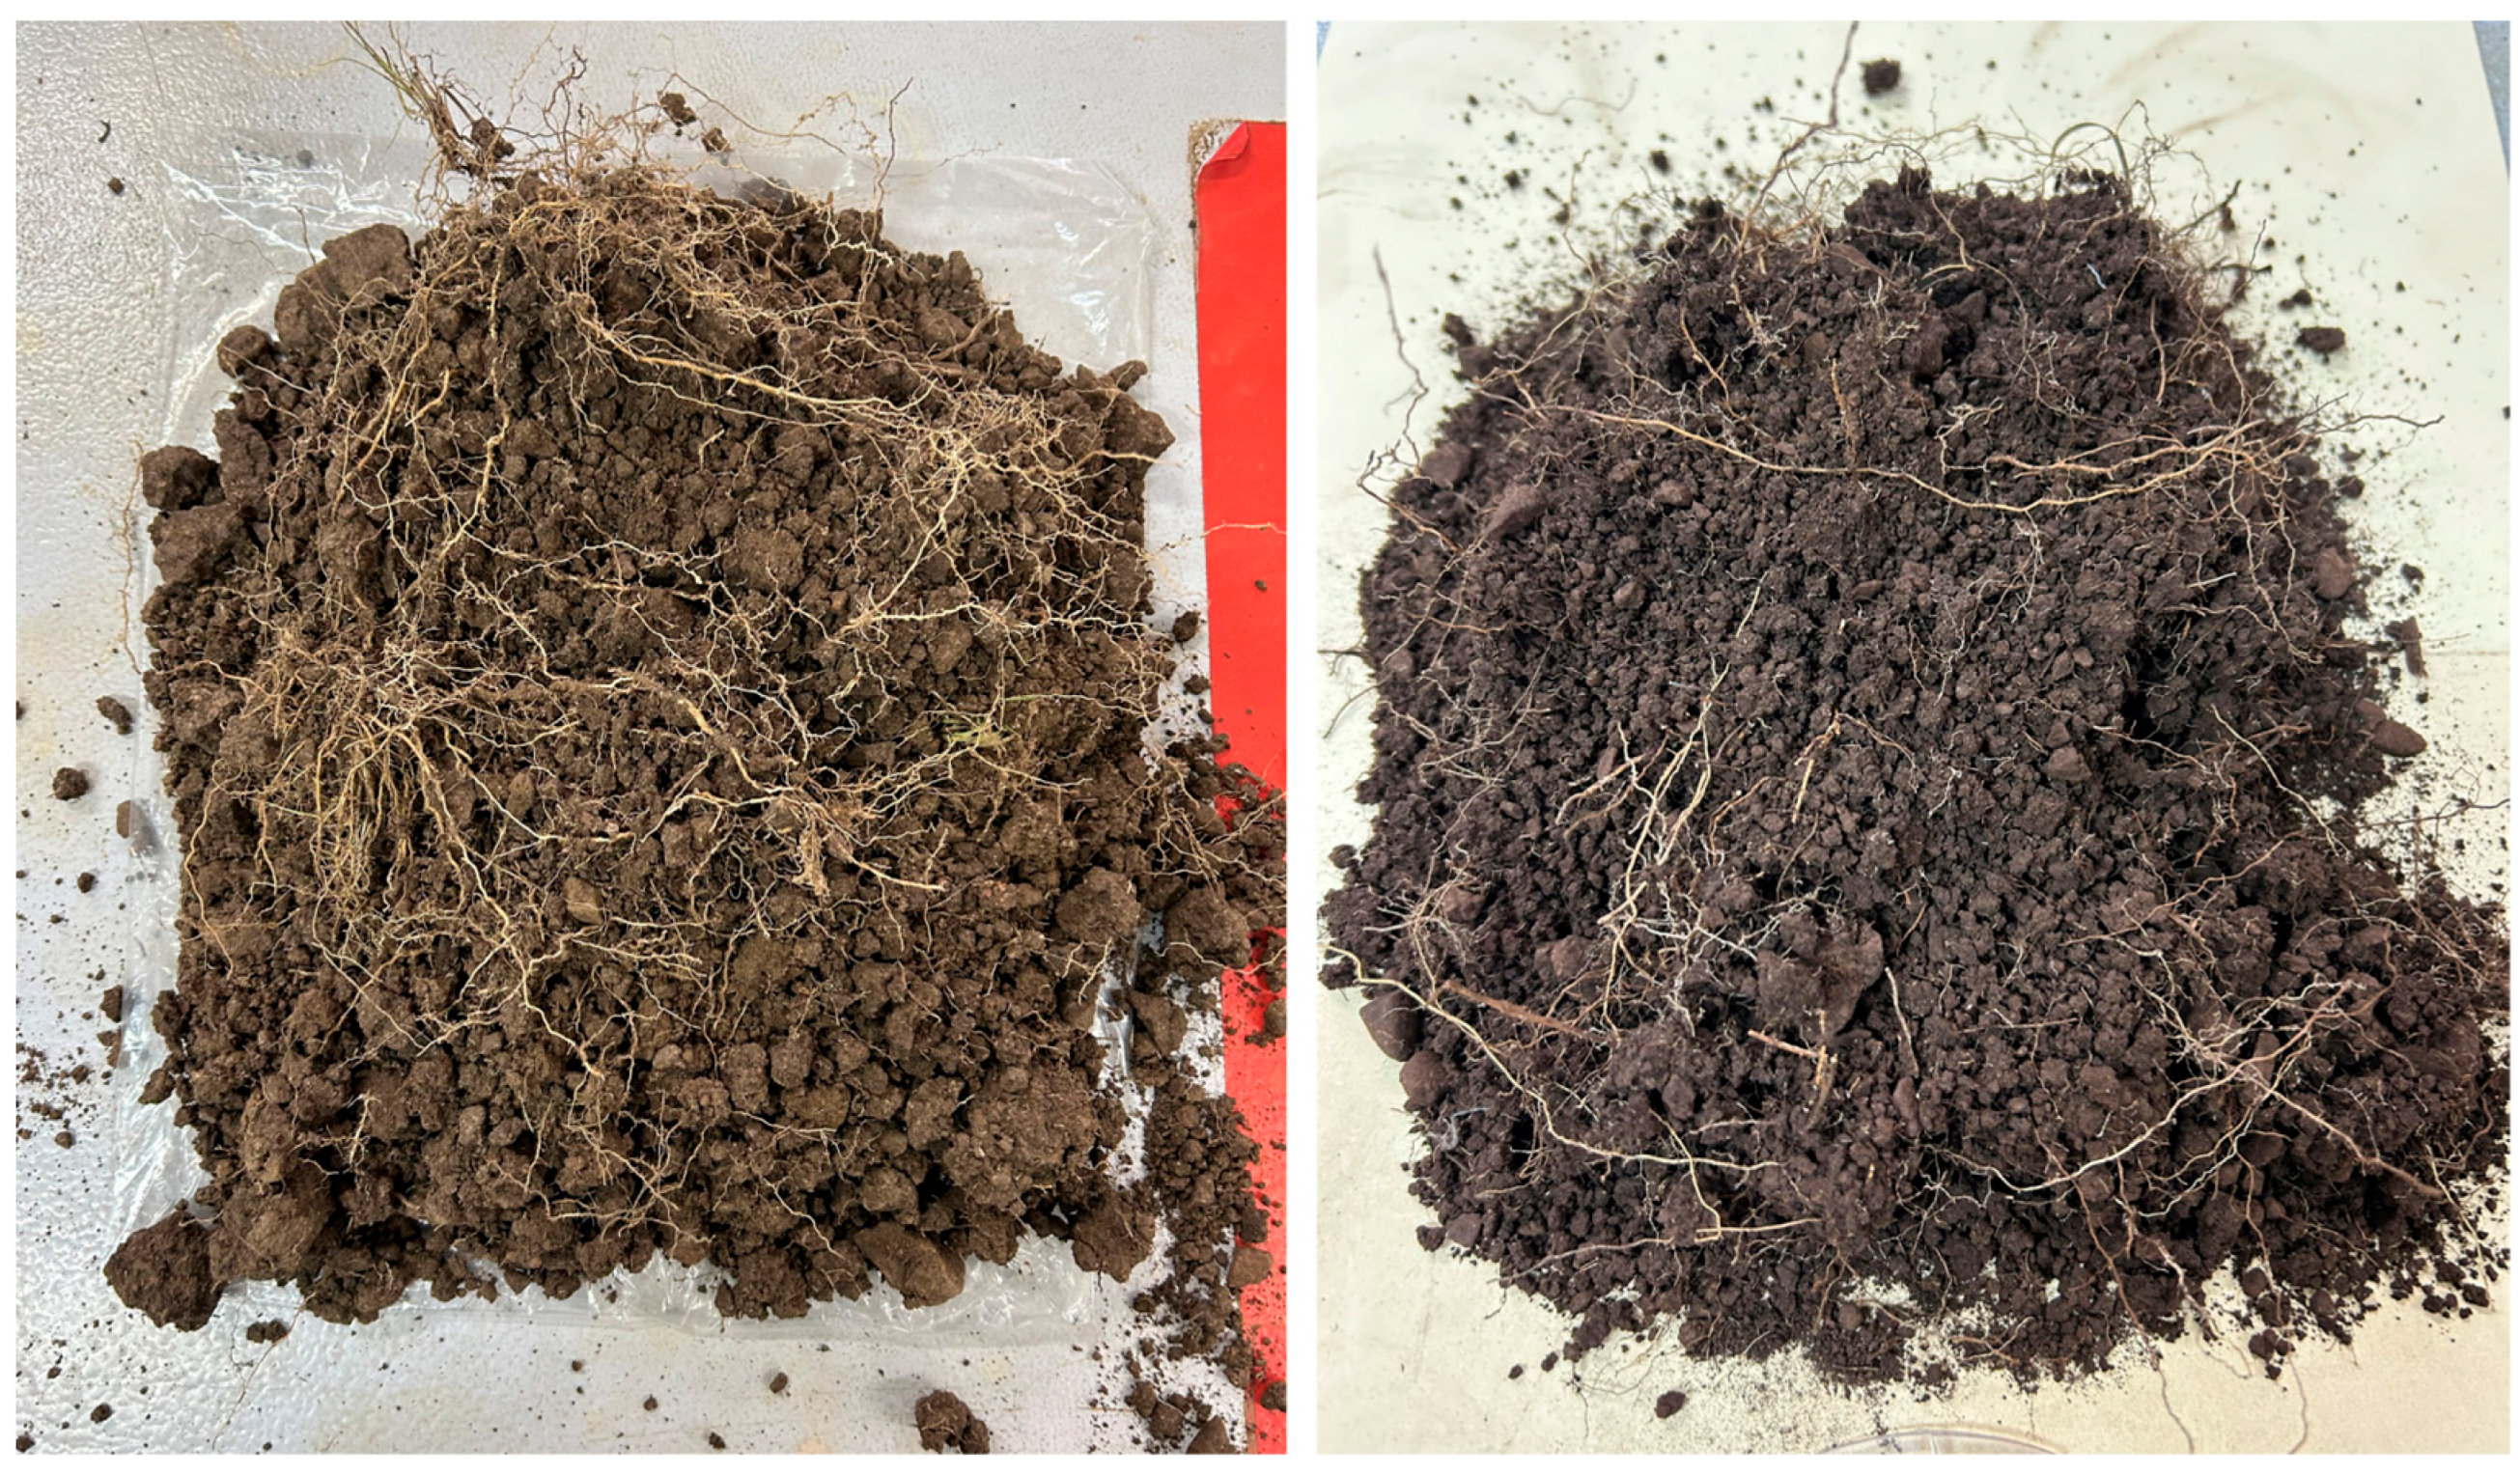
There was a distinction between the different degrees of soil structure quality. Soil blocks from exclusion zones had the highest quality as assessed by the three methods. Exclusion zones in all the paddocks had a granular structure with small and rounded aggregates (Figure 6). The soil blocks in these zones had plant and root materials with AGB ranging from 40 to 100 g.
Figure 6.
Soil blocks from exclusion zones in rangelands showing small and rounded soil aggregates.
Some soil blocks were extracted from areas near water bodies used by cattle. Together with samples from overgrazed zones, these blocks exhibited the poorest Sq and showed platy soil structural deformation (Figure 7), with some roots growing predominantly horizontally. Additionally, aggregates in these areas were often massive, subangular, angular, and with low visible porosity. Similar characteristics were observed in other overgrazed locations. In sandy soils, poorly scored aggregates were smaller, but still massive with sharp edges which restricted root penetration or resulted in few horizontal roots. Rock fragments, characteristic of Leptosol soils, were present in all blocks, and facilitated aggregate rupture with some fragments creating cracks or fractures that enabled root growth.
Figure 7.
Platy soil structure as result of soil degradation due to livestock grazing in rangelands.
3.2. Comparison Between RangelandVESS, GrassVESS, and VESS
Regarding methodological adaptation, all methods incorporated intermediate scores, and a consistent evaluation scale (Sq 1–2 = good, 3 = moderate, and 4 = poor) was applied for RangelandVESS and GrassVESS. An exception was observed in sandy soils under RangelandVESS, where the scale was adjusted to Sq 1–3. To ensure comparability, the scores from GrassVESS and VESS scores (Sq 1 = good to 5 = poor) were harmonized following the classification proposed in [36], where Sq ≤ 2 was classified as good, Sq > 2 to ≤3 as moderate, and >3 as poor.
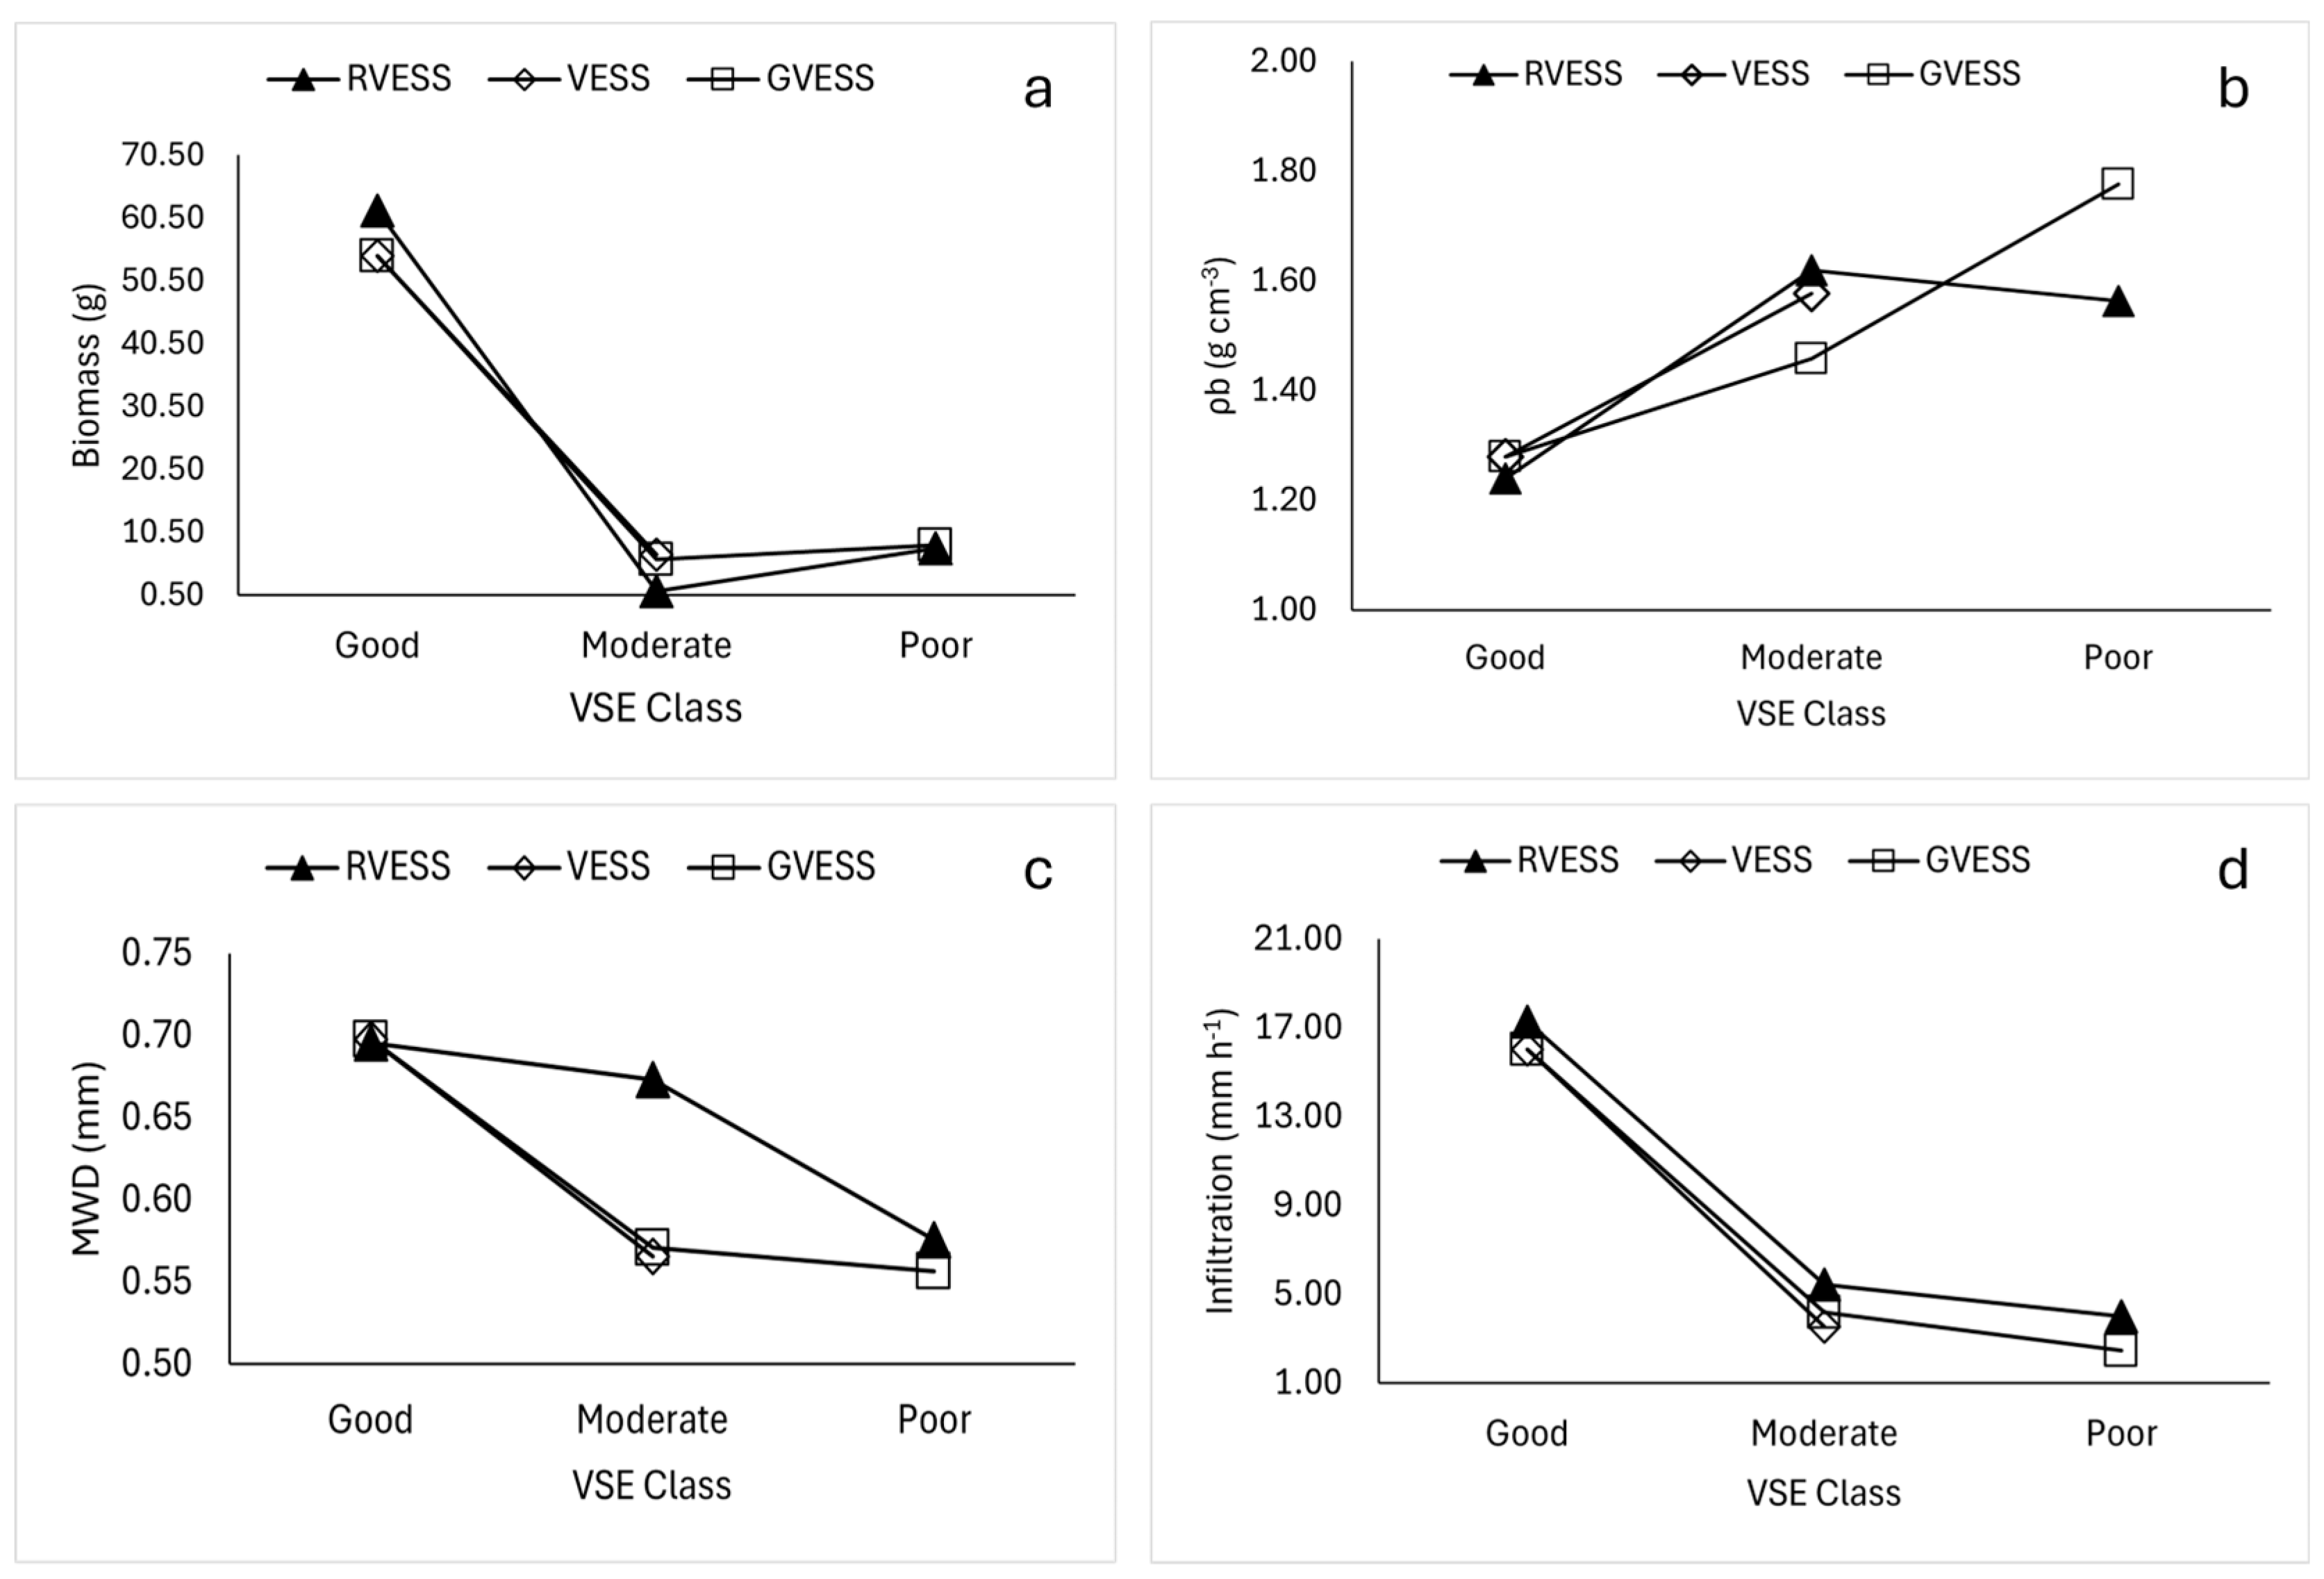
For clayey–loamy soils, no significant differences in Sq’s were detected (χ2 = 0.018, p = 0.99). The non-grazed zones were classified as good (Sq ≤ 2) using the three methods (n = 6). As evaluated by RangelandVESS, overgrazed zones in clayey soils (n = 18) ranged from good to poor (Sq1 to Sq4), demonstrating a decline in soil structural quality. Eight soil blocks from both sampling sites near water bodies and resting areas were classified with poor quality, showing visual signs of platy structure, massive appearance, sharp edges, and being larger than 5 cm but less than 10 cm (Figure 2 and Figure 7). Across paddocks in clayey soils, the evaluations performed with GrassVESS also ranged from Sq1 to Sq4. For GrassVESS, Sq1 scores were found in exclusion zones but also in areas where cattle graze. For the standard VESS, scores ranged from Sq1 to Sq 3, indicating a good to moderate soil structural quality across paddocks in clayey soils. The scores from the methods are in accordance with the arithmetic mean of the quantitative parameters measured across both clayey and sandy soils, that also reflect a decline in soil quality as indicated by lower infiltration, AGB, and MWD, and higher BD (Figure 8a–d).
Figure 8.
Arithmetic mean across soil types of (a) above-ground biomass, (b) bulk density, (c) mean-weigth diameter, and (d) infiltration per method classification.
In the case of sandy soils, significant differences in Sq’s were detected among methods (χ2 = 7.42, p = 0.024). Dunn’s post hoc test with Holm adjustment indicated significant differences only between RangelandVESS and VESS (p = 0.024), whereas GrassVESS did not differ from the other methods (p > 0.05). Six of the soil blocks extracted from sandy soils (n = 12 of the 30 sampling points distributed across the grazing areas) were classified as poor (Sq = 3) using RangelandVESS. In contrast, the VESS method did not classify any block as having poor structure; thus, structural quality assessed with VESS was limited to good (Sq1) and moderate (Sq2). Ten of the twelve blocks received higher Sq scores, indicating greater soil structural degradation, when evaluated with RangelandVESS compared to VESS. Although no significant differences were found with GrassVESS, eight of the twelve blocks had lower Sq compared to RangelandVESS. This means that RangelandVESS reported poorer structural quality in sandy soils. GrassVESS predominantly indicated moderate soil structural quality, with only one block classified as poor (Sq3). This block recorded an Sq value of 2.5 using VESS, which could be interpreted as moderate or poor, and Sq3 using RangelandVESS. Only one soil block presented a good structural quality as assessed with the three methods. Based on the 12 sandy soil samples evaluated, the results suggest that RangelandVESS is more sensitive than the other two methods to the structural degradation of sandy soils in the study area. Nevertheless, further evaluations in other sandy rangeland soils are required to determine whether this pattern is consistent.
3.3. Relation Between Visual Evaluation of Soil Structure and Other Soil Parameters
RangelandVESS was significantly correlated with VESS (rs = 0.62) and GrassVESS (rs = 0.76). Even though RangelandVESS and GrassVESS share the same Sq score range for clayey soils, VESS showed a stronger correlation with GrassVESS (rs = 0.84). These two methods assigned the same score to 13 of the 18 clayey soil blocks. This similarity may stem from the way GrassVESS and VESS classify aggregates based on size, whereas RangelandVESS applies stricter criteria, meaning that smaller aggregates are more likely to be classified as having poor structural quality. RangelandVESS had significant correlations with key soil and vegetation indicators (Table 1). BD had a positive correlation (rs = 0.56), indicating that higher Sq scores, reflecting poorer soil structure, were associated with denser soils. Negative correlations occurred with MWD (rs = −0.35), infiltration (rs = −0.72), and AGB which had the strongest negative correlation (rs = −0.77). This means that as Sq increased, there was poorer soil structural quality, a decrease in aggregate stability, soil permeability, and restricted vegetation growth. VESS and GrassVESS were significantly correlated with the same properties except for MWD, but the correlations were weaker except for infiltration and GrassVESS (rs = −0.73). Among soil indicators, BD had significant negative correlations with infiltration (rs = −0.38), and AGB (rs = −0.63). Infiltration showed a positive correlation with AGB (rs = 0.62).
Table 1.
Correlation matrix (Spearman ρ) of soil properties and visual soil assessment methods (n = 36).
4. Discussion
4.1. Conceptual Basis for the RangelandVESS Method
The VESS method was chosen in this study because it has been widely applied across different soil types and climates, and it shows strong relationships with both laboratory measurements and other field-based soil parameters [21,22,23]. In rangeland ecosystems such as grasslands, visual soil structure assessment methods have helped assess structural quality. For instance, Cui et al. (2014) [25] successfully evaluated grassland productivity in Ireland using VESS, while Tuchtenhagen et al. (2018) [46] used VESS to assess a native grassland in Pampa, Brazil, under a humid subtropical climate. To better capture grasslands nature, Emmet-Booth et al. (2018) [26] adapted VESS and developed GrassVESS but as specified, it is for temperate maritime managed grasslands and has not been tested in semi-arid regions. Under these climate conditions, low soil water content can increase soil strength by enhancing cohesion and the angle of internal friction [47,48]. This increase may limit the formation of large aggregates such as those described in VESS. The soil aggregates from our blocks were smaller than those reported on VESS for the higher Sq’s. The largest found were ≤7 cm (Sq4) and came from sites close to water bodies, while those in VESS can be >10 cm for Sq4 and 5 [20] and GrassVESS describes aggregates > 7 cm [26]. The differences in aggregate size might be related to the water limitation, and its relationship with soil strength, in semi-arid areas in comparison to temperate grasslands and croplands. Hence, this aspect was documented in RangelandVESS as part of the description of the Sq’s and as new visual aids.
Another consideration for method adaptation is the difference in stresses exerted on soil by cattle compared to agricultural machinery. Cattle have been reported to exert static pressures of 144 kPa [49], 160, and 192 kPa [12] and up to 200 kPa in simulated walking [14], although, this pressure may be underestimated and may increase two- to four-fold when walking [12,15,50]. This increase occurs because, during movement, the animal’s weight is distributed over fewer hooves while additional kinetic energy is applied [12,16]. In agricultural fields, machinery has been reported to exert vertical stress up to 360 kPa depending on wheel load, tire inflation pressure, depth, soil texture, and moisture conditions [51]. Additionally, in agricultural settings, the number of passes increases soil compaction [52]. While animals have random movements, cattle tend to create overgrazed zones, which could mimic the effect of repeated passes. However, the results of this study indicate that structural degradation, reflected in larger aggregates and higher BD, in highly overgrazed zones is less pronounced than that reported in agricultural fields [22]. Moreover, in Chihuahua, heritage Criollo cattle, lighter in weight than commercial breeds such as Angus and Hereford cattle, are widely used. This breed has been reported to explore larger areas, maintain a more diverse diet, and adjust its movement according to forage availability [40,53]. Although this study did not explore differences in soil structural quality among breeds, Criollo cattle are thought to exert less stress on the soil and generate fewer overgrazed areas due to their foraging behavior [54]. Hence, this may also be better reflected in the RangelandVESS assessment criteria.
Additionally, the soil stress caused by cattle trampling may also influence the development of platy structure due to shear stress [10]. While the cow exerts a normal or vertical force, the hooves, which have a contact area with the soil creating a frictional force, apply a force acting parallel to a plane (the soil), which causes sliding as the resistive force from the soil is exceeded [55,56,57]. This shear stress has also been reported to alter the directionality (horizontal) of saturated hydraulic conductivity [58]. Site observations revealed predominance of platy soil structure, particularly in areas close to water bodies, where livestock congregation and trampling are more intense. Thus, this feature was included in the description of the Sq’s. RangelandVESS assigns greater relevance to this type of structural deformation, as it is identified from Sq3 onward, in contrast to GrassVESS, which includes this feature at Sq4, and VESS, where it also accounted for at Sq4. Another novel aspect of RangelandVESS is the inclusion of root directionality. In both clay and sandy soils, a predominance of horizontal roots was observed likely due to the platy structure. Munkholm et al. (2015) [59] reported similar horizontal root growth in compacted sandy soils, supporting the patterns identified using RangelandVESS. This feature can be influenced by the aggregate shape, especially if there is a predominance of platy structure.
4.2. Relationship with Quantitative Indicators
The significant correlations between the studied soil indicators (BD, MWD, and infiltration) and RangelandVESS, indicate the suitability of the method to assess soil structure quality. For AGB, the strongest correlation was with RangelandVESS (rs = −0.76). This relationship indicates consistency with the scoring, as a lower Sq corresponds to better structure and therefore, more AGB. This was also supported by BD and infiltration measurements, as zones where blocks exhibited a higher degree of soil compaction showed restricted AGB, with values as low as 0.50 g (Figure 8a). Likewise, the positive correlation between RangelandVESS and BD is consistent with previous studies, as BD is often reported to be highly correlated with visual soil evaluation (VSE) methods [60,61,62]. These correlations highlight the role of soil structure in the productivity of rangeland ecosystems and the importance of visual methods as a reliable tool for monitoring.
4.3. Comparing RangelandVESS, VESS, and GrassVESS
RangelandVESS has different assessment descriptions and visual aids, however, no significant differences were found among methods for clayey–loamy soils. This was expected for the first two Sq representing good structural conditions as no big differences in aggregate size and shape are expected. Another reason is that shared features among methods remain. Characteristics such as ease of breakage and the presence of subangular and angular aggregates may lead to similar results across methods. Nonetheless, presenting mixed evidence across VESS scores may confuse operators when assigning a score, as they are required to integrate characteristics spanning Sq3 to Sq5. Moreover, when assessing soil structure using RangelandVESS, the scoring ranges Sq3 to Sq4 for clayey soils and Sq1 to Sq3 for sandy soils, can facilitate evaluation, as the indicator descriptions are more coherently integrated. Hence, we encourage the local application of RangelandVESS, as it incorporates site-specific characteristics making interpretation more straightforward. However, we acknowledge that increasing the reliability and reproducibility of the method would require evaluations by a greater number of operators. This would allow for a more robust validation of the method and could also be achieved by assessing a larger number of soil blocks when the same area is evaluated by different operators [63]. Additionally, the method must be sufficiently clear and self-explanatory to enable operators to apply it consistently and obtain comparable results. To further support consistency, future users should receive adequate training and gain practical experience in applying the method [30,64]. Thereafter, the method could be tested to discriminate among rangeland management practices and serve as a tool to support decision-making. Furthermore, RangelandVESS classified the samples as having good, moderate, and poor quality while VESS only indicated good and moderate qualities. GrassVESS identified three blocks as having poor soil structure versus eight from RangelandVESS. Based on this, the assessments with VESS and GrassVESS seem to underestimate soil structural degradation. This is supported by the stronger correlation of RangelandVESS with BD reflecting a closer alignment with its assessment criteria which restricts smaller aggregates to higher Sq scores indicating a poorer structural quality. Additionally, this is consistent with the low AGB values (2.30–17.8 g) observed in blocks with higher BD and Sq4 scores as assessed with RangelandVESS.
For sandy soils, differences among soil blocks assessed with RangelandVESS and VESS were statistically significant. This was reflected in the RangelandVESS results, which classified seven of the 12 blocks as Sq3. In contrast, VESS classified only one block as Sq2.5, while GrassVESS classified one block as Sq3. We attribute this mainly to variations in aggregate size and shape, as RangelandVESS applies stricter criteria to these soils. For instance, in Sq3, the largest aggregates are slightly larger than 5 cm and are predominantly massive and have a platy structure. Blocks with aggregates that met these criteria also exhibited low AGB quantities and higher BD. When using VESS, aggregate size may lead the user to assign a lower score, such as Sq2 or Sq3, which include aggregates ranging from 2 mm to 10 cm, indicating better structural quality. Thus, when conducting assessments with VESS in semi-arid rangelands, soil structural degradation may be underestimated.
5. Conclusions
RangelandVESS seems to successfully capture soil structural conditions in semi-arid rangelands under livestock grazing. Its assessment criteria, especially the size of aggregates, may allow for a more accurate classification of soil blocks, particularly those exhibiting poorer structural quality. This is supported by the stronger correlation with key soil parameters. Nevertheless, further validation is needed, including assessments by multiple operators and the application of agreement analyses, to rigorously evaluate the reproducibility and reliability of the method. Additionally, future studies should test its ability to discriminate among different rangeland management practices. Although no significant differences were found among RangelandVESS, VESS, and GrassVESS in clayey–loamy soils, further studies are encouraged, particularly in drier parts of the region where water scarcity may further restrict aggregate size. The Chihuahuan Desert, which supports high levels of livestock production but also exhibits a high degree of soil degradation, represents a priority area for promoting the method. Other areas where the applicability of RangelandVESS should be tested include those where Criollo cattle exclusively graze. The combined influence of lighter Criollo cattle and arid conditions may better correlate with the soil structural characteristics captured by RangelandVESS. The observed differences in aggregate size may be influenced by soil water content in semi-arid regions. These climatic factors, together with land-use type, highlight the need for methodological adaptation. Therefore, visual evaluations should not be considered universal, as their applicability may depend on climate and land use.
Author Contributions
Conceptualization, P.F.M.-L. and A.P.-A.; methodology, P.F.M.-L., M.P.-M. and C.R.M.-N.; software, M.M.-S. and G.N.A.-P.; validation, J.A.P.-A. and A.P.-A.; investigation C.R.M.-N., A.P.-A. and P.F.M.-L.; writing—original draft preparation, P.F.M.-L. and G.V.-Q.; writing—review and editing, A.P.-A. and M.P.-M. All authors have read and agreed to the published version of the manuscript.
Funding
This research received no external funding.
Data Availability Statement
The original contributions presented in the study are included in the article. Further inquiries can be directed at the corresponding author.
Acknowledgments
We sincerely thank the Secretaría de Ciencia, Humanidades, Tecnología e Innovación (SECIHTI) for the scholarship provided to the first author of this manuscript to pursue her PhD program.
Conflicts of Interest
The authors declare no conflicts of interest.
Abbreviations
The following abbreviations are used in this manuscript:
| VESS | Visual Evaluation of Soil Structure |
| IIRH | Interpreting Indicators of Rangeland Health |
| UACh | Autonomous University of Chihuahua |
| WRB | World Reference Base |
| AH | Angus × Hereford |
| CR | Criollo |
| CB | Crossbreed |
| BD | Bulk Density |
| MWD | Mean Weight Diameter |
| AGB | Above-Ground Biomass |
References
- Secretariat of the Convention to Combat Desertification. Global Land Outlook: Thematic Report on Rangelands and Pastoralists; United Nations Convention to Combat Desertification: Bonn, Germany, 2024. [Google Scholar]
- Briske, D.D.; Coppock, D.L. Rangeland stewardship envisioned through a planetary lens. Trends Ecol. Evol. 2023, 38, 109–112. [Google Scholar] [CrossRef] [Scilit] [PubMed]
- Brown, J.R.; Herrick, J.E. Making soil health a part of rangeland management. J. Soil Water Conserv. 2016, 71, 55–60. [Google Scholar] [CrossRef] [Scilit]
- Maher, A.T.; Prendeville, H.R.; Halofsky, J.E.; Rowland, M.M.; Davies, K.W.; Boyd, C.S. Climate Change Vulnerabilities and Adaptation Strategies for Land Managers on Northwest US Rangelands. Rangel. Ecol. Manag. 2025, 98, 399–413. [Google Scholar] [CrossRef] [Scilit]
- Williams, S.E. A Review and Analysis of Rangeland and Wildland Soil Health. Sustainability 2024, 16, 2867. [Google Scholar] [CrossRef] [Scilit]
- Briske, D.D. (Ed.) Rangeland Systems: Foundation for a Conceptual Framework. In Rangeland Systems; Springer International Publishing: Cham, Switzerland, 2017; pp. 1–21. [Google Scholar] [CrossRef] [Scilit]
- Angerer, J.P.; Fox, W.E.; Wolfe, J.E.; Tolleson, D.R.; Owen, T. Land degradation in rangeland ecosystems. In Biological and Environmental Hazards, Risks, and Disasters, 2nd ed.; Sivanpillai, R., Ed.; Elsevier: Amsterdam, The Netherlands, 2023; pp. 395–434. [Google Scholar]
- Zhang, M.; Sun, J.; Wang, Y.; Li, Y.; Duo, J. State-of-the-art and challenges in global grassland degradation studies. Geogr. Sustain. 2025, 6, 100229. [Google Scholar] [CrossRef] [Scilit]
- Houlbrooke, D.; Drewry, J.; Hu, W.; Laurenson, S.; Carrick, S. Soil structure: Its importance to resilient pastures in New Zealand (review). NZGA Res. Pract. Ser. 2021, 17, 201–212. [Google Scholar] [CrossRef] [Scilit]
- Pietola, L.; Horn, R.; Yli-Halla, M. Effects of trampling by cattle on the hydraulic and mechanical properties of soil. Soil Tillage Res. 2005, 82, 99–108. [Google Scholar] [CrossRef] [Scilit]
- Roesch, A.; Weisskopf, P.; Oberholzer, H.; Valsangiacomo, A.; Nemecek, T. An Approach for Describing the Effects of Grazing on Soil Quality in Life-Cycle Assessment. Sustainability 2019, 11, 4870. [Google Scholar] [CrossRef] [Scilit]
- Willatt, S.; Pullar, D. Changes in soil physical properties under grazed pastures. Soil Res. 1984, 22, 343. [Google Scholar] [CrossRef] [Scilit]
- Donovan, M.; Monaghan, R. Impacts of grazing on ground cover, soil physical properties and soil loss via surface erosion: A novel geospatial modelling approach. J. Environ. Manag. 2021, 287, 112206. [Google Scholar] [CrossRef] [Scilit] [PubMed]
- Drewry, J.J.; Cameron, K.C.; Buchan, G.D. Pasture yield and soil physical property responses to soil compaction from treading and grazing—A review. Soil Res. 2008, 46, 237. [Google Scholar] [CrossRef] [Scilit]
- Zhang, B.; Beck, R.; Pan, Q.; Zhao, M.; Hao, X. Soil physical and chemical properties in response to long-term cattle grazing on sloped rough fescue grassland in the foothills of the Rocky Mountains, Alberta. Geoderma 2019, 346, 75–83. [Google Scholar] [CrossRef] [Scilit]
- Serrano, J.; Marques, J.; Shahidian, S.; Carreira, E.; Marques da Silva, J.; Paixão, L.; Paniagua, L.L.; Moral, F.; Ferraz de Oliveira, I.; Sales-Baptista, E. Sensing and Mapping the Effects of Cow Trampling on the Soil Compaction of the Montado Mediterranean Ecosystem. Sensors 2023, 23, 888. [Google Scholar] [CrossRef] [Scilit] [PubMed]
- Karlen, D.L.; Veum, K.S.; Sudduth, K.A.; Obrycki, J.F.; Nunes, M.R. Soil health assessment: Past accomplishments, current activities, and future opportunities. Soil Tillage Res. 2019, 195, 104365. [Google Scholar] [CrossRef] [Scilit]
- Rabot, E.; Wiesmeier, M.; Schlüter, S.; Vogel, H.J. Soil structure as an indicator of soil functions: A review. Geoderma 2018, 314, 122–137. [Google Scholar] [CrossRef] [Scilit]
- Pulido-Moncada, M.; Ball, B.C.; Cornelis, W.M. Advances in Visual Soil Evaluation Techniques; Burleigh Dodds Science Publishing: Cambridge, UK, 2021; pp. 71–110. [Google Scholar] [CrossRef] [Scilit]
- Guimarães, R.M.L.; Ball, B.C.; Tormena, C.A. Improvements in the visual evaluation of soil structure. Soil Use Manag. 2011, 27, 395–403. [Google Scholar] [CrossRef] [Scilit]
- Mueller, L.; Kay, B.D.; Hu, C.; Li, Y.; Schindler, U.; Behrendt, A.; Shepherd, T.G.; Ball, B.C. Visual assessment of soil structure: Evaluation of methodologies on sites in Canada, China and Germany. Soil Tillage Res. 2009, 103, 178–187. [Google Scholar] [CrossRef] [Scilit]
- Guimarães, R.M.L.; Ball, B.C.; Tormena, C.A.; Giarola, N.F.B.; da Silva, Á.P. Relating visual evaluation of soil structure to other physical properties in soils of contrasting texture and management. Soil Tillage Res. 2013, 127, 92–99. [Google Scholar] [CrossRef] [Scilit]
- Moncada, M.P.; Gabriels, D.; Lobo, D.; Rey, J.C.; Cornelis, W.M. Visual field assessment of soil structural quality in tropical soils. Soil Tillage Res. 2014, 139, 8–18. [Google Scholar] [CrossRef] [Scilit]
- Moncada, M.P.; Penning, L.H.; Timm, L.C.; Gabriels, D.; Cornelis, W.M. Visual examinations and soil physical and hydraulic properties for assessing soil structural quality of soils with contrasting textures and land uses. Soil Tillage Res. 2014, 140, 20–28. [Google Scholar] [CrossRef] [Scilit]
- Cui, J.; Askari, M.S.; Holden, N.M. Visual Evaluation of Soil Structure Under Grassland management. Soil Use Manag. 2014, 30, 129–138. [Google Scholar] [CrossRef] [Scilit]
- Emmet-Booth, J.P.; Bondi, G.; Fenton, O.; Forristal, P.D.; Jeuken, E.; Creamer, R.E.; Holden, N.M. GrassVESS: A modification of the visual evaluation of soil structure method for grasslands. Soil Use Manag. 2018, 34, 37–47. [Google Scholar] [CrossRef] [Scilit]
- Pulido, M.; Schnabel, S.; Contador, J.F.L.; Lozano-Parra, J.; Gómez-Gutiérrez, Á. Selecting Indicators for assessing soil quality and degradation in rangelands of Extremadura (SW Spain). Ecol. Indic. 2017, 74, 49–61. [Google Scholar] [CrossRef] [Scilit]
- Pulido, M.; Schnabel, S.; Lavado Contador, J.F.; Lozano-Parra, J.; González, F. The Impact of Heavy Grazing on Soil Quality and Pasture Production in Rangelands of SW Spain. Land Degrad. Dev. 2018, 29, 219–230. [Google Scholar] [CrossRef] [Scilit]
- Pellant, M.; Shaver, P.; Pyke, D.; Herrick, J.; Lepak, N.; Riegel, G.; Kachergis, E.; Newingham, B.; Toledo, D.; Busby, F. Interpreting Indicators of Rangeland Health, Version 5; Tech Ref 1734-6; Bureau of Land Management: Washington, DC, USA, 2020.
- Guimarães, R.M.L.; Lamandé, M.; Munkholm, L.J.; Ball, B.C.; Keller, T. Opportunities and future directions for visual soil evaluation methods in soil structure research. Soil Tillage Res. 2017, 173, 104–113. [Google Scholar] [CrossRef] [Scilit]
- Emmet-Booth, J.P.; Forristal, P.D.; Fenton, O.; Ball, B.C.; Holden, N.M. A review of visual soil evaluation techniques for soil structure. Soil Use Manag. 2016, 32, 623–634. [Google Scholar] [CrossRef] [Scilit]
- Liebig, M.A.; Friedrichsen, C.N.; Clemensen, A.K.; Archer, D.W. Application of visual soil evaluations in a semiarid region. Geoderma 2025, 462, 117509. [Google Scholar] [CrossRef] [Scilit]
- Franco, H.H.S.; Guimarães, R.M.L.; Tormena, C.A.; Cherubin, M.R.; Favilla, H.S. Global applications of the Visual Evaluation of Soil Structure method: A systematic review and meta-analysis. Soil Tillage Res. 2019, 190, 61–69. [Google Scholar] [CrossRef] [Scilit]
- Pulido Moncada, M.; Helwig Penning, L.; Timm, L.C.; Gabriels, D.; Cornelis, W.M. Visual examination of changes in soil structural quality due to land use. Soil Tillage Res. 2017, 173, 83–91. [Google Scholar] [CrossRef] [Scilit]
- García, E. Modificaciones Al Sistema de Clasificación Climática de Köppen (Para Adaptarlo a Las Condiciones de La República Mexicana); Instituto de Geografía-UNAM: Mexico City, Mexico, 2004. [Google Scholar]
- Rascón-Ramos, A.E. Comportamiento Hidrológico de un Bosque Semi-Seco Bajo Diferentes Intensidades de Aclareo en Chihuahua, México. Ph.D. Thesis, Facultad de Zootecnia y Ecología, Universidad Autónoma de Chihuahua, Chihuahua, Mexico, 2021. [Google Scholar]
- Trevizo, A. Caracterización del Componente Natural del Rancho Experimental Teseachi Como Insumo para su Ordenamiento Ecológico Territorial. Master’s Thesis, Facultad de Zootecnia y Ecología, Universidad Autónoma de Chihuahua, Chihuahua, Mexico, 2016. [Google Scholar]
- INEGI. Aspectos Geográficos Chihuahua. Available online: www.inegi.org.mx (accessed on 15 July 2025).
- INEGI. Edafología. Available online: https://www.inegi.org.mx/temas/edafologia/ (accessed on 3 September 2023).
- Cibils, A.F.; Estell, R.E.; Spiegal, S.; Nyamuryekung’e, S.; McIntosh, M.M.; Duni, D.M.; Conegliano, O.A.H.; Almeida, F.A.R.; Estrada, O.R.; Blanco, L.J.; et al. Adapting to climate change on desert rangelands: A multi-site comparison of grazing behavior plasticity of heritage and improved beef cattle. J. Arid Environ. 2023, 209, 104886. [Google Scholar] [CrossRef] [Scilit]
- Nyamasoka-Magonziwa, B.; Vanek, S.J.; Ojiem, J.O.; Fonte, S.J. A soil tool kit to evaluate soil properties and monitor soil health changes in smallholder farming contexts. Geoderma 2020, 376, 114539. [Google Scholar] [CrossRef] [Scilit]
- Elliott, E.T. Aggregate Structure and Carbon, Nitrogen, and Phosphorus in Native and Cultivated Soils. Soil Sci. Soc. Am. J. 1986, 50, 627–633. [Google Scholar] [CrossRef] [Scilit]
- Secretaría de Medio Ambiente y Recursos Naturales (SEMARNAT). NORMA Oficial Mexicana NOM-021-RECNAT-2000, Que Establece Las Especificaciones de Fertilidad, Salinidad Y Clasificación de Suelos; Diario Oficial de la Federación: Mexico City, Mexico, 2002. Available online: https://www.ordenjuridico.gob.mx/Documentos/Federal/wo69255.pdf (accessed on 15 September 2024).
- CIMMYT. Infiltration: A Practical Guide for Comparing Crop Management Practices. In International Maize and Wheat Improvement Center; CIMMYT: El Batan, Mexico, 2013; Available online: http://hdl.handle.net/10883/3382 (accessed on 27 March 2024).
- USDA. Soil Quality Test Kit Guide; Natural Resources Conservation Service: Washington, DC, USA, 2001.
- Tuchtenhagen, I.K.; de Lima, C.L.R.; Bamberg, A.L.; Guimarães, R.M.L.; Mansonia, P.-M. Visual Evaluation of the Soil Structure under Different Management Systems in Lowlands in Southern Brazil. Rev. Bras. Cienc. Solo 2018, 42, e0170270. [Google Scholar] [CrossRef] [Scilit]
- Alakukku, L. Combatting Soil Degradation. Soil Compaction. In Sustainable Agriculture; Jakobsson, C., Ed.; The Baltic University Programme, Uppsala University: Uppsala, Sweden, 2012; pp. 217–221. [Google Scholar]
- Gitau, A.N.; Gumbe, L.O.; Biamah, E.K. Influence of soil water on stress–strain behaviour of a compacting soil in semi-arid Kenya. Soil Tillage Res. 2006, 89, 144–154. [Google Scholar] [CrossRef] [Scilit]
- Mwendera, E.J.; Saleem, M.M. Infiltration rates, surface runoff, and soil loss as influenced by grazing pressure in the Ethiopian highlands. Soil Use Manag. 1997, 13, 29–35. [Google Scholar] [CrossRef] [Scilit]
- Abdel-Magid, A.H.; Trlica, M.J.; Hart, R.H. Soil and vegetation responses to simulated trampling. Rangel. Ecol. Manag. 1987, 40, 303–306. [Google Scholar] [CrossRef] [Scilit]
- Lamandé, M.; Schjønning, P. Soil mechanical stresses in high wheel load agricultural field traffic: A case study. Soil Res. 2018, 56, 129–135. [Google Scholar] [CrossRef] [Scilit]
- Taghavifar, H.; Mardani, A. Effect of velocity, wheel load and multipass on soil compaction. J. Saudi Soc. Agric. Sci. 2014, 13, 57–66. [Google Scholar] [CrossRef] [Scilit]
- Nyamuryekung’e, S.; Cibils, A.F.; Estell, R.E.; McIntosh, M.; VanLeeuwen, D.; Steele, C.; González, A.L.; Spiegal, S.; Reyes, L.A.; Almeida, F.A.R.; et al. Foraging behavior and body temperature of heritage vs. commercial beef cows in relation to desert ambient heat. J. Arid Environ. 2021, 193, 104565. [Google Scholar] [CrossRef] [Scilit]
- Spiegal, S.; Estell, R.E.; Cibils, A.F.; Armstrong, E.; Blanco, L.J.; Bestelmeyer, B.T. Can heritage Criollo cattle promote sustainability in a changing world? J. Arid Environ. 2023, 216, 104980. [Google Scholar] [CrossRef] [Scilit]
- Nimmo, J.R. Aggregation: Physical Aspects. In Reference Module in Earth Systems and Environmental Sciences; Elsevier: Amsterdam, The Netherlands, 2013. [Google Scholar] [CrossRef] [Scilit]
- Renforth, P. Angle of Friction and Shear Stress. Available online: https://www.youtube.com/watch?v=G7vjouBjRTA&list=PLfq_GdsHl0CI5EDirZ2GKzdNfwzMYvR9J&index=16 (accessed on 24 November 2025).
- Payne, P.C.J.; Fountaine, E.R. A field method of measuring the shear strength of soils. J. Soil Sci. 1952, 3, 136–144. [Google Scholar] [CrossRef] [Scilit]
- Krümmelbein, J.; Peth, S.; Zhao, Y.; Horn, R. Grazing-induced alterations of soil hydraulic properties and functions in inner Mongolia, PR China. J. Plant Nutr. Soil Sci. 2009, 172, 769–776. [Google Scholar] [CrossRef] [Scilit]
- Munkholm, L.J.; Holden, N.M. Visual soil evaluation: Realising potential crop production with minimum environmental impact. In Visual Soil Evaluation: Realising Potential Crop Production with Minimum Environmental Impact; Ball, B.C., Munkholm, L.J., Eds.; CABI: Oxfordshire, UK, 2015; pp. 49–65. [Google Scholar] [CrossRef] [Scilit]
- Auler, A.C.; Galetto, S.L.; Hennipman, F.S.; Guntzel, E.D.; Giarola, N.F.; da Fonseca, A.F. Soil structural quality degradation by the increase in grazing intensity in integrated crop-livestock system. Bragantia 2017, 76, 550–556. [Google Scholar] [CrossRef] [Scilit]
- Mutuku, E.A.; Vanlauwe, B.; Roobroeck, D.; Boeckx, P.; Cornelis, W.M. Visual soil examination and evaluation in the sub-humid and semi-arid regions of Kenya. Soil Tillage Res. 2021, 213, 105135. [Google Scholar] [CrossRef] [Scilit]
- Orlando Olivares, B.; Lobo, D.; Rey, J.C.; Vega, A.; Rueda, M.A. Relationships between the Visual Evaluation of Soil Structure (VESS) and soil properties in agriculture: A meta-analysis. Sci. Agropecu. 2023, 14, 67–78. [Google Scholar] [CrossRef] [Scilit]
- Ball, B.C.; Guimarães, R.M.; Cloy, J.M.; Hargreaves, P.R.; Shepherd, T.G.; McKenzie, B.M. Visual soil evaluation: A summary of some applications and potential developments for agriculture. Soil Tillage Res. 2017, 173, 114–124. [Google Scholar] [CrossRef] [Scilit]
- Giarola, N.F.B.; da Silva, Á.P.; Tormena, C.A.; Guimarães, R.M.L.; Ball, B.C. On the visual evaluation of soil structure: The Brazilian experience in Oxisols under no-tillage. Soil Tillage Res. 2013, 127, 60–64. [Google Scholar] [CrossRef] [Scilit]

Disclaimer/Publisher’s Note: The statements, opinions and data contained in all publications are solely those of the individual author(s) and contributor(s) and not of MDPI and/or the editor(s). MDPI and/or the editor(s) disclaim responsibility for any injury to people or property resulting from any ideas, methods, instructions or products referred to in the content. |
© 2026 by the authors. Licensee MDPI, Basel, Switzerland. This article is an open access article distributed under the terms and conditions of the Creative Commons Attribution (CC BY) license.