


Abstract
This work describes the development of the Multi-channel Integrated Zone-sampling Analogue-memory based Readout (MIZAR) ASIC. This 64-channel chip was designed as part of NASA’s POEMMA Balloon with RADIO (PBR) mission, which aims to detect Ultra-High-Energy Cosmic Rays (UHECRs) and showers produced by the interaction of Cosmic Neutrinos (CNs) in the crust. The ASIC was implemented to read out a tile of 8 × 8 Silicon Photomultipliers (SiPMs) used to acquire the optical Cherenkov signals generated by Extensive Air Showers (EASs). A channel is partitioned into 256 cells where each one integrates an analogue memory, a Wilkinson Analog-to-Digital Converter (ADC) and a digital memory operating at the nominal sampling rate of 200 MS/s (with a 5 ns integration time). The signal is digitized on-chip, then the converted data is read out by an FPGA. The MIZAR also provides a 64-bit hitmap as a first-level trigger which can be elaborated by an external firmware. This ASIC can also be configured to further segment the channels into units of 32 or 64 cells each and the ADC resolution can be set to a range between 8 and 12 bits. The chip was designed in a commercial 65 nm CMOS technology node and it was submitted for production in December 2024. The ASICs were delivered in March 2025.
1. Introduction
Detecting Cherenkov radiation from Extensive Air Showers (EAS) initiated by Ultra-High-Energy Cosmic Rays (UHECRs) or neutrinos presents specific challenges, particularly for near-space observations from low Earth orbit (∼500 km) or sub-orbital altitudes (30–40 km). Simulations show that such Cherenkov signals can persist for tens of nanoseconds, depending on the viewing angle relative to the shower axis. Consequently, the front-end (FE) electronics must achieve time resolutions on the order of 10 ns or better to accurately capture the temporal shape of the signals [1]. Additionally, full waveform acquisition is essential for distinguishing genuine EAS signals from background events, such as direct cosmic ray hits on the detector [2,3].
In response to these requirements, INFN Torino began developing a new generation of Application-Specific Integrated Circuits (ASICs). This effort is tightly integrated with ongoing and planned UHECR and neutrino detection missions, such as the stratospheric balloon experiment EUSO-SPB2 [4], as well as space-based projects like Terzina [5,6], POEMMA [7], and M-EUSO [8]. Currently, the ASIC’s capabilities are under evaluation within the framework of the POEMMA Balloon with Radio (PBR) mission [9].
Following the legacy of the JEM-EUSO program [10], PBR is the next balloon-borne mission after EUSO-SPB2, which flew on a NASA Super-Pressure Balloon launched in May 2023 from Wanaka, New Zealand [4]. EUSO-SPB2 featured a dual-instrument payload comprising a fluorescence telescope with a MAPMT focal plane for detecting EeV-scale EAS fluorescence and a Cherenkov telescope (CTel) equipped with a SiPM camera to observe Cherenkov emissions from PeV-scale showers, including those originating from tau neutrino decays.
The PBR design builds on this foundation with a modified Schmidt telescope featuring a 1 m primary mirror segmented into four sections, producing two separate focal spots on the camera via a bifocal optical layout. This arrangement enhances event discrimination by differentiating single-spot direct cosmic ray hits from dual-spot background light, reducing false triggers and improving signal fidelity.
At the heart of the Cherenkov telescope is a high-speed focal plane camera, consisting of 512 Silicon Photomultiplier (SiPM) pixels (Hamamatsu S13361-3050NE-08 [11]). The camera is optimized for detecting nanosecond-scale optical pulses with a 10 ns integration time and a 512-frame analog memory for signal buffering. The readout system is centered around a dedicated front-end ASIC that performs fast waveform sampling, analog-to-digital conversion, and data derandomization. This architecture enables the precise reconstruction of temporal signal profiles and supports high-throughput event capture with minimal dead time.
2. Materials and Methods
The Front-End Electronics
To address the demands of low-power, high-performance signal processing, a highly energy-efficient ASIC [12,13] has been developed using a standard 65 nm CMOS process and operates at a 1.2 V supply voltage. Designed for use with 8 × 8 arrays of SiPMs, the chip integrates 64 channels that function in parallel, each equipped to sample waveforms and accurately reconstruct the detected signals.
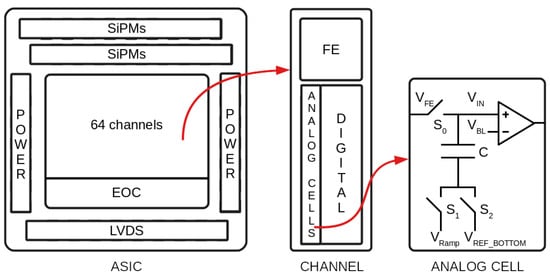
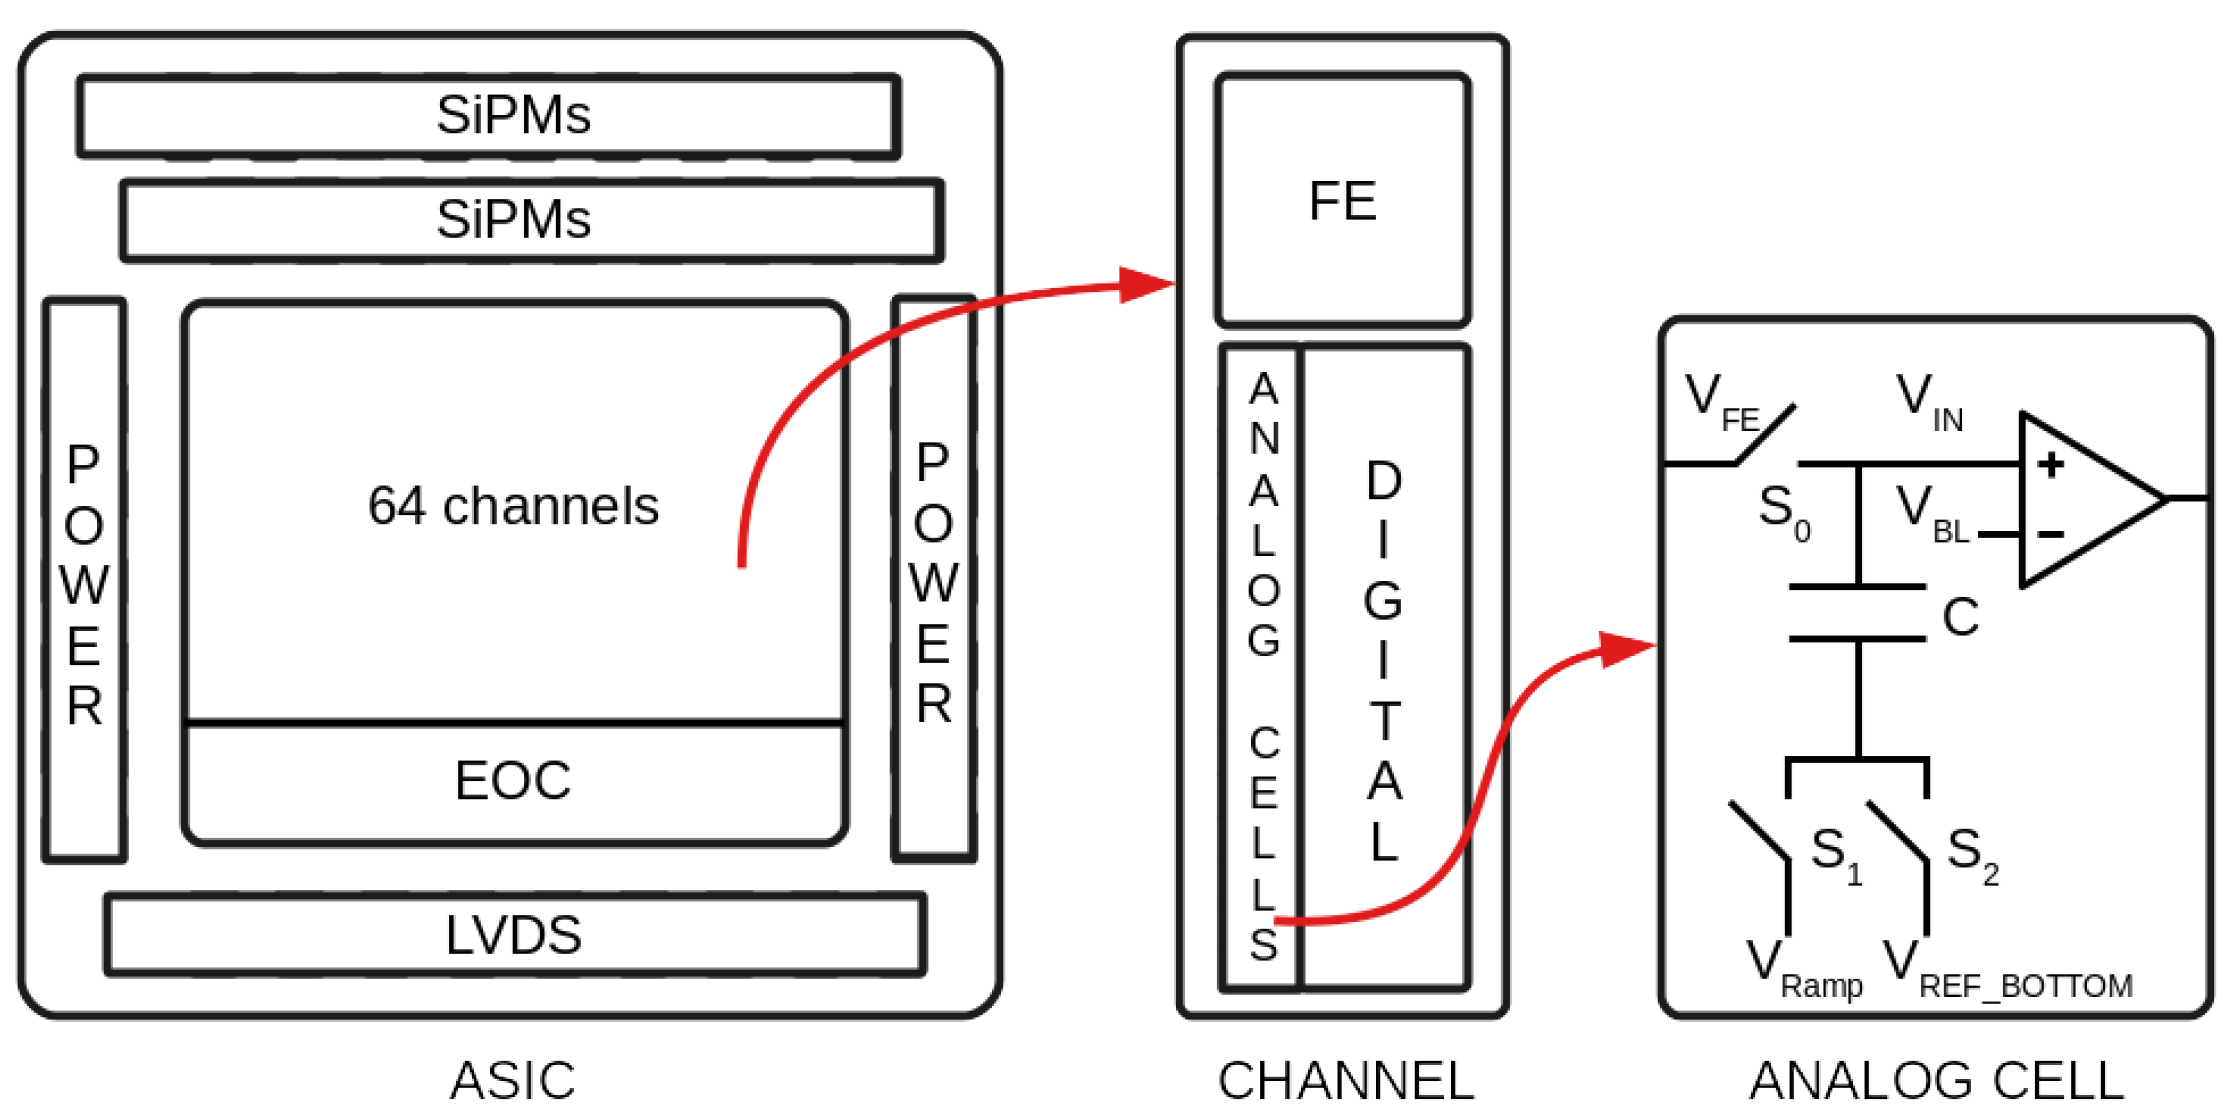
Figure 1 depicts a hierarchical block diagram of the MIZAR. Each of the 64 channels includes an FE analog block that distributes the processed signal across an array of 256 memory cells. These cells incorporate analog storage and sample the input signal at a nominal rate of 200 MHz. Each memory unit integrates a storage capacitor and a single-slope ADC, enabling simultaneous digitization across all cells. This parallel conversion significantly minimizes system dead time without sacrificing precision.
Figure 1.
Block diagram of the MIZAR architecture.
The ADC resolution is configurable from 8 to 12 bits in order to support lower-resolution operation during background monitoring, which reduces digitization overhead when fine detail is unnecessary. The analog memory can operate by segmenting the 256 cells into 32 or 64 cell buffers, or by using all 256 cells, enabling multi-buffer acquisition. Each 32-cell partition is a named section. This configuration allows for data from one event to be digitized while keeping the system ready for subsequent triggers, minimizing event losses due to readout latency.
The chip integrates both analog and digital circuitry on a single die, employing a digital-on-top layout strategy. With a compact footprint of 6 × 5 mm2 and a target power consumption of 5 mW per channel, the ASIC is well-suited to meeting the demanding requirements of future space-based and sub-orbital observatories for UHECRs and neutrinos.
Each channel features two adjustable thresholds: a high threshold, designed to identify events where the signal is predominantly concentrated in a single pixel, and a low threshold, intended to detect events that span multiple neighboring pixels. When the input signal exceeds the low threshold, a programmable counter starts a validation time window. If the signal also crosses the high threshold within this interval, only the high-threshold trigger is forwarded to the FPGA. Otherwise, the low-threshold trigger is sent. The FPGA analyzes the 64-bit hitmap provided by each ASIC, which indicates the active channels, and determines whether the event qualifies for readout. The FPGA follows the following three decision paths:
- Event Acceptance: The event is marked for readout if the high threshold is triggered in one or two adjacent pixels, or if the low threshold is crossed in a group of two to four contiguous pixels.
- Event Rejection: If the hitmap does not show sufficient spatial correlation between triggered pixels, the event is discarded. However, when a single peripheral pixel is involved, the FPGA may consult neighboring ASICs for signs of an extended event before making a final rejection.
- No Response: If the FPGA fails to issue a response within a predefined time window, the system automatically resets and resumes trigger monitoring.
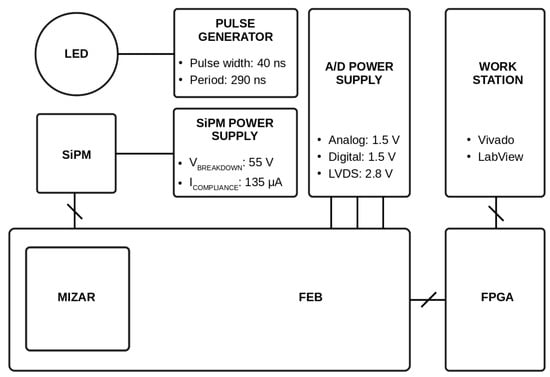
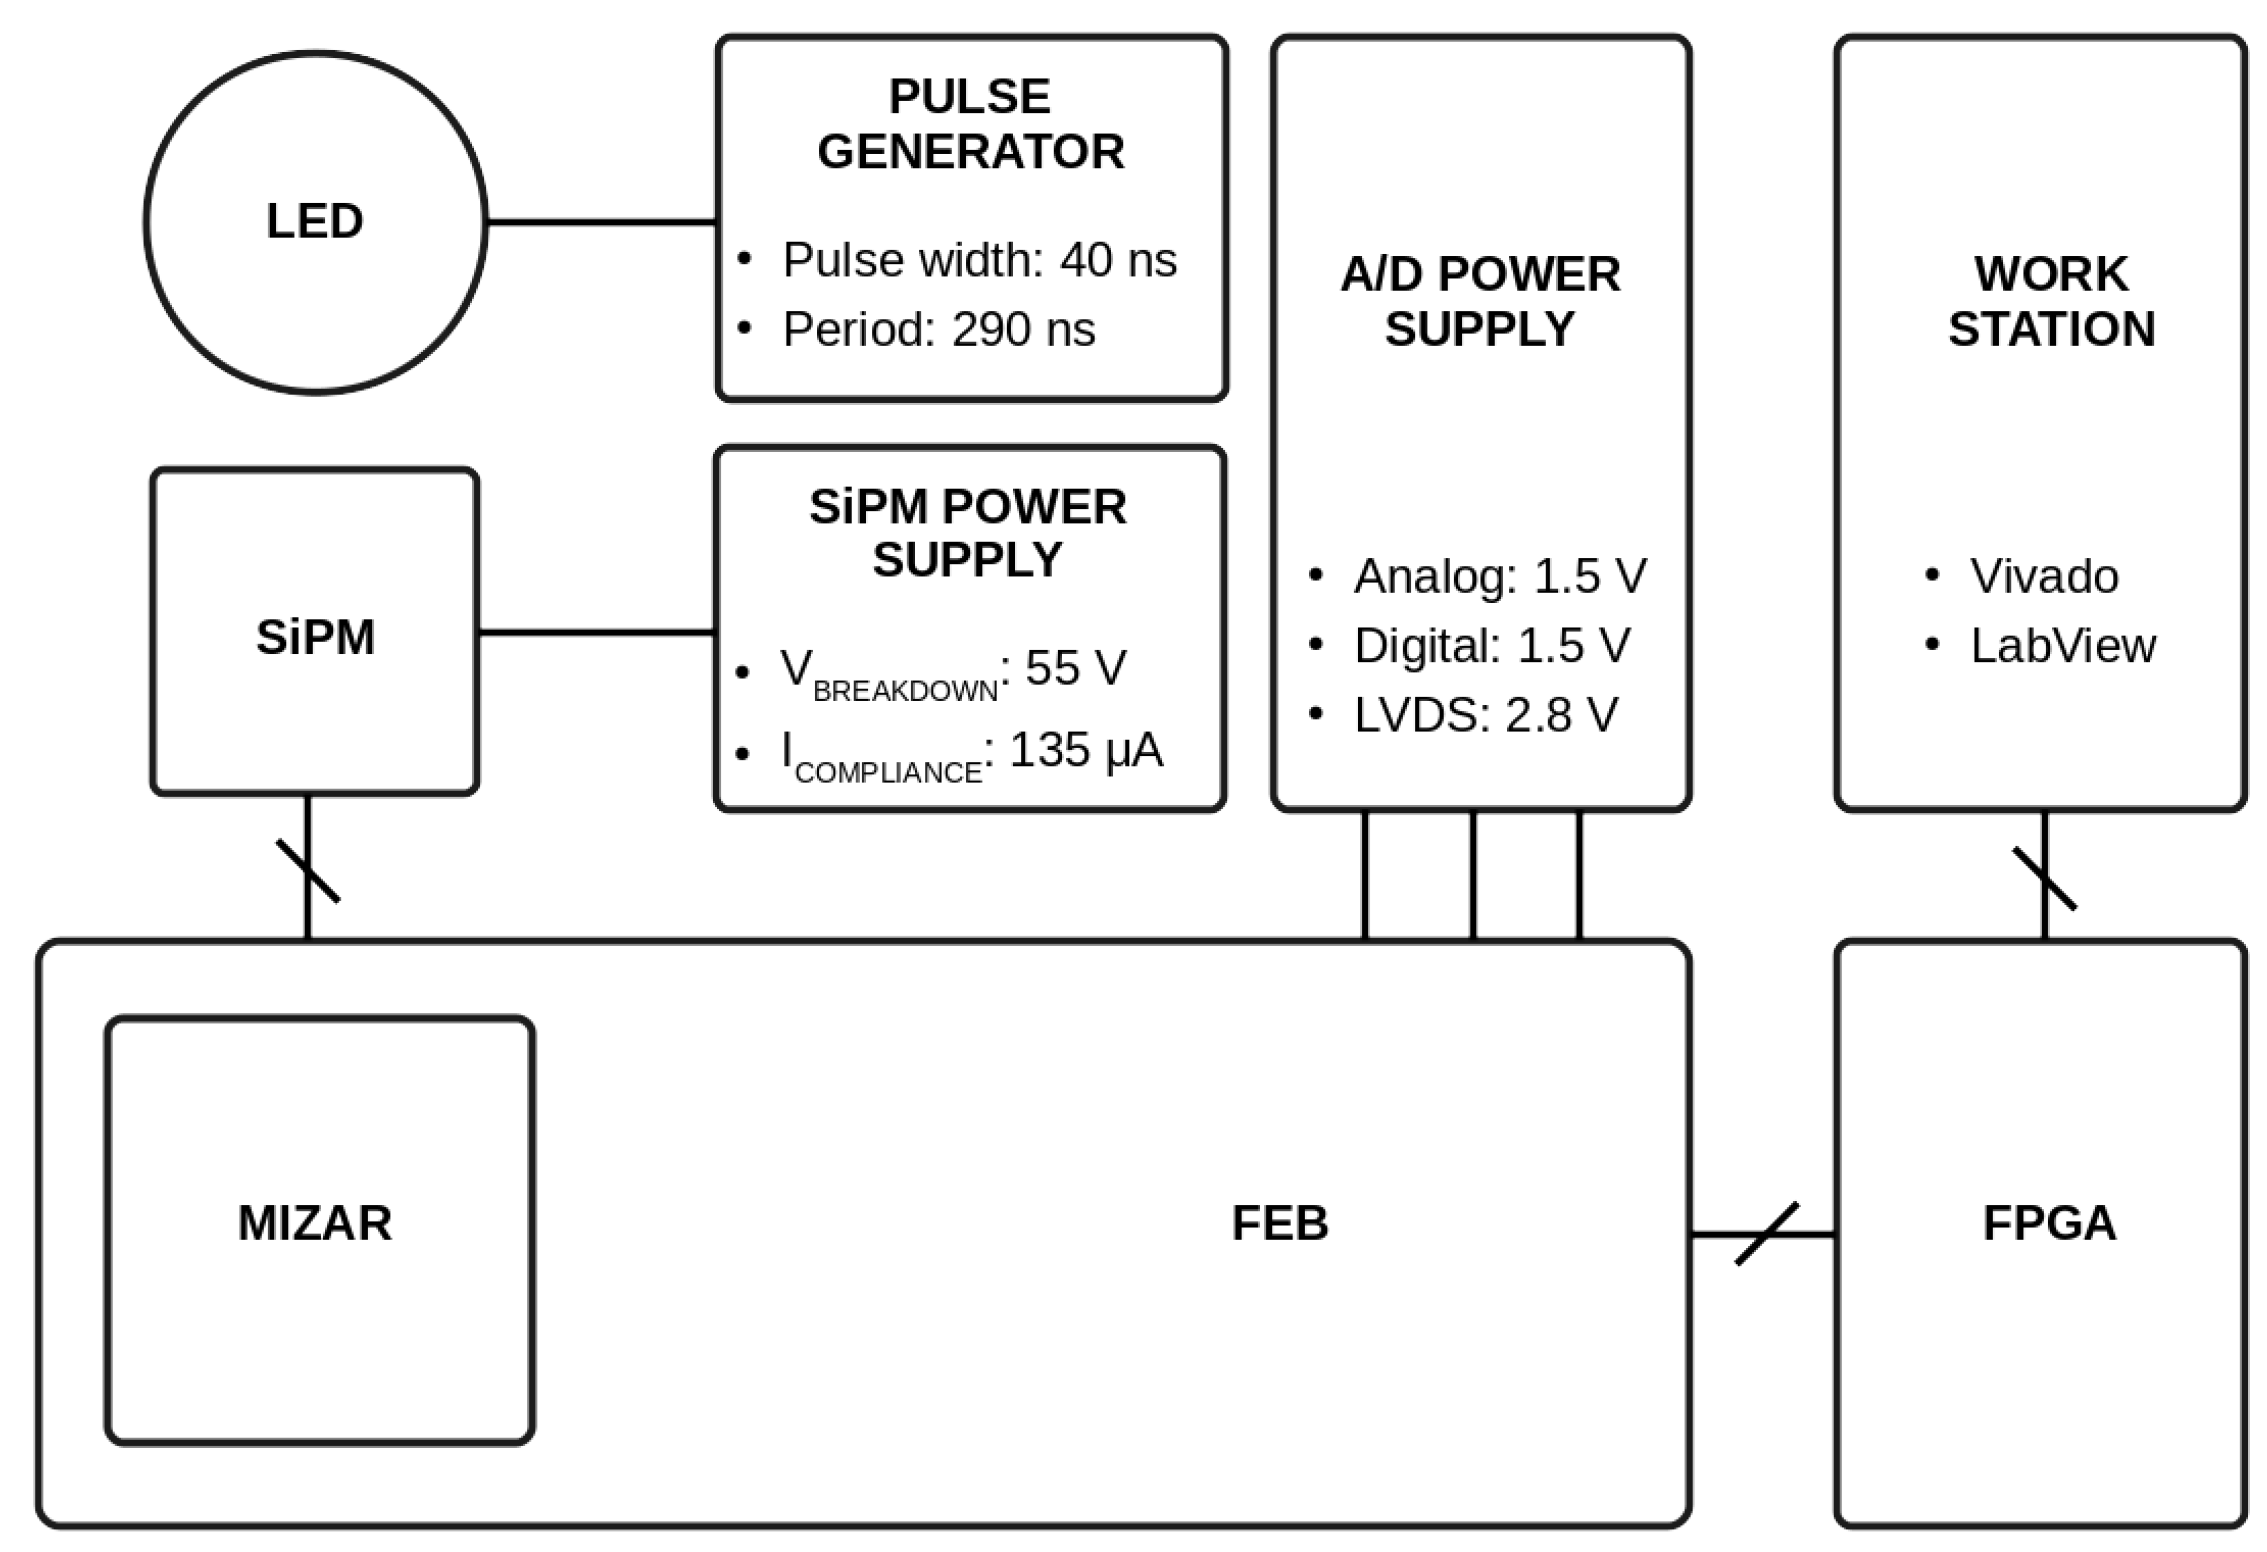
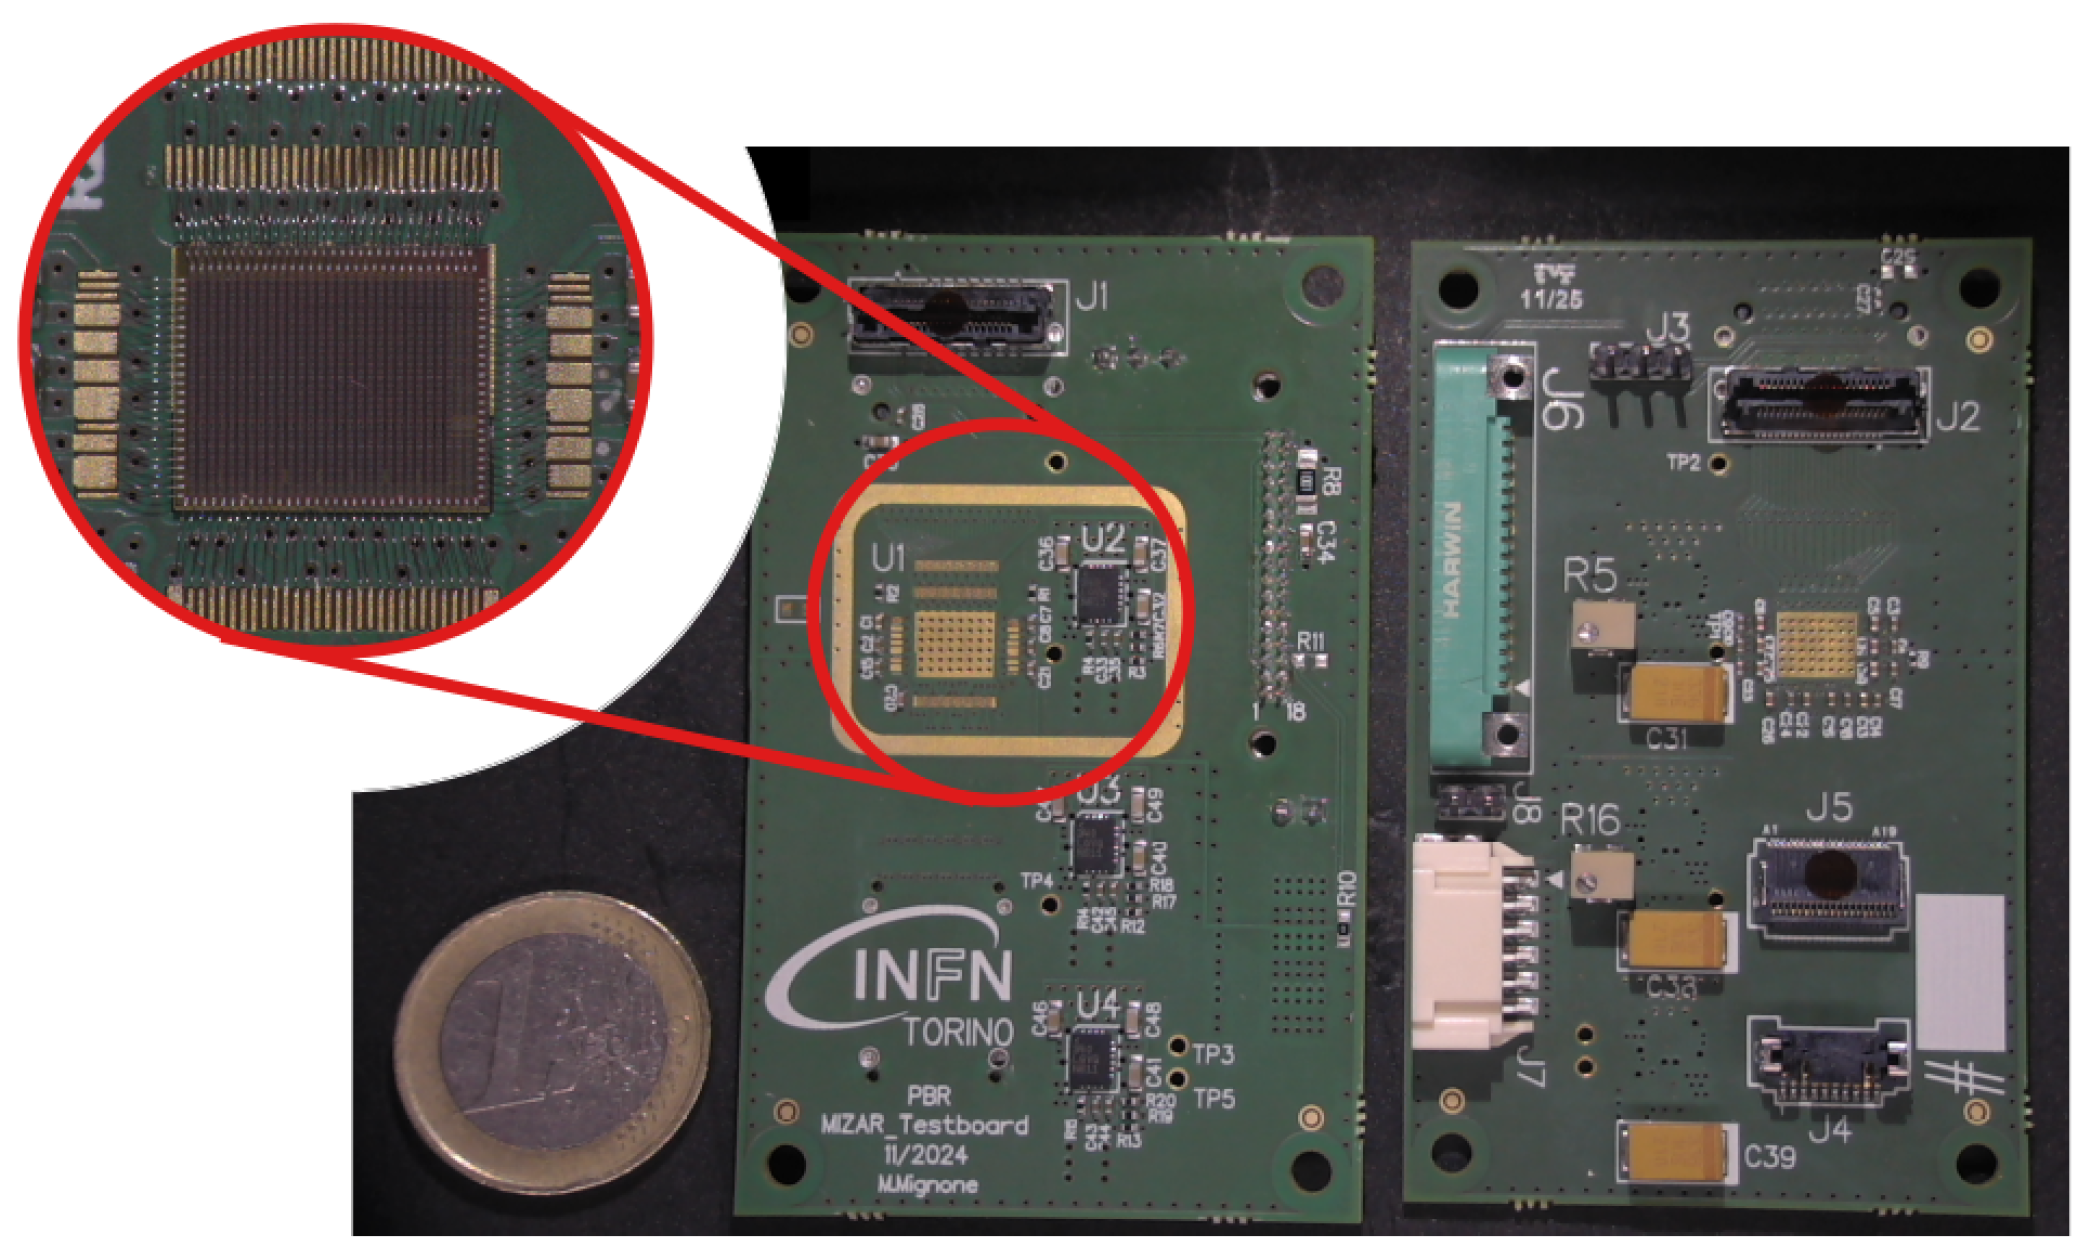
Figure 2 depicts a block diagram of the setup used during the test campaign. A MIZAR chip is bonded on a Front-End Board (FEB) which is connected to the power supply to provide the three power domains to the ASIC. These are 1.5 V for the analog blocks, 1.5 V for the digital counterpart, and 2.8 V for the Low-Voltage Differential Signaling (LVDS) distributed to the voltage regulators on the PCB. The FEB is connected to the FPGA through a FireFly cable, then the data are collected into a work station where both Vivado and LabView are running. Figure 3 shows the FEB where the power connectors (J7, J8), the voltage regulators (C31, C38, C39), the transceiver links (J4, J5), and the SiPMs connectors (J1, J2) are easily recognizable.
Figure 2.
Block diagram of the test setup.
Figure 3.
Front and back of the FEB. In the red circle, a bonded MIZAR is magnified.
The FEB is connected as well to a SiPM tile with a dedicated high-voltage power supply. A LED modulated by a pulse generator is used as light source. The following Table 1 lists the instruments available for the acquisitions and their settings. The FPGA generates the main 200 MHz clock and the 20 MHz clock reserved for the Serial Peripheral Interface (SPI). The compliance for current of the SiPMs was set to 135 μA, while the LED is driven by a pulse width of 40 ns with a period of 290 ns.
Table 1.
List of instruments used in the testing setup.
Table 2 reports the values of the main parameters used during data acquisition. The test pulse injected into each channel is characterized by the CTR_TP_VB register, which sets its amplitude, and by the TP sequence section, which defines its duration. The configuration also includes the CTR_MIR_VB register, which controls the slope of the ramp used in the ADC conversion by regulating the current supplied over time. The current can be programmed to vary from 40 nA to 640 nA in discrete steps of 40 nA. The Low VTH and High VTH registers define the local thresholds at the channel level of the hierarchy. Both of these arrays span a range determined by global thresholds CTR_LO_VTH_GBL and CTR_HI_VTH_GBL, respectively, and VTH_LSB registers, according to the relation CTR_* _VTH_GBL - n × VTH_LSB, with n ranging from 0 to 31. A value of n = 31 corresponds to the baseline set by the CTR_LO_VTH_GBL and CTR_HI_VTH_GBL registers, while n = 0 represents the baseline reduced by 31 LSB steps. The value of the Low VTHs is always larger than the High VTHs because of the inverted signals of SiPMs. The FE electronics also features a coupling capacitor, which is implemented at the preamplifier stage of each channel. This filter is used to stabilize the baseline and during the tests the DC coupling was disabled by switching off the GCR_DC_COUPLING register.
Table 2.
Register settings used for data acquisition.
3. Results
3.1. Chip Configuration
Preliminary tests have been conducted using an 8-bit resolution and 32-cell segmentation, operating on a 200 MHz clock provided by the FPGA. The chip is designed to operate in two modes as indicated in Table 3. In acquisition mode the system sent a sequence of commands to the ASIC with a 2-bit input port called and each command takes two clock cycles to be executed. Thus, after a read request, the FPGA sent out a 01 command to receive the hitmap. If the transmission is validated by the FPGA, a 11 command is set to enable the on-chip digitization of the sampled data. The force mode is used to debugging purposes and it can directly generate a hitmap at a selected time, followed by the digitization of the samples and the data readout.
Table 3.
Commands used by the FPGA.
The LabView interface makes it possible to read and write the SPI registers, to set the thresholds for each channel, and to run the test with the selected configuration.
Laboratory Results
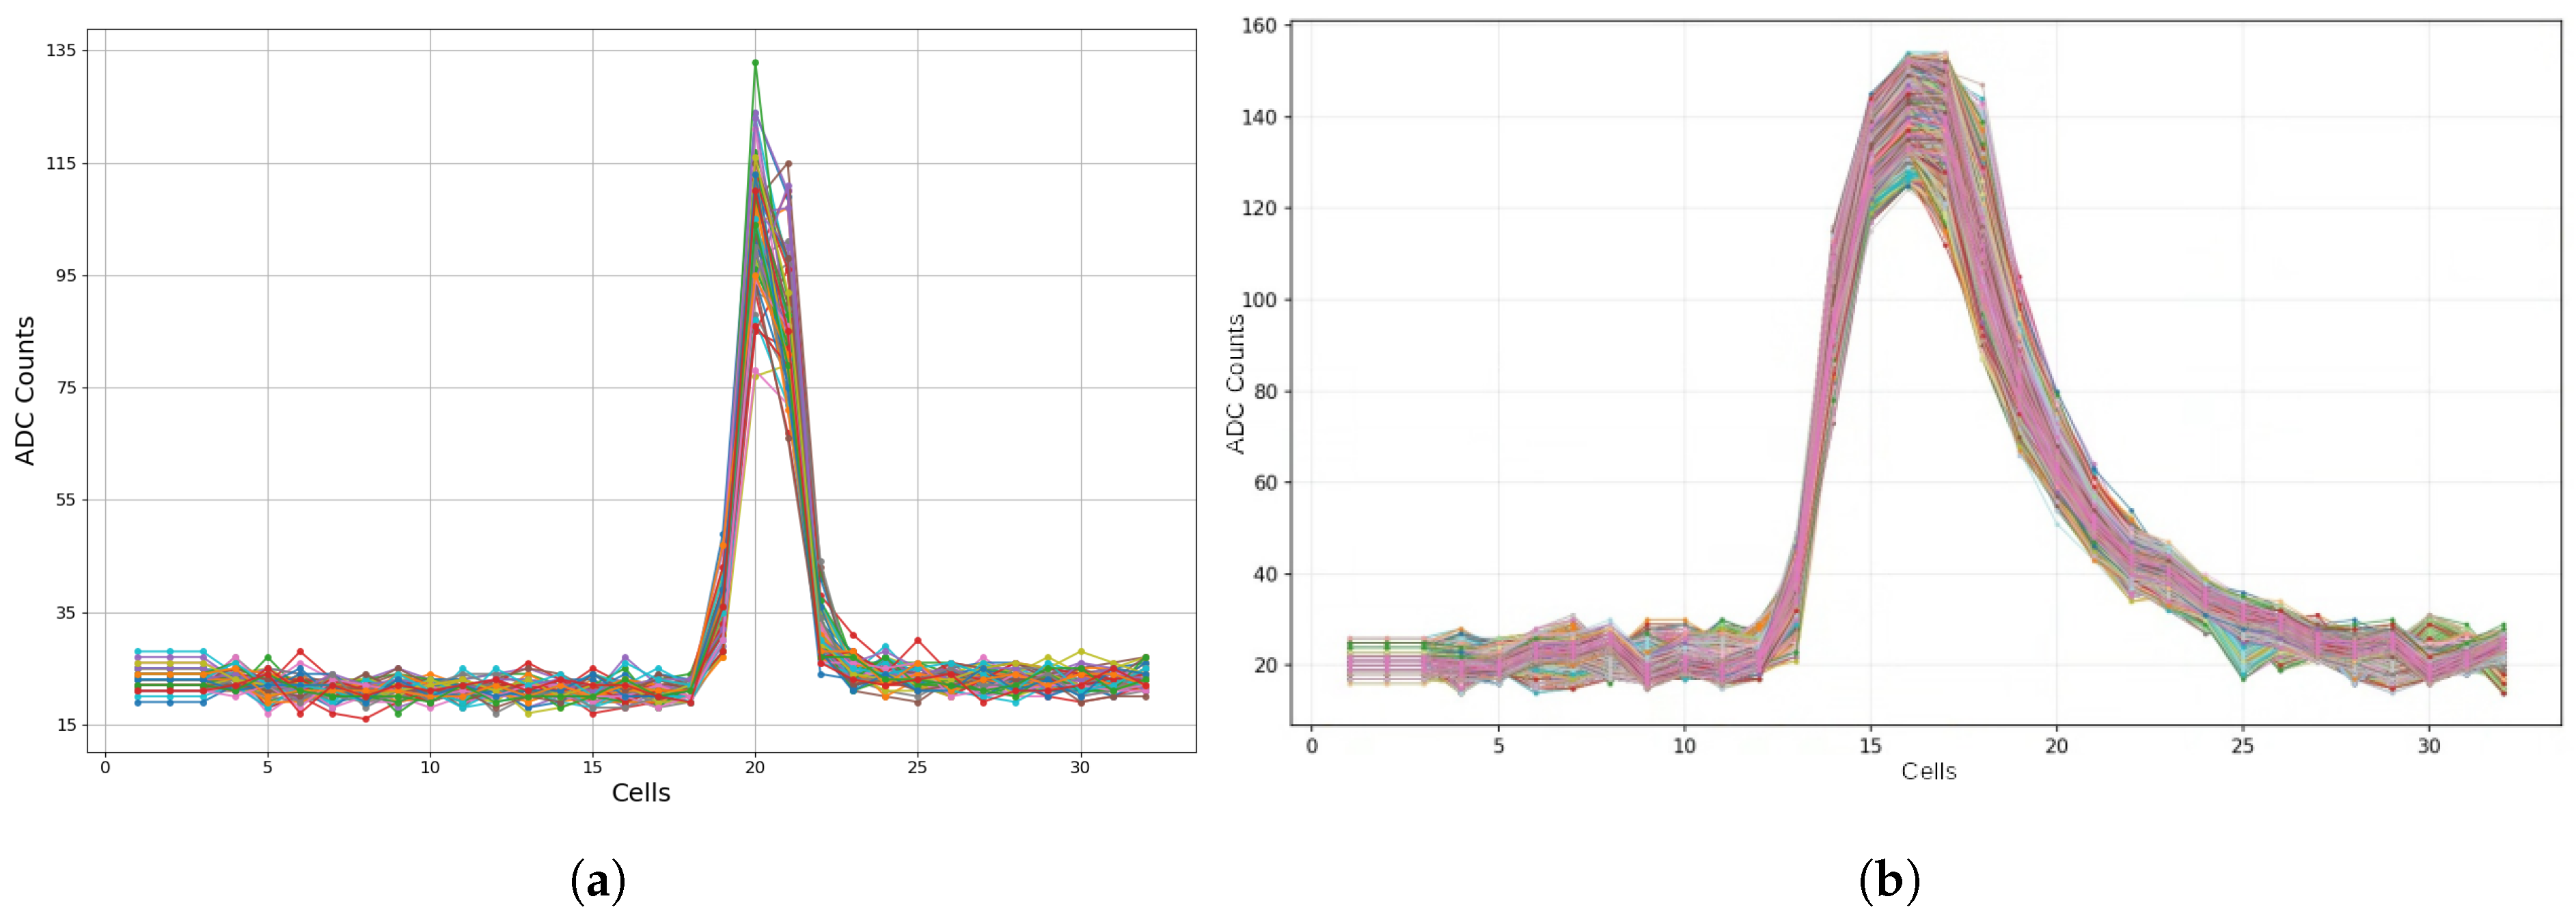
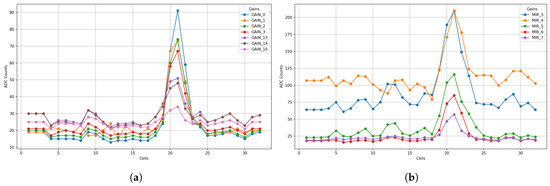
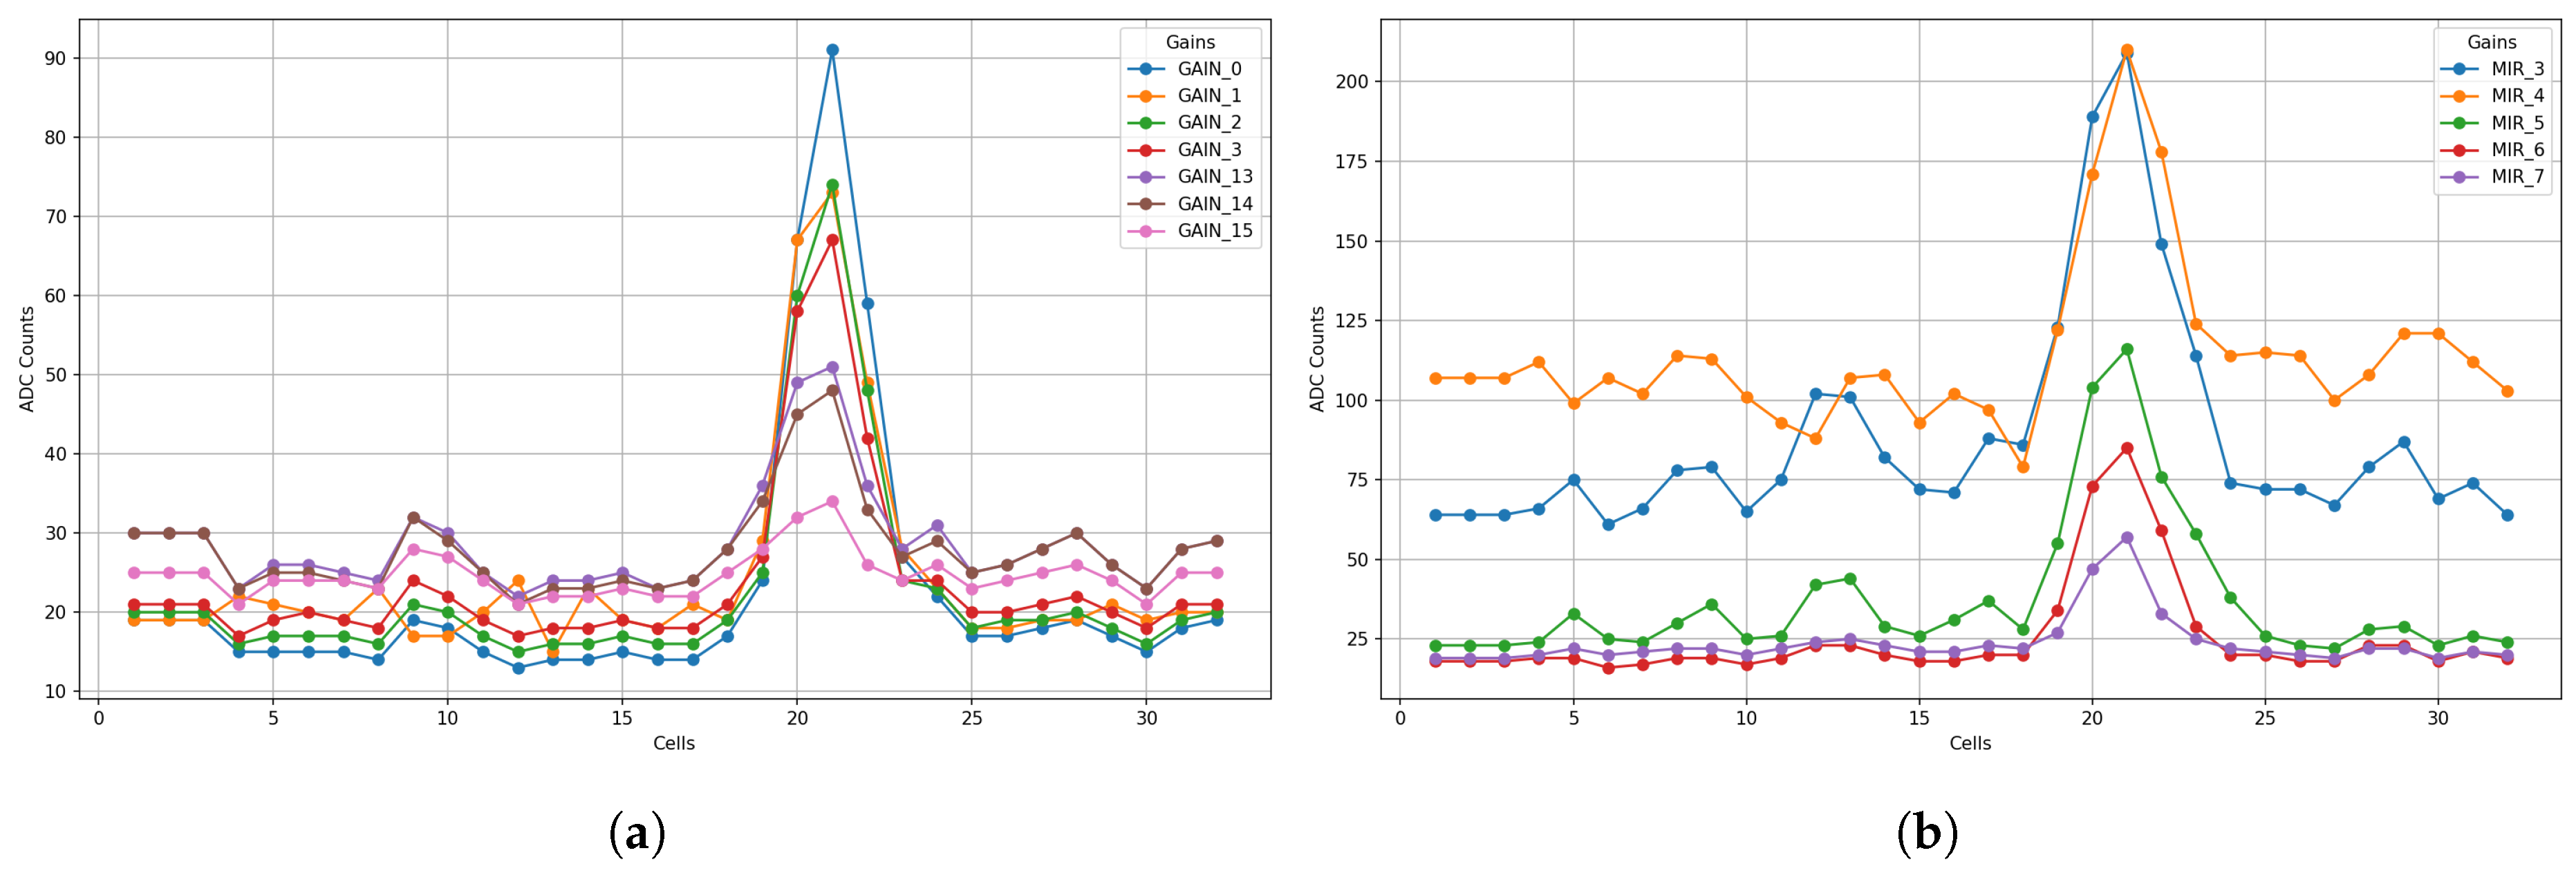
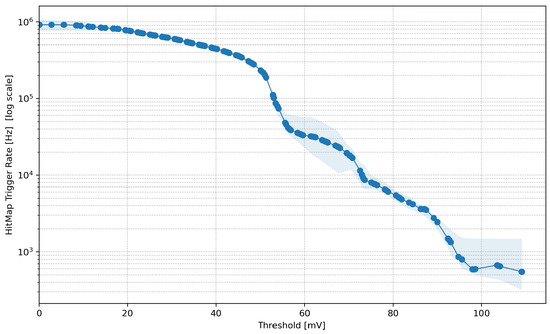
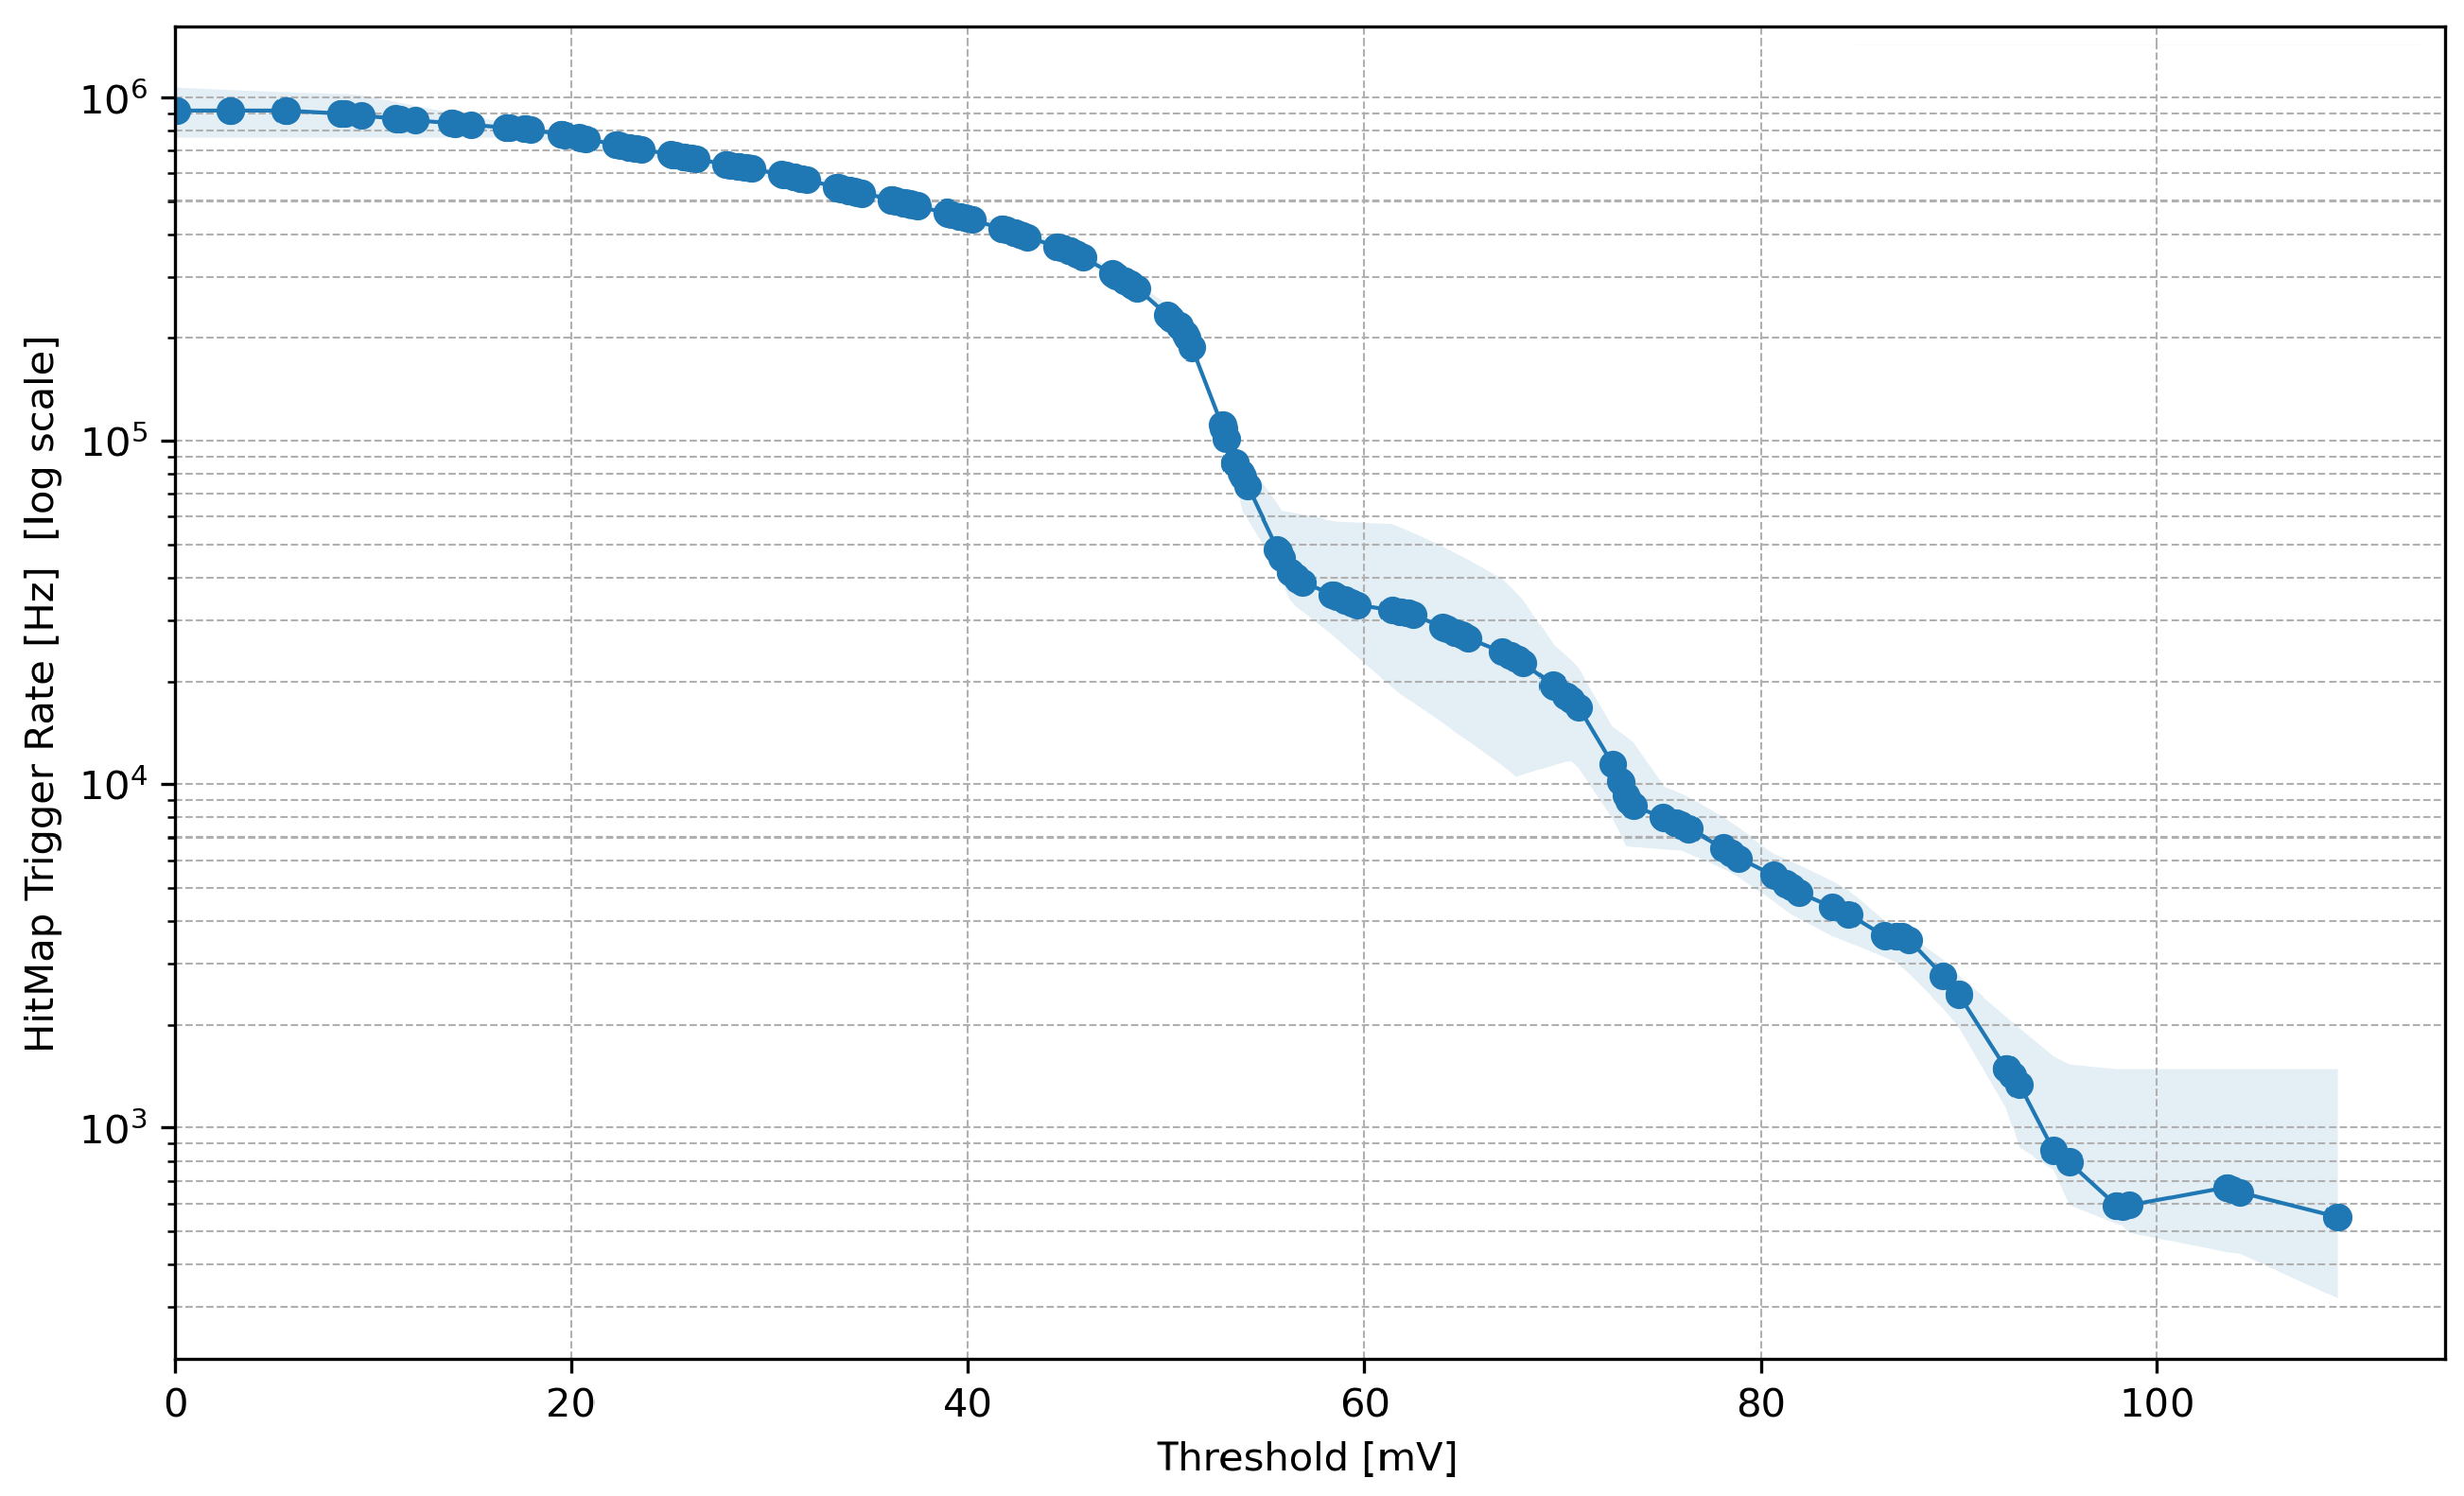
Figure 4a collects all the output coming from 64 channels when the TP is enabled, while Figure 4b shows 100,000 acquisitions taken by using a modulated LED as a signal source for the SiPMs. Figure 5a reports the pulses acquired for the same section by changing the gain value at a given ramp current. Figure 5b illustrates the complementary acquisition where the ramp current is changed for a fixed gain value. Figure 6 depicts the thermal noise plot based on 100,000 acquisitions using the pulsed LED at the temperature of 21 °C.
Figure 4.
(a) Test Pulse enabled for all the 64 channels. (b) Channel outputs using a pulsed LED.
Figure 5.
(a) Test pulse with fixed MIR at 640 nA and variable GAIN—first section. (b) Test pulse with GAIN fixed at 0 and variable MIR—first section.
Figure 6.
Thermal noise operated at 55 V as a function of channel threshold at 21 °C.
4. Discussion
4.1. Preliminary Considerations
The first data acquisition led to conclude that the chip follows the correct procedure in the data generation process; however, some inconsistencies were found compared with the expected data, both in the hitmap and in the data streams. Indeed an 8-bit row of the 64-bit hitmap is overwritten and not properly transmitted. This point has been attributed to a timing issue in the Finite State Machine that manages the serialization, where the first word of a new hitmap overwrites the last word of the previous one before it can be transmitted correctly. Nevertheless the information is lost in the hitmap frame; therefore, this issue is not critical. In fact, let us consider the eight-section configuration of a channel to set the multi-buffer acquisition. The read request signal ensures an interaction occurred in the SiPM tile, characterizing it as a high-threshold or low-threshold event with a dedicated 6-bit field in the data stream. In the first case only one pixel is hit, while in second case at least two pixels are expected. This implies, in the first case, a totally empty hitmap if the event occurred in one of the eight hits that were not properly transmitted. On the other hand, the second scenario leads to a hitmap with an apparently missing event on the 8-bit row. Consequently, the FPGA can be flashed with a firmware implementing a continuous handshake triggered on the read request signal to accept all the hitmaps. Then the external acquisition system can check the 6-bit field to handle the exceptions of the two cases previously described. In this way, by enabling the digitization, the content of the current section can be processed later, while the multi-buffer configuration guarantees a dead time limited to the hitmap transmission itself and to FPGA processing, quantified in 190 ns. The data stream is affected by a systematic bit inversion and a offset of 2 bits during the serialization of the output. These are classified as minor problems, since can be easily addressed during the data processing on the software side.
4.2. Test Pulse, Gain, and Ramp Current
Figure 4a illustrates the output of the 64 channels after the injection of a test pulse (TP). The TP has a width of 20 ns and it is correctly processed by the FE and properly digitized. This known signal has been used to study the effects of different configurations on the output. In greater detail, the gain control of the preamplifier and the ramp current of the Wilkinson ADCs are considered below and are depicted in Figure 5a and Figure 5b, respectively. The configuration of the gain controls the resistance load on which the SiPM’s current is conveyed to generate a voltage output which affects both the hitmap logic and the data sampling. The ramp current of the Wilkinson ADCs is involved during the digitization of the sampled waveform points. By changing its value, the range of the output obtained from the digitization may vary. Thus, the ramp must be fast enough to allow each discriminator to fire before the Gray counter reaches the maximum value to avoid empty registers.
4.3. Pulsed LED Test
The whole experimental setup depicted in Figure 2 is closed inside a black box to stop any undesired sources of light. An LED was modulated with a pulse of 40 ns in width and triggered by the FPGA. Figure 4b illustrates the output of a channel hit by the pulsed light for the same section. The total number of curves is equal to 100,000 and it was used to estimate the spread at the maximum point of the curves, quantified it as equal to 25 ADC counts.
4.4. Dark Count Rate
I–V curves were obtained for the Hamamatsu SiPMs S14521-6050AN-04 series to define the breakdown voltage. The tiles of SiPMs were accommodated inside the black box, then the voltage was spanned with a step of 0.1 V monitoring the current. The resulting breakdown voltage is equal to (53 ± 0.02) V. Then, the high voltage of the SiPMs was set to 55 V to replicate the same conditions shown in the datasheet of S14521-6050AN-04. Our system collected 100,000 frames in dark conditions at a temperature of 21 °C, setting the 32 cells partition in the channel. Figure 6 illustrates the trigger rate as a function of the threshold. This thermal noise was elaborated on considering the data acquired by seven of the active hits of the hitmap. The trend defines pretty well three steps which are compatible with the same plot reported in the datasheet. This acquisition suggests the sensitivity of the processing chain to the single photon–electron. Furthermore by changing the gain setting, we made it possible to cope with the saturation point of the SiPM. Further studies will better detail these preliminary results.
5. Conclusions
A new ASIC for processing optical Cherenkov signals produced by EAS was described. The chip, called the MIZAR, was designed for sub-orbital and orbital missions with low power consumption (around 5 mW per channel). The MIZAR operates at a 200 MHz clock frequency, performing full-waveform sampling to clearly recognize an EAS Cherenkov signal from other types of sources such as direct cosmic ray hits, noise spikes or atmospheric events. The first version of the MIZAR ASIC has been produced and preliminary investigation tested its functionality. The chip is properly configured via SPI. Although truncated, the hitmaps can be retained using the data which preserves the information, either by providing a test pulse or pulses generated with a LED.
In the next months, the study of S-curves will be further developed to evaluate the detection efficiency.
Author Contributions
Conceptualization, A.D.S., M.E.B., and A.R.; methodology, A.D.S., S.G., and A.R.; software, A.D.S., R.W., S.G. and M.M.; validation, A.R.; investigation, A.D.S., E.T., M.M.B., F.R., M.A., S.G. and M.M.; resources, M.E.B. and A.R.; data curation, A.D.S. and M.M.; writing—original draft preparation, A.D.S., E.T., M.M.B., and F.R.; writing—review and editing, A.D.S. and M.E.B.; visualization, A.D.S. and M.M.; supervision, A.D.S. and M.E.B.; project administration, M.E.B. and A.R.; funding acquisition, M.E.B. All authors have read and agreed to the published version of the manuscript.
Funding
The front-end electronics described in this paper are part of the development performed within the ASI-INFN agreement for EUSO-SPB2 n.2021-8-HH.0 and its amendments.
Data Availability Statement
The original contributions presented in this study are included in the article. Further inquiries can be directed to the corresponding author.
Conflicts of Interest
The authors declare no conflicts of interest.
Abbreviations
The following abbreviations are used in this manuscript:
| MIZAR | Multi-channel Integrated Zone-sampling Analogue-memory based Readout |
| ASIC | Application-Specific Integrated Circuit |
| POEMMA | Probe of Extreme Multi-Messenger Astrophysics |
| UHECR | Ultra-High-Energy Cosmic Ray |
| SiPM | Silicon Photomultiplier |
| CN | Cosmic Neutrinos |
| EAS | Extensive Air Shower |
| ADC | Analog-to-Digital Converter |
| FPGA | Field-Programmable Gate Array |
| CMOS | Complementary Metal Oxide Semiconductor |
| FE | Front End |
| INFN | Istituto Nazionale di Fisica Nucleare |
| PBR | POEMMA Balloon Radio |
| JEM-EUSO | Joint Experiment Missions for Extreme Universe Space Observatory |
| EUSO-SPB2 | Extreme Universe Space Observatory–Super-Pressure Balloon 2 |
| M-EUSO | Mini-Extreme Universe Space Observatory |
| MAPMT | Multi-Anode Photomultiplier Tube |
| LVDS | Low-Voltage Differential Signaling |
| LED | Light-Emitting Diode |
| FEB | Front-End Board |
| PCB | Printed Circuit Board |
| TP | Test Pulse |
References
- Bagheri, M.; Gadamsetty, S.; Gazda, E.; Judd, E.; Kuznetsov, E.; Otte, A.N.; Potts, M.; Matamala, O.R.; Shapera, N.; Sorell, J.; et al. The camera and readout for the Trinity Demonstrator and the EUSO-SPB2 Cherenkov telescope. Nucl. Instrum. Methods Phys. Res. Sect. A 2025, 1070, 169999. [Google Scholar] [CrossRef] [Scilit]
- Cummings, A.L.; Aloisio, R.; Eser, J.; Krizmanic, J. Modeling the optical Cherenkov signals by cosmic ray extensive air showers directly observed from suborbital and orbital altitudes. Phys. Rev. D 2021, 104, 063029. [Google Scholar] [CrossRef] [Scilit]
- Cummings, A.L.; Aloisio, R.; Krizmanic, J.F. Modeling of the tau and muon neutrino-induced optical Cherenkov signal from upward-moving extensive air showers. Phys. Rev. D 2021, 103, 043017. [Google Scholar] [CrossRef] [Scilit]
- Adams, J.H., Jr.; Allard, D.; Alldredge, P.; Anchordoqui, L.; Anzalone, A.; Battisti, M.; Belov, A.A.; Bertaina, M.; Bertone, P.F.; Blin-Bondil, S.; et al. The EUSO-SPB2 fluorescence telescope for the detection of Ultra-High Energy Cosmic Rays. Astropart. Phys. 2025, 165, 103046. [Google Scholar] [CrossRef] [Scilit]
- Burmistrov, L. Terzina on board NUSES: A pathfinder for EAS Cherenkov Light Detection from space. EPJ Web Conf. 2023, 283, 06006. [Google Scholar] [CrossRef] [Scilit]
- Abdullahi, M.; Aloisio, R.; Ashurov, S.; Atalay, U.; Barbato, F.C.T.; Battiston, R.; Bertaina, M.E.; Bissaldi, E.; Boncioli, D.; Burmistrov, L.; et al. Progress status of the NUSES Space Mission. Adv. Space Res. 2025. [Google Scholar] [CrossRef] [Scilit]
- Olinto, A.; Krizmanic, J.; Adams, J.H.; Aloisio, R.; Anchordoqui, L.A.; Anzalone, A.; Bagheri, M.; Barghini, D.; Battisti, M.; Bergman, D.R.; et al. The POEMMA (Probe of Extreme Multi-Messenger Astrophysics) observatory. J. Cosmol. Astropart. Phys. 2021, 2021, 7. [Google Scholar] [CrossRef] [Scilit]
- Plebaniak, Z.; JEM-EUSO Collaboration. From Ground to Space: An Overview of the JEM-EUSO Program for the Study of UHECRs and Astrophysical Neutrinos. In Proceedings of the 39th International Cosmic Ray Conference, Geneva, Switzerland, 15–24 July 2025; p. 360. [Google Scholar]
- Battisti, M.; JEM-EUSO Collaboration. POEMMA-Balloon with Radio: A balloon-born multi-messenger multi-detector observatory. Nucl. Instrum. Methods Phys. Res. Sect. A 2024, 1069, 169819. [Google Scholar] [CrossRef] [Scilit]
- Abe, S.; Adams, J.H., Jr.; Allard, D.; Alldredge, P.; Anchordoqui, L.; Anzalone, A.; Arnone, E.; Baret, B.; Barghini, D.; Battisti, M.; et al. Developments and results in the context of the JEM-EUSO program obtained with the ESAF simulation and analysis framework. Eur. Phys. J. C 2023, 83, 1028. [Google Scholar] [CrossRef] [Scilit]
- Hamamatsu, Inc. MPPC Array, S13361-3050NE-08 Series. Product Specification. Available online: https://www.hamamatsu.com/eu/en/product/optical-sensors/mppc/mppc_mppc-array/S13361-3050NE-08.html (accessed on 1 January 2026).
- Di Salvo, A.; Garbolino, S.; Mignone, M.; Zugravel, S.C.; Rivetti, A.; Bertaina, M.E.; Palmieri, P.A. A Configurable 64-Channel ASIC for Cherenkov Radiation Detection from Space. Instruments 2023, 7, 50. [Google Scholar] [CrossRef] [Scilit]
- Di Salvo, A.; Garbolino, S.; Mignone, M.; Zugravel, S.C.; Palmieri, A.; Rivetti, A.; Bertaina, M.E. The MIZAR ASIC: 64-channel zone-sampling based ASIC for Cherenkov light detection from sub-orbital and orbital altitudes. Nucl. Instrum. Methods Phys. Res. Sect. A 2024, 1069, 169856. [Google Scholar] [CrossRef] [Scilit]
- Digilent, Inc. Genesys 2 Kintex-7 FPGA Development Board. Reference Manual. 2020. Available online: https://digilent.com/reference/programmable-logic/genesys-2/start (accessed on 1 January 2026).
- Xilinx, Inc. 7 Series FPGAs Data Sheet: Overview (DS180); Product Specification; Xilinx, Inc.: San Jose, CA, USA, 2018; Available online: https://docs.xilinx.com/v/u/en-US/ds180_7Series_Overview (accessed on 1 January 2026).
- Aim-TTi (Thurlby Thandar Instruments Ltd.). MX-Q & MX-QP Series 2 Instruction Manual (English). Issue 1; Covers MX100Q S2, MX100QP S2. Available online: https://resources.aimtti.com/datasheets/AIM-MX_Series_DC_Power_Supplies_Data_Sheet_EN_82100-1510-11.pdf (accessed on 1 January 2026).
- Keithley Instruments, LLC. Model 2400 SourceMeter® User’s Manual. Part Number: 2400-900-01 Rev. K. 2015. Available online: https://www.tek.com/en/products/keithley/source-measure-units/2400-standard-series-sourcemeter (accessed on 1 January 2026).
- Hewlett-Packard Company. Operating and Service Manual: HP 8012B Pulse Generator; Publication Number 8012B-90901; Hewlett-Packard Company: Palo Alto, CA, USA, 1980. [Google Scholar]

Disclaimer/Publisher’s Note: The statements, opinions and data contained in all publications are solely those of the individual author(s) and contributor(s) and not of MDPI and/or the editor(s). MDPI and/or the editor(s) disclaim responsibility for any injury to people or property resulting from any ideas, methods, instructions or products referred to in the content. |
© 2026 by the authors. Licensee MDPI, Basel, Switzerland. This article is an open access article distributed under the terms and conditions of the Creative Commons Attribution (CC BY) license.