


Abstract
In response to the urgent requirement for sustainable power supply for deep-sea or offshore underwater sensing equipment, this work investigates autonomous power generation aboard marine vessels. The vertical vibrations induced by wave excitation at the bottom of the vessel are utilized to drive the vibration energy harvesters on the deck for power generation. In a scenario involving automatic steering, a multiplicity of magnetoelectric harvesters mounted on the deck would move vertically in response to surface wave motion, enabling continuous conversion of wave energy into electrical power. The key feature of this study is that the ship-based self-power generation system is simple to install and safe, with the vibration energy harvesters mounted above the sea surface to avoid the unpredictable underwater sea conditions. This study presents a numerical case analysis of a three-magnet energy harvester designed to generate induced electrical power under wave conditions characterized by a speed of V = 3.0 m/s, amplitude of Zo = 0.4 m, and wavelength of λ = 2.0 m. Prior to optimizing the ship-based energy harvester, the mathematical model of a three-magnet vibration system was validated against experimental data to ensure accuracy. Subsequently, a sensitivity study was performed to evaluate the influence of wave parameters (e.g., amplitude and wavelength) and the harvester’s geometric parameters on the electrical power output. To maximize power generation, the flower pollination algorithm—an efficient bio-inspired optimization method known for its robustness in global search—was integrated with the objective function defined as the root-mean-square electrical power. Simulation results indicate that the optimized harvester is capable of producing up to 0.1943 W. These findings highlight the potential of ship-based energy harvesters as a sustainable and reliable source of electrical power.
1. Introduction
Over the past decade, petroleum and natural gas exploration has increasingly shifted to offshore sea beds. Monitoring subsea pipelines for leaks via deep-sea sensors deployed on the ocean floor is essential for protecting the marine environment. However, these sensors are heavily dependent on battery power, and in deep-sea settings, the regular replacement of batteries is extremely difficult. Accordingly, there is a critical need for sustainable electrical power sources for long-term subsea monitoring.
Two primary classes of passive vibration-based electricity generation systems have been developed: cantilever-type systems [1,2,3] and mass-spring systems [4,5,6]. Cantilever systems—often employed in MEMS devices—are most effective under small vibration amplitudes and at relatively high frequencies [7]. Conversely, mass-spring systems are better suited for energy extracting from low-frequency vibrations with large displacements. For example, Stephen [8] proposed an ambient air vibration-driven energy harvesting system. Kimoulakis et al. introduced onshore linear generators that convert wave motion into electrical energy via buoys and permanent magnets [9]. However, almost all such electromagnetic generators are designed for land applications and are not suitable for powering subsea sensors.
Farshidianfar and Nabavi [10], along with Safian and Soleimani [11], have proposed electrical generators that harness piezoelectric power by means of buoyancy-driven forces from offshore buoys and ocean waves. Nazari et al. [12] also developed a buoy-based piezoelectric energy system, finding that its electrical output depends strongly on buoy geometry and is substantially constrained by the low-frequency undulations characteristic of ocean currents. In earlier work, Chiu et al. [13] introduced a sustainable energy harvester deployed on the seabed; in that system, ocean currents exerted thrust to drive a piston-type device, which converted motion into electromagnetic energy via magnets, springs, and coils. However, despite this innovative design, the generated electricity was found to be insufficient, owing to the relatively weak current thrust near the ocean floor.
Ocean currents represent a promising source of renewable energy owing to their substantial hydraulic potential. Chiu [14] developed an energy harvesting system in which a buoy, oscillating with wave motion, drives a long rod connected to magnets that reciprocate within a coil-surrounded channel, thereby inducing electrical power. However, this design did not account for the structural endurance of the pod under intense deep-sea currents. To address this limitation, Chiu et al. [15] proposed an underwater generator to replace conventional magnetic induction harvesters. In this configuration, the long rods were substituted with cables, enabling intermittent power generation through unidirectional rotation of a generator actuated by the buoy-driven cable motion. Nonetheless, lateral forces exerted by ocean currents on the cables were found to reduce the efficiency of induction-based power generation in the subsea environment. To address the aforementioned limitations, Chiu and Cheng [16,17] and Chiu et al. [18] have proposed a series of linear or rotational magnetoelectric energy harvester devices, fixedly installed on platforms or embankments above lakes or the sea to avoid unpredictable water flow risks beneath the surface. However, these fixed wave energy harvesters are limited to specific areas for power generation and cannot supply electricity to other locations. To overcome the limitations of fixed wave-based charging, Chiu and Cheng [19] proposed a ship-based autonomous charging device that integrates wave height differences with a buoy, a rocker arm, and a generator. Subsequently, Chiu and Cheng [20] introduced a shipboard self-powering system employing a vertically oriented reciprocating magnetoelectric harvester connected via spherical bearings and installed within the vessel’s cabin. However, the ref. [19] wave energy harvesting device combining wave height differences, a buoy, a rocker arm, and a generator occupies a large area of the deck, restricting deck activities. The externally mounted buoys and rocker arms also pose potential risks to the vessel’s navigational safety. On the other hand, the ref. [20] installation of a vertically oriented reciprocating magnetoelectric harvester within the cabin is constrained by the limited interior space.
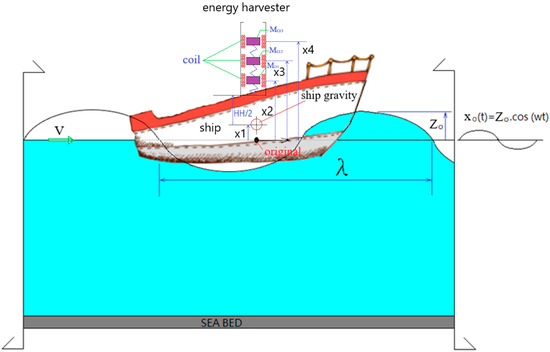
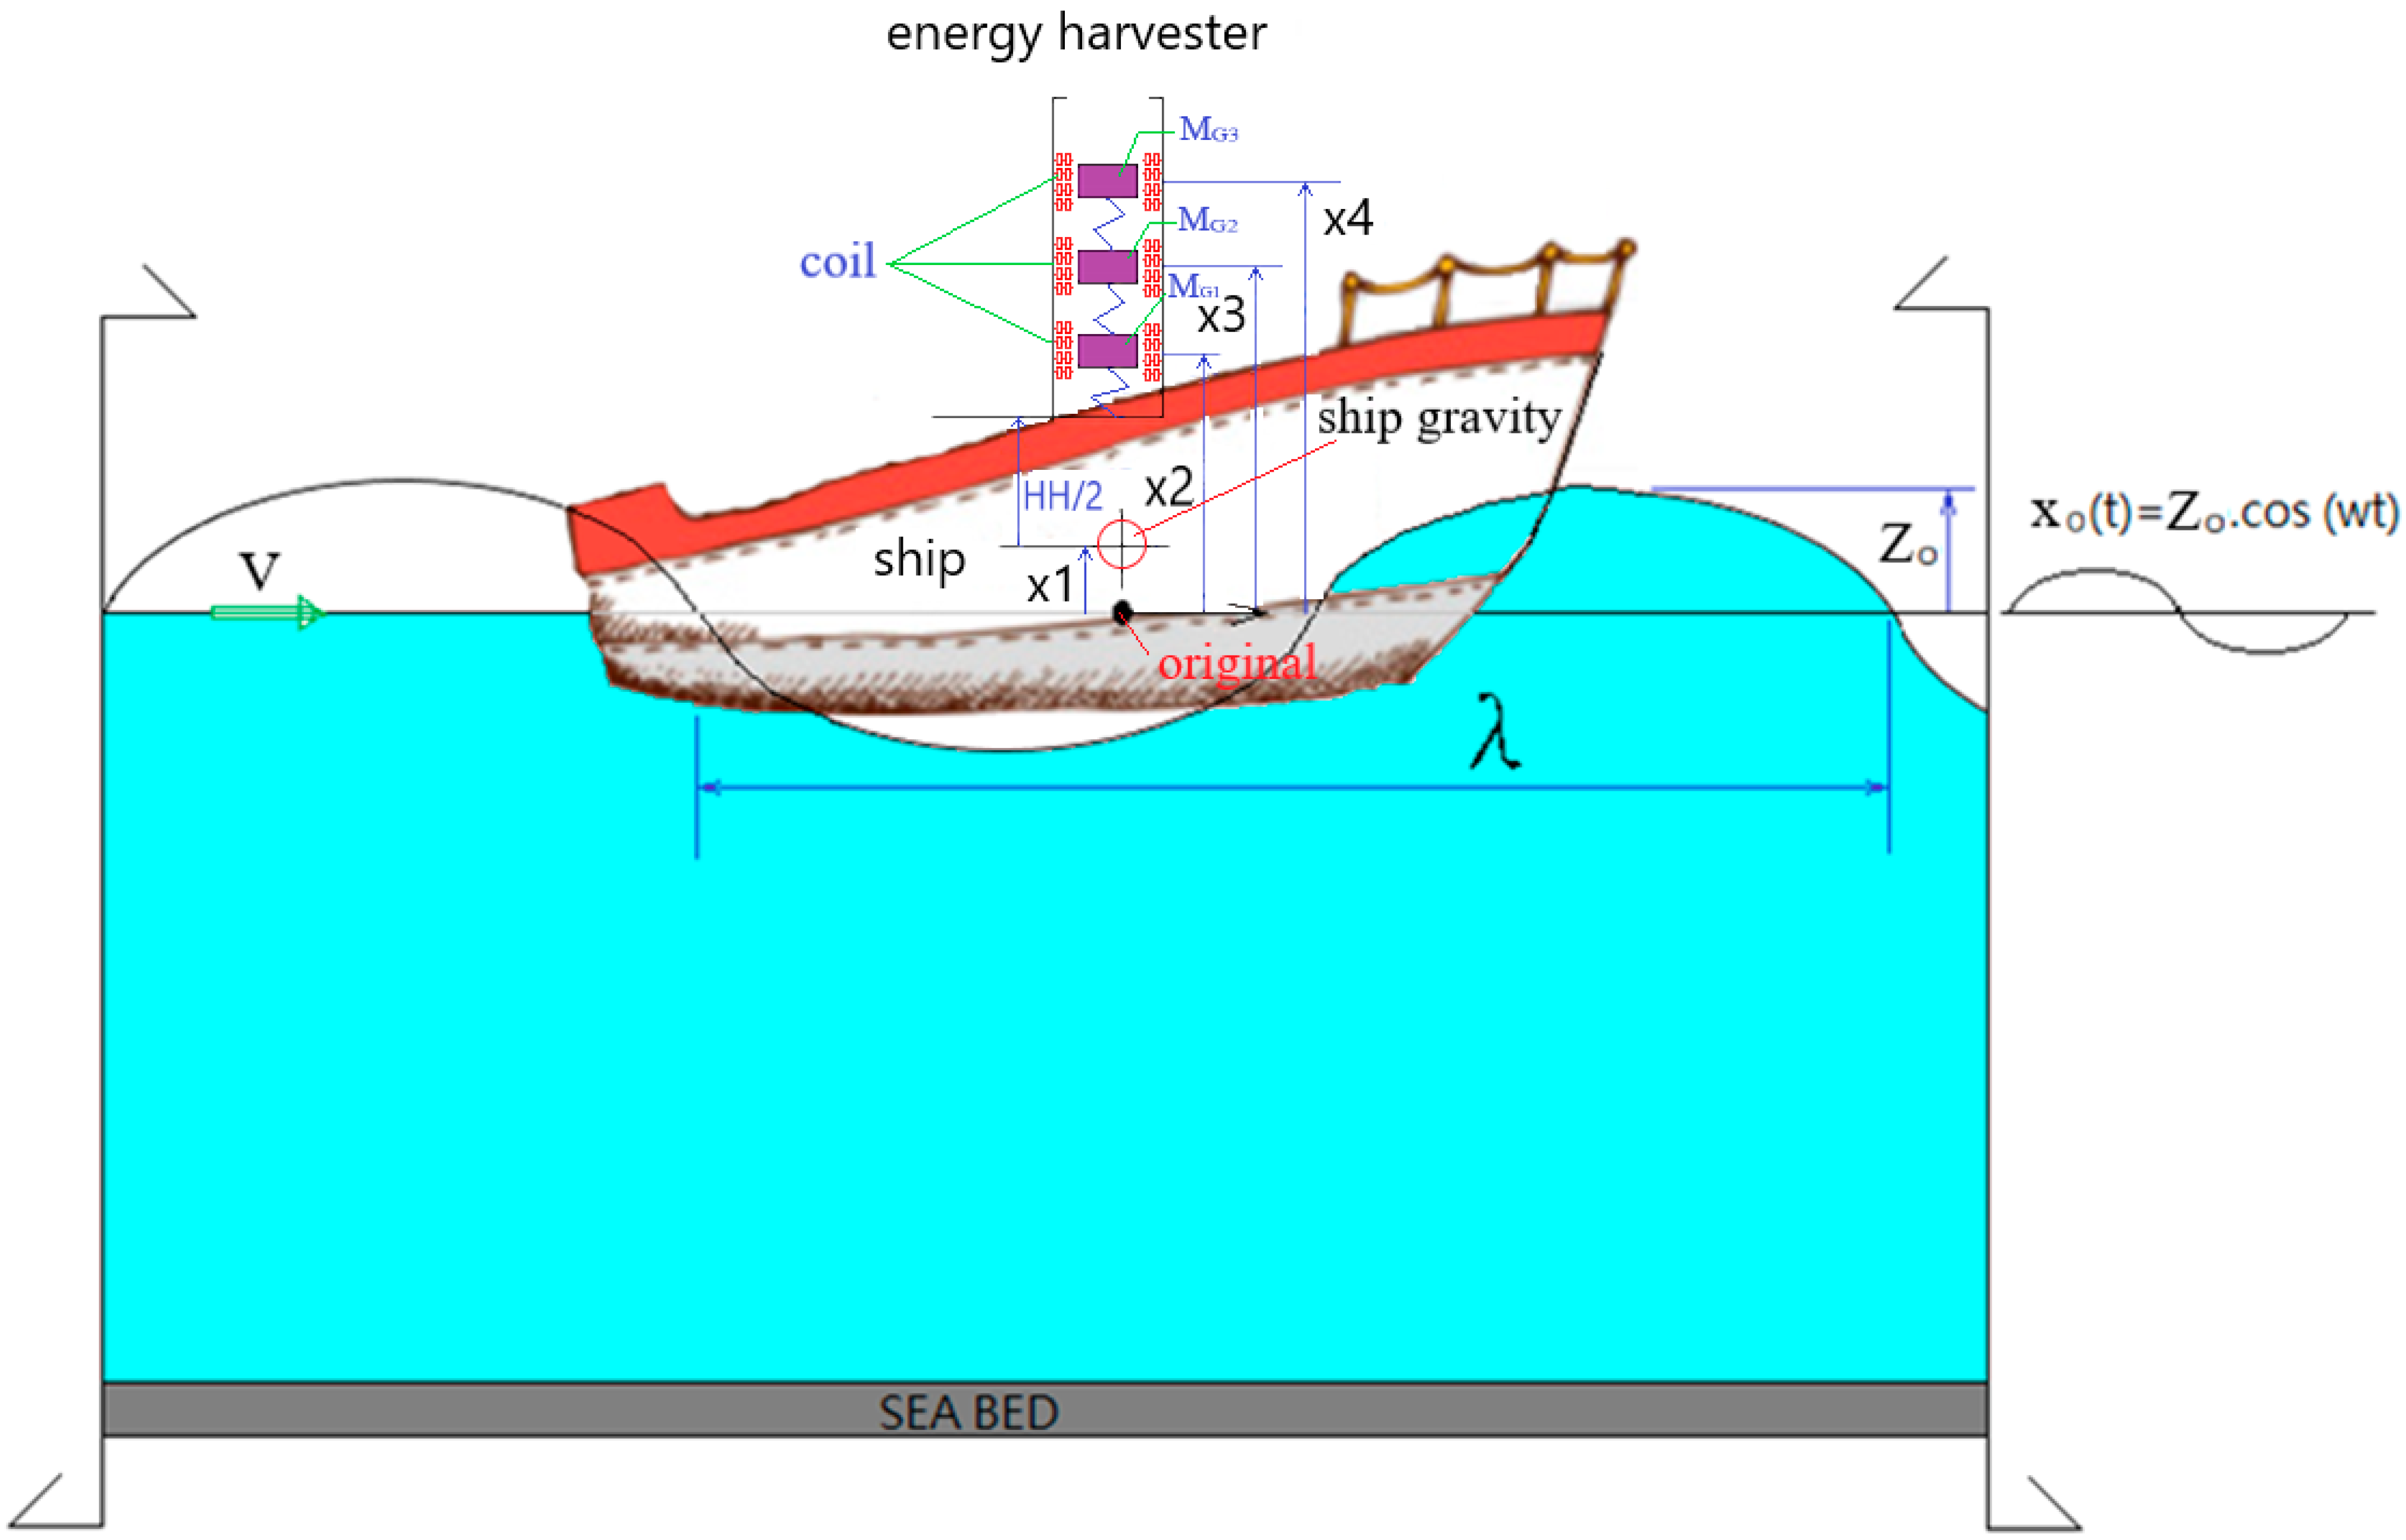
To overcome the aforementioned limitations, this study proposes a ship-based self-powered design that does not interfere with deck operations and navigational safety, is easy to install, and is not limited by cabin space. As shown in Figure 1, a ship-mounted energy harvesting device is developed that utilizes the bottom excitation of the vessel induced by wave motion to generate sustainable electrical power in offshore environments. By placing the energy harvesting components above the sea surface, the proposed design avoids the unpredictable and harsh underwater environmental conditions reported in refs. [14,15]. Moreover, the device is easy to install and does not interfere with operations on either the deck or within the cabin (refs. [19,20]). Specifically, a novel three-magnet energy harvester is mounted on the ship’s deck; the vessel’s motion induced by surface waves causes vertical oscillation. The three magnets, surrounded by three sets of coils, move relative to the base of the harvester, producing variations in magnetic flux that generate electrical power.
Figure 1.
An energy harvester with three magnets mounted on the ship deck and subjected to periodic vertical excitation by surface waves.
This study develops a mathematical model of an autonomous, ship-based wave power generation system. To maximize the electrical output of the energy harvester, optimization of its design is essential. For this purpose, the flower pollination algorithm (FPA), a new heuristic optimization approach method inspired by natural pollination processes, is employed. In nature, pollination occurs primarily through two mechanisms: cross-pollination and self-pollination [21]. Cross-pollination, facilitated by birds or insects, represents a global search process by transferring pollen between distant plants, whereas self-pollination, driven by wind or local dispersion, corresponds to a local search process within nearby flowers of the same plant. The FPA models these biological processes as global and local pollination strategies, respectively. Owing to its simplicity, minimal parameter requirements, and ease of implementation, the FPA has attracted considerable attention in recent years. Accordingly, it is adopted in this study to optimize the performance of the proposed ship-based energy harvesting device. The initial target application of this study is to supply power to deep-sea sensors (as stated in the abstract), with a target power output of 0.5–1 W.
The structure of this paper is as follows:
Section 1. Introduction; Section 2. Mathematical Background (Section 2.1: Bottom Excitation Motion of the Ship; Section 2.2: Dynamic System Model of the Ship Energy Harvester; Section 2.3: Electrical Power Based on Magnetoelectric Induction); Section 3. Experimental Validation of the Vibration-Based Ship Energy Harvester Model; Section 4. Sensitivity Analysis; Section 5. Flower Pollination Algorithm (Section 5.1: Flower Pollination Algorithm Theory; Section 5.2: Numerical Comparison Between the Flower Pollination Algorithm and the Simulated Annealing Method; Section 5.3: Range Settings of Flower Pollination Algorithm Control Parameters in the Optimization Process; Section 5.4: Case Studies); Section 6. Results and Discussion (Section 6.1: Results; Section 6.2: Discussion); Section 7. Conclusions.
2. Mathematical Background
In this study, the ship is assumed to be a rigid body, and the ocean waves acting on it are considered as surface waves. The surface waves are simplified as a cosine function, as shown in Figure 1. It is assumed that the ship’s center of gravity lies on the horizontal plane. The ship is subjected to vertical excitation from the waves beneath it, resulting in bottom excitation of the rigid body. The damping coefficient CC can be expressed as the sum of the mechanical damping (CCm) and the damping (CCe) generated by the electromagnetic effect of the coil and magnet MG, thereby yielding the equivalent damping value.
2.1. Base-Excitation Motion
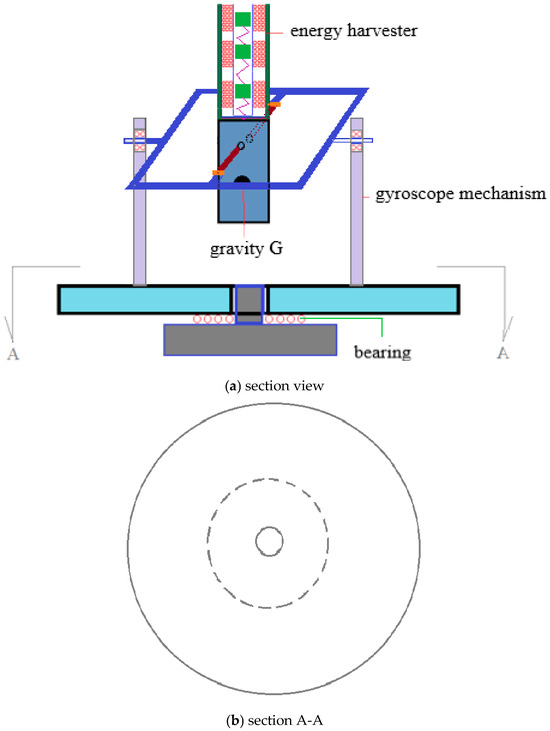
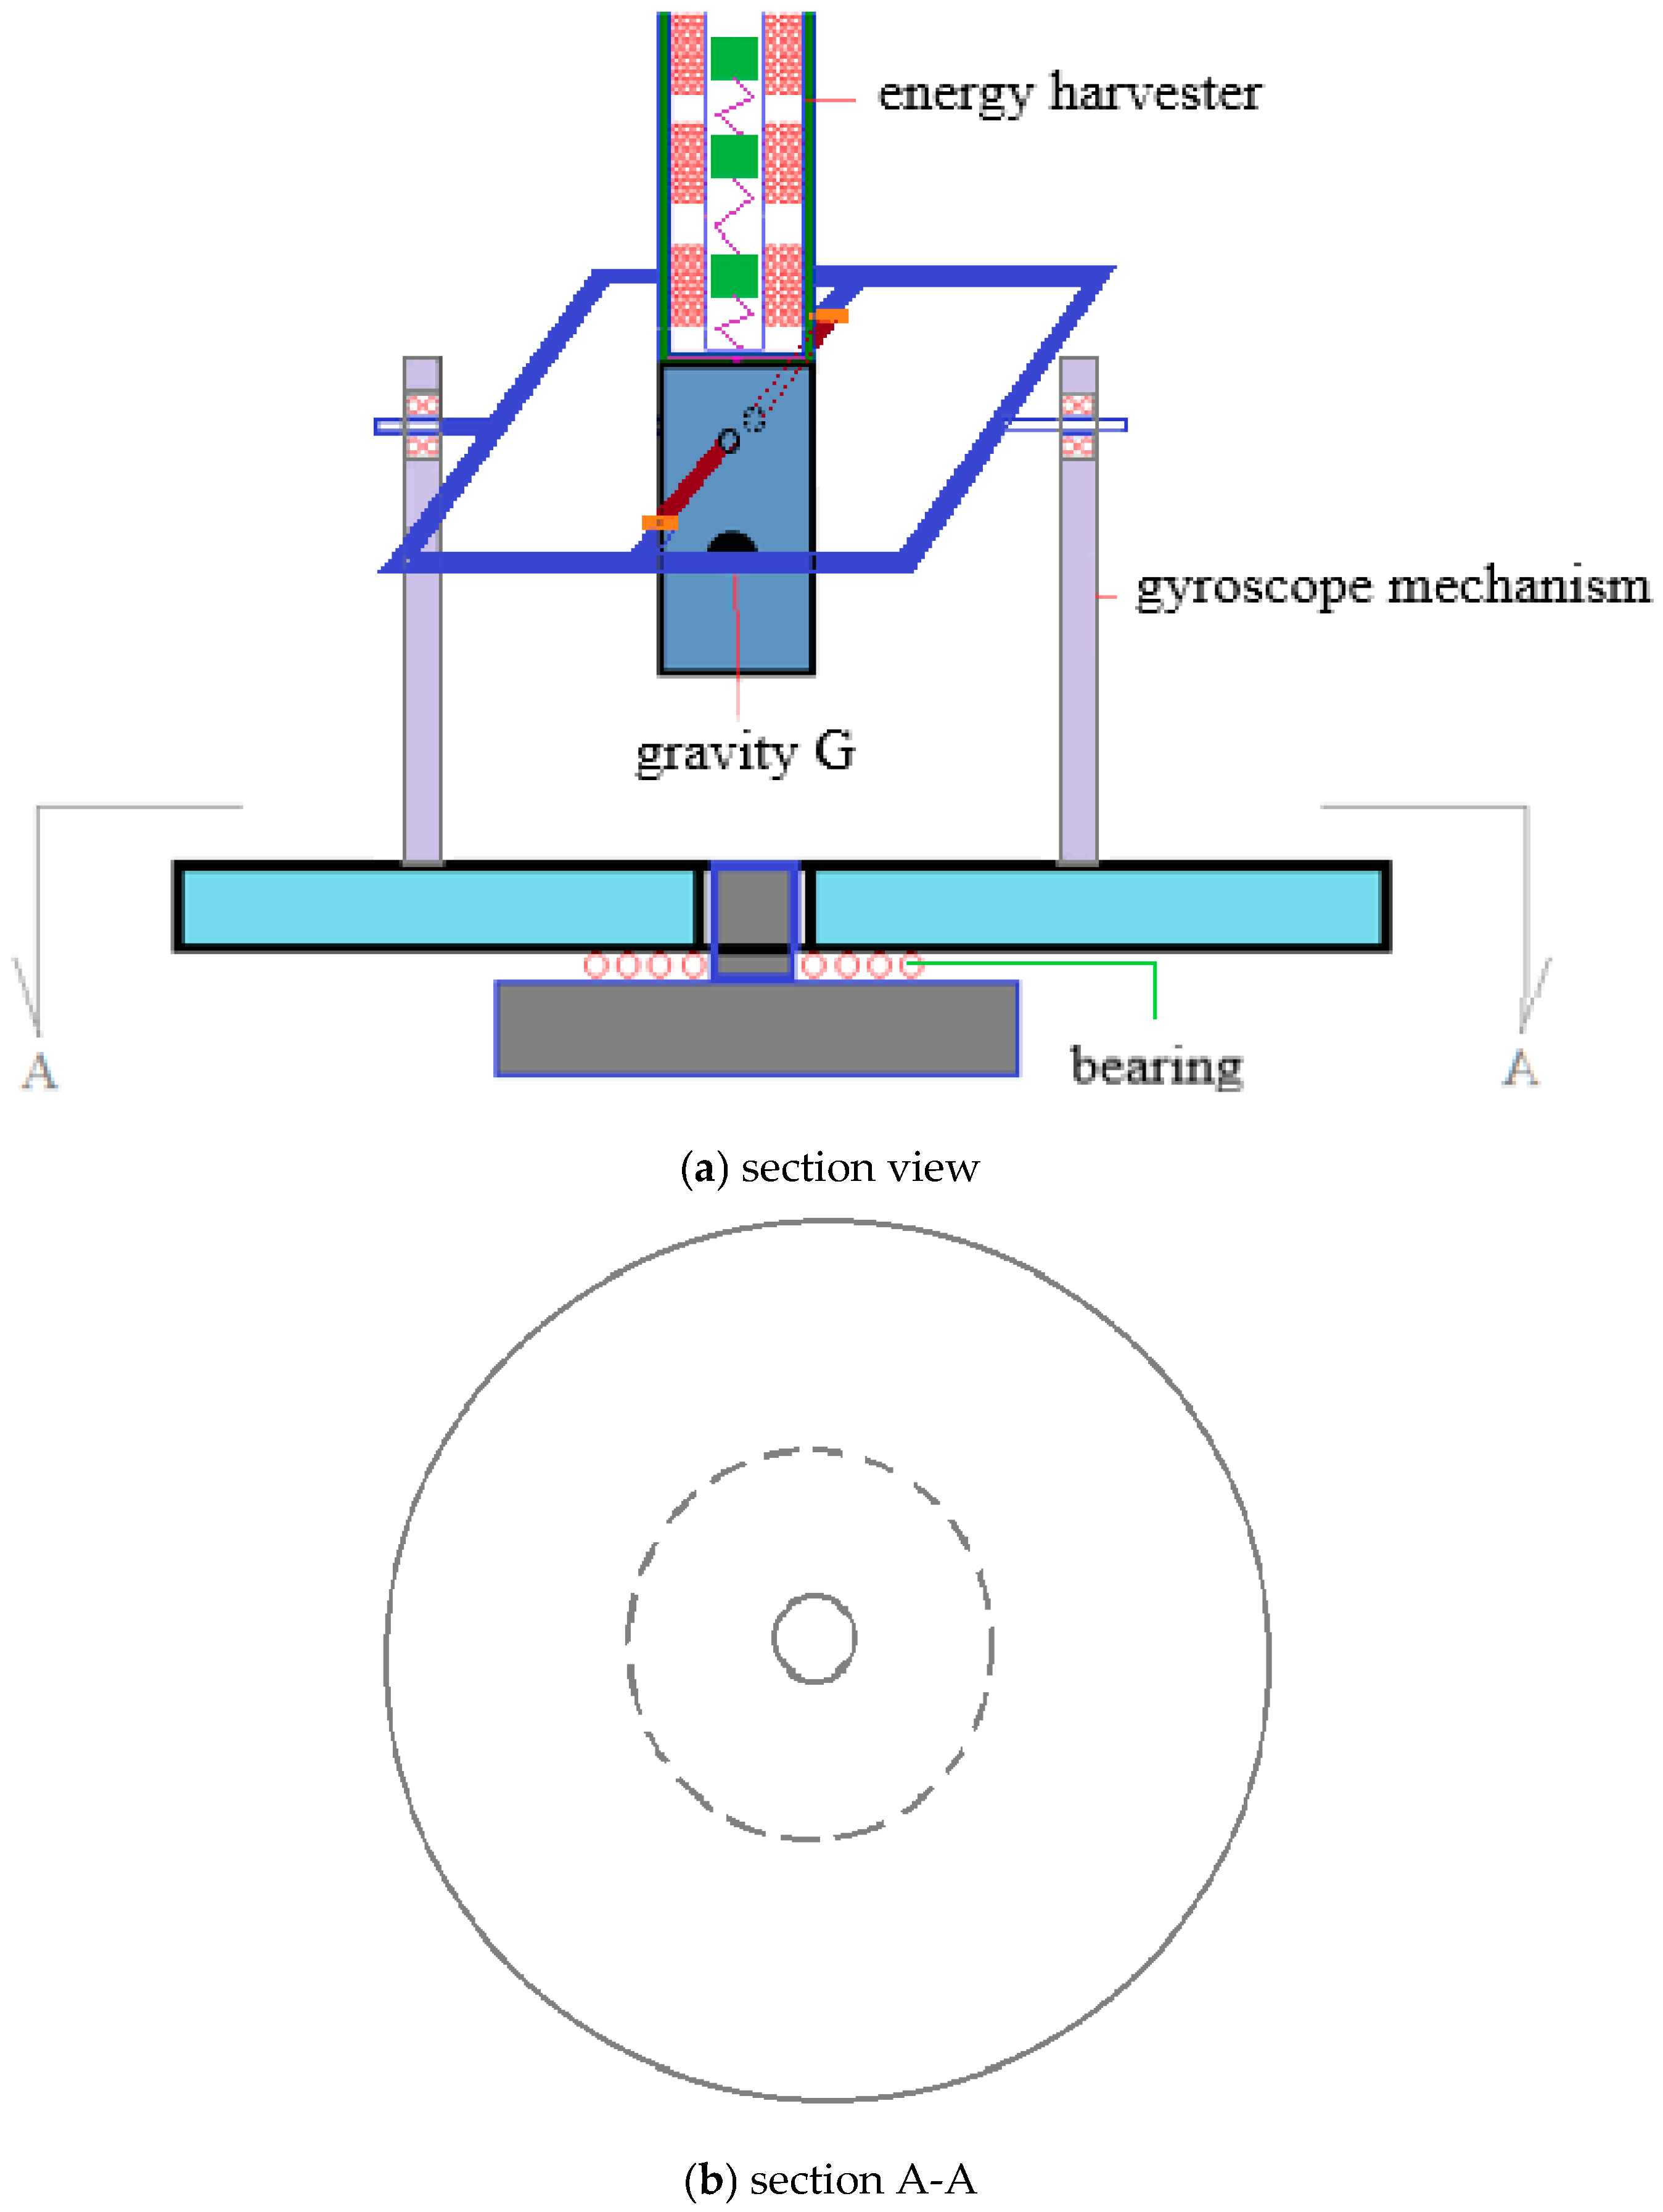
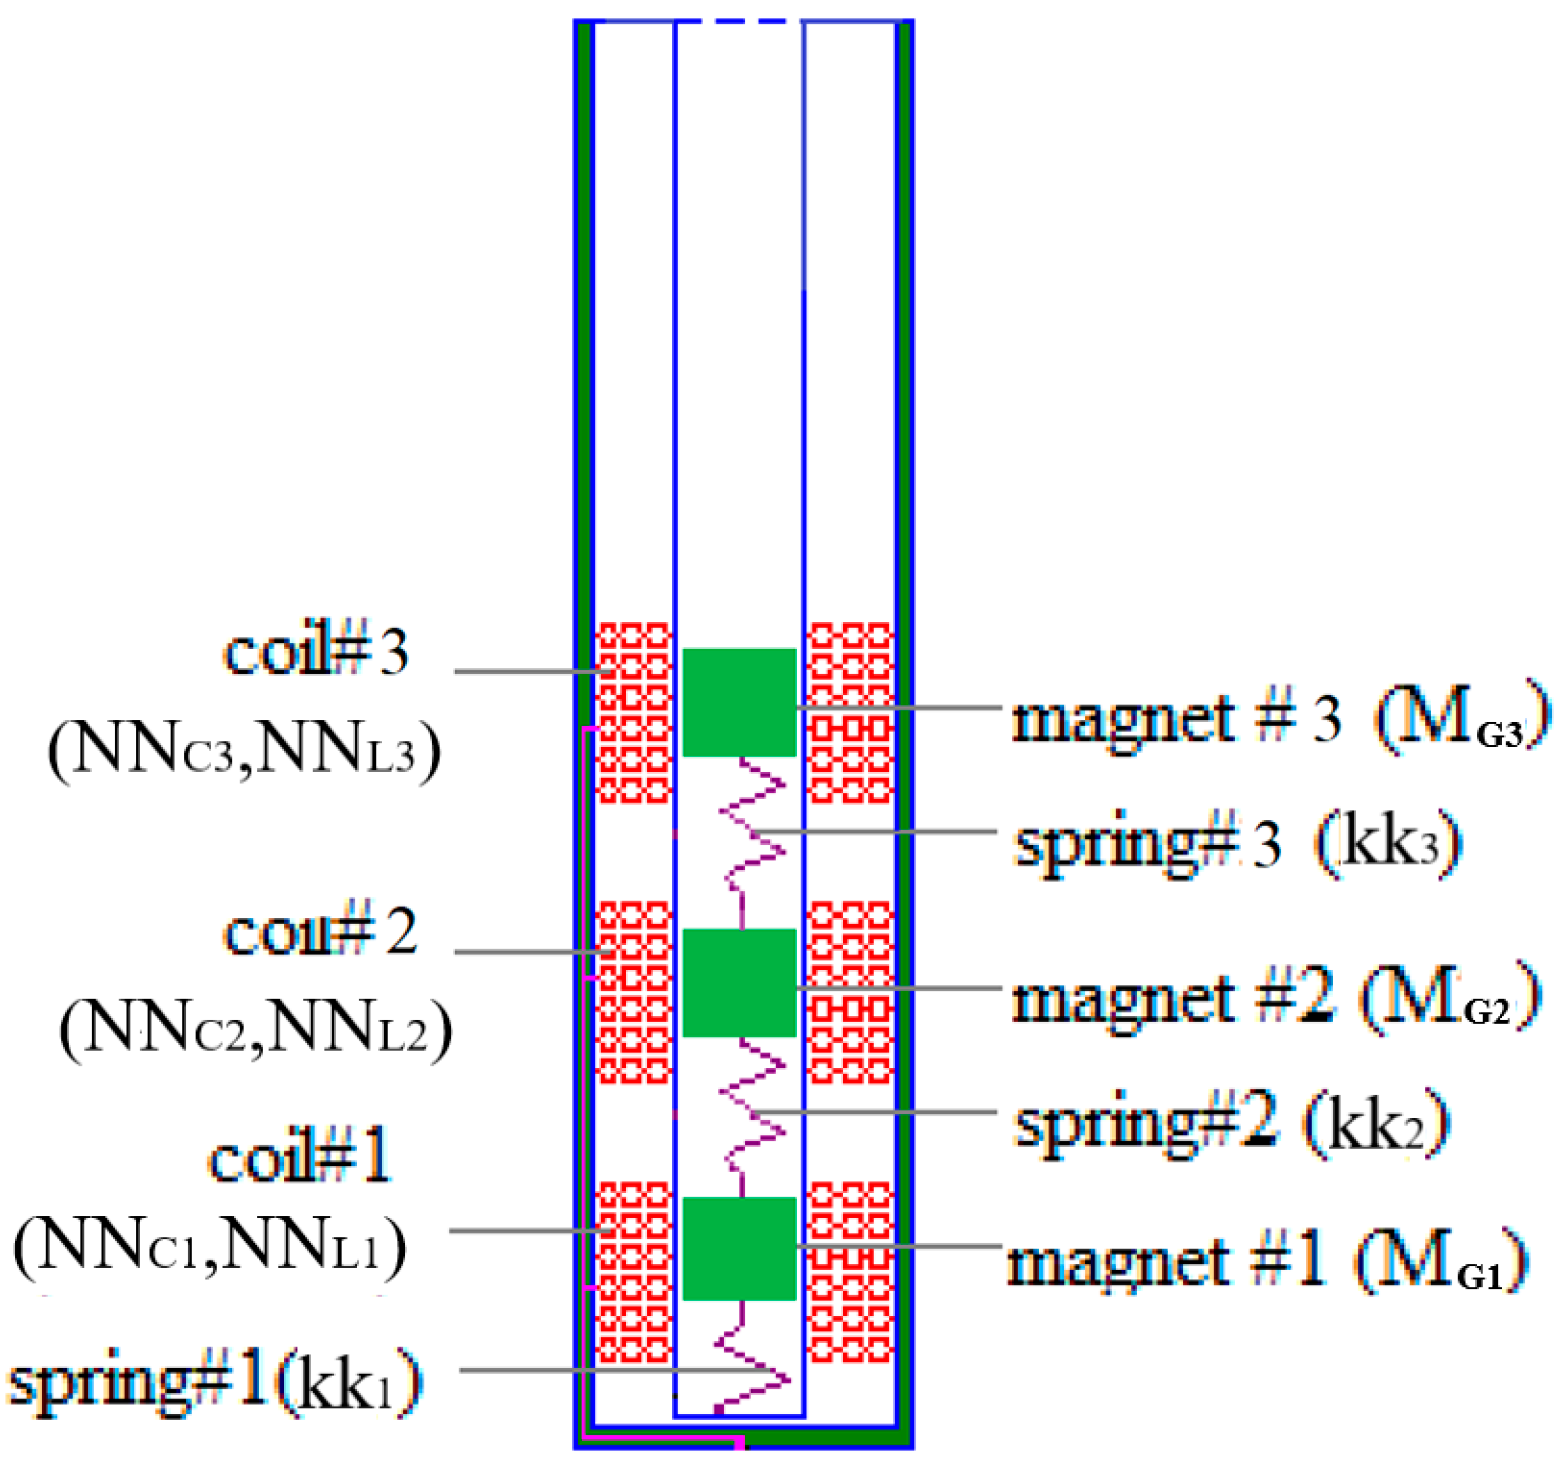
As illustrated in Figure 1, an energy harvester with three magnets is mounted on the ship deck and is activated by surface waves, causing periodic vertical motion. The harvester is installed on a gyroscope-type base (Figure 2) to maintain its orientation strictly vertical. Consequently, as the ship moves with the waves, the device (shown schematically in Figure 3) undergoes corresponding up-and-down actuation, ensuring that the three magnets oscillate relative to the base and thus induce electrical power through magnetic flux variation.
Figure 2.
An energy harvester mounted on a gyroscope-type base on the ship’s deck.
Figure 3.
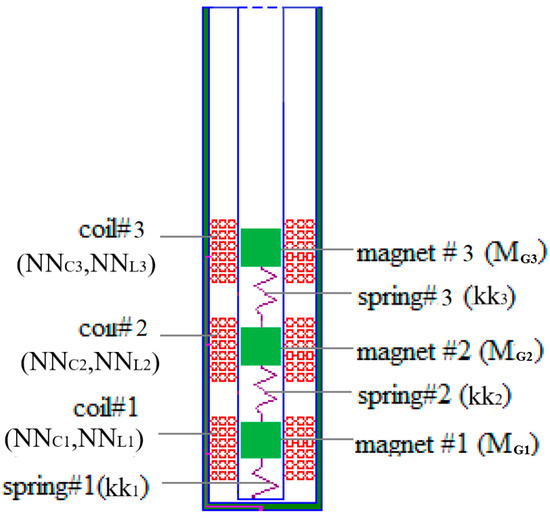
Diagram of an energy harvester with three magnets.
The motion due to base excitation caused by surface waves is expressed as follows:
Here, V denotes the speed of wave, and λ represents the wavelength.
2.2. Dynamic System Model
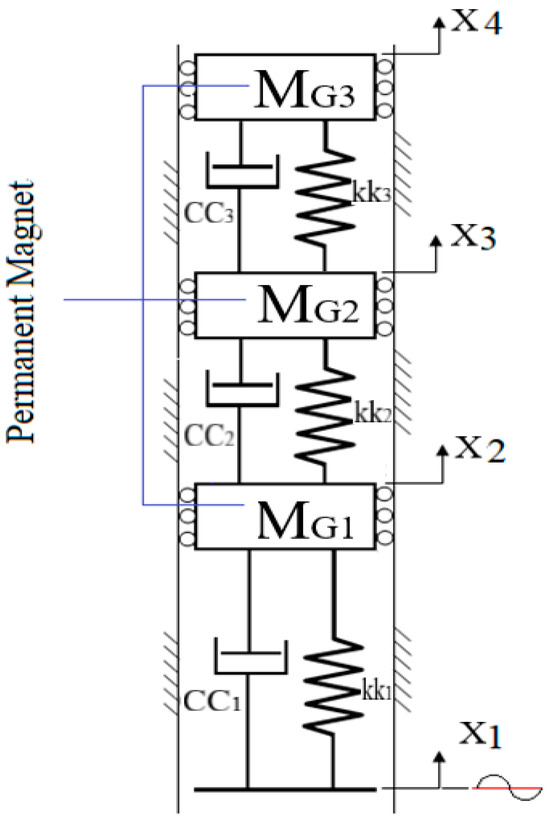
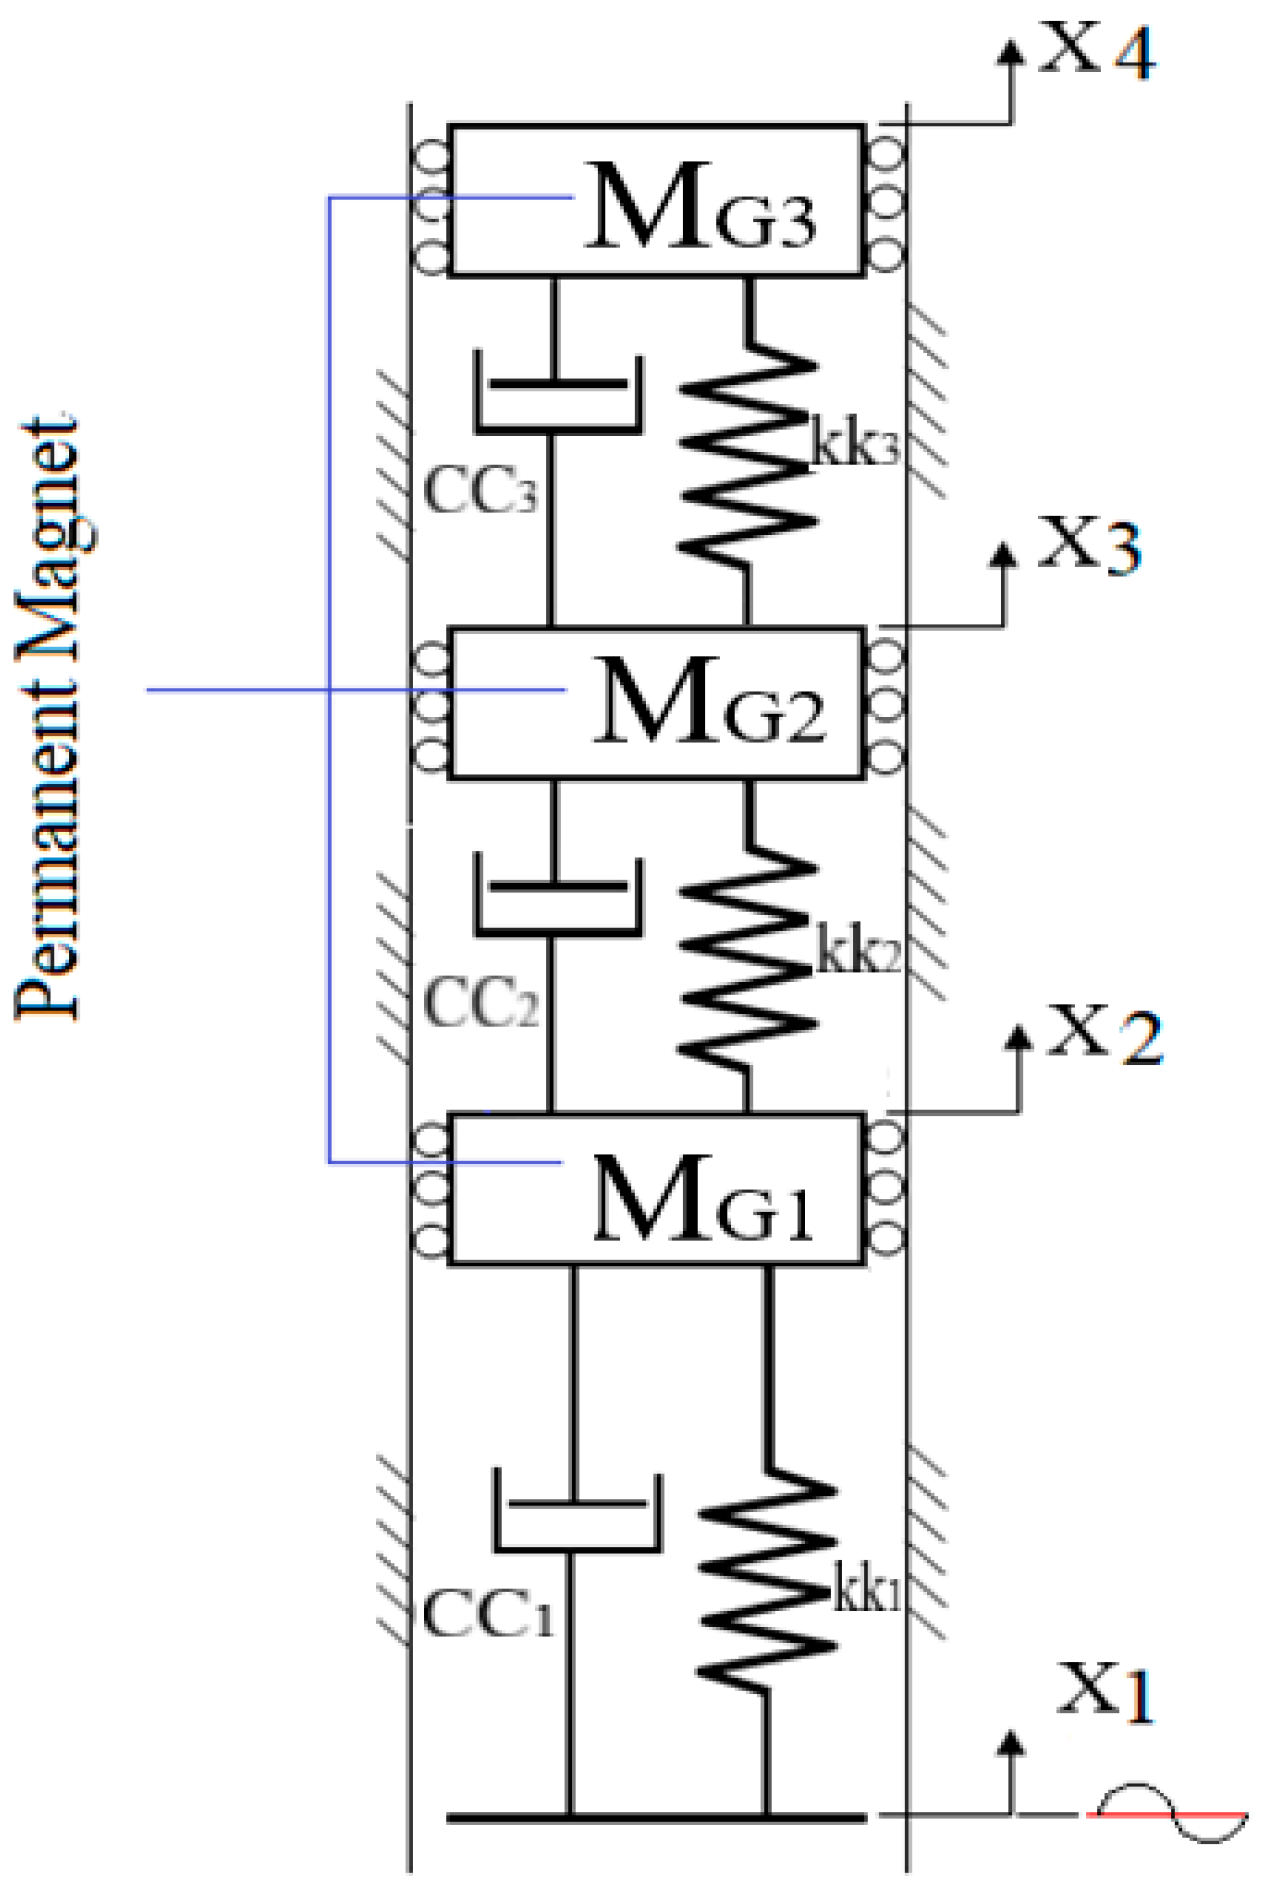
An illustration of the mathematical model of the three-magnet energy harvester is shown in Figure 4.
Figure 4.
A scheme of an energy harvester with three magnets.
The energy equations for the ship-based energy harvesting device, excited by waves inducing periodic vertical motion, can be expressed as follows:
Here, TT, VV, and DD denote the kinetic, potential, and damping energies, respectively. By defining the Lagrangian as LL = TT − VV and applying the Lagrange equations, we obtain
Here, Ri(t) denotes the applied force corresponding to the i-th degree of freedom. Substituting Equation (2) into Equation (3) and rearranging in matrix form yields
As derived in Supplementary Material Section S1, the displacements x2(t), x3(t), and x4(t) are given by
The relative displacement of magnet #1 (MG1) with respect to the device base is expressed as
Similarly, the relative displacement of magnet #2 (MG2) with respect to the device base is expressed as
Likewise, the relative displacement of magnet #3 (MG3) with respect to the device base is given by
2.3. Electromagnetic-Based Electricity [13,14,19]
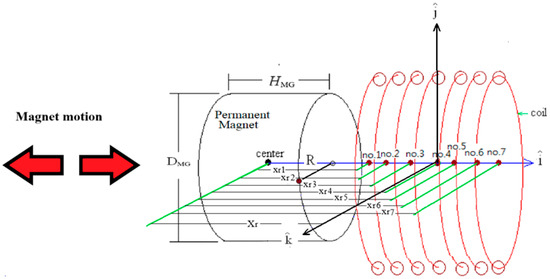
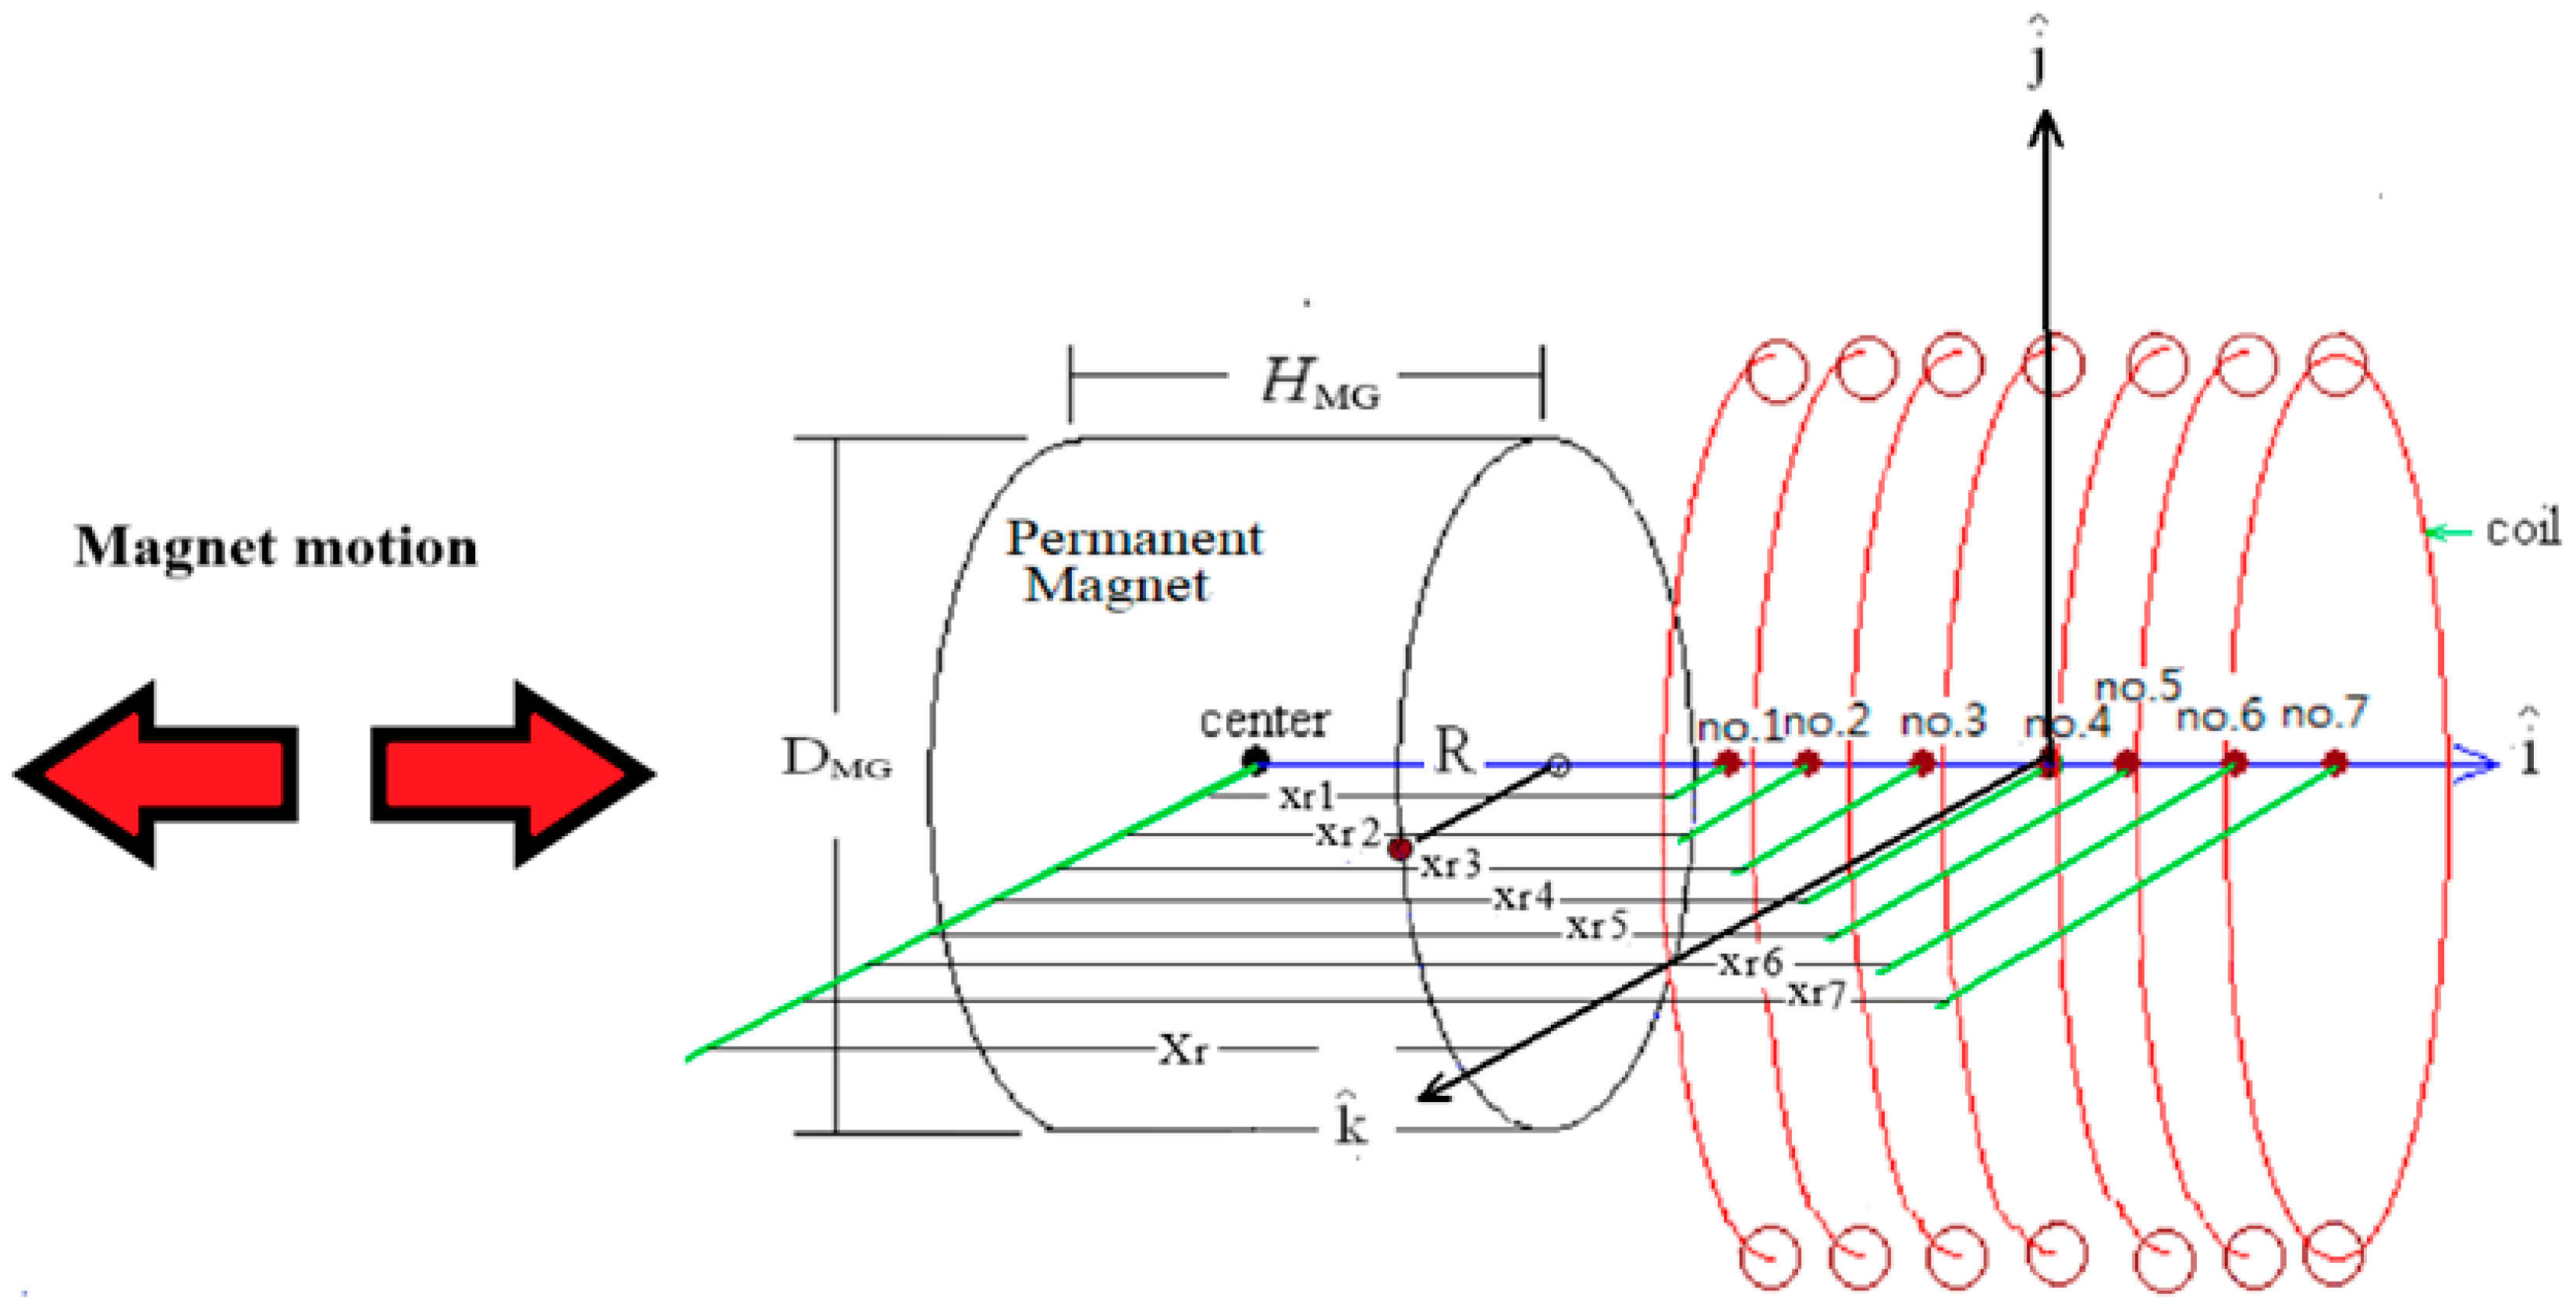
The arrangement of the coils surrounding the j-th magnet, comprising NNCj turns, is illustrated in Figure 5. As derived in Supplementary Material Section S2, accounting for NNL1 coil layers, the electrical voltage induced by the k-th coil turn is given by
Figure 5.
The allocation of coil surrounding magnet with NNCj turns.
The induced voltage generated by the relative motion between the h-th magnet and the j-th coil set at the h-th coil turn is given by
The total electrical voltage induced in the j-th coil set is the sum of the voltages induced in all coil turns. Thus, T(j) is given by
Considering the number of coil layers NNL(j) in the j-th coil set, the total electrical voltage T(j) and current IT(j) of the j-th coil set are given by
The root-mean-square (RMS) voltage of the j-th coil set is given by
The total RMS voltage is given by
Here, nn denotes the number of magnets.
The corresponding electrical power can be expressed as
Moreover, the corresponding electrical power in root-mean-square (RMS) terms can be determined as
3. Vibration-Based Ship’s Energy Harvester Model Verification
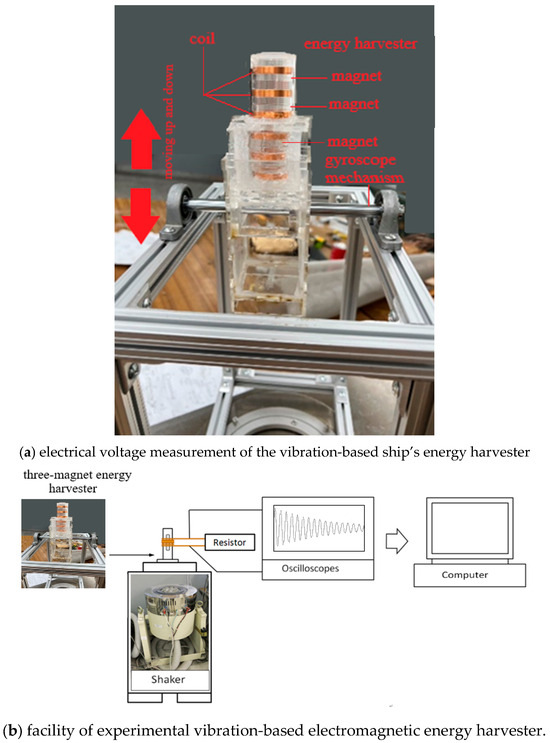
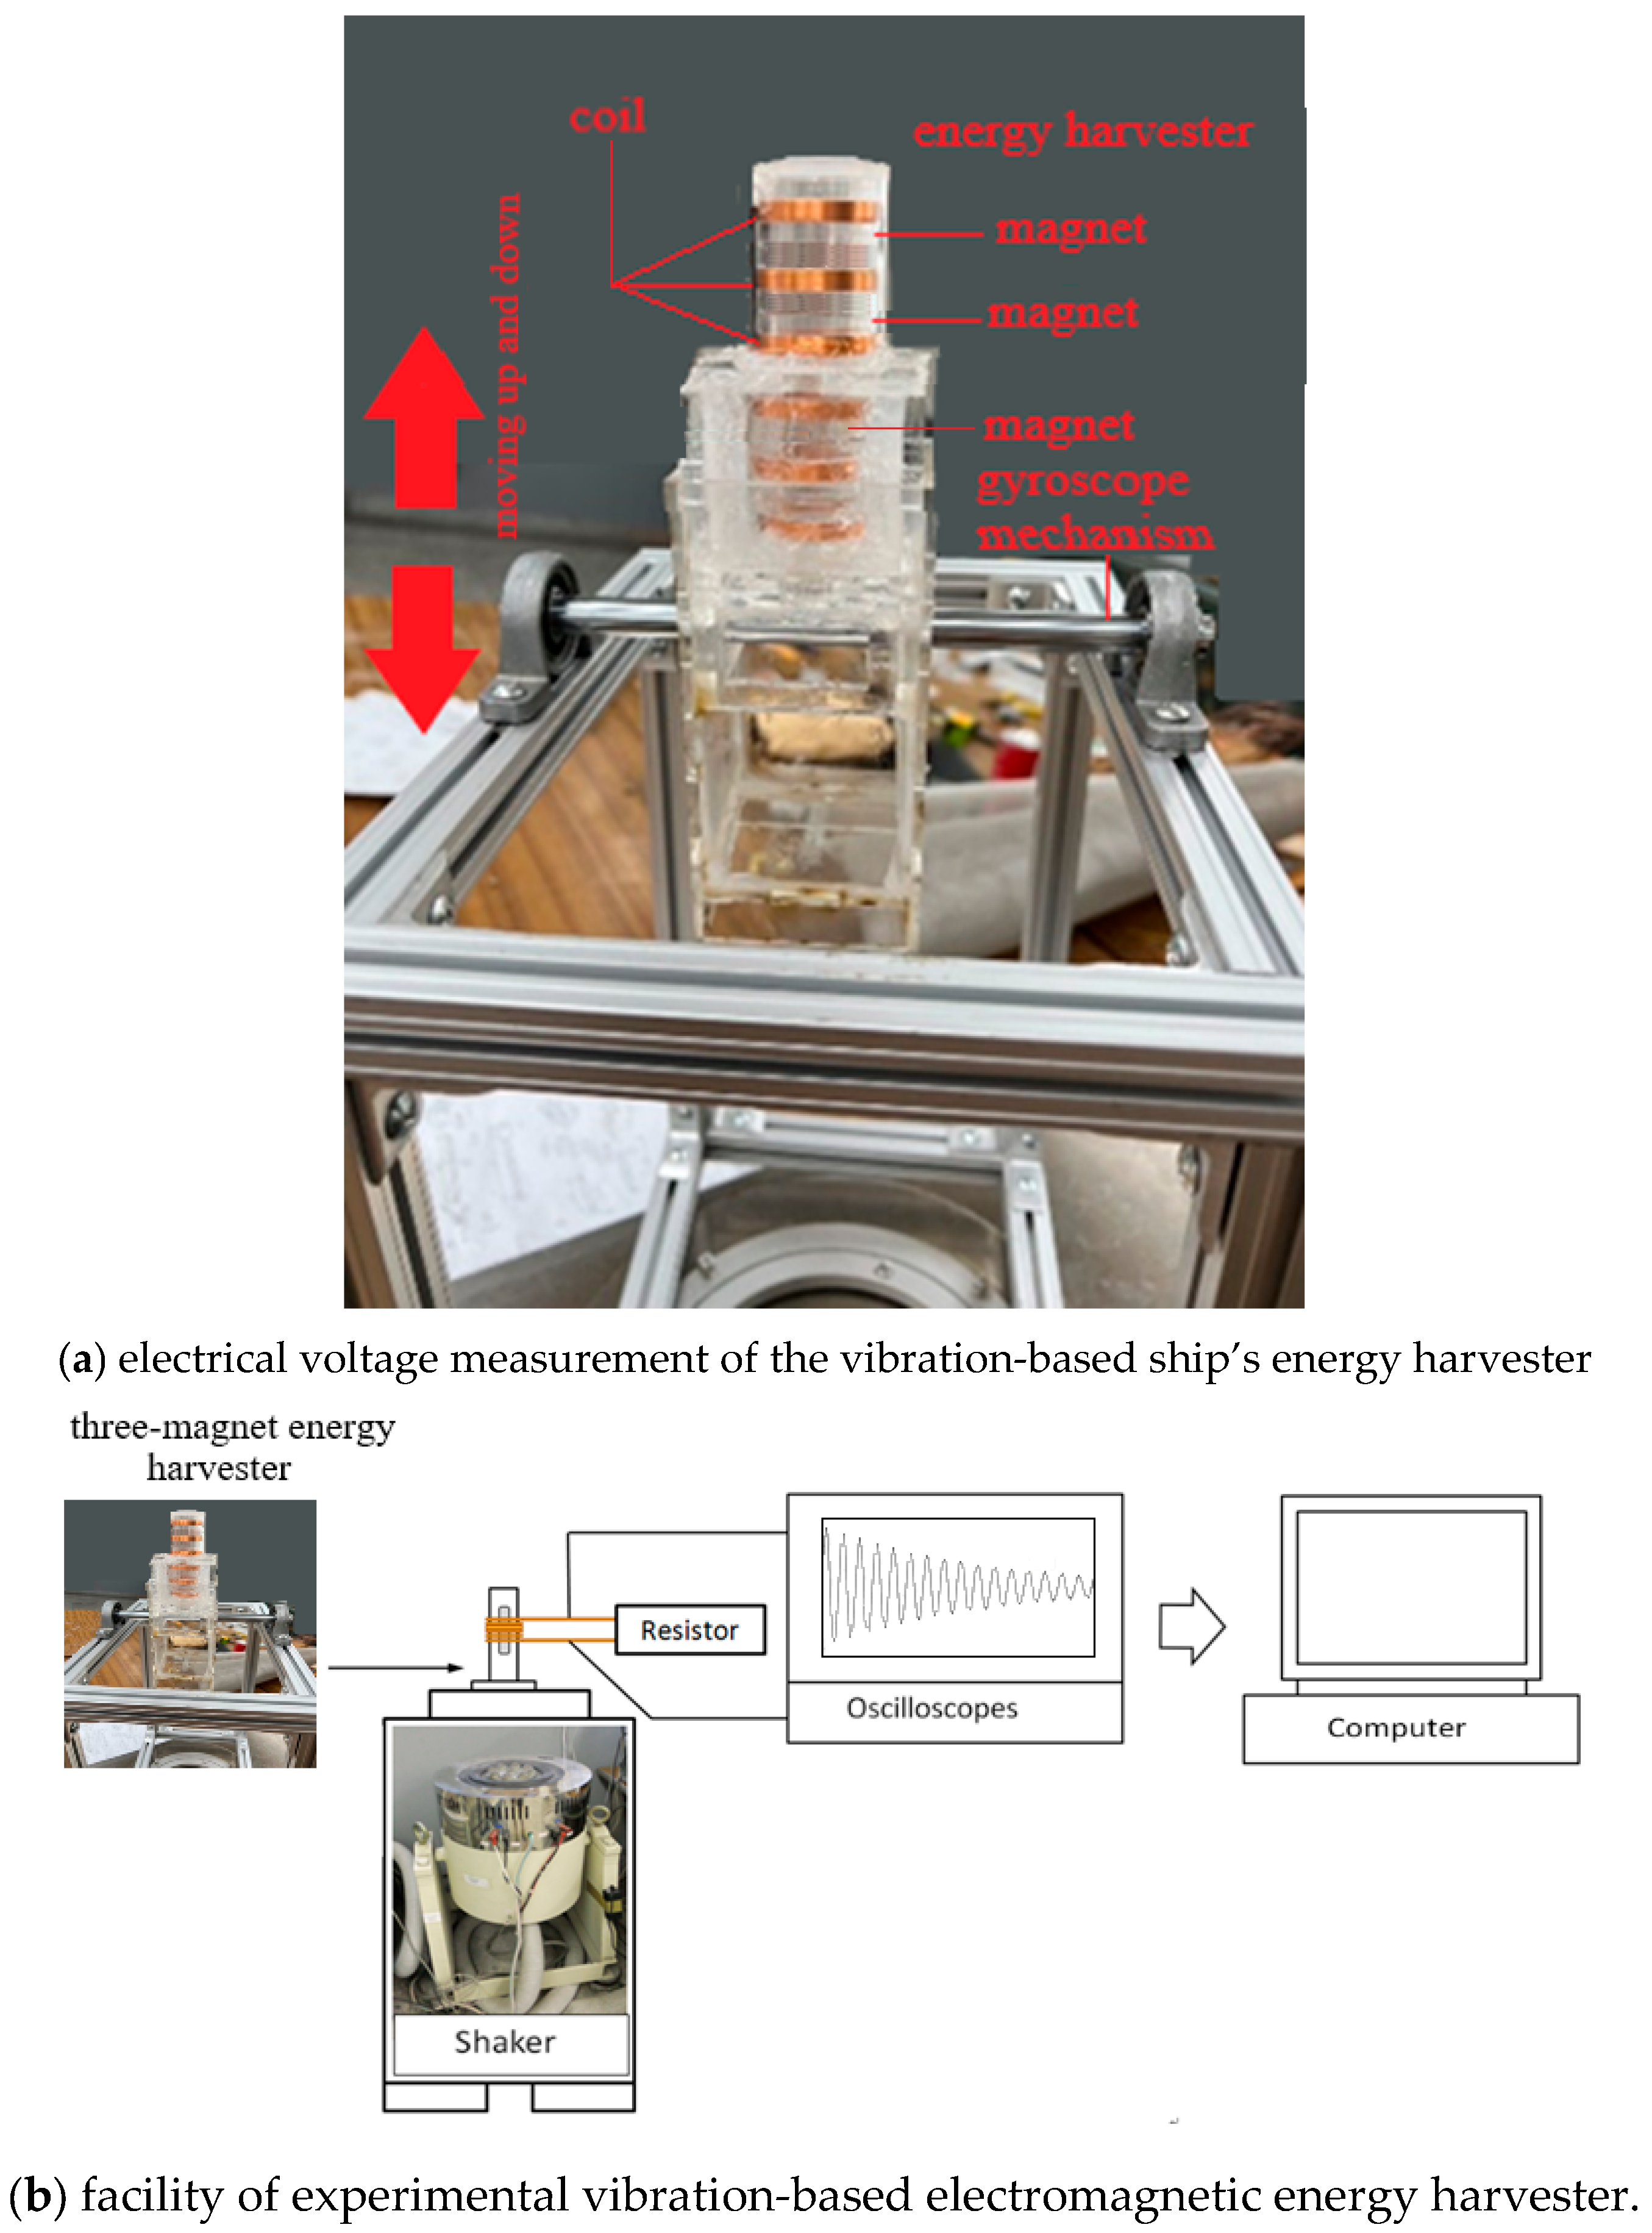
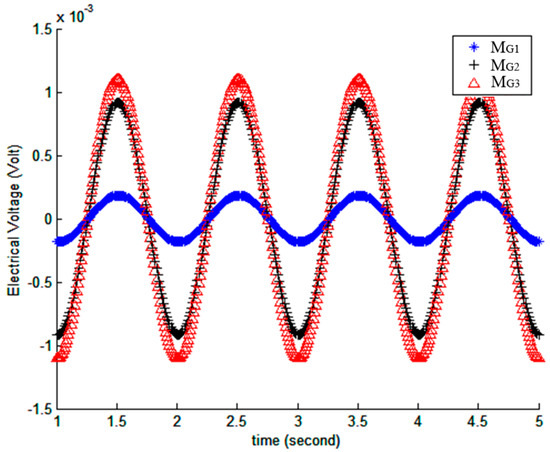
As shown in Figure 6a,b, the experimental setup comprises an electrical power generation system. A gyroscope mechanism mounted on the boat deck is employed to support the energy harvester, while the boat undergoes periodic vertical motion. To measure the harvested vibrational energy, a shaker connected to the energy harvester is used to simulate the wave motion. The energy harvester consists of three magnet sets, each surrounded by a corresponding coil set. Each coil contains 42 turns, and each magnet has a diameter of 0.02 m and a height of 0.02 m. The spring stiffness is 392 N/m. A test case with a wave amplitude Zo = 0.3 m and an angular frequency of 1 Hz is performed, and the resulting peak electrical voltage is detected to be 0.0025 V. Thereafter, the theoretical electrical voltage is calculated using Equations (10)–(14), and the results are presented in Figure 7. The figure indicates that the peak total electrical voltage is 0.0024 V. In comparison of peak electrical voltage between the theory and experiment, this minor discrepancy of 0.0001 V is likely attributable to measurement uncertainties. Given the small magnitude of the error, the proposed theoretical model might be accepted and is considered for subsequent analyses.
Figure 6.
An experimental facility used to measure the electromagnetic energy harvester.
Figure 7.
The theoretical electrical voltage to time at Zo = 0.3 m.
4. Sensitivity Assessment
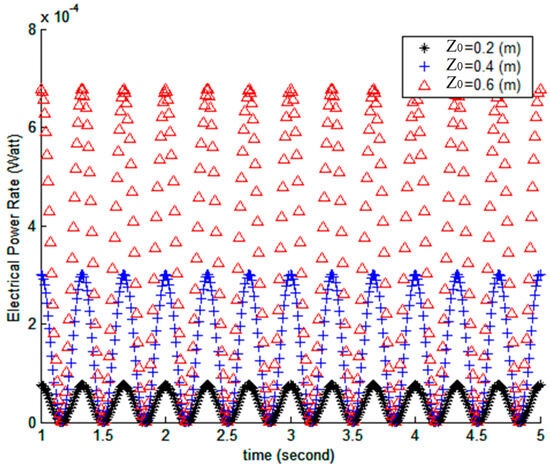
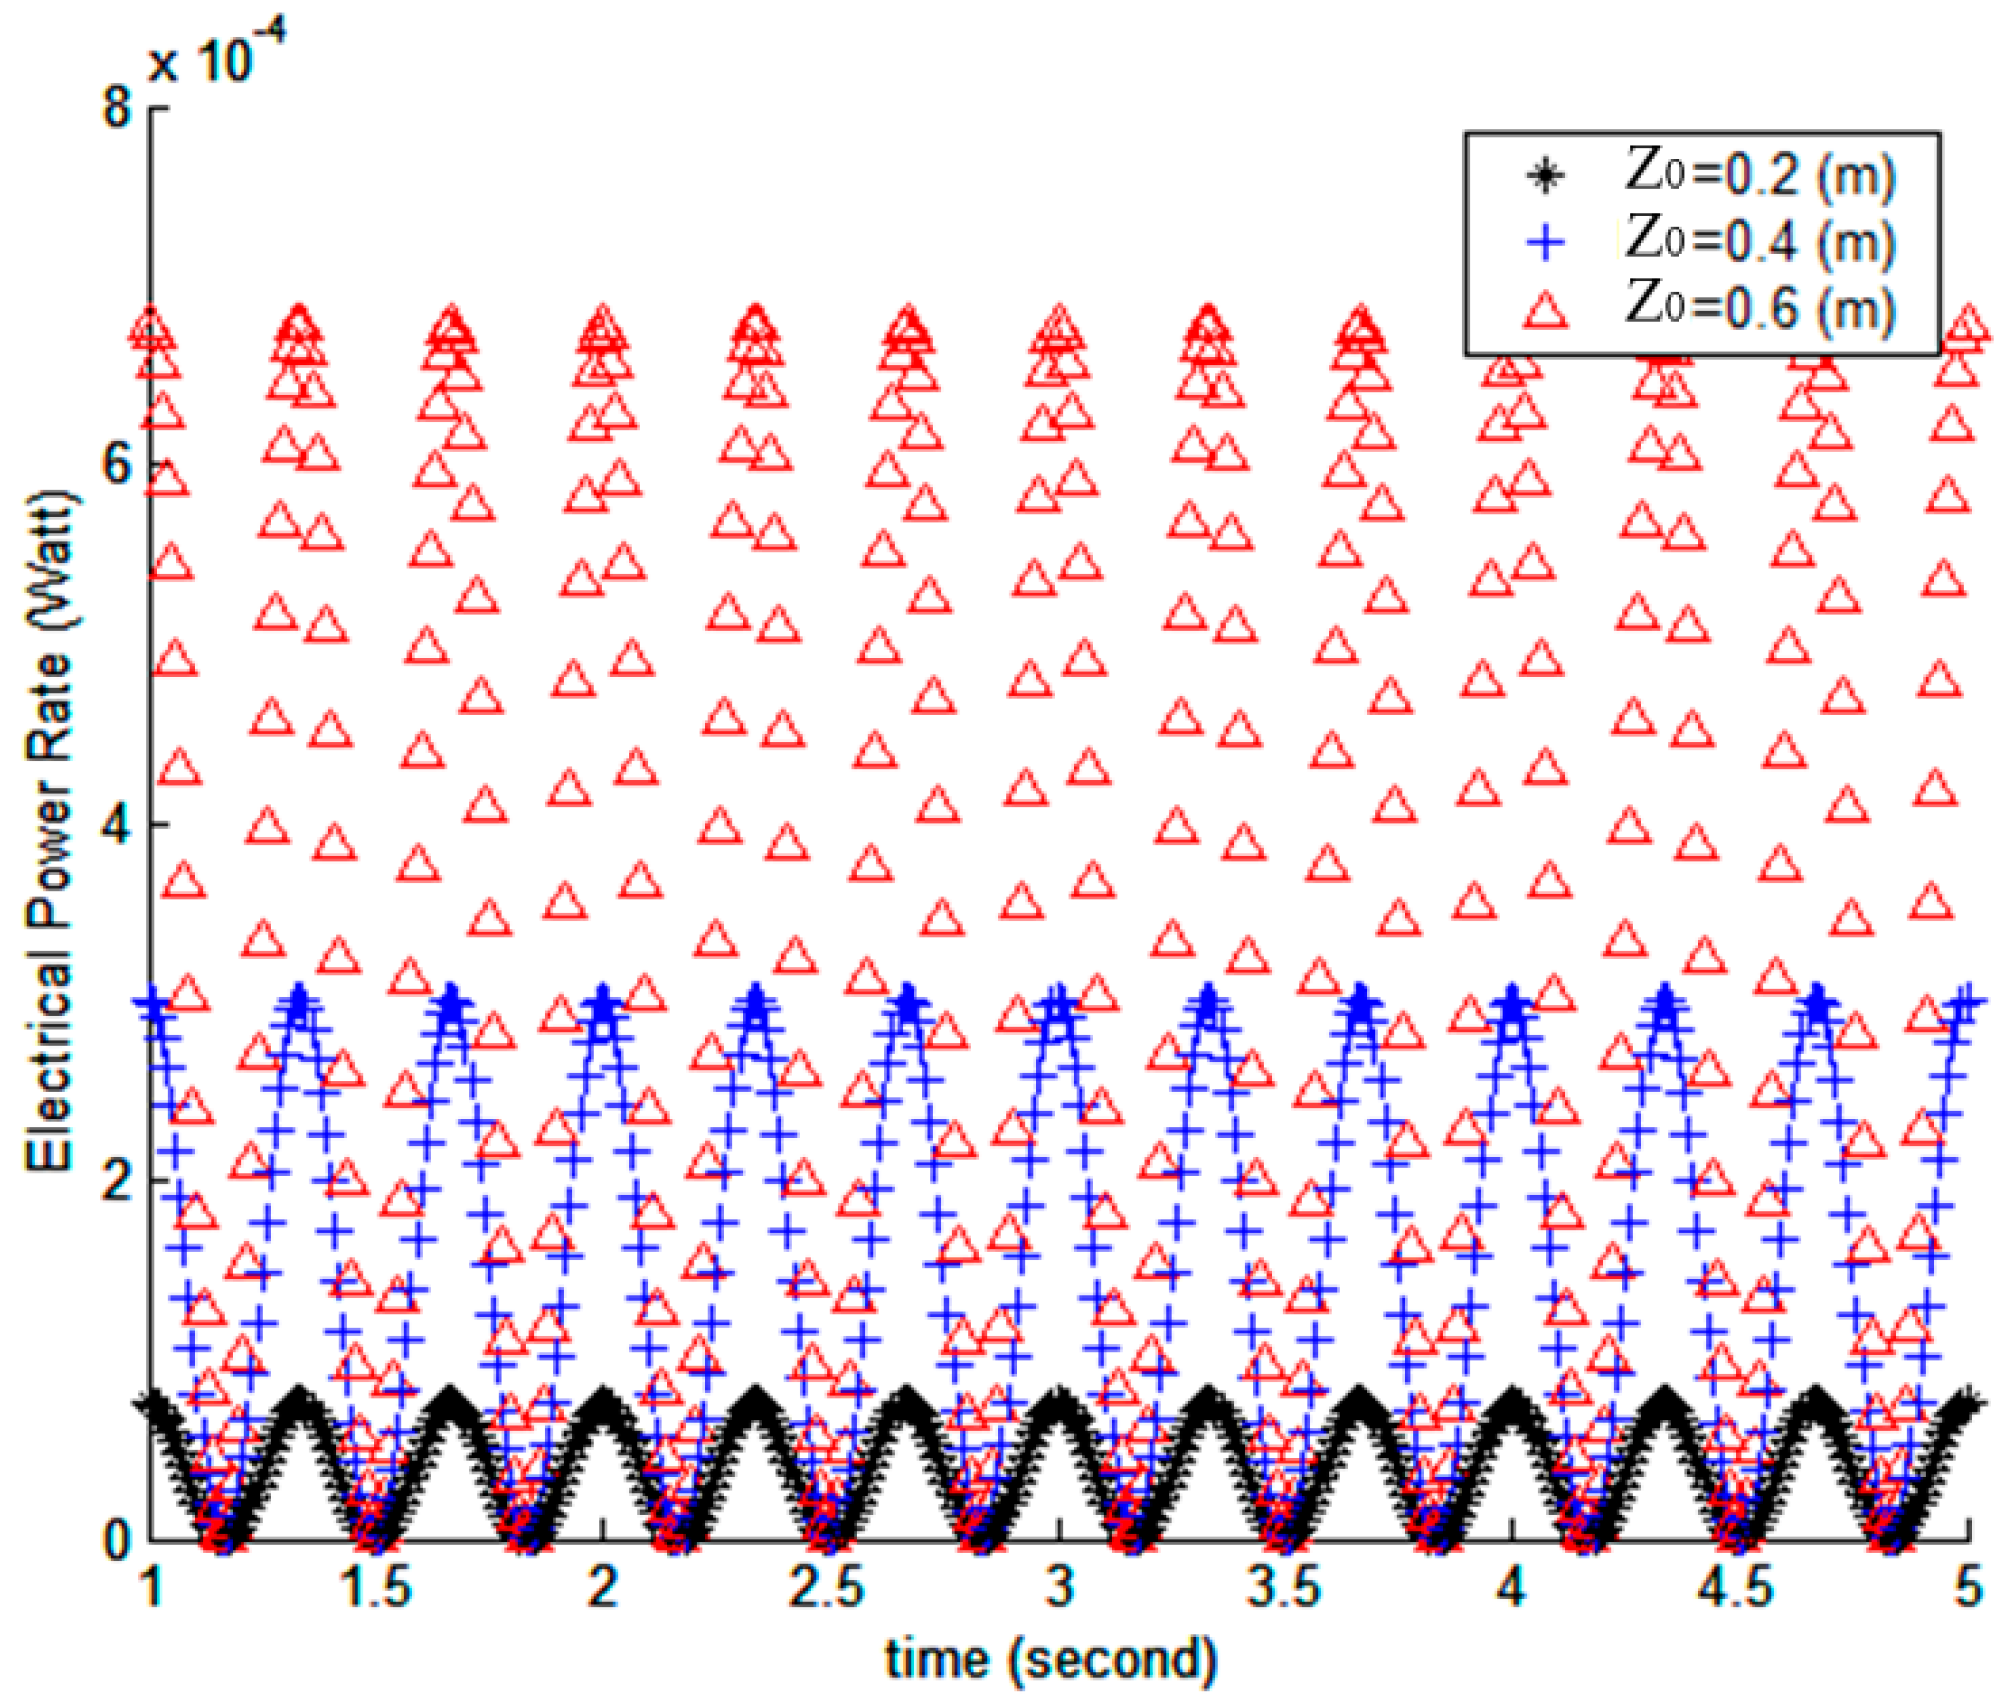
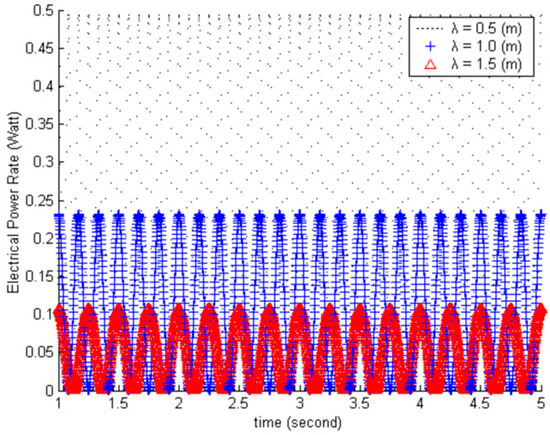
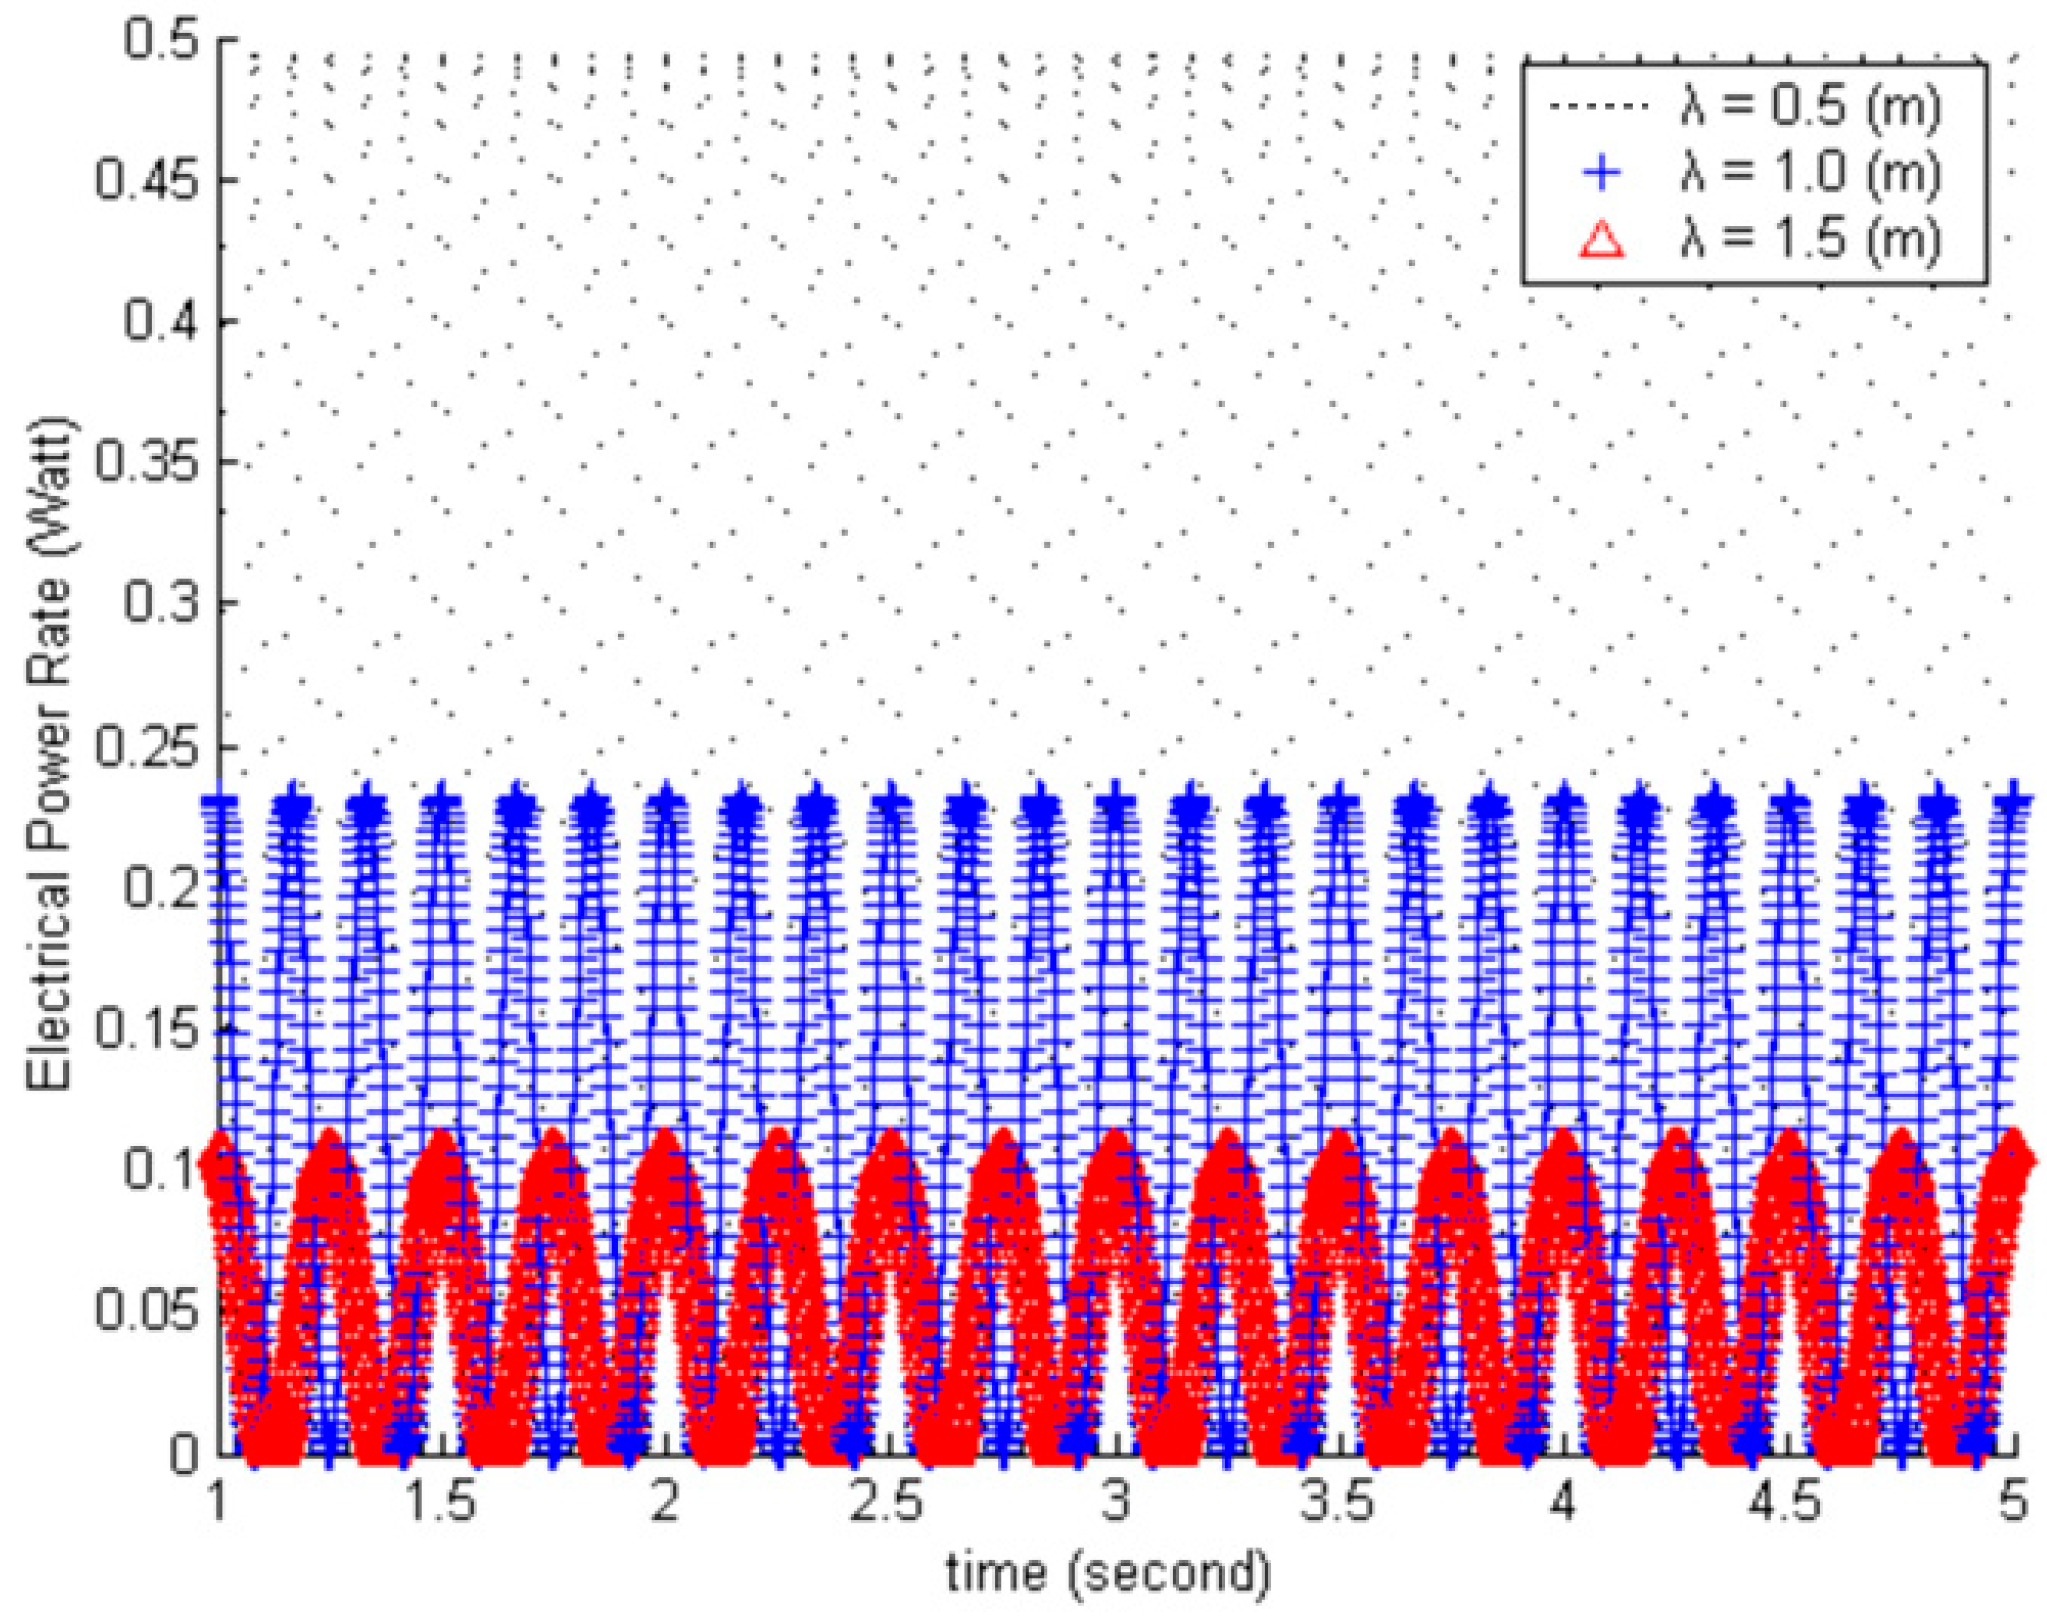
Before optimizing the ship-based energy harvesting device, a sensitivity analysis was conducted to evaluate the effects of both marine conditions and energy harvester design parameters on the induced electrical power. To satisfy the requirement that ocean wave slopes remain below 1 m per 7 m of wavelength [22], the ratio of wave amplitude (Zo) to wavelength (λ) was constrained to be less than 1/10. Using Equation (14), the time-dependent electrical power under various wave conditions (Zo, λ) was simulated, and the results are shown in Figure 8 and Figure 9. Figure 8 demonstrates that the induced electrical power increases with wave amplitude, while Figure 9 shows that the electrical power increases as the wavelength decreases.
Figure 8.
Influence of induced electrical power relating to Zo.
Figure 9.
Influence of induced electrical power relating to λ.
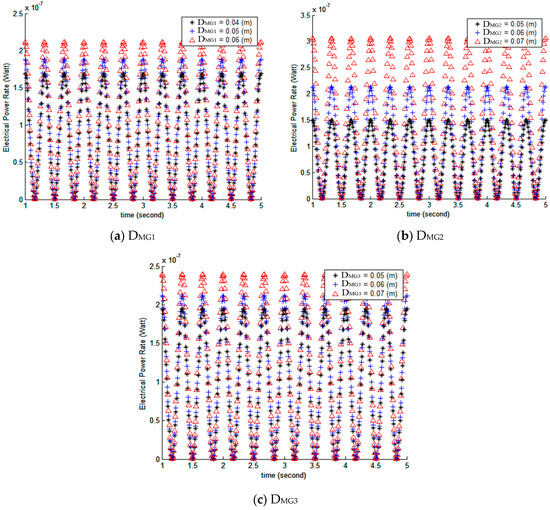
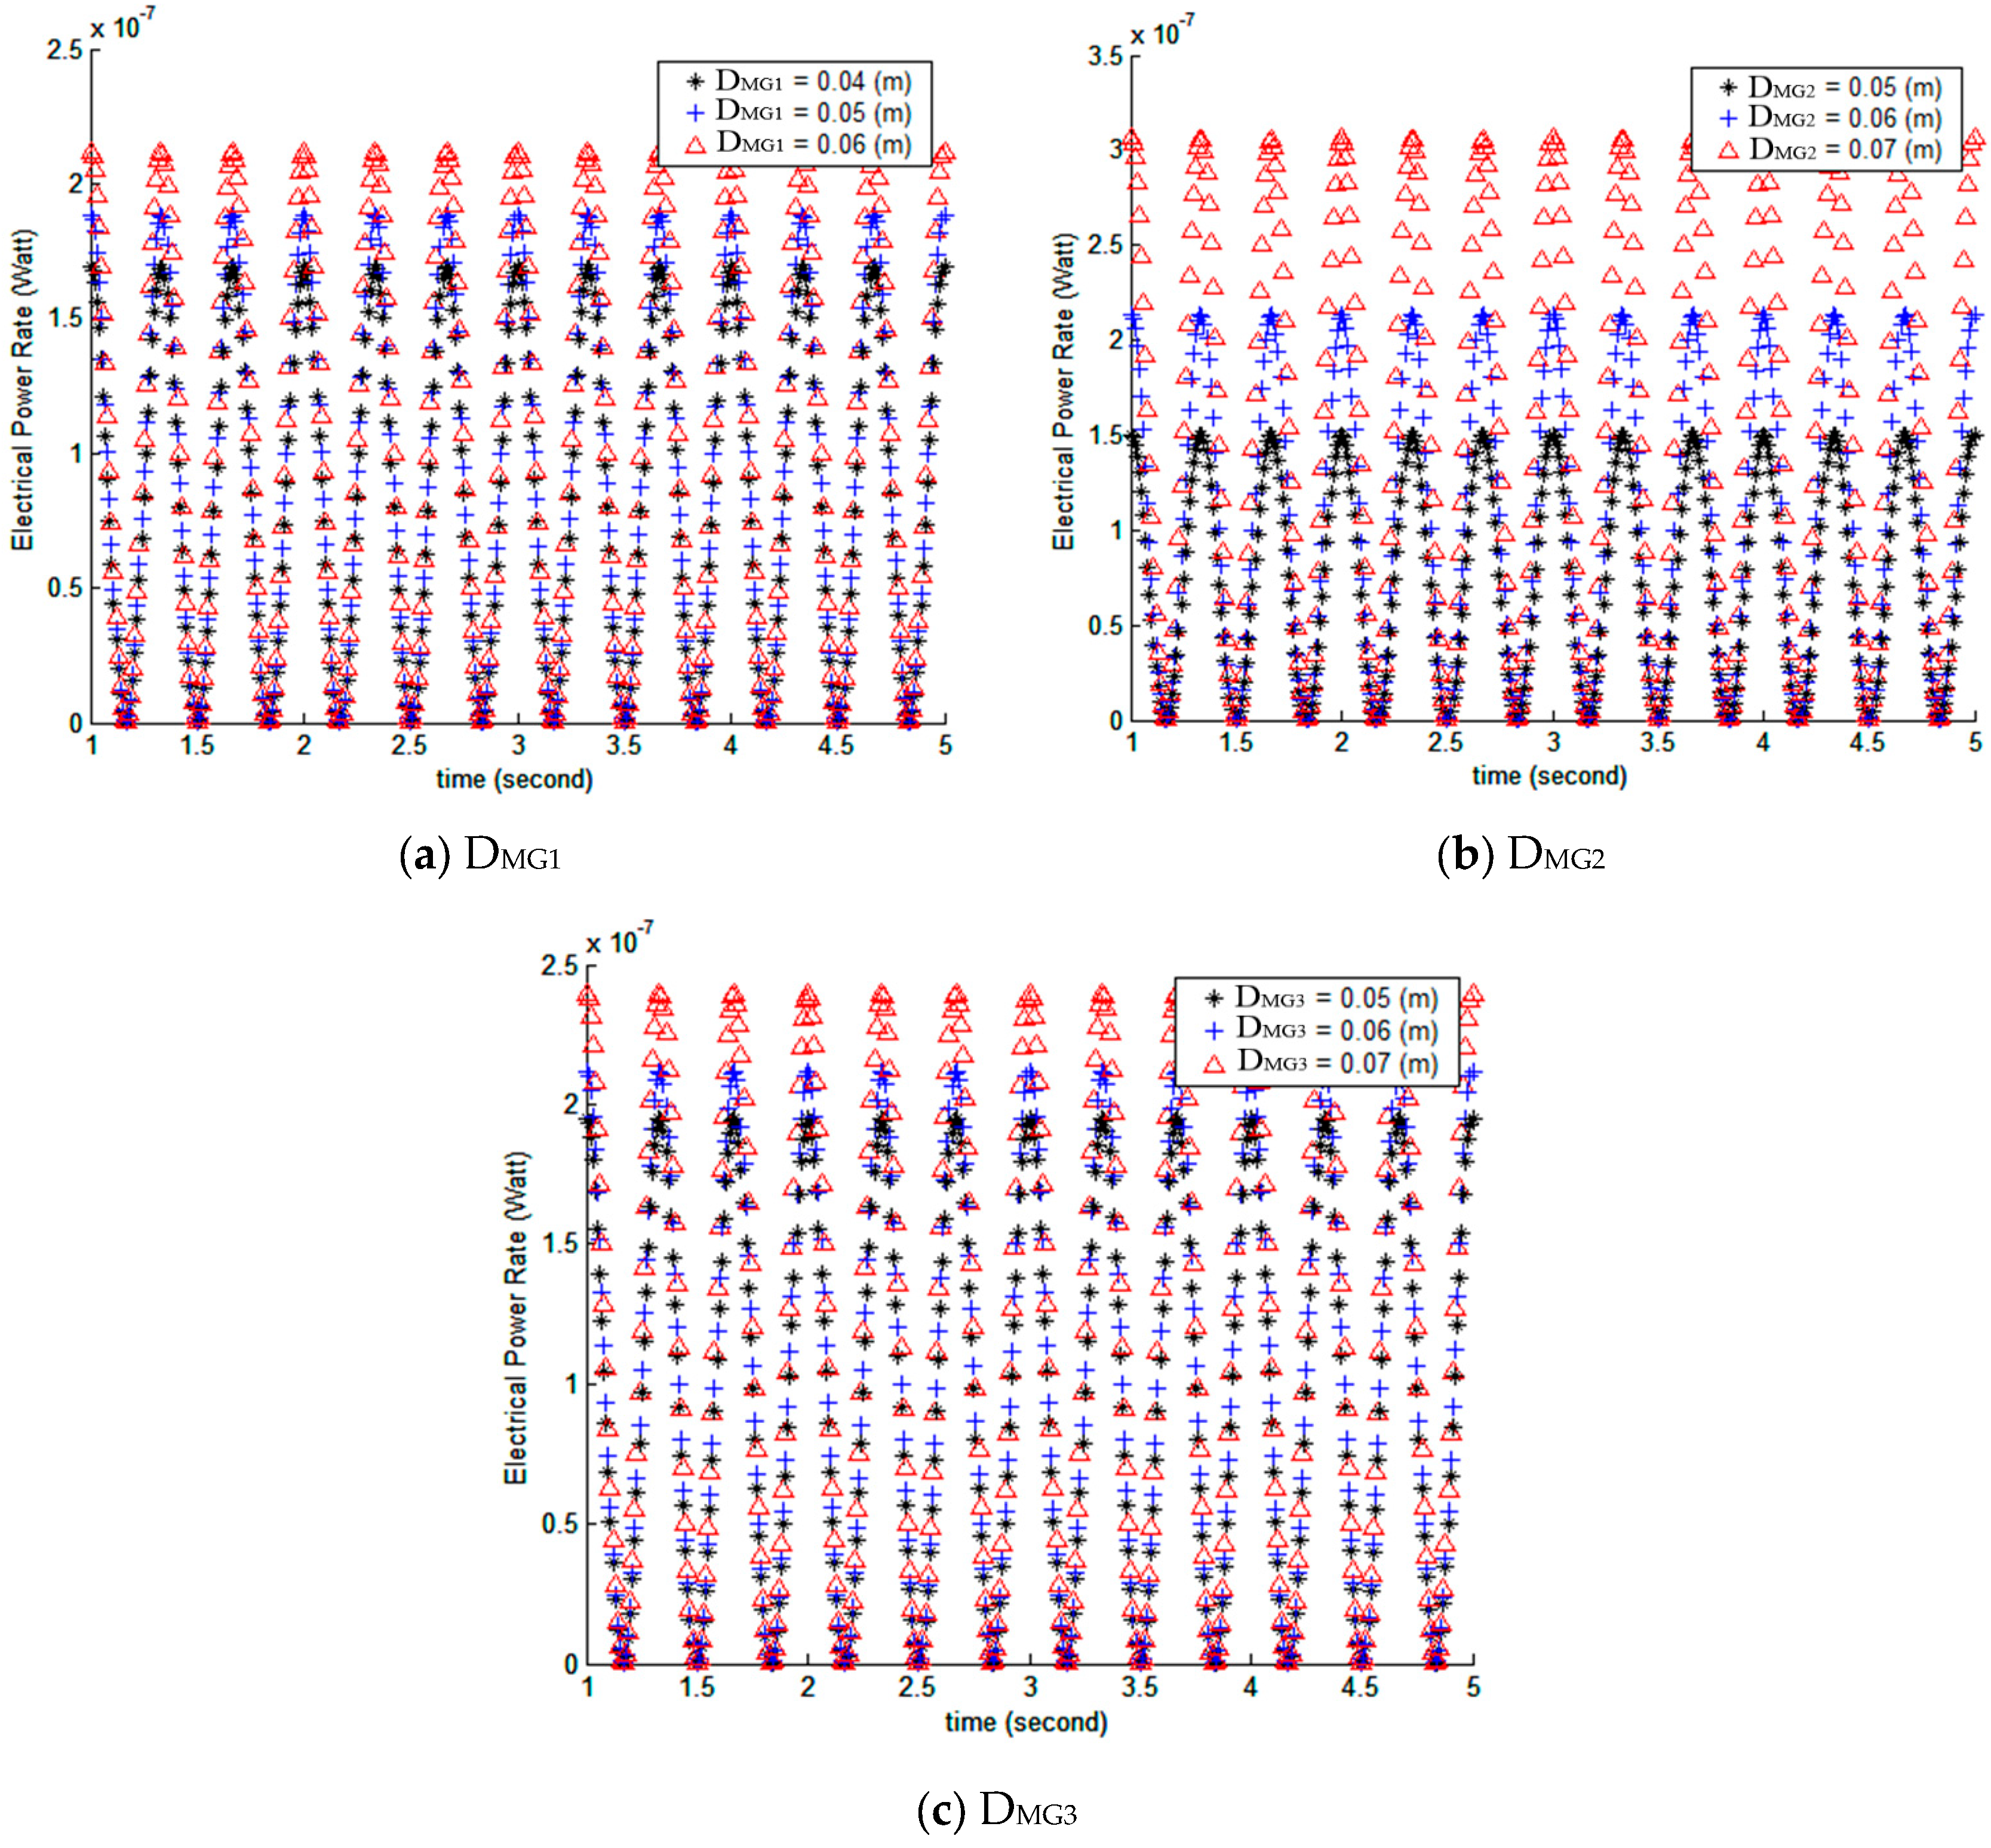
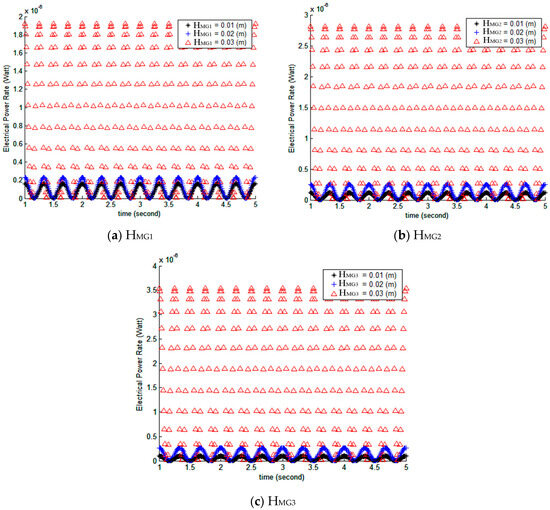
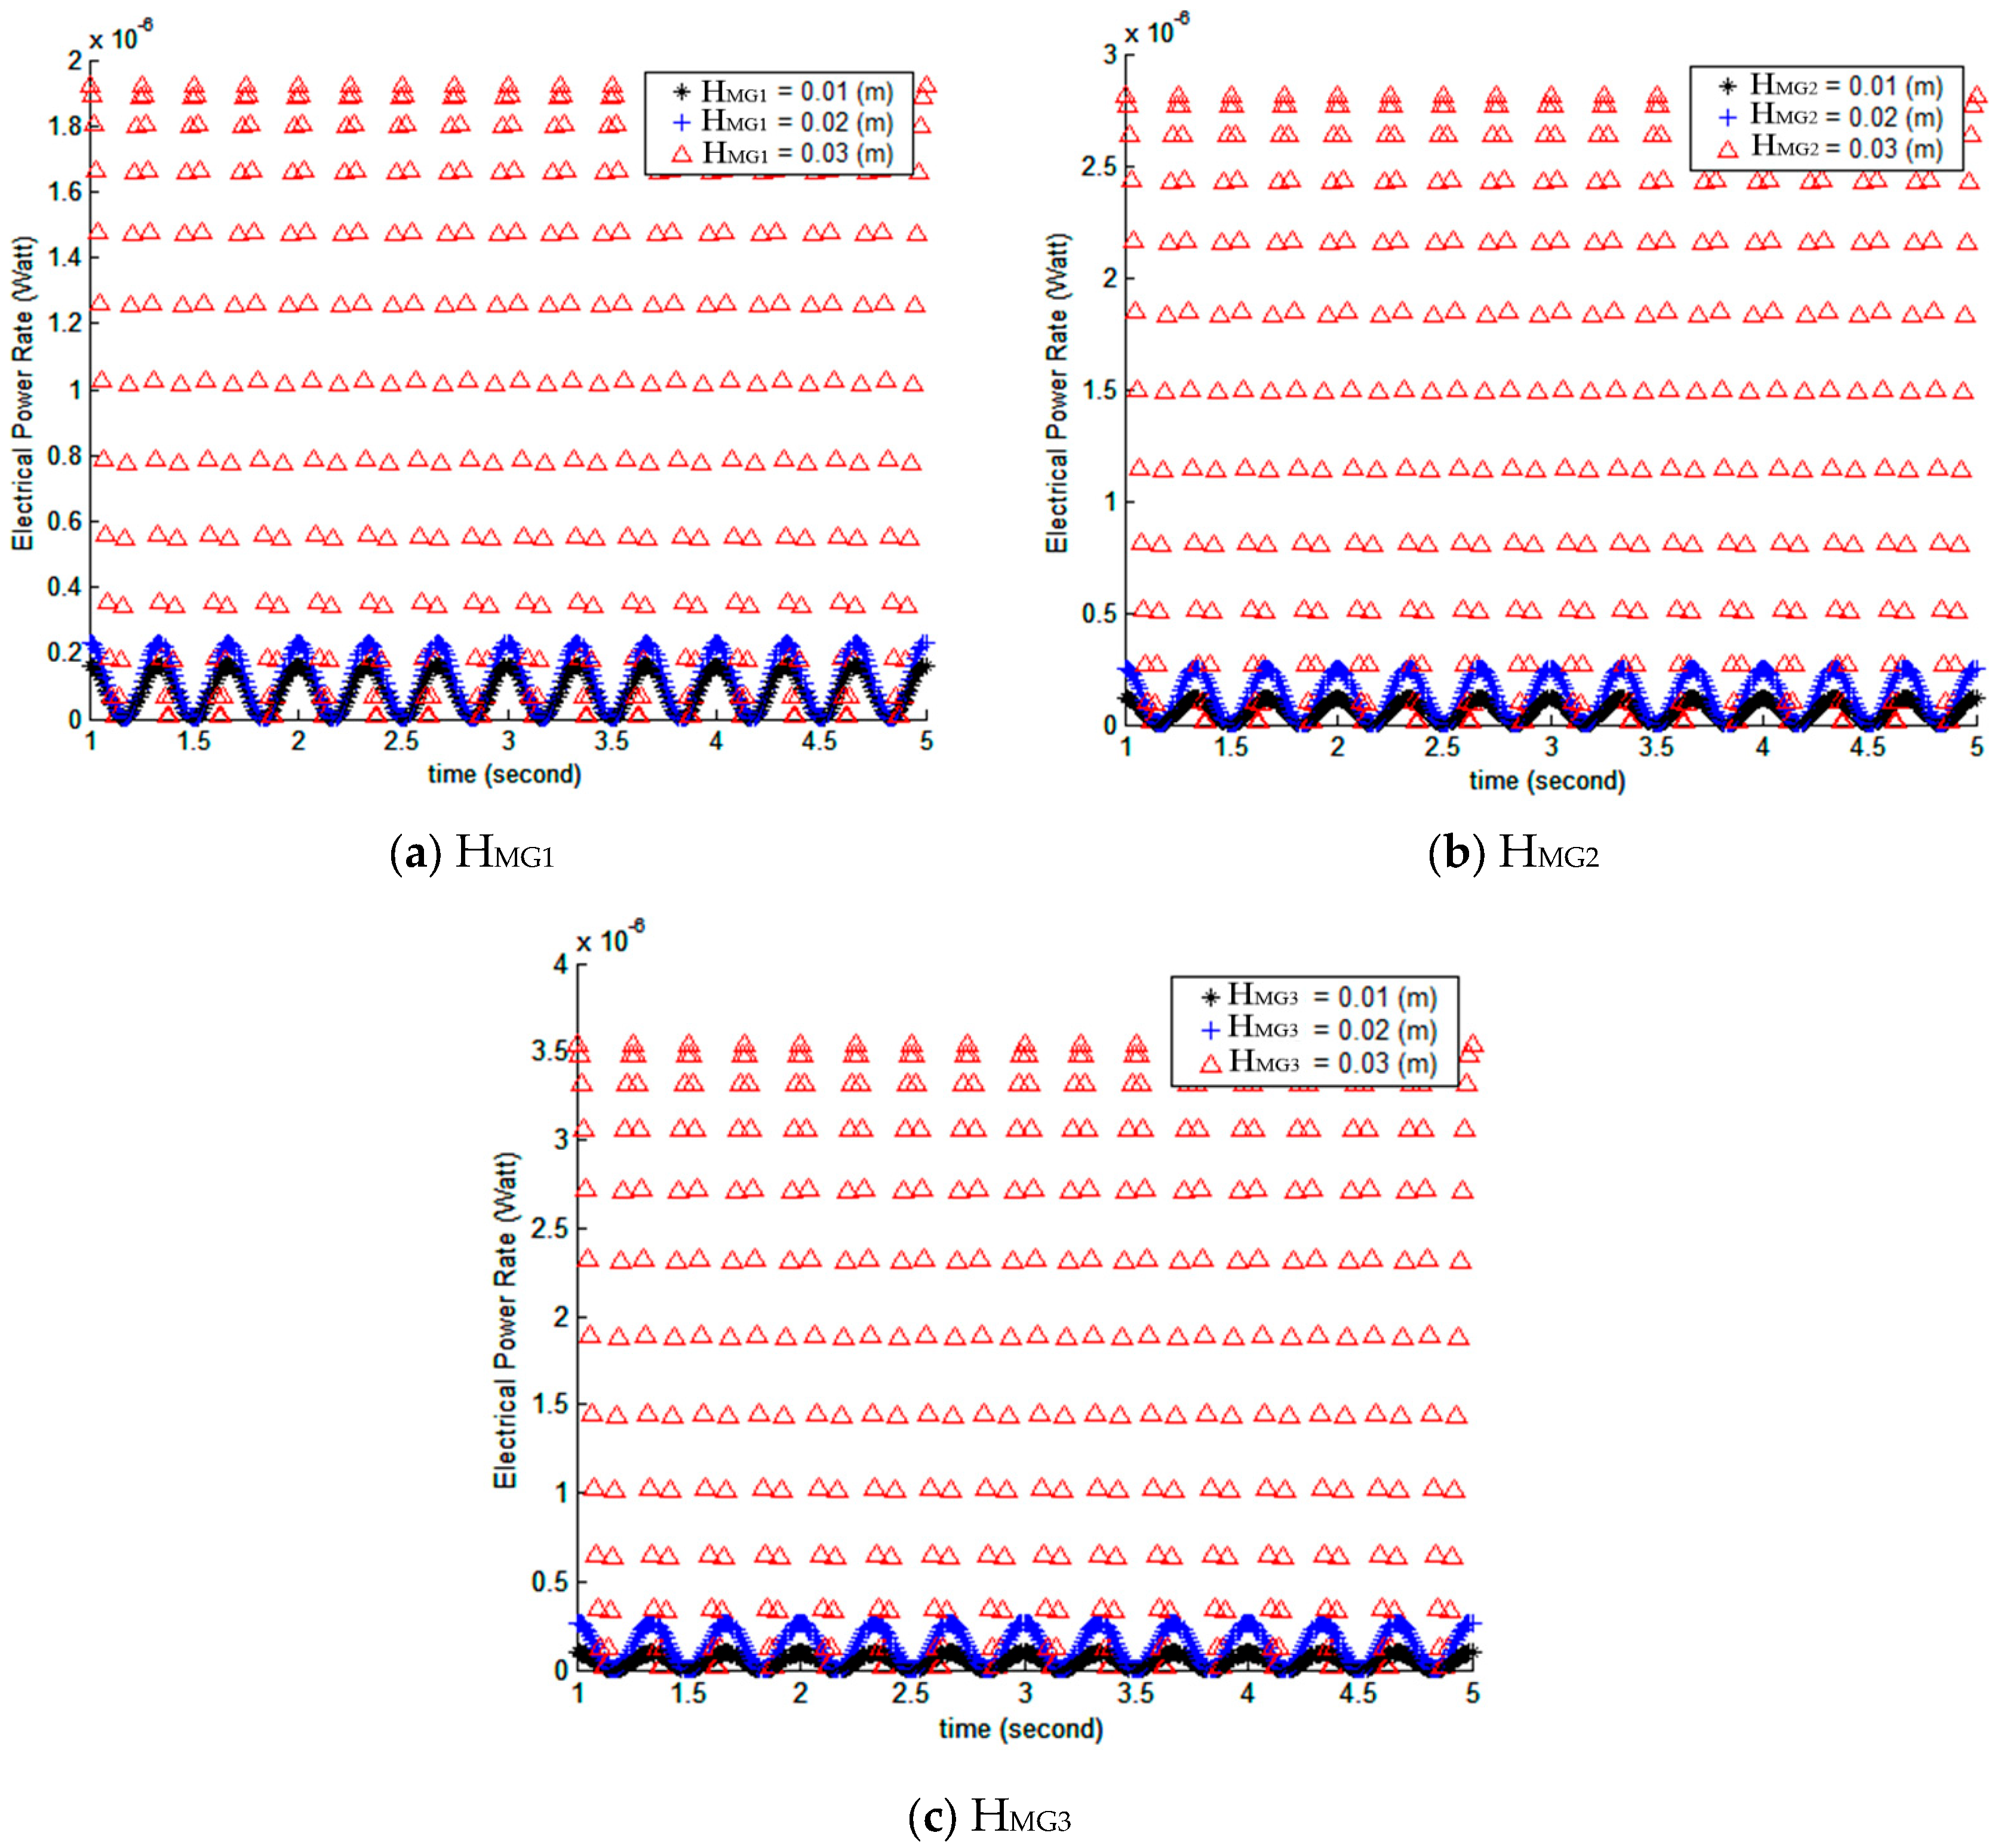
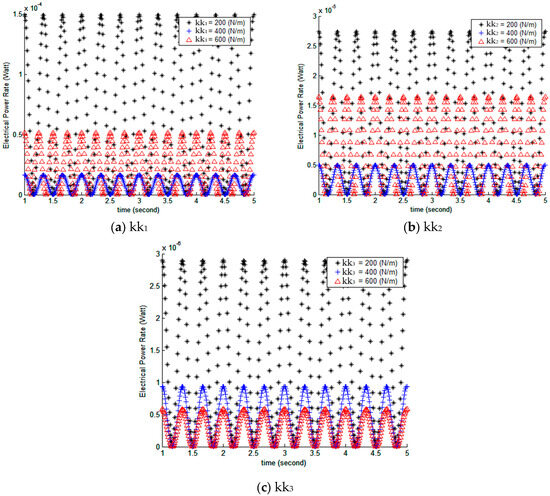
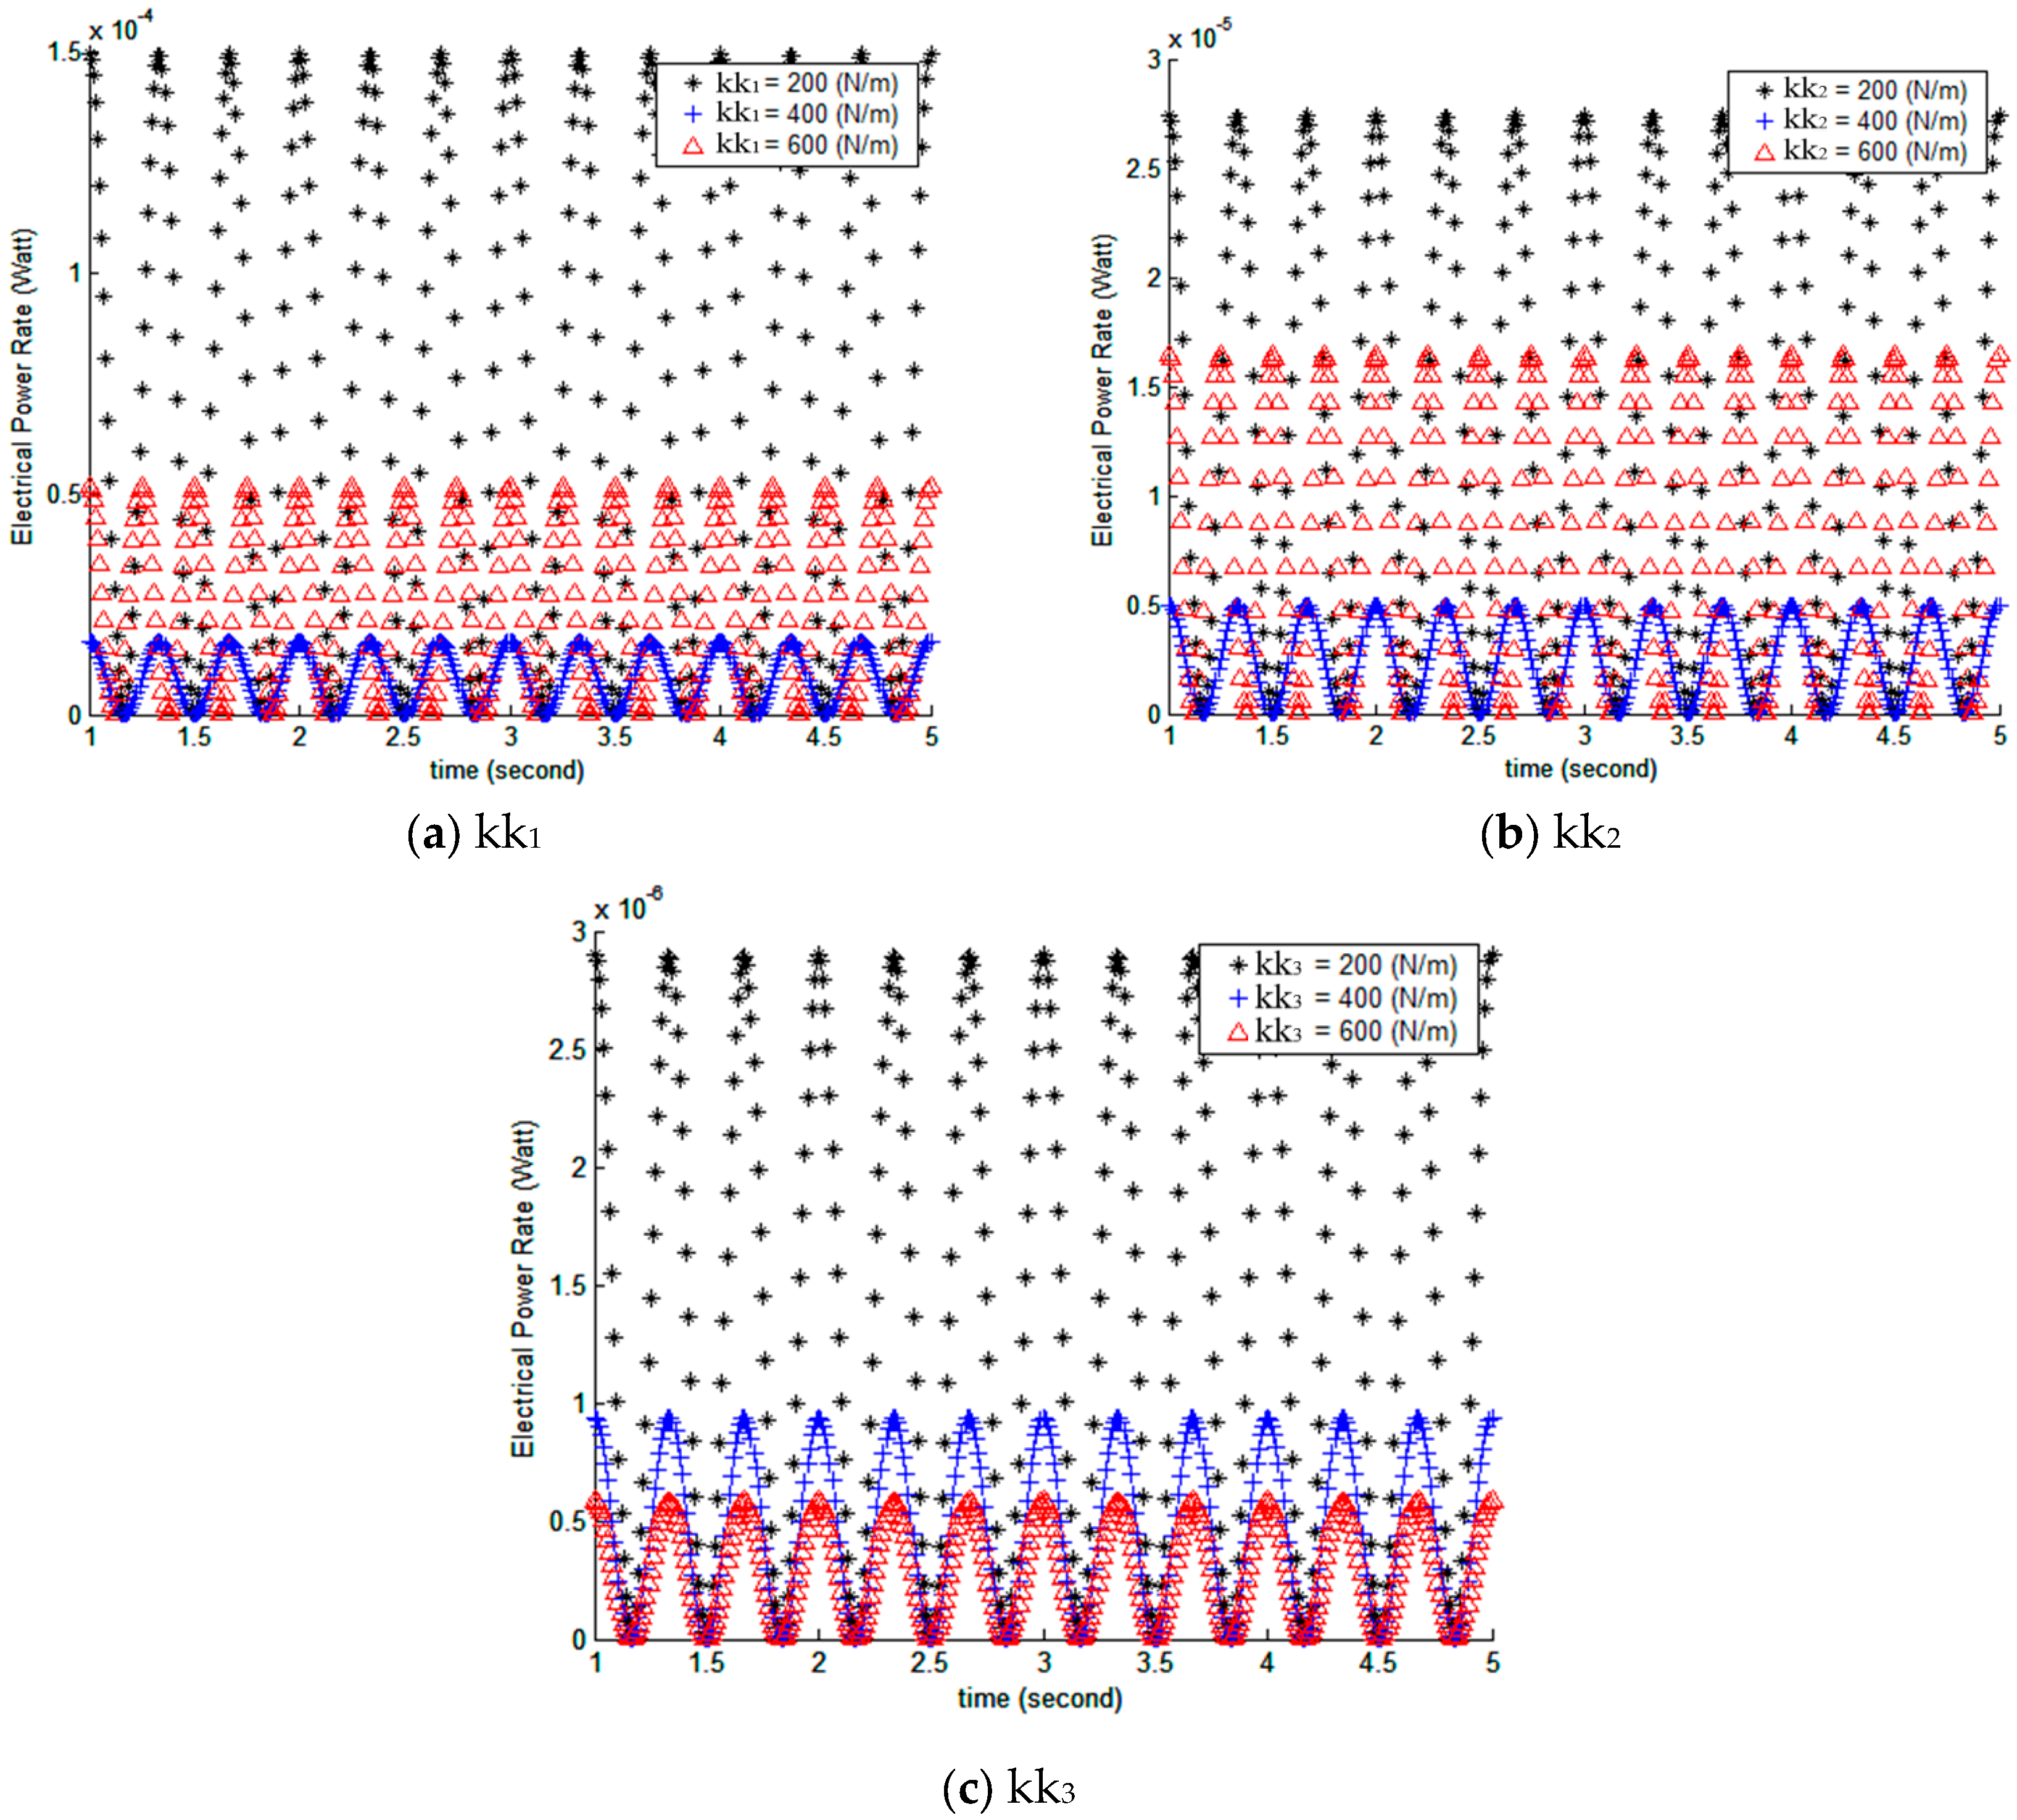
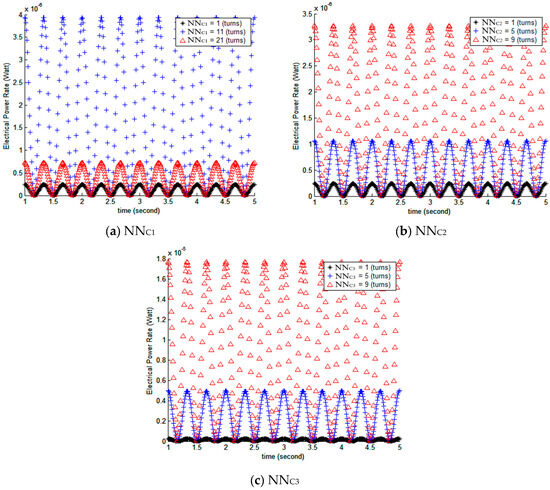
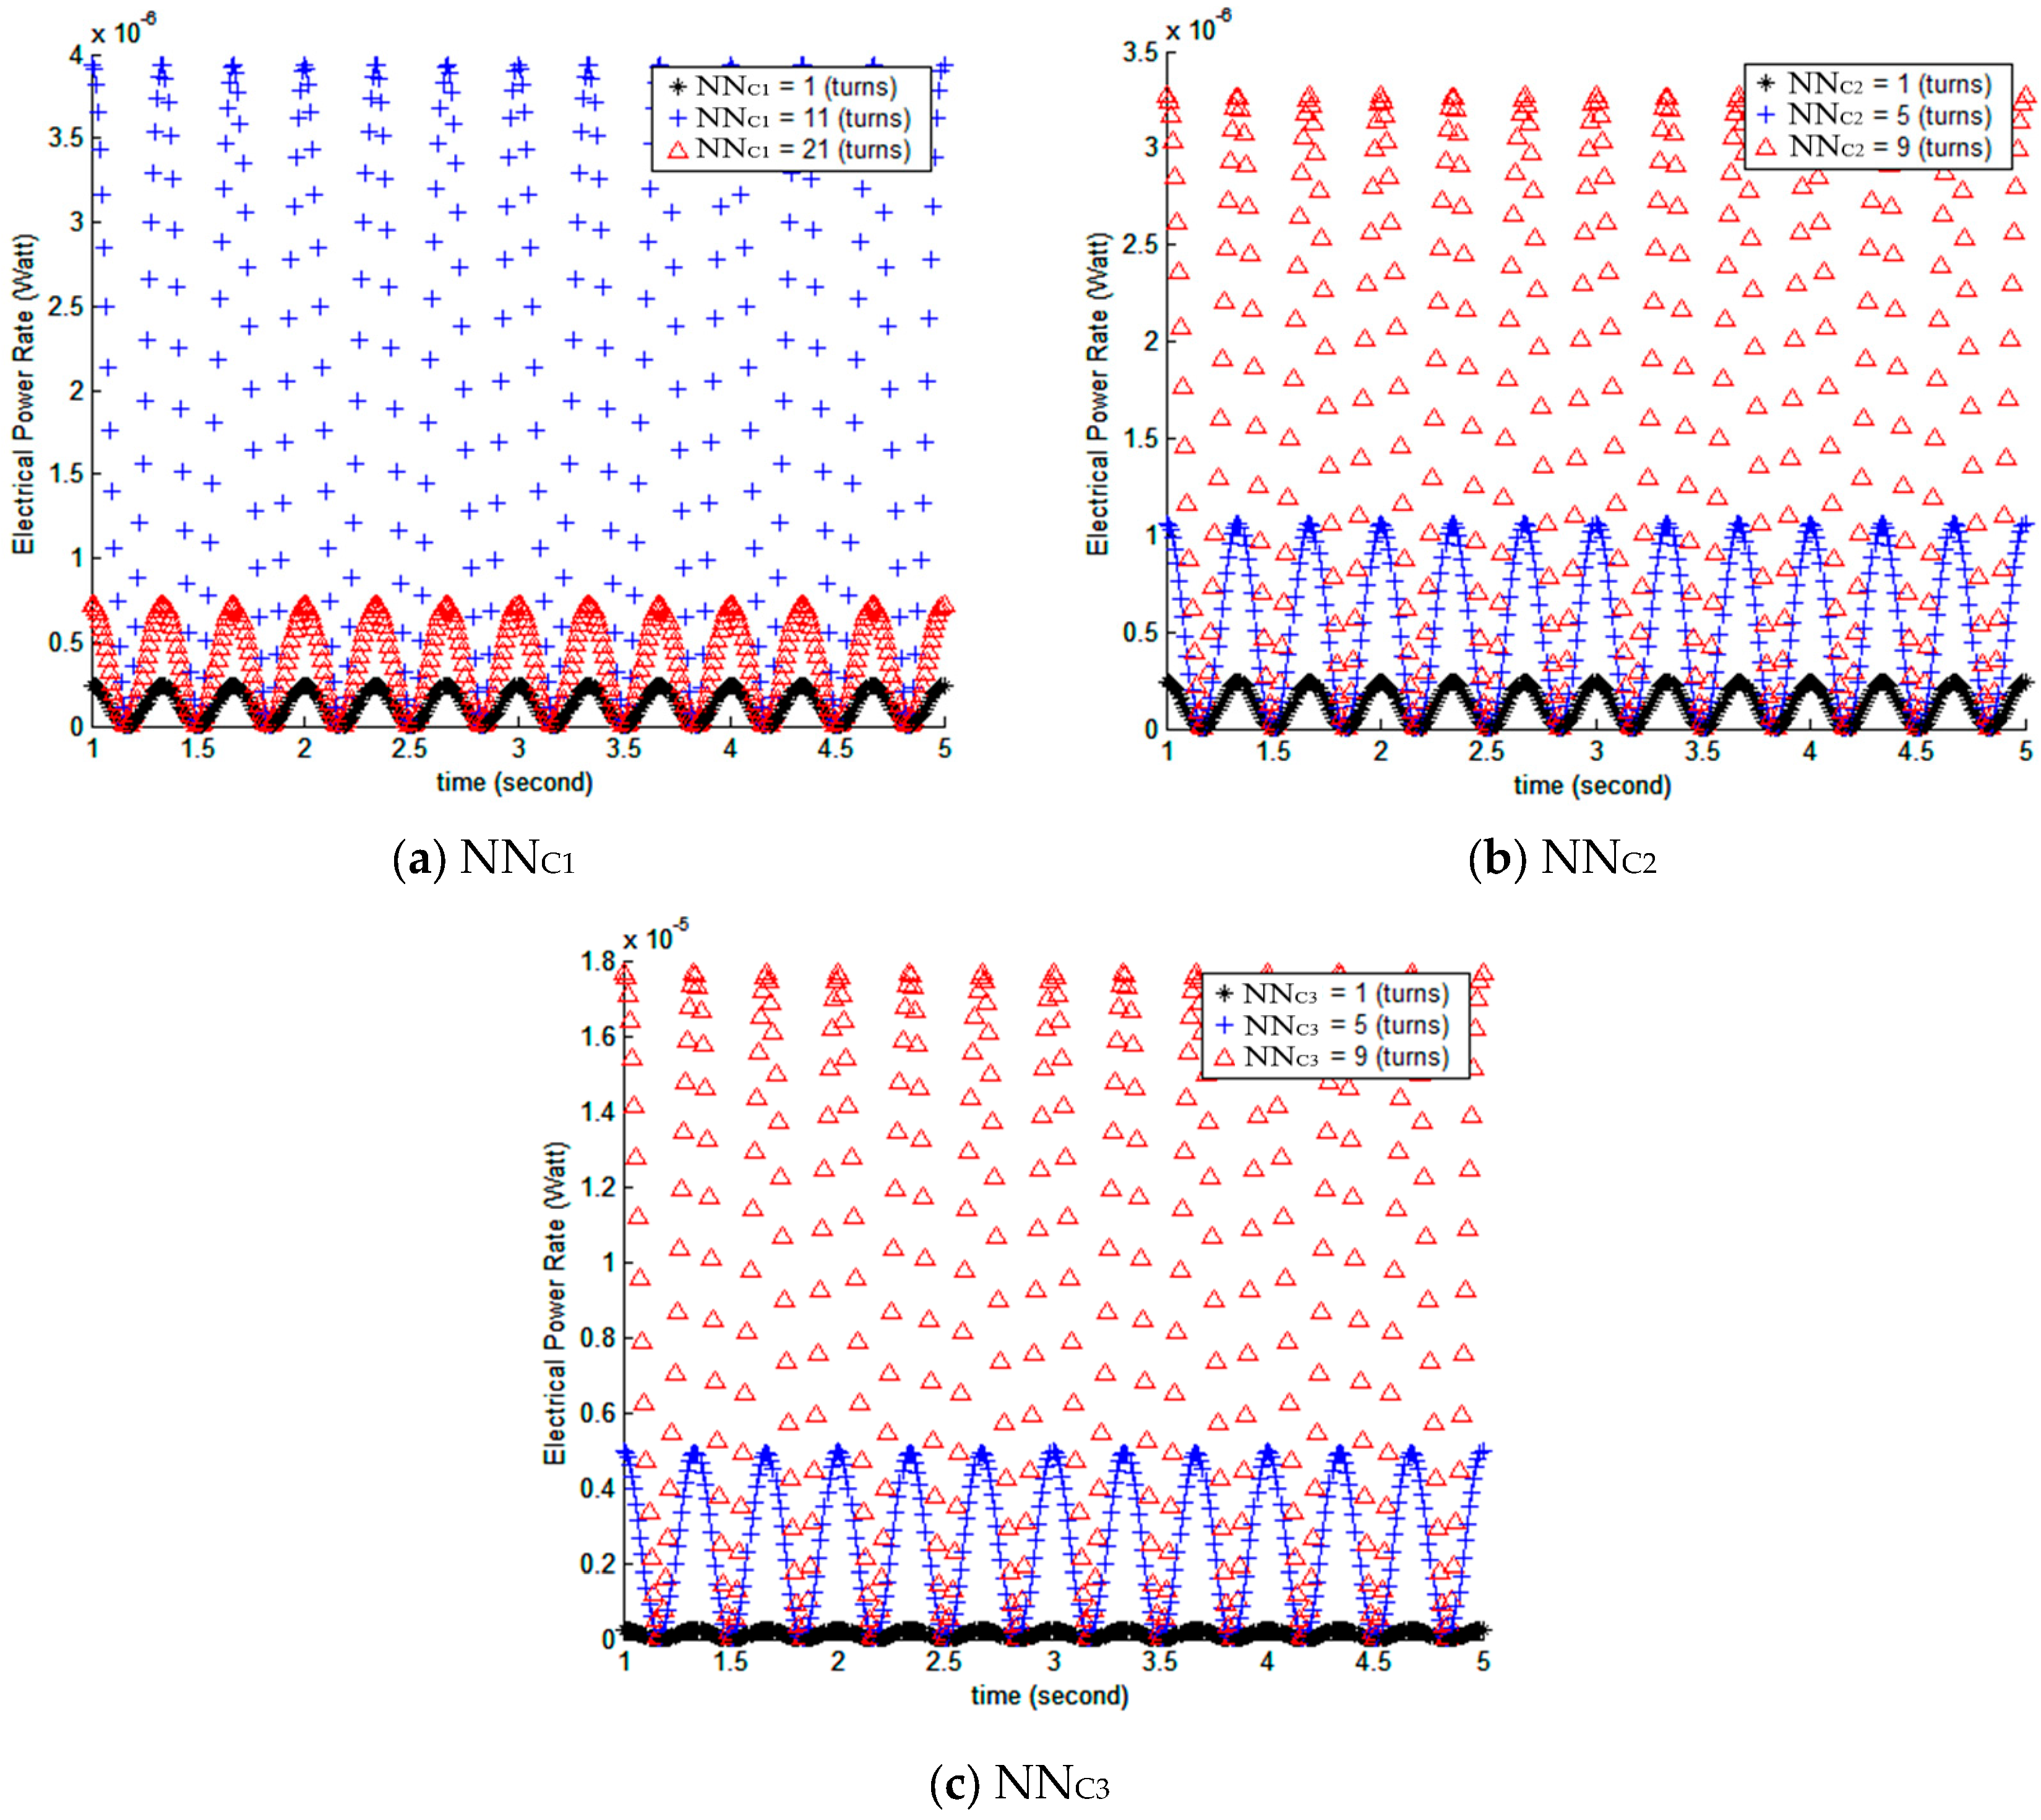
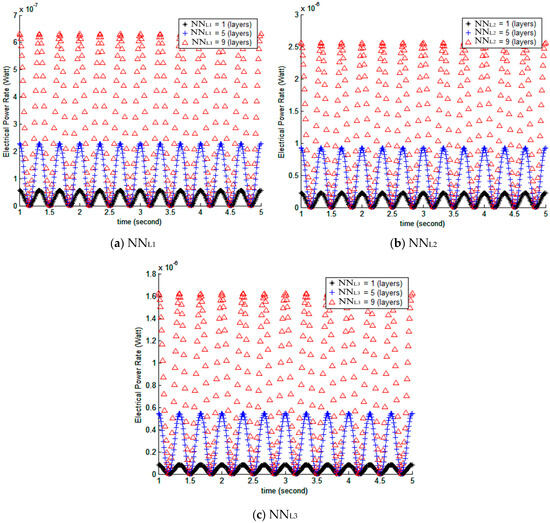
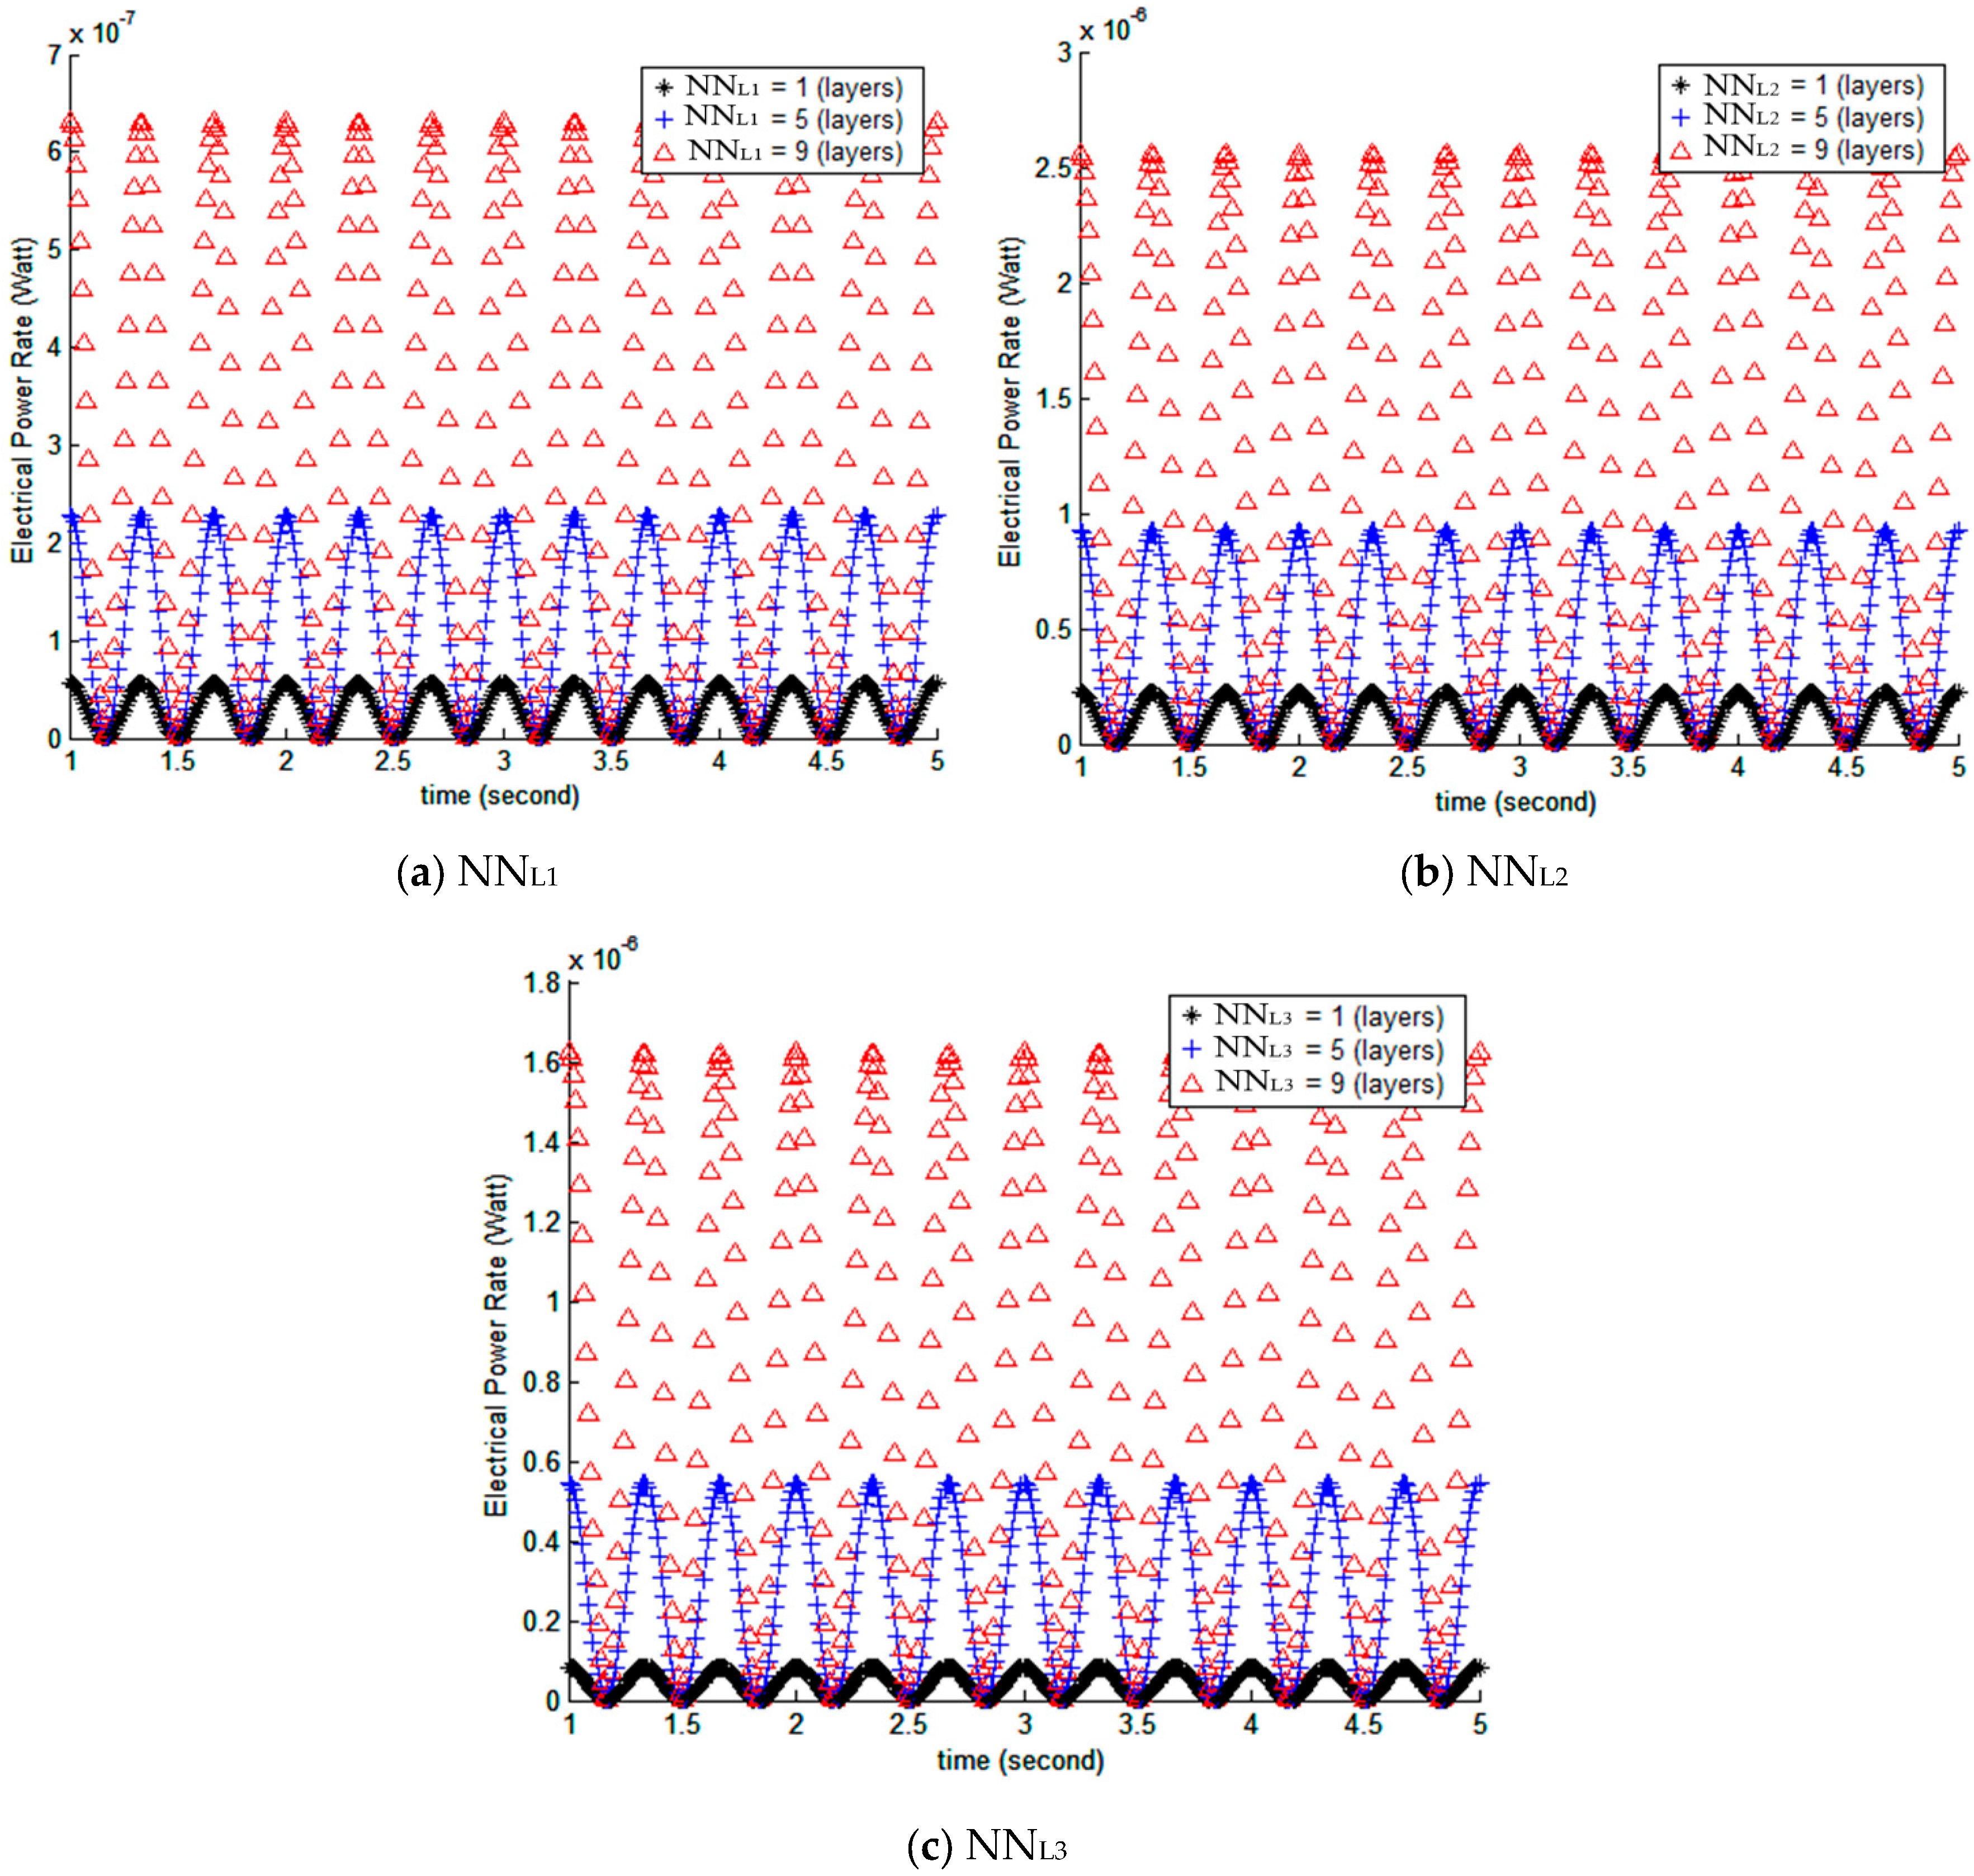
Additionally, a sensitivity analysis was conducted to evaluate the effects of the ship’s energy harvester geometric parameters (DMG1, HMG1, kk1, NNC1, NNL1, DMG2, HMG2, kk2, NNC2, NNL2, DMG3, HMG3, kk3, NNC3, NNL3) on the induced electrical power, with the results presented in Figure 10, Figure 11, Figure 12, Figure 13 and Figure 14. Figure 10a–c show that the generated electrical power is positively correlated with DMG1, DMG2, and DMG3.
Figure 10.
Influence of induced electrical power relating to DMG1, DMG1, and DMG3.
Figure 11.
Influence of induced electrical power relating to HMG1, HMG1, and HMG1.
Figure 12.
Influence of induced electrical power relating to kk1, kk2, and kk3.
Figure 13.
Influence of induced electrical power relating to NNC1, NNC2, and NNC3.
Figure 14.
Influence of induced electrical power relating to NNL1, NNL2, and NNL3.
Furthermore, Figure 11a–c show that the induced electrical power is positively correlated with HMG1, HMG2, and HMG3.
There is a clear trend showing that the induced electrical power reaches its maximum when the spring stiffnesses kk1, kk2, and kk3 are at their lowest values (Figure 12a–c). Conversely, the induced electrical power is at its minimum when the spring stiffnesses kk1, kk2, and kk3 are at the mid-range value of 400 N/m.
Furthermore, Figure 13b,c show that the induced electrical power increases with the number of coil turns NNC2 and NNC3. However, as illustrated in Figure 13a, the induced electrical power decreases when NNC1 reaches higher values. Although increasing the number of turns in the induction coil can enhance the induced voltage, it also increases the magnetic impedance of the coil, thereby intensifying the coil damping (CCe) effect in the vibration system. Therefore, the number of coil turns must be balanced with the target electrical output to determine the optimal configuration.
Finally, as shown in Figure 14a–c, the induced electrical power is positively correlated with the number of coil layers (NNL1, NNL2, NNL3).
In summary, all the parameters (Zo, λ, DMG1, HMG1, kk1, NNC1, NNL1, DMG2, HMG2, kk2, NNC2, NNL2, DMG3, HMG3, kk3, NNC3, NNL3)play a critical role in determining the electrical power produced by the energy harvester.
5. Flower Pollination Algorithm
5.1. Flower Pollination Algorithm Theory
Developed by Yang et al. [21], the flower pollination algorithm (FPA) is a population-based global optimization algorithm that employs the following strategies:
Strategy 1: Global pollination, akin to cross-pollination by birds, is carried out by the pollinators through Levy flight behavior. Strategy 2: Local pollination is conducted by self-pollination of nearby flowers. Strategy 3: Flower constancy, defined as being directly proportional to the similarity between two flowers, is used as the reproductive rate. Strategy 4: Global and local pollination are executed according to a switch probability.
Following the above strategies, the FPA algorithm employs both a global pollination operator and a local pollination operator. In this framework, each pollen represents a candidate solution and is initialized as a random vector within the feasible search space, as described below.
where i ∈{1,…,NP}, with NP denoting the population size; and Rν is a D-dimensional random vector in [0, 1]. In the global pollination process of the FPA, pollinators (e.g., birds) can travel long distances, enabling pollen transfer over wide areas and facilitating the search for global solutions. This process can be mathematically expressed as follows:
where denotes the i-th solution at iteration t, is the current global best solution, γ is a step size factor, and L(λ) characterizes the flight of pollinators, which can be approximated by a Lévy distribution. For L > 0, the Lévy distribution is expressed as
As shown in Equation (19a), s, a random variable, is generated based on two Gaussian distributions, U and PP.
Here, denotes a normal distribution with mean 0 and variance .
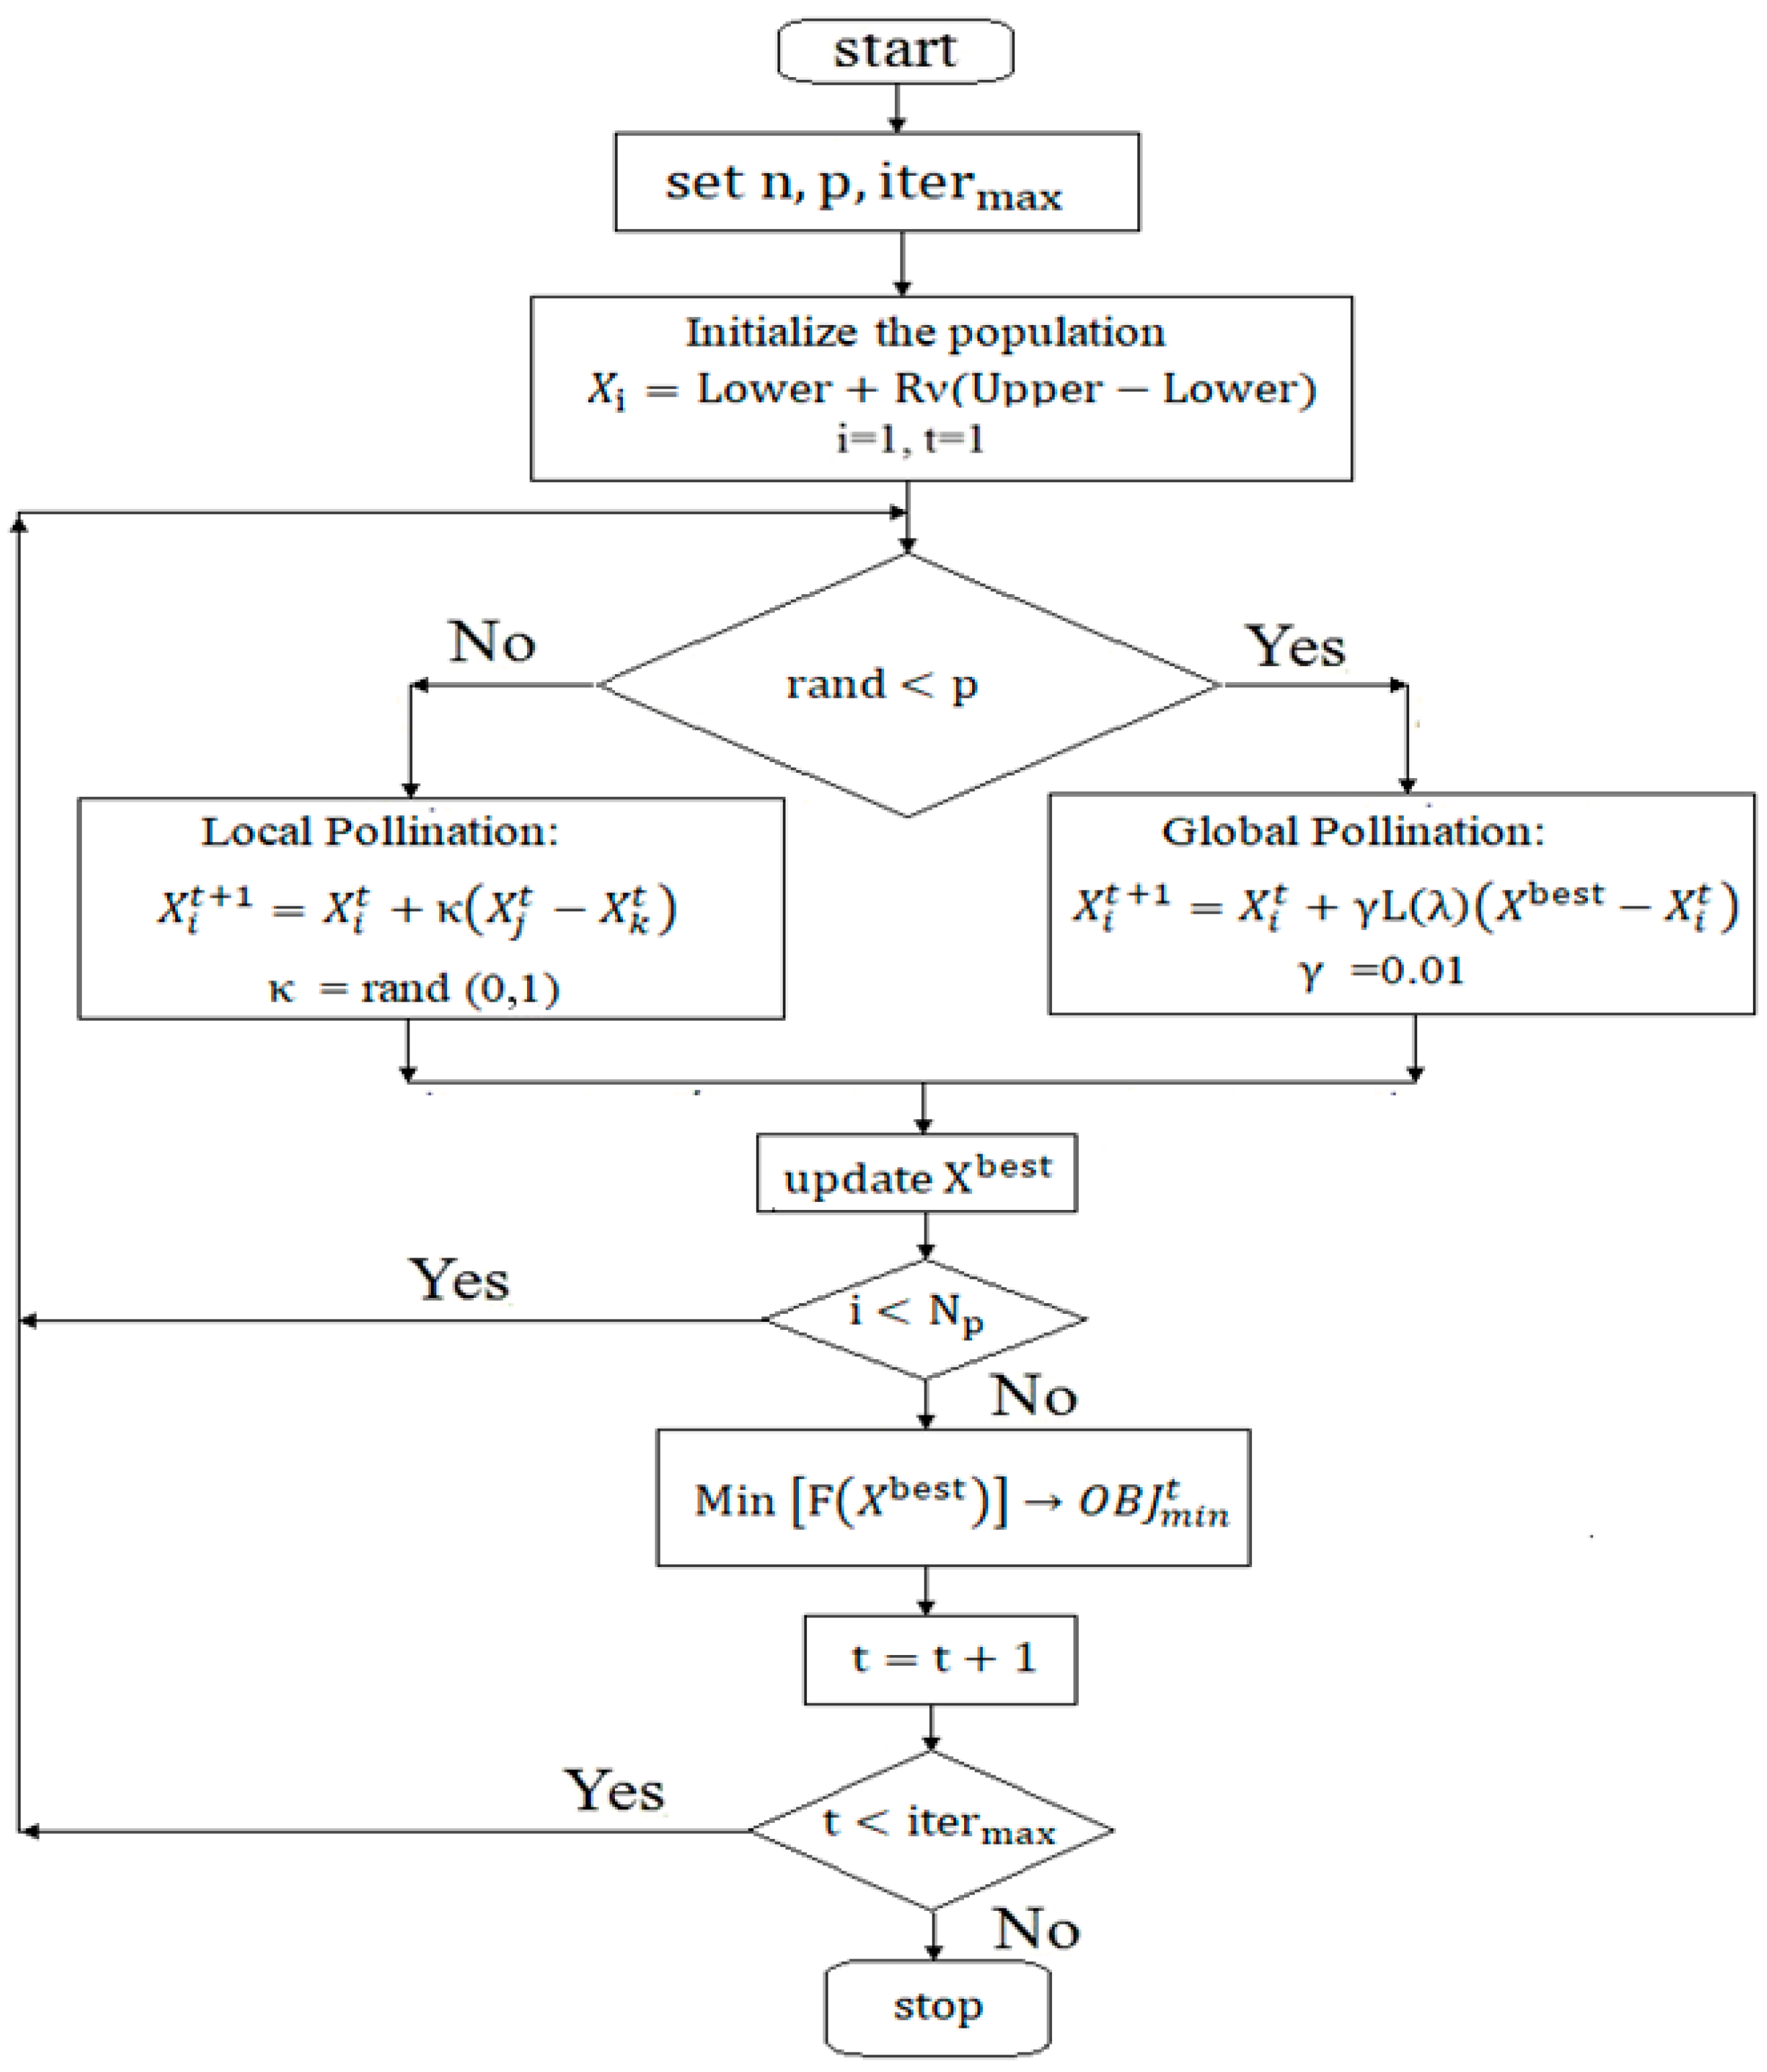
Based on Strategies 1–4, the flower pollination algorithm (FPA) is illustrated in the flowchart shown in Figure 15. As depicted, the two types of pollination are determined by a probability p. If a randomly generated value rand∈ [0, 1] is smaller than p, global pollination is performed; otherwise, local pollination is executed. All flower pollens (Np) are evaluated and compared to determine the minimum fitness value using the best global solution at the t-th iteration. The process continues until the iteration count t reaches the maximum number of iterations, itermax.
5.2. Numerical Comparison Between the Flower Pollination Algorithm and the Simulated Annealing Method
Previous studies aiming to maximize power generation in energy-harvesting systems have predominantly employed simulated annealing (SA) as the bio-inspired optimization method [13,15]. In this study, however, we propose replacing SA with the flower pollination algorithm (FPA), which is recognized for its robustness in optimization tasks. Prior to applying FPA to maximize power generation in the ship-based energy harvesting system, a numerical comparison between SA and FPA is conducted. For this comparison, the wave conditions are set as V = 3 m/s, λ = 2 m, and Zo = 0.2 m. Under these conditions, fifteen design parameters (DMG1, HMG1, kk1, NNC1, NNL1, DMG2, HMG2, kk2, NNC2, NNL2, DMG3, HMG3, kk3, NNC3, NNL3) are optimized. The corresponding parameter ranges are (0.01, 0.1), (0.01, 0.1), (4000, 40,000), (10, 100), (1, 10), (0.01, 0.1), (0.01, 0.1), (4000, 40,000), (10, 100), (1, 10), (0.01, 0.1), (0.01, 0.1), (4000, 40,000), (10, 100), and (1, 10). The electrical resistances of the loads attached to the three coil sets RL1, RL2, and RL3, are fixed at 300 Ω. The optimization objective is defined as the root-mean-square (RMS) value of the induced electrical power output.
After the optimization process, the best control parameters of SA are (kk, itermax) = (0.91, 32,000). The best control parameters of FPA are (Np, p, itermax) = (50, 0.7, 32,000).
The optimal numerical analysis results and corresponding power generation from the two bio-inspired optimization methods are summarized in Table 1.
Table 1.
Optimal numerical analysis results and power generation of the two bio-inspired optimization methods.
As shown in Table 1, the maximum power output achieved using the FPA and SA methods is 0.0768 W and 0.000529 W, respectively. With the same control parameter value (itermax), the power output obtained using the FPA method is higher than that of the SA method. This case study demonstrates that the FPA algorithm outperforms the SA algorithm; therefore, FPA is adopted for the present study.
Figure 15.
Flowchart of the flower pollination algorithm.
5.3. Range Settings of Flower Pollination Algorithm Control Parameters in the Optimization Process [21]
The control parameters of the flower pollination algorithm (FPA), including Np, p, γ, and itermax, play a crucial role in the optimization process. To achieve optimal performance, suitable FPA parameters must be selected for the energy harvesting device. Accordingly, these parameters are gradually adjusted during numerical optimization. In this study, with γ set to 0.01, the optimal design is obtained by varying the FPA control parameters as follows:
Np = (20, 30, 40,50), p = (0.7, 0.8, 0.9), and itermax = (500, 1000, 2000, 4000, 8000, 16,000, 32,000).
5.4. Case Studies
The ship’s wave-excited self-power generation design allows the vessel to be deployed in oceans or lakes with waves. This study provides an application demonstration through a case study. In the case study, the ship is assumed to be a rigid body, and the ocean waves acting on the ship are considered as surface waves, which are simplified as cosine functions, as shown in Figure 1. The ship’s center of gravity is assumed to lie on the horizontal plane, and the vessel experiences vertical motions induced by the waves at the hull, generating bottom excitations of the ship as a rigid body. The damping coefficient CC within the energy harvester can be expressed as the sum of the mechanical damping (CCm) and the damping (CCe) generated by the electromechanical effect of the first set of coils and magnet M, thereby yielding an equivalent damping value. As discussed in Section 4, both the marine conditions (Zo, λ) and the geometric parameters of the energy harvester (DMG1, HMG1, kk1, NNC1, NNL1, DMG2, HMG2, kk2, NNC2, NNL2, DMG3, HMG3, kk3, NNC3, NNL3) have a significant impact on the induced electrical power. To optimize the electrical output by adjusting the harvester’s geometric parameters, Equation (15) is employed with the marine conditions set to V = 3 m/s, Zo = 0.4 m, and λ = 2 m. The design parameter ranges are predefined and summarized in Table 2. The flower pollination algorithm (FPA) is then applied to maximize the power generation of the three-magnet energy harvester.
Table 2.
The ranges of the parameters for the three-magnet energy harvester.
6. Results and Discussion
6.1. Results
Using Equation (20) and Table 2 in conjunction with the FPA optimizer, the optimal results are obtained and presented in Table 3. As revealed in Table 3, the maximal root-mean-square electrical power of 0.1943 Watt was achieved at the 12th set of solutions. The corresponding optimal values of the design parameters, namely, DMG1, HMG1, kk1, NNC1, NNL1, DMG2, HMG2, kk2, NNC2, NNL2, DMG3, HMG3, kk3, NNC3, andNNL3, are 0.1 m, 0.1 m, 4000 N/m, 100 turns, 10 layers, 0.1 m, 0.1 m, 4000 N/m, 97 turns, 10 layers, 0.1 m, 0.1 m, 4001 N/m, 100 turns, and 10 layers, respectively. The optimal value of the induced root-mean-square electrical power () reaches 0.1943 Watt when the FPA control parameter set (, p, ) is (50, 0.7, 32,000).
Table 3.
Optimization results for the three-magnet energy harvester under various FPA control parameters.
Using Equation (20) and the parameter ranges listed in Table 2, the FPA optimizer was employed to obtain the optimal results, which are summarized in Table 3. As shown in Table 3, the maximum root-mean-square (RMS) electrical power of 0.1943 W is achieved at the 12th solution set. The corresponding optimal design parameters are DMG1 = 0.1 m, HMG1 = 0.1 m, kk1 = 4000 N/m, NNC1 = 100 turns, NNL1 = 10 layers; DMG2 = 0.1 m, HMG2 = 0.1 m, kk2 = 4000 N/m, NNC2 = 97 turns, NNL2 = 10 layers; and DMG3 = 0.1 m, HMG3 = 0.1 m, kk3 = 4001 N/m, NNC3 = 100 turns, NNL3 = 10 layers. The optimal RMS electrical power of 0.1943 W is obtained using the FPA control parameters Np = 50, p = 0.7, and itermax = 32,000.
Using Equation (20) and the parameter ranges listed in Table 1, the FPA optimizer was employed to obtain the optimal design results, which are summarized in Table 3. A smaller positive convergence ratio (CR) indicates improved convergence, and in this case, the CR value for the 12th solution set is 0.00154, demonstrating excellent convergence. As shown in Table 3, the maximum root-mean-square (RMS) electrical power of 0.1943 W is achieved at the 12th solution set. The corresponding optimal design parameters areDMG1 = 0.1 m, HMG1 = 0.1 m, kk1 = 4000 N/m, NNC1 = 100 turns, NNL1 = 10 layers; DMG2 = 0.1 m, HMG2 = 0.1 m, kk2 = 4000 N/m, NNC2 = 97 turns, NNL2 = 10 layers; and DMG3 = 0.1 m, HMG3 = 0.1 m, kk3 = 4001 N/m, NNC3 = 100 turns, NNL3 = 10 layers. The optimal RMS electrical power of 0.1943 W is obtained using the FPA control parameters Np = 50, p = 0.7, and itermax = 32,000.
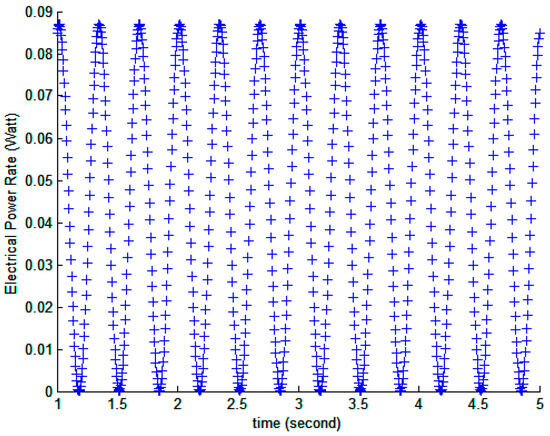
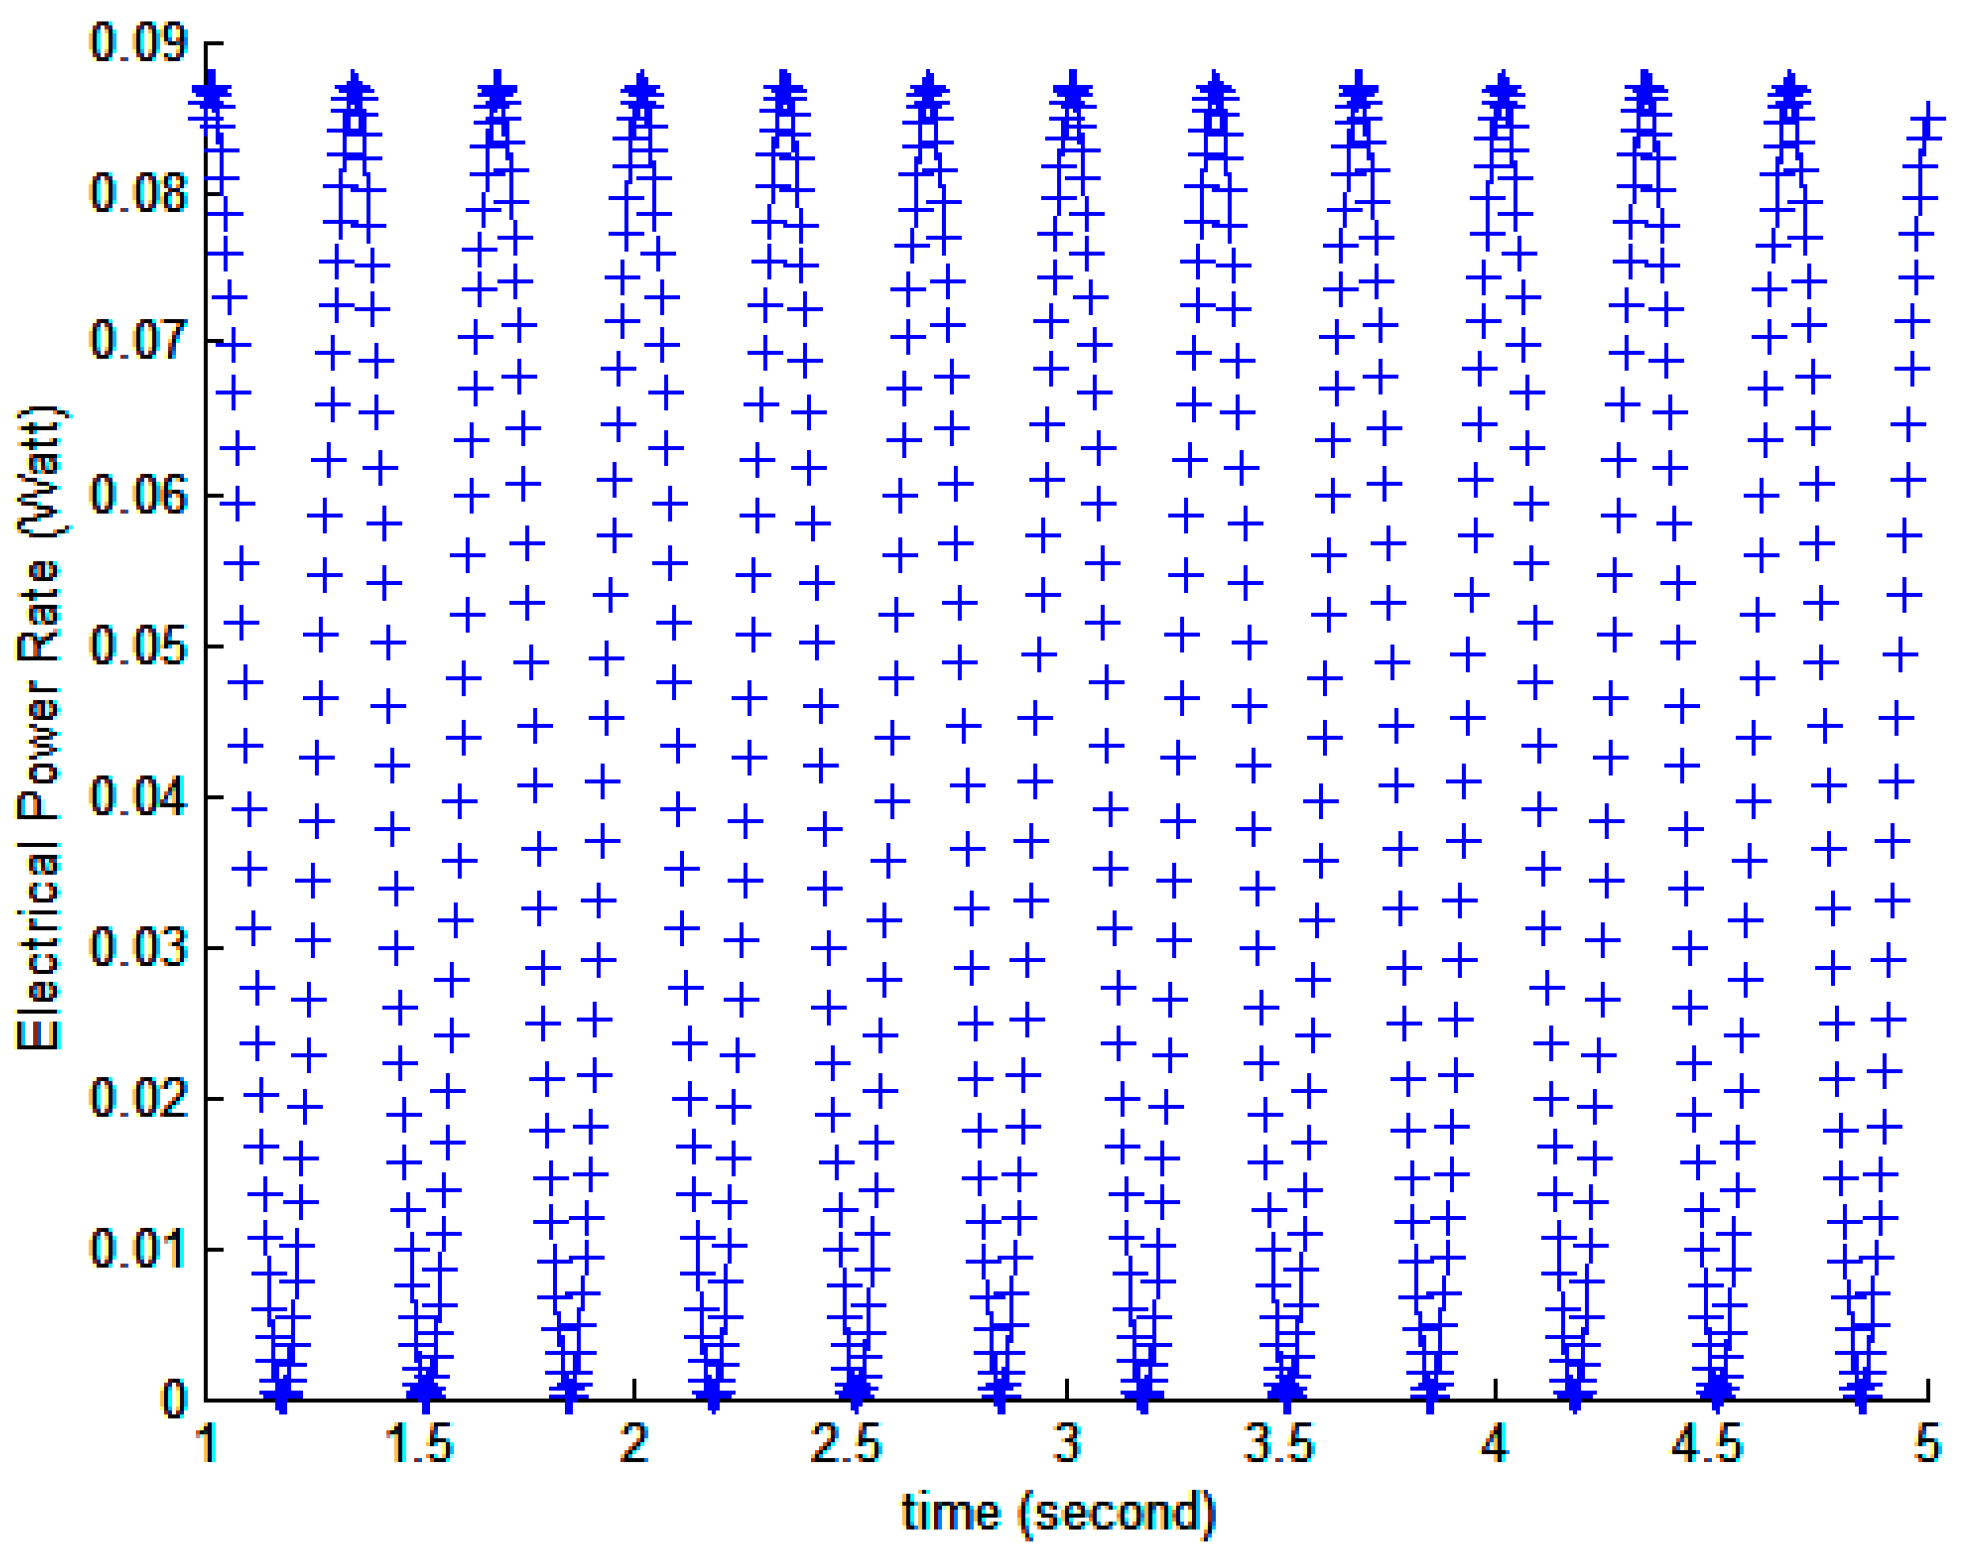
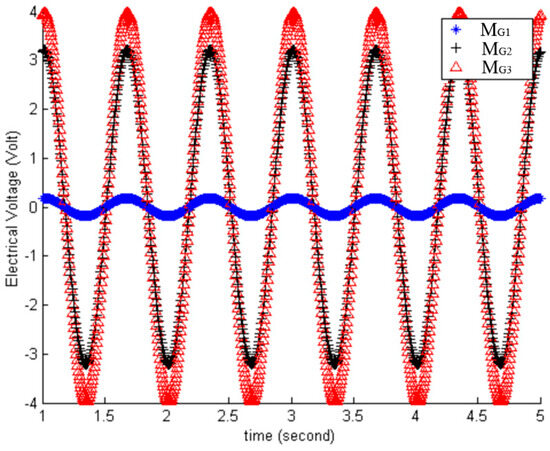
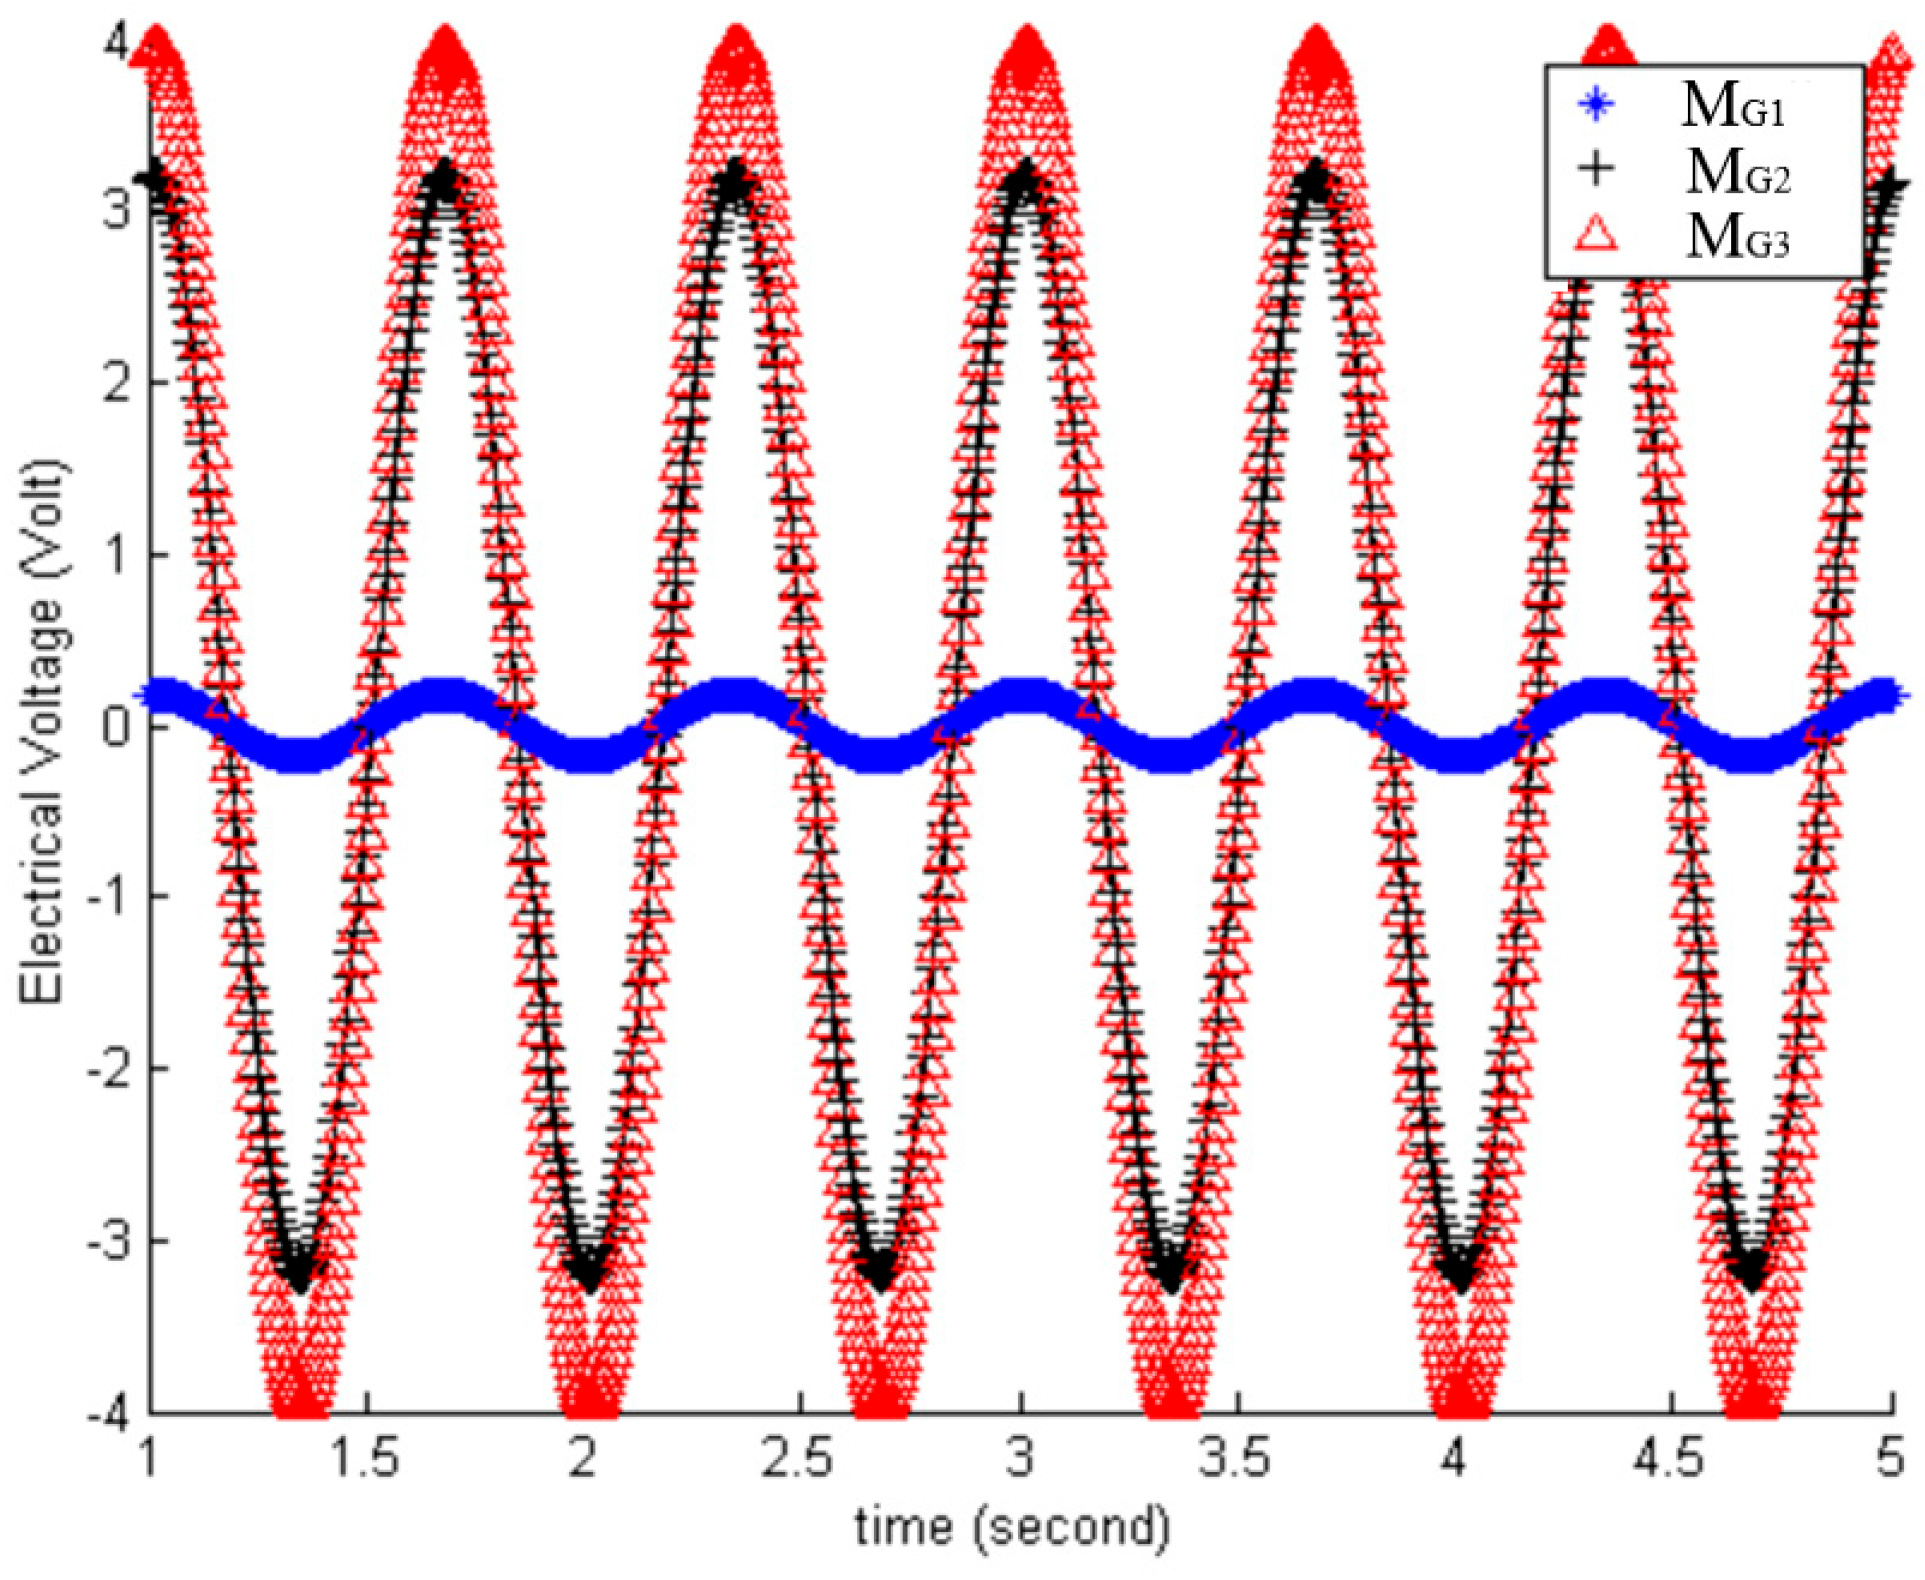
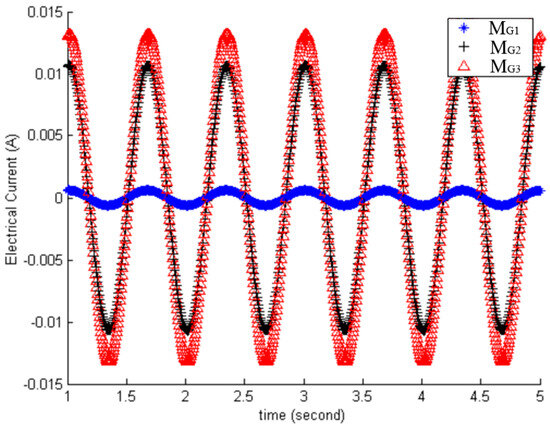
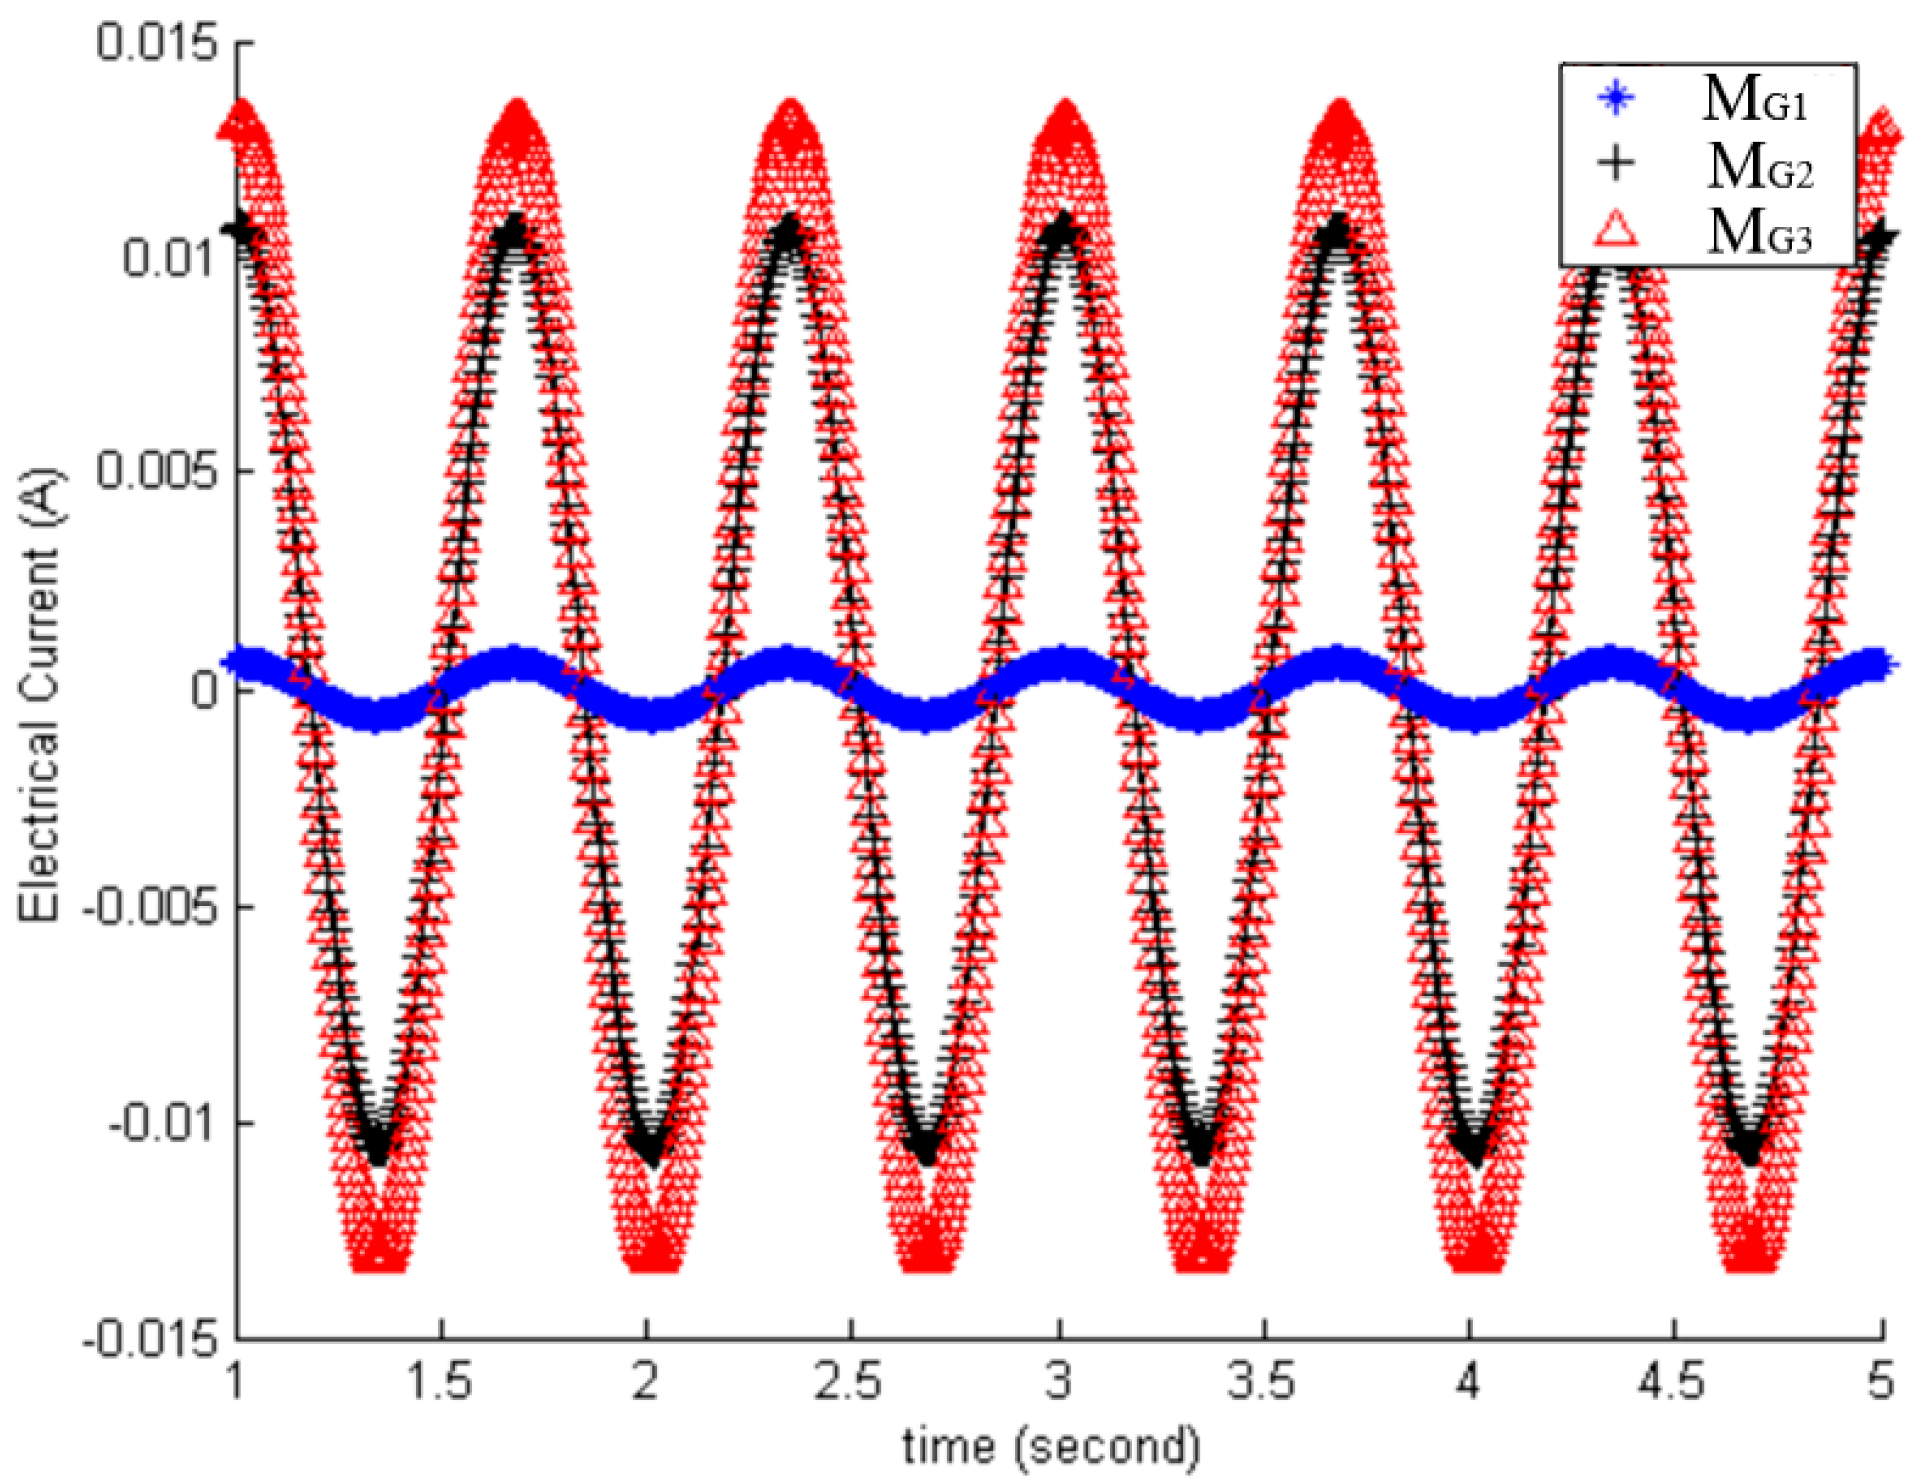
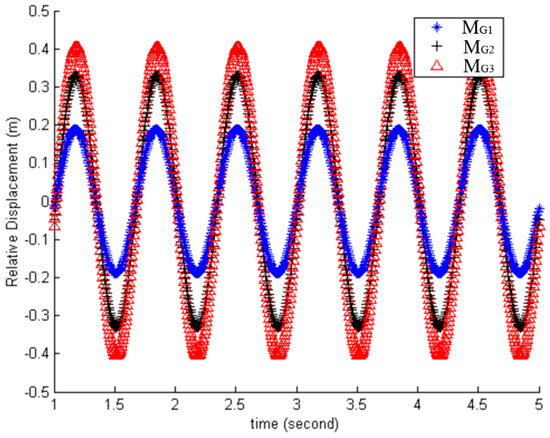
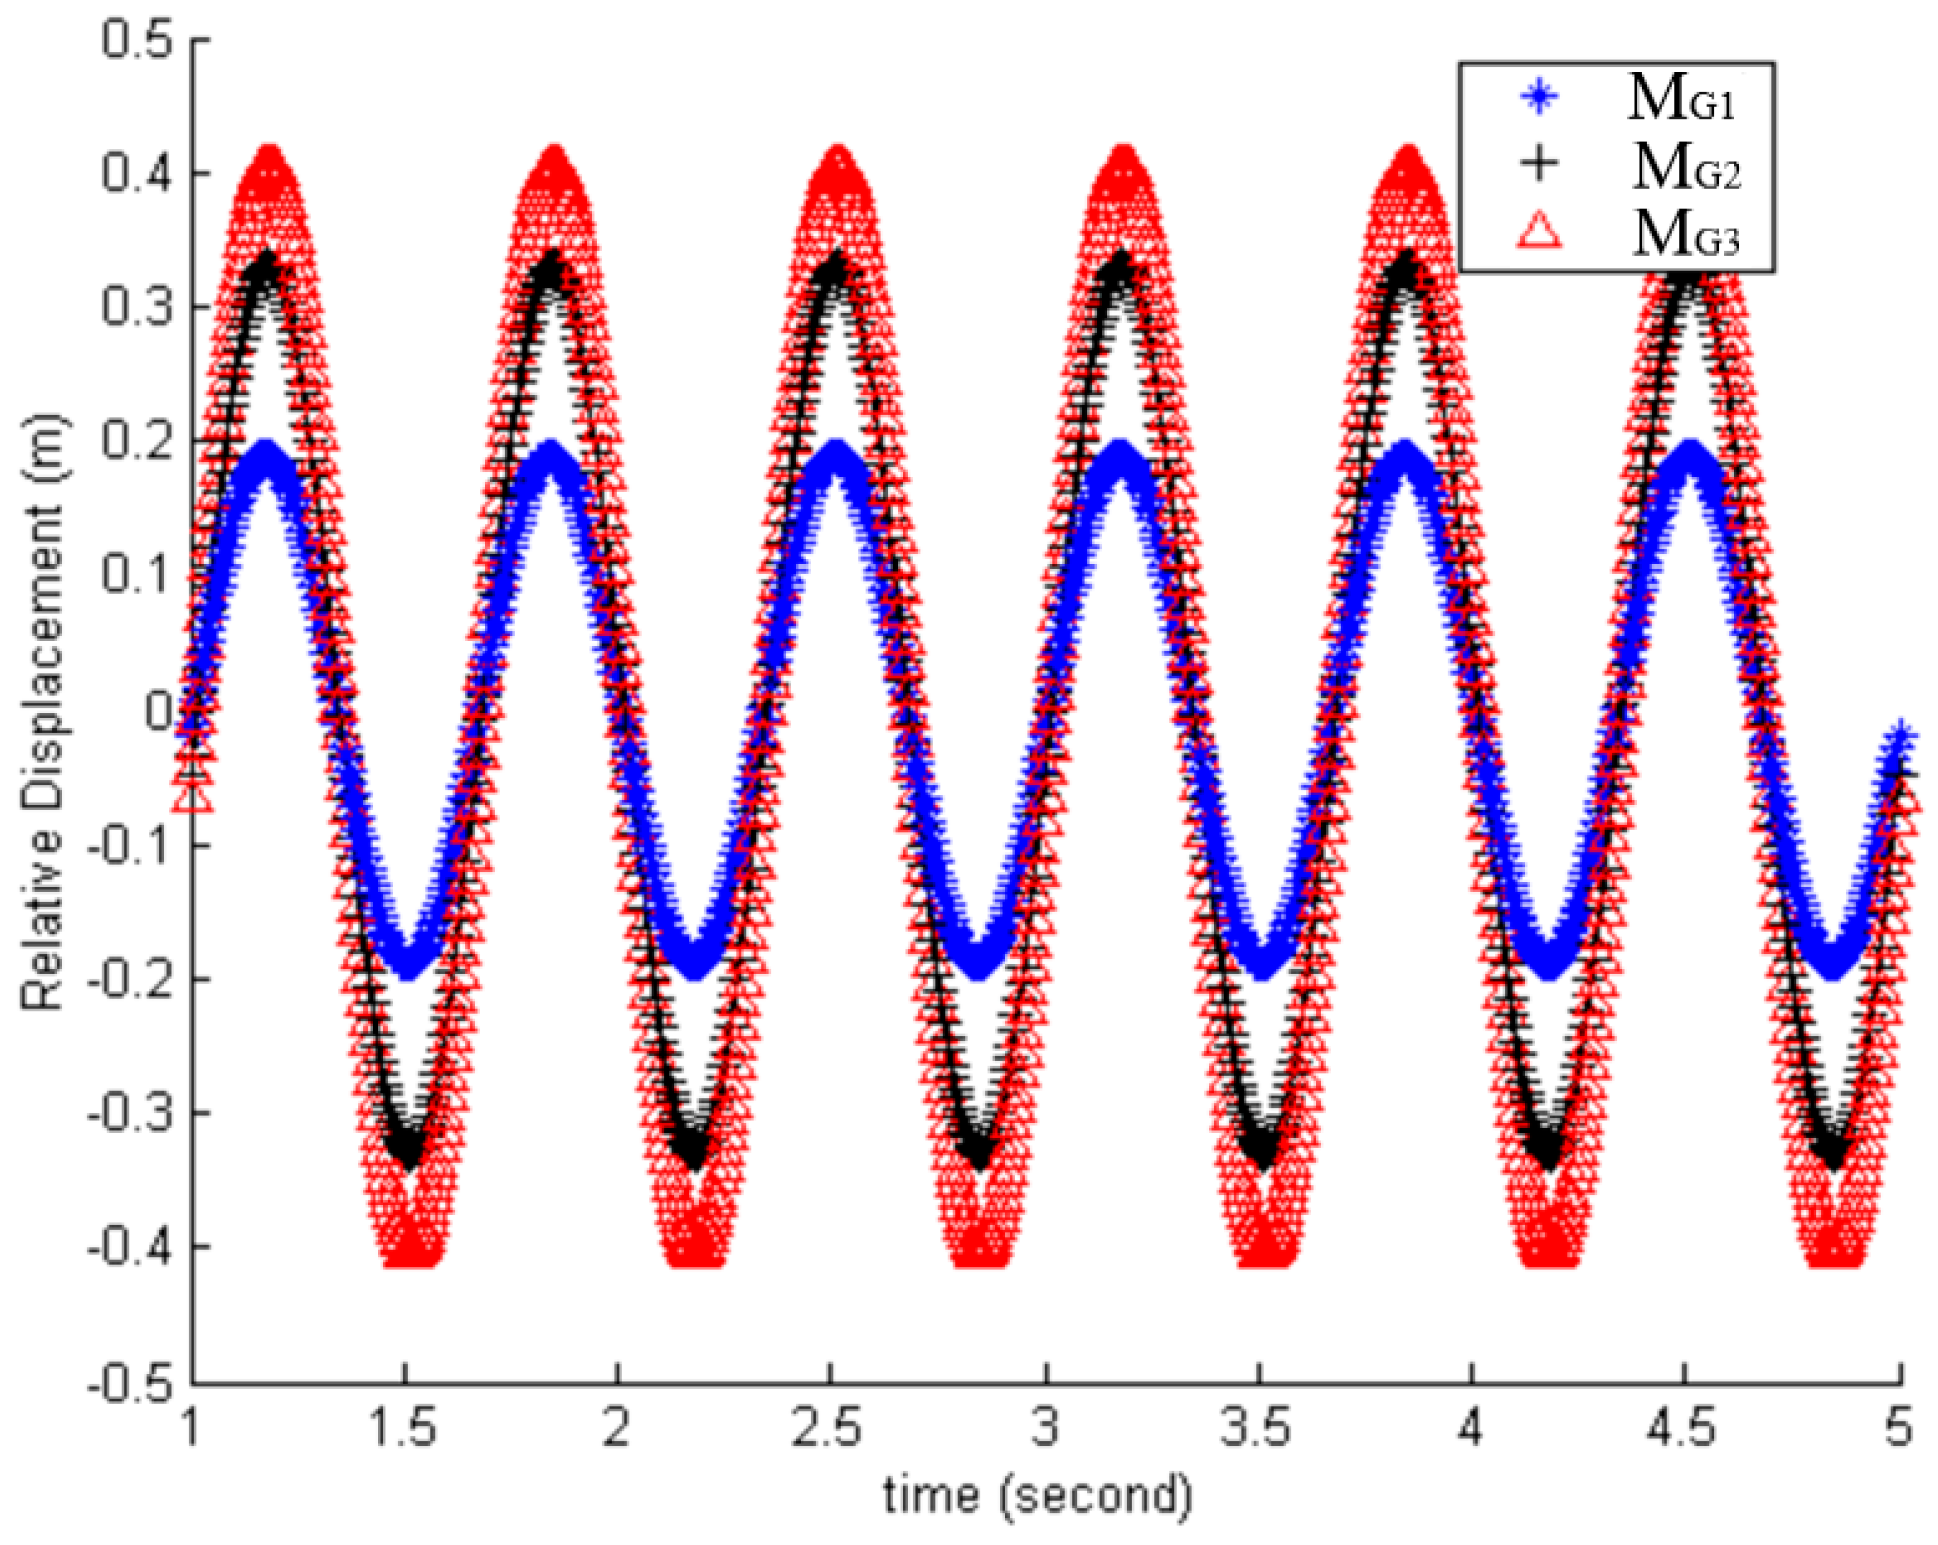
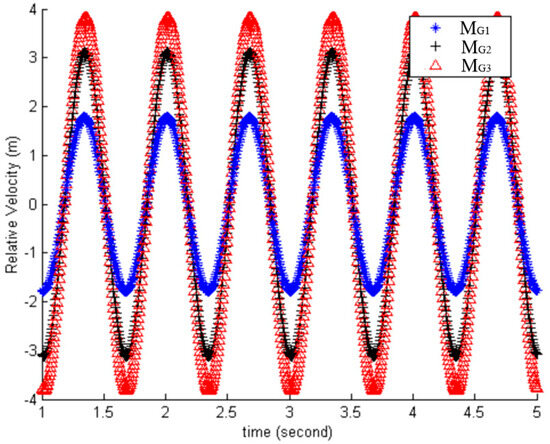
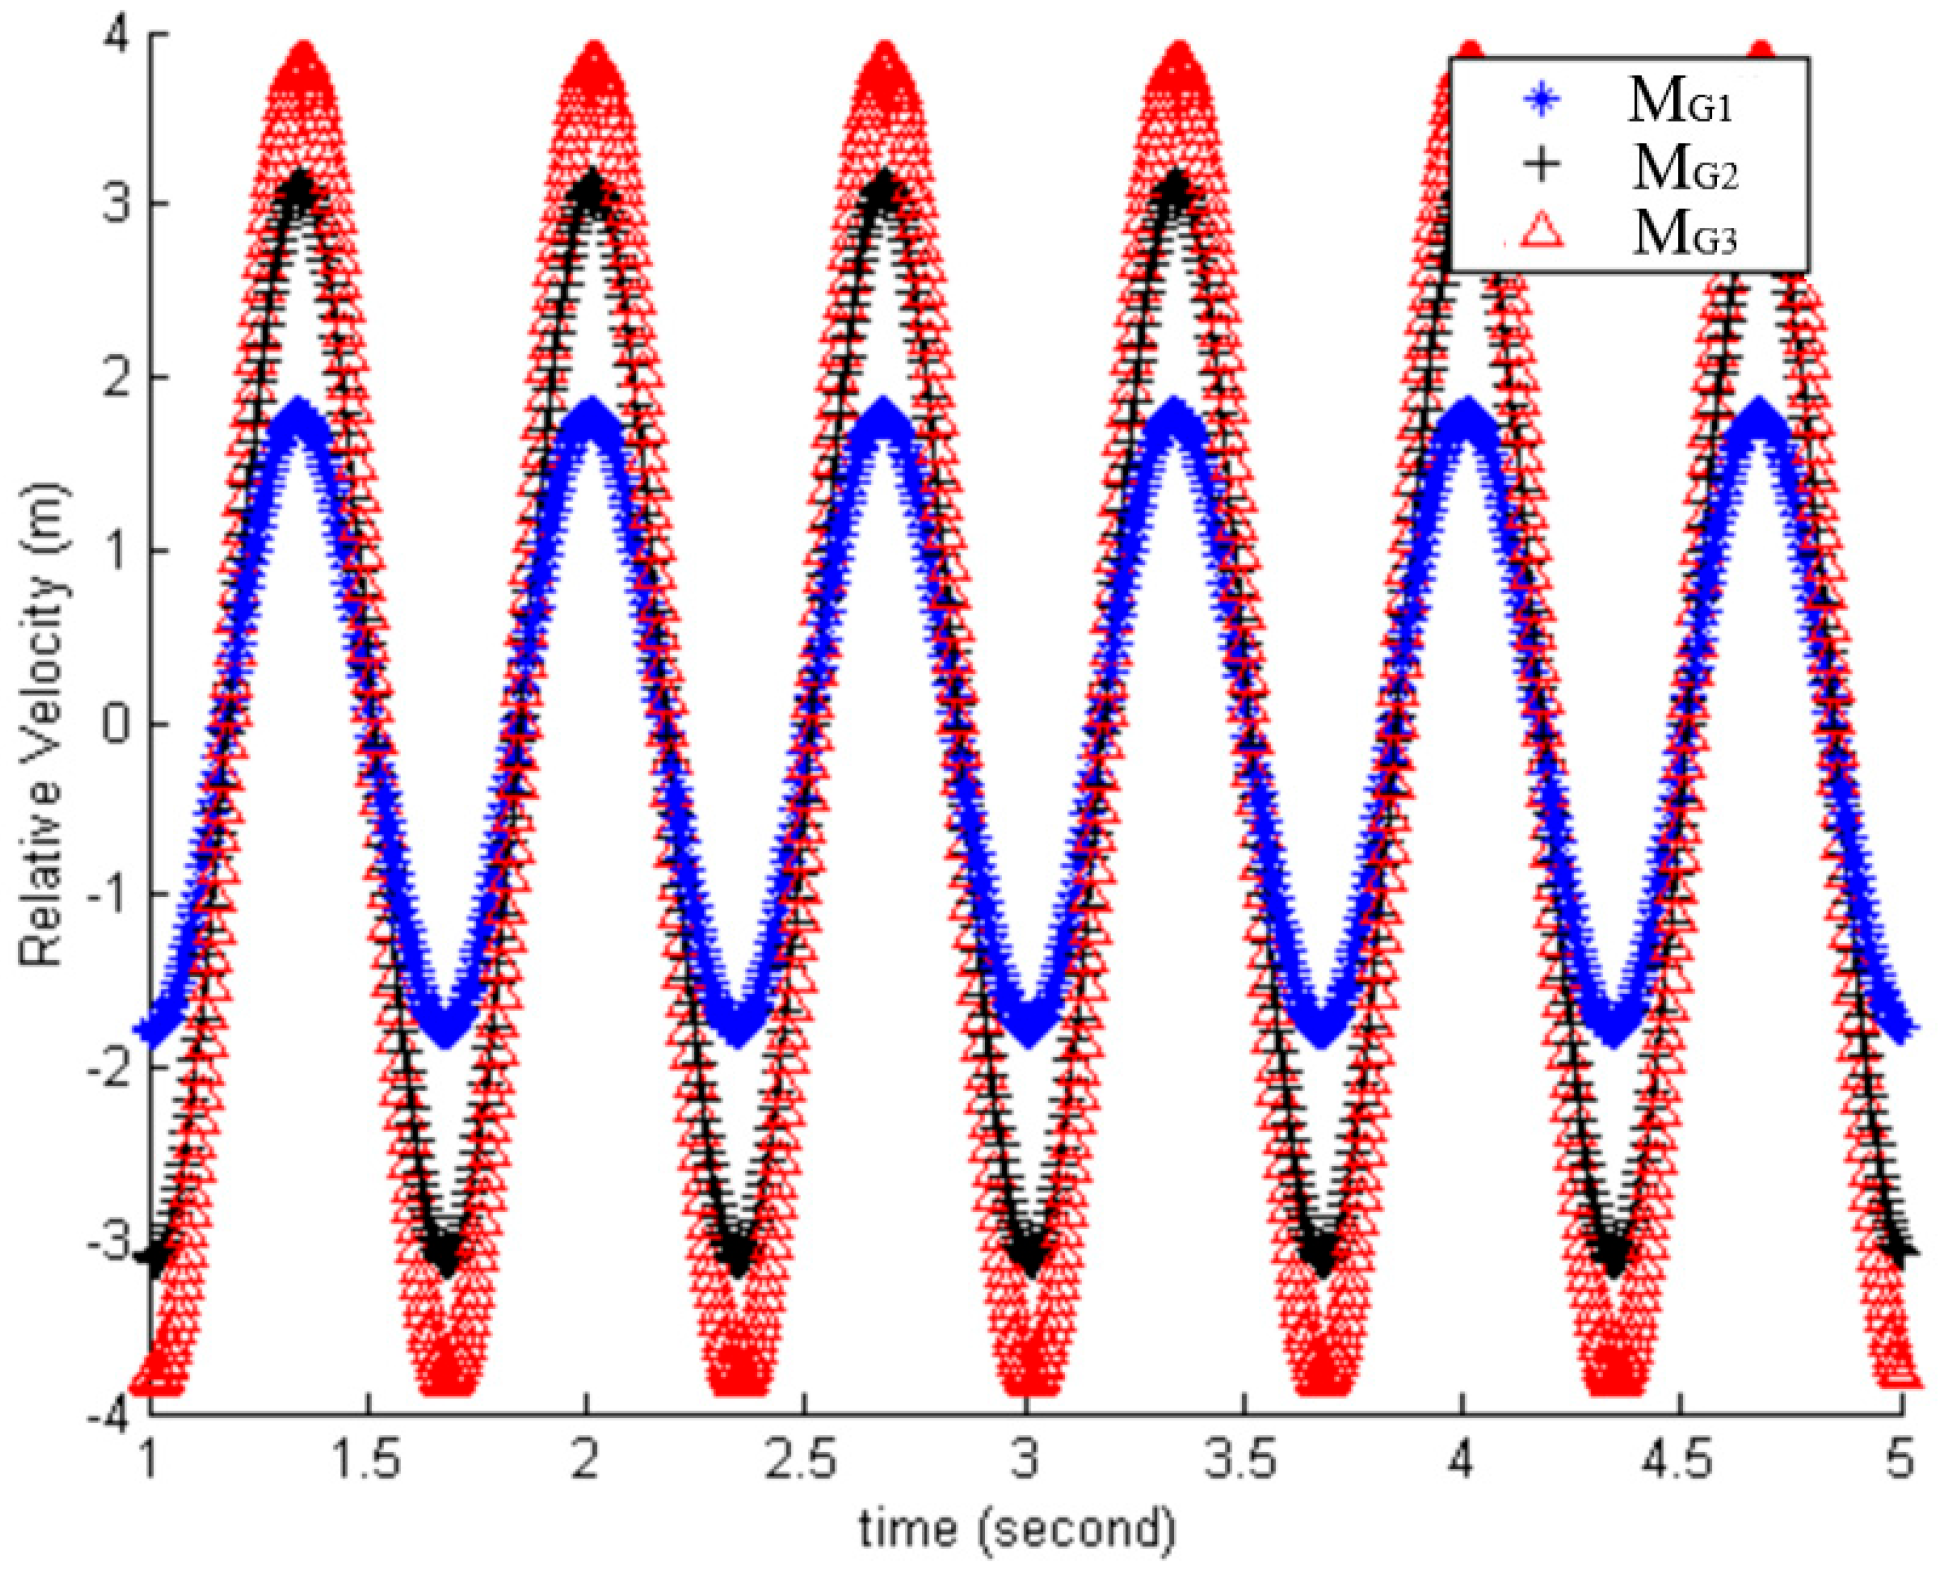
By substituting the optimal design parameters obtained from the FPA optimization into Equation (14a), the theoretical time response of the electrical power was calculated and is shown in Figure 16. Using the same design parameters in Equations (11a) and (11b), the corresponding time responses of the induced electrical voltage and current were derived and are presented in Figure 17 and Figure 18, respectively. To illustrate the relative motion of the magnets with respect to the energy harvesting base, the relative displacement curves were calculated using Equations (6)–(8) and are shown in Figure 19. The corresponding relative velocity curves, obtained by differentiating Equations (6)–(8), are plotted in Figure 20.
Figure 16.
Response of electrical power relating to time after the optimization of the three-magnet energy harvester.
Figure 17.
Response of electrical voltage relating to time after the optimization of the three-magnet energy harvester.
Figure 18.
Response of electrical current relating to time after the optimization of the three-magnet energy harvester.
Figure 19.
Response of magnets’ relative displacement relating to time after the optimization of the three-magnet energy harvester.
Figure 20.
Response of magnets’ relative velocity relating to time after the optimization of the three-magnet energy harvester.
6.2. Discussion
As discussed in Section 4, Figure 8 and Figure 9 show that the induced electrical power of the ship-based three-magnet energy harvester increases with wave amplitude and decreases with wavelength. Figure 10a–c illustrate a strong dependence of electrical power on the magnet diameters (DMG1, DMG2, DMG3), while Figure 11a–c demonstrate that the magnet heights (HMG1, HMG2, HMG3) also significantly influence the output. The effects of spring stiffness parameters (kk1, kk2, kk3) on electrical power are presented in Figure 12a–c. Furthermore, Figure 13a–c show the impact of the number of coil turns, and Figure 14a–c depict the response of electrical power to the number of coil layers. These results indicate that the geometric parameters of the energy harvester—including DMG1, HMG1, kk1, NNC1, NNL1, DMG2, HMG2, kk2, NNC2, NNL2, DMG3, HMG3, kk3, NNC3, and NNL3—are highly sensitive to the induced electrical power and are therefore selected as design variables for the optimization of the harvester. The maximum root-mean-square (RMS) electrical power occurs at the 12th optimal configuration (Table 3) when the FPA parameters (, p, ) are set to (50, 0.7, 32,000), as shown in Table 3, achieving an RMS power of 0.1943 W. From Table 3, the first set of optimized design values corresponds to the initial generation in the optimization process and can be regarded as the pre-optimization design, with a power output of 0.1072 W. The twelfth set represents the final generation of the optimization process and corresponds to the optimal design, with a power output of 0.1943 W. The increase in power output of the twelfth set (optimal design) is 81.25% compared to the first set.
Based on the design parameter sensitivity analysis in Section 4, the ranges of design parameters in Table 2 are compared with the engineering optimization results in Table 3. Table 2 shows that the diameter (DMG1–DMG3) and height (HMG1–HMG3) of the three magnets have a design range of 0.01–0.1. The optimal values in the 12th set of Table 3 indicate that both the diameters (DMG1–DMG3) and heights (HMG1–HMG3) of the magnets reach the maximum values of their respective ranges. This aligns with the sensitivity analysis in Section 4, which shows that the generated power is positively correlated with the magnet diameters and heights. In Table 2, the design range of the three springs (kk1–kk3) is 400–40,000 N/m. The optimal values in the 12th set show that all three springs have a value of 4000 N/m, which is on the lower end of the range. This is consistent with the Section 4 sensitivity analysis, where the generated power is negatively correlated with the spring constants. In Table 2, the number of turns for the three coils (NNC1–NNC3) ranges from 10–100. The optimal values in the 12th set indicate that all three coils reach the maximum value of 100. This is largely consistent with the sensitivity analysis in Section 4, which suggests a trade-off is required for NNC1, while NNC2 and NNC3 are positively correlated with power output. Finally, in Table 2, the number of coil layers (NNL1–NNL3) ranges from 1 to 10. The optimal values in the 12th set indicate that all coil layers reach the maximum value of 10. This aligns with the sensitivity analysis in Section 4, which shows a positive correlation between power output and the number of layers. Overall, the optimization results are generally consistent with the trends identified in the sensitivity analysis.
Using these optimal design parameters, the theoretical time response of electrical power (Figure 16) reaches a peak value of 0.1943 W. The corresponding peak voltages for magnet #1, magnet #2, and magnet #3 (Figure 17) are 0.2 V, 3.2 V, and 4.0 V, respectively, while the peak currents (Figure 18) are 0.001 A, 0.011 A, and 0.013 A, respectively. Moreover, the time response of magnet displacements (Figure 19) shows amplitudes of 0.18 m, 0.33 m, and 0.4 m for magnets #1, #2, and #3, respectively. The corresponding peak velocities (Figure 20) are 1.75 m/s, 3.1 m/s, and 3.8 m/s, respectively.
The maximum root-mean-square (RMS) electrical power is achieved at the 12th optimal configuration (Table 3) with FPA parameters Np = 50, p = 0.7, and itermax = 32,000, resulting in an RMS power of 0.1943 W. Using these optimal design parameters, the theoretical time response of the electrical power (Figure 16) reaches the same peak of 0.1943 W. The corresponding peak voltages for magnets #1, #2, and #3 (Figure 17) are 0.2 V, 3.2 V, and 4.0 V, respectively, while the peak currents (Figure 18) are 0.001 A, 0.011 A, and 0.013 A, respectively. The time responses of the magnet displacements (Figure 19) show amplitudes of 0.18 m, 0.33 m, and 0.4 m for magnets #1, #2, and #3, respectively, with corresponding peak velocities (Figure 20) of 1.75 m/s, 3.1 m/s, and 3.8 m/s.
This study proposes a ship-based self-powered design that does not interfere with deck operations, is easy to install, and is not constrained by a fixed area [17,18,19] or a cabin space [20]. By utilizing the bottom excitation of the vessel induced by wave motion and placing the energy harvesting device above the sea surface, the proposed approach avoids the unpredictable and harsh underwater environmental effects reported in refs. [14,15]. Based on surface wave effects and under the assumption that the ship behaves as a rigid body, the dynamic equations of motion are derived using the energy method. The relative displacement and velocity of the magnet in the vibration energy harvester are analytically obtained using the complex variable method. The induced voltage and electrical power generated from the magnetoelectric effect are then calculated. The theoretical electrical power predicted by the mathematical model is further compared with experimental results to validate the model’s reliability.
To determine the optimal design of the vibration energy harvester, two bio-inspired algorithms—the flower pollination algorithm (FPA) and the simulated annealing (SA) algorithm—are employed. Compared with traditional gradient-based methods, bio-inspired algorithms are more effective in identifying global optimal solutions. Among them, SA is also a commonly used method. In this study, both FPA and SA are applied to an engineering optimization case of ship-based wave energy generation, and the results show that FPA outperforms SA. Under the conditions of a wave velocity of 3.0 m/s, wave amplitude of 0.4 m, and wavelength λ = 2.0 m, the optimization results indicate that the energy harvester can generate a maximum electrical power of 0.1943 W. In contrast, the wave energy generation system located inside a ship cabin reported in ref. [20], under conditions of wave velocity 2.0 m/s, wave amplitude 0.4 m, and wavelength λ = 4.0 m, achieves an optimized power output of 0.1497 W. These results show that the proposed method yields slightly higher power output than that in ref. [20].
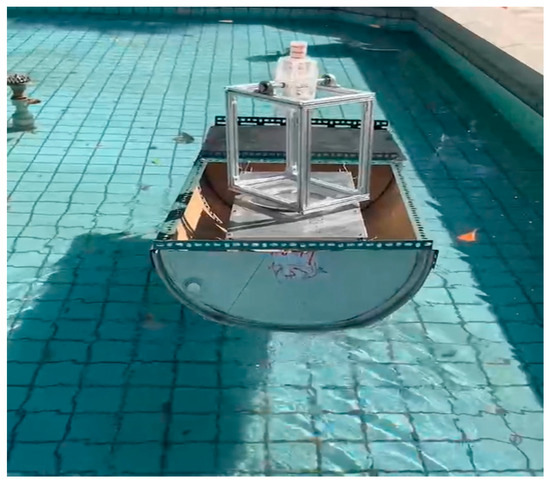
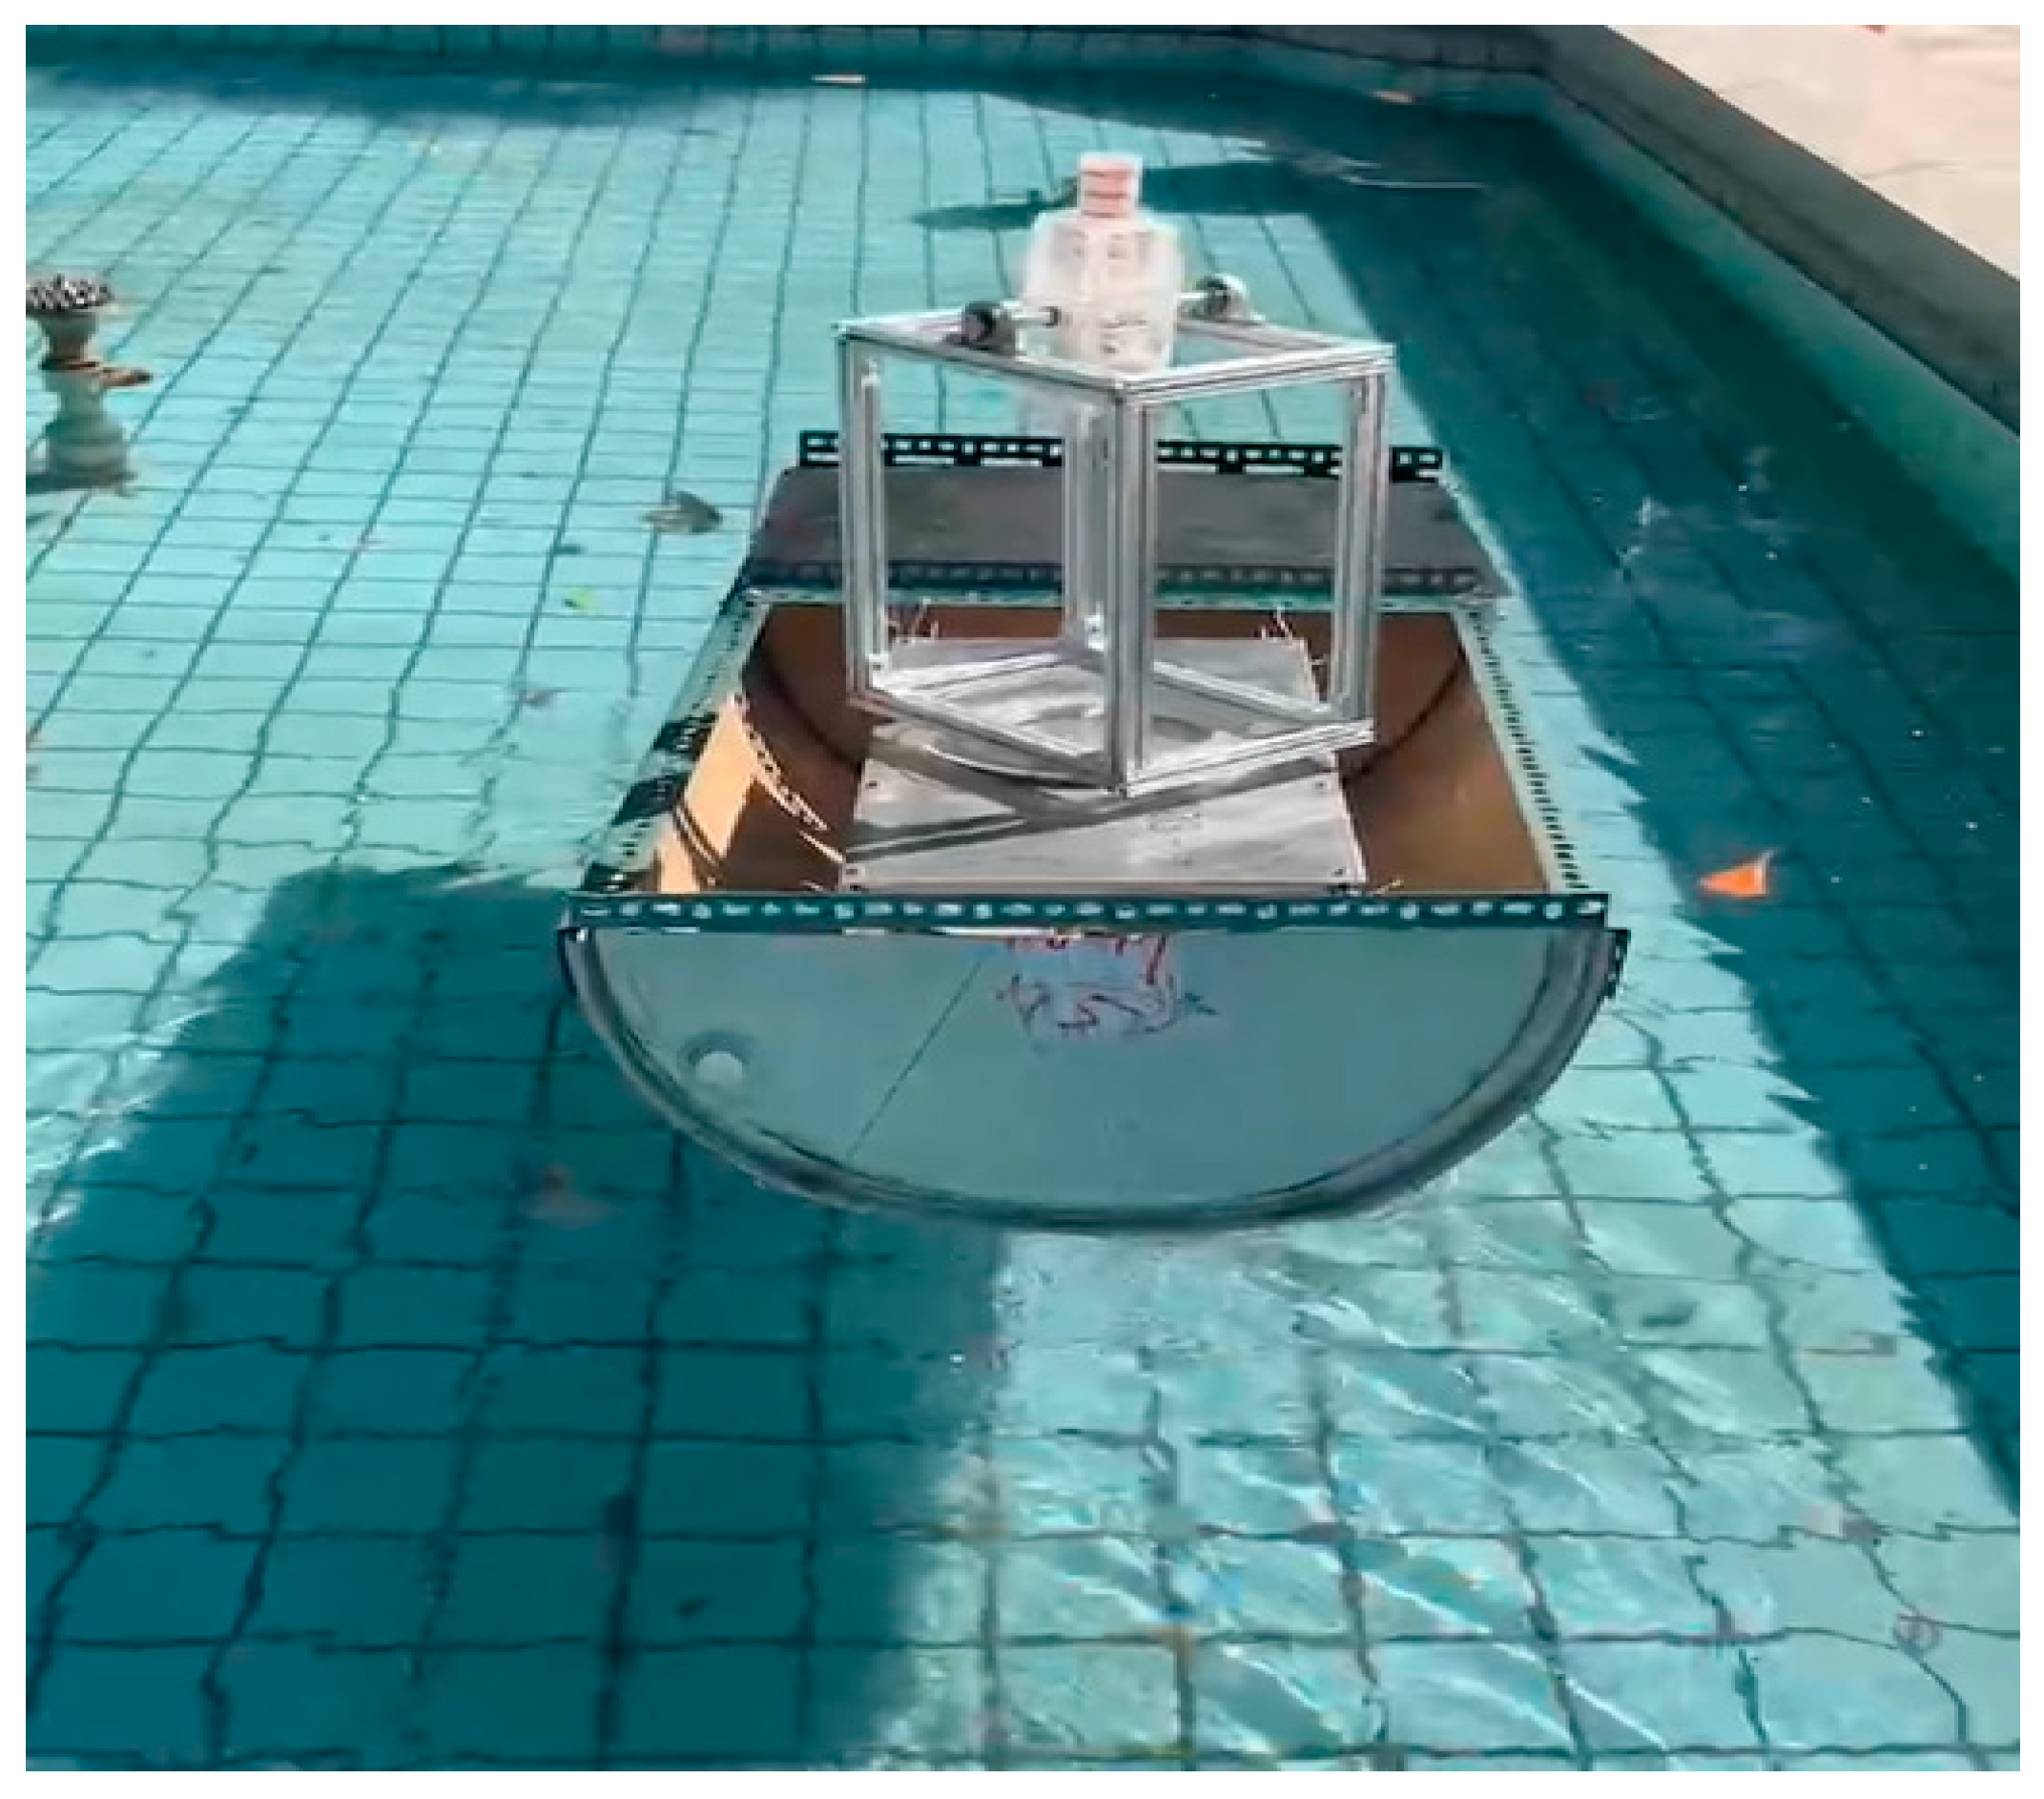
In terms of practical engineering feasibility, the proposed ship-mounted energy harvester is installed on the deck and is easy to use, whereas the cabin-based wave energy system in Ref. [20] may interfere with onboard operations. However, the power output of the proposed system remains relatively low. This limitation could be mitigated by deploying multiple vibration energy harvesters across the deck to increase total power generation. In addition, this study carries out an engineering optimization design for the ship’s wave-excited self-power generation system and has also completed a miniaturized prototype shown in Figure 21.
Figure 21.
A prototype of a ship-based energy harvester in the pool.
7. Conclusions
This study proposes a design concept for ship-based self-power generation in marine environments in which the location of power generation at sea is not restricted. By installing the self-power generation system on the vessel, risks associated with harsh underwater sea conditions can be avoided. The proposed device is easy to install and does not interfere with onboard operations or navigational safety. Specifically, an autonomous power-generation ship concept is introduced, employing multiple magnet-based energy harvesters mounted on the deck and driven by wave-induced vertical ship motions. In addition, it is necessary to satisfy the requirement that ocean wave slopes remain below 1 m per 7 m of wavelength.
In this study, a three-magnet energy harvester integrated with springs and coil sets is adopted as a demonstrative system. Prior to optimization, the accuracy of the mathematical model was validated against experimental data. Furthermore, a sensitivity analysis was conducted to assess the influence of marine parameters and the harvester’s geometric parameters. The optimization objective is to maximize the electrical power output, formulated through an objective function based on the total root-mean-square (RMS) electrical power and solved using the flower pollination algorithm (FPA). The optimal design achieves an RMS electrical power of 0.1943 W, with voltages induced by the three magnets ranging from 0.2 to 4.0 V and currents from the three coil sets ranging from 0.001 to 0.013 A.
In conclusion, this study presents a new approach for harvesting energy from ocean waves using a piston-type energy harvester installed on a ship deck. From a practical application perspective, although the current power output is relatively small (0.1943 W) and does not meet the target power requirement for deep-sea sensing equipment (0.5–1 W), multiple energy harvesting devices can be installed simultaneously on the deck in future implementations to achieve the desired power level. Furthermore, to enhance the utilization of the generated electricity, future work will focus on energy storage design and remote power monitoring systems.
Supplementary Materials
The following supporting information can be downloaded at: https://www.mdpi.com/article/10.3390/vibration9020026/s1.
Author Contributions
H.-C.C.: conceptualization, methodology, software, validation, formal analysis, investigation, data curation, visualization; M.-C.C.: conceptualization, methodology, software, writing—original draft, formal analysis, funding Acquisition, project administration; M.-G.H.: validation, resources, writing—review and editing, supervision, project administration. All authors have read and agreed to the published version of the manuscript.
Funding
National Science and Technology Council (NSTC 112-2221-E-036-008, TW).
Data Availability Statement
Data generated or analyzed during this study are provided in full within the published article.
Acknowledgments
The authors recognize the financial support of National Science and Technology Council (NSTC 112-2221-E-036-008, TW).
Conflicts of Interest
The authors declare no conflicts of interest.
Abbreviations
The following abbreviations are used throughout the paper:
| Abbreviations | |
| FPA | Flower pollination National Science and Technology Council (NSTC 112-2221-E-036-008, TW).algorithm |
| Nomenclature | |
| Acoil | the cross-sectional area of the coil wire (m2) |
| BB | magnetic flux density (T/tesla) |
| BBy | magnetic flux density along the y-axis (T) |
| cce1, cce2, cce3 | the coil’s electromagnetic damping coefficient (N-m s−1) |
| ccm1, ccm2, ccm3 | equivalent mechanical damping coefficient(N-m s−1) |
| CC1, CC2, CC3 | the vibration system damping coefficient (N-m s−1) |
| dcoil | the coil wire diameter (m) |
| DD | damping energy |
| DDC1, DDC2, DDC3 | coil diameter (m) |
| DMG1, DMG2, DMG3 | diameter of permanent magnet (m) |
| HMG1, HMG2, HMG3 | permanent magnet height (m) |
| the maximal number of FPA iterations | |
| kk1, kk2, kk3 | the spring constant of the vibration system (N/m) |
| levy distribution | |
| LLC1, LLC2, LLC3 | coil length (m) |
| MG1, MG2, MG3 | mass of permanent magnet (kg) |
| standard normal distribution | |
| normal distribution with the mean value 0 and variance | |
| NNC1, NNC2, NNC3 | coil turns |
| NNL1, NNL2, NNL3 | the number of coil layers |
| NP | population size |
| nnj | coil turn density around the j-th magnet |
| OBJ1 | objective function |
| the induced electrical power in the i-th coil set(Watt) | |
| total electrical power(Watt) | |
| total RMS electrical power(Watt) | |
| p | probability of global pollination |
| Riner | the coil wire’s electrtical resistance (Ω) |
| RL1, RL2, RL3 | the load resistance of the electromagnetic energy harvester (Ω) |
| a D-dimensional random vector whose components lie in [0, 1]. | |
| TT | kinetic energy |
| V | the surface wave velocity (m s−1) |
| VV | potential energy |
| the current global best solution | |
| the i-th solution at iteration t. | |
| the i-th solution at iteration t + 1” | |
| xh(t) | the vertical movement of the h-th magnet (m) |
| Xh(t) | the amplitude of the vertical displacement of the h-th magnet (m) |
| the relative velocity of the h-th magnet with respect to the energy harvester’s base (m) | |
| xxrh(t) | the h-th magnet’s relative displacement relative to the energy harvester base (m) |
| wave amplitude (m) | |
| the wave’s angular velocity (rad/s) | |
| a step factor. | |
| standard gamma function | |
| electromagnetically induced voltage (Volt) | |
| T | overall induced voltage |
| electrical resistivity coefficient of coil () | |
| wavelength (m) | |
References
- Constantinou, P.; Mellor, P.H.; Wilcox, P. Model of an electromagnetic vibration generator. In Proceedings of the 41st International Universities Power Engineering Conference (UPEC ’06), Newcastle upon Tyne, UK, 6–8 September 2006; IEEE: New York, NY, USA, 2007; pp. 6–10. [Google Scholar]
- Constantinou, P.; Mellor, P.H.; Wilcox, P. A model of a magnetically sprung vibration generator for power harvesting applications. In Proceedings of the IEEE International Electric Machines & Drives Conference (IEMDC ’07), Antalya, Türkiye, 3–5 May 2007; IEEE: New York, NY, USA, 2007; pp. 725–730. [Google Scholar]
- Lallart, M.; Anton, S.R.; Inman, D.J. Frequency self-tuning scheme for broadband vibration energy harvesting. J. Intell. Mater. Syst. Struct. 2010, 21, 897–906. [Google Scholar] [CrossRef] [Scilit]
- Li, H.; Pillay, P. A methodology to design linear generators for energy conversion of ambient vibrations. In Proceedings of the 2008 IEEE Industry Applications Society Annual Meeting IAS ’08, Edmonton, AB, Canada, 5–9 October 2008; IEEE: New York, NY, USA, 2008; pp. 1–8. [Google Scholar]
- Saha, C.R.; O’Donnell, T.; Wang, N.; McCloskey, P. Electromagnetic generator for harvesting energy from human motion. Sens. Actuators A Phys. 2008, 147, 248–253. [Google Scholar] [CrossRef] [Scilit]
- Morais, R.; Silva, N.; Santos, P.; Frias, C.; Ferreira, J.; Ramos, A.; Simõesd, J.; Baptista, J.; Reis, M. Permanent magnet vibration power generator as an embedded mechanism for smart hip prosthesis. Procedia Eng. 2010, 5, 766–769. [Google Scholar] [CrossRef] [Scilit]
- Park, J.C.; Bang, D.H.; Park, J.Y. Micro-fabricated electromagnetic power generator to scavenge low ambient vibration. IEEE Trans. Magn. 2010, 46, 1937–1942. [Google Scholar] [CrossRef] [Scilit]
- Stephen, N.G. On energy harvesting from ambient vibration. J. Sound Vib. 2006, 293, 409–425. [Google Scholar] [CrossRef] [Scilit]
- Kimoulakis, N.M.; Kladas, A.G.; Tegopoulos, J.A. Power generation optimization from sea waves by using a permanent magnet linear generator drive. IEEE Trans. Magn. 2008, 44, 1530–1533. [Google Scholar] [CrossRef] [Scilit]
- Farshidianfar, A.; Nabavi, S.F. Novel piezoelectric-based ocean wave energy harvesting from offshore buoys. Appl. Ocean Res. 2018, 76, 174–183. [Google Scholar] [CrossRef] [Scilit]
- Safian, A.; Soleimani, A. Piezoelectric energy harvesting from direct buoyancy force. In Proceedings of the 3rd International Conference on Mechanical and Aerospace Engineering, Tehran, Iran, 17 April 2018. [Google Scholar]
- Berenjkoob, M.N.; Ghiasi, M.; Soares, C.G. Influence of the shape of a buoy on the efficiency of its dual-motion wave energy conversion. Energy 2020, 214, 118998. [Google Scholar] [CrossRef] [Scilit]
- Chiu, M.C.; Karkoub, M.; Her, M.G. Energy harvesting devices for subsea sensors. Renew. Energy 2017, 101, 1334–1347. [Google Scholar] [CrossRef] [Scilit]
- Chiu, M.C.; Karkoub, M.; Her, M.G. Two-magnet energy harvesting device for charging submersable sensors. Renew. Energy 2020, 152, 120–137. [Google Scholar] [CrossRef] [Scilit]
- Chiu, M.C.; Karkoub, M.; Her, M.G. A comparative study of buoy-actuated energy harvesting devices for submersible sensors. ASCE J. Energy Eng. 2020, 146, 04020042. [Google Scholar] [CrossRef] [Scilit]
- Chiu, M.C.; Cheng, H.C. Optimization of buoy-type energy harvesting device in lake using firefly algorithm. J. Mech. 2023, 39, 161–174. [Google Scholar] [CrossRef] [Scilit]
- Chiu, M.C.; Cheng, H.C. Enhancing buoy-based swinging energy harvesters through bat algorithm optimization: A comprehensive study. J. Mech. 2024, 40, 203–222. [Google Scholar] [CrossRef] [Scilit]
- Chiu, M.C.; Cheng, H.C.; Her, M.G. A two-magnet energy harvesting device with buoy base for a marine terminal. AIP Adv. 2024, 14, 045238. [Google Scholar] [CrossRef] [Scilit]
- Chiu, M.C.; Cheng, H.C. Optimizing energy harvesting from ship-based buoys using bat algorithm: A study. AIP Adv. 2024, 14, 055314. [Google Scholar] [CrossRef] [Scilit]
- Chiu, M.C.; Cheng, H.C. Optimizing efficiency of a ship’s two-magnet energy harvesting device using the cuckoo search algorithm. J. Low Freq. Noise Vib. Act. Control 2025, 43, 1910–1938. [Google Scholar] [CrossRef] [Scilit]
- Yang, X.S.; Karamanoglu, M.; He, X. Flower pollination algorithm: A novel approach for multiobjective optimization. Eng. Optim. 2014, 46, 1222–1237. [Google Scholar] [CrossRef] [Scilit]
- US Army Corps of Engineers. Shore Protection Manual; Department of the Army, US Army Corps of Engineers: Washington, DC, USA, 1984.

Disclaimer/Publisher’s Note: The statements, opinions and data contained in all publications are solely those of the individual author(s) and contributor(s) and not of MDPI and/or the editor(s). MDPI and/or the editor(s) disclaim responsibility for any injury to people or property resulting from any ideas, methods, instructions or products referred to in the content. |
© 2026 by the authors. Licensee MDPI, Basel, Switzerland. This article is an open access article distributed under the terms and conditions of the Creative Commons Attribution (CC BY) license.