


Abstract
Passive Fourier transform infrared (FTIR) spectral imaging technology is easily affected by complex background radiation for leakage monitoring at natural gas stations, leading to low gas identification sensitivity, poor detection accuracy and a high false alarm rate. To address these issues, the spectral characteristics of typical background interference sources and their impact mechanisms were first analyzed in this work. Subsequently, a targeted background denoising method was developed and then on-site gas release experiments were conducted in a typical natural gas station. The results demonstrated that the proposed background denoising method can effectively suppress complex environmental background interference and reduce the false alarm rate. This study provides a solution for enhancing the reliability and practicality of passive FTIR spectral imaging technology in remote gas leakage monitoring at industrial sites.
1. Introduction
With the transformation and upgrading of the global energy structure, the consumption of natural gas as a clean energy source has been on a steady rise and the safety monitoring of its transportation and storage processes has become a core concern of the industry. As key nodes in the transmission and distribution system, natural gas stations are prone to gas leakage caused by human operation errors and integrity failure of equipment and facilities due to their characteristics of dense equipment, crisscrossing pipelines and high-pressure, flammable media. Such leakage may further trigger major safety accidents such as fires and explosions, leading to casualties and economic losses. Typical incidents include the Petronas Gas Pipeline Explosion (Putra Heights, Selangor, Malaysia), TC Energy Pipeline Rupture Explosion (Edson, Alberta, Canada) and Fujia Natural Gas Station Pipeline Explosion (Sichuan province, China), all of which pose severe threats to public safety and the ecological environment. And enhancing the early leakage monitoring and detection capability of natural gas stations is of great significance for curbing and preventing major accidents.
Traditional point-domain monitoring gas sensors [1], for example, catalytic combustion and electrochemical sensors, and line-domain monitoring gas detectors such as TDLAS [2], DOAS [3] and LiDAR [4] have limitations such as a narrow monitoring range, high false alarm rates affected by installation positions and meteorological conditions and a single type of detectable gas, making them unable to meet the demand for large-range, long-distance and multi-component leakage monitoring. In recent years, the area-domain monitoring passive Fourier transform infrared (FTIR) spectral imaging technology [5,6,7,8] has gradually become a cutting-edge technology in the field of remote gas leakage monitoring due to its advantages of non-contact, high-throughput, broadband and synchronous identification of multiple components [9]. This technology realizes the quantitative inversion of leaked gas by capturing the characteristic absorption spectrum of target gas against background infrared radiation and is particularly suitable for the visual monitoring of gas plumes in open spaces.
Although passive FTIR spectral imaging technology achieves remarkable monitoring and detection results in laboratories and simple scenarios, its engineering application in complex industrial sites especially for micro-leakage monitoring in natural gas stations still faces challenges. The station environment contains various strong radiation background interference sources. High-temperature equipment and pipelines emit intense infrared radiation, whose spectra are prone to overlap with gas absorption peaks. The reflectivity of vegetation such as trees and lawns changes under solar radiation, easily introducing radiation noise. The ground, wall surfaces and mountainous areas form a spatially heterogeneous background due to differences in material properties and temperature and humidity. The atmospheric window fluctuation, cloud reflection and absorption of atmospheric components, for example water vapor and CO2, in the sky background cause spectral baseline drift. These interferences lead to a significant reduction in the signal-to-noise ratio (SNR) of the collected infrared spectra, mainly manifested in three aspects. Firstly, weak absorption peaks of target gases are submerged by background noise, resulting in decreased sensitivity especially for low-concentration micro-leakage of gas. Then spectral characteristic distortion degrades the accuracy of gas identification and mis-matching between methane (CH4) and water vapor spectral lines in the background atmosphere are prone to occur. Moreover, the false alarm rate increases because transient changes in background radiation such as cloud movement or sudden changes in equipment thermal state can lead to misjudged leakage events.
To address the above challenges, the interference mechanism and spectral characteristics of environmental background radiation in natural gas stations from a practical engineering perspective were first analyzed in this work. A corresponding method for deducting environmental background noise was developed and representative on-site verification tests were ultimately carried out. This study provides theoretical support and methodological tools for the application of passive FTIR technology in complex industrial environments, offering significant practical engineering value for advancing the construction of intelligent stations and the digital transformation of safety production.
2. Mechanism and Spectral Characteristics Analysis of Background Interference in Complex Environments
The infrared absorption and radiation characteristics of gas molecules provide the theoretical foundation for passive FTIR remote sensing [10]. An infrared radiative transfer model establishes the relationship between the physical properties of target gas molecules and the measured infrared radiation, enabling the separation of background radiation and the extraction of the target absorption spectrum from the observed signals. Under local thermodynamic equilibrium, the optical path from the background and target gas to the spectrometer can be approximated as a series of parallel, horizontally homogeneous layers. For each layer, the incident radiation reaching the next layer consists primarily of the radiation transmitted from the previous layer and the radiation emitted by the layer itself [11,12].
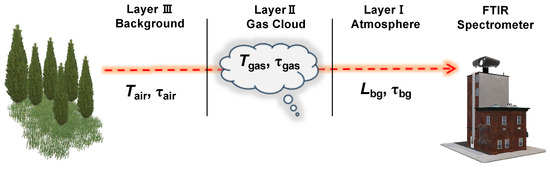
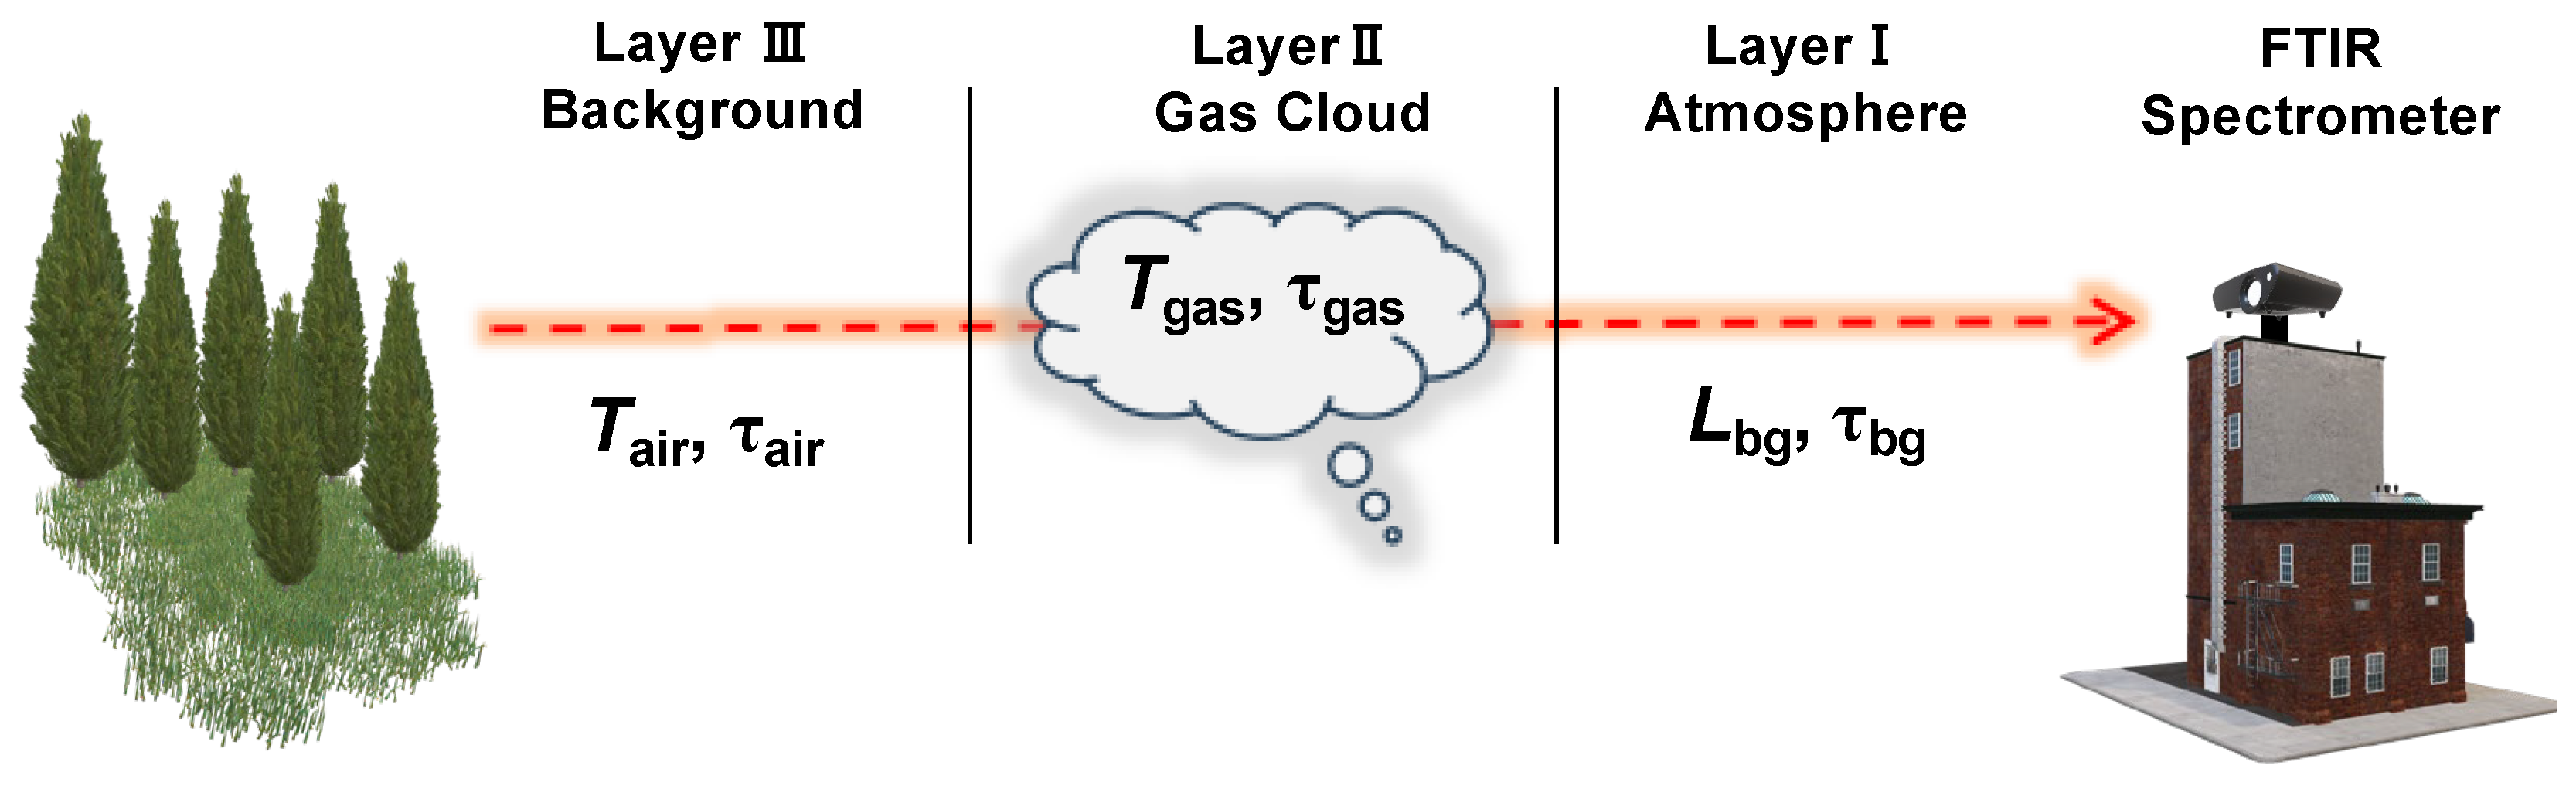
In practical monitoring applications, passive Fourier transform infrared (FTIR) remote sensing is typically performed at low elevation angles or along nearly horizontal paths [13]. Under such a radiation transmission geometry, the multi-layer atmospheric radiative transfer model can be simplified into a generic three-layer infrared radiative transfer model, as illustrated in Figure 1. Specifically, the distant infrared background radiation originating from the sky, ground surface, vegetation and buildings (layer 3) passes through the target gas plume (layer 2) and the intervening atmosphere (layer 1) before reaching the detector.
Figure 1.
Schematic diagram of the simplified three-layer radiative transfer model.
The fundamental principle of passive FTIR spectroscopy for gas leakage detection is to retrieve gas concentrations by analyzing the characteristic absorption features imprinted on the background infrared radiation by the target gas. However, the complex environment of natural gas stations introduces significant challenges, as the background radiation is highly dynamic, spatially inhomogeneous and subject to spectral overlap. These interference effects can be primarily attributed to four typical radiation sources.
2.1. Radiation Interference from High-Temperature Equipment and Pipelines
Metallic components within natural gas facilities such as valves, transmission pipelines and purification units, frequently exhibit surface temperatures exceeding ambient levels due to process heat dissipation or solar radiation absorption. According to Planck’s law, the intensity of thermal radiation increases exponentially with temperature, with the spectral peak located within the mid-infrared atmospheric windows (3–5 μm and 8–14 μm). These bands closely coincide with the fundamental absorption bands of methane (CH4) at 3.3 μm and 7.7 μm. Spectral measurements indicate that under solar illumination, pipelines exhibit elevated radiation intensity in the 7.7–12.5 μm long-wave band, leading to an elevated broadband baseline that partially masks the narrow absorption features of CH4.
2.2. Interference from Solar Reflection and Vegetation Self-Emission
Vegetation within and surrounding facility sites including grasses and trees introduces detection interference through two primary mechanisms. First, the reflection of solar radiation: the spectral reflectance characteristics of plant leaves are strongly modulated by chlorophyll and water content. Second, thermal self-emission: in the long-wave infrared region (8–10 μm), vegetation primarily exhibits emissive behavior with low reflectivity, where the radiance is governed by leaf temperature and water status [14]. Although vegetation temperatures typically approximate ambient conditions, localized heating under direct solar exposure during daytime generates emission spectra that exhibit broad features similar to water vapor absorption in the 8–10 μm band, thereby complicating quantitative gas analysis [15].
2.3. Background Radiation Interference from Surface and Mountainous Areas
The station ground (e.g., concrete, asphalt and soil) and surrounding mountainous terrain (e.g., mixed rocks and vegetation) form hot spots and cold areas under varying sunlight and shading conditions due to differences in material heat capacity. The resulting temperature contrast in adjacent areas leads to spatial radiation gradients and spectral interference from material characteristics. Additional challenges include fluctuations in background radiation values and spectral baseline distortion caused by the interference of Si–O vibrational emission peaks from silicate rocks [16].
2.4. Dynamic Drift of the Sky Background
As the primary radiation source for passive Fourier transform infrared (FTIR) spectroscopy, the sky introduces significant interference through uncertainties in atmospheric transmission processes. These interferences manifest in three principal forms: (i) Absorption fluctuations from atmospheric constituents—concentrations of water vapor (H2O) and carbon dioxide (CO2) vary with meteorological conditions, generating time-varying absorption bands at 2.7 μm, 4.3 μm and 6.3 μm that compress the effective detection window. (ii) Cloud-scattering effects—thin clouds induce low-frequency baseline drift in the 8–14 μm atmospheric window due to downwelling radiation, whereas thick clouds completely obscure the background radiation source, resulting in signal loss. (iii) Variations in atmospheric path radiance—rapid temperature gradients during dawn and dusk create discrepancies between the temperature profile assumed in the radiative transfer equation and actual atmospheric conditions, thereby increasing errors in gas concentration retrieval [17].
2.5. Analysis of the Coupling Effect of Environmental Background Radiation Interference
The above four types of interference sources are coupled in the time–space spectral dimension and affect the system performance through three primary mechanisms including SNR attenuation, characteristic spectrum distortion and false alarm triggering mechanism. Fluctuations in background radiation intensity, such as those caused by equipment temperature variations or cloud cover changes, can overwhelm the weak absorption signals of target gases, resulting in SNR attenuation, an elevated minimum detectable limit for methane and reduced monitoring sensitivity. The spatial inhomogeneity of background radiation, exemplified by the alternation of hot spots and cold areas, induces spectral shape variations in the same gas plume at different spatial locations. This leads to characteristic spectrum distortion and consequent missed detection when conventional global threshold segmentation methods are applied. Furthermore, the transient spectral characteristics of dynamic interference sources, such as vegetation reflection flashes or artifacts from cloud edge movement, are prone to being misidentified as gas absorption peaks, thereby triggering false alarms.
In summary, the essence of background interference lies in the coupling and competition between non-target radiation sources and target gas signals across three dimensions: temporal variation, spatial distribution and spectral characteristics. Effective denoising requires accurate quantification of interference features and establishment of a mapping relationship between these features and system performance parameters, thereby providing a physical basis for subsequent algorithm design.
3. Background Radiation Deduction Methods
3.1. Passive FTIR Spectral Imaging Remote Sensing Instrument
The main technical parameters of the passive FTIR spectral imaging remote sensing instrument used in this study are presented in Table 1. The system is equipped with a single-pixel cooled detector, where a complete scan of the interferometer moving mirror acquires the spectral information for one-pixel grid. To monitor the designated target area, a high-precision two-dimensional pan-tilt unit sequentially scans the region in an S pattern from left to right and top to bottom. This process enables real-time concentration retrieval and assigns corresponding RGB pseudocolor blocks to generate the final image.
Table 1.
Main technical indicators and parameters.
3.2. Introduction to Background Radiation Deduction Methods
According to literature [18], the transmittance of the target gas plume in the simplified three-layer transmission model can be expressed by Formula (1):
where τg(ν) is the target transmittance, Bg(ν) is the ideal radiance, L(ν) is the entrance pupil radiance and Lb(ν) is the background radiance.
In the environmental measurement of natural gas stations, the measured spectra of different targets are different due to the different emissivity of objects. The instrument adopts the method of linear fitting and background radiation deduction to calculate the transmittance spectrum of the target and obtain accurate measurement results. The control software adds an option for setting the background radiation deduction coefficient and changes the set value of the alarm threshold. The average value and variance of each scanning grid are obtained by collecting the environmental background radiation under a certain period of time and meteorological conditions. In actual detection, the detection result value of each scanning grid is obtained by subtracting the average value and variance from the detection value. During the actual operation of the instrument, for gas measurement with complex backgrounds, multiple scans are used for background radiation deduction and the specific calculation formula is as follows:
where Ck is the concentration result of the k-th measurement, is the average value of the measured concentration results and Cw is the early warning concentration value.
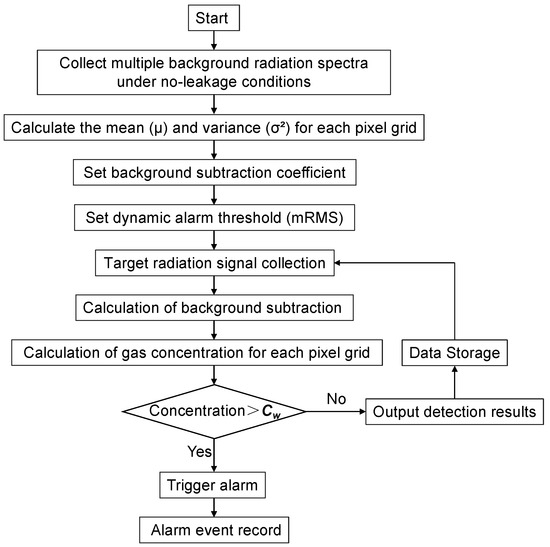
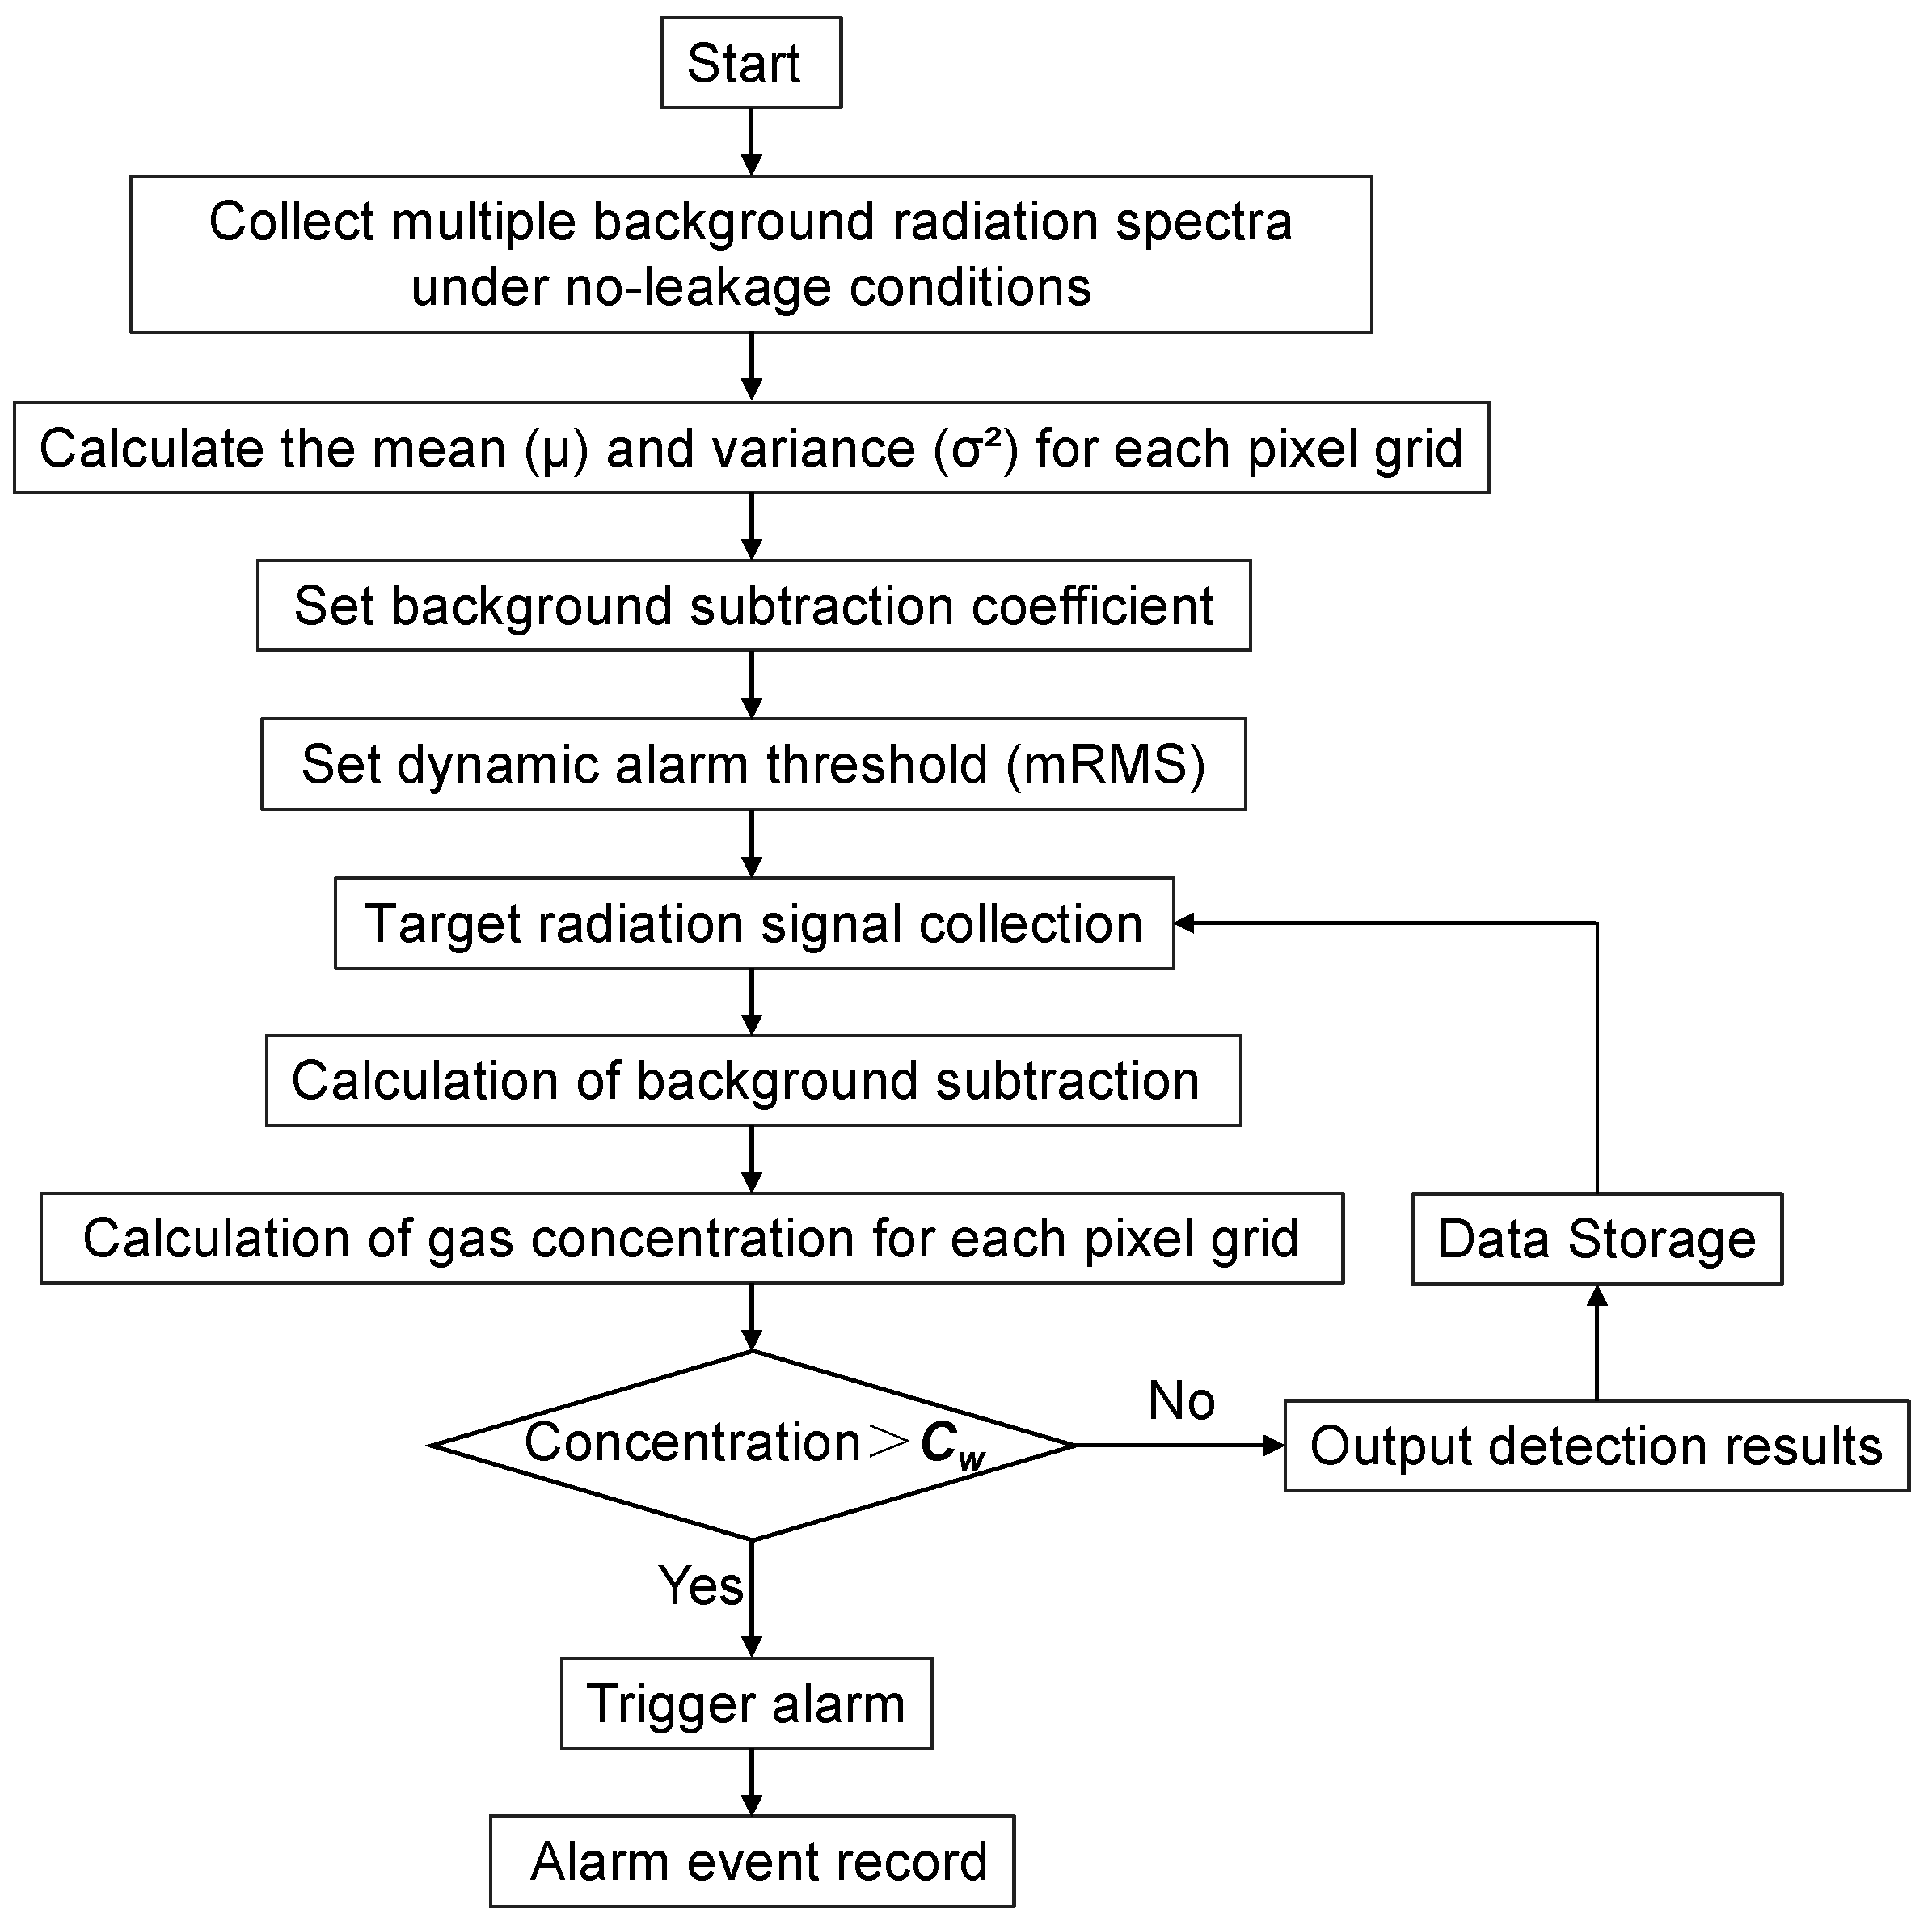
The above method is used for continuous observation of the monitoring area and the RMS of the concentration results is the background concentration fluctuation range. The alarm threshold can be set as mRMS and the alarm threshold for different observation scenarios is dynamically adjusted according to the current scenario to avoid false alarms and improve the accuracy of early warning. The calculation process of the background radiation deduction method is shown in Figure 2. The complete deduction process comprises the following main four steps: (1) Background acquisition. During a non-leakage period (e.g., the first 3–5 min of normal operation), the passive FTIR system continuously scans the monitoring area. For each pixel grid, we calculate the mean and variance of the background radiation signal over time. These statistical parameters characterize the baseline background under the current environmental conditions. (2) Real-time subtraction. For each newly acquired raw spectral signal, the detection signal is obtained by subtracting the real-time background mean from the raw signal. (3) Dynamic threshold setting. After background subtraction, we calculate the RMS of the residual background signal. An adaptive alarm threshold is then set as: Threshold = m × RMS (residual), where the calarm coefficient m was comprehensively determined through long-term field statistics, comparative experiments and engineering experience. In this study, m is set to 0.3~0.8. (4) Concentration inversion. Once the background is effectively removed, the gas transmittance is derived from the subtracted spectral data. The path-integrated concentration is then retrieved using the Beer–Lambert law, and the final gas distribution is displayed as a pseudocolor image overlaid on the optical image of the monitored scene. The core contribution of our work is not a single algorithmic component but the integrated framework of adaptive background radiation deduction coupled with a dynamic threshold linkage, specifically designed for complex industrial scenes.
Figure 2.
Calculation process of background radiation deduction method.
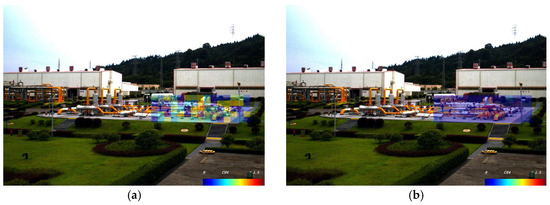
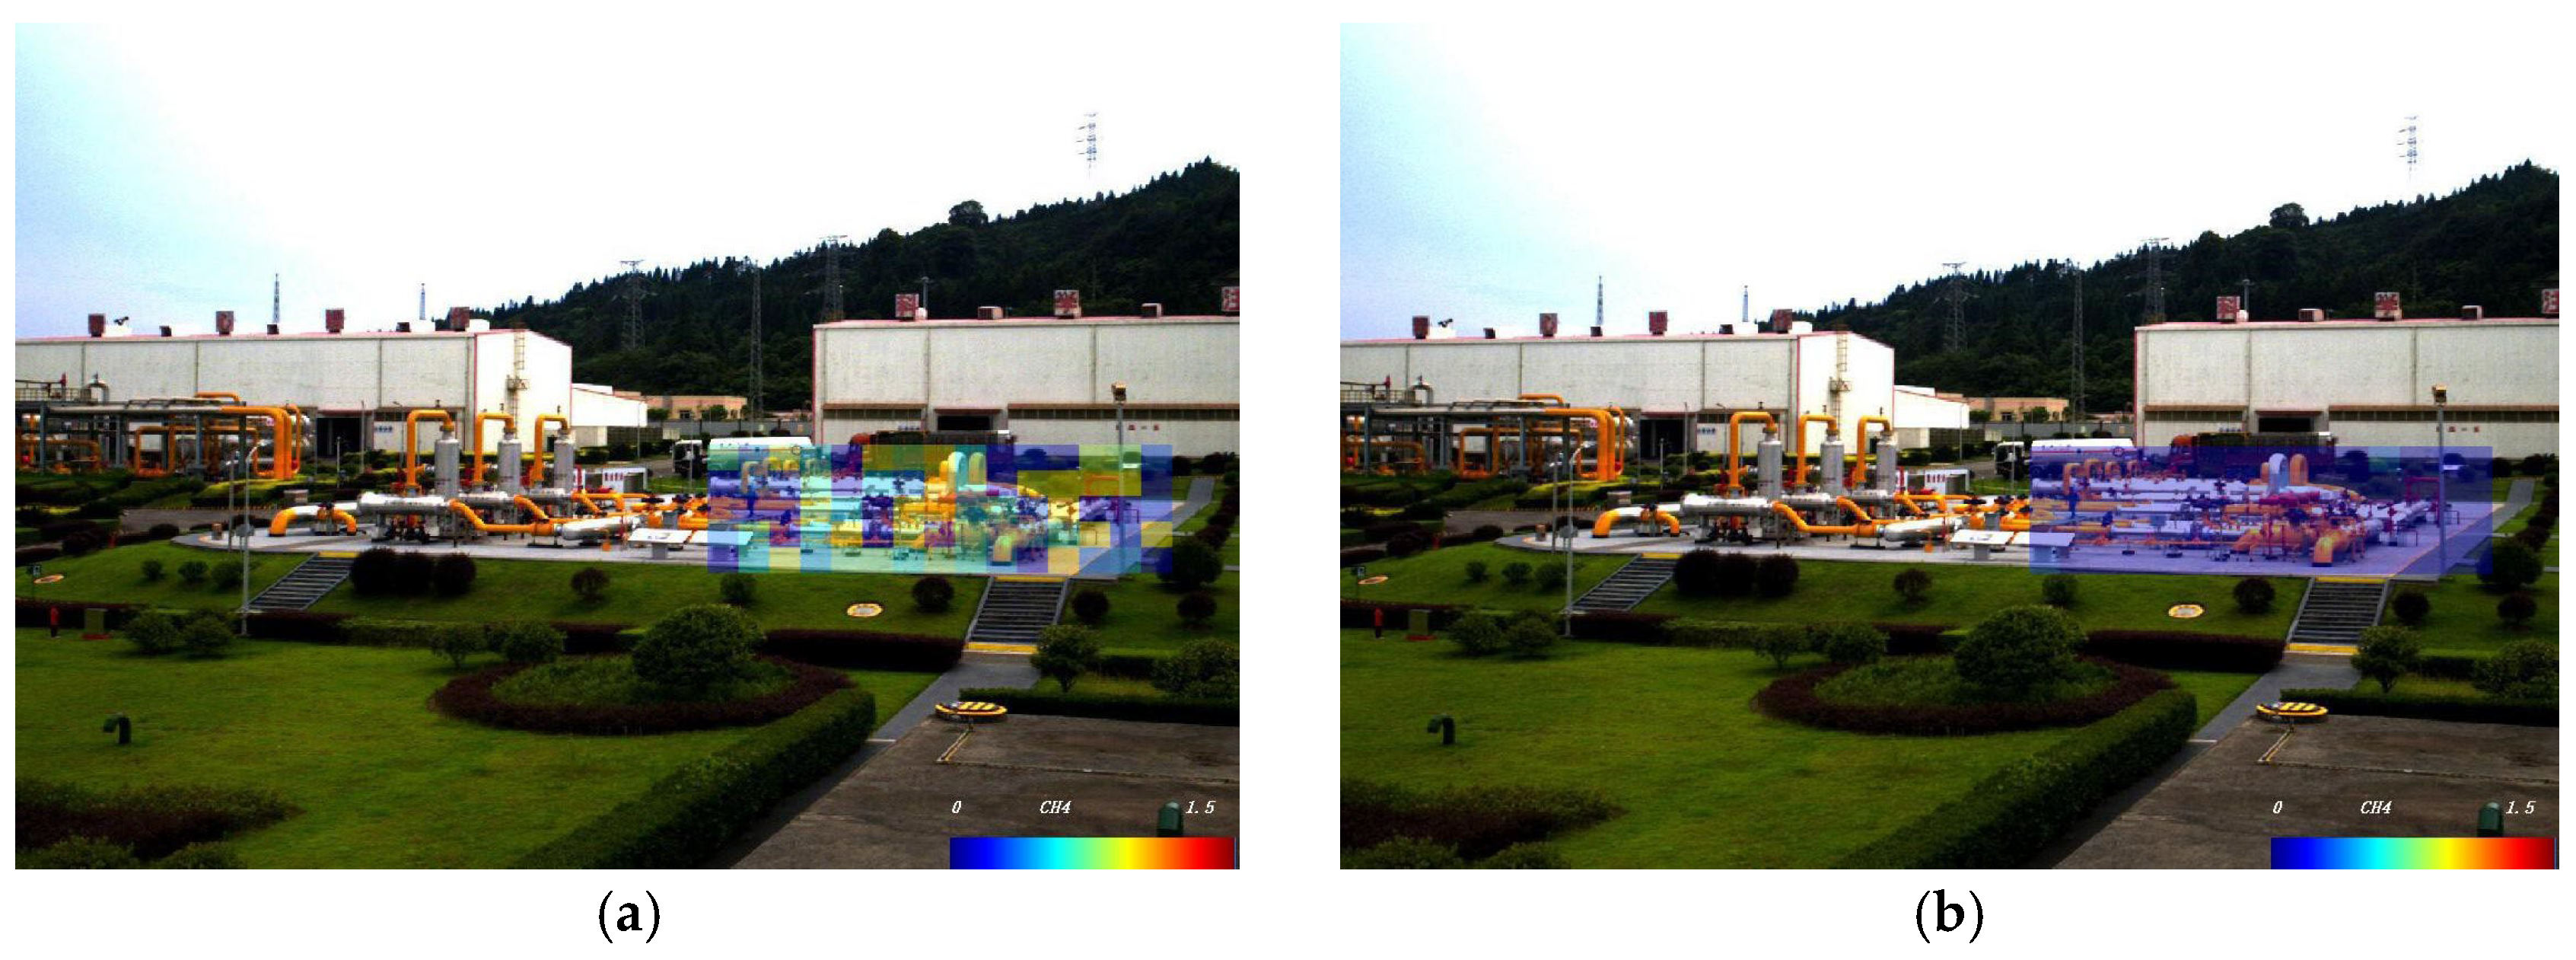
As shown in Figure 3, each pixel grid within the rectangular area corresponding to the target monitoring task represents a unit step monitoring region of the pan-tilt in the infrared field of view. The inverted concentration values detected are visualized using pseudocolor, with different RGB color blocks indicating distinct concentration levels (refer to the pseudocolor bar in the lower right corner of the figure for the mapping between concentration ranges and RGB values). Figure 3 illustrates that under leakage-free conditions, significant interference from the station’s environmental background radiation is present, causing the concentration values within the task rectangular area to fluctuate randomly between 0 and 1.5 ppm·m. After background radiation deduction, this interference is substantially reduced, effectively addressing a key challenge in background removal for spectroscopic gas detection.
Figure 3.
Comparison of visual pseudocolor display effects under leakage-free conditions: before (a) and after (b) background radiation deduction.
4. Application Effect of On-Site Tests
4.1. Test Conditions
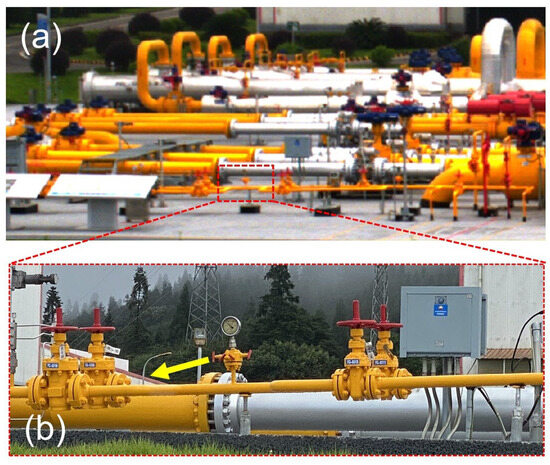
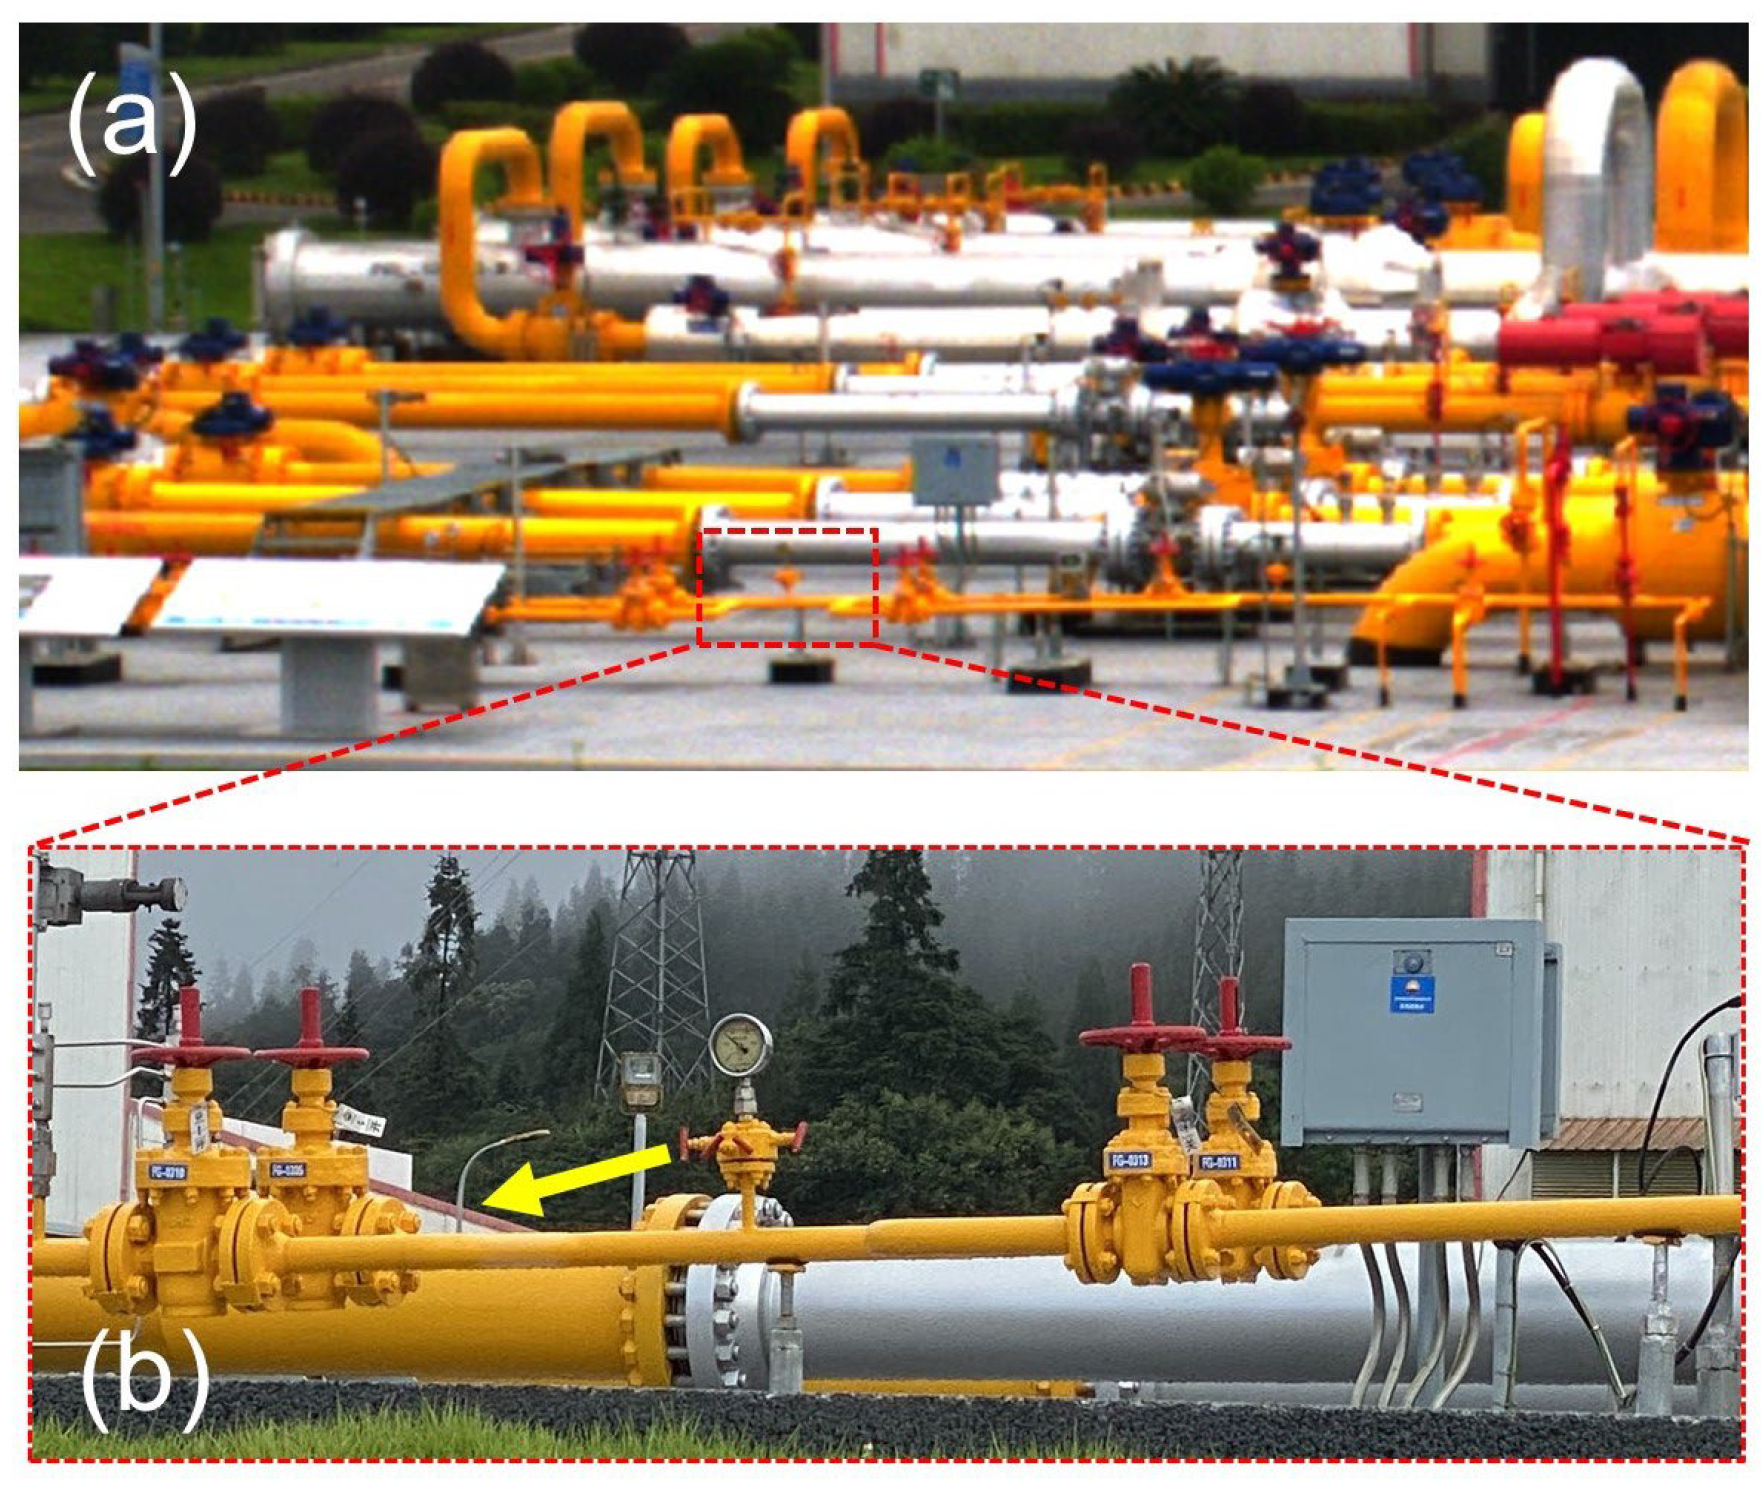
To verify the effectiveness of the background radiation deduction method, a series of on-site gas release verification tests were conducted at a natural gas gathering and transportation station (as showed in Figure 4). The test conditions were as follows: the distance between the instrument and the release point was approximately 65 m, the pressure at the release point was 0.31 MPa of methane and the orifice diameter was about 8 mm. Daytime meteorological conditions were northeast wind at 3 m/s, relative humidity of 77% and temperature of 29 °C, while the nighttime conditions were northeast wind at 1 m/s, relative humidity of 84% and temperature of 24 °C. The parameters of the passive FTIR spectral imaging remote sensing instrument were set as follows: spectral resolution of 4 cm−1, number of co-added scans of 4, number of scans per task of 3, alarm coefficient of 0.3 and pseudocolor map color bar range of 0–1.0 ppm·m.
Figure 4.
(a) On-site vent point and (b) close-up view (arrow indicates the direction of air flow ejection).
4.2. Result Discussion
To comprehensively evaluate the robustness, sensitivity and adaptability of the background radiation deduction method proposed in Section 3 under complex and variable field conditions, more than 20 controlled release experiments were conducted at a natural gas gathering and transportation station. The experimental design systematically encompassed different time periods (day and night), meteorological conditions (sunny, cloudy, windy, etc.), detection distances (60–100 m) and key leakage scenarios, including four configurations of methane medium, leakage location, orifice diameter and pipeline pressure. This setup aimed to replicate the diversity of real-world leakage events and to specifically assess method performance under conditions involving strong background radiation, for example daytime solar radiation, complex background structures, including pipelines, equipment and vegetation, and varying leakage intensities.
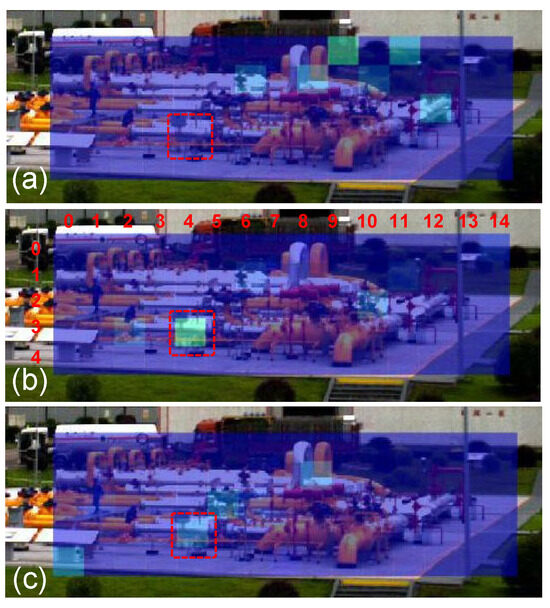
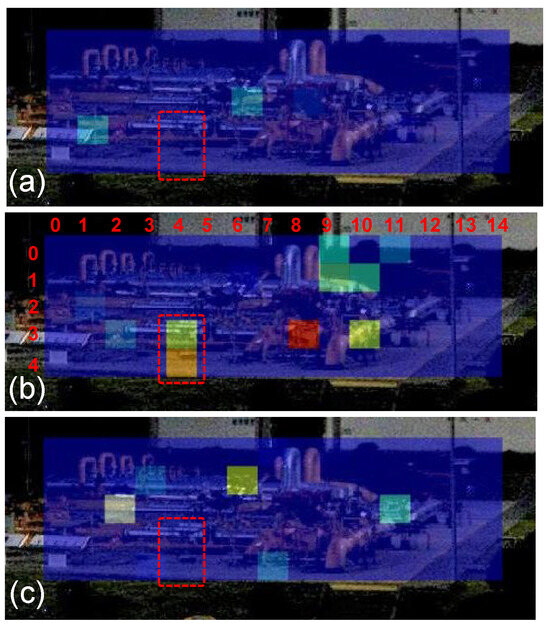
Taking the daytime environment with intense solar radiation as an illustrative example, Figure 5 presents representative detection images before, during and after gas release. The detection target area was configured as a 5-row × 15-column grid and rows and columns numbered from top to bottom and left to right, respectively. Based on the infrared field of view and detection distance, each pixel grid corresponded to an approximate ground sampling area of 0.5 m × 0.5 m. The time resolution is about 1 s per spectral frame (averaging eight scans). The background radiation deduction method was applied, with an alarm coefficient set to 0.3 in the software.
Figure 5.
Comparison of the detection effects before (a), during (b) and after (c) the venting test under daytime conditions.
Figure 5a clearly illustrates the effect of background deduction under strong solar radiation. After deduction, complex environmental background radiation—primarily direct and scattered solar radiation, thermal emissions from the ground and pipeline equipment and vegetative reflections—is effectively suppressed. This is evidenced by the concentration values in non-target pixel grids dropping to near the instrument’s background noise level and the average background concentration is approximately 0 ppm·m as shown in Table 2, thereby significantly reducing the likelihood of false alarms caused by environmental features such as station pipelines, vegetation and the ground.
Table 2.
Pixel grid concentration values corresponding to task array in Figure 5b (ppm·m).
Upon gas release from the pressure valve corresponding to pixel grid (3, 4) and owing to the effective background deduction, the methane concentration detected at this grid increased from approximately 0 ppm·m post-deduction to 0.43 ppm·m (Table 2). This value not only exceeds the typical background fluctuation range after deduction but also surpasses the alarm threshold established from the statistical characteristics of the background. Consequently, the system accurately triggered an active alarm and recorded the event.
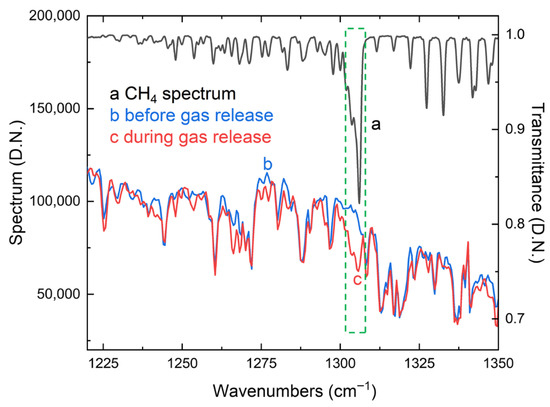
The analysis of the gas transmittance spectrum corresponding to pixel grid (3, 4), as measured by the passive FTIR spectral imaging remote sensing instrument (Figure 6), reveals a distinct absorption feature near 1306 cm−1 during gas release compared to before release. This absorption peak is attributed to the asymmetric bending vibration (νC–H) associated with C–H bond deformation (H–C–H bond angle) in methane. The observed spectral feature confirms the successful detection of methane gas release.
Figure 6.
Spectral curves of the pixel grid (3, 4) before and during venting.
After the gas release ceases, the concentration value detected at pixel grid (3, 4) drops rapidly and stabilizes at the environmental noise level observed prior to the release (approximately 0 ppm·m). This sequence demonstrates that the adopted background radiation subtraction method exhibits dynamic adaptability comprising blank background, simulated leakage and environmental recovery (e.g., before, during and after gas release). It can accurately distinguish transient leakage signals from complex environmental backgrounds, thereby significantly improving the accuracy, sensitivity and reliability of daytime gas leakage monitoring.
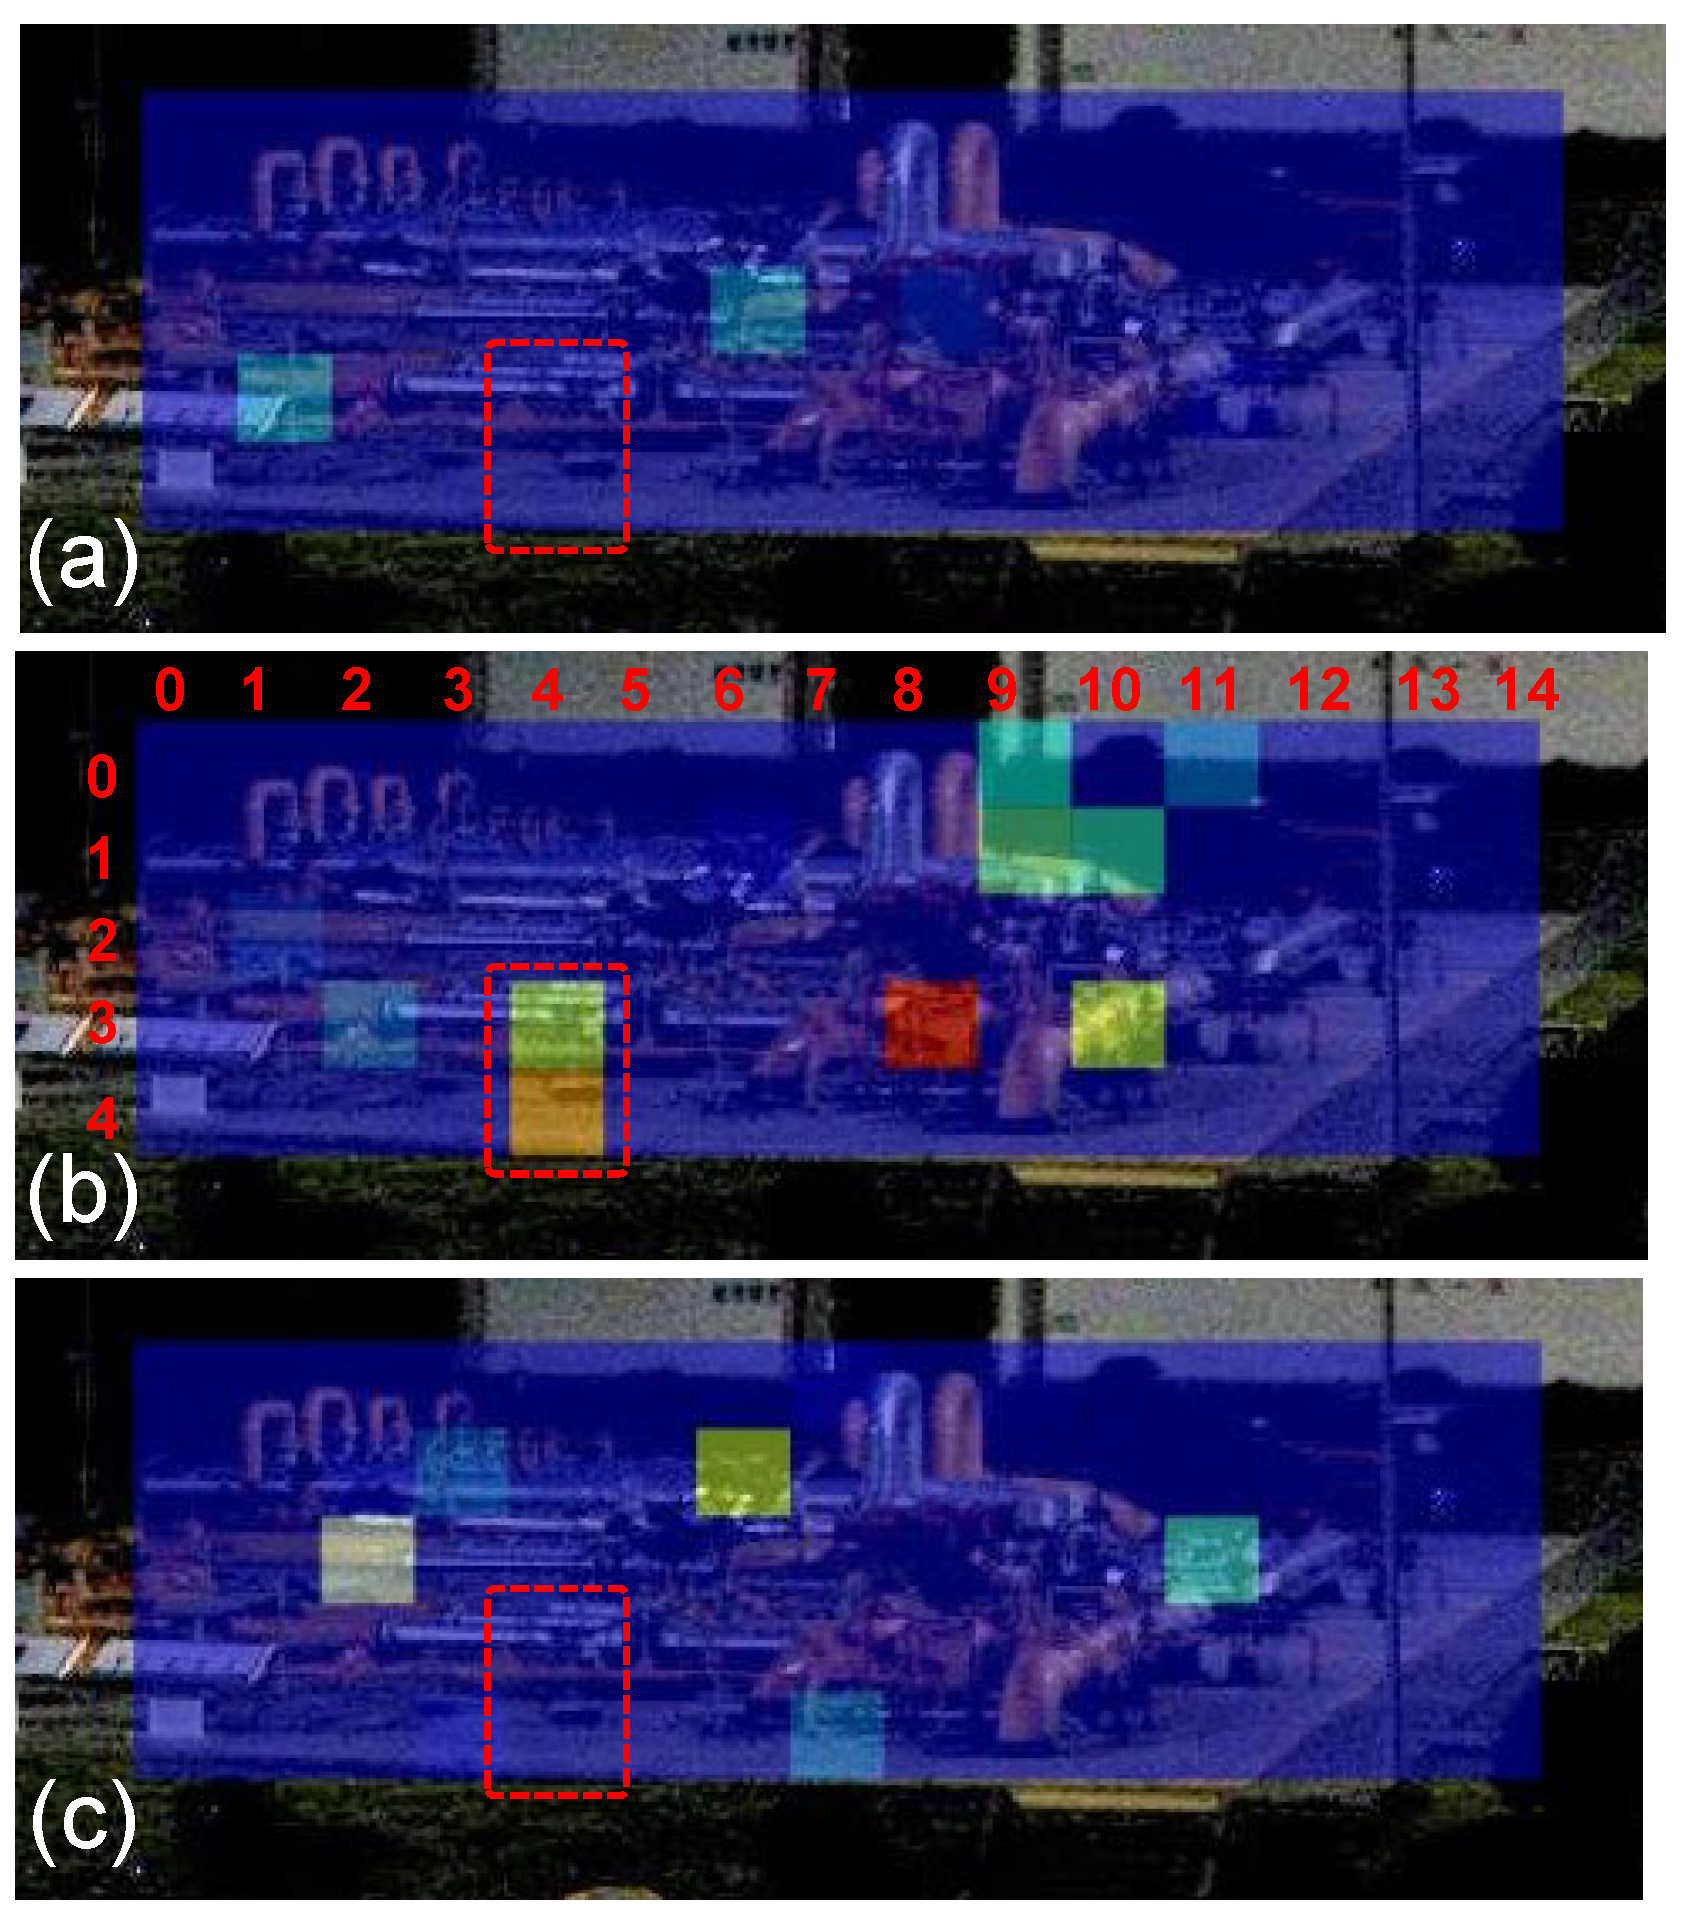
To rigorously evaluate the robustness and effectiveness of the proposed background radiation deduction algorithm under nighttime low-radiation conditions, a controlled gas release test was conducted at a known methane leakage point (pressure gauge cock). The monitoring results are presented in Figure 7. As shown in Figure 7a, despite the substantial reduction in environmental background thermal radiation at night, the average background radiation noise level in the imaging area is significantly suppressed after applying the proposed deduction method. Specifically, the average methane column concentration in the background region away from the leakage point stabilizes near 0 ppm·m after deduction (typical background pixel values fluctuate within 0–0.05 ppm·m shown in Table 3). These results directly demonstrate the algorithm’s capability to separate background interference and stabilize the baseline under low SNR conditions, thereby providing a solid foundation for reliable detection of subsequent micro-leakage signals.
Figure 7.
Comparison of the detection effects before (a), during (b) and after (c) the venting test under night conditions.
Table 3.
Pixel grid concentration values corresponding to task array in Figure 7b (ppm·m).
After the controlled gas release commenced from the pressure gauge valve located near pixel coordinates (3, 4) in the image, the background-subtracted methane concentration image exhibited an immediate and significant change. As shown in Figure 7b and detailed in Table 3, the detected concentration values at the target pixel grid (3, 4) and its adjacent pixel (4, 4) increased rapidly from the background-subtracted baseline with approximately 0 ppm·m to 0.55 ppm·m and 0.72 ppm·m, respectively, within a short period. This increase substantially exceeded the fluctuation range of the subtracted background noise, thereby validating the effectiveness of the methane release test. Based on this concentration change, the monitoring software accurately triggered a leak alarm, demonstrating the reliability of the entire processing pipeline—from background subtraction and target identification to alarm decision-making—under low-light conditions. Following the cessation of gas release, Figure 7c shows that the methane concentration in the target area decreased rapidly and eventually returned to a level consistent with the pre-test background noise with approximately 0 ppm·m. The successful capture of this dynamic process further confirms the strong correlation between the detection signal and the leakage event, as well as the sensitivity of algorithm to state transitions.
In addition, it should be noted that at certain non-gas-release locations within the scanning area of this test (e.g., coordinates (3, 8), (3, 10) and (1, 9) as marked in Figure 7), individual pixels also exhibited transient abnormal concentration values exceeding the background level, for example 0.93 ppm·m, 0.42 ppm·m and 0.35 ppm·m. A comprehensive analysis of their spatiotemporal characteristics, such as isolated occurrence, transient nature and absence of diffusion behavior, combined with the on-site environmental context, suggests that these anomalies may be attributed to noise in the spectral recognition algorithm or local transient fluctuations of non-target gas components in the air. The presence of such elevated detection values could potentially trigger false alarms. In subsequent algorithm optimization or practical deployment, techniques such as spatial continuity analysis, time series filtering, or machine learning-based pattern recognition may be employed to better distinguish real leaks from transient interferences, thereby improving the reliability of the detection results.
Summarily, without environmental background radiation deduction methods, the alarm accuracy was approximately 20% with a false alarm rate of 80%. After applying our proposed background deduction method, the alarm accuracy across the 21 tests ranged from 11.1% to 82.8%, with an average value of 37.1%, and correspondingly the false alarm rate ranged from 17.2% to 88.9%, with an average of 62.2%.
5. Conclusions
The background radiation deduction method proposed in this paper effectively addresses a core challenge limiting the application of passive FTIR imaging technology in complex industrial environments—namely, interference from environmental backgrounds. Specifically, this study was conducted in natural gas gathering and transportation stations during daytime conditions characterized by strong solar radiation and the presence of complex fixed heat sources and reflective surfaces. The results demonstrate the practical value of this method in enhancing the all-weather, high-precision and automated monitoring capabilities of remote gas leak detection systems for natural gas facilities.
On the one hand, the proposed background radiation deduction method successfully enables dynamic subtraction of dominant environmental background radiation, significantly suppressing background noise. The alarm accuracy increased from approximately 20% to 37.1%, and the false alarm rate decreased from approximately 80% to 62.2%. This improves the sensitivity and signal-to-noise ratio of the passive FTIR spectral imaging remote sensing instrument in detecting weak leakage signals, thereby ensuring system responsiveness and stability, for example clear correspondence between the onset and cessation of leakage signals without residual false alarms. As a result, the false alarm rate caused by complex fixed background sources is substantially reduced. On the other hand, the occurrence of abnormally high detected concentration values during the tests clearly identifies a direction for future improvement: distinguishing actual leaks from transient interferences to enhance result reliability. We acknowledge that further research is needed to enhance the reliability of the deduction method and to achieve higher detection accuracy.
Author Contributions
Conceptualization, B.S. and Y.J.; methodology and writing—original draft preparation, J.D. and J.S.; project administration and funding acquisition, W.M. and J.W.; data curation, and drawing figures, H.B., Y.S. and X.X. All authors have read and agreed to the published version of the manuscript.
Funding
This research is supported by CNPC Forward-looking Basic Strategic Technology Research Projects (2021DJ6501, 2023DJ6508 and 2024YQX20102).
Data Availability Statement
The data that support the findings of this study are not publicly available due to privacy.
Conflicts of Interest
Authors Jinrui Deng, Jipei Sun, Jinyou Wang, Bingcai Sun, Yinghua Jing and Xin Xu were employed by the company CNPC Research Institute of Safety & Environment Technology. Author Wencheng Miao was employed by the company PetroChina Oil & Gas and New Energy Branch Company. Authors Haiping Bai and Yaqiang Su were employed by the company No.4 Oil Extraction Plant, PetroChina Changqing Oilfield Company. All authors declare that the research was conducted in the absence of any commercial or financial relationships that could be construed as a potential conflict of interest.
References
- Haque, M.F.; Park, S.; Yang, D. Gas sensors in harsh environments: Challenges and advances in high temperature, high humidity, radiative and corrosive conditions. J. Sci. Adv. Mater. Devices 2025, 10, 101049. [Google Scholar] [CrossRef] [Scilit]
- Sun, J.; Chang, J.; Wang, C.; Shao, J. Tunable diode laser absorption spectroscopy for detection of multi–component gas: A review. Appl. Spectrosc. Rev. 2024, 59, 23. [Google Scholar] [CrossRef] [Scilit]
- Platt, U.; Stutz, J. Physics of Earth and Space Environments: Differential Optical Absorption Spectroscopy: Principles and Applications; Springer: Berlin/Heidelberg, Germany, 2008. [Google Scholar]
- Meshcherinov, V.; Kazakov, V.; Spiridonov, M.; Suvorov, G.; Rodin, A. Lidar–based gas analyzer for remote sensing of atmospheric methane. Sens. Actuators B Chem. 2025, 424, 136899. [Google Scholar] [CrossRef] [Scilit]
- Beil, A.; Daum, R.; Matz, G.; Harig, R. Remote sensing of atmospheric pollution by passive FTIR spectrometry. In Spectroscopic Atmospheric Environmental Monitoring Techniques; SPIE: Bellingham, WA, USA, 1998; Volume 3493, pp. 32–43. [Google Scholar]
- Deng, J.; Hu, B.; Zhang, X.; Huang, J.; Sun, B.; Chu, S.; Yang, Y.; Jing, Y. Research progress on gas cloud imaging by passive FTIR spectroscopy. Laser Infrared 2025, 55, 823–839. [Google Scholar]
- Wang, Y.; Wan, L.; Song, Z.; Xu, L.; Liu, J.; Xu, H. Robust gas quantification in mid–infrared FTIR spectroscopy via a suppression–adaptation–optimization model. Opt. Express 2025, 33, 35865–35880. [Google Scholar] [CrossRef] [Scilit] [PubMed]
- Zhang, L.; Xu, L. A 3D reconstruction of gas cloud leakage based on multi–spectral imaging systems. Remote Sens. 2025, 17, 1786. [Google Scholar] [CrossRef] [Scilit]
- Griffiths, P.R.; de Haseth, J.A. Fourier Transform Infrared Spectrometry; Wiley: New York, NY, USA, 1986. [Google Scholar]
- Griffith, D.W.T.; Jamie, I.M. Fourier Transform Infrared Spectrometry in Atmospheric and Trace Gas Analysis; John Wiley & Sons, Ltd.: Hoboken, NJ, USA, 2006. [Google Scholar]
- Harig, R.; Matz, G. Toxic cloud imaging by infrared spectrometry: A scanning FTIR system for identification and visualization. Field Anal. Chem. Technol. 2001, 5, 75–90. [Google Scholar] [CrossRef] [Scilit]
- Harig, R.; Rusch, P.; Peters, H.; Gerhard, J.; Braun, R.; Sabbah, S.; Beecken, J. Field–portable imaging remote sensing system for automatic identification and imaging of hazardous gases. In Proceedings of the Remote Sensing of Clouds and the Atmosphere XIV, SPIE 2009, Berlin, Germany, 31 August–1 September 2009; Volume 7475, pp. 261–268. [Google Scholar]
- Sun, Y. Study on Detector Response and Instrumentline Shape in Passive Telemetry System with Infrared Spectrum of Contaminated Gas. Ph.D. Thesis, University of Science and Technology of China, Hefei, China, 2021. [Google Scholar]
- Johnson, J.E.; Shaw, J.A.; Lawrence, R.L.; Nugent, P.; Hogan, J.A.; Dobeck, L.; Spangler, L.H. Comparison of long–wave infrared imaging and visible/near–infrared imaging of vegetation for detecting leaking CO2 gas. IEEE J. Sel. Top. Appl. Earth Obs. Remote Sens. 2014, 7, 1651–1657. [Google Scholar] [CrossRef] [Scilit]
- Xu, K.; Long, L.; Yang, W.; Huang, Z.; Ye, H. Bionic metamaterial for multispectral–compatible camouflage of solar spectrum and infrared in the background of vegetation. Cell Rep. Phys. Sci. 2024, 5, 101798. [Google Scholar] [CrossRef] [Scilit]
- Lee, R.J. Spectral analysis of synthetic quartzofeldspathic glasses using laboratory thermal infrared spectroscopy. J. Geophys. Res. Solid Earth 2010, 115, B06202. [Google Scholar] [CrossRef] [Scilit]
- Malarich, N.A.; Rieker, G.B. Resolving nonuniform temperature distributions with single–beam absorption spectroscopy. Part II: Implementation from broadband spectra. J. Quant. Spectrosc. Radiat. Transf. 2021, 272, 107805. [Google Scholar] [CrossRef] [Scilit]
- Jiao, Y.; Xu, L.; Gao, M.; Feng, M.; Jin, L.; Tong, J.; Li, S. Investigation on remote measurement of air pollution by the infrared passive scanning image. Spectrosc. Spectr. Anal. 2012, 32, 1754–1757. [Google Scholar]

Disclaimer/Publisher’s Note: The statements, opinions and data contained in all publications are solely those of the individual author(s) and contributor(s) and not of MDPI and/or the editor(s). MDPI and/or the editor(s) disclaim responsibility for any injury to people or property resulting from any ideas, methods, instructions or products referred to in the content. |
© 2026 by the authors. Licensee MDPI, Basel, Switzerland. This article is an open access article distributed under the terms and conditions of the Creative Commons Attribution (CC BY) license.