


Abstract
In Canada, early fire detection is an important component of wildfire management, and it utilizes a combined effort approach including public reports, aviation patrols, and satellite observations. The role of ground-based continuous smoke sensors has not been formally assessed in Canadian wildfire management detection systems. Dense networks of ground-based, internet-enabled continuous smoke sensors were deployed at three locations across southern Canada during 2023 and 2024, in concert with planned prescribed fire in grass fuels as well as incidental wildfire ignitions. Smoke sensor detection of fires was compared to polar orbiting and geostationary fire detection. Large fire events (50–600 ha) with a ground smoke detector distance of 1–2 km were observed on most occasions (n = 7), but the detection rate dropped to 30% for fires 1 ha or smaller. Follow-up smoke monitoring after the initial detection offered valuable information on smoke production and dispersion across multiple sensors. This typically nighttime smoldering smoke production fell below the threshold for geostationary satellite fire observation and is otherwise only captured sparingly by polar orbiting satellites. Thus, ground-based smoke detection systems likely fit an important niche for monitoring low-energy (i.e., smoldering) smoke events from fully contained fires or to monitor fires considered recently extinguished.
1. Introduction
Fire activity in Canada reached a record of 15 Mha burned in 2023, nearly double the prior record from 1986–2022 [1]. Recent wildfire seasons in Canada have caused increasing public concern due to poor air quality and health impacts [2,3], impacts on critical infrastructure, and the threat of evacuations. On average, between 2010 and 2019, roughly 25,000 people were evacuated yearly due to wildfires in Canada [4]. Detailed annual costing of wildfires up to 2016 was estimated to be between CAD 10 and 25 billion [5] and is likely higher in recent years with larger area burned. Canadian wildland fire management agencies spend over CAD 1 billion in direct costs annually [5,6]. All these statistics are expected to increase due to the effects of climate change [5,7].
One of the main challenges of wildfire fighting is the early detection of ignitions. With earlier detection, the rate of success of the initial firefighting response increases dramatically [8,9,10]. The critical importance of early wildfire suppression stems from multiple physical phenomena that facilitate early direct suppression (in Canada, typically using water and at times chemical fire retardant). Fire ignitions are typically at a single point, be it from lightning or human ignition; such ignitions, if occurring underneath a dense forest canopy, may persist as an easily suppressed surface fire for hours under low- to moderate-fire-weather conditions, while concurrent ignitions at the edges of a forest or in clearings will intensify rapidly [11]. This early fire growth is of a far lower intensity, which is more easily suppressed by aviation suppression resources [12,13], and has a dramatically lower total fire perimeter, owing to the geometric increase in fire perimeter length over time as a fire accelerates [14]. This baseline initial attack success rate in Canada (defined variously as the fire remaining under a threshold size or being contained by the following day) is typically over 80–90%, which represents a high success rate for the most common small fires discovered at 1 ha or less in area [12]. Fires discovered at much larger sizes (c. 5–10 ha) owing to a delay in detection or acutely intense fire behaviour show much lower IA success rates of 5–25% [12].
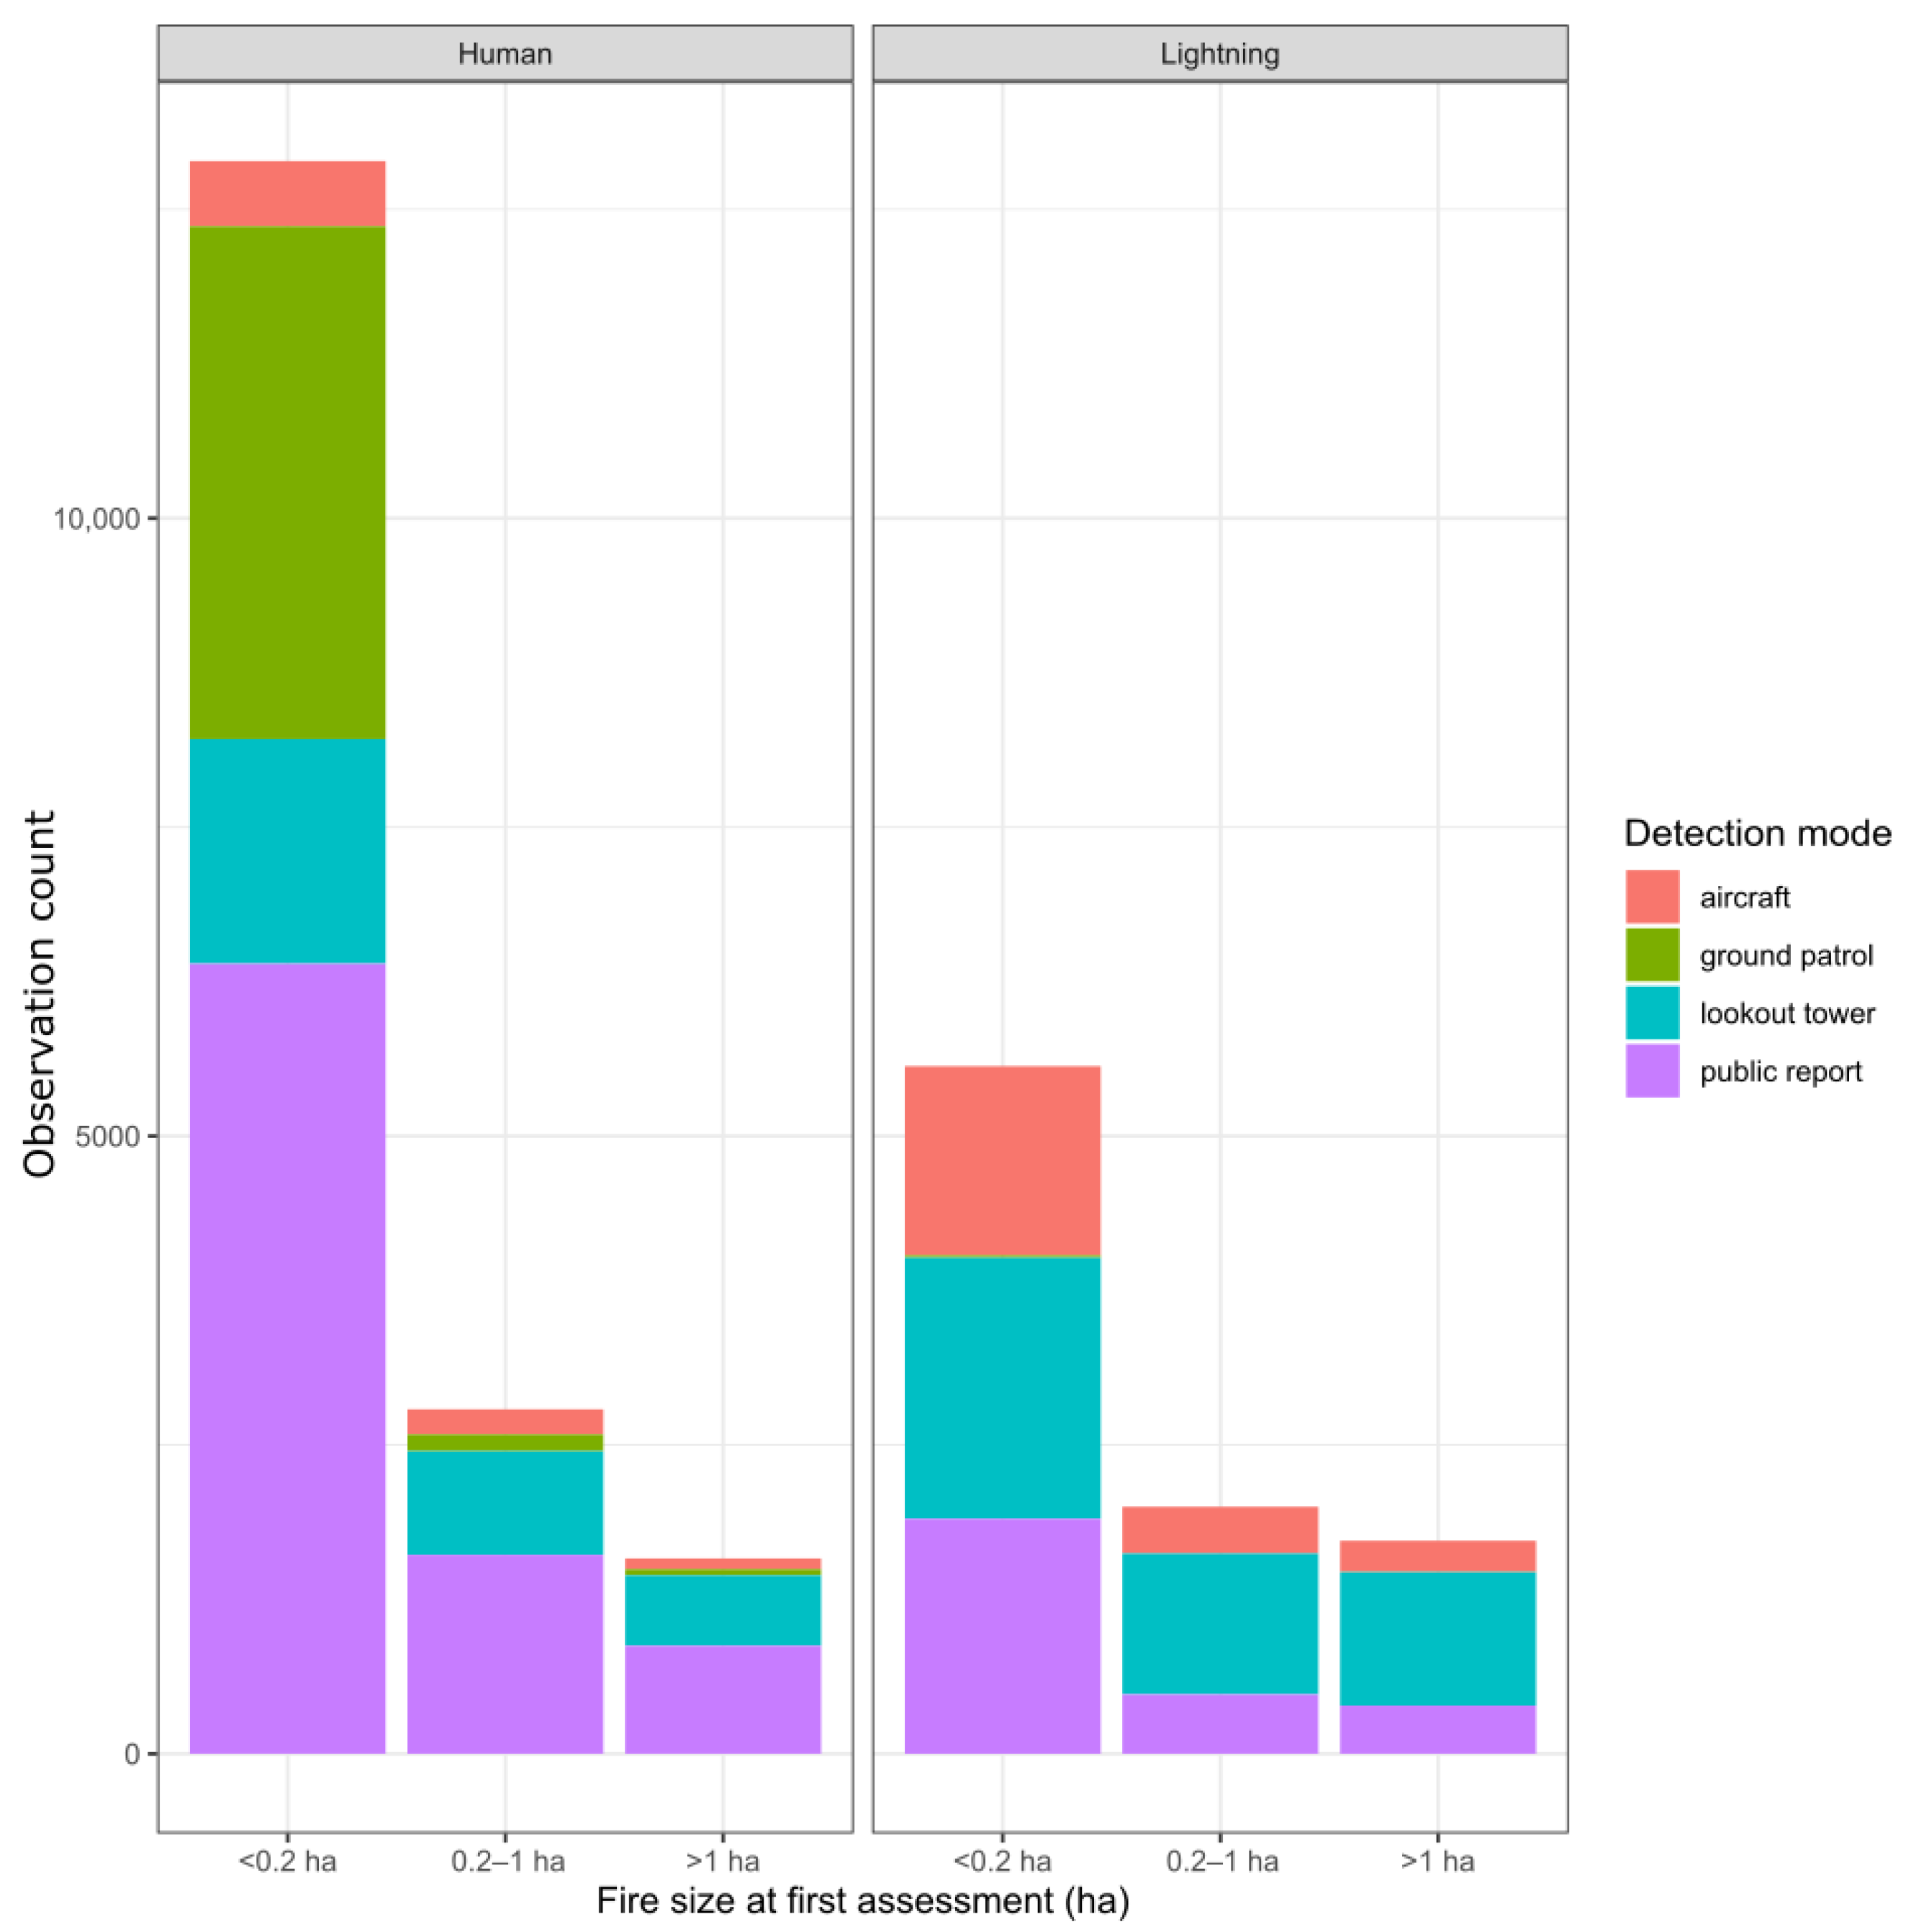
Forest and other vegetation fire response and coordination in Canada varies by location. Within the municipal boundary of larger incorporated communities and rural agricultural areas, vegetation fire reporting and dispatch is typically handled via the same common emergency dispatch line as structure fire suppression. Fires occurring in the forest areas of Canada, predominantly public lands, are handled via a separate dedicated fire reporting and dispatch system operated by the provincial or territorial fire management agency [15]. This forest fire dispatch and response system not only takes in calls from the public (via 9-1-1 or a dedicated wildfire reporting line), but also from dedicated fire detection platforms such as fixed observers (i.e., fire towers with human and/or camera installations), fixed-wing dedicated detection flights [16], patrolling firefighting crews in rotary-wing aircraft, civil aviators, and satellite thermal anomalies [17]. Fixed observation platforms are readily able to detect small fires at distances of 20–30 km, and at times as much as 50 km (Figure A1). For managed forest areas in Canada with dispersed communities and industrial activities, public reporting of newly ignited small and more readily suppressed (<0.2 ha) human-caused fires occurs for 50% of all new fires; fire management agency ground and air patrols, as well as fixed lookout towers, are responsible for the other 50% of detections (Figure A2). For lightning-caused fires that are typically further from roads and settlements, public reporting of small fires is still the initial detection mode in 34% of small lightning fires, with aircraft patrols responsible for 27% of detection while the remainder come from ground patrols and lookout towers.
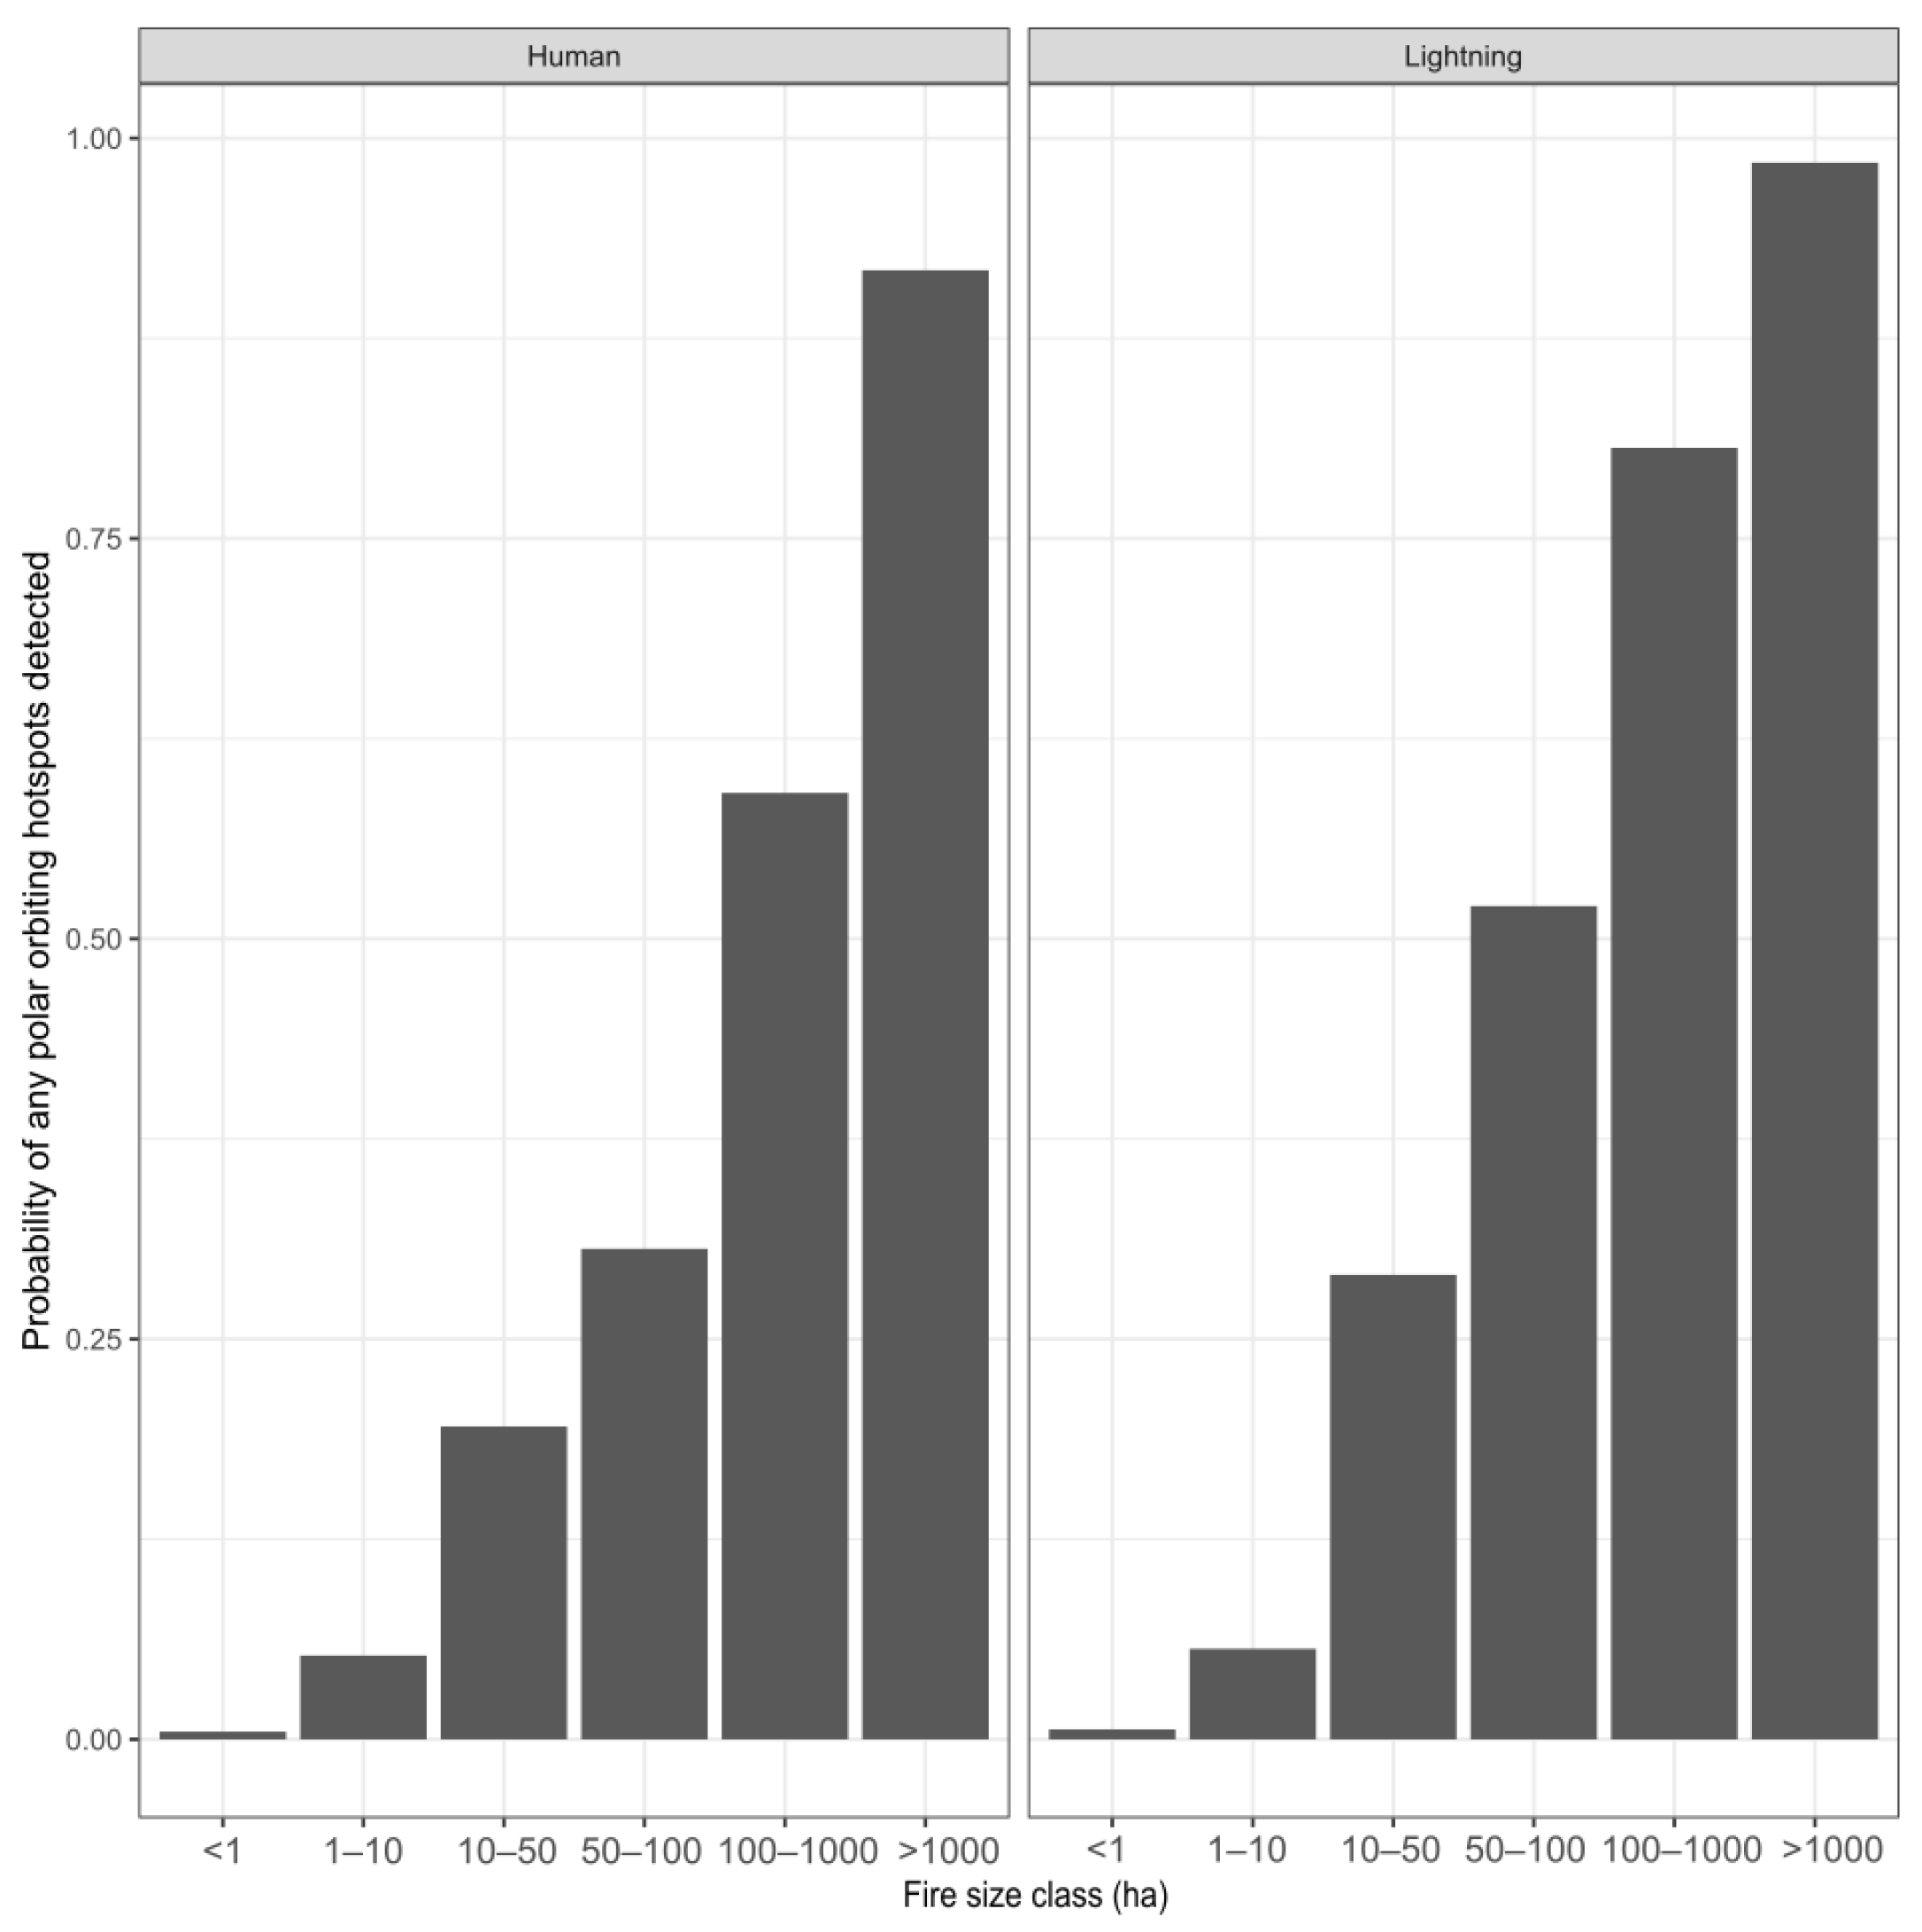
Fire detection solely by satellite is not a typical form of initial fire observation in Canada’s populated forest and agricultural regions (and is not documented as a primary detection mode in most agency records). A retrospective analysis of the burned area records of [18] shows that approximately 16% of all fires are observed by polar orbiting satellites prior to discovery and cataloguing by fire management agencies (Figure A3). At the same time, polar orbiting satellites are inefficient at detecting small fires, which are often under control within 1–2 days; a majority of fires in Canada less than 100 ha are not detected by polar orbiting satellite (Figure A4). In the case of Canada’s largely unpopulated tundra, satellite detection is the primary mode of the infrequent lightning-caused fires in the region [19].
The detection of large, fast-moving grass fires using the geostationary GOES satellite’s ABI imager as the initial detection mode has been documented in the western US Great Plains [20,21], where formal fire detection and assessment is limited to largely local volunteers and public reporting. The utility of geostationary fire detection in Canada’s agricultural regions that also lie outside of formalized wildfire protection regions is unknown, but likely carries a similar utility.
Intense fires under light wind conditions can often lead to little to no local smoke impacts due to efficient lofting of smoke within a large fire convective plume; lighter fuels and stronger winds yield large impacts to local air quality and even highway safety due to ground-level smoke [22]. To date, distributed wireless small-sensor networks of smoke and/or thermal detectors have not been operationally deployed in Canada to use these ground-level smoke events for fire detection systems. Such systems have been proposed in other jurisdictions [23] with primarily theoretical and simulation evaluation of such systems [24]. Multi-sensor approaches have been shown to be effective under moderate burning conditions in grass fuels, with smoke particulate, organic gases, and thermal detection approaches being the most effective [25].
With commercial vendors recently making such distributed small sensor systems available to communities or fire management agencies, field evaluation of smoke-detecting ground wildfire sensors was conducted through the 2023 and 2024 seasons during prescribed burns as well as incidental wildfires at three locations in varying terrain across Canada. This study represents the first large field deployment and assessment of ground-based smoke detection sensors across multiple prescribed fires and wildfires with a fixed network (i.e., sensors not redeployed around each fire). Thus, this deployment simulates the case where dense sensor network deployment is used as part of a fire detection and monitoring program. All fires consisted of primary grass fuels with some shrubs and sparse trees. Ground-based fire detection records were compared to a proxy for human visual detection (smoke plume height) as well as satellite fire detection records. Data on ignition time, fire weather, and final fire size were used in conjunction with standard fire growth models to estimate fire size and activity at varying detection intervals.
2. Methods
2.1. Hourly Fire Weather
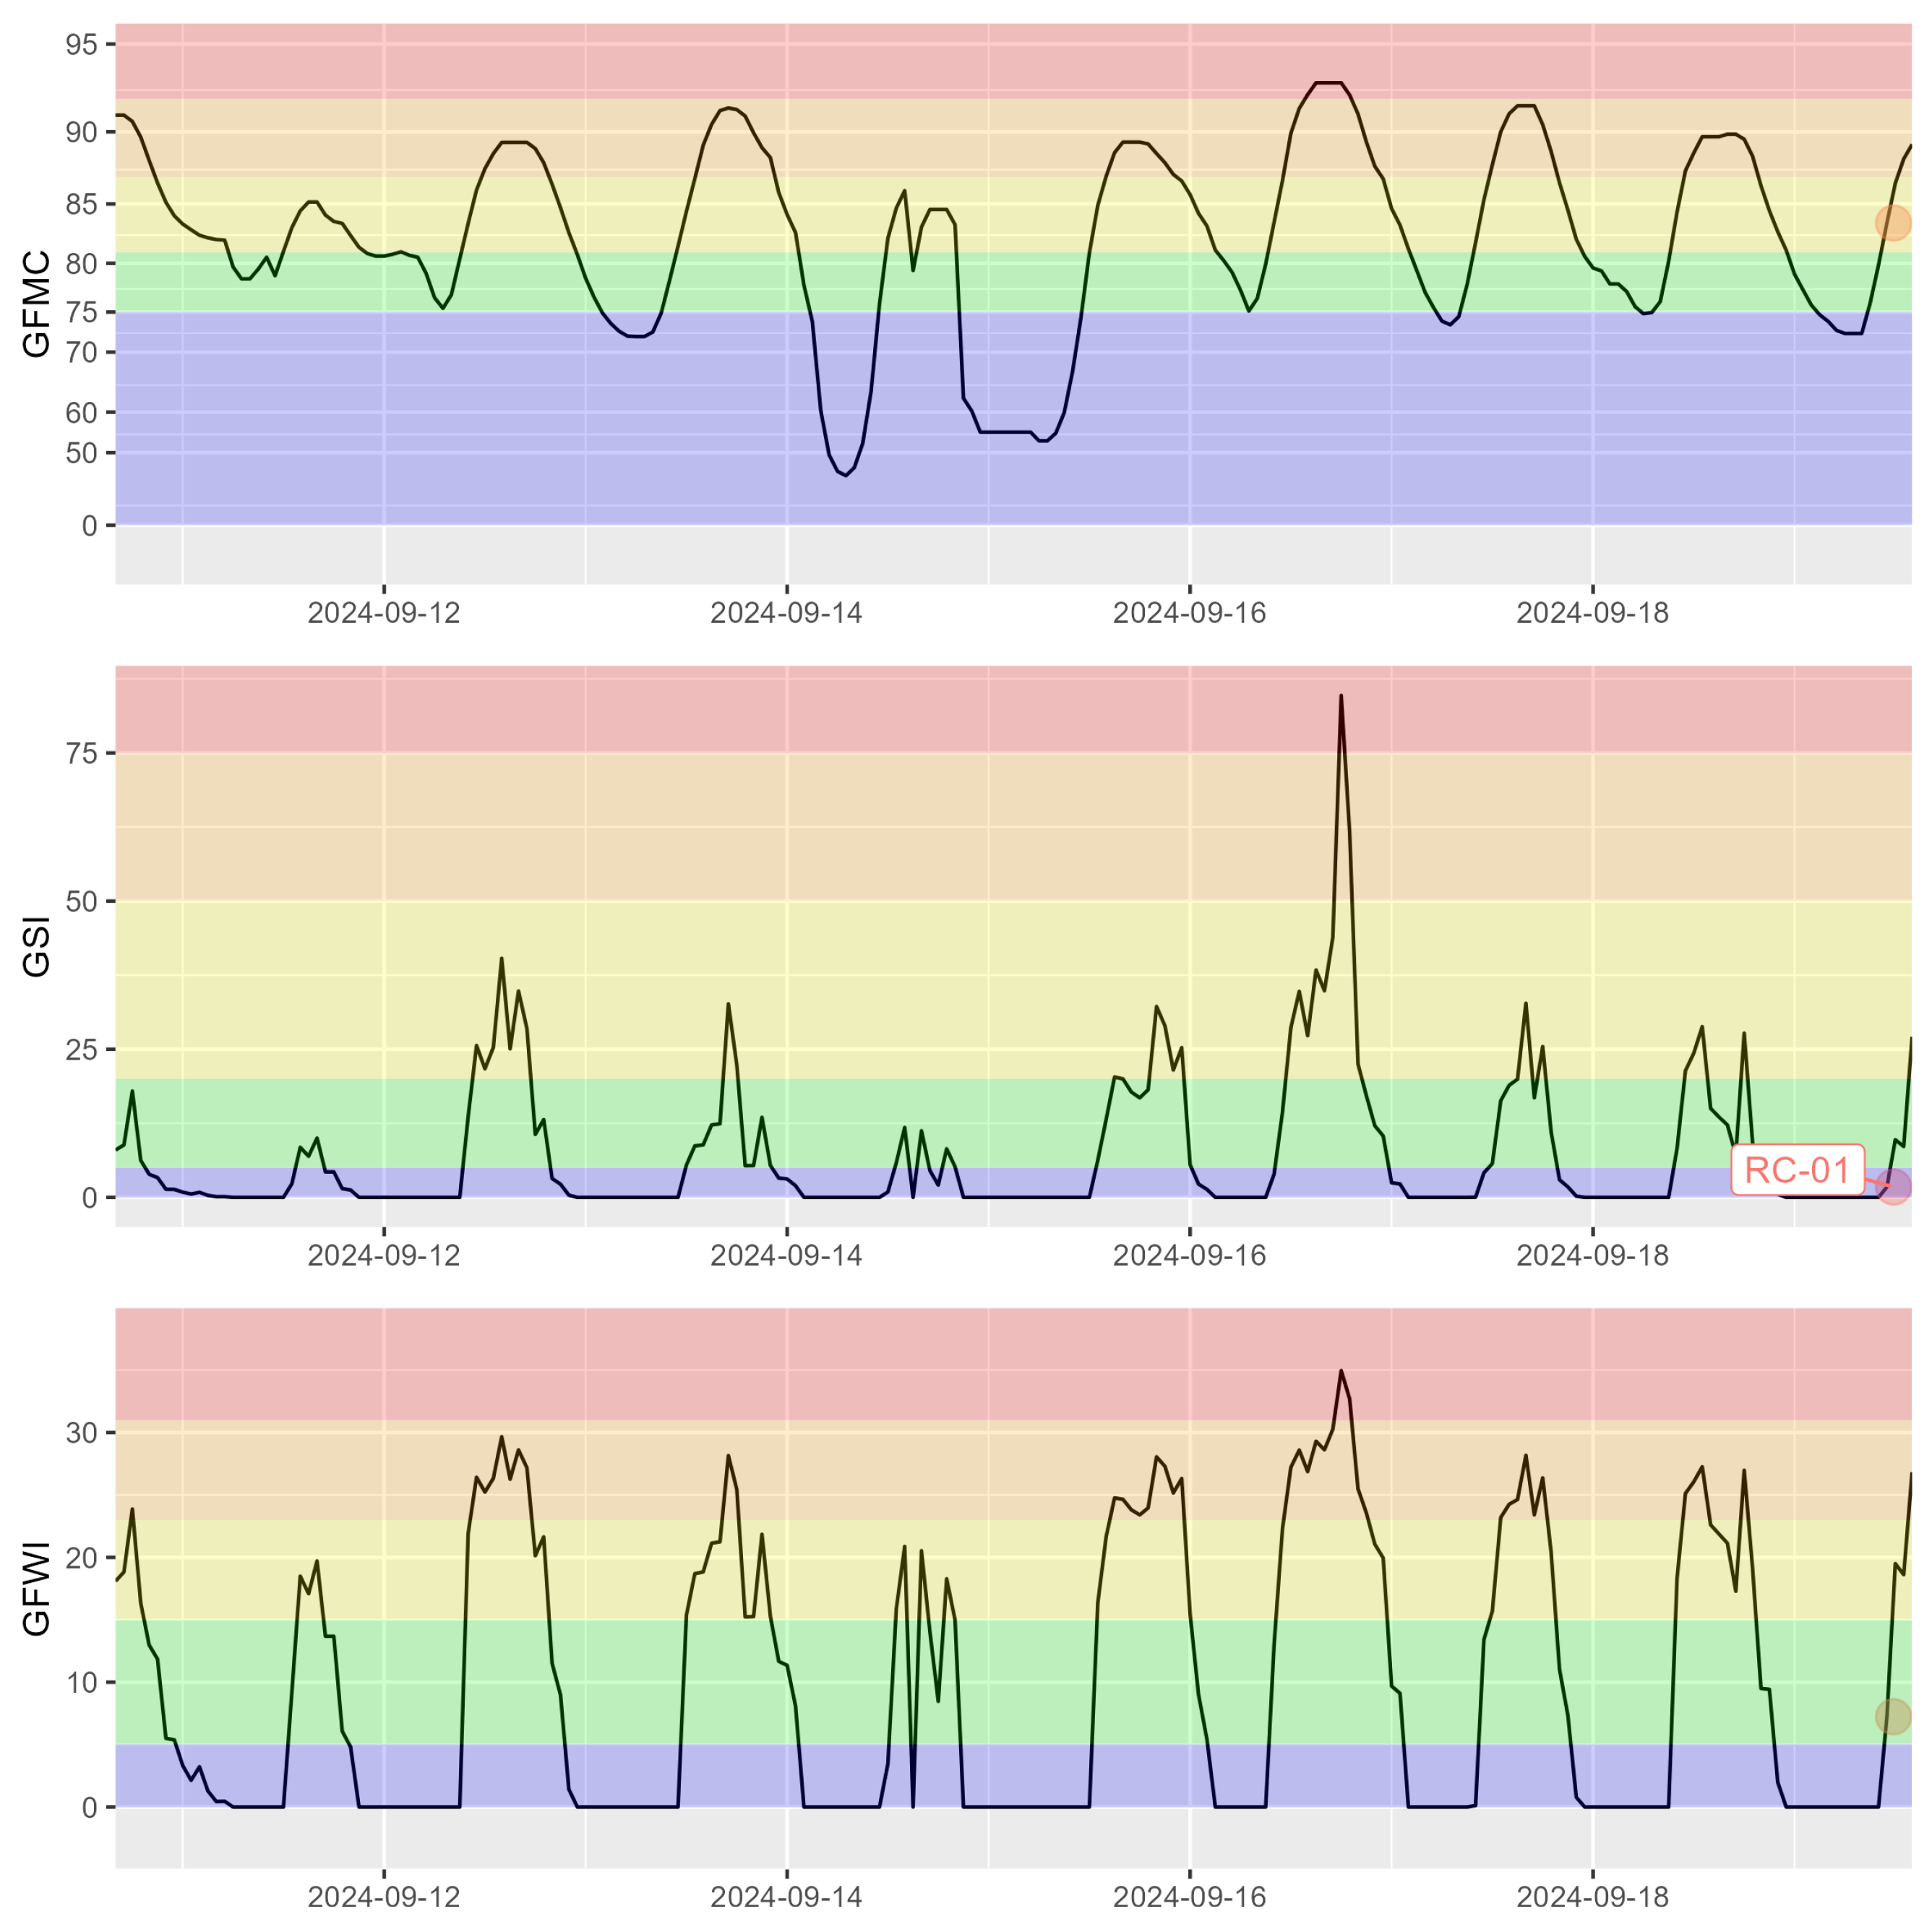
The widely used Canadian Fire Weather Index (FWI) System [26], using only noon-hour weather observations, is optimized to track moisture conditions and fire potential in pine forests or similar ecosystems. Recently, the FWI System has been revised to a new version, FWI2025 [27], in order to incorporate full hourly weather observations, as is typical in agricultural, aeronautical, air quality, and other weather monitoring applications. FWI2025 contains three grassland variants of the existing FWI System components. First, a Grassland Fuel Moisture Code (GFMC) aims to track the aggregate flammability of live and dead grass fuels in an open setting by incorporating familiar hourly weather observations (temperature, humidity, rainfall, wind) as well as open solar radiation and a user-provided estimate of the relative fraction of cured (dead) vs. live grass fuels. GFMC ranges from 0 to 101, with conditions 80 and above corresponding to those able to sustain ignition. Secondly, the Grassland Spread Index (GSI) incorporates the GFMC and the measured wind speed to approximate the potential fire spread rate through grasslands. Lastly, the Grassland Fire Weather Index (GFWI) is an index of fire suppression difficulty. Full details on each metric are provided in [27].
2.2. Ground-Based Smoke Sensors
The present ground wildfire sensor initiative is a collaboration between Defence Research and Development Canada, the Centre for Security Science, and the United States Department of Homeland Security, Science and Technology Directorate (DHS(S&T)). The DHS(S&T) SCITI program funded a number of industrial partners for the initial development of ground wildfire sensors. After initial testing in laboratories and other evaluations in controlled settings [28], DHS(S&T) has selected two sensor manufacturers to proceed to the second phase of the wildfire sensor development program in which DRDC CSS and stakeholders are taking part. DRDC CSS coordinated the participation of a number of Canadian stakeholders: the Canadian Forces Fire Marshall (CFFM), CFB Valcartier, CFB Edmonton Detachment Waiwright, Société de protection des forêts contre le feu (SOPFEU), Ville de Baie-Comeau, Ville de Chibougamaum, and the British Columbia Wildfire Service (BCWS). The Canadian Forest Service (CFS) provided technical and scientific guidance in this effort. CAF (Canadian Armed Forces) members on large forested bases (such as Valcartier) spend significant amounts of time fighting wildfires on their bases that occur as a result of training exercises. We focus on the deployment on the sensors at CFB Valcartier and Wainwright, as well as a BCWS prescribed burn, during 2023 and 2024. Other deployments did not experience adjacent wildfires or prescribed fires and will not be reported here. Detailed site descriptions and sensor layout maps are presented in Appendix A.
Prescribed burns are ideal for testing sensor effectiveness with a known start location, time, and final burned area. In 2023, twenty sensors were deployed in CFB Valcartier to collect data from the prescribed burns scheduled before the start of the 2023 fire season. In 2024, ten of the twenty sensors remained in Valcartier, with the other ten relocated to CFB Wainwright to collect from two different prescribed burn schedules. Using the known ignition location and time combined with total burned area allows for characterization of the fire for comparison with other methods of detection.
Ground sensors detect particulate matter (PM) and volatile organic compound (VOC) concentrations, and report data every 5 min. PM and VOC sensors offer an advantage over CO and CH4 sensors via multi-channel data that allow for sensor diagnostics (i.e., concentration ratio between the size classes PM2.5 and PM10). Additionally, PM emissions are most closely related to both human health impacts [29], as well as fire suppression operation challenges related to reduced visibility due to wildfire smoke [22]. Sensors are powered by solar panels and communicate via LTE wireless protocol. They are best deployed at a height of greater than 3 m (trees or utility poles). Warnings (first detection with a lower threshold) or alerts (higher threshold) are sent out by the sensors if these concentrations pass a certain threshold determined by vendor-provided algorithms; warnings are approximated by PM2.5 observations exceeding 30 g/m3, and alerts as observations exceeding 200 g/m3. A web portal allowed stakeholders to monitor sensor status and receive text notifications for the wildfire ignitions warnings and alerts. The focus of this work is on the applied utility of the sensor network for small and localized smoke events; the precision or accuracy of lower-cost particulate concentration measurements has been extensively studied elsewhere [30]. The analyses contained herein are not meant to be an evaluation of the specifications and performance of the individual ground sensors. The main purpose of conducting these analyses is to provide advice to provincial/territorial wildfire suppression managers on what the most effective utilization of such ground sensors is operationally—either in conjunction with other detection methods, or on their own; and before, during, and after a suppression operation.
2.3. Other Detection Modes
Ground-based smoke sensor observations were compared to other more common detection modes, namely (1) visual detection (both public and fire agency) as well as (2) polar orbiting satellites for detection of smaller and smoldering fires, and (3) geostationary fire detection for large and fast-growing fires. Visual detection potential was estimated with two models used in conjunction: modeled fire growth and energy output from the Canadian Forest Fire Behaviour Prediction System [31], coupled to the widely used plume rise model from Briggs that can be applied to small- to medium-sized fires [32]. Since detailed fire growth records over time were not available, fire ignition records and hourly weather were used to drive the fire ignition until the final recorded area was achieved by the model. Fire growth modeling estimates with nearby weather observations are typically accurate within 20% of observations [33], with similar accuracy in models of FRP and plume heights, resulting in a larger, compounded error rates of approximately 40% for those estimates. The relationship between plume rise height, diameter, and detection distance is not robustly understood; historical records indicate visual detection of forest fires <1 ha is possible at well over 25 km given a clear line of sight and favorable atmospheric conditions (see Appendix A). Thus, any comparison to plume heights is merely for reference, as visual detection modes are very efficient in populated areas.
Satellite detection records (both polar orbiting and geostationary) for each individual fire event were obtained from the NASA FIRMS archive [34]. A qualitative assessment of cloud cover for daytime periods was accessed via the NASA Worldview service for the satellite overpasses during fire events (including those without satellite detection). For each fire, the ground-reported ignition time (both wildfire and prescribed fire) was available with precision down to the minute from fire management records. The reported ignition time was then used as time zero for each event, with fire growth and detection events calculated as minutes since ignition.
3. Results and Discussion
3.1. Detection of Large Fires (Over 50 ha)
3.1.1. Wainwright
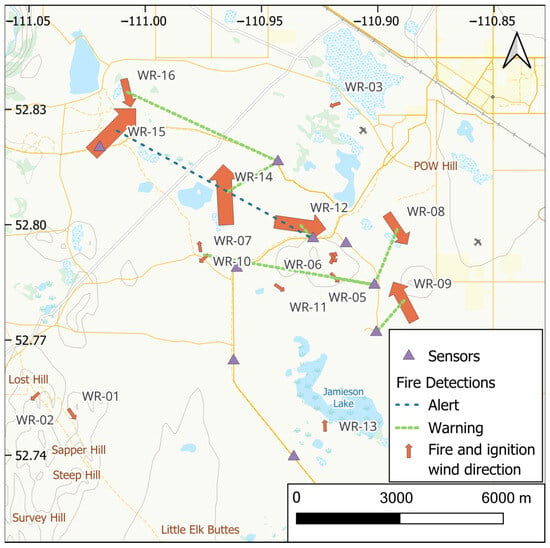
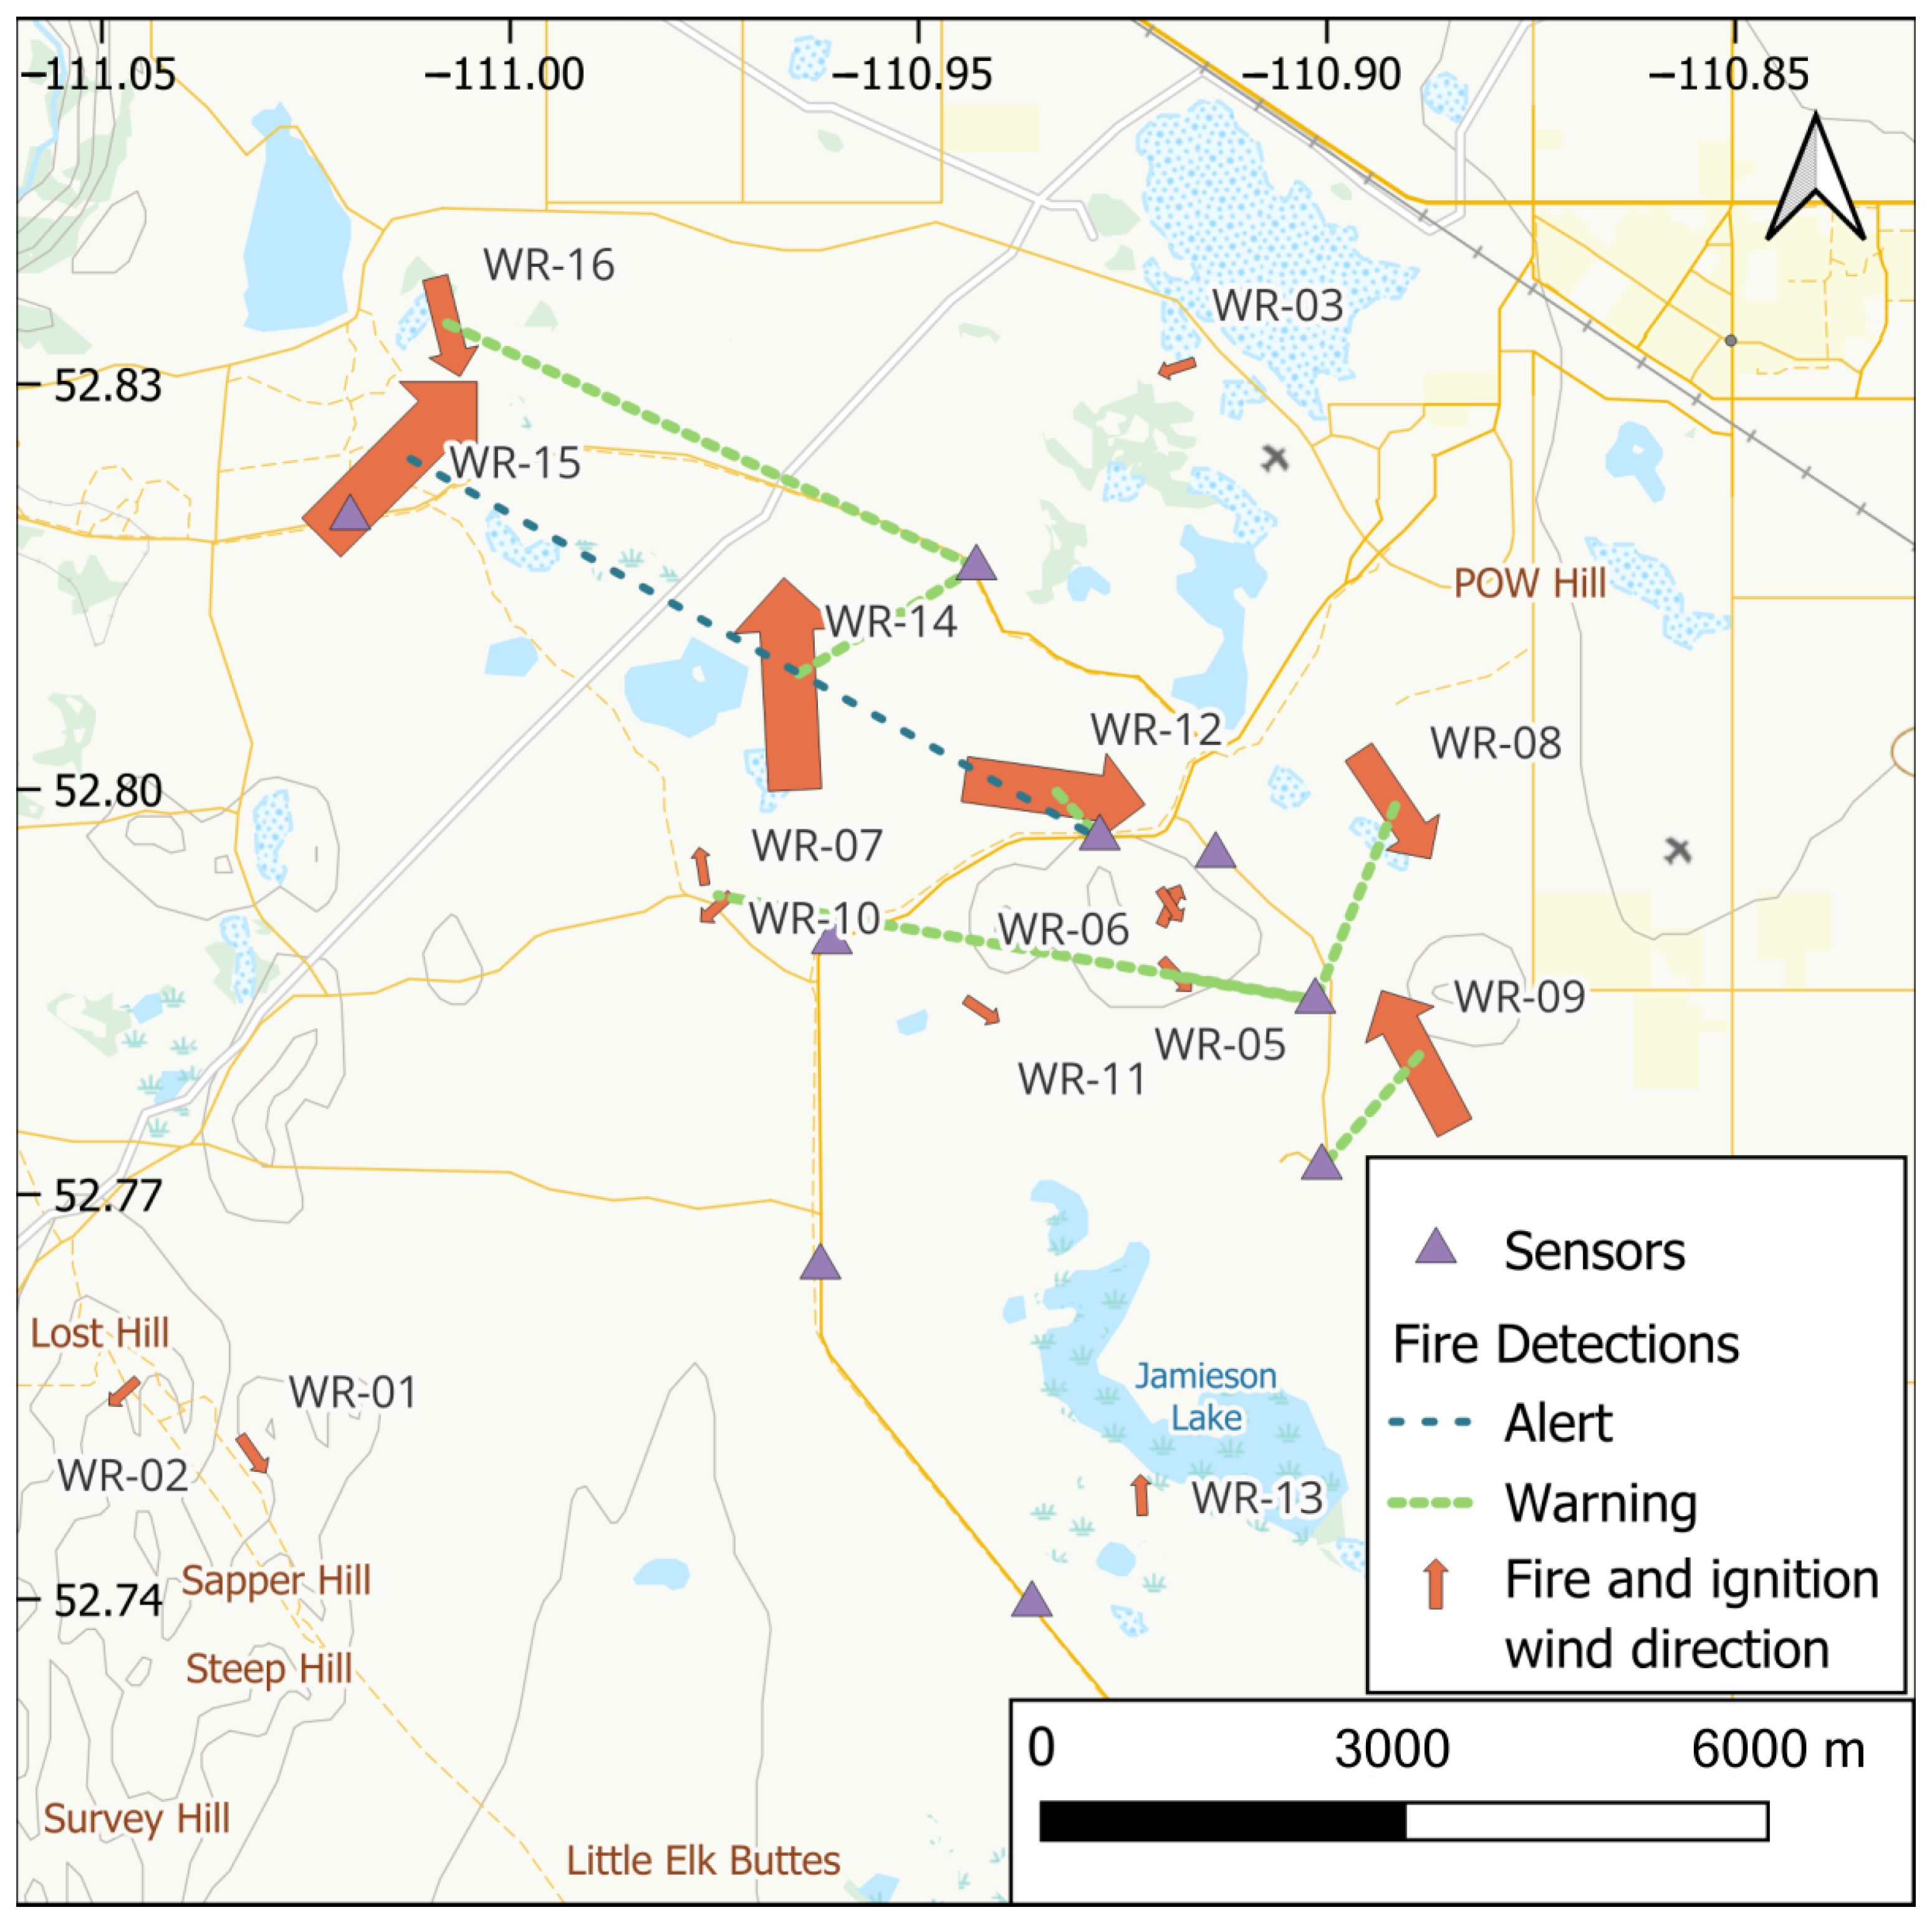
At Wainwright, all large fires were prescribed fires with the exception of WR-15, which was an unplanned spillover from the WR-14 prescribed fire earlier that day (Figure A5). All five fires over 100 ha were detected by the smoke sensors (Figure 1), with first warnings 13–309 min after ignition and first alert at 23–338 min after ignition. The median distance between the fire ignition point at the smoke sensor was approximately 1500 m and ranged from 500 m to 4.8 km. At the time of the first warning, three (WR-12, WR-09, WR-08) out of the five fires had already grown to their final size (i.e., completed active fire growth in area), while the largest fire of the group, WR-15, was at approximately 420 ha of its final 600 ha fire size. In these cases, it was likely that the main smoke column during flaming combustion was lofted immediately above the nearby smoke sensors, and it was not until the cessation of flaming combustion that the convective column collapsed and residual smoke was advected. A similar phenomenon has been observed in experimental fires under light to moderate winds [35].
Figure 1.
Wainwright study area showing fire, sensors, and dotted lines linking the first fire detection (warning or alert) for each detected fire. Arrow indicates observed wind direction at the time of detection.
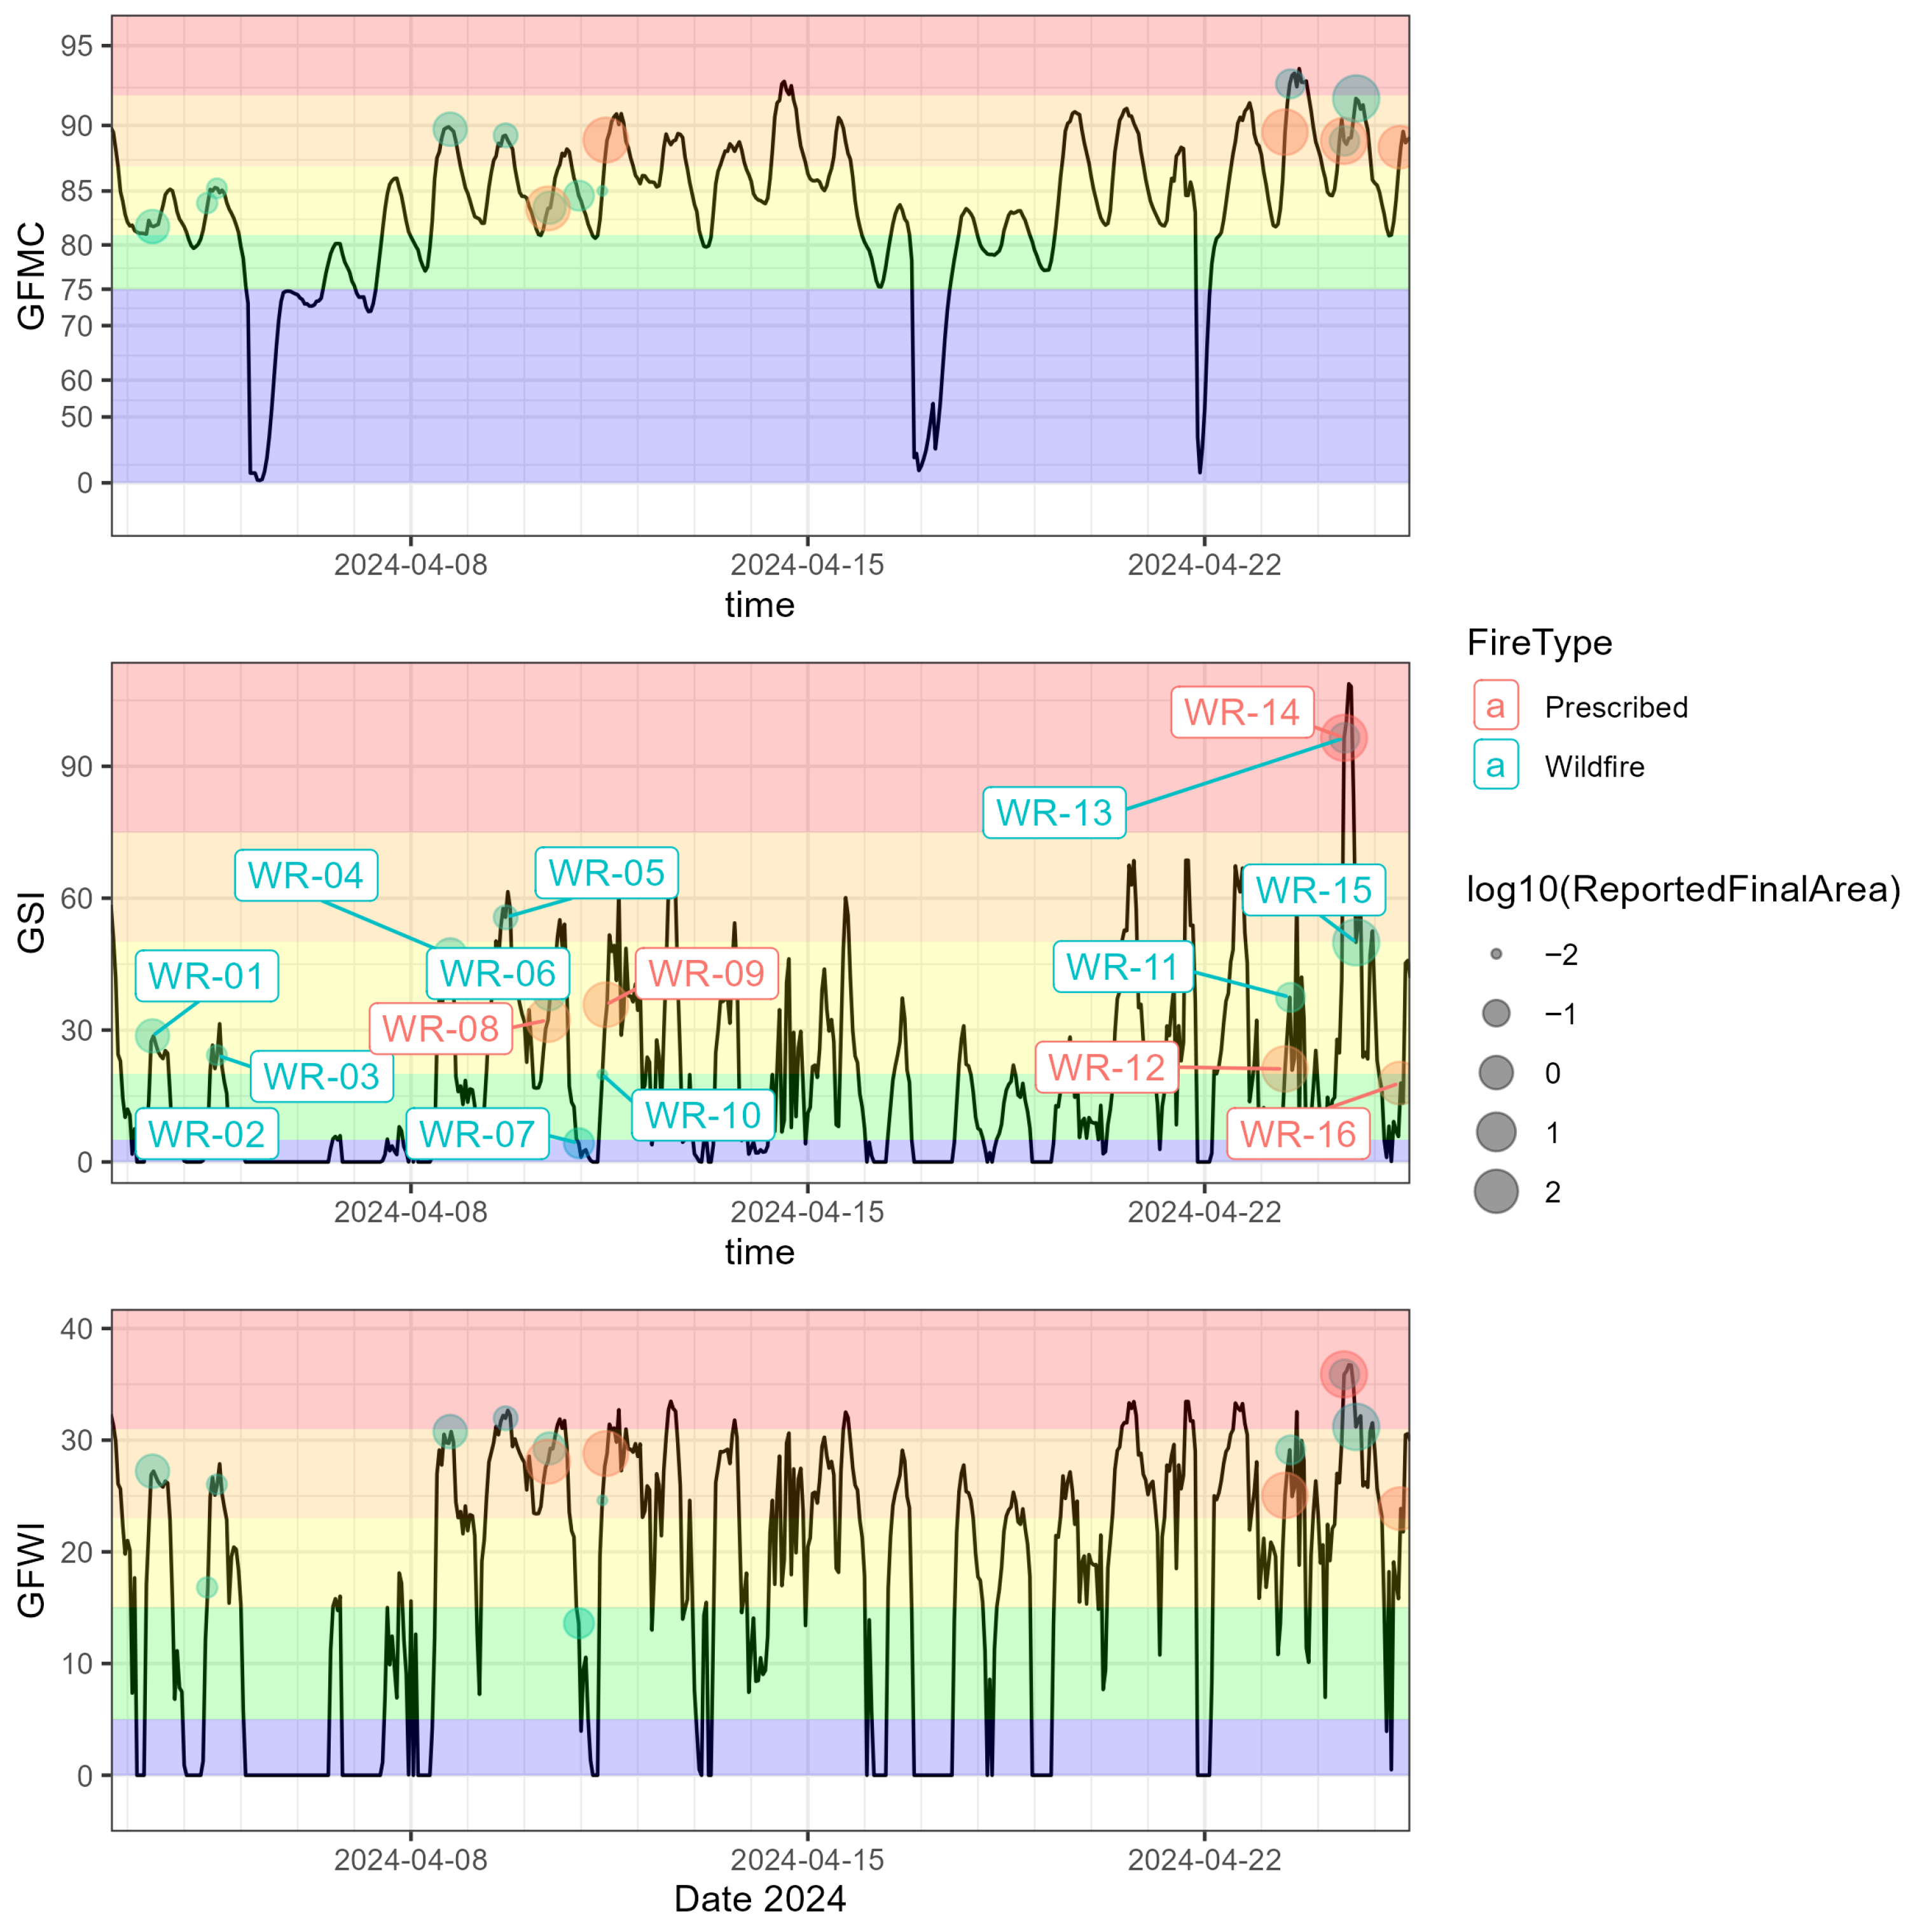
For the 500 ha WR-14 prescribed fire, the southerly winds and large ignition area allowed the rapid detection of the WR-14 fire, which experienced a rapid increase from ambient PM2.5 concentrations of <10g/m3 to 3260 g/m3 at a sensor location 1.8 km downwind. PM concentrations continued to be elevated above 100 g/m3 for an additional 4 h. GOES fire detection occurred within 59 min after the completion of ignition operations, with two GOES-18 hotspots totaling 107.7 MW detected. NOAA VIIRS sensors detected a similar sum of 108 MW of fire radiative power at 149 min after ignition during the early afternoon overpasses. All of the additional sensors at Wainwright were deployed further south, except one sensor located 3 km to the west, which also did not register any elevated PM concentrations. Photos of the strip backing fire ignition pattern at 09:00 showed light winds corresponding to station measurements of 10 km/h winds, but by the time of completion of ignition operations at 11:00, winds had increased rapidly to 30 km/h and relative humidity was 15%, resulting in a Grassland Spread Index of 95 (Table 1). Of the large fires at Wainwright, WR-14 had the most severe fire weather conditions of the large fires and the second highest wind speeds at ignition of all Wainwright fires. Unique to this fire was the rapid detection both by the smoke sensors as well as the GOES geostationary satellite. This rapid spread rate coupled with stronger winds leads to a lower plume height and more turbulent mixing of smoke down to the surface [36], which likely contributed to the rapid detection by the smoke sensors.
Table 1.
Weather and fire weather conditions at the time of ignition for each fire. Acronyms as follows: GFMC = Grassland Fuel Moisture Code; GSI = Grassland Spread Index; GFWI = Grassland Fire Weather Index. All times given in local time.
Fire WR-15 was caused by an escaped spot fire from the WR-14 prescribed burn and ignited at 16:07. With the southwesterly winds at 18 km/h, this fire spread northward and to the north of the entire sensor network, and it was not captured by any ground-based smoke sensors until 19:43, when wind speeds dropped below 10 km/h and the winds shifted to the NW, allowing for a sensor 6 km downwind to detect the lower-intensity smoke plume as the winds decreased and fire spread rates declined at sunset. Increasing cloud cover after the ignition of WR-15 at 16:00 likely prevented GOES detection despite the large fire size. Clear sky conditions the following day at 01:00 allowed for residual smoldering of 2 MW to be detected by the VIIRS sensor. Overnight smoke detection across seven distinct sensors was noted from WR-14 and WR-15, which extended over an area approximately 4800 ha and up to 6.5 km from the WR-14 fire. Overnight winds were from the NW between 9 and 14 km/h. PM2.5 concentrations as high as 100 g/m3 were detected in this dispersed ground-level smoke plume.
Prescribed fire WR-08 (150 ha) took place at 09:00 local time under partially cloudy conditions with moderate relative humidity (50%) and strong winds (30 km/h) from the northwest. This fire, being on the eastern edge of the sensor layout, was not detected until 309 min (5 h) after ignition when a sensor 1.7 km to the SW was able to detect smoke, likely residual smoldering smoke with little to no plume rise. This excess PM at the surface was detected for 4.25 h afterwards and again at 18:14 and 23:37. Two additional sensors within 3 km of the burn registered fire warnings that were made concurrently to the first sensor at 23:30 local time, suggesting that low-wind conditions overnight allowed for the widespread lateral dispersion of smoke to both the south and southwest in a 60 degree cone extending at least 2.5 km. No GOES data were detected for this fire due to the cloud; VIIRS detection only occurred the following morning when 2 MW of smoldering FRP was detected. Approximately 1 h prior to the VIIRS detection, smoke sensor warning detections were made by two sensors located 1.4 and 2.6 km west of the fire, where PM2.5 concentrations in excess of 200 g/m3 were detected.
Prescribed fire WR-09 took place the morning following WR-08, but under cloud-free conditions. The fire, with 250 ha of fuel, was detected as lighter southeast winds at 14–18 km/h advected smoke to a sensor located 1.1 km SW of the prescribed fire area at 140 min after ignition. GOES detections were not recorded, likely due to a thin cirrus cloud layer present during the entire burning period. S-NPP VIIRS detections of 232 MW were made within 215 min after ignition through the cirrus clouds.
The 375 ha prescribed fire WR-12 was ignited approximately 500 m upwind of a smoke sensor under light (9 km/h) west winds. Ground-level smoke detection was not noted until 133 min after ignition operations ceased, when a warning detection was registered. A second sensor located 2.8 km downwind of the fire triggered a warning detection 6 min later. A MODIS Terra fire detection was noted 167 min after ignition with the late morning overpass, registering a total of 108 MW of FRP. The first GOES detection was made 20 min after the MODIS Terra detection, with an FRP of 86 MW detected. The ground-level smoke was detected for nearly 5 h. An additional four sensors located southeast of the fire detected the smoke from 15:54 to 16:37. Five additional detections were registered by sensors after sunset, in all directions and up to 6 km away.
The final large fire of the season, the WR-16 prescribed fire, was ignited at 10:36 local time under light NW winds and partial cloud cover of thin cirrostratus cloud, eventually reaching a final size of 75 ha. The first detection of the fire was by the VIIRS sensor on the NOAA-21 satellite at 19:19 UTC, 218 min after ignition, where a single 7 MW hotspot was registered. At 19:47 UTC, two additional hotspots of 7 and 54 MW were detected by VIIRS on Suomi-NPP. The first smoke sensor warning occurred 396 min after ignition, when a sensor 4.7 km downwind registered a warning. Smoke events were registered by an additional seven sensors overnight. No GOES detections were recorded for this fire, due in part to its smaller size as well as the nearly complete cover of cirrostratus cloud in the afternoon, which attenuates midwave radiation emitted by the fire.
VIIRS detections were registered in all five large fires at Wainwright. In three cases, morning ignitions between 10:00 to 11:00 local standard time resulted in VIIRS detections 94 to 160 min later. Of these, only one VIIRS detection was faster than the smoke sensors, and the fires in all cases far exceeded the minimum VIIRS detection radiative power of 0.5 MW. Two fires (WR-15 and WR-08) only had fire detections during the 01:00 nighttime overpass as residual flaming was visible. In the case of WR-15, the fire’s ignition was at 16:07 local time, and therefore after the S-NPP and NOAA satellite daytime overpasses. GOES geostationary detections were only registered in two fires (WR-12 and WR-14), with very rapid detection of WR-14 within minutes of the reported ignition while the fire was approximately 5 ha and near the GOES FRP detection threshold of 85 MW.
3.1.2. Valcartier and Rock Creek
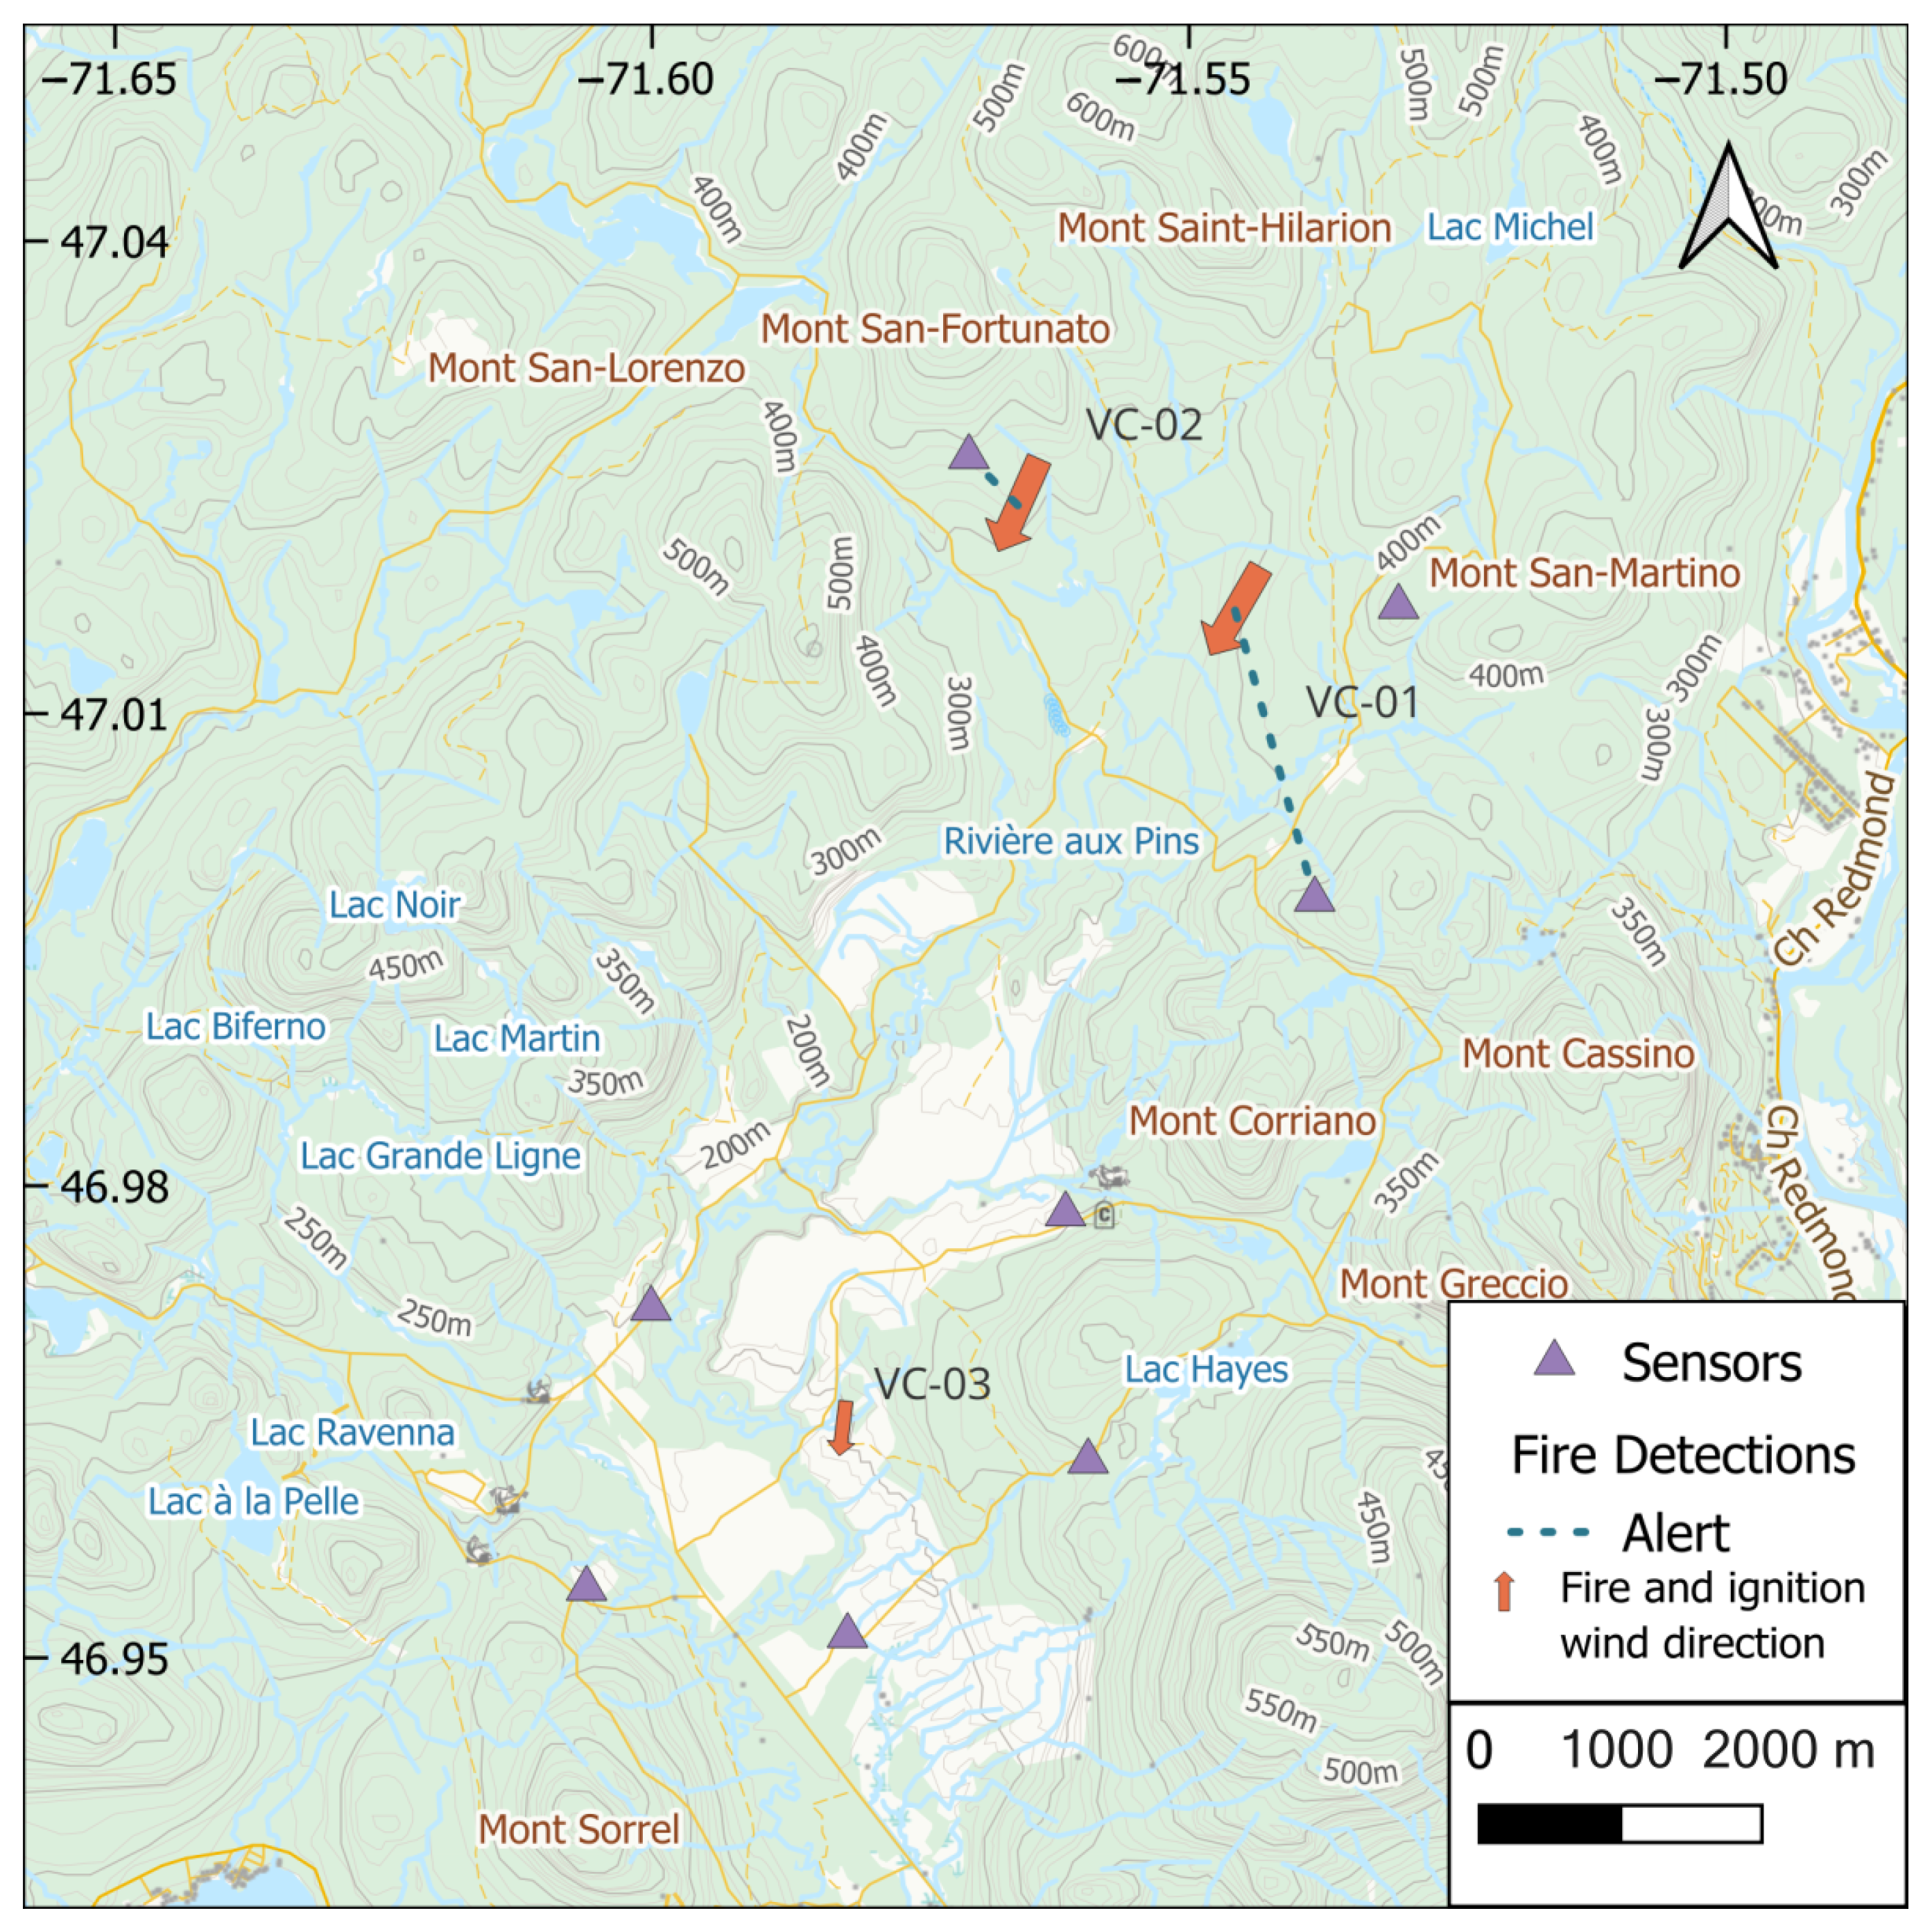
The ignition of prescribed fire VC-01 was completed at 14:05 local time on 13 May under light winds (5 km/h) but low humidity (22%) and correspondingly high Grassland Fuel Moisture Content (GFMC) of 91 (Figure A7). Conditions were mostly overcast with broken cloud. The light NE winds caused smoke to drift away from the sensors immediately east and northwest of the fire, and instead a sensor 2 km away made the first detection at 14:01 (Figure A6). PM remained elevated at this sensor alone until 21:00 local time that evening. No GOES satellite detection was registered for this fire, despite fire growth modeling approximating a peak FRP of 420 MW. Broken cloud cover likely interfered with any satellite fire detection. Cloud-free conditions overnight and into the next day allowed for a VIIRS detection of smoldering conditions, with 1 MW of FRP detected at 02:45 local time as a single pixel.
By 23 May, very large fires in Alberta and British Columbia, some 2500 to 3000 km to the west, had begun to bring smoke aloft into the Valcartier region. The VC-02 prescribed fire was ignited with a single sensor 500 m to the northwest at 10:08 on 23 May under NE winds at 11 km/h but higher humidity (56%) compared to VC-01, and thus GFMC was 81. First smoke sensor detection was not registered until 13:09 local time. Elevated PM from only the one sensor remained until 21:00. No GOES detection of this fire was registered, despite the reported 75 ha size and theoretical peak FRP of 198 MW, which is well above the minimum floor for GOES detection under ideal cloud-free conditions. The slower pace of ignition operations compared to a free-growing fire [37] may have reduced the growth rate and thus FRP emissions below the threshold for GOES detection. MODIS aqua aerosol optical depth for the mid-day overhead was approximately 0.12 to 0.25 and likely did not significantly impact fire detection.
The 75 ha prescribed fire at Rock Creek took place under light winds (5 km/h at ignition) and partially cloudy conditions (Figure A9), resulting in no ground-based smoke sensor detections until 298 min after ignition (Figure A8). A second sensor located a further 400 m downwind triggered a warning 4 min afterwards. A sensor located 900 m east and downwind did not detect the fire until a warning was issued at 20:10, after sunset. Three additional detections were made at 16:51 and through to 05:03 the following morning. GOES-18 detection occurred 213 min after ignition, when 69 MW of FRP was observed. VIIRS did not detect the fire until 1 MW was observed at 2:07 by the VIIRS sensor on the NOAA-20 satellite.
3.2. Detection of Small Fires
Of the smaller fires, 1 ha or less, only three (WR-06, WR-07, WR-16) of ten of the fires registered a warning with the smoke sensors (Table 2), and only two registered an alert. Similar to the large fires, in all three cases, the fire had already reached its final size (i.e., was no longer growing) at the time of first warning. Fires were detected by smoke sensors 1.1 to 5.0 km away at 90–400 min after ignition. Fires WR-06 and WR-16 ignited at 10:30 local time and were likely finished burning by the SNPP and NOAA satellite overpasses at 13:00; the fires were likely too small for the critical sub-pixel area of extensive residual smoldering that could be detected by VIIRS [17]. The single small fire at Valcartier (6 ha) did not result in any smoke sensor warnings or alerts, but did result in a VIIRS detection 163 min after ignition.
Table 2.
Fire ignition and detection characteristics of each fire event, in order of decreasing final fire size in each study area. Area, fire radiative power (FRP), and plume height at warning are all estimates based on fire growth modeling.
3.3. Monitoring of Sustained Smoke Production
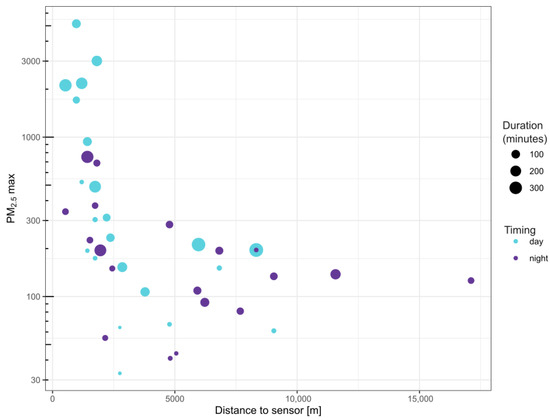
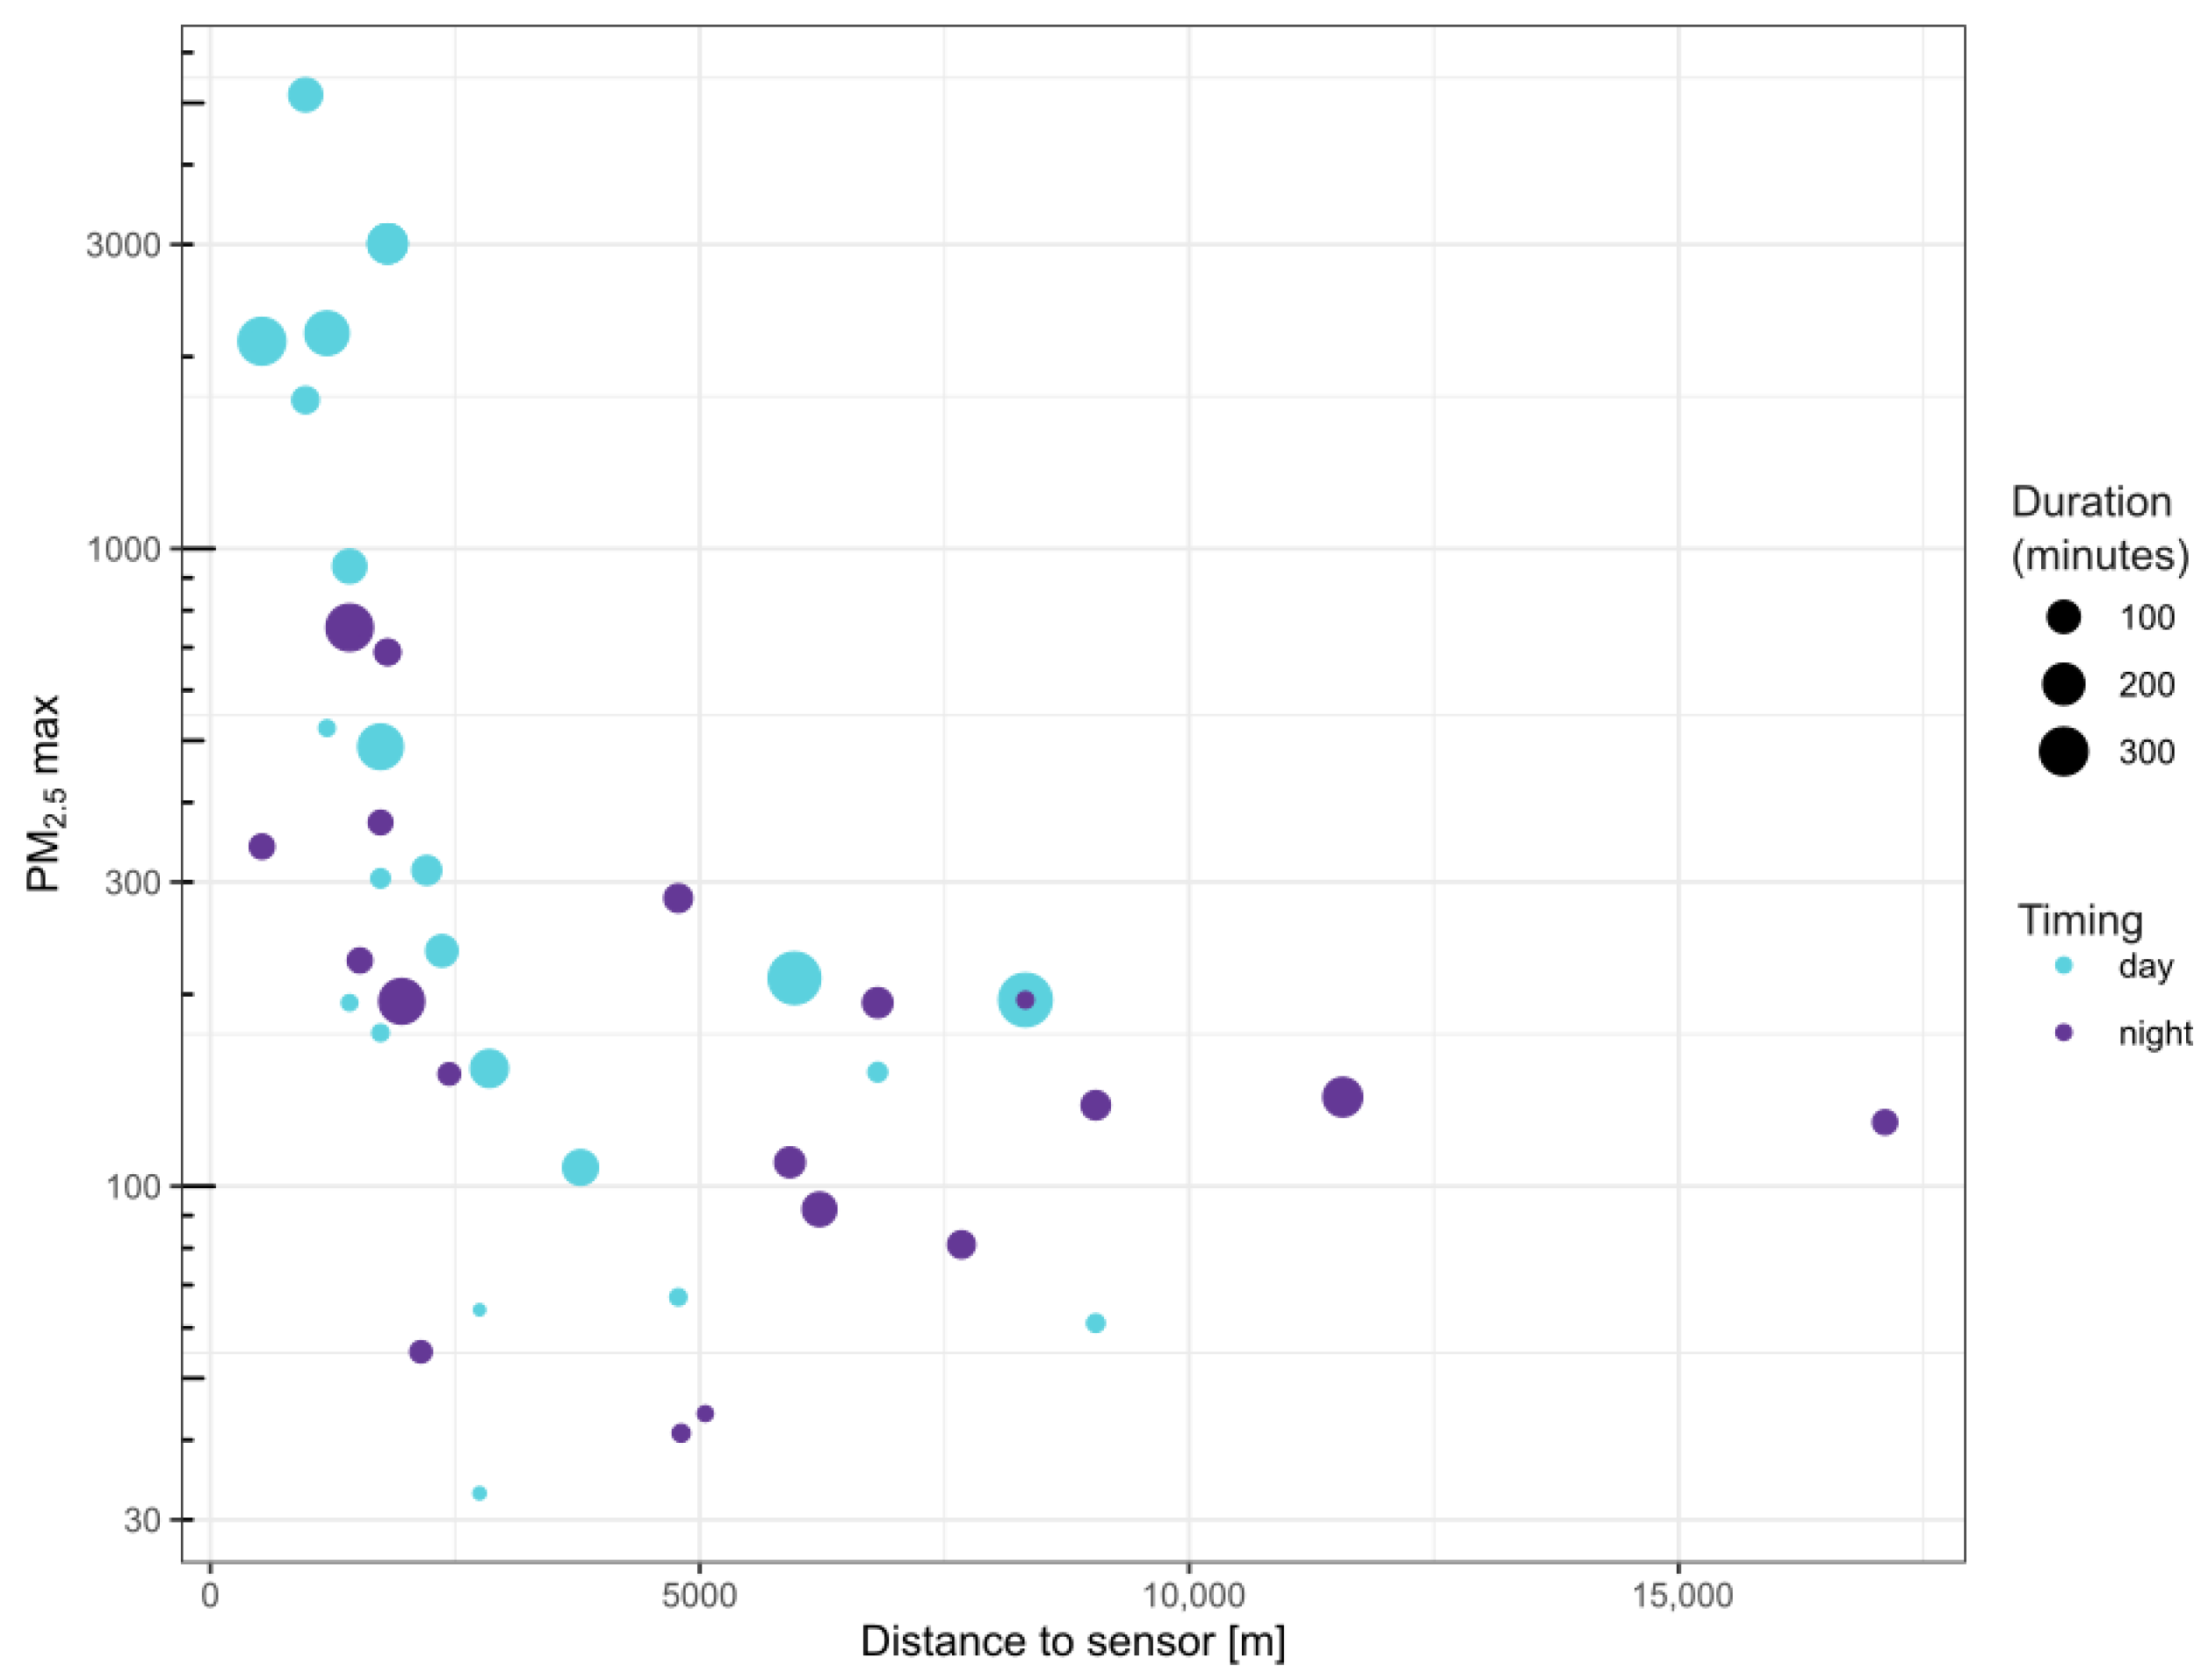
In addition to the first detection, the smoke sensors produced useful information on the sustained production of ground-level smoke in the hours after ignition and growth of the prescribed fires and wildfires. Smoke detection events were registered at Wainwright up to 17 km from the fire area, at concentrations as high as 5000 g/m3 (Figure 2). Concentrations of PM2.5 have been registered as high as 20,000 g/m3 at the immediate perimeter of fires by similar ground-based sensor packages by ref. [25]. Smoke event observations the most distant from the fire were typically made after sunset through the early morning and had a lower peak PM2.5 of less than 800 g/m3. Afternoon smoke event observations made near the peak of the daily burning conditions (highest temperature and winds, lowest humidity) were confined to a distance of less than 2.5 km typically, and only in these observations within 2.5 km were PM2.5 concentrations in excess of 300 g/m3 observed. Short duration and low concentration (<50 g/m3 smoke events) were only observed at distances of 5 km or less; smoke events observed closer were of both longer duration and higher concentration.
Figure 2.
Biplot of distance from sensor to fire compared to peak PM 2.5 concentration by detection event. Events are colored by the hour of the start of the detection. Data for the Wainwright study area only.
3.4. Estimating Visual Detection Range
At the time of the smoke sensor warning, the modeled plume top-heights were between 400 and 1600 m above the ground. Against a high-contrast blue sky, such features are likely visible at a limit approaching the maximum aeronautical visibility range of 50–60 km, as supported by an analysis of detection distances by human observers from fire towers (see Figure A1). However, visual detection observations were not undertaken as a parallel effort during the smoke sensor deployment; future work on this topic would benefit from visual plume observation and detection in parallel to smoke and remote sensing. We do not explicitly model the visual detection of the smoke plumes, but rather provide this data as comparison against fire detection distances in nearby forest fire management zones with trained human observers.
Under widespread regional smoke or overcast conditions, the visual contrast between a smoke plume and its surroundings can diminish, and thus reduce the detection distance [38]. Larger, more intense fires that are beyond suppression resources often feature darker (and larger) smoke columns [39], which aid in the visual detection process for incidental ground-based observers. In Canada, fixed-wing dedicated fire detection [16,40] uses human observers, and benefits from the visual contrast of typically light-colored smoke against a dark forest canopy background. Ideally, initial fire detections are made when the fire is a small sub-canopy surface fire, which reduces the ability of fixed-wing or satellite fire infrared detection due to canopy interception of infrared energy [17].
3.5. Regional Smoke False Positives from Smoke Sensors
In June of 2023, extensive regional smoke from wildfires 300–500 km upwind to the west in central Quebec severely impacted local particulate concentrations at the Valcartier deployment [41,42]. This far-field smoke source caused system warnings and alerts that were valid at the instrument level, but the smoke source was from very large and very well-observed fires that were being heavily suppressed. This smoke emission is well predicted in advance and in real time using operational air quality forecasting systems that incorporate satellite fire detection and smoke dispersion schemes such as [43]. These regional, widespread smoke emissions present a major source of false positive events in the context of local smoke and fire detection; furthermore, the detection of local fire events during periods of regional smoke remains a significant shortcoming in the fire detection event algorithms provided by sensor vendors.
4. Conclusions
Continuous air quality sensors with telemetry were deployed in advance of prescribed fire operations at a number of locations across Canada. A total of 20 prescribed fires and wildfires occurred in the vicinity of the sensor network, and in 6 of the 10 largest fires, the ground-based smoke sensor network provided superior time to first detection compared to satellite observations by polar orbiting and geostationary platforms. Given the densely populated locations, visual detection by observers (fire response agency or public) would have been rapid due the quick fire acceleration and large resultant smoke plumes. The smoke sensor network provided valuable information on sustained nighttime fire smoldering activity, with residual flaming and smoldering resulting in smoke plumes which that traveled upwards of 10 km at night and at smoke concentrations far in excess of ambient levels, providing a clear detection signal. Satellite geostationary sensors were largely unable to detect overnight activity due to very low fire radiative power, while polar orbiting sensors provide only a handful of observations overnight and only under cloud-free conditions. Such ground-based smoke monitoring may fill a niche in fire detection and monitoring under the following conditions: (1) the absence of visual observers of smoke plumes (dedicated staff, camera tower systems, or the public), (2) frequent continuous cloud that obscures satellite observations of fire, (3) a relatively dense sensor spacing on the order of kilometers, (4) low-intensity fire typical of residual flaming and smoldering without active fire area growth, and (5) nighttime or overcast conditions that greatly limit the visibility of the smoke plume in the sky. This nighttime monitoring function of the smoke sensor networks appears to be particularly suited to this type of instrumentation, and fulfills a niche in the continuous monitoring of contained or extinguished fires.
Author Contributions
D.K.T. and G.F. conceived and designed the experiments; G.F. performed the experiments; D.K.T. and P.J. analyzed the data; D.K.T. and G.F. wrote the paper. All authors have read and agreed to the published version of the manuscript.
Funding
The United States Department of Homeland Security (Science and Technology Directorate) purchased the sensors from the vendor, and provided support for travel, sensor deployment operations and technical support under the project Critical Infrastructure Protection (CAA-10-2008). The Canadian Safety and Security Program (a program within Defence Research and Development Canada) provided funding for travel, technical and logistical support under project number CSSP-2022-TI-2583.
Data Availability Statement
All the data required to reproduce the analysis, as well as the RMarkdown build files, are available at https://doi.org/10.5281/zenodo.18202275.
Acknowledgments
The authors would like to thank Jeffrey Booth from the United States DHS (S&T) for initiating the collaboration with the Canadian DND for the testing of the sensors and for funding both the sensor acquisition and logistical support for sensor deployment. We also acknowledge the contribution of the Canadian Safety and Security Program to develop the testing and evaluation of the sensors in Canada. We would like to thank the smoke sensor vendors, N5 Inc. (Rockville, Maryland, USA), especially Debra Deinenger, Robins George and Rudy Villegas for their assistance in data retrieval. We would also like to thank Andrew Loulousis and his team at TechNexus Venture Collaborative for logistical organization and support of the bilateral US/CAN collaboration and sensor deployments. We would like to thank Maj. Lavigne and Sergeant-Major (ret’d) Steve Noiseux and their team at CFB Valcartier for their excellent support in installing the sensors there, as well as the late Robert Prospero, Mark Batten, and Sgt. Korosi and his team at the CF Detachment Wainwright for their excellent support in the installation at that location. Finally, we would like to thank Olivier Lundqvist, Luc Carrière, and Christine Bussières at SOPFEU; and Samuel Siddall, Neal McLoughlin, Andrew Simpson, Ash Richardson, and their colleagues at the BCWS for their support in this initiative.
Conflicts of Interest
The authors declare no conflicts of interest.
Appendix A. Patterns in Historical Canadian Wildfire Detection
The count of fire detections by different modalities is broken down by size class and ignition type in Figure A1 for the Canadian province of Alberta. Lookout towers in Alberta are a mixture of staffed towers as well as camera-equipped lookouts. Note that human-caused fires are typically associated with settlements and roadways and are therefore more easily detected by public reporting, as compared to lightning fires, which may start in relatively isolated forest areas distant from human activity.
Using the same Alberta Historical Wildfire Database, a record of all fires observed in Alberta from 2006 to 2023 was obtained. Data were filtered to only contain observations from lookout towers. Distances between reported fire locations and tower locations were calculated and displayed on a histogram. A maximum observable distance from towers can provide a cutoff where visual detection is effective. Within the Alberta dataset, some towers have distributions that are overly centralized on a specific area. Checking these locations shows that many of them come from small settlements doing waste burning or other events requiring a large fire. Three towers were discarded as outliers not indicative of random fire events but instead those with a social purpose. Additionally, any towers with names not matched in the tower list were discarded to avoid combining maps with location data to identify them. The histogram was normalized to fit with the gamma probability density function, PDF, before scaling it back up to match the raw histogram data.
Figure A1.
Distance between the fire ignition location and the location of a fixed human observer stationed in an observation tower equipped with basic optics (binocular or simple telescope) for fires in the Canadian province of Alberta from 2012 to 2024. Note that 95 percent of fires were detected at 50 km or less.
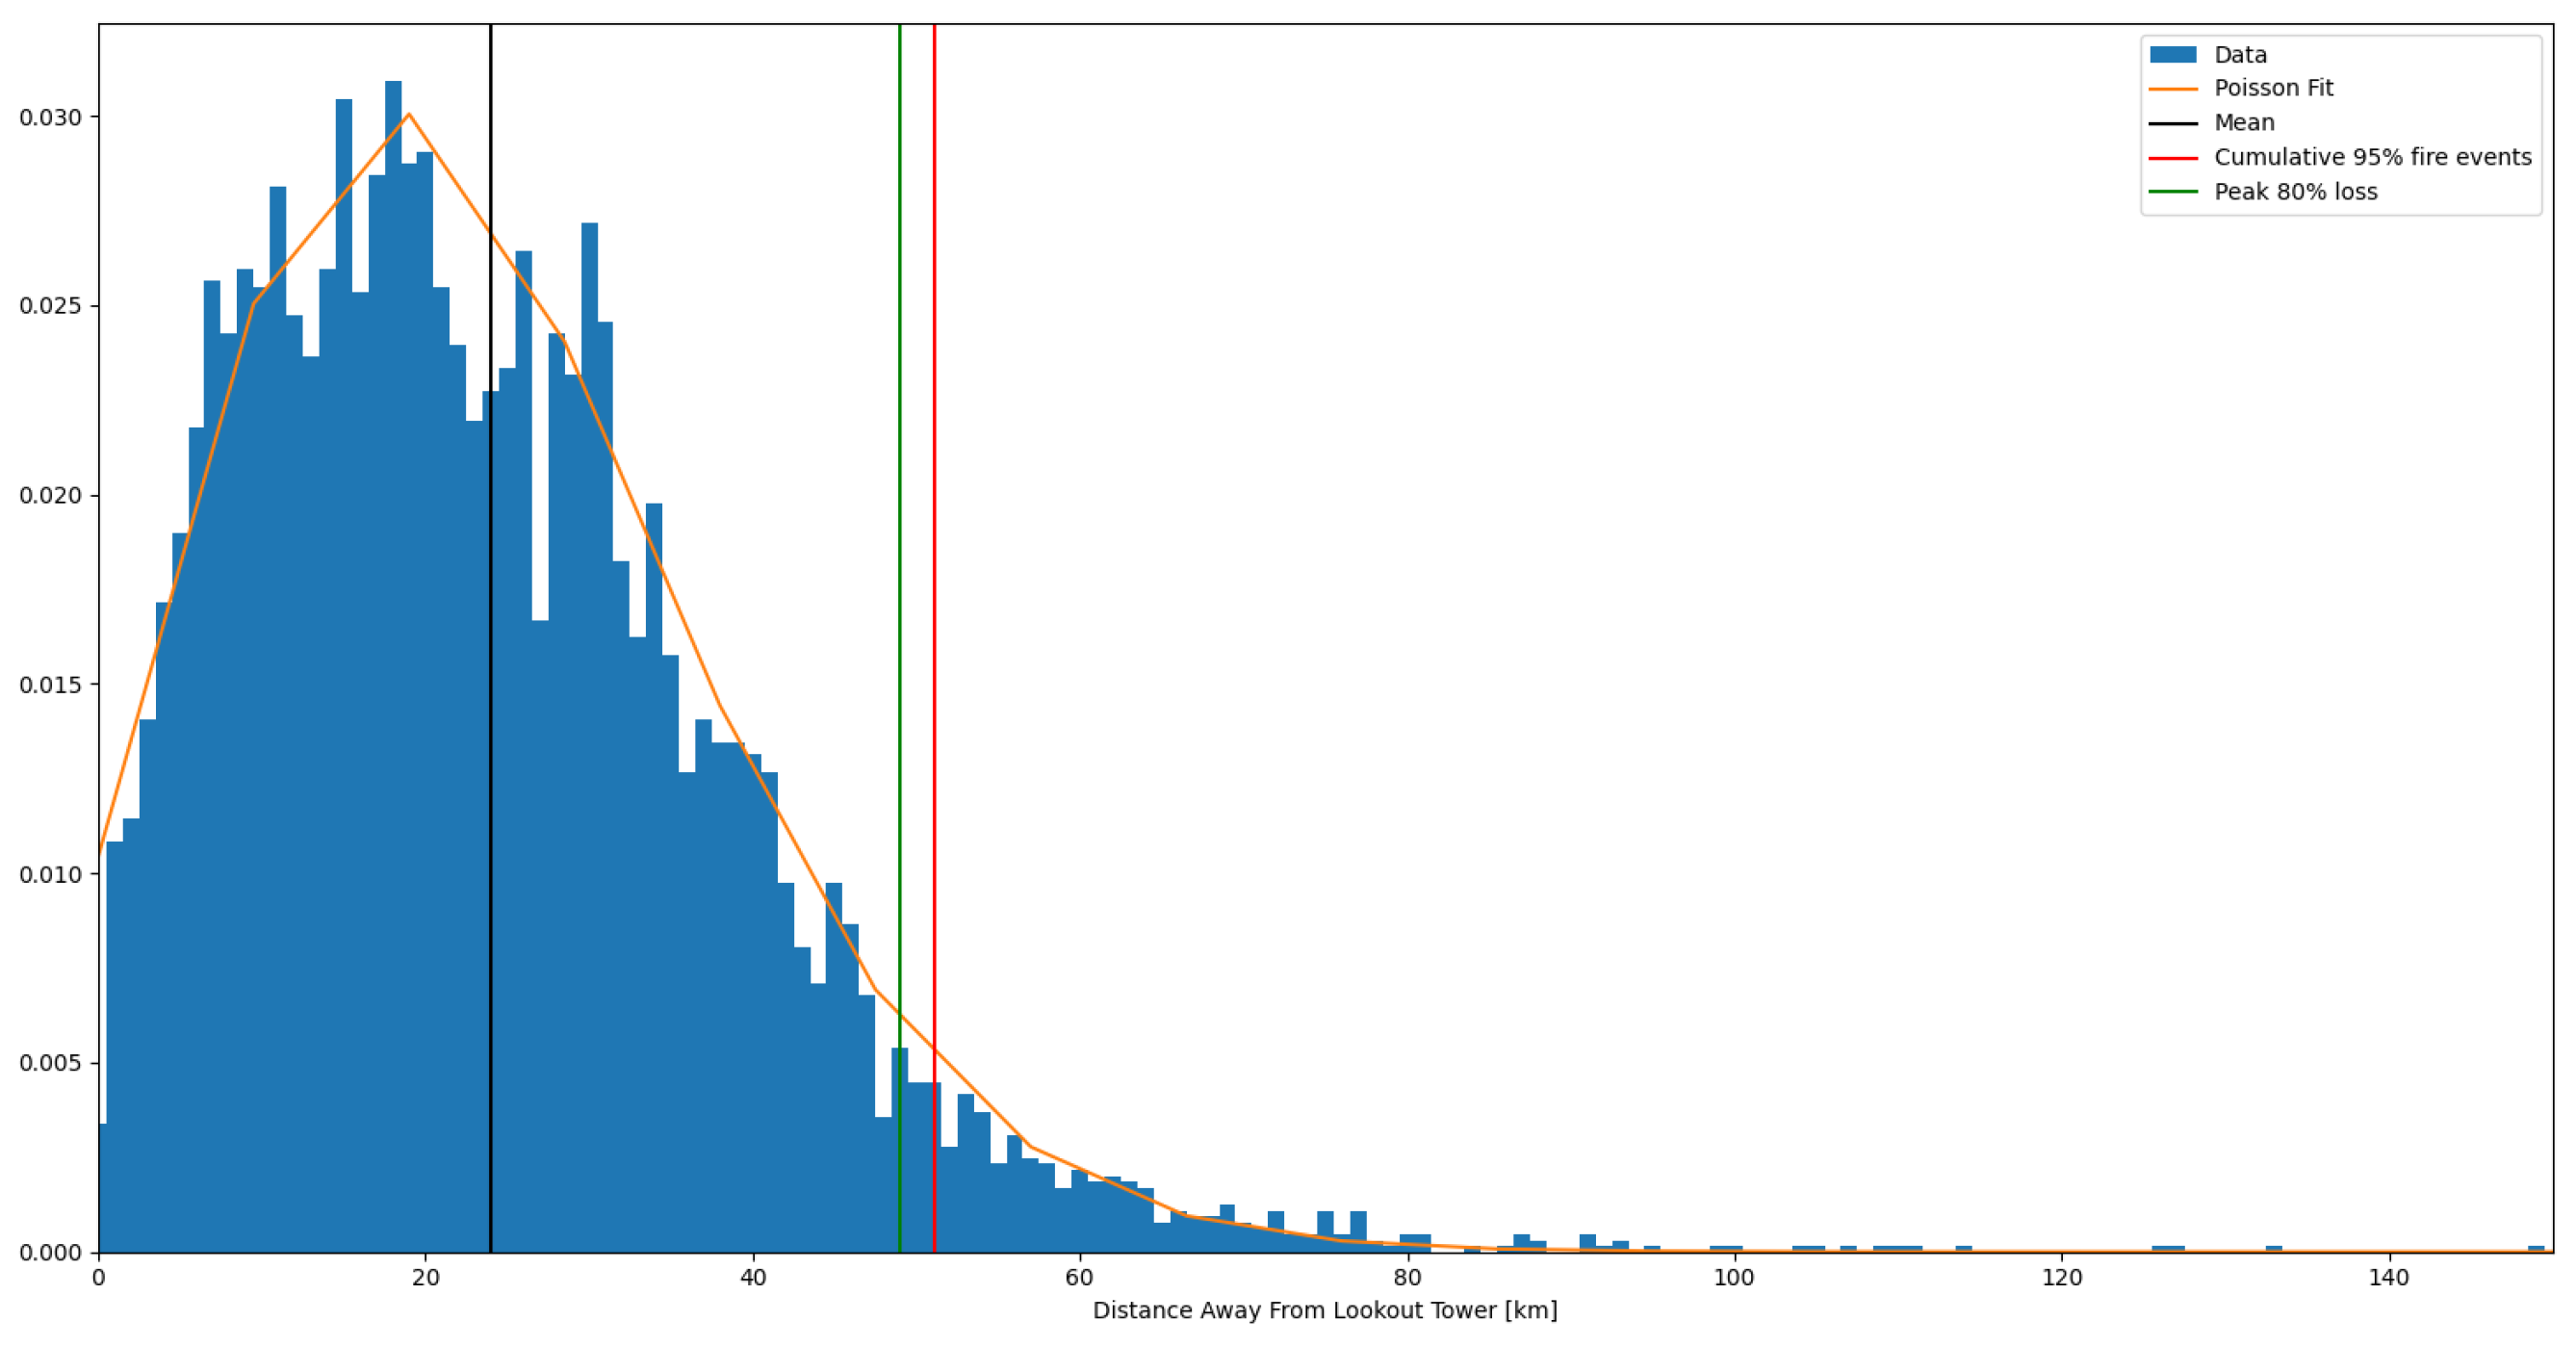
Figure A2.
Historical fire detection mode by fire size class (at detection) and fire ignition type.
Canada’s National Burned Area Composite Database contains records of polar orbiting fire detection (i.e., MODIS starting in 2002 and VIIRS from 2012 onwards) as well as official fire agency records of the day of first detection. Agency records as well as Landsat burn perimeters are used to filter hotspots in space and time per fire. The date of first and last hotspot per fire are cataloged and can be compared against the date of fire detection by the land management agency. Using broad size classes, the detection rate of fires by polar orbiting satellite is shown in Figure A4. Similarly, the offset (rounded to the nearest integer of day) between satellite detection and agency detection by fire cause is shown in Figure A3.
Figure A3.
Difference in timing of first polar orbiting satellite detection vs. agency detection, rounded to calendar day.
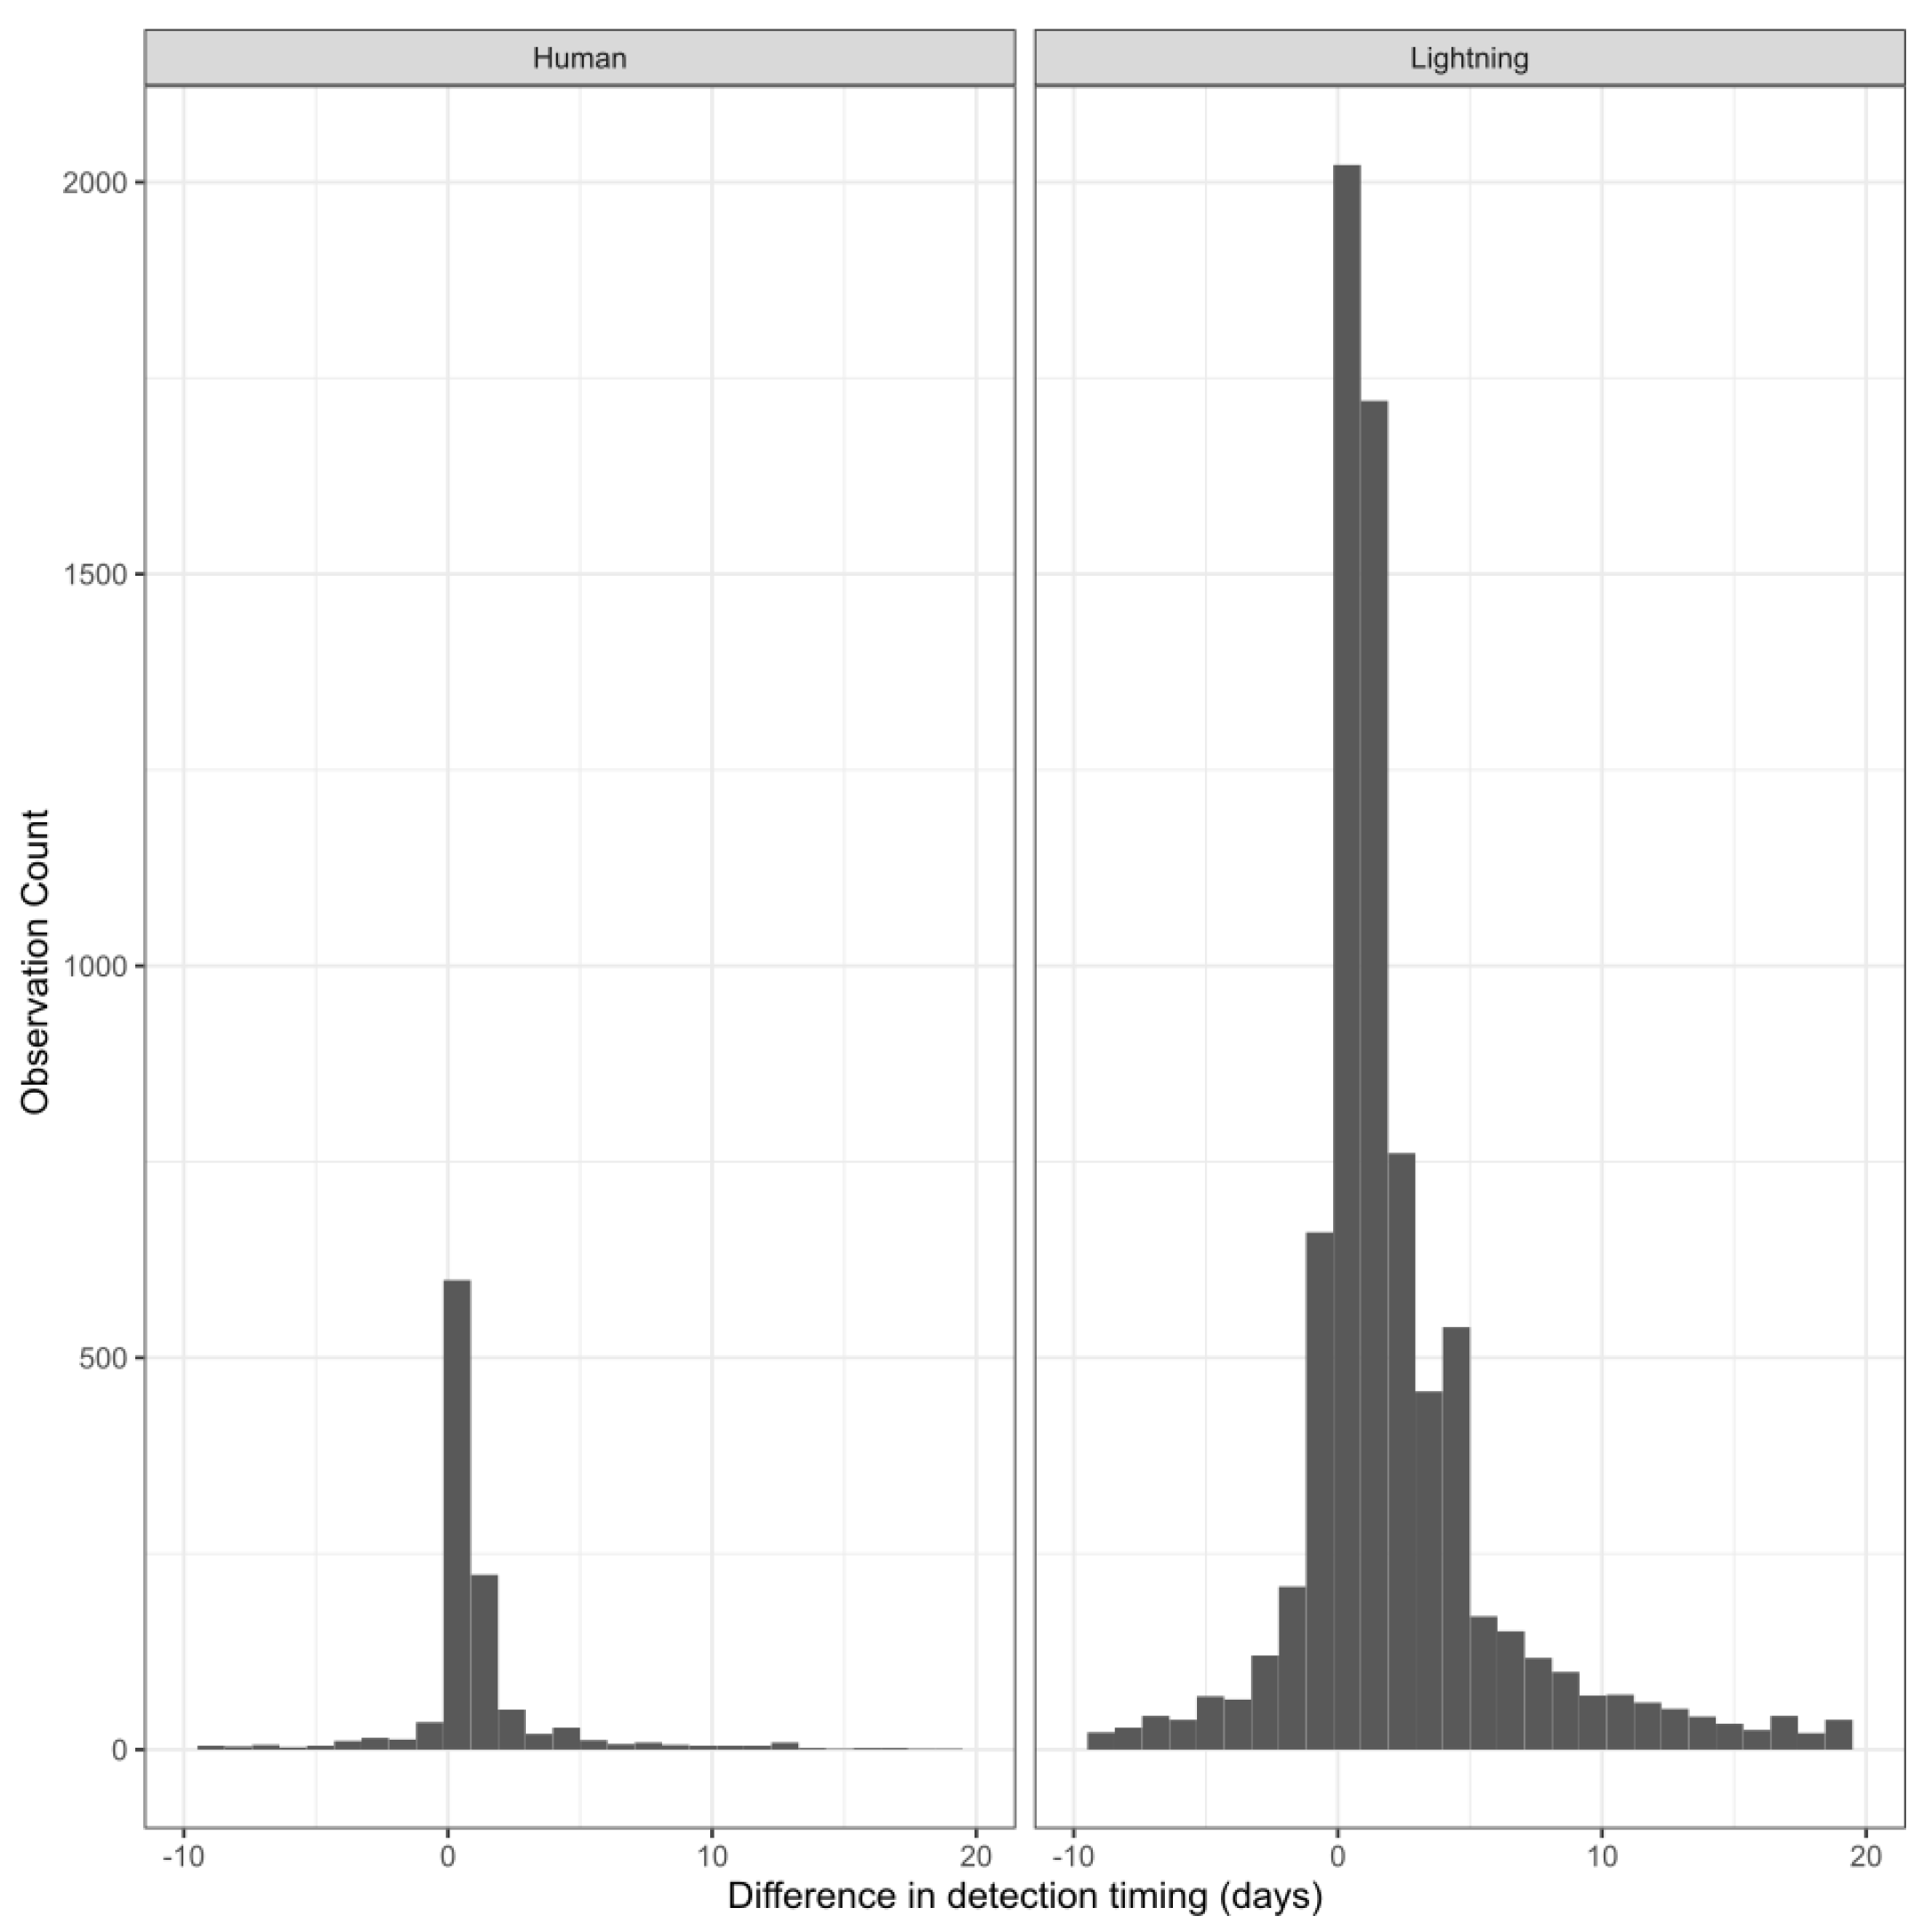
Figure A4.
Probability of one or more satellite hotspot detections by a polar orbiting fire detection sensor (e.g., MODIS or VIIRS) by final fire size and ignition type. Note that human-caused fires typically grow faster and are extinguished more quickly in Canada.
Appendix B. Site Descriptions and Weather Records
Appendix B.1. Wainwright
The 3rd Canadian Division Support Base Detachment Wainwright is located in east-central Alberta, in the Subhumid Prairies ecozone, Aspen Parkland ecoregion. Snowmelt typically occurs in March in the region, and the month of April is often relatively dry with few days of cloud cover and rain, allowing for frequent spring fires in the area before annual vegetation emergence of grasses, shrubs, and aspen leaf-out in May. Vegetation is dominantly grass, with patches of short (<10 m height) and low-density aspen and deciduous shrubs. In the aspen patches, downed wood and a thin duff layer [44] provide fuels for sustained smoldering for multiple hours after the initial passage of a fire. Some areas of the training grounds see frequent fire as a result of training activities, while other areas burned in 2024 with high tree and shrub cover had not experienced recent fire. A complete description of the vegetation ecology of the region in given in [45]. Springtime fuel loads as given in [45] are 4.5 t/ha, slightly higher than the 3.5 t/ha fuel load used in the FBP. The terrain is relatively flat for the purposes of fire growth modeling and actual fire spread. Hourly weather data was taken from the Wainwright Airfield (52.82 N, 111.10 W), with solar radiation instrument observations from the Kinsella agricultural monitoring station, located 35 km to the NW of the study area.
Figure A5.
The Grassland Fire Weather Index System values for the Wainwright deployment. GFMC is the Grassland Fuel Moisture Code; GSI is the Grassland Spread Index; GFWI is the Grassland Fire Weather Index. The blue, green, yellow, orange, and red backgroudn colours correspond to the low, moderate, high, very high, and extreme classes of each code and index, following [27]. Circles are colourized by prescribed vs. wildfire with size proportional to final area.
Appendix B.2. Valcartier
The 2nd Canadian Division Support Base Valcartier is located 20 km NW of Quebec City. The site lies at the northern-most edge of the Mixedwood Plains ecozone, where the forest transitions into a typical Boreal Shield East ecosystem. The forest is a mix of broadleaf (mostly Acer spp.) with spruce, fir, and pine conifers. Prescribed fires in the training grounds typically occur in flat lowlands c. 200 m above sea level, while sensor deployment took place in lowlands as well as on numerous large and steep hills that rise up to 400 m above the valley bottom. These frequently burned valley bottom training grounds are a mixture of short grasses and shrubs with little to no tree cover, and correspond well to the O-1 matted grass fuel type in the FBP. A total of three prescribed fires took place at Valcartier in May of 2023, at which point valley bottom fuels were fully cured and dry. No wildfires occurred during the deployment of the sensors at the training ground. Weather data for this sensor deployment were taken from the Quebec City International Airport, 23 km to the SE.
Figure A6.
Fire and sensor locations at the Valcartier deployment.
Appendix B.3. Rock Creek
The Rock Creek prescribed fire took place on public forest lands in the Kettle River Valley of southern British Columbia, Canada. The fuels are primarily an open Douglas Fir-Ponderosa Pine woodland with a grass surface fuel. The prescribed fire operation occurred on a gentle west-facing slope of c. 10%. Large-diameter downed woody debris provides the majority of surface fuel load, which can contribute to multiple hours of low-intensity smoldering and smoke production [46]. An hourly automatic weather station (also named Rock Creek) operated by the BC Wildfire Service was located 3 km south of the prescribed fire.
Figure A7.
Grassland Fire Weather Indices for the Valcartier deployment. GFMC is the Grassland Fuel Moisture Code; GSI is the Grassland Spread Index; GFWI is the Grassland Fire Weather Index. The blue, green, yellow, orange, and red backgroudn colours correspond to the low, moderate, high, very high, and extreme classes of each code and index, following [27]. Circles are colourized by prescribed vs. wildfire with size proportional to final area.
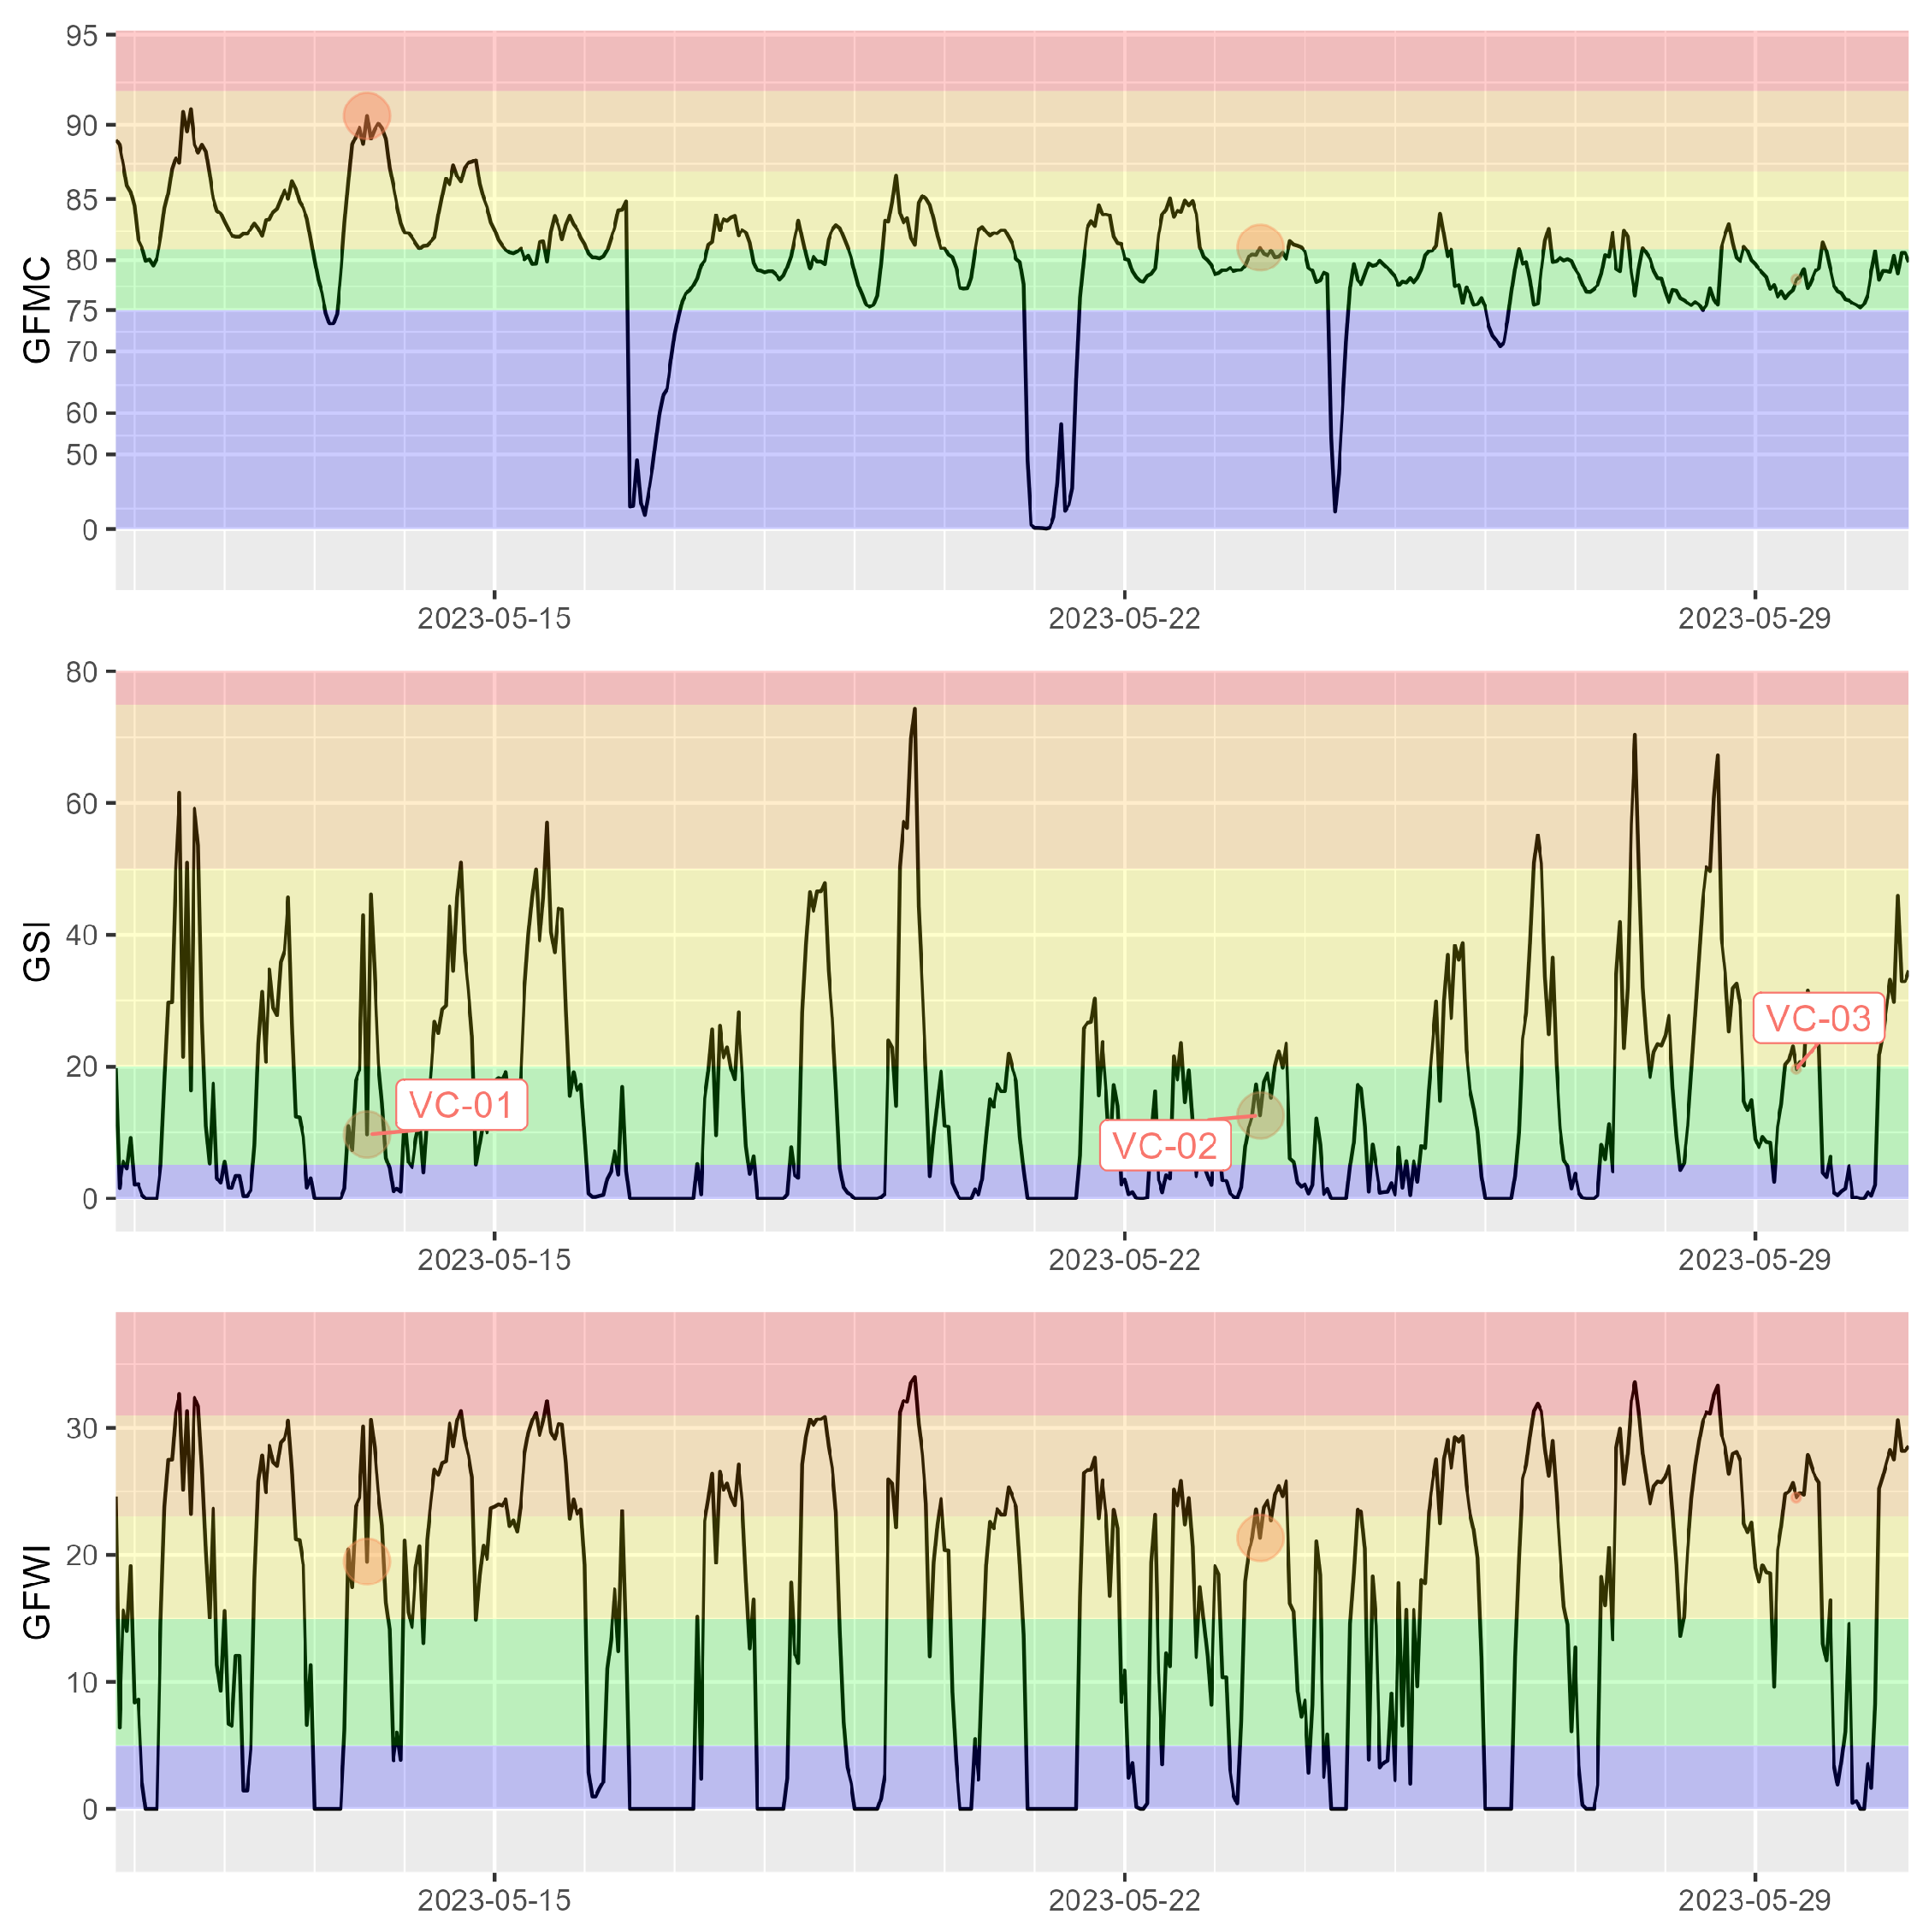
Figure A8.
Fire and sensor locations at the Rock Creek deployment. GFMC is the Grassland Fuel Moisture Code; GSI is the Grassland Spread Index; GFWI is the Grassland Fire Weather Index. The blue, green, yellow, orange, and red backgroudn colours correspond to the low, moderate, high, very high, and extreme classes of each code and index, following [27]. Circles are colourized by prescribed vs. wildfire with size proportional to final area.
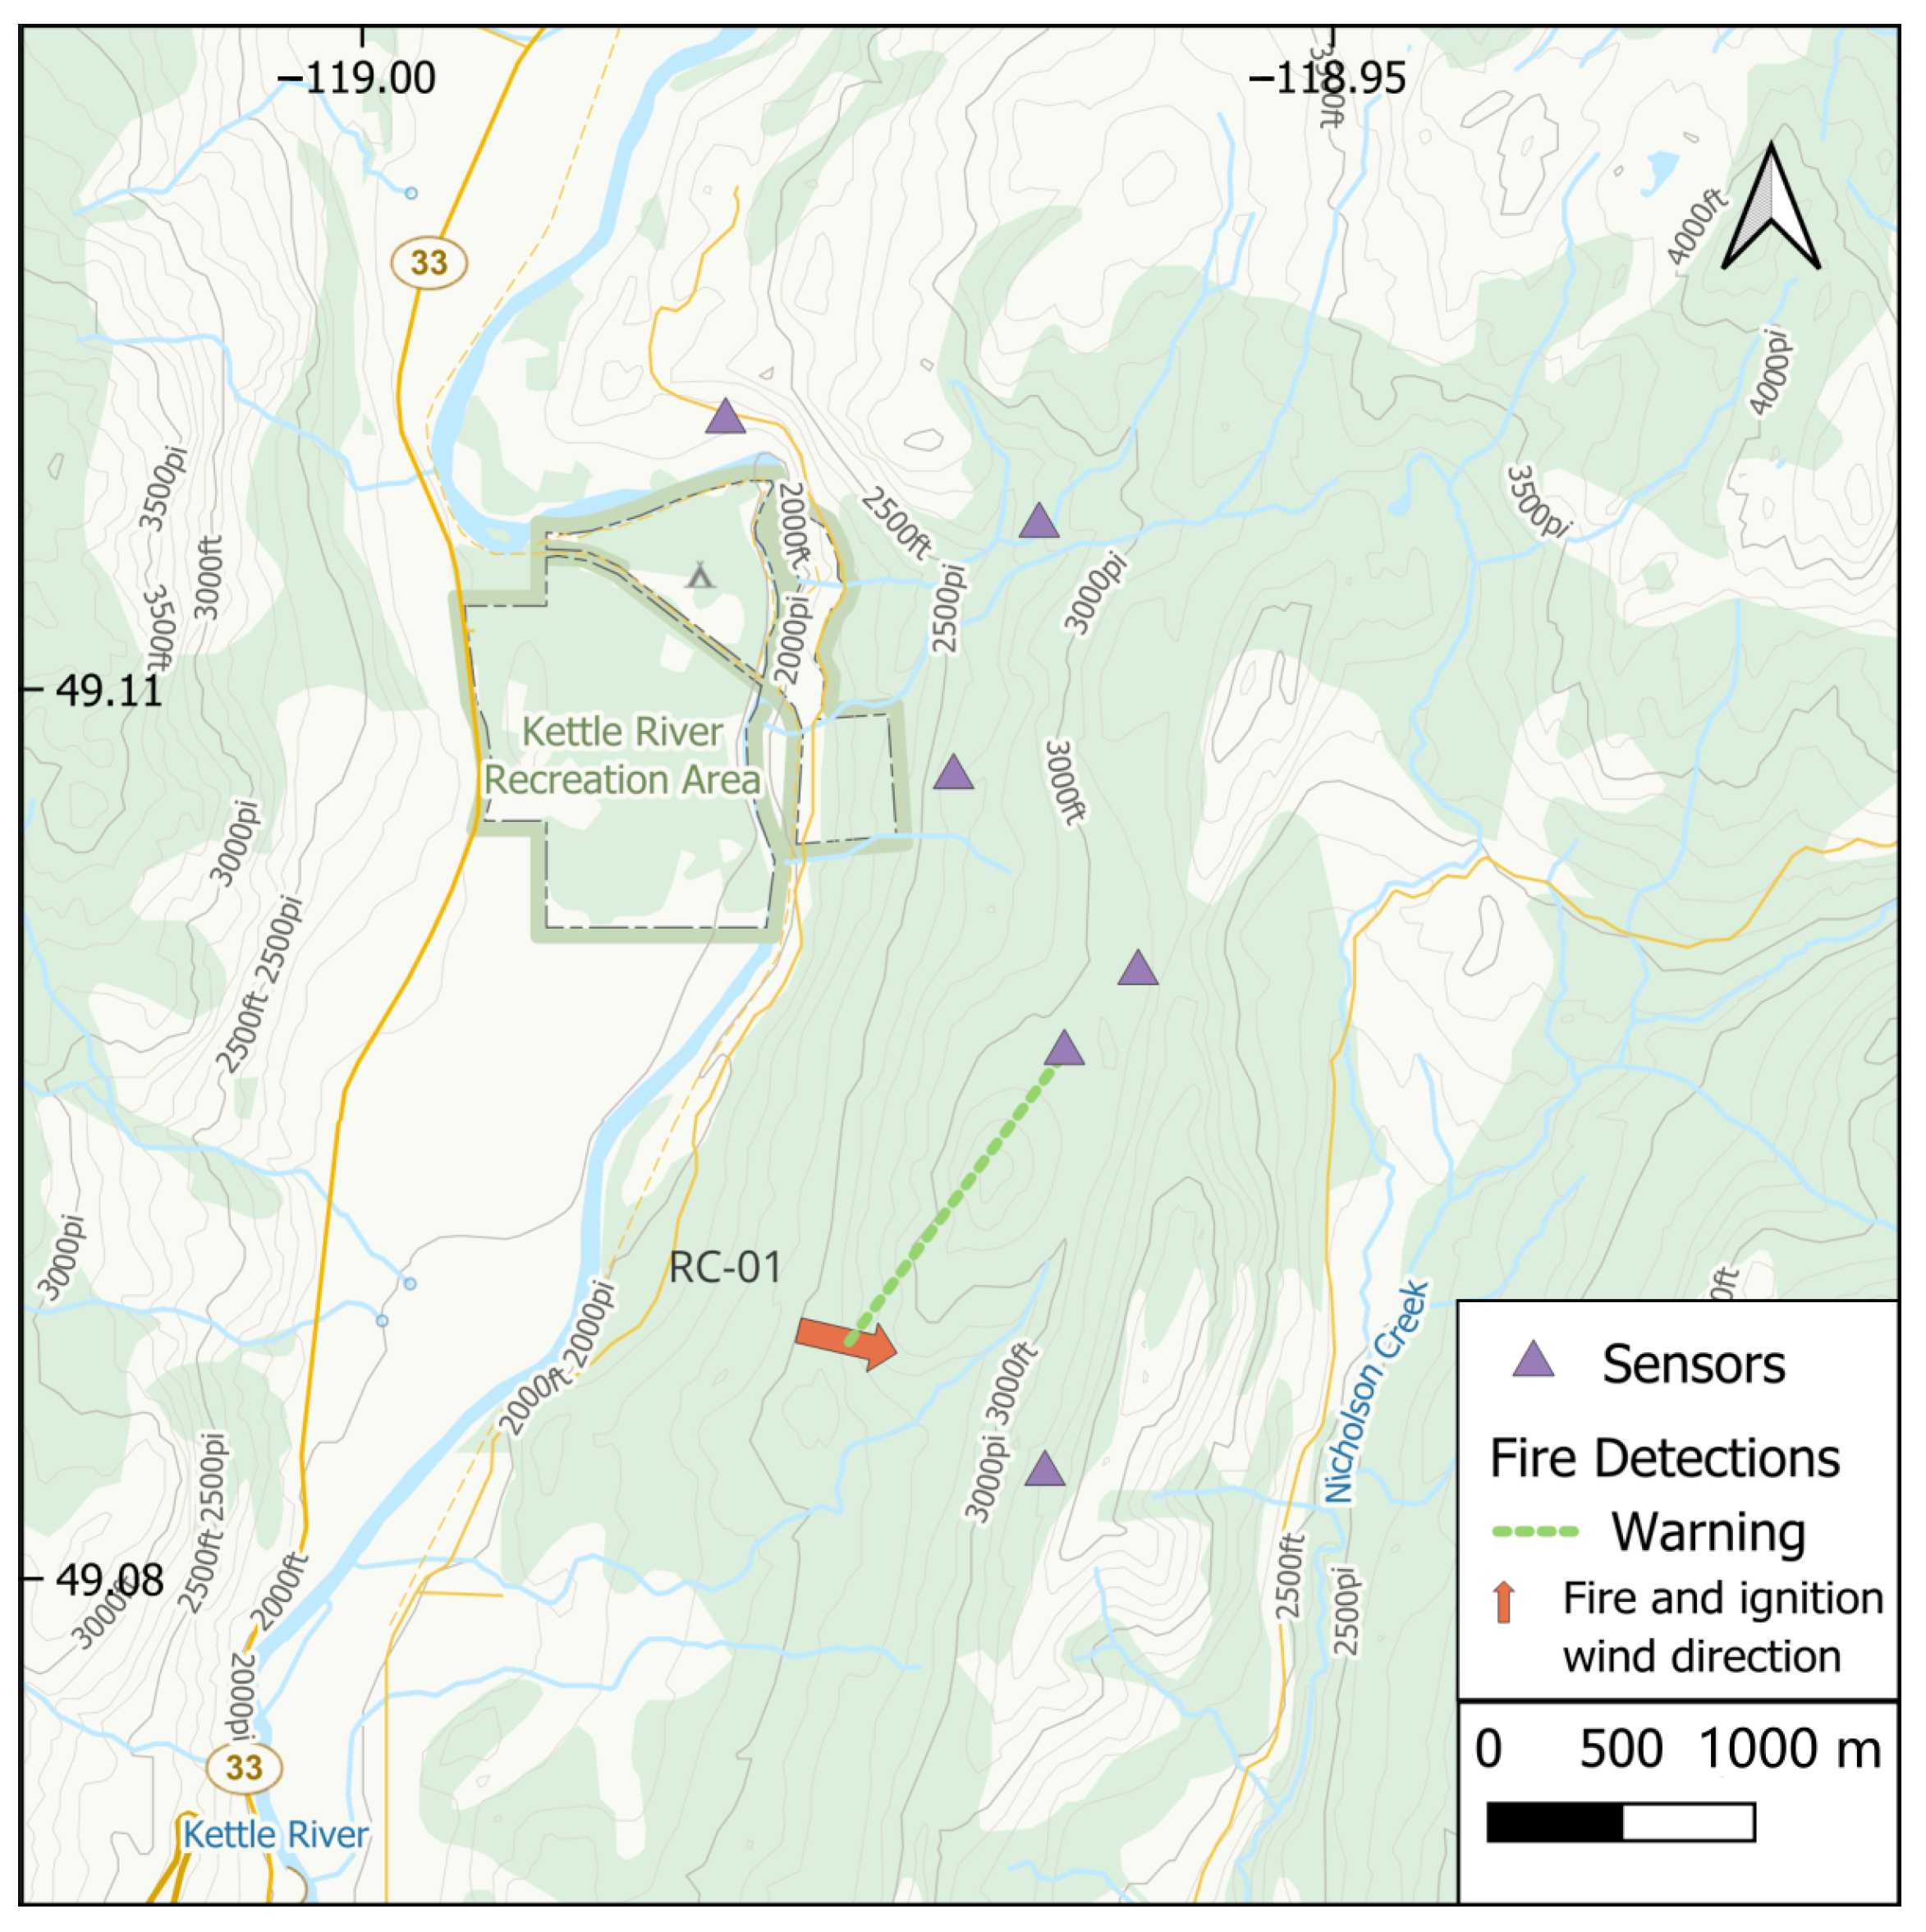
Figure A9.
Grassland Fire Weather Indices for the Rock Creek deployment.
Appendix C. Fire Growth Energy Release Rate
The detailed progression of fire growth was not available for the prescribed fires and wildfires observed. In order to link fire observations (ignition time, weather, final fire size) with time-based observations from the smoke sensors, the Canadian Fire Behaviour Prediction (FBP) System was utilized to estimate the fire growth, intensity, and fuel consumption over time until the estimated fire size reached the reported final fire size. Estimates of the smoke plume height based on fire intensity were conducted using a separate model detailed in the Appendix C. Additionally, we computed an estimated fire radiative power based on fire growth estimates as a bottom-up comparison to observed FRP from satellite. While the Canadian FBP does readily produce fire perimeter energy release rate (kW of energy release per unit length of perimeter), total fire energy release rates in W are not a formal output of the system. Following the methodology used in the Canadian Forest Fire Emissions Prediction System used in continental fire smoke forecasting [43,47,48], the energy release rate from a single fire event is the product of the rate of area burning multiplied by the estimated fuel load (0.35 kg of dry biomass m−2 in the case of our grass fuels) and heat of combustion (18 MJ kg−1):
The fire radiative power (Prad) is then estimated using the observed radiative fraction for surface fires and fine fuel beds of 18% from [49]:
where GOES (10 min update cycle, 24 h a day) geostationary fire detections typically have a daytime minimum FRP of detection of 80 MW for mid-Canada latitudes (55 degrees North), and the polar orbiting VIIRS (twice daily detections) are able to detect 1 MW fires during the daytime. A correction is additionally made for approximately 10% absorption of MWIR in the atmosphere [50].
As compared to the radiative fraction, the convective energy release for a spread wildfire is on the order of 52% of the energy produced by combustion [51], and is similarly partitioned:
Details on the Briggs plume rise model that uses the Pconv term is given in the Appendix C. Unlike satellite detection, Pconv itself is not the threshold for detection; rather, the plume width, opacity, and height will dictate visibility to observers. The authors of [17], utilizing detailed historical forest fire visual detections by aircraft, estimate a minimum size of 0.2 ha for average aerial detection size. This minimum size accounts for both the instantaneous power of the fire and the formation of a sufficiently large smoke column to be visible in contrast against the sky. More intense fires will produce darker smoke that provides a greater contrast against the sky [39], but no adjustment for intensity and smoke color is available from the historical records.
Plume Rise
With a knowledge of the convective energy release rate, the plume rise can be computed for a given atmospheric condition following numerous plume rise equations. For smaller fires such as those documented in this study, the Briggs plume rise equation provides a succinct analytical equation to be evaluated at the same time steps as the fire growth model. The plume height z (m) at distance x (m) from the fire is calculated as:
where Bflux is a function of the convective power of the fire:
where is the air temperature.
References
- Hanes, C.; Jain, P.; Wang, W.; Wang, X.; Parisien, M.A.; Little, J.; Flannigan, M.D. Fire regime changes in Canada: An update. Can. J. For. Res. 2025, 55, 1–11. [Google Scholar] [CrossRef] [Scilit]
- Hertelendy, A.J.; Howard, C.; Sorensen, C.; Ranse, J.; Eboreime, E.; Henderson, S.; Tochkin, J.; Ciottone, G. Seasons of smoke and fire: Preparing health systems for improved performance before, during, and after wildfires. Lancet Planet. Health 2024, 8, e588–e602. [Google Scholar] [CrossRef] [Scilit]
- Michaud, A.; Leigh, R. Letter from Canada: Global warming and wildfire smoke pollution emerging as major threats to respiratory health. Respirology 2024, 29, 430–431. [Google Scholar] [CrossRef] [Scilit]
- Christianson, A.C.; Johnston, L.M.; Oliver, J.A.; Watson, D.; Young, D.; MacDonald, H.; Little, J.; Macnab, B.; Bautista, N.G. Wildland fire evacuations in Canada from 1980 to 2021. Int. J. Wildland Fire 2024, 33, WF23097. [Google Scholar] [CrossRef] [Scilit]
- Hope, E.S.; McKenney, D.W.; Pedlar, J.H.; Stocks, B.J.; Gauthier, S. Wildfire Suppression Costs for Canada under a Changing Climate. PLoS ONE 2016, 11, e0157425. [Google Scholar] [CrossRef] [Scilit] [PubMed]
- Stocks, B.; Martell, D.L. Forest fire management expenditures in Canada: 1970–2013. For. Chron. 2016, 92, 298–306. [Google Scholar] [CrossRef] [Scilit]
- Wang, X.; Thompson, D.K.; Marshall, G.A.; Tymstra, C.; Carr, R.; Flannigan, M.D. Increasing frequency of extreme fire weather in Canada with climate change. Clim. Change 2015, 130, 573–586. [Google Scholar] [CrossRef] [Scilit]
- Korkola, K.; Wheatley, M.; Beverly, J.; James, P.M.A.; Wotton, M. A comparative analysis of wildfire initial attack containment objectives and modelling strategies in Ontario, Canada. Int. J. Wildland Fire 2024, 33, WF24104. [Google Scholar] [CrossRef] [Scilit]
- Hirsch, K.G.; Martell, D.L. A Review of Initial Attack Fire Crew Productivity and Effectiveness. Int. J. Wildland Fire 1996, 6, 199–215. [Google Scholar] [CrossRef] [Scilit]
- Hirsch, K.G.; Corey, P.N.; Martell, D.L. Using Expert Judgment to Model Initial Attack Fire Crew Effectiveness. For. Sci. 1998, 44, 539–549. [Google Scholar] [CrossRef] [Scilit]
- McRae, D.J.; Stocks, B.J.; Mason, J.A.; Lynham, T.J.; Blake, T.W.; Hanes, C.C. Influence of Ignition Type on Fire Behavior in Semi-Mature Jack Pine; Number Information Report GLC-X-19; Natural Resources Canada: Sault Ste. Marie, ON, Canada, 2017. [Google Scholar]
- Wheatley, M.; Wotton, B.M.; Woolford, D.G.; Martell, D.L.; Johnston, J.M.; Wheatley, M.; Wotton, B.M.; Woolford, D.G.; Martell, D.L.; Johnston, J.M. Modelling initial attack success on forest fires suppressed by air attack in the province of Ontario, Canada. Int. J. Wildland Fire 2022, 31, 774–785. [Google Scholar] [CrossRef] [Scilit]
- McFayden, C.; Wotton, B.M.; Robinson, J.W.; Johnston, J.M.; Cantin, A.; Jurko, N.; Boucher, J.; Wheatley, M.J.; Ansell, M.; Boychuk, D.; et al. Reference Guide to the Drop Effectiveness of Skimmer and Rotary Wing Airtankers; Natural Resources Canada: Sault Ste. Marie, ON, Canada, 2023. [Google Scholar]
- McAlpine, R.S.; Wakimoto, R.H. The Acceleration of Fire from Point Source to Equilibrium Spread. For. Sci. 1991, 37, 1314–1337. [Google Scholar] [CrossRef] [Scilit]
- Tymstra, C.; Stocks, B.J.; Cai, X.; Flannigan, M.D. Wildfire management in Canada: Review, challenges and opportunities. Prog. Disaster Sci. 2019, 5, 100045. [Google Scholar] [CrossRef] [Scilit]
- McFayden, C.B.; Woolford, D.G.; Stacey, A.; Boychuk, D.; Johnston, J.M.; Wheatley, M.J.; Martell, D.L. Risk assessment for wildland fire aerial detection patrol route planning in Ontario, Canada. Int. J. Wildland Fire 2019, 29, 28–41. [Google Scholar] [CrossRef] [Scilit]
- Johnston, J.M.; Johnston, L.M.; Wooster, M.J.; Brookes, A.; McFayden, C.; Cantin, A.S. Satellite Detection Limitations of Sub-Canopy Smouldering Wildfires in the North American Boreal Forest. Fire 2018, 1, 28. [Google Scholar] [CrossRef] [Scilit]
- Skakun, R.; Castilla, G.; Metsaranta, J.; Whitman, E.; Rodrigue, S.; Little, J.; Groenewegen, K.; Coyle, M. Extending the National Burned Area Composite Time Series of Wildfires in Canada. Remote Sens. 2022, 14, 3050. [Google Scholar] [CrossRef] [Scilit]
- Hethcoat, M.G.; Jain, P.; Parisien, M.A.; Skakun, R.; Rogic, L.; Whitman, E. Unrecorded Tundra Fires in Canada, 1986–2022. Remote Sens. 2024, 16, 230. [Google Scholar] [CrossRef] [Scilit]
- Lindley, T.; Anderson, A.; Mahale, V.; Curl, T.; Line, W.; Lindstrom, S.; Bachmeier, S. Wildfire detection notifications for impact-based decision support services in Oklahoma using geostationary super rapid scan satellite imagery. J. Oper. Meteorol. 2016, 4, 182–191. [Google Scholar] [CrossRef] [Scilit]
- Lindley, T.T.; Zwink, A.B.; Speheger, D.A.; Daily, D.C.; Smith, B.R.; Schlatter, P.T.; Walbrun, R.W.; Rasch, W.; Elliott, M.S.; Jeglum, M.E.; et al. Retrospective Demonstrations of an Integrated Team Approach to Fire Warnings for Western United States Wildfire Disasters. J. Oper. Meteorol. 2024, 12, 54–71. [Google Scholar] [CrossRef] [Scilit]
- Brambilla, S.; Rojas, D.; Robinson, D.J.; Josephson, A.J.; Nelson, M.A.; Linn, R.R. Modeling the impact of smoke from prescribed fire on road visibility. Environ. Model. Softw. 2025, 191, 106510. [Google Scholar] [CrossRef] [Scilit]
- Son, B.; Her, Y.s.; Kim, J.G. A Design and Implementation of Forest-Fires Surveillance System based on Wireless Sensor Networks for South Korea Mountains. Int. J. Comput. Sci. Netw. Secur. 2006, 6, 124–130. [Google Scholar]
- Serna, M.A.; Casado, R.; Bermúdez, A.; Pereira, N.; Tennina, S. Distributed Forest Fire Monitoring Using Wireless Sensor Networks. Int. J. Distrib. Sens. Netw. 2015, 11, 964564. [Google Scholar] [CrossRef] [Scilit]
- Chwalek, P.; Chen, H.; Dutta, P.; Dimon, J.; Singh, S.; Chiang, C.; Azwell, T. Downwind Fire and Smoke Detection during a Controlled Burn—Analyzing the Feasibility and Robustness of Several Downwind Wildfire Sensing Modalities through Real World Applications. Fire 2023, 6, 356. [Google Scholar] [CrossRef] [Scilit]
- Van Wagner, C.E. Development and Structure of the Canadian Forest Fire Weather Index System; Canadian Forestry Service: Sault Ste. Marie, ON, Canada, 1987; Volume 35. [Google Scholar]
- Canadian Forest Service Fire Danger Group. The 2025 Update to the FWI System: Structure, Changes and Interpretation; Information Report; Natural Resources Canada: Ottawa, ON, Canada, 2025. [Google Scholar]
- U.S. Department of Homeland Security. S and T Wildfire Sensor Initiative Heats Up: Homeland Security. 2021. Available online: https://www.dhs.gov/science-and-technology/news/2021/09/14/feature-article-st-wildfire-sensor-initiative-heats (accessed on 14 January 2026).
- Matz, C.J.; Egyed, M.; Wang, X.; Duhamel, A.; Xi, G.; Rittmaster, R.; Pentcheva, N.; Stieb, D.M. Health Impact Analysis of Wildfire Smoke-PM2.5 in Canada (2019–2023). GeoHealth 2026, 10, e2025GH001565. [Google Scholar] [CrossRef] [Scilit] [PubMed]
- Holder, A.L.; Mebust, A.K.; Maghran, L.A.; McGown, M.R.; Stewart, K.E.; Vallano, D.M.; Elleman, R.A.; Baker, K.R. Field Evaluation of Low-Cost Particulate Matter Sensors for Measuring Wildfire Smoke. Sensors 2020, 20, 4796. [Google Scholar] [CrossRef] [Scilit] [PubMed]
- Forestry Canada Fire Danger Group. Development and Structure of the Canadian Forest Fire Behavior Prediction System; Forestry Canada: Ottawa, ON, Canada, 1992; Volume ST-X-3. [Google Scholar]
- Tory, K. Models of Buoyant Plume Rise; Natural Hazards Research Australia: Melbourne, VIC, Australia, 2018. [Google Scholar]
- Taylor, S.W.; Alexander, M.E. Field guide to the Canadian Forest Fire Behavior Prediction (FBP) System, 3rd ed.; Number 11 in Special Report; Natural Resources Canada, Canadian Forest Service: Ottawa, ON, Canada, 2018. [Google Scholar]
- Hewson, J.; Davies, D.; Olsina, O.; Quayle, B.; Radov, A. Informing Wildfire Needs: The Expanded Interface of NASA’s Fire Information for Resource Management System (FIRMS); ADS Bibcode: 2024AMS; American Meteorological Society: Boston, MA, USA, 2024; Volume 104, p. 438828. [Google Scholar]
- Huda, Q.; Lyder, D.; Collins, M.; Schroeder, D.; Thompson, D.K.; Marshall, G.; Leon, A.J.; Hidalgo, K.; Hossain, M. Study of Fuel-Smoke Dynamics in a Prescribed Fire of Boreal Black Spruce Forest through Field-Deployable Micro Sensor Systems. Fire 2020, 3, 30. [Google Scholar] [CrossRef] [Scilit]
- Freitas, S.R.; Longo, K.M.; Trentmann, J.; Latham, D. Technical Note: Sensitivity of 1-D smoke plume rise models to the inclusion of environmental wind drag. Atmos. Chem. Phys. 2010, 10, 585–594. [Google Scholar] [CrossRef] [Scilit]
- McRae, D.J. Prescribed Fire Aerial Ignition Strategies; Number TR-33; Natural Resources Canada: Sault Ste. Marie, ON, Canada, 1996. [Google Scholar]
- Victor, A.C.; Breil, S.H. A simple method for predicting rocket exhaust smoke visibility. J. Spacecr. Rocket. 1977, 14, 526–533. [Google Scholar] [CrossRef] [Scilit]
- Stack, A.P. Influence of Airborne Ocularly Assessed Stand Density on Wildfire Escapes and Containment Challenges. Master’s Thesis, University of Alberta, Edmonton, AB, Canada, 2024. [Google Scholar] [CrossRef]
- Aircraft in forest fire control in Ontario. Can. J. Forest Res. 1962, 1, 38–48. [CrossRef] [Scilit]
- Matz, C.J.; MacDonald, M.E.; Mitchell, M.; Audette, C. Using Air Quality Alerts to Estimate Population-Based Wildfire Smoke Exposure from the 2023 Canadian Wildfire Season. Fire 2025, 8, 441. [Google Scholar] [CrossRef] [Scilit]
- Boulanger, Y.; Arseneault, D.; Bélisle, A.C.; Bergeron, Y.; Boucher, J.; Boucher, Y.; Danneyrolles, V.; Erni, S.; Gachon, P.; Girardin, M.P.; et al. The 2023 wildfire season in Québec: An overview of extreme conditions, impacts, lessons learned and considerations for the future. Can. J. For. Res. 2024, 55, 1–21. [Google Scholar] [CrossRef] [Scilit]
- Chen, J.; Anderson, K.; Pavlovic, R.; Moran, M.D.; Englefield, P.; Thompson, D.K.; Munoz-Alpizar, R.; Landry, H. The FireWork v2.0 air quality forecast system with biomass burning emissions from the Canadian Forest Fire Emissions Prediction System v2.03. Geosci. Model Dev. 2019, 12, 3283–3310. [Google Scholar] [CrossRef] [Scilit]
- Otway, S.G.; Bork, E.W.; Anderson, K.R.; Alexander, M.E. Predicting sustained smouldering combustion in trembling aspen duff in Elk Island National Park, Canada. Int. J. Wildland Fire 2007, 16, 690–701. [Google Scholar] [CrossRef] [Scilit]
- Anderson, H.G.; Bailey, A.W. Effects of annual burning on grassland in the aspen parkland of east-central Alberta. Can J. Bot 1980, 58, 985–996. [Google Scholar] [CrossRef] [Scilit]
- Erasmus, H. Vaseux Lake Canadian Wildlife Service Burn. Bachelor’s Thesis, University of British Columbia, Vancouver, BC, Canada, 2014. [Google Scholar] [CrossRef] [Scilit]
- Griffin, D.; Sioris, C.; Chen, J.; Dickson, N.; Kovachik, A.; de Graaf, M.; Nanda, S.; Veefkind, P.; Dammers, E.; McLinden, C.A.; et al. The 2018 fire season in North America as seen by TROPOMI: Aerosol layer height validation and evaluation of model-derived plume heights. J. Geophys. Res. Atmos. 2008, 13, 1427–1445. [Google Scholar] [CrossRef] [Scilit]
- Makar, P.A.; Akingunola, A.; Chen, J.; Pabla, B.; Gong, W.; Stroud, C.; Sioris, C.; Anderson, K.; Cheung, P.; Zhang, J.; et al. Forest-fire aerosol–weather feedbacks over western North America using a high-resolution, online coupled air-quality model. Atmos. Chem. Phys. 2021, 21, 10557–10587. [Google Scholar] [CrossRef] [Scilit]
- Johnston, J.M.; Wooster, M.J.; Paugam, R.; Wang, X.; Lynham, T.J. Direct estimation of Byram’s fire intensity from infrared remote sensing imagery. Int. J. Wildland Fire 2017, 26, 668–684. [Google Scholar] [CrossRef] [Scilit]
- Griffin, M.; Burke, H.; Kerekes, J. Radiative transfer in the midwave infrared applicable to full spectrum atmospheric characterization. In Proceedings of the 2004 IEEE International Geoscience and Remote Sensing Symposium 2004 (IGARSS 2004), Anchorage, AK, USA, 20–24 September 2004. [Google Scholar] [CrossRef] [Scilit]
- Freeborn, P.H.; Wooster, M.J.; Hao, W.M.; Ryan, C.A.; Nordgren, B.L.; Baker, S.P.; Ichoku, C. Relationships between energy release, fuel mass loss, and trace gas and aerosol emissions during laboratory biomass fires. J. Geophys. Res. Atmos. 2008, 113, D01301. [Google Scholar] [CrossRef] [Scilit]

Disclaimer/Publisher’s Note: The statements, opinions and data contained in all publications are solely those of the individual author(s) and contributor(s) and not of MDPI and/or the editor(s). MDPI and/or the editor(s) disclaim responsibility for any injury to people or property resulting from any ideas, methods, instructions or products referred to in the content. |
© His Majesty the King in Right of Canada, as represented by the Minister of Energy and Natural Resources, 2026. Licensee MDPI, Basel, Switzerland. This article is an open access article distributed under the terms and conditions of the Creative Commons Attribution (CC BY) license.