


Abstract
The Gilé National Park (PNAG for its acronym in Portuguese), located in central Mozambique is one of the most important protected areas in the country. It is one of the last remnants of intact Miombo woodlands, providing critical habitat for endemic biodiversity. Fires are an important ecological factor in Miombo, but changes in fire regimes may compromise the stability of this ecosystem and thus, the conservation value of PNAG. This study assessed fire patterns and mapped fire risk in support of adaptive management in the PNAG. We investigated Miombo fire regime over 23 years (2001 to 2023) in terms of return interval, frequency, temporal distribution, spatial density and intensity, extent, and severity, by using two Moderate-Resolution Imaging Spectroradiometer (MODIS) satellite products (MCD14ML active fire; MCD64A1 burned area). Primary risk drivers were established and spatial fire likelihood mapped, using the Random Forest algorithm. Analysis revealed pronounced late dry season burning (August–October) affecting approximately 60% of the PNAG annually, especially in central-northern and eastern landscapes. Remarkably, 88% of the park maintains a 1-to-2-year fire return interval across the entire fire season (May–October) while only 7% maintains return frequencies of 3-to-4-year cycles. The latter is important for maintaining Miombo ecosystem functionality. Medium to medium–high fire severity covered 98% of the total fire extension. Climate-related drivers and hunting activities were identified as key fire initiators, especially in central areas of the park. The findings demonstrate an urgent need for spatially differentiated fire management action through prescribed burning to maintain PNAG’s ecological resilience and conservation value.
1. Introduction
Miombo woodlands (thereafter Miombo) span approximately 1.9 million km2 across seven southern African nations, including Angola, the Democratic Republic of Congo, Malawi, Mozambique, Tanzania, Zambia and Zimbabwe, making them one of the largest ecosystems in sub-Saharan Africa [1,2]. These ecosystems play a critical ecological role in the global climate system, including carbon storage and the regulation of fundamental biogeochemical processes [1,3]. In Mozambique, Miombo dominates the forest landscape, accounting for approximately two-thirds of the total forest cover [4]. They also support a high level of biological diversity, including endemic and threatened plant and animal species [1,5,6].
Beyond its ecological importance, Miombo is central to rural livelihood and national economies. In Mozambique, over 70% of the population relies directly on forest resources, which contribute approximately 20% to household monetary income and 40% to non-monetary subsistence [4]. This strong socio-ecological relationship makes the sustainability of Miombo ecosystems particularly sensitive to shifts in disturbance regimes.
Miombo ecological dynamics result from complex interactions among climatic variability, herbivory and human activities [3,7], with fire serving as a cross-cutting element influencing all these processes [8]. Fires have historically been an intrinsic component of Miombo, shaping vegetation structure, species composition, and successional pathways, while facilitating ecological processes such as seed germination and soil nutrient cycling [9].
However, growing evidence indicates that contemporary fire regimes increasingly diverge from historical burning patterns, posing significant threats to ecosystem integrity [10]. Altered fire regimes can lead to soil degradation, biodiversity loss, and the long-term structural transformations of the Miombo ecosystem [7,11,12,13,14]. Such alterations consequently undermine the capacity of Miombo to provide essential goods and services, threatening both conservation goals and human well-being [15].
Fire regimes refer to the characterization of the temporal and spatial patterns of burning within a landscape [16], encompassing components such as seasonality, extent, return interval, intensity, severity, and risk [16,17,18]. Among these components, fire frequency and intensity are particularly key in shaping ecological processes [19]. Fire frequency—the temporal interval between consecutive fire events—determines the period available for vegetation recovery before the next fire’s occurrence [20]. Fire intensity—the energy released during combustion—combined with severity, define the magnitude of potential fire impact in the ecosystem (e.g., tree mortality, natural regeneration suppression and fauna decline) [1].
Understanding fire frequency and intensity is especially critical in the context of ongoing climate change, which is expected to modify fire–environment–climate feedbacks globally [21]. In Miombo, where fire has a long coexistence history, multiple authors converge on a fire return interval of approximately 3–4 years as a functional threshold, promoting biodiversity, nutrient cycling, and preventing high-severity fires [1,14,22,23]. Departures from this range may push ecosystems towards degradation or alternative stable states [1].
Fire risk expresses the probability of fire occurrence as a function of fuel availability, climatic conditions, vegetation cover type, topography, and anthropogenic activities [24,25,26]. Spatially explicit fire risk mapping is therefore a key tool for identifying priority areas for prevention, monitoring, and adaptive fire management, particularly in landscapes where conservation and human use intersect [1,27,28].
Advances in remote sensing have transformed fire regime analysis, enabling consistent monitoring across large areas and long time periods [29]. Among remote sensing data, Moderate-Resolution Imaging Spectroradiometer (MODIS) data have been widely applied in the region [8,13,30,31,32,33]. The strength of MODIS lies on its long temporal continuity, standardized algorithms, and suitability for regional-scale fire regime characterization [34,35].
Despite this growing body of research, important knowledge gaps persist, particularly within protected areas of Miombo. National parks are biodiversity strongholds where fire serves as both a natural ecological process and a management challenge. Yet, long-term, spatially explicit assessments of fire regimes and fire risk remain scarce for many protected areas in Mozambique. The Gilé National Park (PNAG for its acronym in Portuguese), located in Zambézia Province, central Mozambique, is a priority conservation area where fires are identified as a management priority [36]. However, evidence-based fire management in PNAG is constrained by the lack of comprehensive analysis of fire regimes and spatial fire risk assessments.
This study addresses this gap by providing one of the first multi-year (2001–2023), integrated assessments of fire regime and risk in the PNAG, advancing the understanding of fire dynamics in protected Miombo landscapes. This study aims to contribute to ongoing debates about fire occurrence and impacts under climate change. Specifically, this study aims to (i) characterize fire frequency, seasonality, density, and intensity; (ii) map the spatial distribution of fire severity; and (iii) identify and model the main determinants of fire risk.
2. Materials and Methods
2.1. Study Area
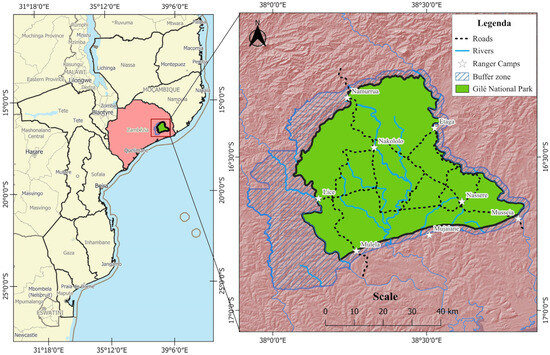
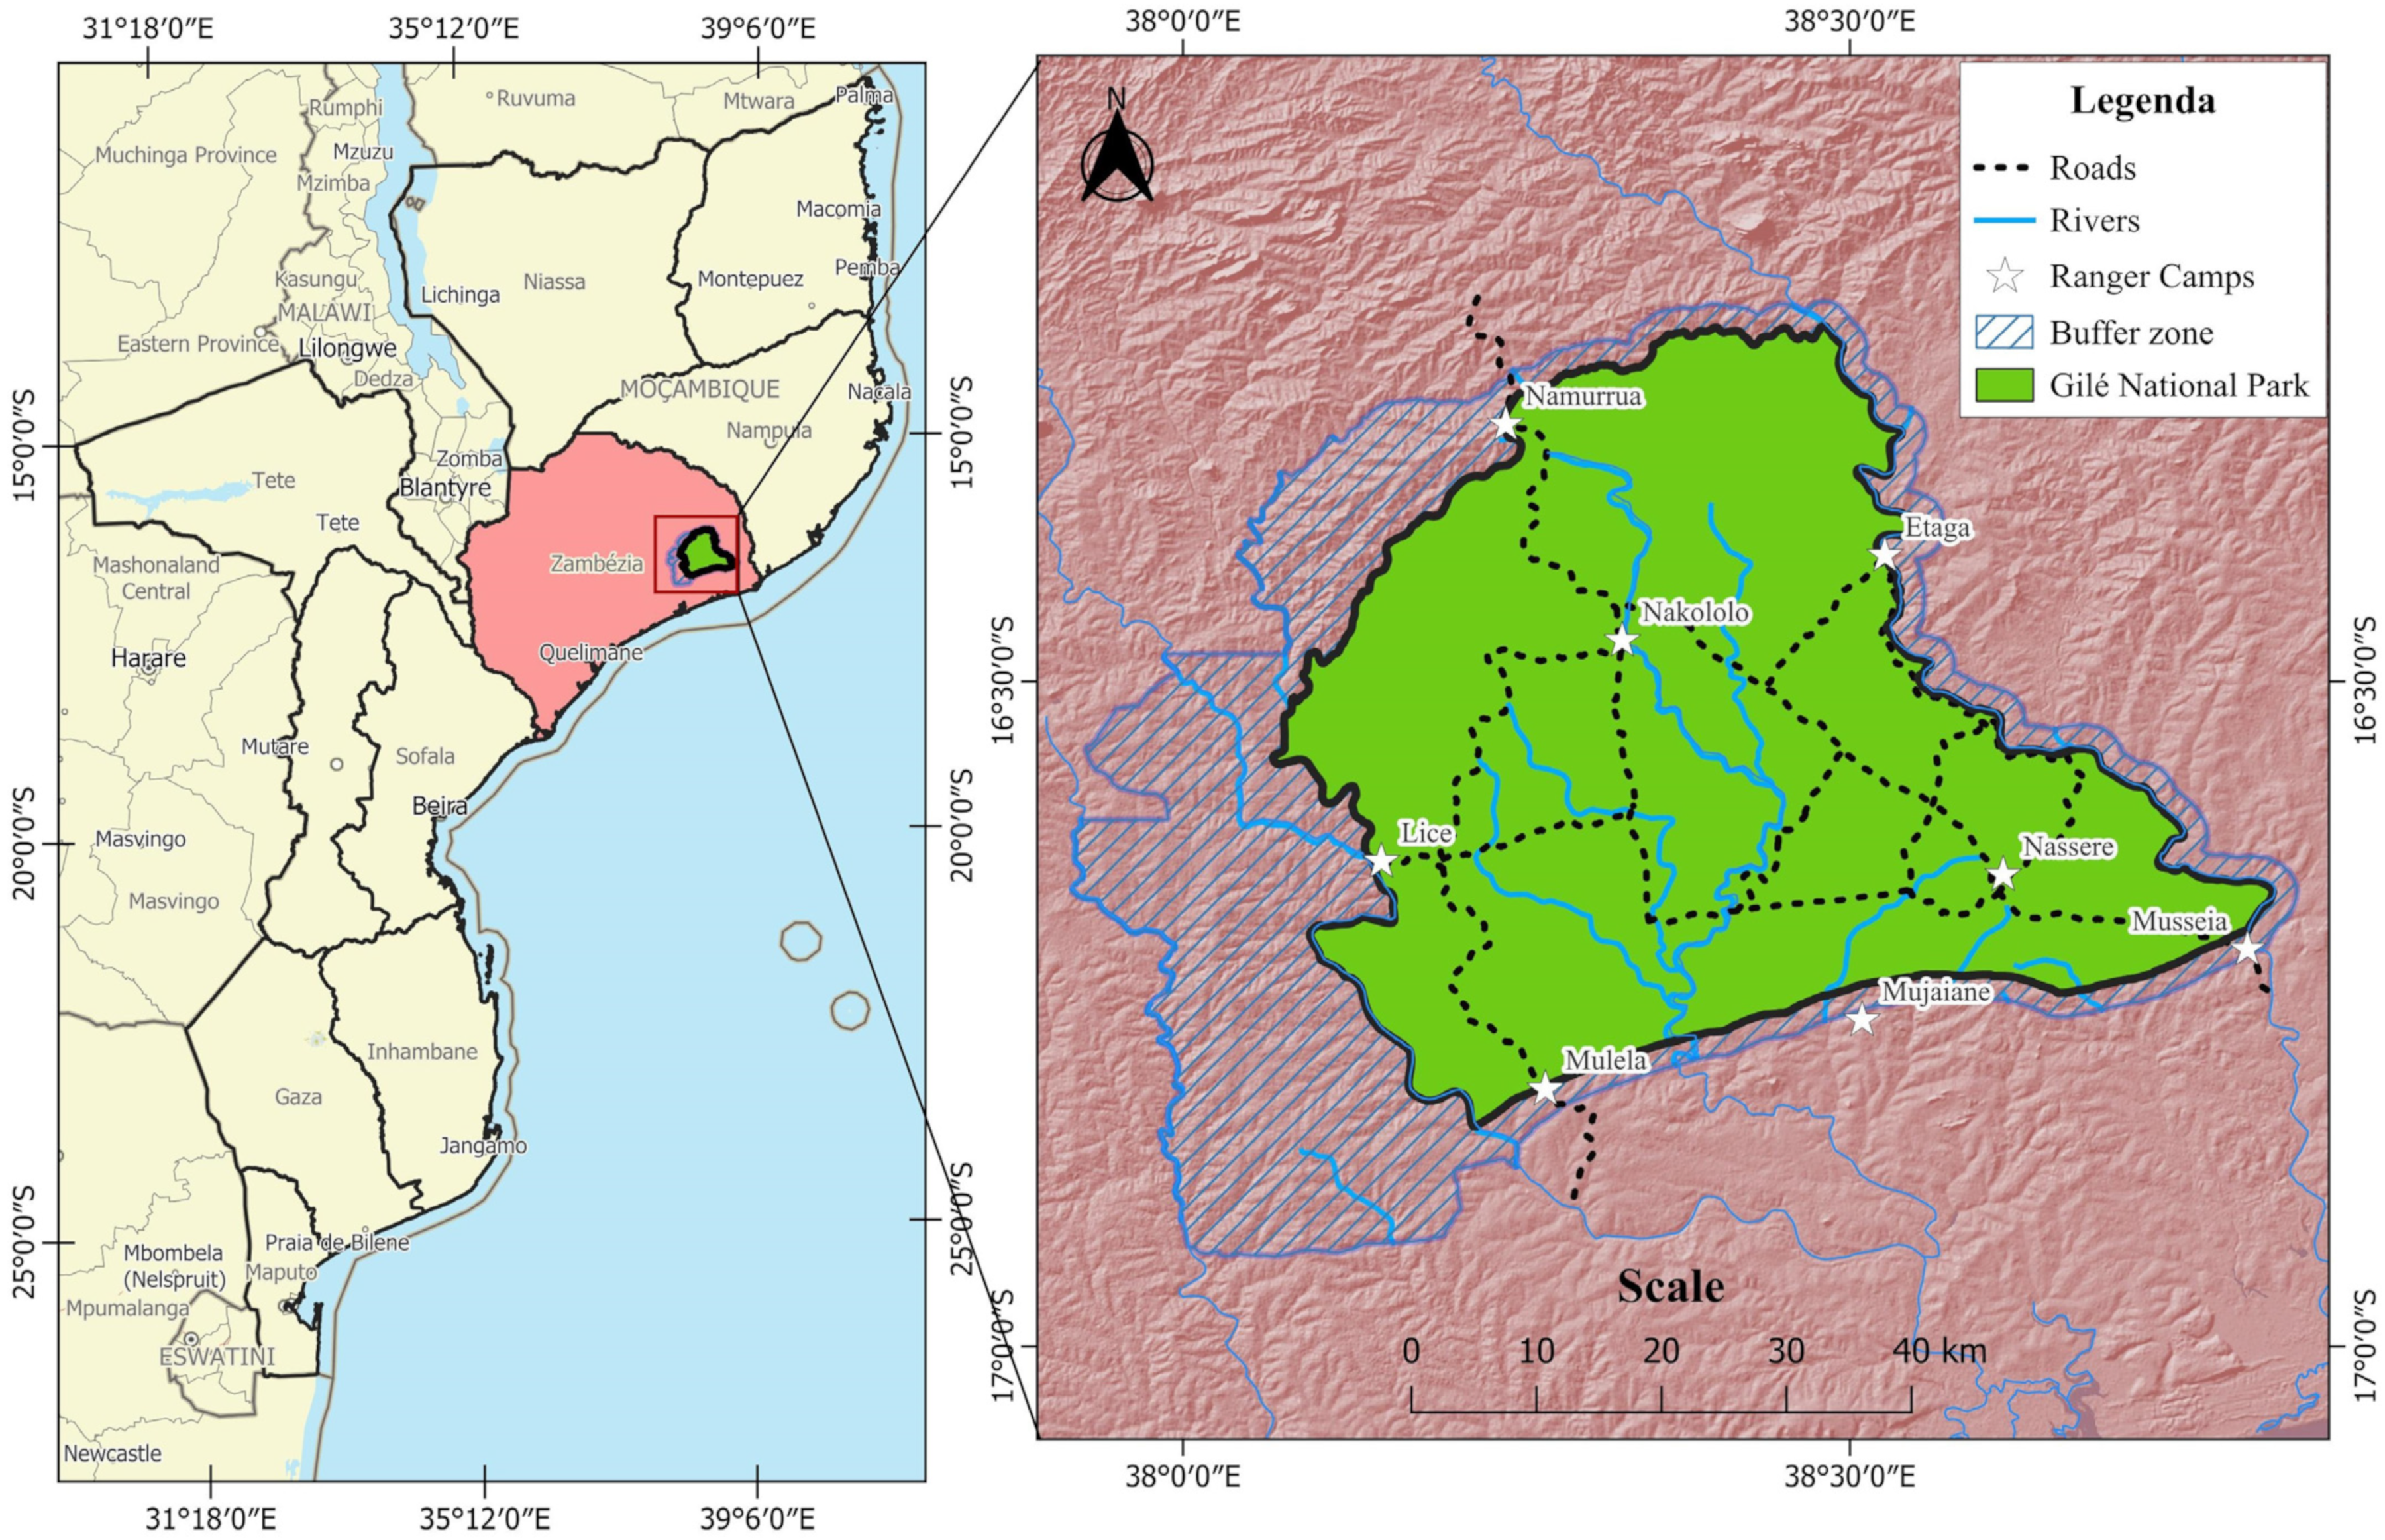
Our research was carried out in the PNAG, located in Zambézia Province, central Mozambique, encompassing portions of the Gilé and Pebane districts. The park spans 4532 km2, comprising a 2861 km2 core protection zone and a 1671 km2 buffer zone. Three major rivers characterize the park’s hydrology: the Mulela River delineates the western boundary, the Molocuè River defines the eastern perimeter, while the Malema River represents the primary drainage system within the park’s interior. Additional permanent watercourses include the Naivocone River in the northern sector, the Nakololo, Malemacuculo, and Mucussa Rivers within the core area, and the Muipige and Enrorue Rivers in the southern portion [36]. The area’s conservation status evolved from its initial establishment as a game reserve in 1932, through designation as a National Reserve in 1999 [37], to its current status as a National Park under the Decree 44/2020 of 17 June 2020 [36]. The park’s management infrastructure includes seven ranger camps and an administrative center located in Musseia (Figure 1).
Figure 1.
Geographic location map of Gilé National Park, Zambézia Province, Central Mozambique. Background image: ESRI shaded relief.
Plains dominate the park’s topography, with mean elevations around 160 m above sea level, while northern mountainous areas reach maximum elevations of 1052 m [38]. According to Köppen classification, the area has a tropical savanna climate, featuring distinct wet (November–April) and dry (May–October) seasons, with a mean annual precipitation of 1296 mm and temperatures ranging between 20 °C and 31 °C during 2010–2020 [39]. Miombo constitutes the dominant vegetation type across the PNAG, recognized as one of Mozambique’s most biodiverse and ecologically intact landscapes [36]. Characteristic Miombo flora documented in the park include Brachystegia spiciformis Benth., B. boehmii Taub., Julbernardia globiflora (Benth.) Troupin, Diplorhynchus condylocarpon (Müll.Arg.) Pichon, Millettia stuhlmannii Taub., and Parinari curatellifolia Planch. ex Benth., among others [40].
The buffer zone presents a heterogeneous landscape mosaic, shaped by human activities and comprising Miombo regeneration of varying ages, agricultural plots (cassava, maize, groundnuts, legumes, cashew, and mango), mature woodlands, and wooded savannas [38,41]. Approximately 12,000 people inhabit the buffer zone [36], depending on natural resource extraction for livelihood sustenance through activities such as shifting cultivation, apiculture, hunting, and non-timber forest product collection [37]. Fire is common management tool for all those activities.
2.2. Data Acquisition
2.2.1. Fire Data
Our analysis utilized two MODIS Collection 6 fire products in the period spanning January 2001 through December 2023: the daily 1 km active fire product (MCD14ML) and the monthly 500 m burned area product (MCD64A1). Active fire data were obtained via NASA’s Fire Information for Resource Management System (FIRMS; https://firms.modaps.eosdis.nasa.gov/map/, accessed on 10 March 2024), while burned area data were downloaded from the USGS LP DAAC data repository (https://lpdaac.usgs.gov/tools/data-pool/, accessed 10 March 2024) in Hierarchical Data Format (HDF). To minimize false detections, we excluded active fire pixels below 30% confidence following the recommendations for MODIS Collection 6 data [42]. This threshold differs from earlier Collection 5 analyses that typically employed ≥ 70% confidence filters [43,44,45], reflecting algorithmic improvements in Collection 6 that enable reliable fire detection at lower confidence levels. For burned area analysis, we reclassified MCD64A1 pixel values originally encoded as 0 (unburned) or 1–366 (Julian burn day) into binary format, where 1 indicates burned and 0 indicates unburned conditions, using QGIS v3.34.7 [46]. The annual binary burn maps (n = 23) were then aggregated to derive a multi-year fire frequency (FF) map.
2.2.2. Environmental and Socio-Economic Data
In this study, we investigated the role of several environmental and socio-economic factors in explaining fire occurrence in the PNAG (Table 1).
Table 1.
Details of the environmental and socio-economic variables used for modeling historical fire risk in Gile National Park.
2.3. Data Pre-Processing and Analysis
2.3.1. Pre-Processing
Prior to analysis, we standardized all spatial datasets by clipping to park boundaries and reprojecting to UTM Zone 37S (WGS 84 datum) using QGIS v3.34.7 reprojection tools [46]. To ensure spatial consistency, all raster layers described in Table 1 were resampled to a 30 m resolution using the projectRaster function from the raster package in R v4.4.0 [50], employing bilinear interpolation for continuous variables and nearest neighbor for categorical data. The resampling of different native resolutions (30 m to 5000 m), to a common 30 m grid may introduce interpolation errors, particularly for coarse-resolution climate data (precipitation: 5000 m; temperature, wind, vapor pressure, and solar radiation: 1000 m). However, this impact is considered minimal because (i) climate variables exhibit spatial gradients across the park’s predominantly flat topography (mean elevation ~160 m), with patterns driven by regional circulation rather than microtopography, and (ii) 30 m resolution was selected to match the finest datasets (elevation, land cover, biomass, and trap density) exhibiting the most fire-relevant spatial heterogeneity, suggesting that resampling errors do not substantially compromise predictions for management applications.
No additional preprocessing was applied to MCD14ML data, as Collection 6 products undergo automated correction during operational processing including cloud masking, contextual fire pixel identification, and background characterization prior to distribution [42,51].
2.3.2. Fire Frequency and Mean Fire Return Interval
We characterized fire regime components following established protocols [13,30]. Fire frequency (FF) quantifies how many times per year fire affected each pixel during the 23-year study period (Equation (1)), whereas the Mean Fire Return Interval (MFRI) represents the average temporal spacing between successive burns at individual pixel locations (Equation (2)) [52,53].
where MFRI is the Mean Fire Return Interval.
where T = the total study period (23 years), A = the total park area, and a = the area burned within the study period.
The FF classes were defined taking as reference the MFRI threshold in Miombo of 3–4 years [1]. Pixels within that range were defined as the “medium FF class” and the other classes were generated for return intervals below (low FF class) and above (high FF class) that threshold. This resulted in six FF classes: (i) 0: no burn; (ii) 1–2: low; (iii) 3–4: medium (reference class); (iv) 5–10: medium to high; (v) 10–18: high; and (vi) >18: very high (annual burning). The FF map was generated in QGIS 3.40.7 [46] by adding the annual area burned using the raster calculation tool.
2.3.3. Fire Seasonality
Temporal fire patterns were characterized by analyzing the monthly distribution of active fire detections and the burned area extent throughout the year. We extracted burn dates (Julian day format) from both MCD14ML active fire and MCD64A1 burned area products, then aggregated fire occurrences by calendar month across the entire study period (2001–2023). Following regional fire phenology classifications [54], we categorized fire activity into three distinct seasons aligned with regional precipitation patterns: the wet season (November–April), early dry season (May–July), and late dry season (August–October). This seasonal stratification enabled the assessment of the intra-annual fire variability and the identification of the peak burning periods. The monthly FF and burned area were visualized through temporal distribution graphs to illustrate seasonal trends.
2.3.4. Extent of Burned Area and Fire Density
The cumulative burned area over the study period was quantified by summing annual binary burn maps in QGIS v3.40.7 [46]. Fire density—expressing the spatial concentration of fire detections—was calculated as follows (Equation (3)):
The spatial patterns of fire density were visualized using kernel density estimation in QGIS v3.40.7 [46], producing continuous surfaces depicting fire hotspots throughout the park.
2.3.5. Fire Intensity
Fire intensity was assessed using Fire Radiative Power (FRP) values embedded in MCD14ML data. FRP quantifies the instantaneous rate of radiative energy emission from active fires across all wavelengths and view angles, expressed in megawatts (MW) [55,56]. This metric serves as a proxy for fire intensity—the heat release rate per unit time [57].
We analyzed 25,119 fire detections occurring between June and December during the 2001–2023 period. Spatial clustering of fire intensity was identified through Getis-Ord Gi* hotspot analysis in QGIS v3.34.7 [46], which identifies statistically significant (p < 0.05) spatial clusters of high FRP values (hot zones) versus low FRP values (cold zones). Areas exhibiting 95% and 99% statistical significance were classified as high-intensity fire zones. Continuous intensity surfaces were generated via Inverse Distance Weighting (IDW) interpolation of FRP values, producing spatially explicit fire intensity maps.
2.3.6. Fire Severity
Fire severity—reflecting the ecological impact and ecosystem damage—was assessed using remotely sensed burn severity indices. We employed a Google Earth Engine (GEE) script adapted from UN-SPIDER recommended practices for burn severity assessment [58] based on Landsat imagery. Given the availability of quality images, our analysis covered the period from 2014 to 2023. The Normalized Burn Ratio (NBR) was computed from Landsat surface reflectance data following standard protocols [59] (Equation (4)):
where NIR represents near-infrared reflectance and SWIR represents shortwave infrared reflectance.
Burn severity was quantified through the differenced Normalized Burn Ratio (dNBR), calculated by subtracting the post-fire NBR from the pre-fire NBR (Equation (5)) [60].
This index captures fire-induced vegetation changes, with higher dNBR values indicating greater severity. We classified dNBR values into severity categories following [61]: unburned/regenerating (≤0.099), low (0.10–0.26), moderate (0.27–0.43), moderate–high (0.44–0.65), and high (>0.66) severity. Multi-year severity patterns were synthesized by aggregating annual severity maps in QGIS v3.40.7 [46].
2.3.7. Fire Risk Mapping
We modeled fire occurrence probability using historical active fire locations as response variables and environmental/anthropogenic factors as predictors. To ensure data quality, fire detections underwent two-stage quality control: (1) the exclusion of detections below 30% confidence, and (2) the removal of statistically non-significant detections identified through hotspot analysis. Only high-confidence (>95% significance) detections were retained. From filtered detections, we generated a fire density surface using IDW in QGIS v3.40.7 [46], subsequently reclassified into binary format (0 = no fire/low density; 1 = fire/high density) as the response variable.
Our modeling dataset comprised 5362 locations: 2681 historical fire occurrences paired with 2681 randomly sampled non-fire locations generated in QGIS v3.40.7 [46]. The dataset was partitioned into 70% calibration and 30% validation subsets through random stratified sampling. Twenty explanatory variables spanning six thematic categories (Table 1) were extracted to each point location: terrain characteristics (elevation, slope, and aspect), land cover (land use and aboveground biomass), vegetation indices (Normalized Difference Vegetation Index - NDVI and NDVI anomalies), climate (precipitation, temperature, evapotranspiration, wind, vapor pressure, and solar radiation), accessibility (distances to villages, roads, rivers, and agriculture), demographics (population density), and anthropogenic pressure (hunting trap density).
Fire occurrence probability was modeled using Random Forest machine learning [62], implemented through the randomForest package in R [63]. Random Forest was selected based on its established effectiveness for fire risk modeling in different ecosystems [64,65], including in recent Miombo applications [38]. RF is particularly appropriate because it (i) handles non-linear relationships and multicollinearity among predictors without requiring variable pre-selection [62,63,64,65,66,67]; (ii) manages mixed continuous and categorical data; (iii) provides variable importance metrics (Mean Decrease Gini - MDG) essential for management recommendations; and (iv) incorporates inherent robustness through bootstrap aggregation and out-of-bag validation [63]. This ensembled approach constructs multiple decision trees, each trained on bootstrap samples, with predictions aggregated across all trees to produce robust probability estimates [38,67].
The calibrated model was applied across the study area to generate a continuous probability surface ranging from 0 (low fire risk) to 1 (high fire risk). For operational interpretation, this surface was reclassified into binary risk categories (0 = no/low risk; 1 = moderate–high risk).
Variable importance was assessed via MDG, which quantifies each predictor’s contribution to improving classification purity across decision tree nodes, averaged across the entire area [68,69]. This metric identifies the most influential drivers of fire occurrence.
All spatial analyses and modeling were conducted in R v4.4.0 [48] using the randomForest package for model development [63] and the raster package for spatial data handling [70].
2.4. Annual Burning Map Accuracy
Validation of FF mapping incorporated field observations collected during 2022–2023 across 29 sampling plots (0.1 ha each; 50 × 20 m dimensions) distributed throughout the park. Field indicators included direct fire evidence, tree fire scars, mortality patterns and bark damage. For the period 2001–2021, we used Google Earth imagery as validation reference data. Classification accuracy was evaluated through confusion matrix analysis, comparing mapped burn classifications against reference data (field observations and Google Earth imagery). We computed two accuracy metrics (Equation (6)):
where Po represents observed agreement proportion (correctly classified pixels/total assessed pixels) and Pe represents the expected agreement by chance (product of row and column marginals for each class).
Overall Accuracy was alculated as the sum of correctly classified pixels (main diagonal) divided by total sample size.
3. Results
3.1. Fire Regime in the PNAG
3.1.1. Fire Frequency and Mean Fire Return Interval
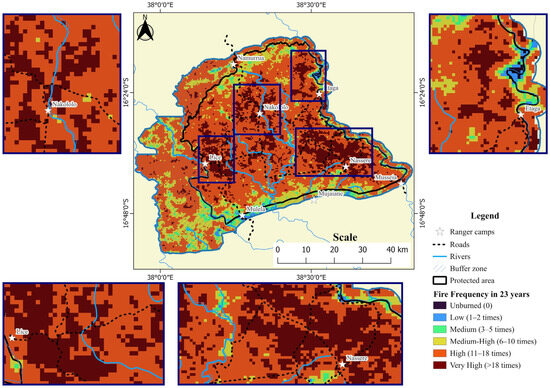
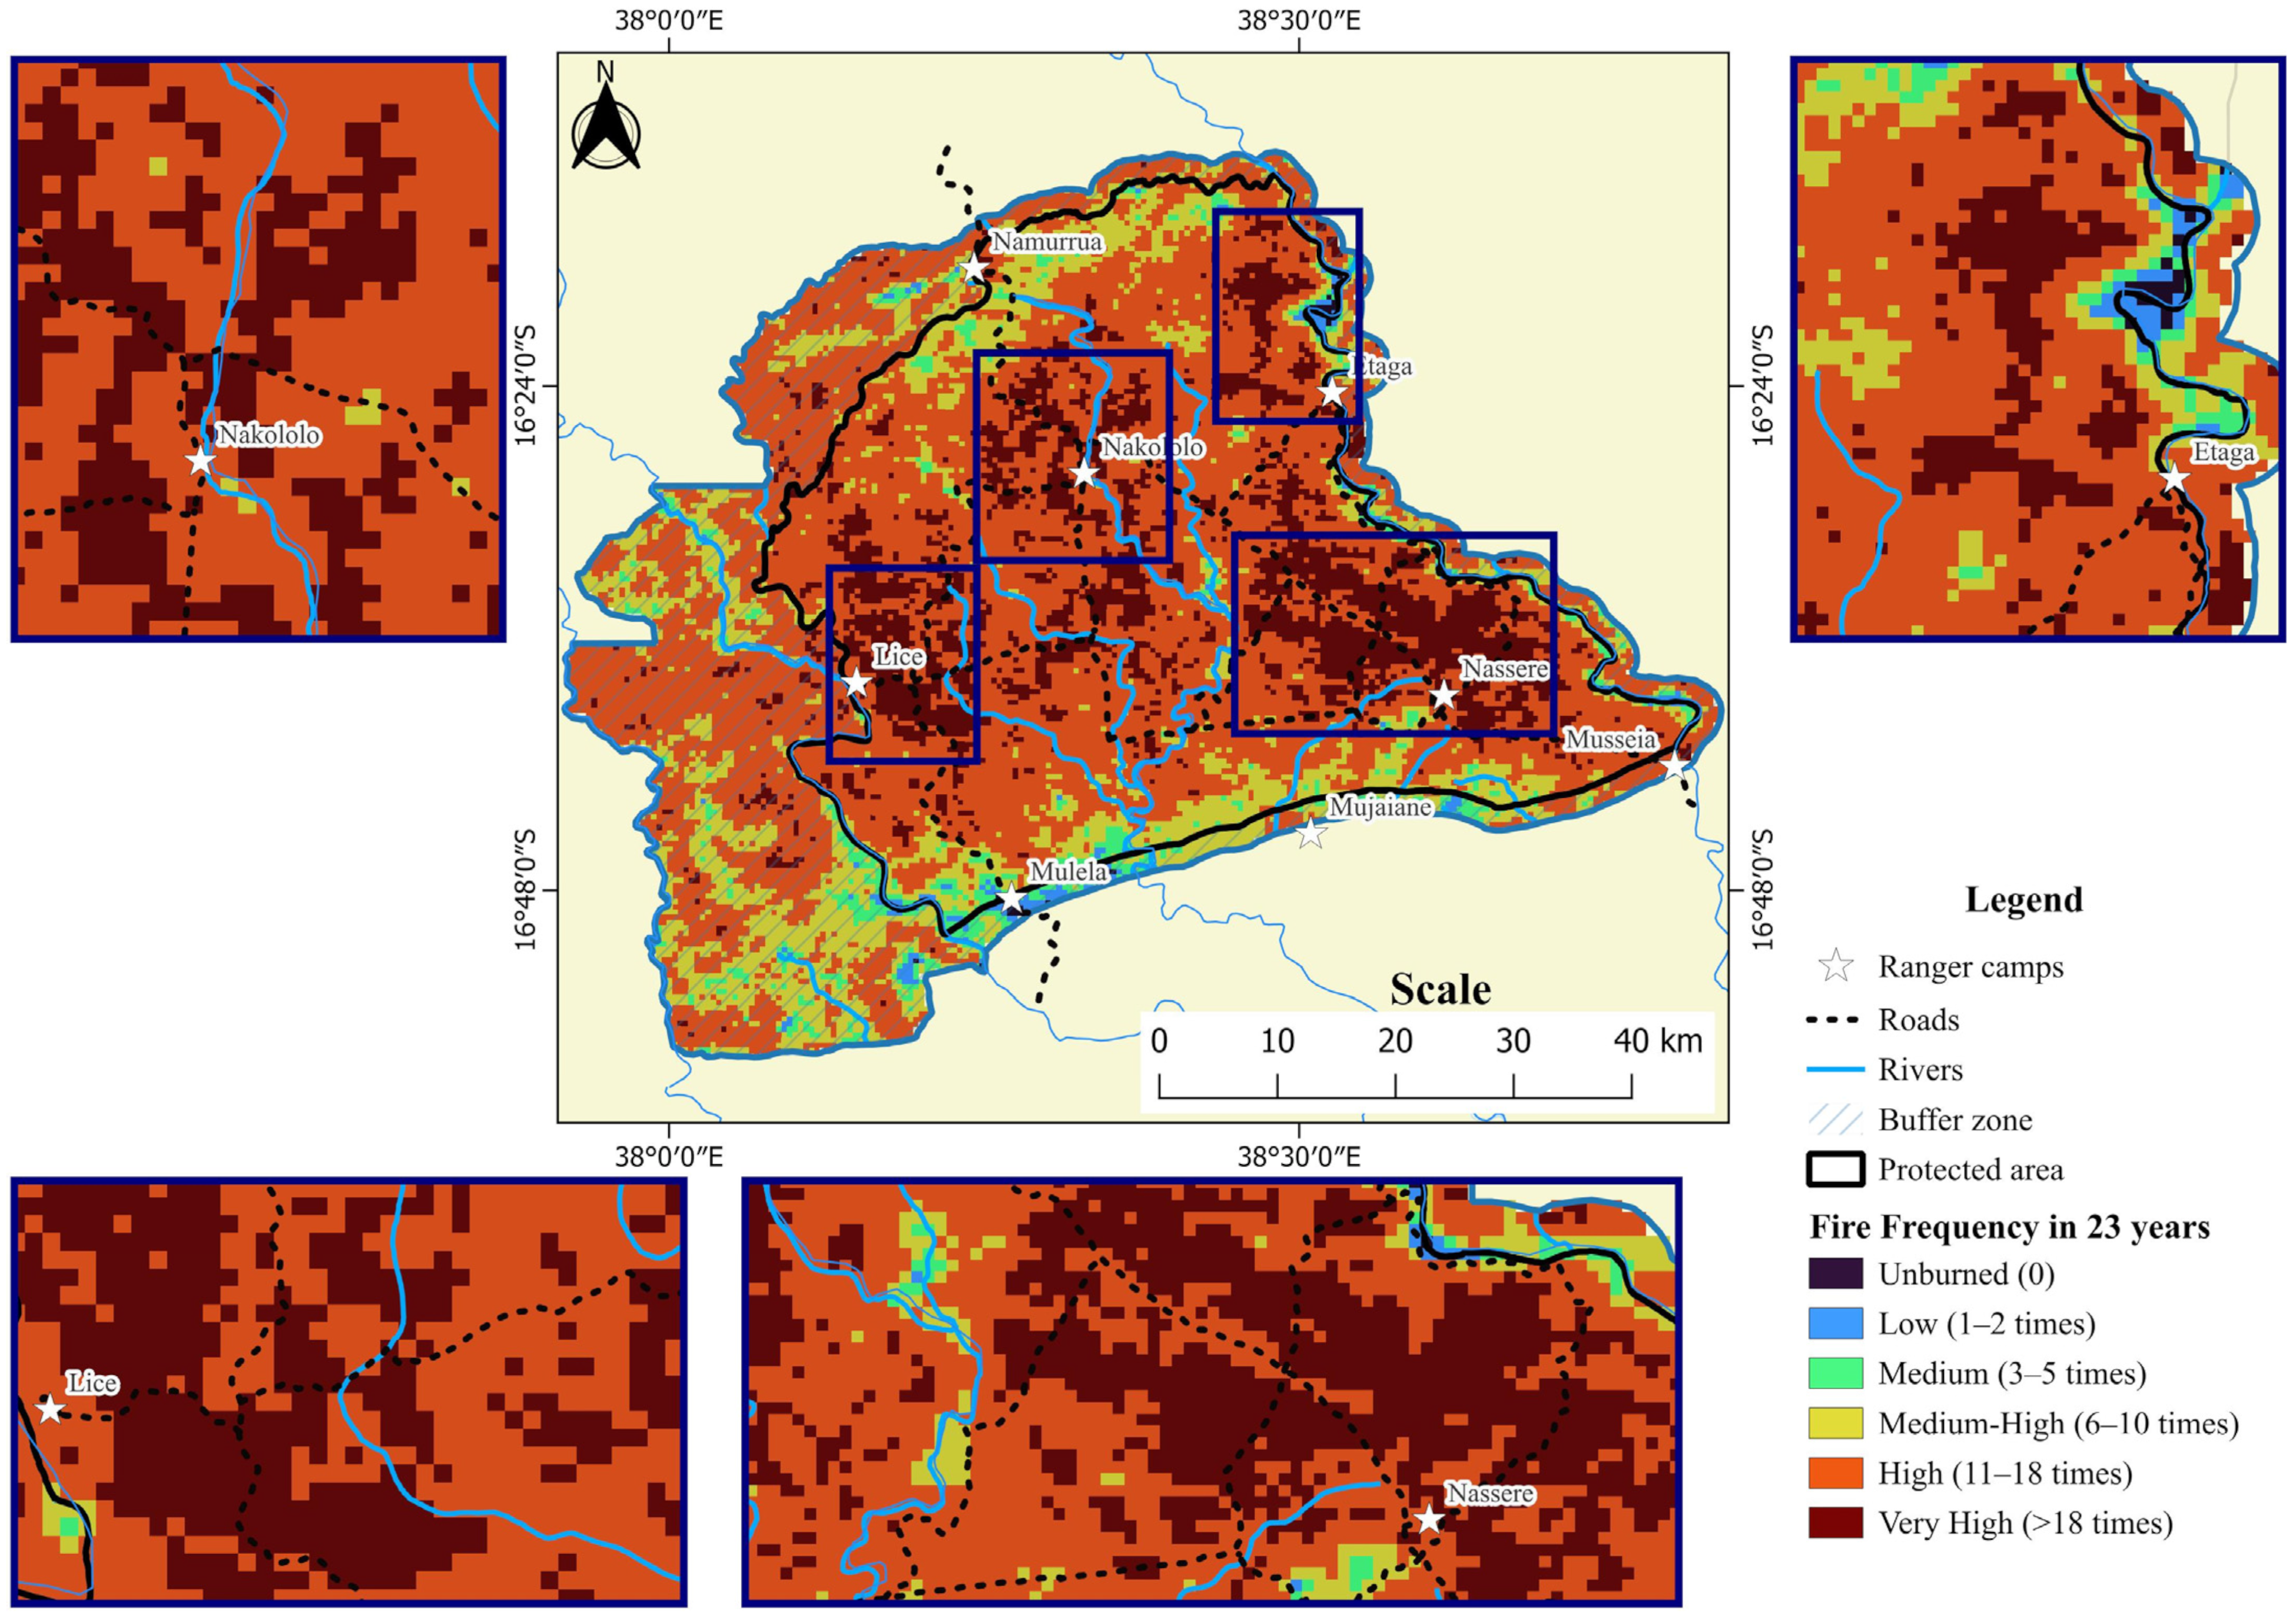
Our 23-year analysis (2001–2023) revealed substantial variation in FF across the PNAG, ranging from completely fire-free pixels to those experiencing up to 24 fire events, averaging a rate of 0.26 fires annually per unit area. Spatial patterns (Figure 2) demonstrated pronounced FF in the park’s core region, with particularly elevated values surrounding the Lice, Nakololo, and Nassere ranger camps. Remarkably, fire touched nearly the entire landscape during our study timeframe, with merely 0.17% escaping combustion. The majority of the PNAG (61.46%) experienced 11–18 burning episodes, classified as high FF, while 14.44% endured 18 or more events (very high FF). Collectively, high and very high FF regimes characterized approximately three quarters of the formally protected zone.
Figure 2.
Spatial distribution of burning frequency over 23 years (2001–2023), in the Gilé National Park. The insets represent FF in the vicinity of the main ranger camps inside the park.
Our calculations yielded an average MFRI of 3.9 years, suggesting a typical recurrence cycle of approximately four years between successive fire events at any given location. However, this aggregate metric masks significant heterogeneity. As presented in Table 2 the vast majority (88%) experienced 1–2-year MFRI, whereas a negligible fraction (0.003%) persisted without fire throughout the entire observation period.
Table 2.
Burned area by Mean Fire Return Interval (MFRI) class.
3.1.2. Fire Temporal Variation and Seasonality
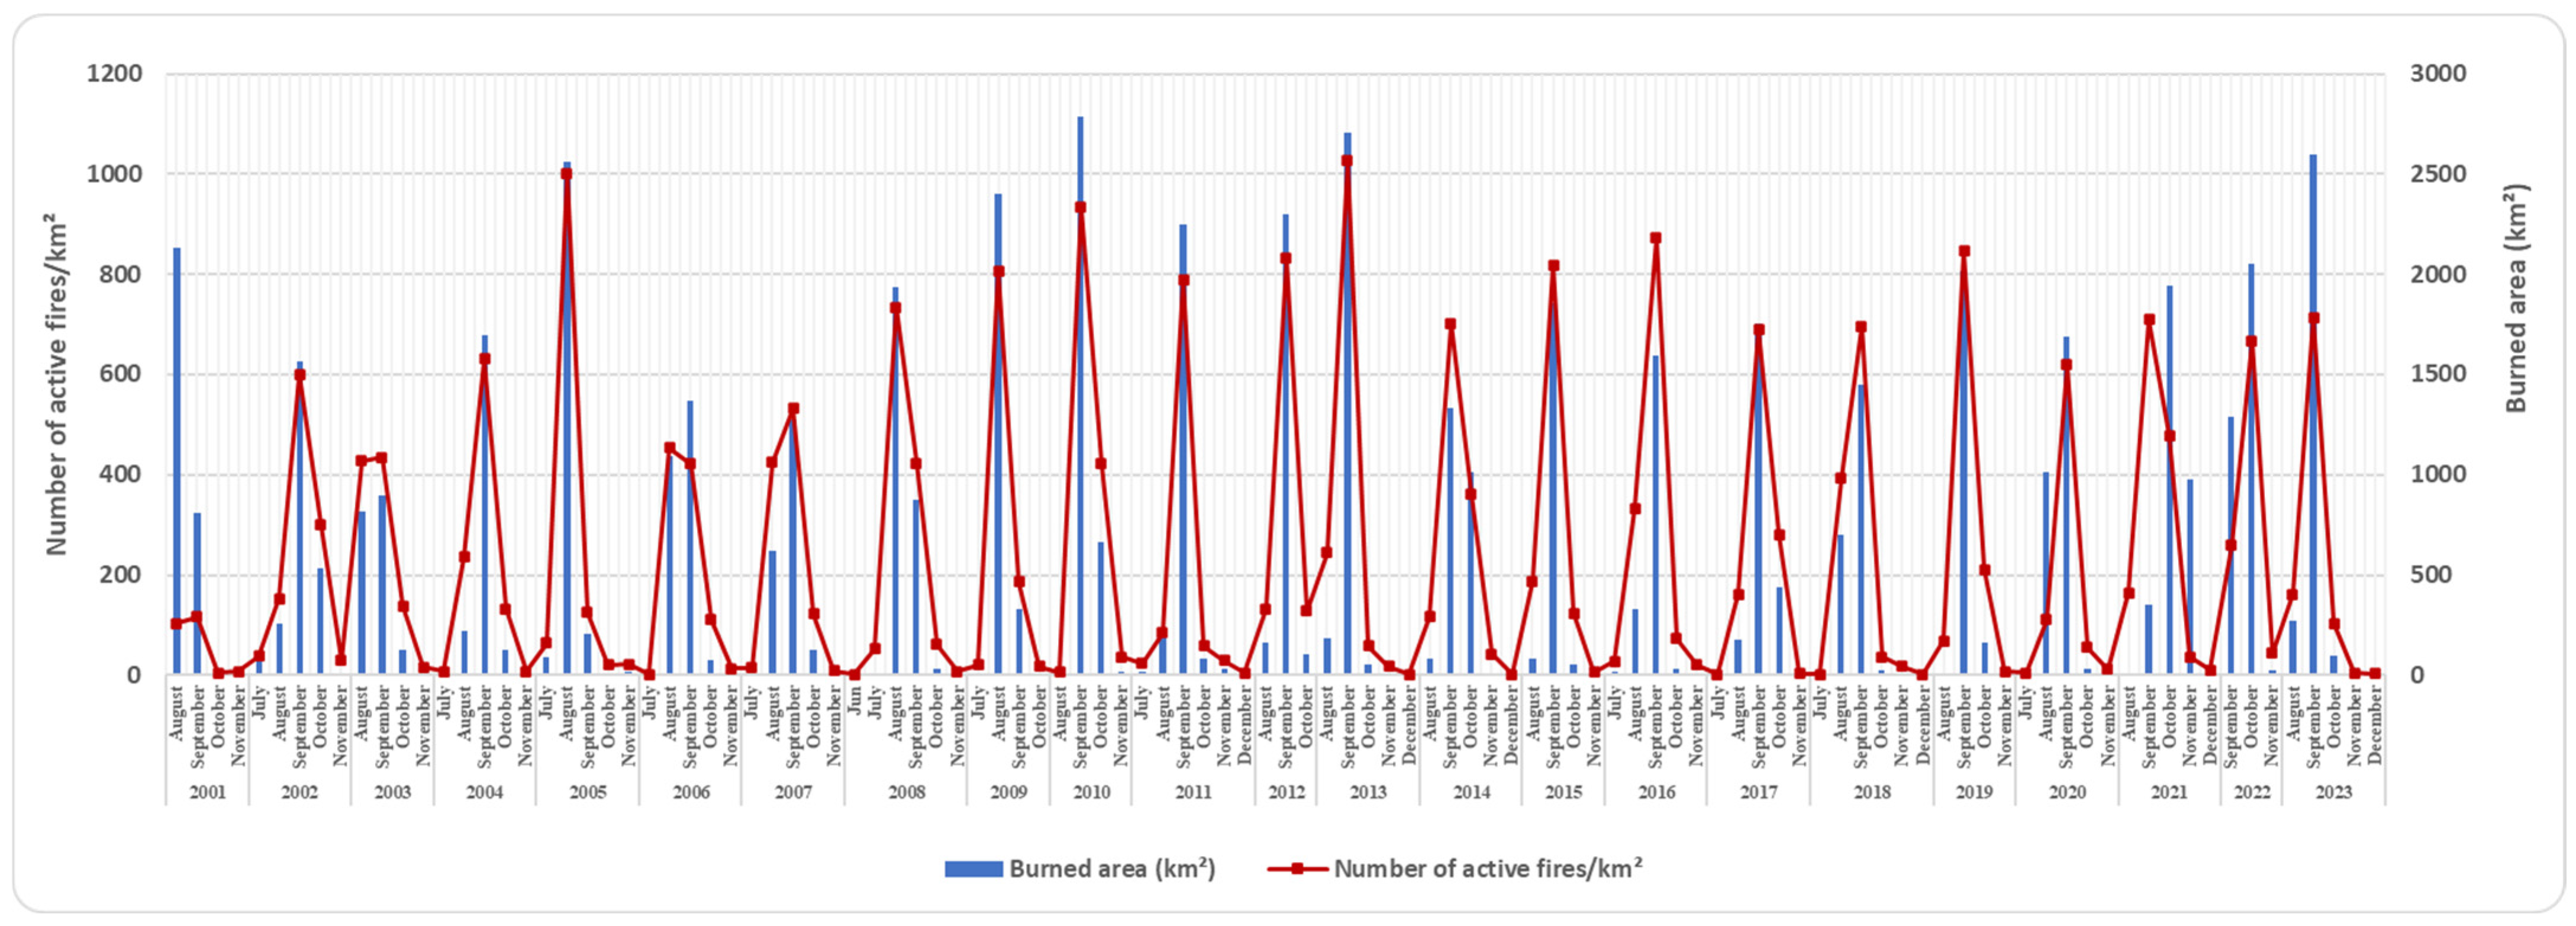
Fire activity over the 23-year observation window affected approximately 99% of the PNAG’s 4367 km2 extent, indicating near-complete landscape involvement. Temporal analysis identified distinct peak years—2001, 2005, 2010, 2013, and 2023—when the burned area extent reached its maximum values. Among these, 2010 emerged as the most extreme fire year, occurring in roughly 80% of PNAG including the buffer zone. Conversely, 2003 represented the minimum extent, with combustion limited to approximately 43% of the landscape (including the buffer zone) (Figure 3). Fires occur mainly during the late dry season, between August and October (Figure 3).
Figure 3.
Intra-annual and inter-annual distribution of fire outbreaks and the extent of the burned area during the period between 2001 and 2023 in the Gilé National Park, Central Mozambique.
3.1.3. Fire Intensity and Density
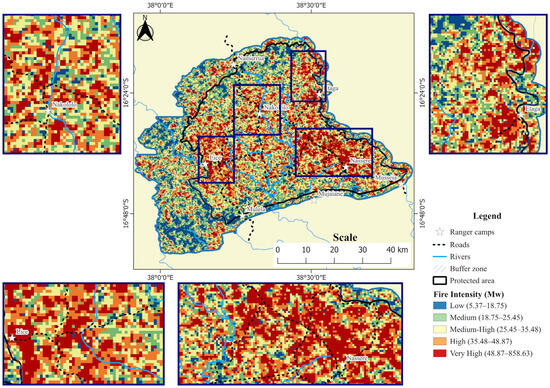
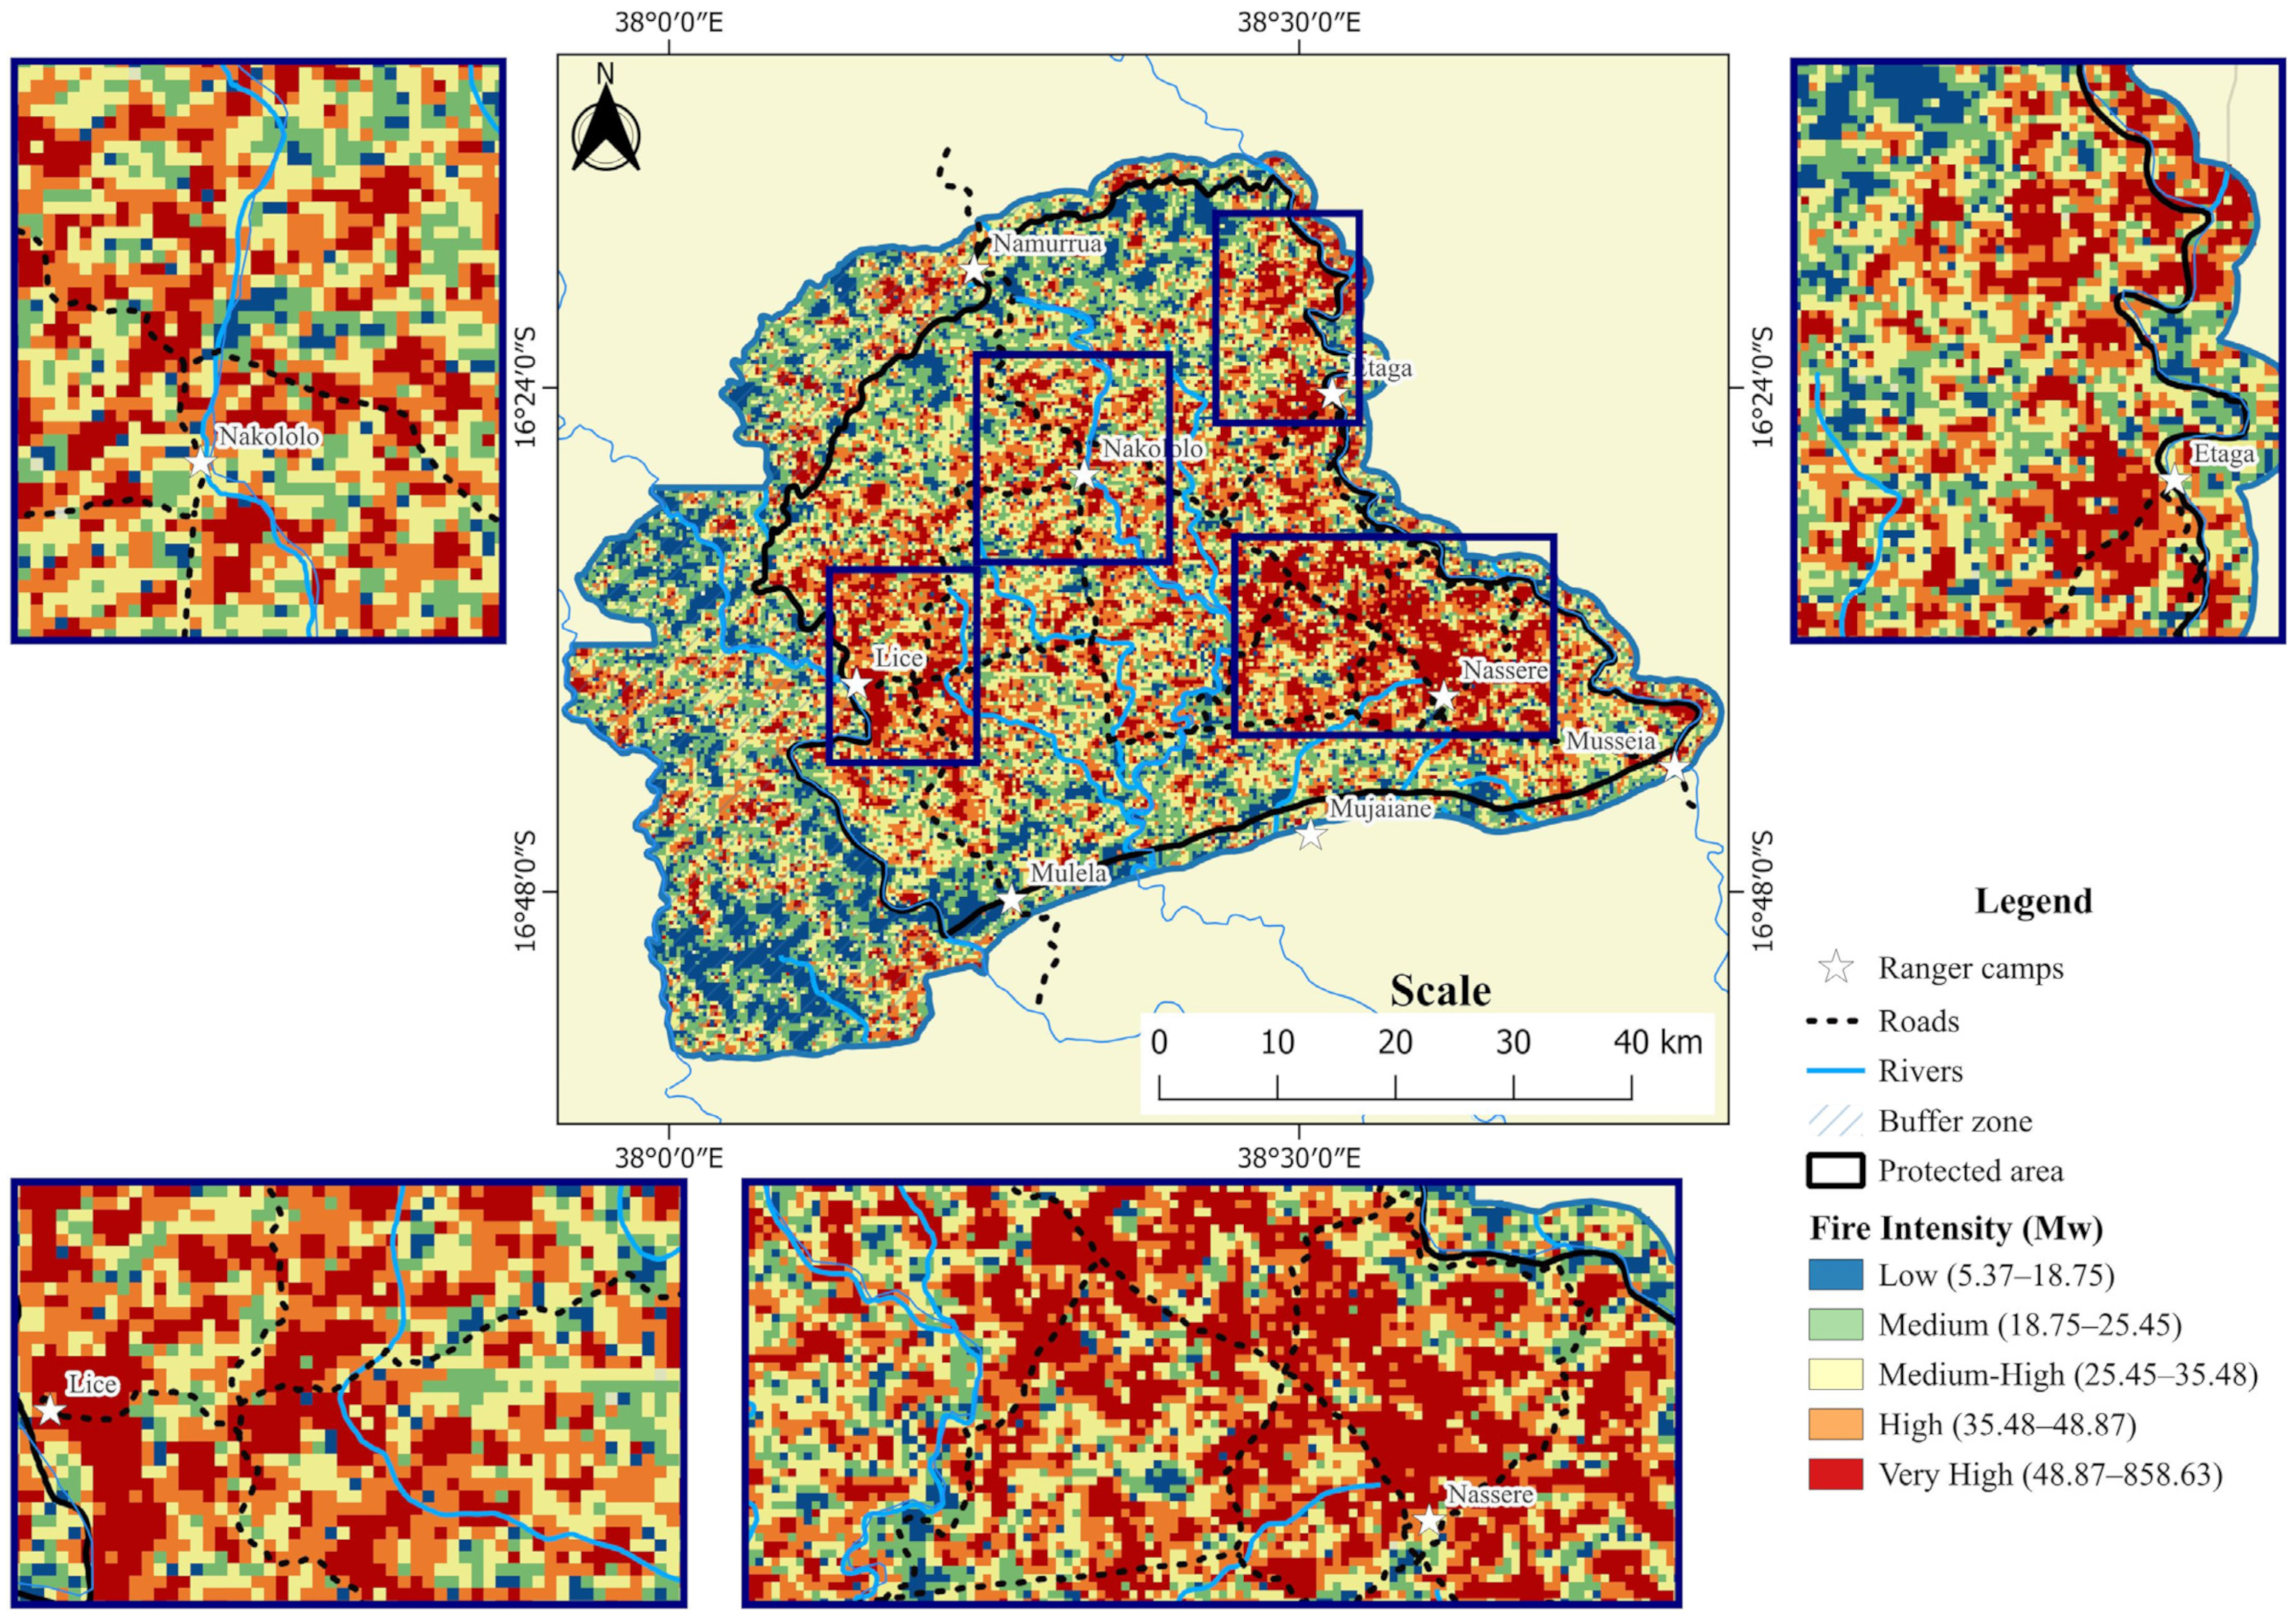
The FRP measurements across the study period averaged 36.24 MW, spanning from 5.75 MW (August 2015 minimum) to 858.63 MW (September 2021 maximum). High and very high intensity categories collectively characterized roughly one third (35%) of PNAG’s landscape (Table 3; Figure 4).
Table 3.
Extent of fire intensity classes across the Gilé National Park area.
Figure 4.
Spatial distribution of burning intensity over 23 years (2001–2023), in the Gilé National Park. The insets represent the density of fire in the vicinity of the ranger camps.
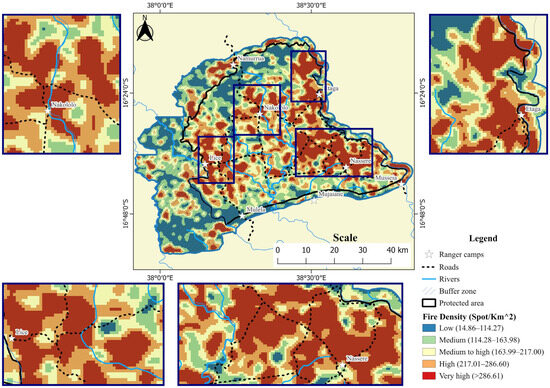
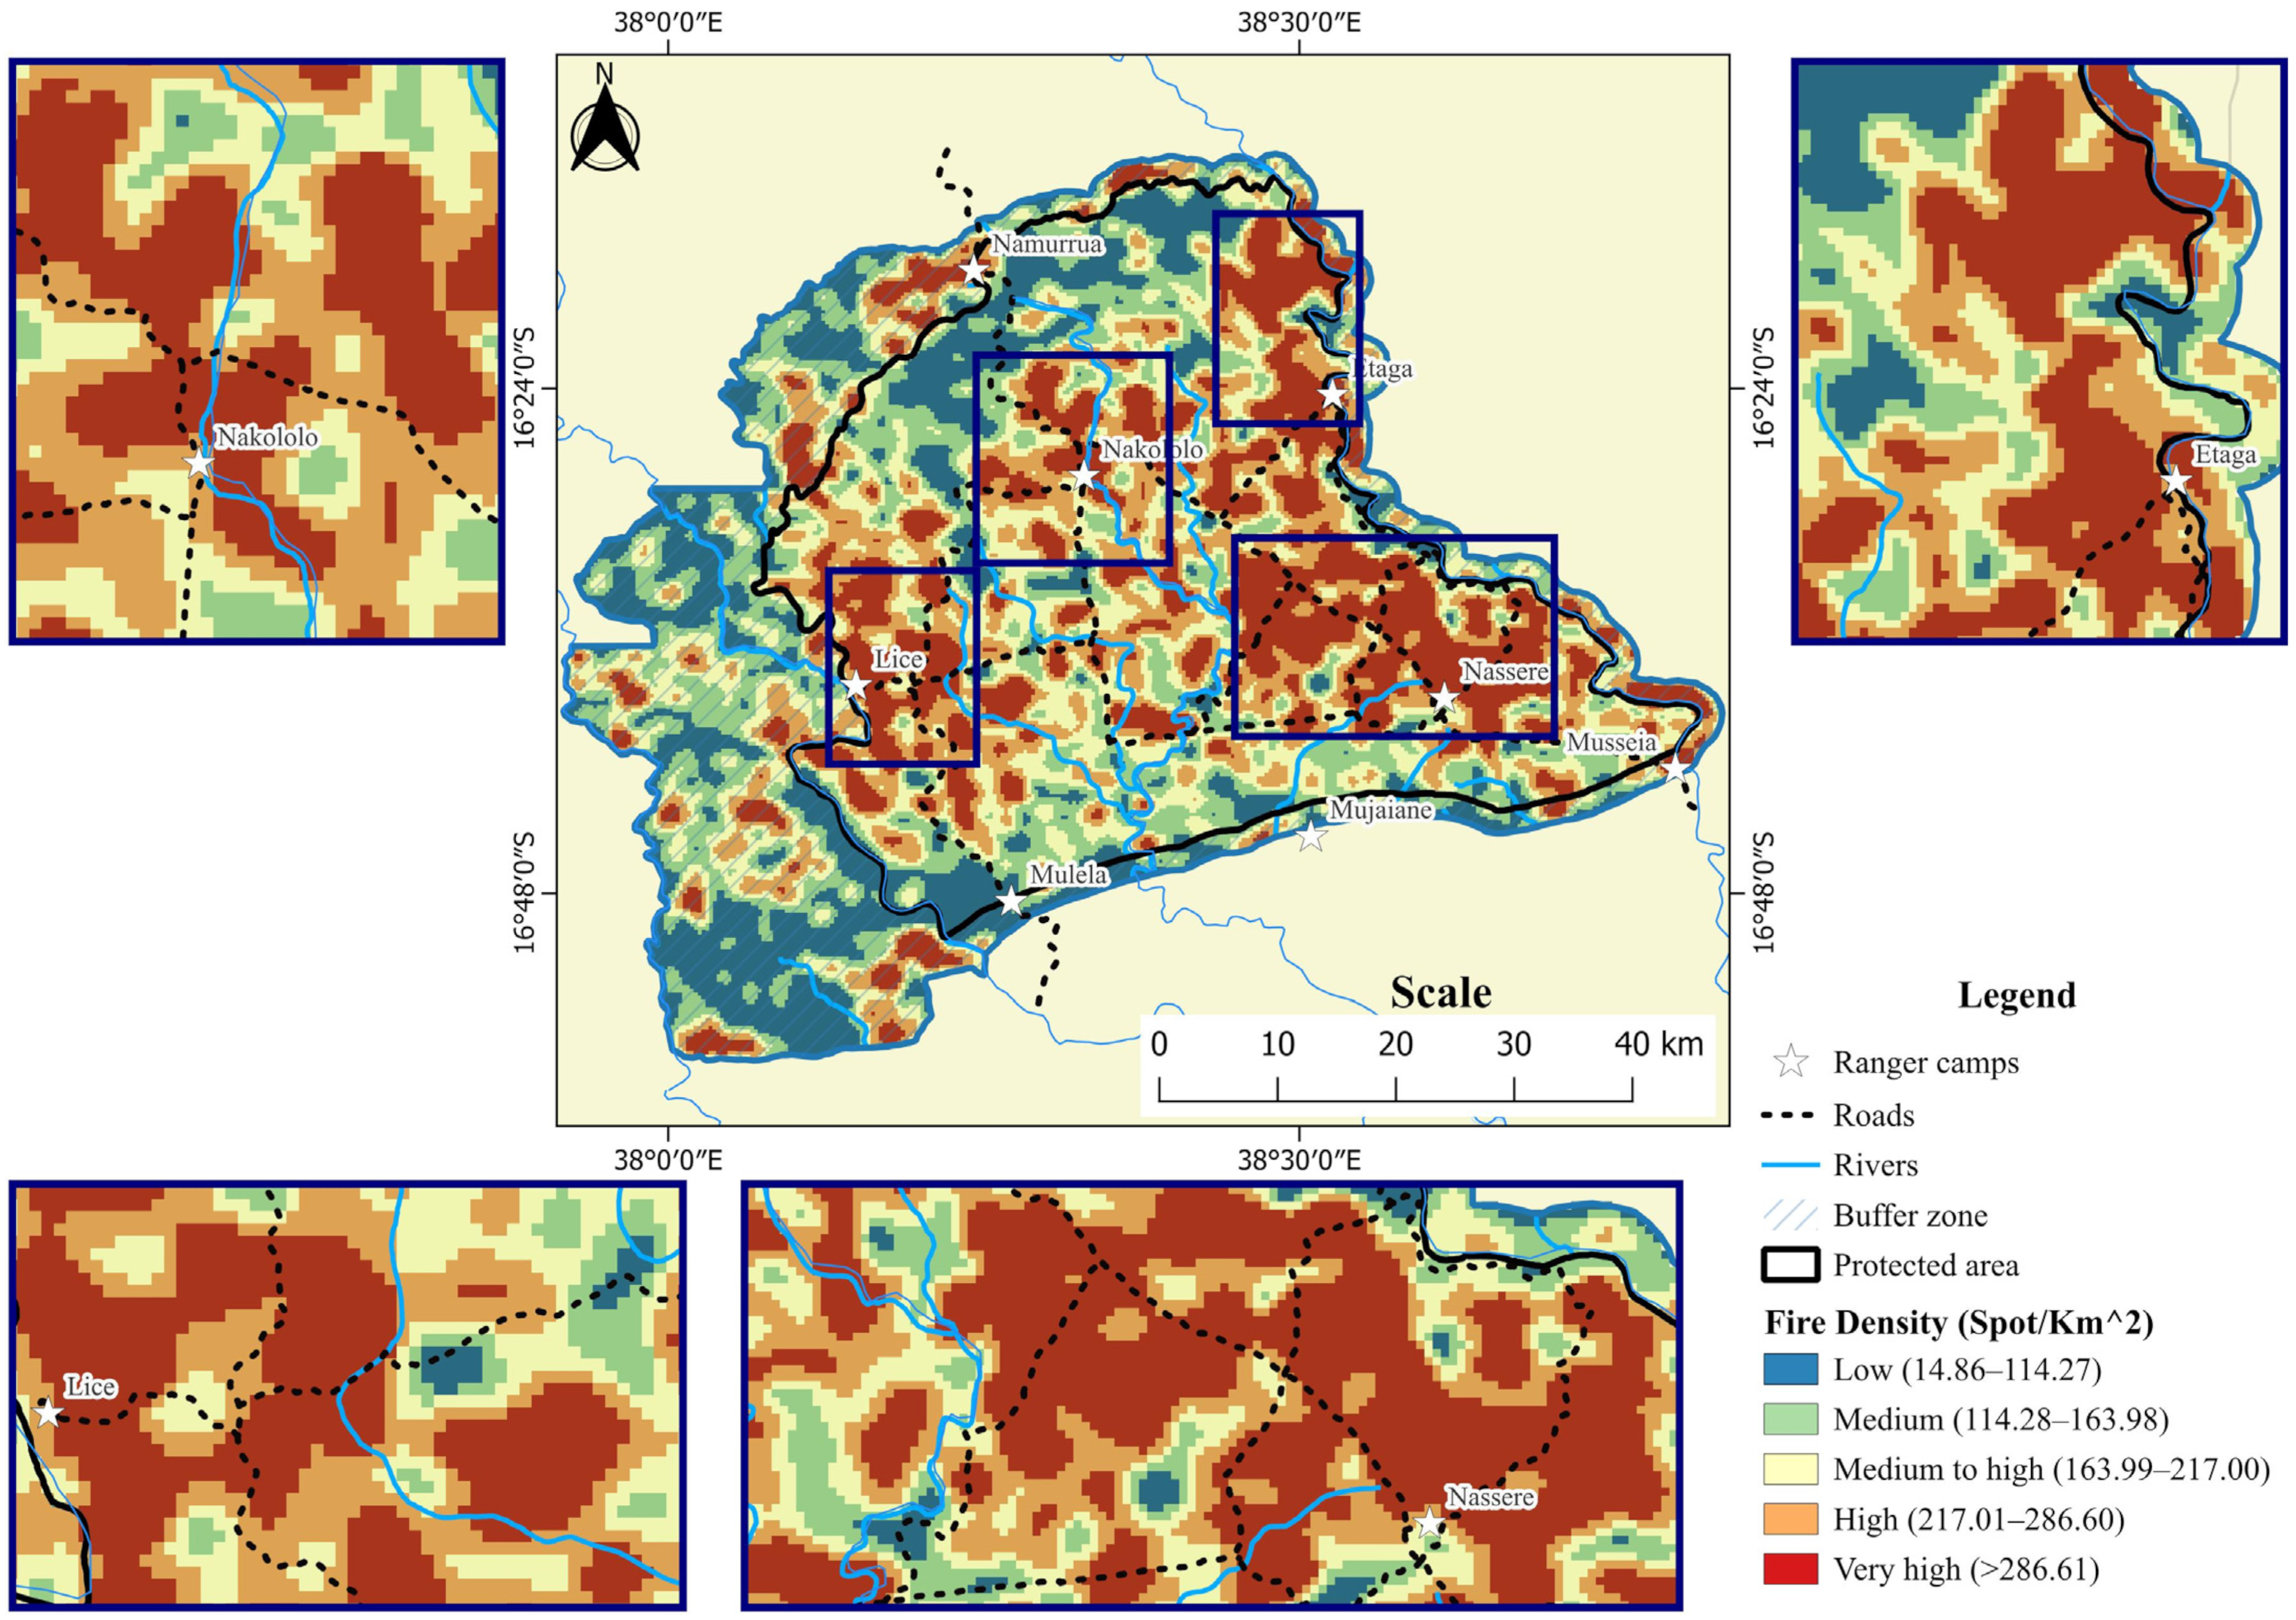
Spatial fire occurrence density averaged 206 ignitions km−2 over the observation period (Table 4; Figure 5), with values ranging from 14.86 to 859.92 fires km−2 (September 2015 was the maximum). Low-density fire regimes (14.86–114.27 ignitions km−2) occupied merely 18% of PNAG’s total extent, predominantly within the buffer zone in the southern and southwestern sectors, as well as near the Namurrua ranger camp (Table 4). About 20.47% of the total area of the PNAG had medium-density fires ranging from 114.28 to 163.98 fires per km2. Approximately 60.59% of the park’s total area was dominated by medium- to very high-density fires, which were more concentrated in the park’s total protection zone (Figure 5).
Table 4.
Area occupied by each class of fire density in the Gilé National Park.
Figure 5.
Spatial distribution of burning density over 23 years (2001–2023), in the Gilé National Park. The insets represent the density of fires in the vicinity of the ranger camps.
3.1.4. Fire Severity
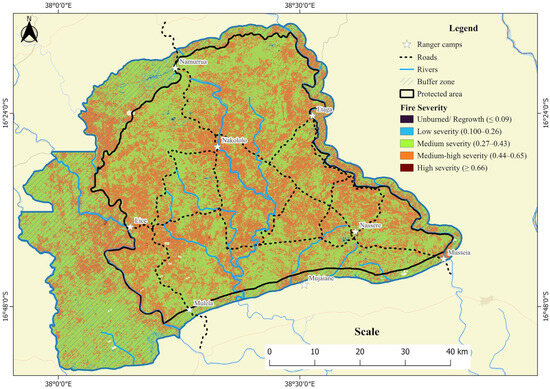
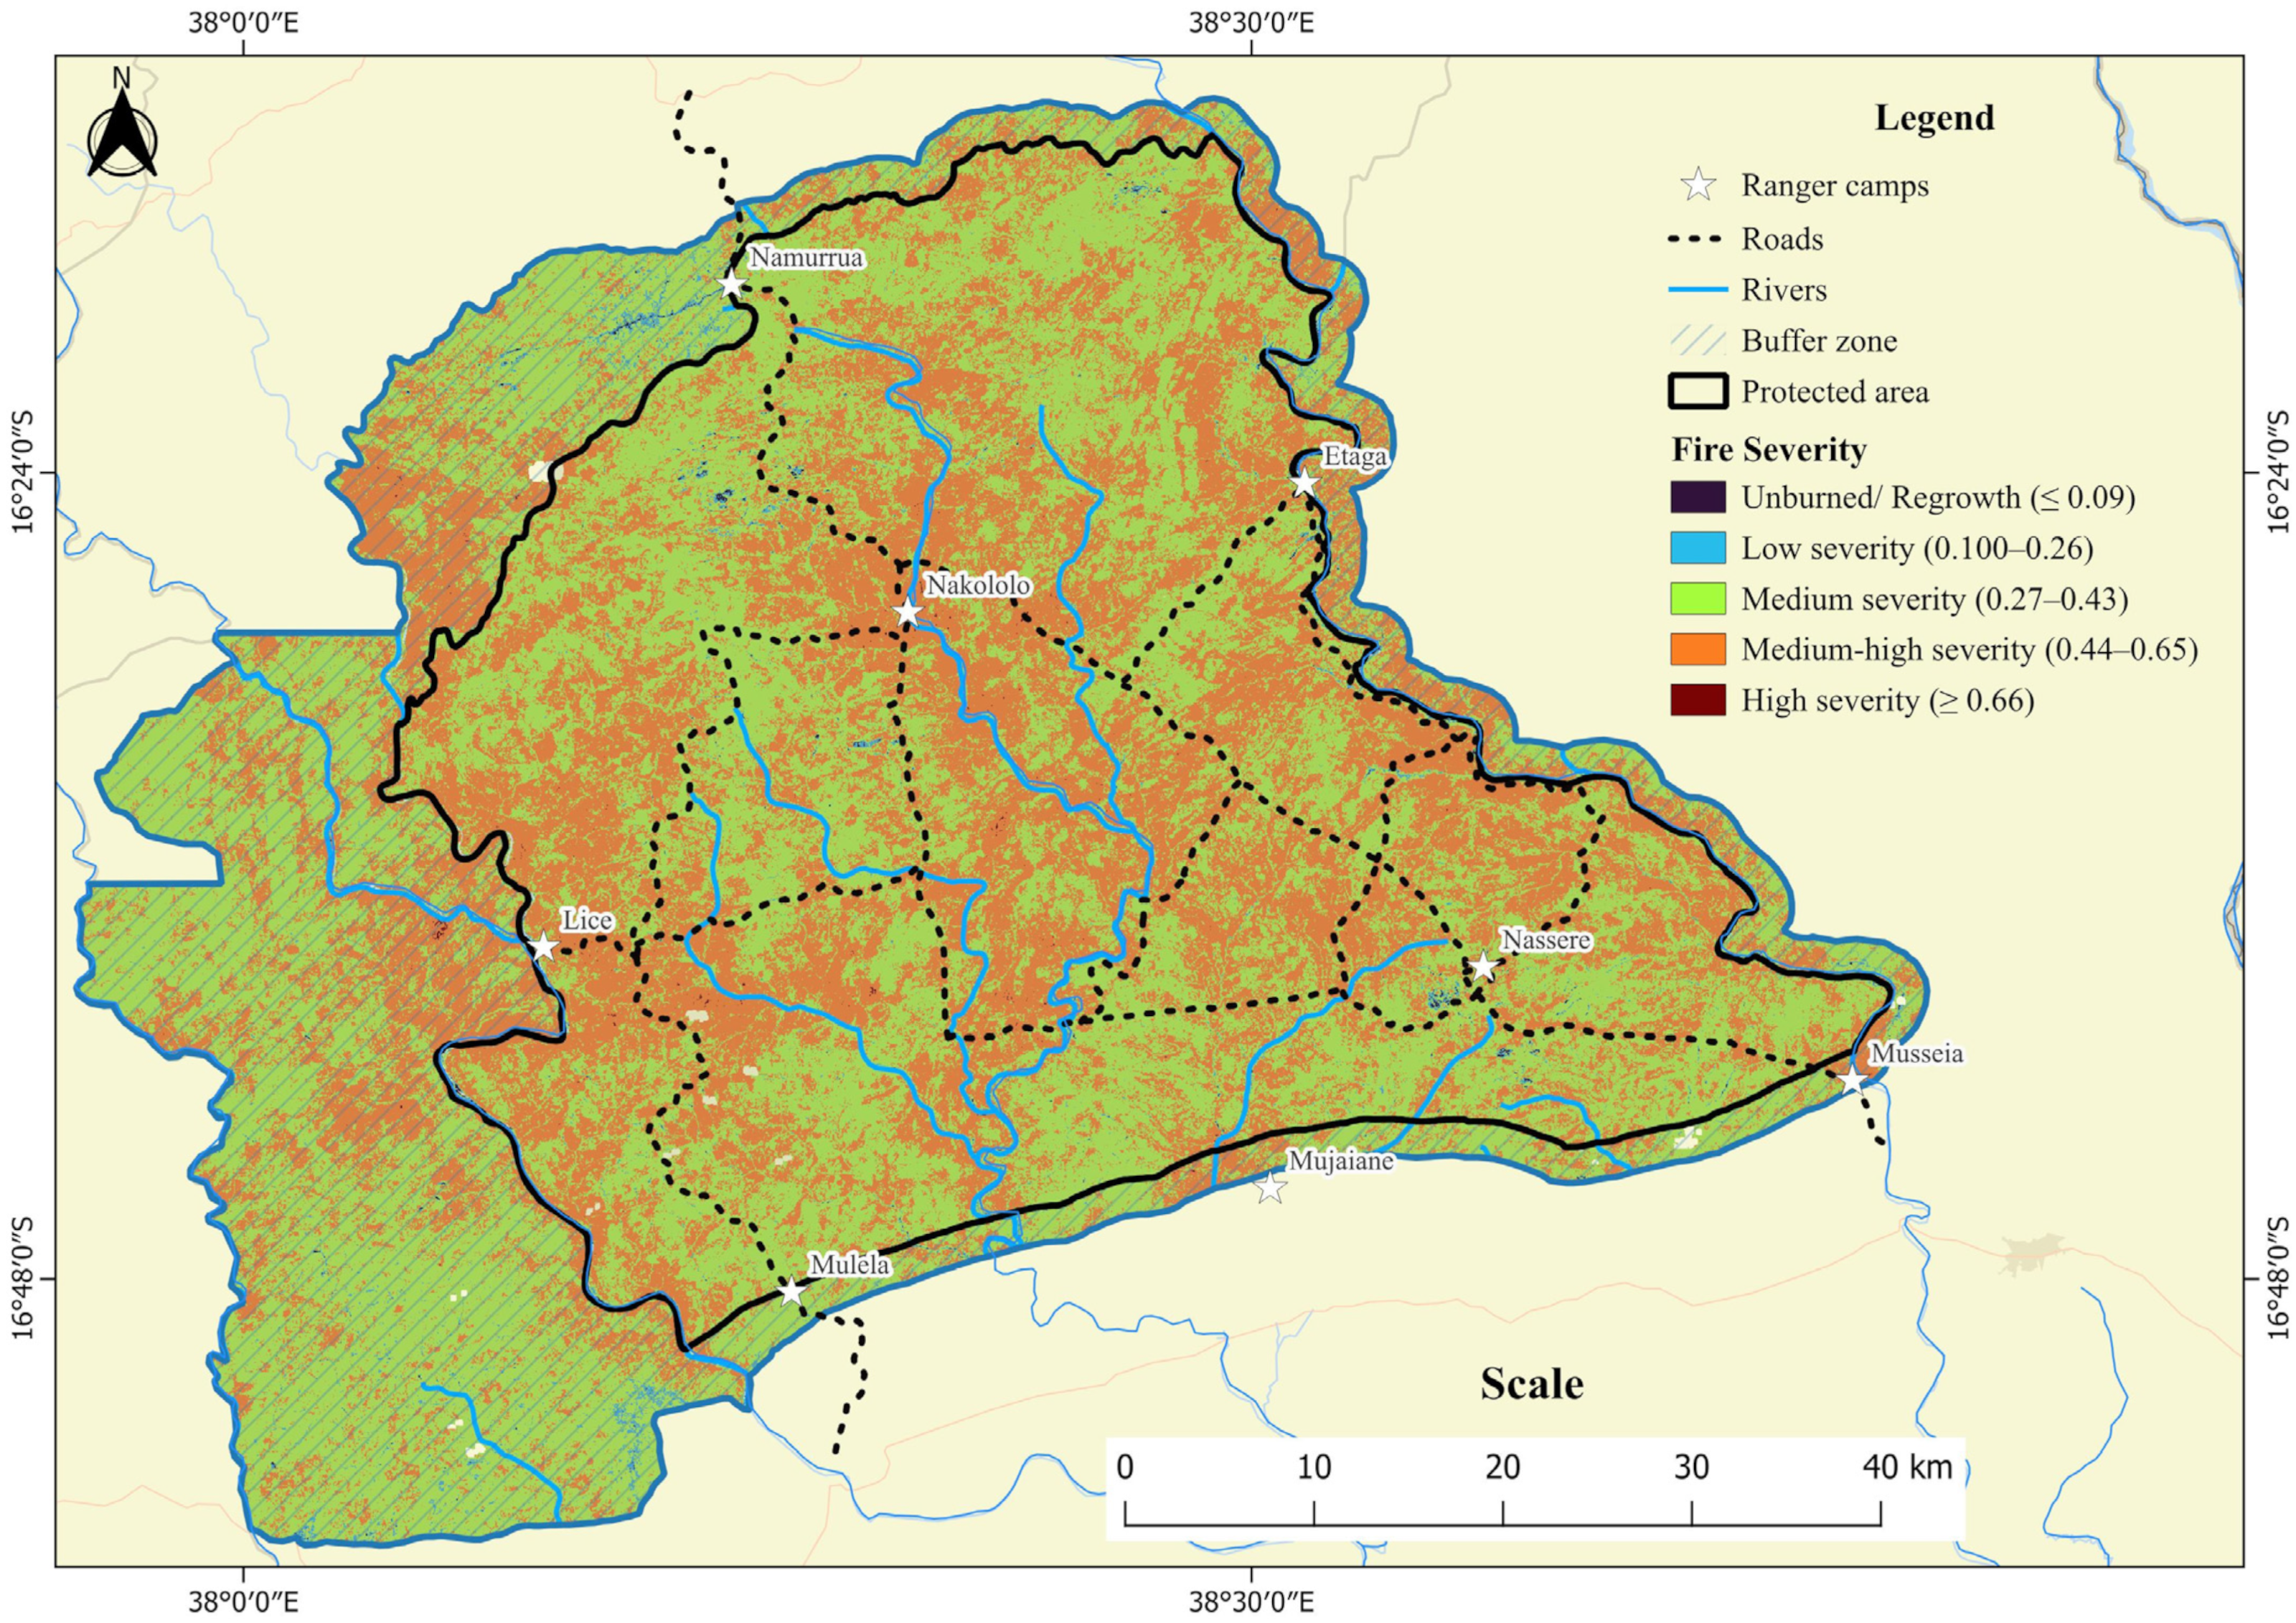
The dNBR analysis revealed that medium to medium–high severity burns dominated the PNAG, affecting 98% of the landscape (Figure 6; Table 5). High severity fires remained exceedingly rare, encompassing just 0.04% of the park. Unlike the frequency and intensity patterns, severity distribution exhibited no discernible spatial structure.
Figure 6.
Fire severity map in Gilé National Park, central Mozambique. Fire severity is given by the dNBR (difference Normalized Burned Ratio Index).
Table 5.
Fire severity extension in Gilé National Park (dNBR is the difference in Normalized Burned Ratio).
3.2. Fire Risk Modelling and Mapping
3.2.1. Fire Risk Modelling
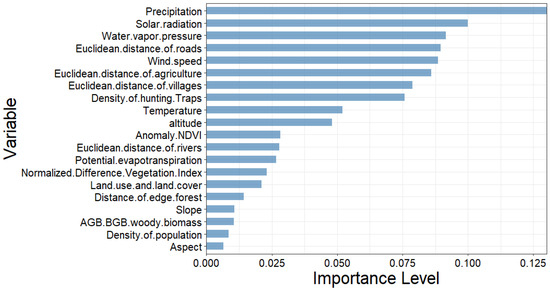
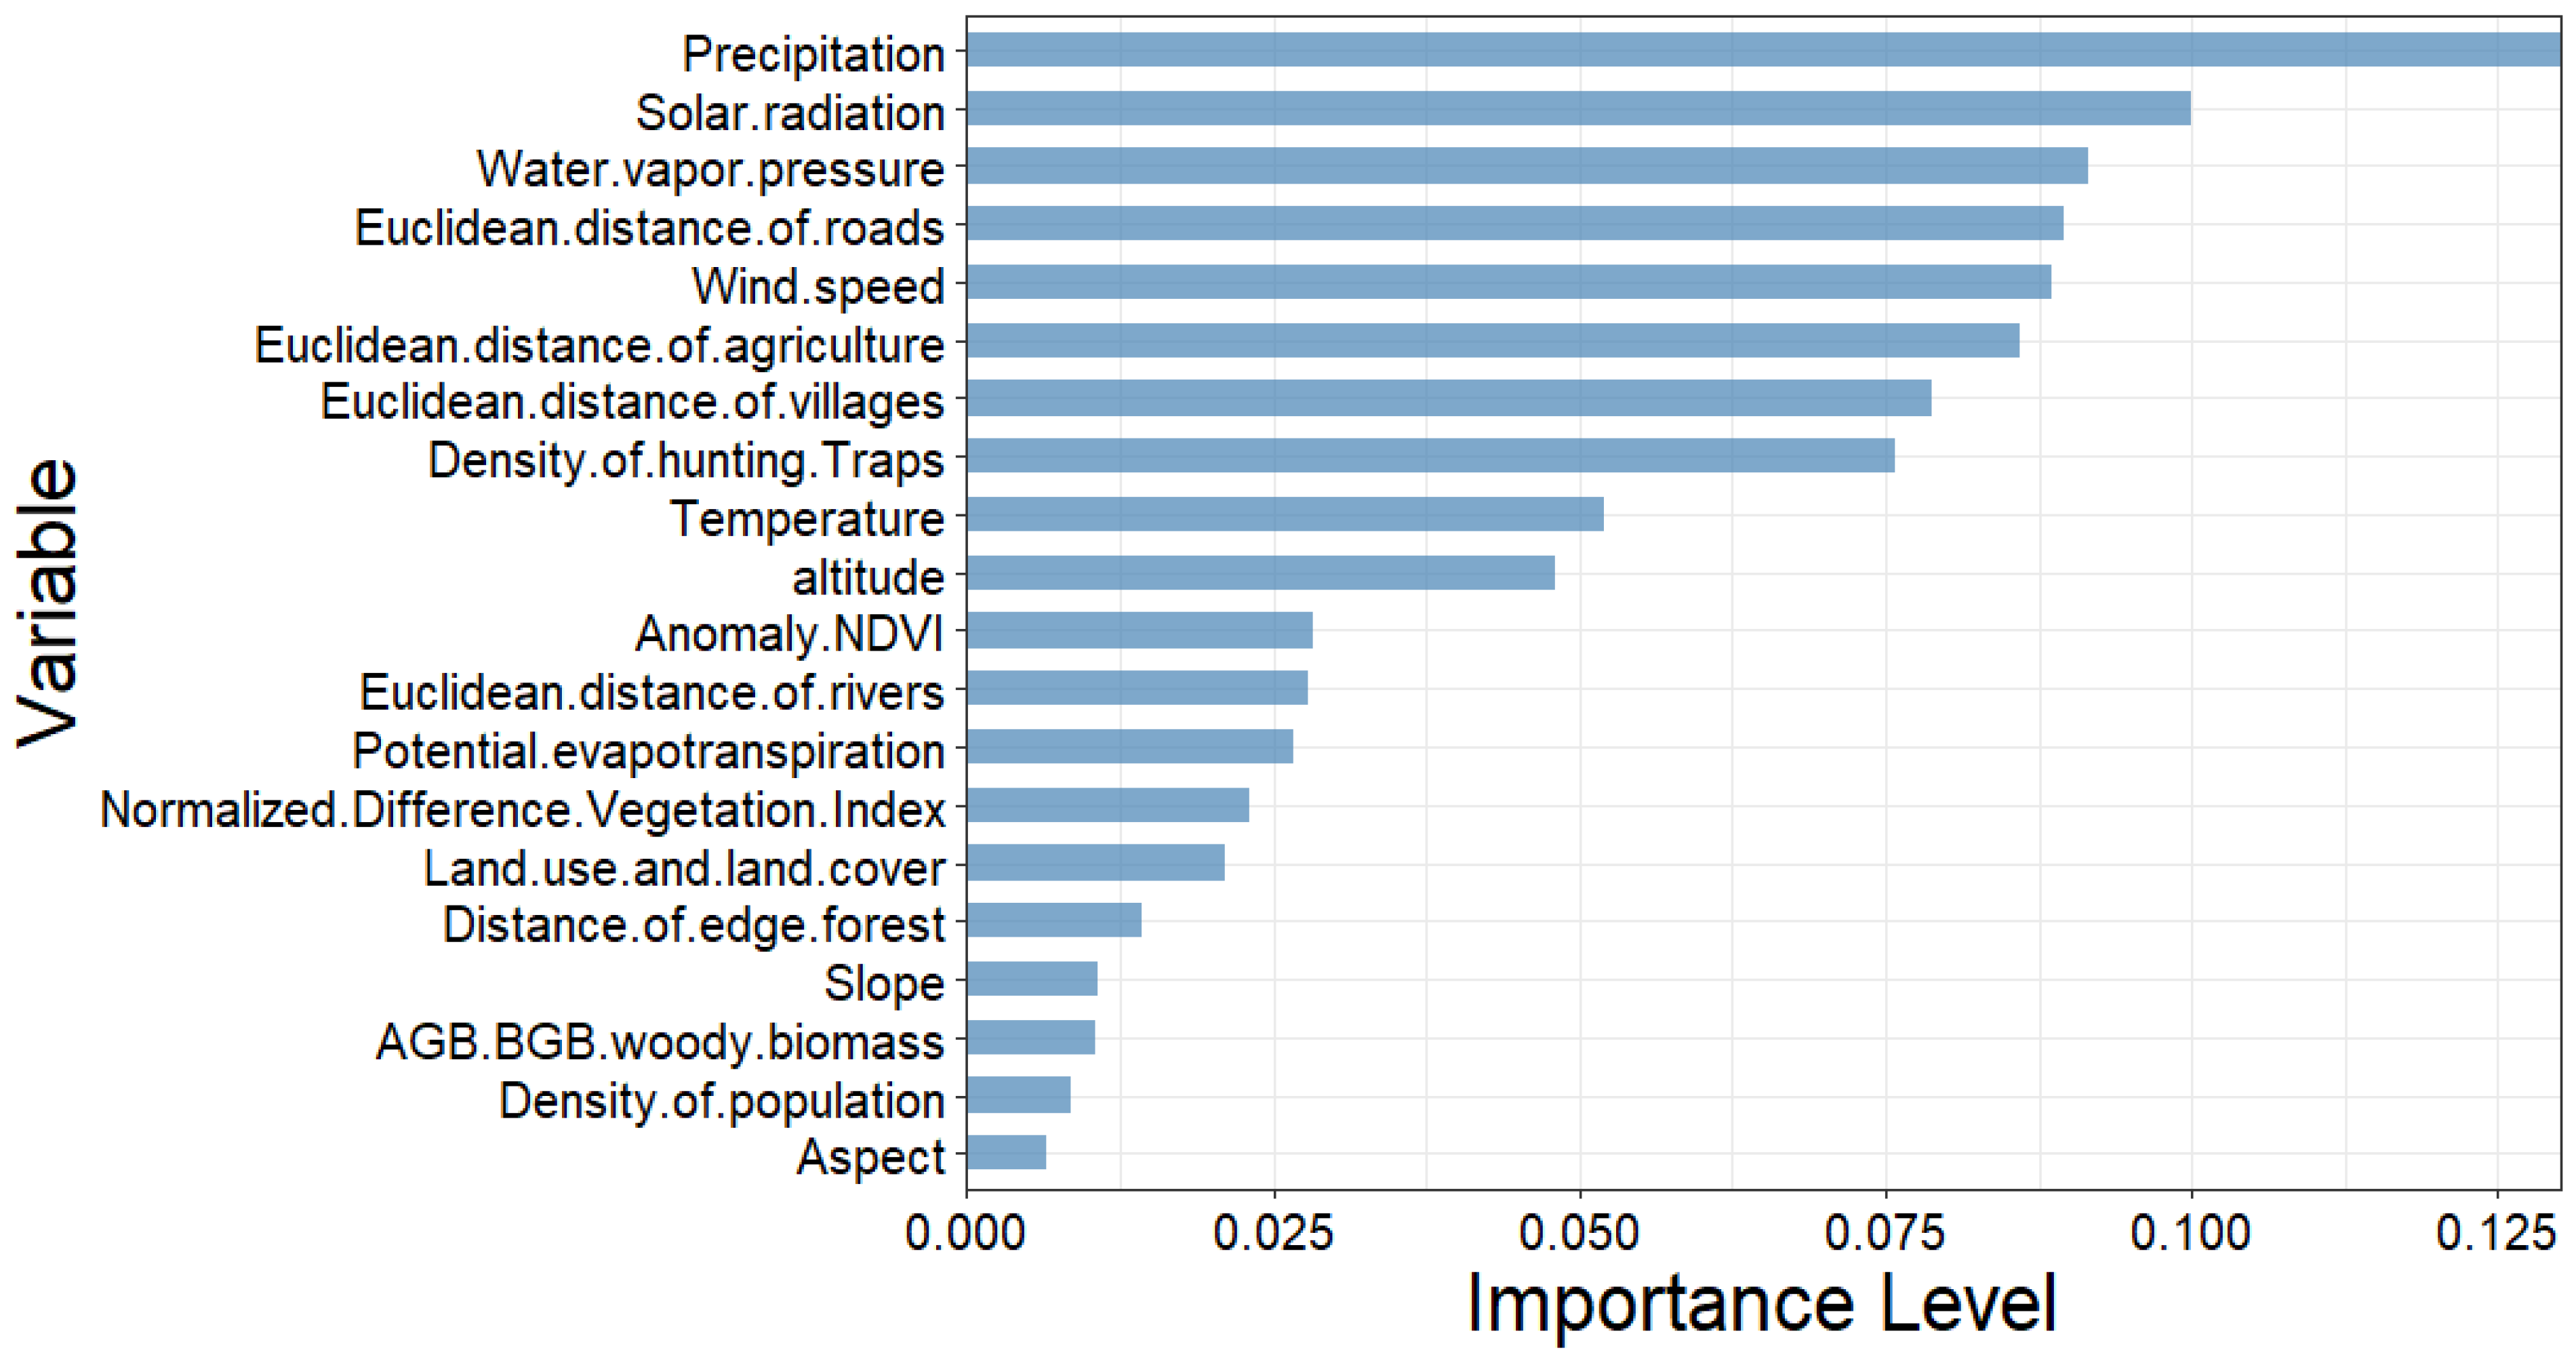
Based on the MDG scores, eight variables with highest importance were selected from the twenty used to train our model: precipitation, solar radiation, water vapor pressure, distance to access roads, distance to agricultural fields, wind speed, distance to villages, and hunting trap density (Figure 7).
Figure 7.
Importance of the fire predicting variables according to the Mean Decrease Gini index.
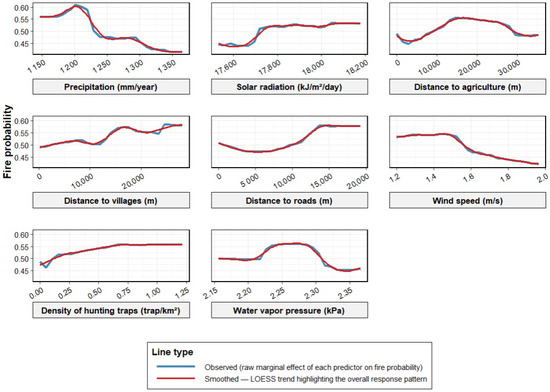
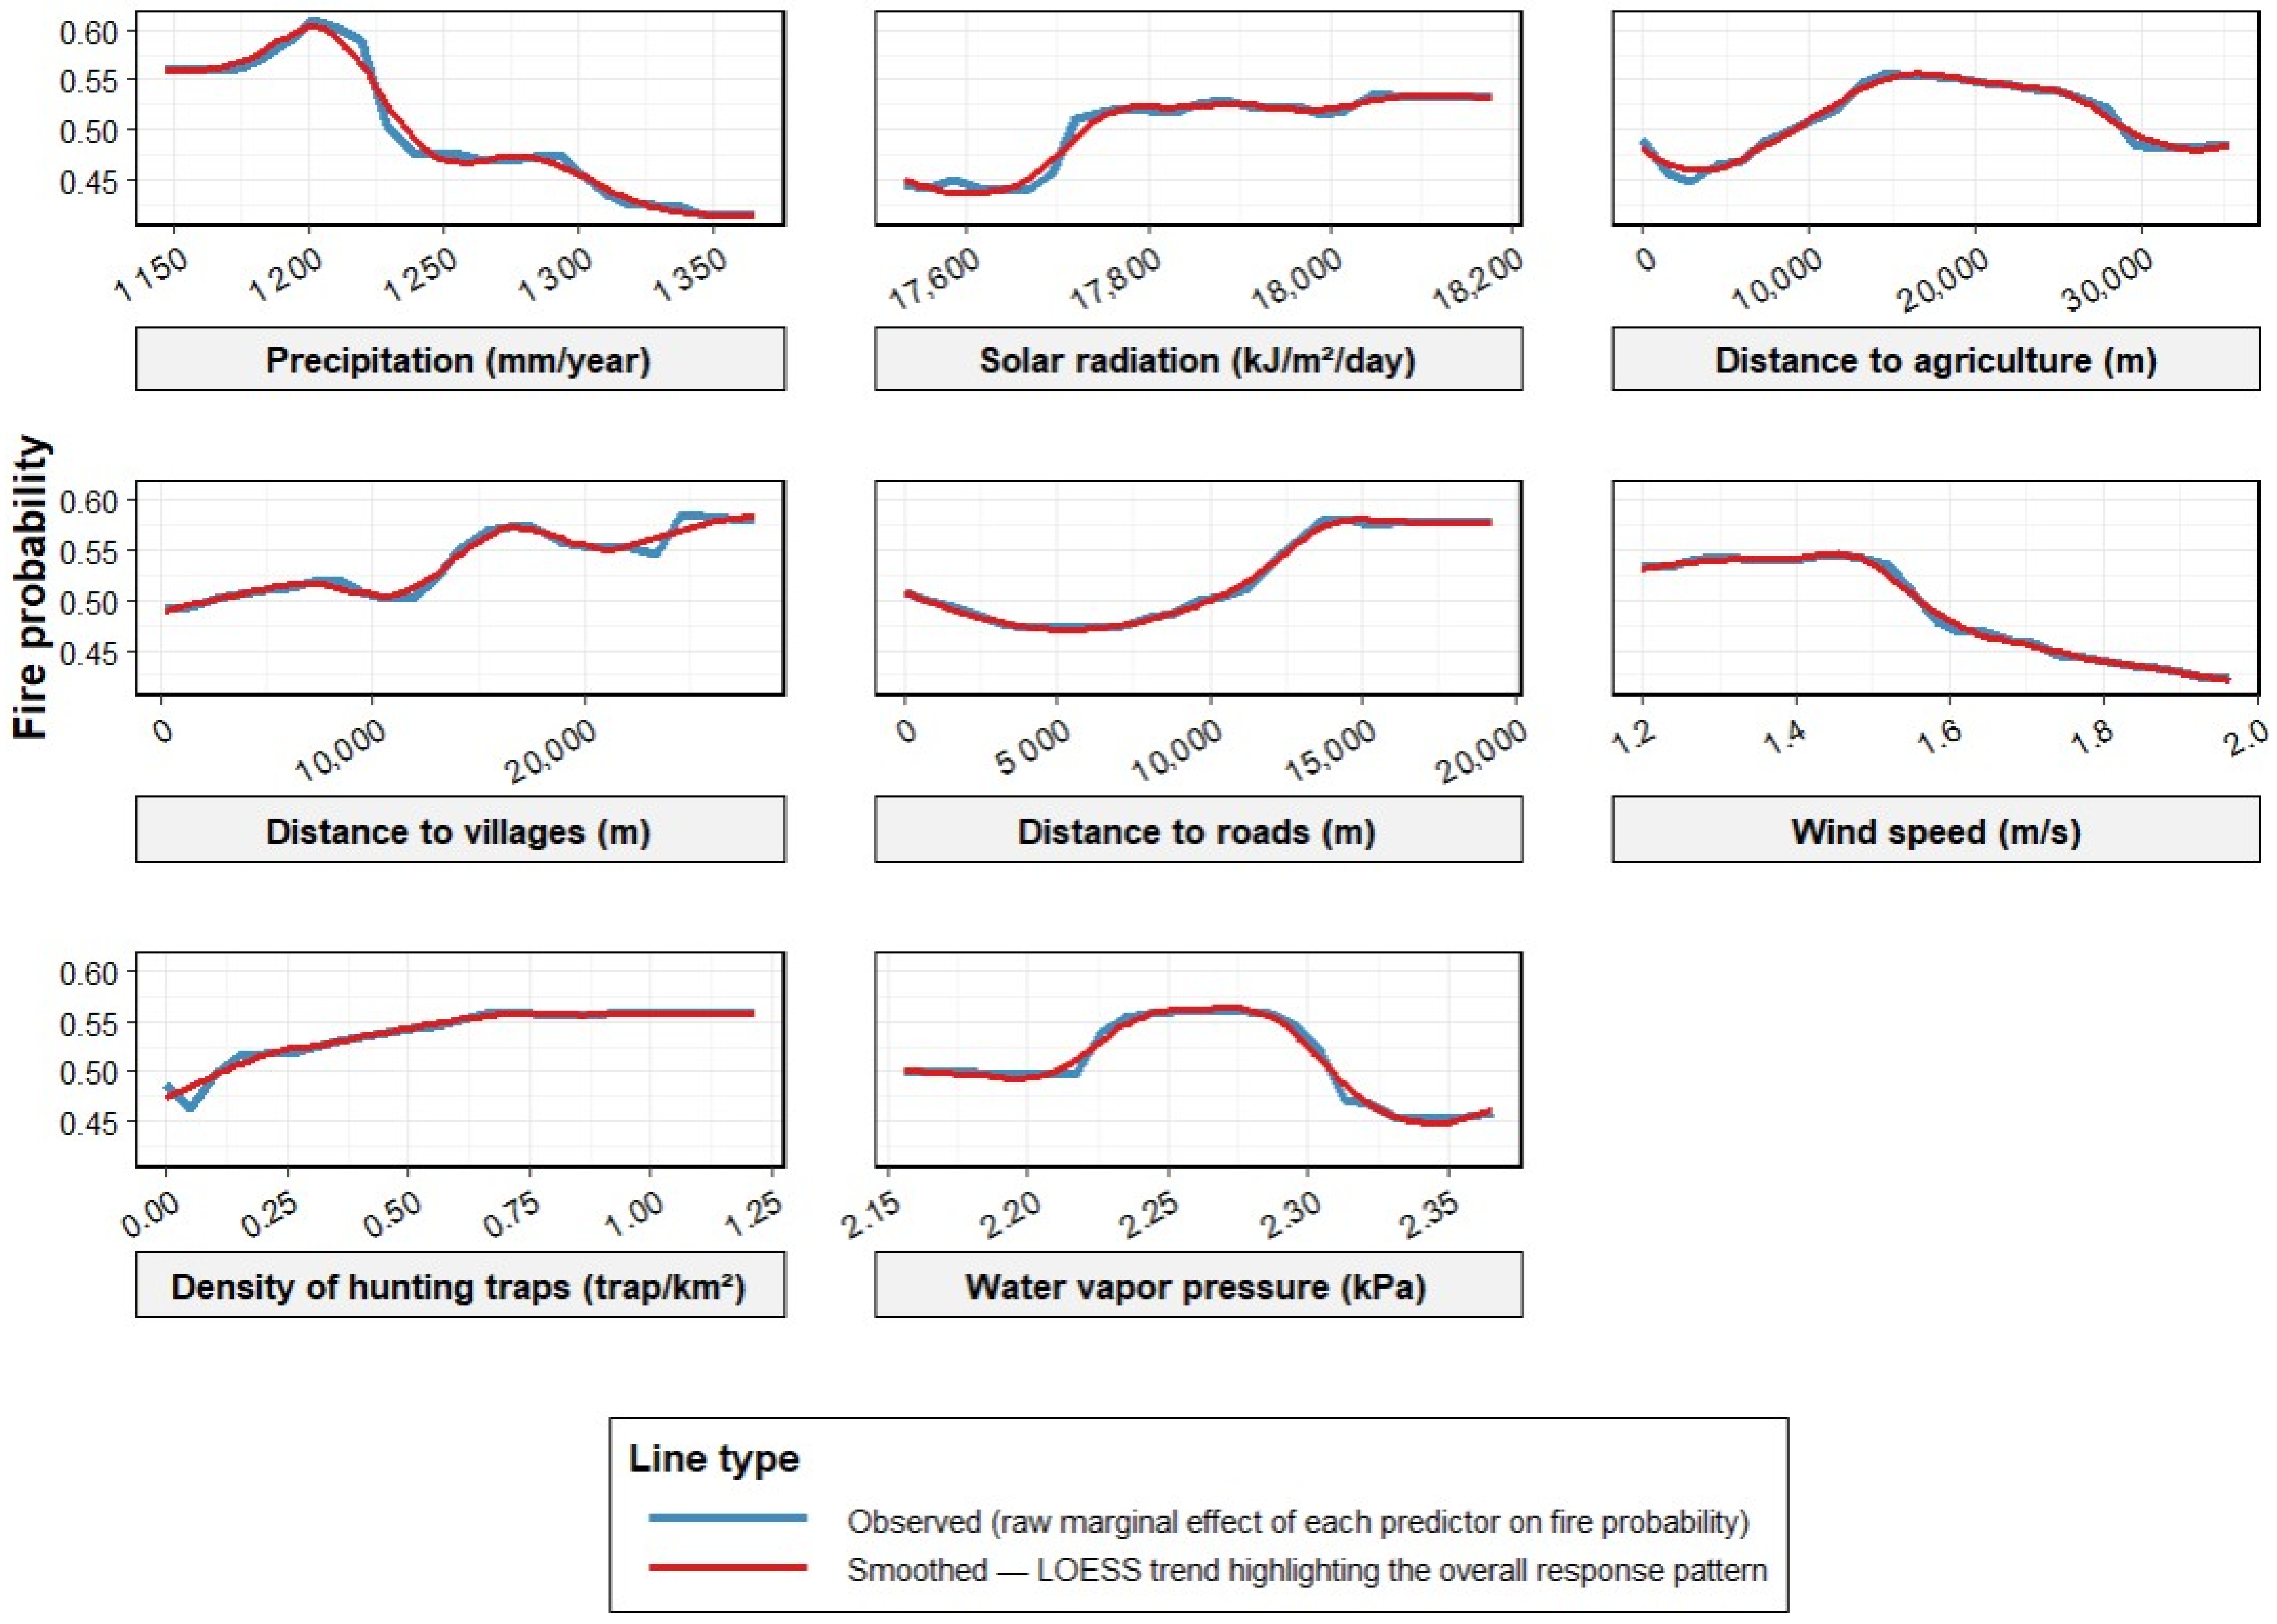
Figure 8 shows the partial dependence of the eight most important variables selected using the Random Forests algorithm. The results show that precipitation below the range of 1150 to 1200 mm increased fire ignition probability. Solar radiation influenced the ignition of fires from 17,800 kJ day−1 onwards. Areas closer to the villages (<15,000 m) presented a lower risk of fires, but further away the fire risk increased. Similarly, fire ignition likelihood was higher farther away (10,000 to 20,000 m) of agricultural activity and at about 10,000 m away from the main roads. Regarding the density of hunting traps, above 0.2 traps km−2 there was a greater probability of fire risk.
Figure 8.
Partial dependence plots for variables that predict the occurrence of fires, selected using the Random Forest algorithm.
3.2.2. Fire Risk Mapping
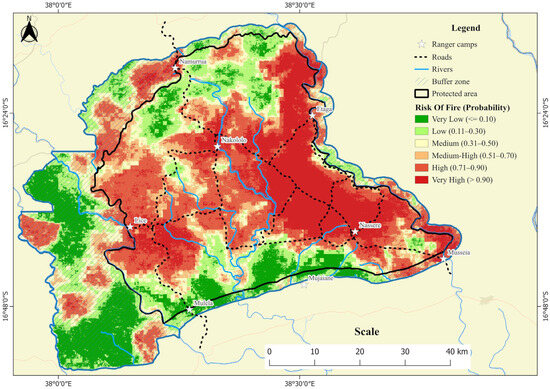
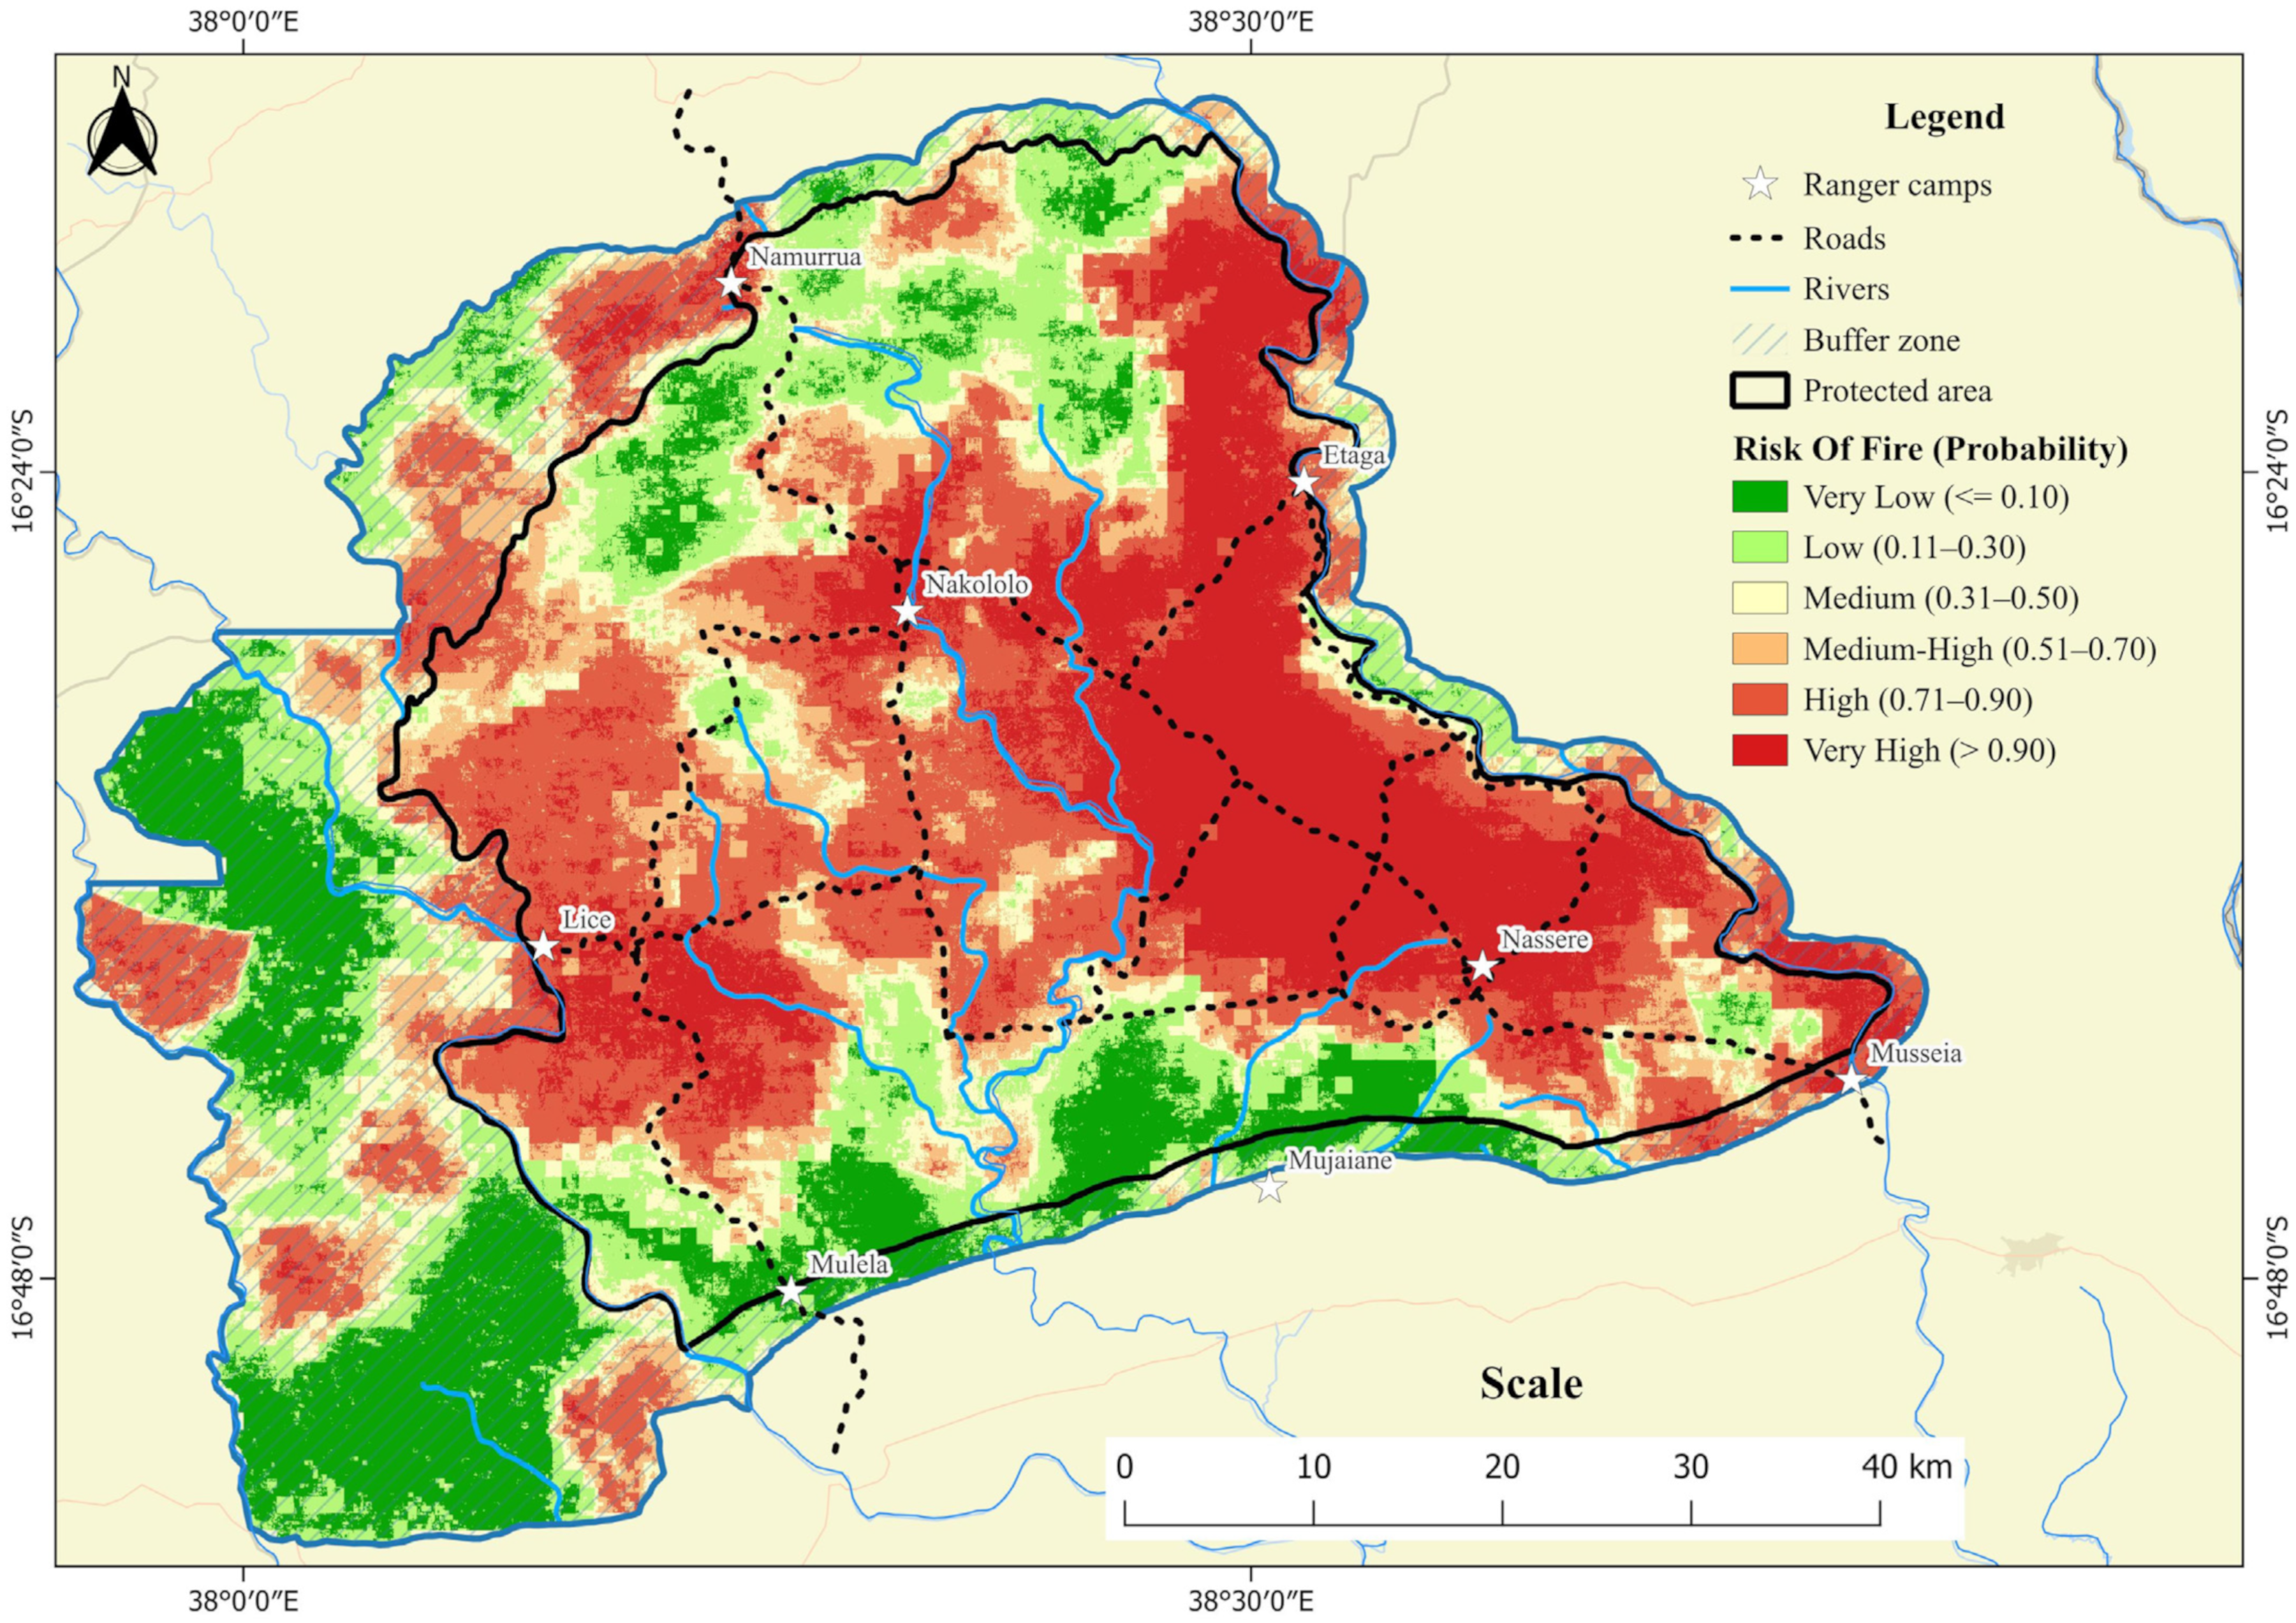
Figure 9 illustrates the spatial distribution of fire risk in the PNAG, indicating that most of the areas with a high and very high risk of fires are in the central region, especially near to the ranger camps of Nassere, Etaga and Lice. According to field observations, very low-to-medium fire probability was associated with dominance of dense forest, especially around the Mulela, south of Lice, west of Mujaiane, north and south of Namurrua to the west of Nakololo, and in some areas in the central region of the park. Areas with a higher fire risk were usually dominated by herbaceous vegetation and open forest in the interior of the park, and by agricultural activities in the buffer zone.
Figure 9.
Spatial distribution of fire risk (likelihood of fire) in the Gilé National Park, explained by precipitation, solar radiation, water vapor deficit, wind speed, distance from agriculture fields, distance from settlements, distance from roads and density of hunting traps.
Table 6 shows that 15% of the total area of the park had very low fire risk, 17% had low risk, 11% medium risk, 13% medium–high risk, while around 43% experienced a higher probability of fire ignition. These areas experienced also higher density, intensity and frequency of fires (Figure 2, Figure 4 and Figure 5).
Table 6.
Area occupied by each class of fire risk (likelihood of fire).
3.2.3. Accuracy Analysis and Kappa Index
The model performance was evaluated using multiple accuracy metrics derived from the confusion matrix (Table 7). The Kappa index (K) corresponded to an 80% degree of agreement, meaning that the model presents substantial agreement between predicted and observed fire occurrence patterns. In terms of overall accuracy, there was approximately a 90% probability that the burned area corresponded to the truth found in the reference map, with around 9% of the pixels at risk being wrongly classified as having low burning area.
Table 7.
Accuracy metrics for the fire risk map.
These metrics confirm balanced model performance across fire and non-fire classes and demonstrate robust performance. Its high Specificity (88.53%) and Sensitivity (92.56%) indicated that the model effectively identified both fire and non-fire locations without systematic bias toward over- or under-prediction, confirming its suitability for operational fire risk mapping in the PNAG.
4. Discussion
We conducted the first ever comprehensive 23-year (2001–2023) assessment of fire regime dynamics (frequency, seasonality, intensity, density, and severity) and modelling of spatial risk probability in the PNAG, central Mozambique. Our findings demonstrated that fire is an important ecological factor with considerable spatial and temporal heterogeneity. The MFRI of 3.9 years found in this study is within the threshold defined for Miombo as essential to maintain its stability [1,9]. However, the spatial distribution of the MFRI, indicated that the overwhelming majority (88%) of the park experiences annual or biennial burning (MFRI of 1–2). This means that the PNAG emerged as an outlier characterized by exceptionally high MFRI when compared to regional studies which indicated a return interval of 3–5 years [1,40,54,71]. Such high fire recurrence rates demand urgent attention as discussed below.
Short return intervals of 1–2 years may carry substantial ecological implications. Empirical evidence [14,72,73] has indicated such intensive regimes systematically benefit herbaceous vegetation while suppressing woody recruitment. This creates a demographic bottleneck wherein saplings remain arrested in vulnerable size classes, progressively eroding woodland regeneration potential. With merely 7% of PNAG experiencing return intervals within the functional 3–4-year range, woodland recovery appears systemically compromised. Persistent fire pressure may progressively diminish biodiversity, carbon sequestration capacity, and adaptive resilience to climatic shifts, while elevating degradation risk and undermining ecosystem service provisioning over decadal timescales. These ecological relationships are addressed in another yet-to-come publication.
Fire frequency was higher within the core zone of the park compared to the buffer zone where human population density is higher. This pattern diverges from findings in Burkina Faso and South Africa, where ignition density correlates positively with proximity to settlements and agricultural landscapes [74,75]. Several mechanisms may explain PNAG’s atypical spatial signature: (i) hunting-associated ignitions, evidenced by elevated trap density (and the strong correlation with fire likelihood) within the core zone; (ii) fire use during honey harvesting operations; or (iii) biomass accumulation in less-disturbed interior zones creating high fuel loads. Another plausible factor is the role of park ranger camps, where fire may be used (or accidentally triggered) for visibility, protection, or accessibility. In fact, we found that around the ranger camps all fire regime components stood out. Even though we have not tested all of these factors, personal observations indicate they may be playing a role. These results highlight the complexity of human–fire interactions in Miombo and the need to further investigate those relationships.
Temporal patterns demonstrated pronounced late dry season fire concentration (August–October), consistent with regional Miombo fire climatology [33,54,76]. Fire intensity peaks (sometimes exceeding 800 MW) in the late dry season, as herbaceous vegetation and grass fuels reach maximum curing. High fire intensity in the central-eastern and northern zones, coupled with high MFRI, suggests a feedback loop between fires and the ecosystem structure with likely transitions from woodland- to grassland-dominated states occurring [77]. These conditions may threaten the long-term ecological integrity of the PNAG.
Risk modeling revealed complex interactions between climatic drivers (precipitation regimes, solar radiation intensity, and wind dynamics) and anthropogenic factors (hunting, infrastructure density and agricultural activity). Notably, ignition probability exhibited a positive correlation with distance from settlements, roads and cultivation zones, implying that fire initiation is more strongly linked to intra-park activities rather than to agricultural land-clearing and settlements. This makes sense if people are keen to protect their assets from fire. It underscores the importance of integrating socio-ecological monitoring (e.g., hunting activity) and analysis for effective fire governance.
Our findings provide an empirical basis for spatially differentiated management interventions. Given the high-risk concentration in the central-eastern area, we recommend the following: (i) strategic early dry season prescribed burning to mitigate the effects of late dry season intense fires; (ii) enhanced law enforcement, targeting hunting-associated ignitions; and (iii) collaborative fire governance engaging buffer zone communities. Without intervention, the persistence of annual or biennial fire regimes may compromise PNAG’s ability to maintain biodiversity, store carbon, and provide ecosystem services. Our findings therefore emphasize the urgency of implementing targeted fire management strategies to safeguard the ecological resilience and conservation value of the PNAG.
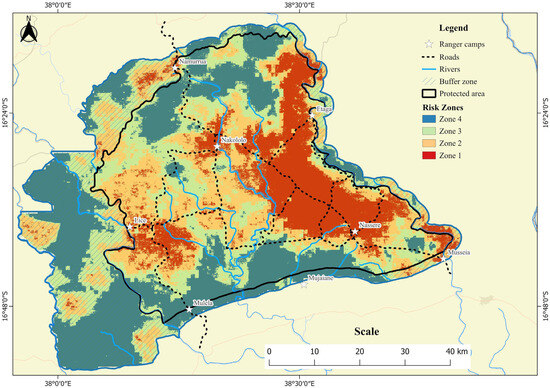
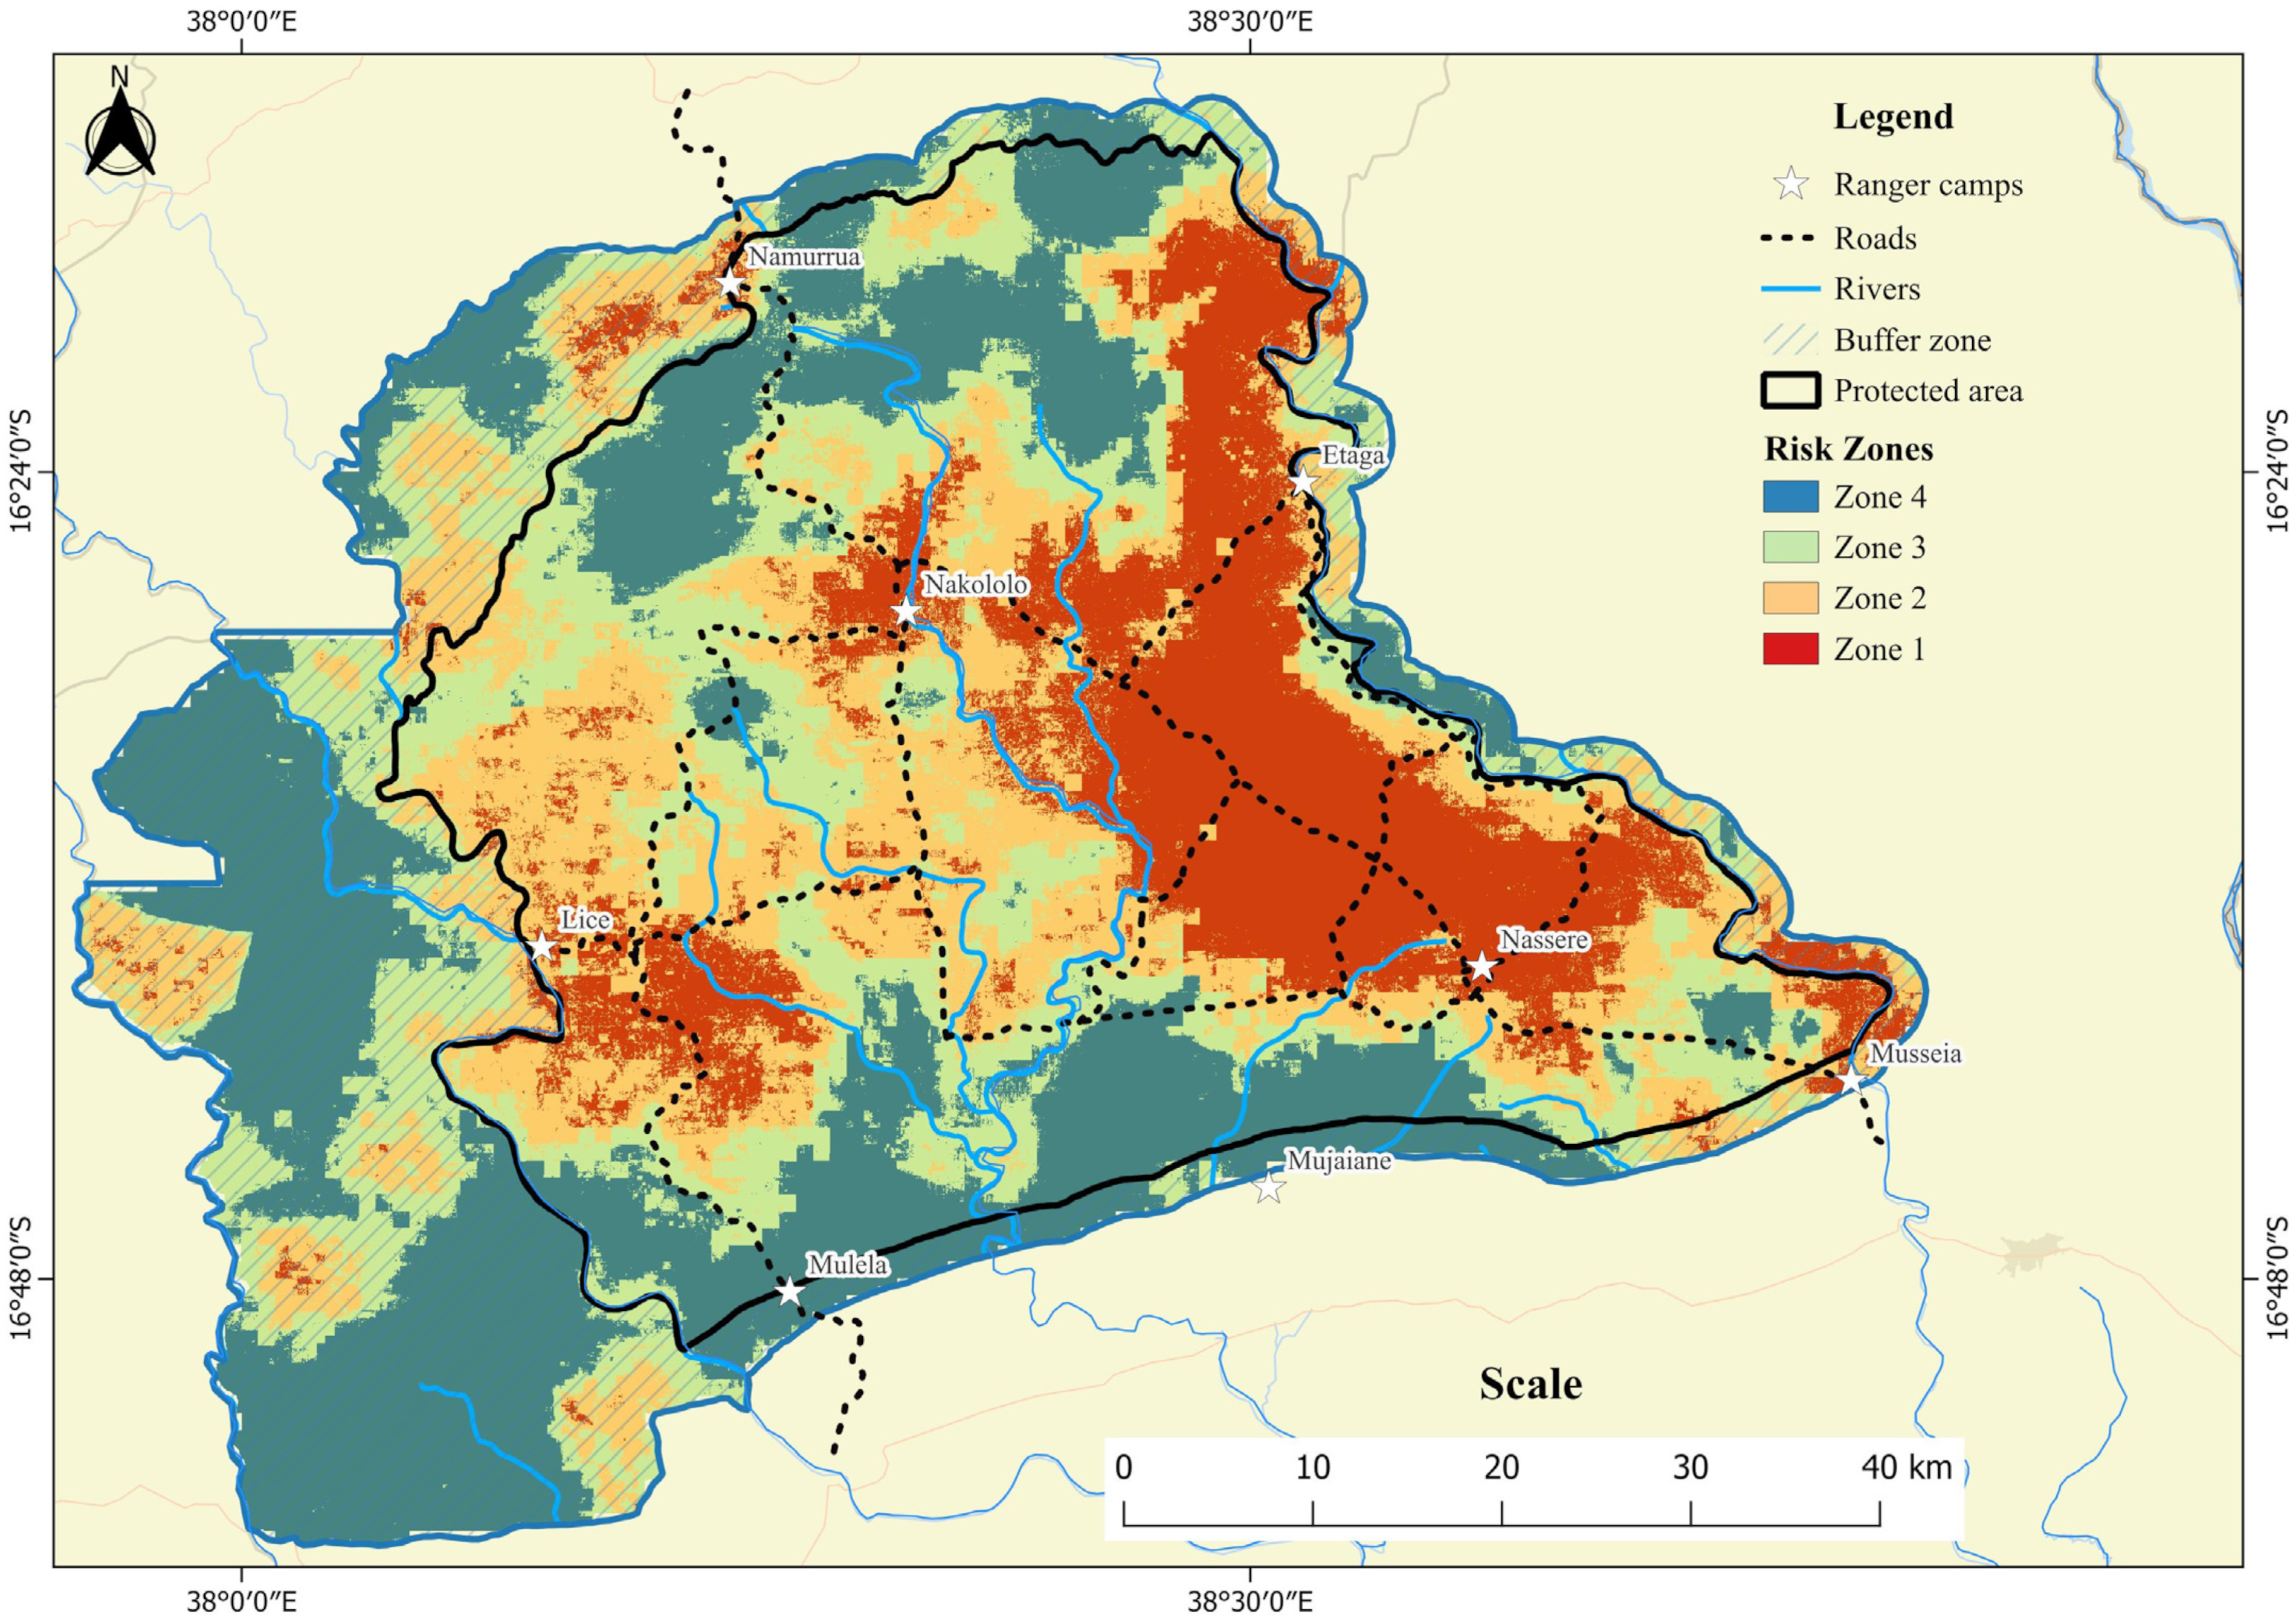
Based on the fire risk map, we zoned the park according to fire management priorities (Figure 10). Zone 1: very high priority (red areas in the map); located in the central-eastern region (Musseia-Etaga, Namixelelene, Nassere, Molocue). The management of this area should focus on grasslands (dambos) through sequential cold burns (May–August) synchronized with hydrological cycles, intensive monitoring, and strategic firebreaks around critical areas. Zone 2: high priority (orange areas in the map); located in the northwestern and central-western sectors. This zone requires controlled cold burns (May–August) during late afternoon under favorable weather conditions, and the establishment of burning calendars, firebreaks maintenance in coordination with Zone 1 activities. Zone 3: medium priority (green areas in the map); with a balanced distribution throughout the southern and central areas. The management of this area should be based on community awareness programs, controlled burns during land clearing (November–December) and early-dry season (May-August), and the establishment of community-based fire management committees. Zone 4: low priority (blue areas in the map); located in the western and southern sectors (and the buffer zone in general). In this zone we recommend a laissez-faire approach and a strong partnership with local communities to enhance natural resources management (including conservation agriculture and maintenance of existing firebreaks and natural barriers).
Figure 10.
Spatial distribution of fire management priorities zones across Gilé National Park, determined by fire risk areas.
5. Conclusions
Our multi-decadal analysis (2001–2023) demonstrates that the PNAG experiences fire recurrence patterns fundamentally incompatible with Miombo ecosystem resilience. The annual burning cycle covers 88% of the park, substantially exceeding the 3–4 year functional thresholds established for maintaining Miombo ecosystems. This intensive regime poses systemic threats: short return intervals may suppress woody recruitment, creating demographic bottlenecks; approximately 60% of PNAG experiences annual late dry season burning (August–October) with medium to medium–high severity affecting 98% of burned areas; and high fire density (averaging 206 ignitions km−2) and intensity (mean FRP 36.24 MW and maximum 858.63 MW) concentrated in the central-eastern regions, accelerating potential woodland-to-grassland transitions.
By identifying the climatic and anthropogenic drivers of fire risk, our findings provide a foundation for targeted interventions, including zoning for management priority, community fire management, and adaptive prescribed burning. Locally, these actions are essential to safeguard PNAG’s ecological integrity and socio-economic value. Regionally and globally, the case of PNAG highlights how Miombo woodlands—a biome spanning 1.9 million km2 and central to African livelihoods and global carbon balance—are increasingly vulnerable to recurrent fire. Protecting PNAG is therefore not only a national conservation priority but also a contribution to global commitments on biodiversity, climate mitigation, and sustainable development.
This study has several limitations that should be acknowledged. First, our analysis of fire severity was constrained by data availability, and was limited to 2014–2023 due to the temporal coverage of consistent Landsat imagery for the study area. Fire frequency validation relied on field data during 2022–2023, while earlier periods (2001–2021) used Google Earth imagery, which presented significant constraints including its low resolution and obstructions that complicated the accurate identification of burned scars. Consequently, robust validation was only possible from 2014 onward. This temporal restriction prevents comprehensive comparative analysis of historical fire dynamics and limits our ability to correlate results with long-term climate variability or evolving fire management practices over previous decades.
Second, field data collection faced logistical challenges, particularly regarding access to remote areas of the PNAG, which restricted the spatial representativeness of ground validation and limited verification of some analyses in inaccessible zones.
Third, while our spatial risk modeling achieved strong validation metrics, the model carries inherent uncertainties related to the 500 m resolution of MODIS MCD64A1 burned area data, which may underestimate small-scale fires (<25 ha), and potential interpolation errors from resampling environmental variables to finer resolution.
Despite these limitations, our findings provide the first comprehensive, multi-decadal characterization of fire regime in the PNAG, offering an evidence-based foundation for adaptive fire management that was previously lacking. Future research should prioritize (1) the integration of higher-resolution satellite data (Sentinel-2; Landsat-8/9) to capture fine-scale fire patterns; (2) extended time series and paleo-fire records to contextualize recent patterns within centennial-scale baselines; and (3) the incorporation of detailed socio-economic factors through ethnographic approaches and participatory mapping to support culturally appropriate interventions that balance conservation with local welfare.
Author Contributions
Conceptualization, A.I.R.-B. and N.S.R.; Methodology, F.M., S.N.L., V.B. and N.S.R.; Validation, F.M. and N.S.R.; Formal analysis, J.C.D., S.N.L., F.M.; Investigation, J.C.D., V.B. and N.S.R.; Resources, A.I.R.-B. and N.S.R.; Data curation, J.C.D., S.N.L. and V.B.; Writing—original draft, J.C.D.; Writing—review & editing, F.M., S.N.L., V.B., I.S.M., A.S., A.I.R.-B. and N.S.R.; Supervision, F.M. and N.S.R.; Project administration, A.I.R.-B. and N.S.R.; Funding acquisition, N.S.R. All authors have read and agreed to the published version of the manuscript.
Funding
Biofund Project number REF Nº5/BIOFUND/SUB/PROMOVE/21. FCT—Fundação para a Ciência e Tecnologia, I.P. through project reference UID/00239/2025 (Forest Research Centre), PLCM—Programa de Liderança para a Conservação de Moçambique and Associate Laboratory TERRA (LA/P/0092/2020).
Data Availability Statement
The raw data supporting the conclusions of this article will be made available by the authors on request.
Acknowledgments
The authors would like to thank all the individuals who made this study possible, namely, Jone Fernando, Ismenia Amaral, Macamo, Hermenegildo Mandlate, and Joana Govene. We also thank the institutional support of Eduardo Mondlane University and the National Administration of Conservation Areas (ANAC) through the PNAG administrative team, and Alessandro Fusari for his valuable contribution to fit the study into the management objectives of the park. The authors declare having used AI (Microsoft Co-Pilot 23.0.430815004) to improve the English quality of the Manuscript.
Conflicts of Interest
The authors declare no conflicts of interest.
References
- Frost, P. The Ecology of Miombo Woodlands. In The Miombo in Transition: Woodlands and Welfare in Africa; Campbell, B., Ed.; Center for International Forestry Research: Bogor, Indonesia, 1996. [Google Scholar]
- Dziba, L.; Ramoelo, A.; Ryan, C.; Harrison, S.; Pritchard, R.; Tripathi, H.; Sitas, N.; Selomane, O.; Engelbrecht, F.; Pereira, L.; et al. Scenarios for Just and Sustainable Futures in the Miombo Woodlands. In Miombo Woodlands in a Changing Environment: Securing the Resilience and Sustainability of People and Woodlands; Ribeiro, N.S., Katerere, Y., Chirwa, P.W., Grundy, I.M., Eds.; Springer International Publishing: Cham, Switzerland, 2020. [Google Scholar]
- Ribeiro, N.S.; Katerere, Y.; Grundy, I.M.; Chirwa, P.W. (Eds.) Miombo Woodlands in a Changing Environment: Securing the Resilience and Sustainability of People and Woodlands; Springer Nature: Cham, Switzerland, 2020. [Google Scholar]
- Aquino, A.; Lim, C.; Kaechele, K.; Taquidir, M. Mozambique Country Forest Note; World Bank: Washington, DC, USA, 2018. [Google Scholar]
- Assédé, E.S.P.; Azihou, A.F.; Geldenhuys, C.J.; Chirwa, P.W.; Biaou, S.S.H. Sudanian versus Zambezian woodlands of Africa: Composition, ecology, biogeography and use. Acta Oecologica 2020, 107, 103599. [Google Scholar] [CrossRef] [Scilit]
- Dewees, P.A.; Campbell, B.M.; Katerere, Y.; Sitoe, A.; Cunningham, A.B.; Angelsen, A.; Wunder, S. Managing the Miombo Woodlands of Southern Africa: Policies, Incentives and Options for the Rural Poor. J. Nat. Resour. Policy Res. 2011, 2, 57–73. [Google Scholar] [CrossRef] [Scilit]
- Ribeiro, N.S.; Matos, C.N.; Moura, I.R.; Washington-Allen, R.A.; Ribeiro, A.I. Monitoring vegetation dynamics and carbon stock density in miombo woodlands. Carbon Balance Manag. 2013, 8, 11. [Google Scholar] [CrossRef] [Scilit] [PubMed]
- Buramuge, V.A.; Ribeiro, N.S.; Olsson, L.; Bandeira, R.R.; Lisboa, S.N. Tree Species Composition and Diversity in Fire-Affected Areas of Miombo Woodlands, Central Mozambique. Fire 2023, 6, 26. [Google Scholar] [CrossRef] [Scilit]
- Furley, P.A.; Rees, R.M.; Ryan, C.M.; Saiz, G. Savanna burning and the assessment of long-term fire experiments with particular reference to Zimbabwe. Prog. Phys. Geogr. Earth Environ. 2008, 32, 611–634. [Google Scholar] [CrossRef] [Scilit]
- Aragão, L.E.O.; Malhi, Y.; Barbier, N.; Lima, A.; Shimabukuro, Y.; Anderson, L.; Saatchi, S. Interactions between rainfall, deforestation and fires during recent years in the Brazilian Amazonia. Philos. Trans. R. Soc. B Biol. Sci. 2008, 363, 1779–1785. [Google Scholar] [CrossRef] [Scilit]
- Frost, P.G.H.; Robertson, F. The Ecological Effects of Fire in Savannas. In Determinants of Tropical Savannas; IRL Press: Oxford, UK, 1987. [Google Scholar]
- Ribeiro, N.S.; Shugart, H.H.; Washington-Allen, R. The effects of fire and elephants on species composition and structure of the Niassa Reserve, northern Mozambique. For. Ecol. Manag. 2008, 255, 1626–1636. [Google Scholar] [CrossRef] [Scilit]
- Meneses, O.M.; Ribeiro, N.S.; Shirvani, Z.; Andrew, S.M. Spatio-Temporal Analysis of Wildfire Regimes in Miombo of the LevasFlor Forest Concession, Central Mozambique. Fire 2024, 7, 264. [Google Scholar] [CrossRef] [Scilit]
- Salimo, M.; Buramuge, V.; Farão, A.; Chauque, A.; Bandeira, R.; Fernando, J.; Ribeiro-Barros, A.I.; Branquinho, C.; Ribeiro, N. Insights on the dynamics of Miombo woody vegetation in Niassa Special Reserve, northern Mozambique. Int. J. Wildland Fire 2025, 34, WF24060. [Google Scholar] [CrossRef] [Scilit]
- Miombo Network. Using & Restoring the Miombo Woodlands: Needs for an Integrated and Holistic Approach in Ecosystem Management for Long Term Sustainability; 5203881 Bytes; Miombo Network: Maputo, Mozambique, 2016. [Google Scholar]
- Whitlock, C.; Higuera, P.E.; McWethy, D.B.; Briles, C.E. Paleoecological Perspectives on Fire Ecology: Revisiting the Fire-Regime Concept. Open Ecol. J. 2010, 3, 6–23. [Google Scholar] [CrossRef] [Scilit]
- Conedera, M.; Tinner, W.; Neff, C.; Meurer, M.; Dickens, A.F.; Krebs, P. Reconstructing past fire regimes: Methods, applications, and relevance to fire management and conservation. Quat. Sci. Rev. 2009, 28, 555–576. [Google Scholar] [CrossRef] [Scilit]
- Krebs, P.; Pezzatti, G.B.; Mazzoleni, S.; Talbot, L.M.; Conedera, M. Fire regime: History and definition of a key concept in disturbance ecology. Theory Biosci. 2010, 129, 53–69. [Google Scholar] [CrossRef] [Scilit] [PubMed]
- Keeley, J.E. Fire intensity, fire severity and burn severity: A brief review and suggested usage. Int. J. Wildland Fire 2009, 18, 116–126. [Google Scholar] [CrossRef] [Scilit]
- Gandiwa, E. Effects of repeated burning on woody vegetation structure and composition in a semi-arid southern African savanna. Int. J. Environ. Sci. 2011, 2, 458. [Google Scholar]
- Pausas, J.G.; Keeley, J.E. A Burning Story: The Role of Fire in the History of Life. BioScience 2009, 59, 593–601. [Google Scholar] [CrossRef] [Scilit]
- Govender, N.; Trollope, W.S.W.; Van Wilgen, B.W. The effect of fire season, fire frequency, rainfall and management on fire intensity in savanna vegetation in South Africa. J. Appl. Ecol. 2006, 43, 748–758. [Google Scholar] [CrossRef] [Scilit]
- Macave, O.A.; Ribeiro, N.S.; Ribeiro, A.I.; Chaúque, A.; Bandeira, R.; Branquinho, C.; Washington-Allen, R. Modelling Aboveground Biomass of Miombo Woodlands in Niassa Special Reserve, Northern Mozambique. Forests 2022, 13, 311. [Google Scholar] [CrossRef] [Scilit]
- Koproski, L.; Ferreira, M.P.; Goldammer, J.G.; Batista, A.C. Modelo de zoneamento de risco de incêndios para unidades de conservação brasileiras: O Caso do Parque Estadual Do Cerrado (Pr). Floresta 2011, 41, 551–562. [Google Scholar] [CrossRef] [Scilit]
- Torres, F.T.P.; Ribeiro, G.A.; Martins, S.V.; Lima, G.S. Correlações entre os elementos meteorológicos e as ocorrências de incêndios florestais na área urbana de Juiz de Fora, MG. Rev. Árvore 2011, 35, 143–150. [Google Scholar] [CrossRef] [Scilit]
- Vallejo-Villalta, I.; Rodríguez-Navas, E.; Márquez-Pérez, J. Mapping Forest Fire Risk at a Local Scale—A Case Study in Andalusia (Spain). Environments 2019, 6, 30. [Google Scholar] [CrossRef] [Scilit]
- Ryan, C.M.; Pritchard, R.; McNicol, I.; Owen, M.; Fisher, J.A.; Lehmann, C. Ecosystem services from southern African woodlands and their future under global change. Philos. Trans. R. Soc. B Biol. Sci. 2016, 371, 20150312. [Google Scholar] [CrossRef] [Scilit] [PubMed]
- Novo, A.; Fariñas-Álvarez, N.; Martínez-Sánchez, J.; González-Jorge, H.; Fernández-Alonso, J.M.; Lorenzo, H. Mapping Forest Fire Risk—A Case Study in Galicia (Spain). Remote Sens. 2020, 12, 3705. [Google Scholar] [CrossRef] [Scilit]
- Chuvieco, E.; Mouillot, F.; van der Werf, G.R.; San Miguel, J.; Tanase, M.; Koutsias, N.; García, M.; Yebra, M.; Padilla, M.; Gitas, I.; et al. Historical background and current developments for mapping burned area from satellite Earth observation. Remote Sens. Environ. 2019, 225, 45–64. [Google Scholar] [CrossRef] [Scilit]
- Ribeiro, N.S.; Shugart, H.H.; Swap, R.J.; Okin, G.S. Five-Year Period of Fire Regime in the Miombo Woodlands of Niassa Reserve, Mozambique in Northern Mozambique. Ph.D. Thesis, University of Virginia, Charlottesville, VA, USA, 2007. [Google Scholar]
- Silva, J.M.; Sá, A.C.; Pereira, J.M. Comparison of burned area estimates derived from SPOT-VEGETATION and Landsat ETM+ data in Africa: Influence of spatial pattern and vegetation type. Remote Sens. Environ. 2005, 96, 188–201. [Google Scholar] [CrossRef] [Scilit]
- Archibald, S.; Roy, D.P.; Van Wilgen, B.W.; Scholes, R.J. What limits fire? An examination of drivers of burnt area in Southern Africa. Glob. Change Biol. 2009, 15, 613–630. [Google Scholar] [CrossRef] [Scilit]
- Meneses, O.M.; Ribeiro, N.S.; Shirvani, Z.; Andrew, S.M. Resilience of the Miombo Woodland to Different Fire Frequencies in the LevasFlor Forest Concession, Central Mozambique. Forests 2025, 16, 10. [Google Scholar] [CrossRef] [Scilit]
- Giglio, L.; Randerson, J.T.; van der Werf, G.R. Analysis of daily, monthly, and annual burned area using the fourth-generation global fire emissions database (GFED4). J. Geophys. Res. Biogeosci. 2013, 118, 317–328. [Google Scholar] [CrossRef] [Scilit]
- Andela, N.; Morton, D.C.; Giglio, L.; Chen, Y.; van der Werf, G.R.; Kasibhatla, P.S.; DeFries, R.S.; Collatz, G.J.; Hantson, S.; Kloster, S.; et al. A human-driven decline in global burned area. Science 2017, 356, 1356–1362. [Google Scholar] [CrossRef] [Scilit]
- Administração Nacional das Áreas de Conservação (ANAC). Plano de Maneio do Parque Nacional do Gile 2024—2033 Versao Final; CEAGRE: Maputo, Mozambique, 2024. [Google Scholar]
- Mercier, C.; Grinand, C.; Randrianary, T.; Nourtier, M.; Rabany, C. Background Study for the Preparation of the Zambézia Integrated Landscapes Management Program; Report for Government of Mozambique and FCPF; Etc Terra: Montpellier, France, 2016. [Google Scholar]
- Montfort, F.; Nourtier, M.; Grinand, C.; Maneau, S.; Mercier, C.; Roelens, J.-B.; Blanc, L. Regeneration capacities of woody species biodiversity and soil properties in Miombo woodland after slash-and-burn agriculture in Mozambique. For. Ecol. Manag. 2021, 488, 119039. [Google Scholar] [CrossRef] [Scilit]
- Huntington, J.L.; Hegewisch, K.C.; Daudert, B.; Morton, C.G.; Abatzoglou, J.T.; McEvoy, D.J.; Erickson, T. Climate Engine: Cloud Computing and Visualization of Climate and Remote Sensing Data for Advanced Natural Resource Monitoring and Process Understanding. Bull. Am. Meteorol. Soc. 2017, 98, 2397–2410. [Google Scholar] [CrossRef] [Scilit]
- Pungulanhe, L.A. Caracterização da Vegetação Arbórea sob Diferentes Regimes de Queimadas na Floresta de Miombo, Reserva nacional do Gilé. Master Thesis, Universidade Eduardo Mondlane, Maputo, Mozambique, 2020. [Google Scholar]
- Ameja, L.G.; Ribeiro, N.; Sitoe, A.A.; Guillot, B. Regeneration and Restoration Status of Miombo Woodland Following Land Use Land Cover Changes at the Buffer Zone of Gile National Park, Central Mozambique. Trees For. People 2022, 9, 100290. [Google Scholar] [CrossRef] [Scilit]
- Giglio, L.; Schroeder, W.; Hall, J.V.; Justice, C.O. MODIS Collection 6 Active Fire Product User’s Guide Revision B; NASA: Washington, DC, USA, 2018. [Google Scholar]
- Giglio, L.; Descloitres, J.; Justice, C.O.; Kaufman, Y.J. An Enhanced Contextual Fire Detection Algorithm for MODIS. Remote Sens. Environ. 2003, 87, 273–282. [Google Scholar] [CrossRef] [Scilit]
- Roy, D.P.; Boschetti, L.; Justice, C.O.; Ju, J. The collection 5 MODIS burned area product—Global evaluation by comparison with the MODIS active fire product. Remote Sens. Environ. 2008, 112, 3690–3707. [Google Scholar] [CrossRef] [Scilit]
- Schroeder, W.; Prins, E.; Giglio, L.; Csiszar, I.; Schmidt, C.; Morisette, J.; Morton, D. Validation of GOES and MODIS active fire detection products using ASTER and ETM+ data. Remote Sens. Environ. 2008, 112, 2711–2726. [Google Scholar] [CrossRef] [Scilit]
- QGIS Development Team. QGIS Geographic Information System, version 3.40; QGIS: Gossau, Switzerland, 2024. Available online: https://www.qgis.org/en/site/ (accessed on 10 November 2024).
- Montfort, F. Dynamiques des Paysages Forestiers au Mozambique: Étude de L’écologie du Miombo Pour Contribuer aux Stratégies de Restauration des Terres Dégradées. Doctorate Thesis, L’UPR Forêts et Sociétés, Montpellier, France, 2021. Available online: https://revues.cirad.fr/index.php/BFT/article/view/37281 (accessed on 10 November 2024).
- Running, S.; Mu, Q.; Zhao, M. MOD16A2 MODIS/Terra Net Evapotranspiration 8-Day L4 Global 500m SIN Grid V006; NASA Land Processes Distributed Active Archive Center: Sioux Falls, SD, USA, 2017. [Google Scholar] [CrossRef]
- Tiecke, T.G.; Liu, X.; Zhang, A.; Gros, A.; Li, N.; Yetman, G.; Kilic, T.; Murray, S.; Blankespoor, B.; Prydz, E.B.; et al. Mapping the World Population One Building at a Time; World Bank: Washington, DC, USA, 2017. [Google Scholar] [CrossRef] [Scilit]
- R Core Team. R: A Language and Environment for Statistical Computing, version 4.3.0; R Core Team: Vienna, Austria, 2023. Available online: https://www.R-project.org/ (accessed on 2 November 2023).
- Giglio, L.; Schroeder, W.; Justice, C.O. The collection 6 MODIS active fire detection algorithm and fire products. Remote Sens. Environ. 2016, 178, 31–41. [Google Scholar] [CrossRef] [Scilit] [PubMed]
- Bond, W.; Keeley, J. Fire as a global ‘herbivore’: The ecology and evolution of flammable ecosystems. Trends Ecol. Evol. 2005, 20, 387–394. [Google Scholar] [CrossRef] [Scilit]
- He, T.; Lamont, B.B.; Pausas, J.G. Fire as a key driver of Earth’s biodiversity. Biol. Rev. 2019, 94, 1983–2010. [Google Scholar] [CrossRef] [Scilit]
- Ribeiro, N.S.; Cangela, A.; Chauque, A.; Bandeira, R.R.; Ribeiro-Barros, A.I. Characterisation of spatial and temporal distribution of the fire regime in Niassa National Reserve, northern Mozambique. Int. J. Wildland Fire 2017, 26, 1021–1029. [Google Scholar] [CrossRef] [Scilit]
- Wooster, M.J.; Roberts, G.; Perry, G.L.W.; Kaufman, Y.J. Retrieval of biomass combustion rates and totals from fire radiative power observations: FRP derivation and calibration relationships between biomass consumption and fire radiative energy release. J. Geophys. Res. Atmos. 2005, 110, 311. [Google Scholar] [CrossRef] [Scilit]
- Silva Junior, C.H.L.; Aragão, L.E.O.C.; Fonseca, M.G.; Almeida, C.T.; Vedovato, L.B.; Anderson, L.O. Deforestation-Induced Fragmentation Increases Forest Fire Occurrence in Central Brazilian Amazonia. Forests 2018, 9, 305. [Google Scholar] [CrossRef] [Scilit]
- Goryl, P.; Buongiorno, A.; Santella, C.; Fournier-Sicre, V.; Santacesaria, V. Active Fire: Fire Detection and Fire Radiative Power Assessment; King’s College London: London, UK, 2012. [Google Scholar]
- United Nations Platform for Space-Based Information for Disaster Management and Emergency Response (UN-SPIDER). Recommended Practice: Burn Severity Mapping. Step-by-Step: Burn Severity in Google Earth Engine; United Nations: New York, NY, USA, 2023; Available online: https://un-spider.org/advisory-support/recommended-practices/recommended-practice-burn-severity/burn-severity-earth-engine (accessed on 15 July 2024).
- Lutes, D.C.; Keane, R.E.; Caratti, J.F.; Key, C.H.; Benson, N.C.; Sutherland, S.; Gangi, L.J. FIREMON: Fire Effects Monitoring and Inventory System; (No. RMRS-GTR-164; p. RMRS-GTR-164); U.S. Department of Agriculture, Forest Service, Rocky Mountain Research Station: Fort Collins, CO, USA, 2006. [CrossRef] [Scilit]
- Konkathi, P.; Shetty, A. Inter comparison of post-fire burn severity indices of Landsat-8 and Sentinel-2 imagery using Google Earth Engine. Earth Sci. Inform. 2021, 14, 645–653. [Google Scholar] [CrossRef] [Scilit]
- Key, C.H.; Benson, N. Landscape Assessment: Ground Measure of Severity, the Composite Burn Index; and Remote Sensing of Severity, the Normalized Burn Ratio; USDA Forest Service, Rocky Mountain Research Station: Fort Collins, CO, USA, 2006. [Google Scholar]
- Breiman, L. Random Forests. Mach. Learn. 2001, 45, 5–32. [Google Scholar] [CrossRef] [Scilit]
- Liaw, A.; Wiener, M. Classification and Regression by randomForest. R News 2002, 2, 18–22. [Google Scholar]
- Oliveira, S.; Oehler, F.; San-Miguel-Ayanz, J.; Camia, A.; Pereira, J.M. Modeling spatial patterns of fire occurrence in Mediterranean Europe using Multiple Regression and Random Forest. For. Ecol. Manag. 2012, 275, 117–129. [Google Scholar] [CrossRef] [Scilit]
- Rodrigues, M.; de la Riva, J. An insight into machine-learning algorithms to model human-caused wildfire occurrence. Environ. Model. Softw. 2014, 57, 192–201. [Google Scholar] [CrossRef] [Scilit]
- Cutler, D.R.; Edwards, T.C.; Beard, K.H.; Cutler, A.; Hess, K.T.; Gibson, J.; Lawler, J.J. Random forests for classification in ecology. Ecology 2007, 88, 2783–2792. [Google Scholar] [CrossRef] [Scilit]
- Milà, C.; Ludwig, M.; Pebesma, E.; Tonne, C.; Meyer, H. Random forests with spatial proxies for environmental modelling: Opportunities and pitfalls. Earth Space Sci. Inform. 2024, 17, 6007–6033. [Google Scholar] [CrossRef] [Scilit]
- Silva, I.S.; Garcia, C.A.B.; de Sousa, F.E.R.; do Patrocínio, H.A.J.; Garcia, H.L. Aplicação do Algoritmo Random Forest na Avaliação de Corpos Hídricos no Estado de Sergipe. In Proceedings of the 12th Water Resources Meeting, Sergipe, Brazil, 18–22 March 2019. [Google Scholar]
- Gonçalves, Y.L.M.; Siqueira, E.S.; Ferreira, C.A.; da Silva, T.M.; da Ventura, C.P.; Urbinati, C.V. Aplicação de algoritmos de Random Forest no suporte à identificação das espécies Handroanthus Serratifolius (Vahl) SO Grose e Handroanthus Impetiginosus (Mart. Ex DC.) Mattos (bignoniaceae). Braz. J. Dev. 2022, 8, 39721–39735. [Google Scholar] [CrossRef] [Scilit]
- Hijmans, R.J. Raster: Geographic Data Analysis and Modeling, version 3.6-32; GitHub: San Francisco, CA, USA, 2025. Available online: https://github.com/rspatial/raster (accessed on 30 November 2023).
- Wood, E.; Mgaya, M.; Andrews, C.; Schreckenberg, K.; A Fisher, J.; Grundy, I.; Ryan, C.M. Intentions behind common and risky fires in south-eastern Tanzania. Afr. J. Range Forage Sci. 2022, 39, 124–135. [Google Scholar] [CrossRef] [Scilit]
- Magadzire, N. Reconstruction of a Fire Regime Using MODIS Burned Area Data: Charara Safari Area, Zimbabwe. Ph.D. Thesis, Stellenbosch University, Stellenbosch, South Africa, 2013. Available online: http://scholar.sun.ac.za (accessed on 23 September 2024).
- Ryan, C.M.; Williams, M. How does fire intensity and frequency affect miombo woodland tree populations and biomass? Ecol. Appl. 2011, 21, 48–60. [Google Scholar] [CrossRef]
- Hudak, A.T.; Brockett, B.H. Mapping fire scars in a southern African savannah using Landsat imagery. Int. J. Remote Sens. 2004, 25, 3231–3243. [Google Scholar] [CrossRef] [Scilit]
- Devineau, J.-L.; Fournier, A.; Nignan, S. Savanna fire regimes assessment with MODIS fire data: Their relationship to land cover and plant species distribution in western Burkina Faso (West Africa). J. Arid. Environ. 2010, 74, 1092–1101. [Google Scholar] [CrossRef] [Scilit]
- Pereira, J.M.; Mota, B.; Privette, J.L.; Caylor, K.K.; Silva, J.M.; Sá, A.C.; Ni-Meister, W. A simulation analysis of the detectability of understory burns in miombo woodlands. Remote Sens. Environ. 2004, 93, 296–310. [Google Scholar] [CrossRef] [Scilit]
- Van Langevelde, F.; Van De Vijver, C.A.; Kumar, L.; Van De Koppel, J.; De Ridder, N.; Van Andel, J.; Skidmore, A.K.; Hearne, J.W.; Stroosnijder, L.; Bond, W.J.; et al. Effects of fire and herbivory on the stability of savanna ecosystems. Ecology 2003, 84, 337–350. [Google Scholar] [CrossRef] [Scilit]

Disclaimer/Publisher’s Note: The statements, opinions and data contained in all publications are solely those of the individual author(s) and contributor(s) and not of MDPI and/or the editor(s). MDPI and/or the editor(s) disclaim responsibility for any injury to people or property resulting from any ideas, methods, instructions or products referred to in the content. |
© 2026 by the authors. Licensee MDPI, Basel, Switzerland. This article is an open access article distributed under the terms and conditions of the Creative Commons Attribution (CC BY) license.